Author Contributions
Conceptualization, Y.H., U.S.A. and H.W.; Data curation, Y.H., U.S.A., A.R., J.U. and H.W.; Formal analysis, Y.H., U.S.A., A.R. and H.W.; Funding acquisition, H.W. and U.S.A.; Investigation, Y.H., U.S.A. and H.W.; Methodology, U.S.A., Y.H., A.R. and H.W.; Project administration, H.W.; Validation, Y.H., U.S.A. and H.W.; Visualization, H.W., Y.H. and U.S.A.; Writing—original draft, H.W.; Writing—review & editing, H.W., U.S.A. and Y.H. All authors have read and agreed to the published version of the manuscript.
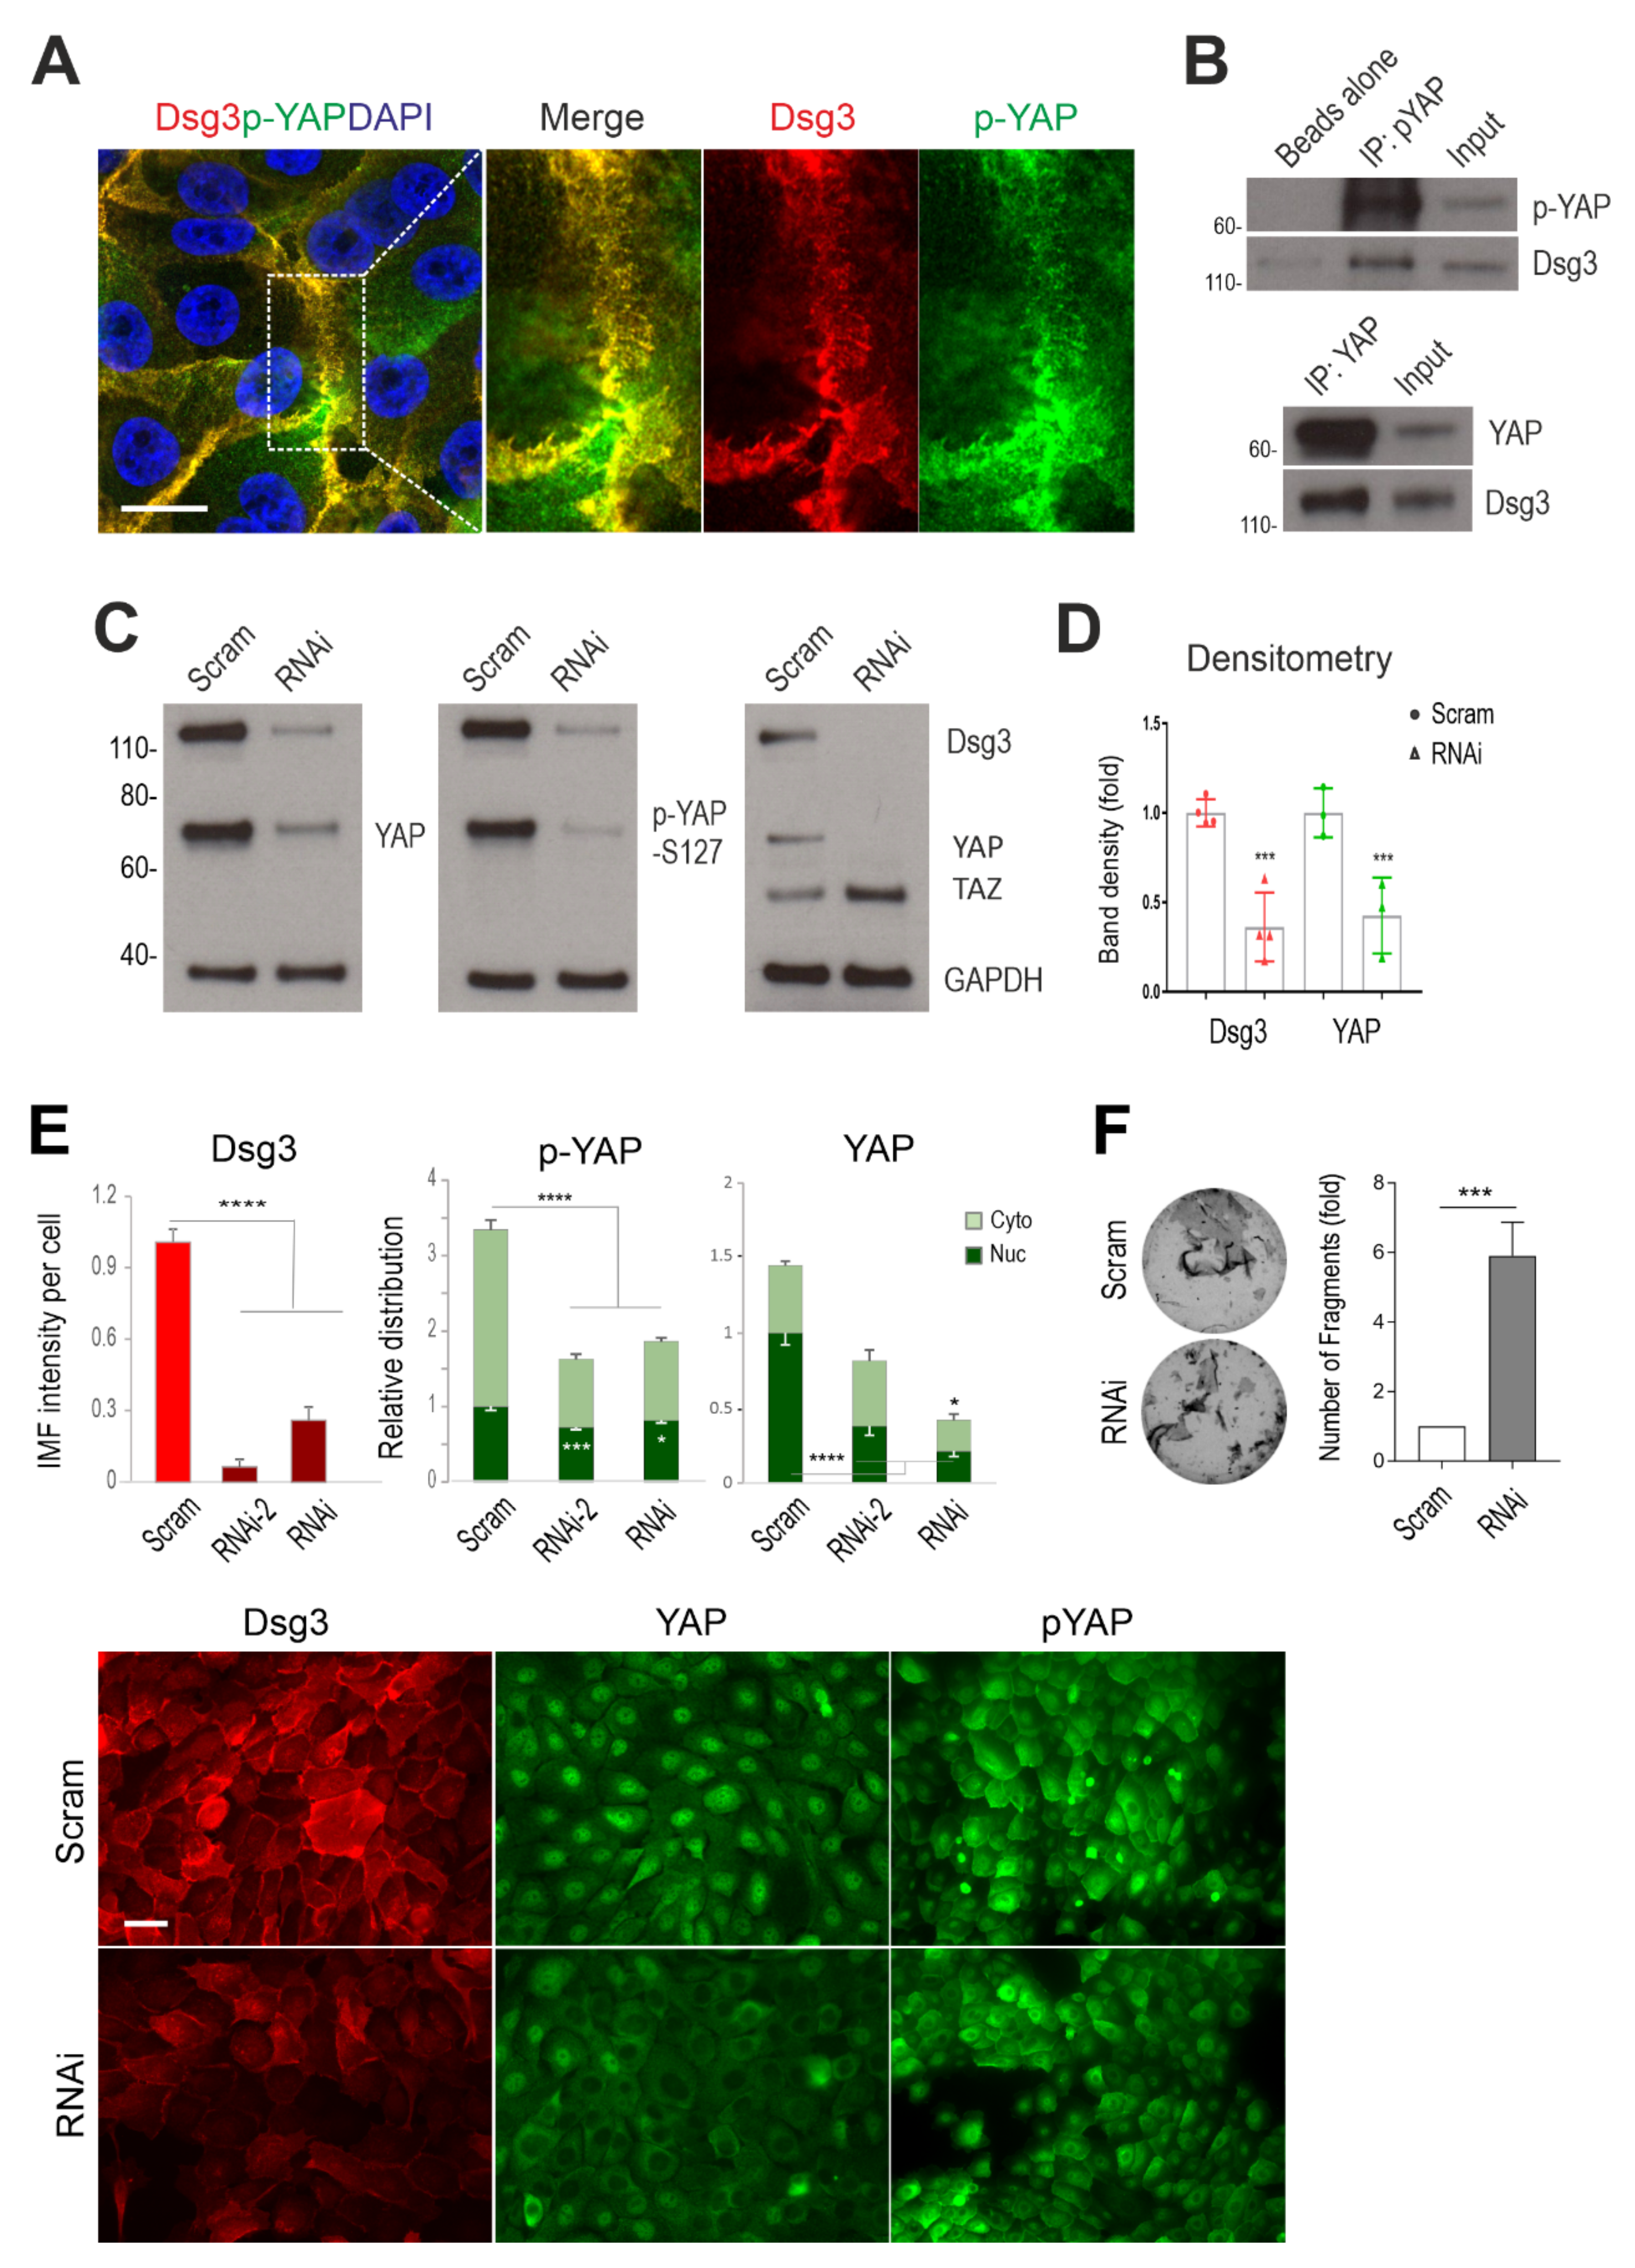
Figure 1.
Dsg3 complexes with YAP/p-YAP, with its knockdown resulting in their significant reduction and disruption of intercellular adhesion in N/TERT cells. (A) Confocal super-resolution microscopy of N/TERT cells double-stained for Dsg3 and p-YAP showed their colocalisation, especially at cell borders. The enlarged dotted box for each channel is displayed on the right, respectively. (B) Co-immunoprecipitation (co-IP) in freshly confluent cell lysates with antibodies for p-YAP (IP: pYAP) or YAP (IP: YAP) that demonstrated Dsg3 physically interacted with the protein complexes purified with anti-p-YAP or YAP. The control lane was Beads alone, and input was lysates before IP (7~8%) (n = 2 independent experiments performed). (C) Western blotting for the indicated proteins in N/TERT cells pre-treated with Dsg3 specific or scrambled control siRNA for 2 days (n = 3 independent experiments). GAPDH was used as a loading control. (D) Densitometry for the indicated protein blots. (E) Image quantitation for the indicated proteins and their subcellular distribution in cells transfected with two hits of Dsg3 siRNA. A significant reduction in YAP/p-YAP was detected in cells with Dsg3 knockdown. The representative images for the indicated proteins in control and Dsg3 knockdown cells are displayed below the bar charts (n = 5 images/sample, representative of three independent experiments, Mean ± SD). (F) Dispase cell dissociation assay in N/TERTs with Dsg3 knockdown or control cells treated with scrambled siRNA. The siRNA pre-treated cells were pooled at confluent densities one day after siRNA transfection and were allowed to grow for 2 days before dispase treatment at 2.4 unit/mL until the epithelial cell sheets detached from the substrate, followed by mechanical stress to induce fragmentation. Images are displayed on the left and the quantitation of fragments is shown on the right (n = 4, Mean ± SD). (Student’s t-test for two-group comparison or one-way ANOVA for three group comparison, * p < 0.05, *** p < 0.001 and **** p < 0.0001). Scale bar in A, 10 µm and E, 20 µm.
![Life 12 00792 g001]()
Figure 2.
Coordinated regulation of Dsg3 and Hippo-YAP components in a cell density and a time-dependent manner. (
A) Fluorescent images of N/TERT cells seeded at low, intermediate and high cell densities for 1 day before immunostaining for Dsg3 and p-YAP as well as Hippo kinase LATS1/2 showed a density-dependent increase in Dsg3 coupled with p-YAP/LATS1/2 nuclear exclusion, especially at the high cell density. (
B) Quantification for the images shown in A. (
C,
D) Western blotting analysis of lysates extracted from cells grown at three different densities or in a time-course study that detected a cell density and time-dependent augmentation in both Dsg3 and p-YAP expression, with YAP levels appearing relatively stable, with the densitometry shown in C. For the time-course experiment, N/TERT cells were seeded in KSFM at low calcium (0.09 mM) before being replaced with KGM containing normal calcium concentration (1.8 mM). Cells were grown for various time frames before extraction or immunostaining for p-YAP and Dsg3 with the image quantitation shown in (
E) and the representative images in
Figure S1. A bell-shaped expression profile was detected for both p-YAP and Dsg3 (n = 5 images/coverslips, at least three experiments were performed, Mean ± SEM,
p values were determined by one-way ANOVA, *
p < 0.05, **
p < 0.01, ***
p < 0.001 and ****
p < 0.0001). Nuc: nucleus; Cyto: cytoplasm; Ca
++: calcium ion. Scale bar, 20 µm.
![Life 12 00792 g002]()
Figure 3.
Coordinated regulation of Dsg3 and Hippo-YAP components in response to growing cell densities in T8 keratinocytes. (A) Fluorescent images of cutaneous carcinoma T8 (parental) cells seeded at low, intermediate and high cell densities for 1 day before immunostaining for Dsg3 and Hippo kinase LATS1/2 showed a density-dependent increase in Dsg3 coupled with LATS1/2 nuclear exclusion, especially at the high cell density. Image quantification for Dsg3 expression and LATS1/2 subcellular distribution was shown on the right. (B) Immunofluorescent staining for Dsg3, p-YAP and LATS1/2 in T8 stable lines with transduction of hDsg3.myc (D3) and the matched empty vector control line (Vect Ct) showed that the elevated Dsg3 expression was correlated with cytoplasmic translocation of p-YAP and LATS1/2, respectively. Image quantification for Dsg3 expression and p-YAP/LATS1/2 subcellular distribution was shown on the right. (n = 5 fields/coverslips, a representative from at least three experiments, Mean ± SEM, Student’s t-test or one-way ANOVA was used to determine the statistical significance for two groups or three groups comparison, respectively, * p < 0.05, ** p < 0.01, **** p < 0.0001). Scale bar, 20 µm.
![Life 12 00792 g003]()
Figure 4.
Treatment of N/TERT keratinocytes with VP shows little or no effect on cell viability. (A,B) N/TERT cells were treated with VP at various time frames and dosages as indicated in the figure. Cells were seeded in a 24-well plate in triplicate overnight before being treated with VP at increasing concentrations, i.e., 1, 3, and 5 µg/mL for 2, 6 and 24 h before MTT assay (A) and Trypan blue assay (B). (C) Measurement of the ROS levels in cells treated with VP. Cells was seeded in a 96-well plate overnight before being treated with VP at various concentrations for 6 h. Then, cells were incubated with CellRox reagent (5 µm) for 30 min before brief washing with PBS followed by image acquisition with an INCA 2200 Analyzer system straightaway. Image quantitation indicated no significant increase in ROS in cells treated with VP compared to controls (n = 25 automated fields/well, Mean ± SEM).
Figure 5.
Desmosomal genes are the targets of YAP nuclear transcription activity and VP treatment causes drastic suppression of cell junctional proteins in N/TERT cells. (A) IMF analysis of YAP nuclear expression in cells treated with VP at different concentrations for various time points indicated a time and a dose-dependent reduction in nuclear YAP. (B) qPCR analysis for various cell anchoring junctional genes in N/TERTs treated in the presence and absence of VP at 2 µg/mL for 6 h (n = 4, Student’s t-test was used to determine the p values, * p < 0.05, ** p < 0.01, *** p < 0.001 and $ p < 0.0001). NS, no significance. Note that the p-value for YAP1 was p = 0.08 based on the current test. (C) Western blotting analysis for the indicated cell junction assembly proteins showed a remarkable decrease, except for Dp and β-Catenin, in cells with treatment of VP in a dose-dependent manner, compared to the respective controls. Cells were treated with VP at various concentrations for 6 h before protein extraction. Dp: desmoplakin; E-Cad: E-cadherin; PKP1: plakophilin 1; PKP3: plakophilins 3; β-Cat: β-Catenin. (D) Dispase cell dissociation assay showed compromised cell–cell adhesion strength in cells treated with VP in a dose-dependent manner. N/TERT cells were seeded at confluent densities and grown for three days to allow the junctions to become established. Then, cells were treated with VP for the indicated concentrations alongside vehicle control for 6 h before dispase treatment at a 2.4 unit/mL concentration until the epithelial cell sheets detached from the substrate. This was followed by mechanical stress to induce fragmentation as displayed in the images on the right, and the quantitation of fragments in cells treated in the presence and absence of VP is shown on the left (Mean ± SEM, one-way ANOVA was used to determine the statistical significance, **** p < 0.0001).
![Life 12 00792 g005]()
Figure 6.
Overexpression of Dsg3 can compensate VP-induced attenuation of junction protein expression and disruption of the anchoring junction architecture in T8 keratinocytes. (A) YAP/TAZ luciferase assay in skin-derived T8 carcinoma cell lines with transduction of hDsg3.myc (T8-D3) and matched vector control (Vect Ct) alongside parental cells (T8-P). Cells were transfected with the YAP/TAZ plasmid (8xGTIIC) for 24 h before the luciferase assay. Relatively higher luciferase activity of YAP/TAZ was detected in the T8-D3 cell line compared to controls (representative of three independent experiments, * p < 0.05). (B) Confocal images in Vect Ct and D3 cells that were treated with VP at 3 µg/mL for 2 and 6 h before formaldehyde fixation only without Triton and then immunostained for surface Dsg3 (5H10) and E-cadherin (HECD-1), both of which bind to the N-terminus of the extracellular domains of cadherins, as well as plakoglobin (Pg) in cells after being treated with Triton. Compensation for junction formation in both the E-cadherin and Pg staining was shown in D3 cells with overexpression of Dsg3 compared to Vect Ct cells treated with VP. Note that pronounced nuclear Pg was detected in Vect Ct with marked suppression in D3 cells (images were representative of three independent experiments). (C) Western blotting analysis for various cell junction assembly proteins in T8 Vect Ct and D3 lines exposed to VP at 3 µg/mL for 2 and 6 h. Again, compensation was detected for various proteins in D3 cells treated with VP. Scale bar, 20 µm.
![Life 12 00792 g006]()
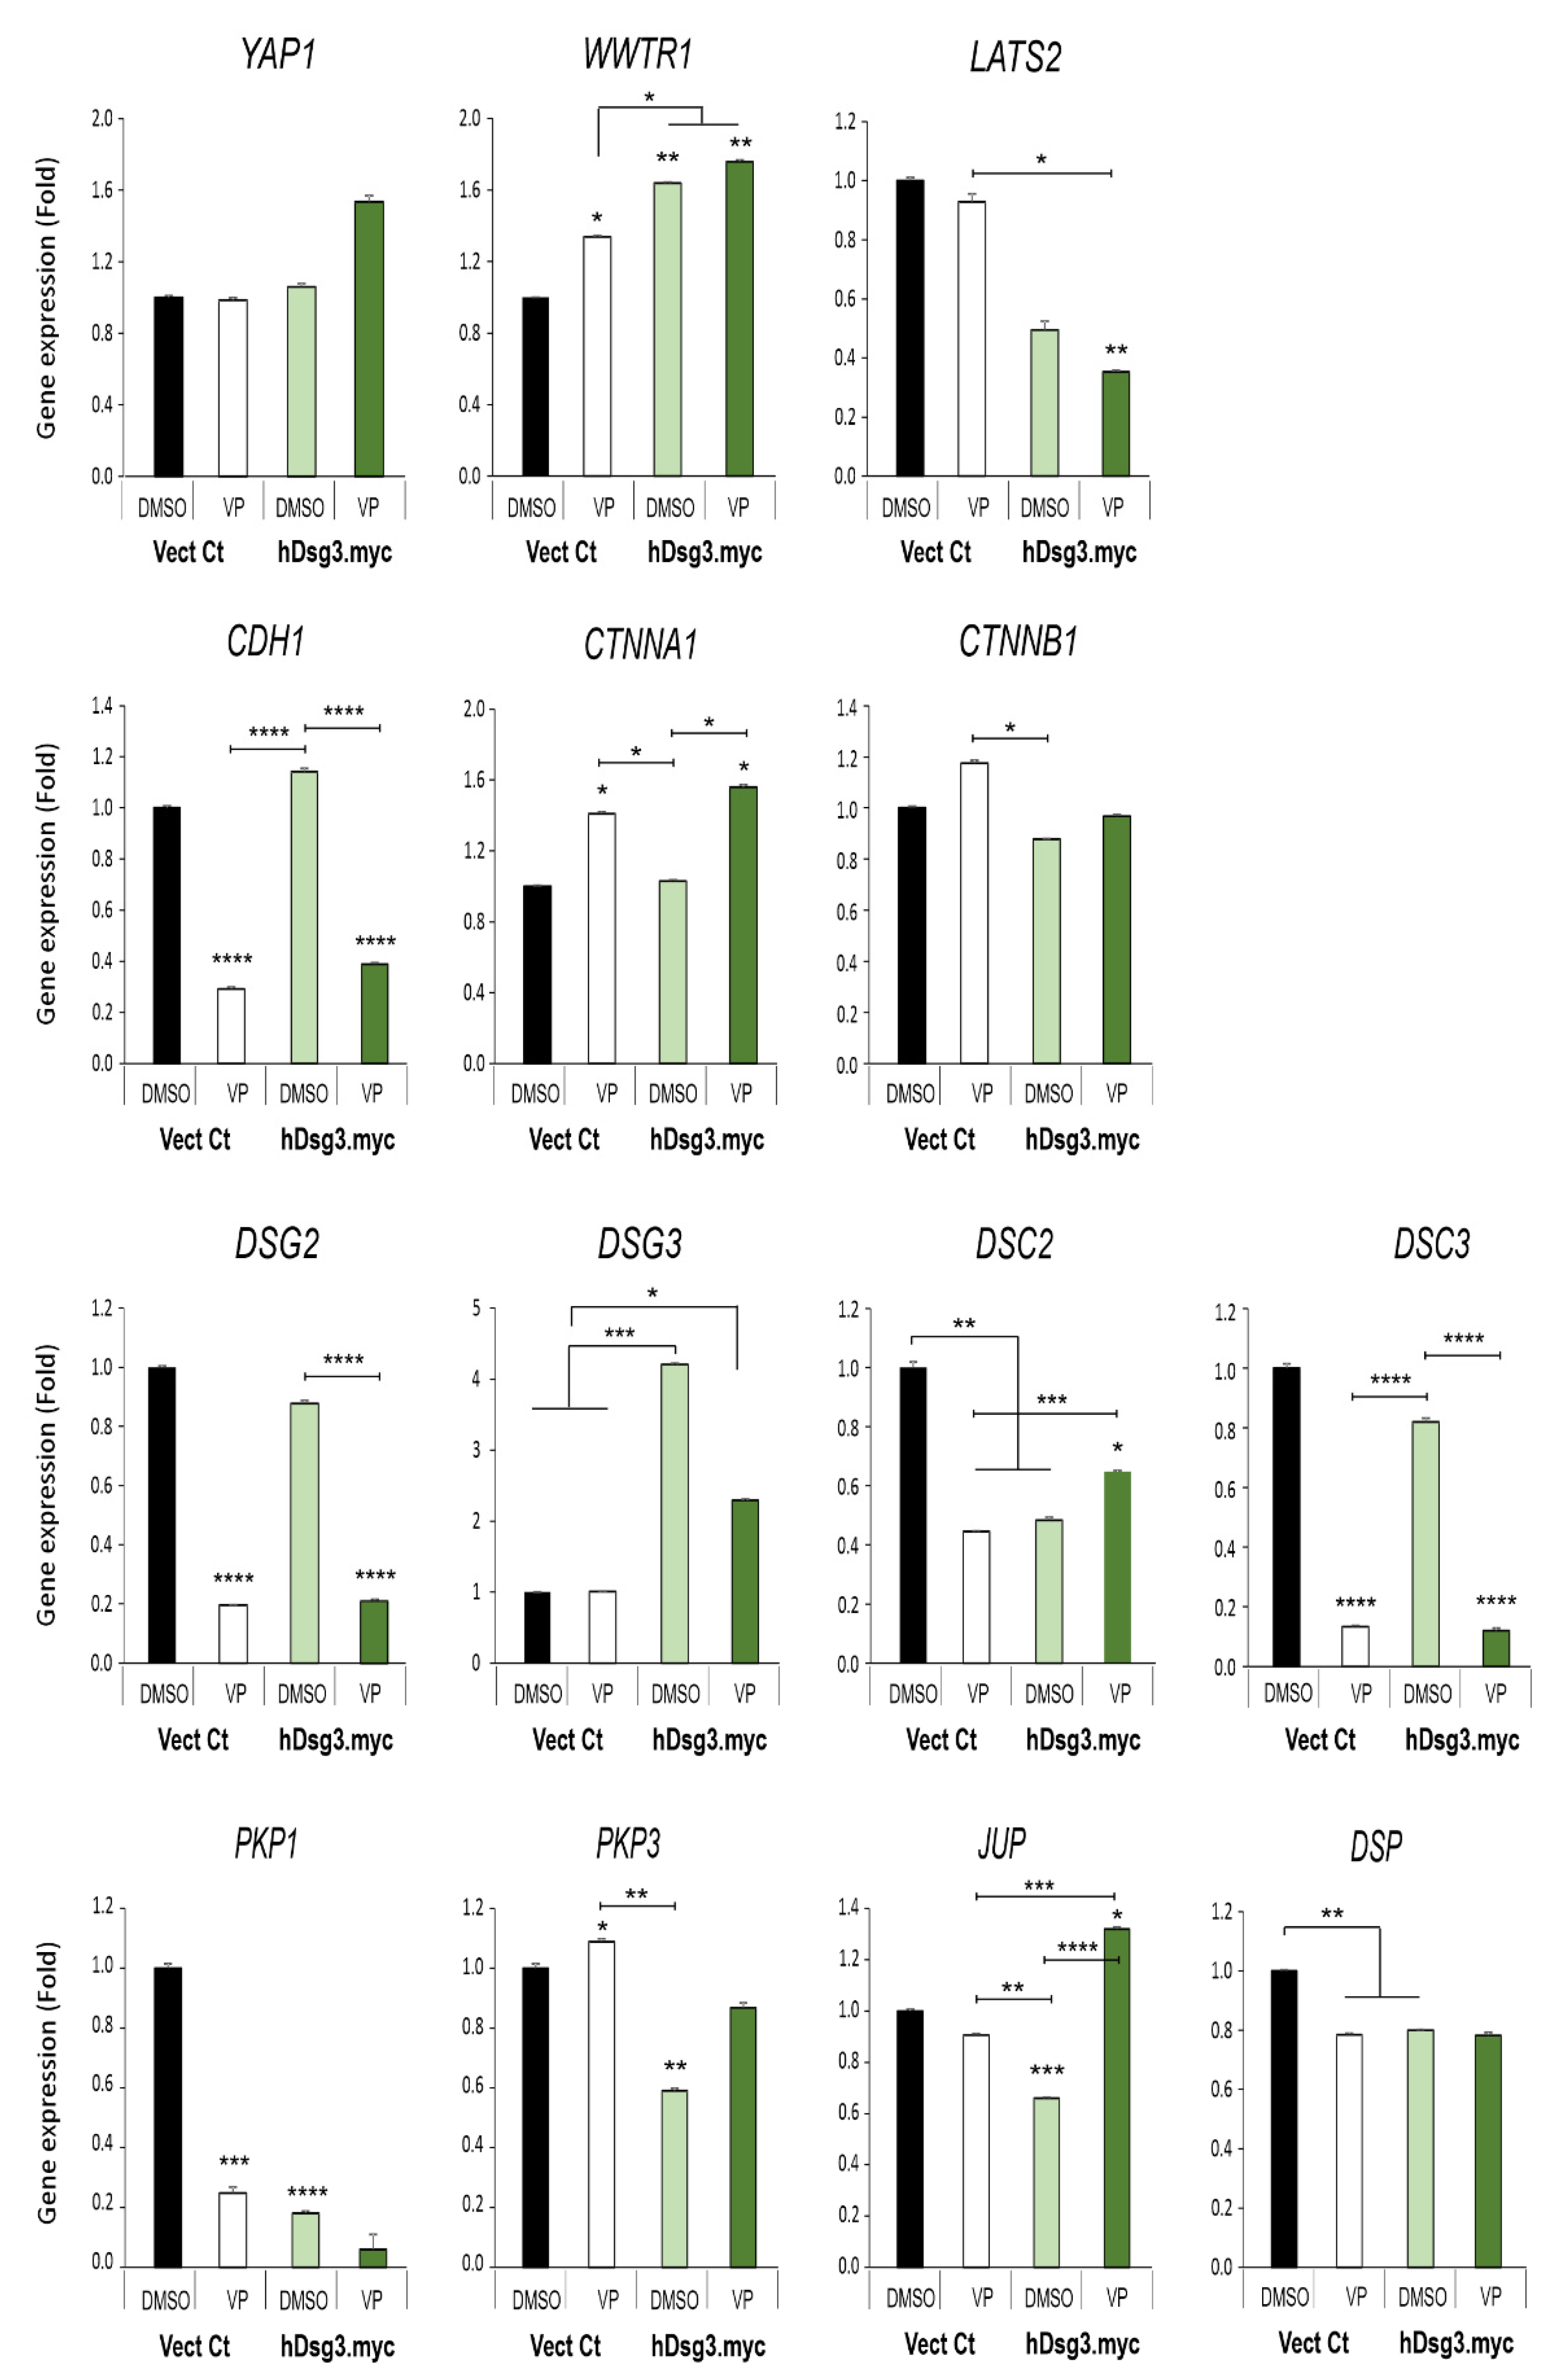
Figure 7.
Effect of Dsg3 overexpression and VP treatment on the expression of various Hippo and junctional genes in T8 keratinocyte cell lines. qPCR data showed variations of individual genes in cells with Dsg3 overexpression and treated in the presence and absence of VP at 3 µg/mL for 6 h. Increased expression of WWTR1 but a decrease in DSC2, PKP1/3, JUP and DSP were detected in D3 cells compared to the Vect Ct line. Increased expression of WWTR1 and CTNNA1 was also shown to be induced by VP treatment, but only DSC2 and JUP displayed compensation in D3 cells with overexpression of Dsg3 relative to controls without VP exposure (n = 4, error bar: Mean ± SEM, * p < 0.05, ** p < 0.01, *** p < 0.001, **** p < 0.0001).
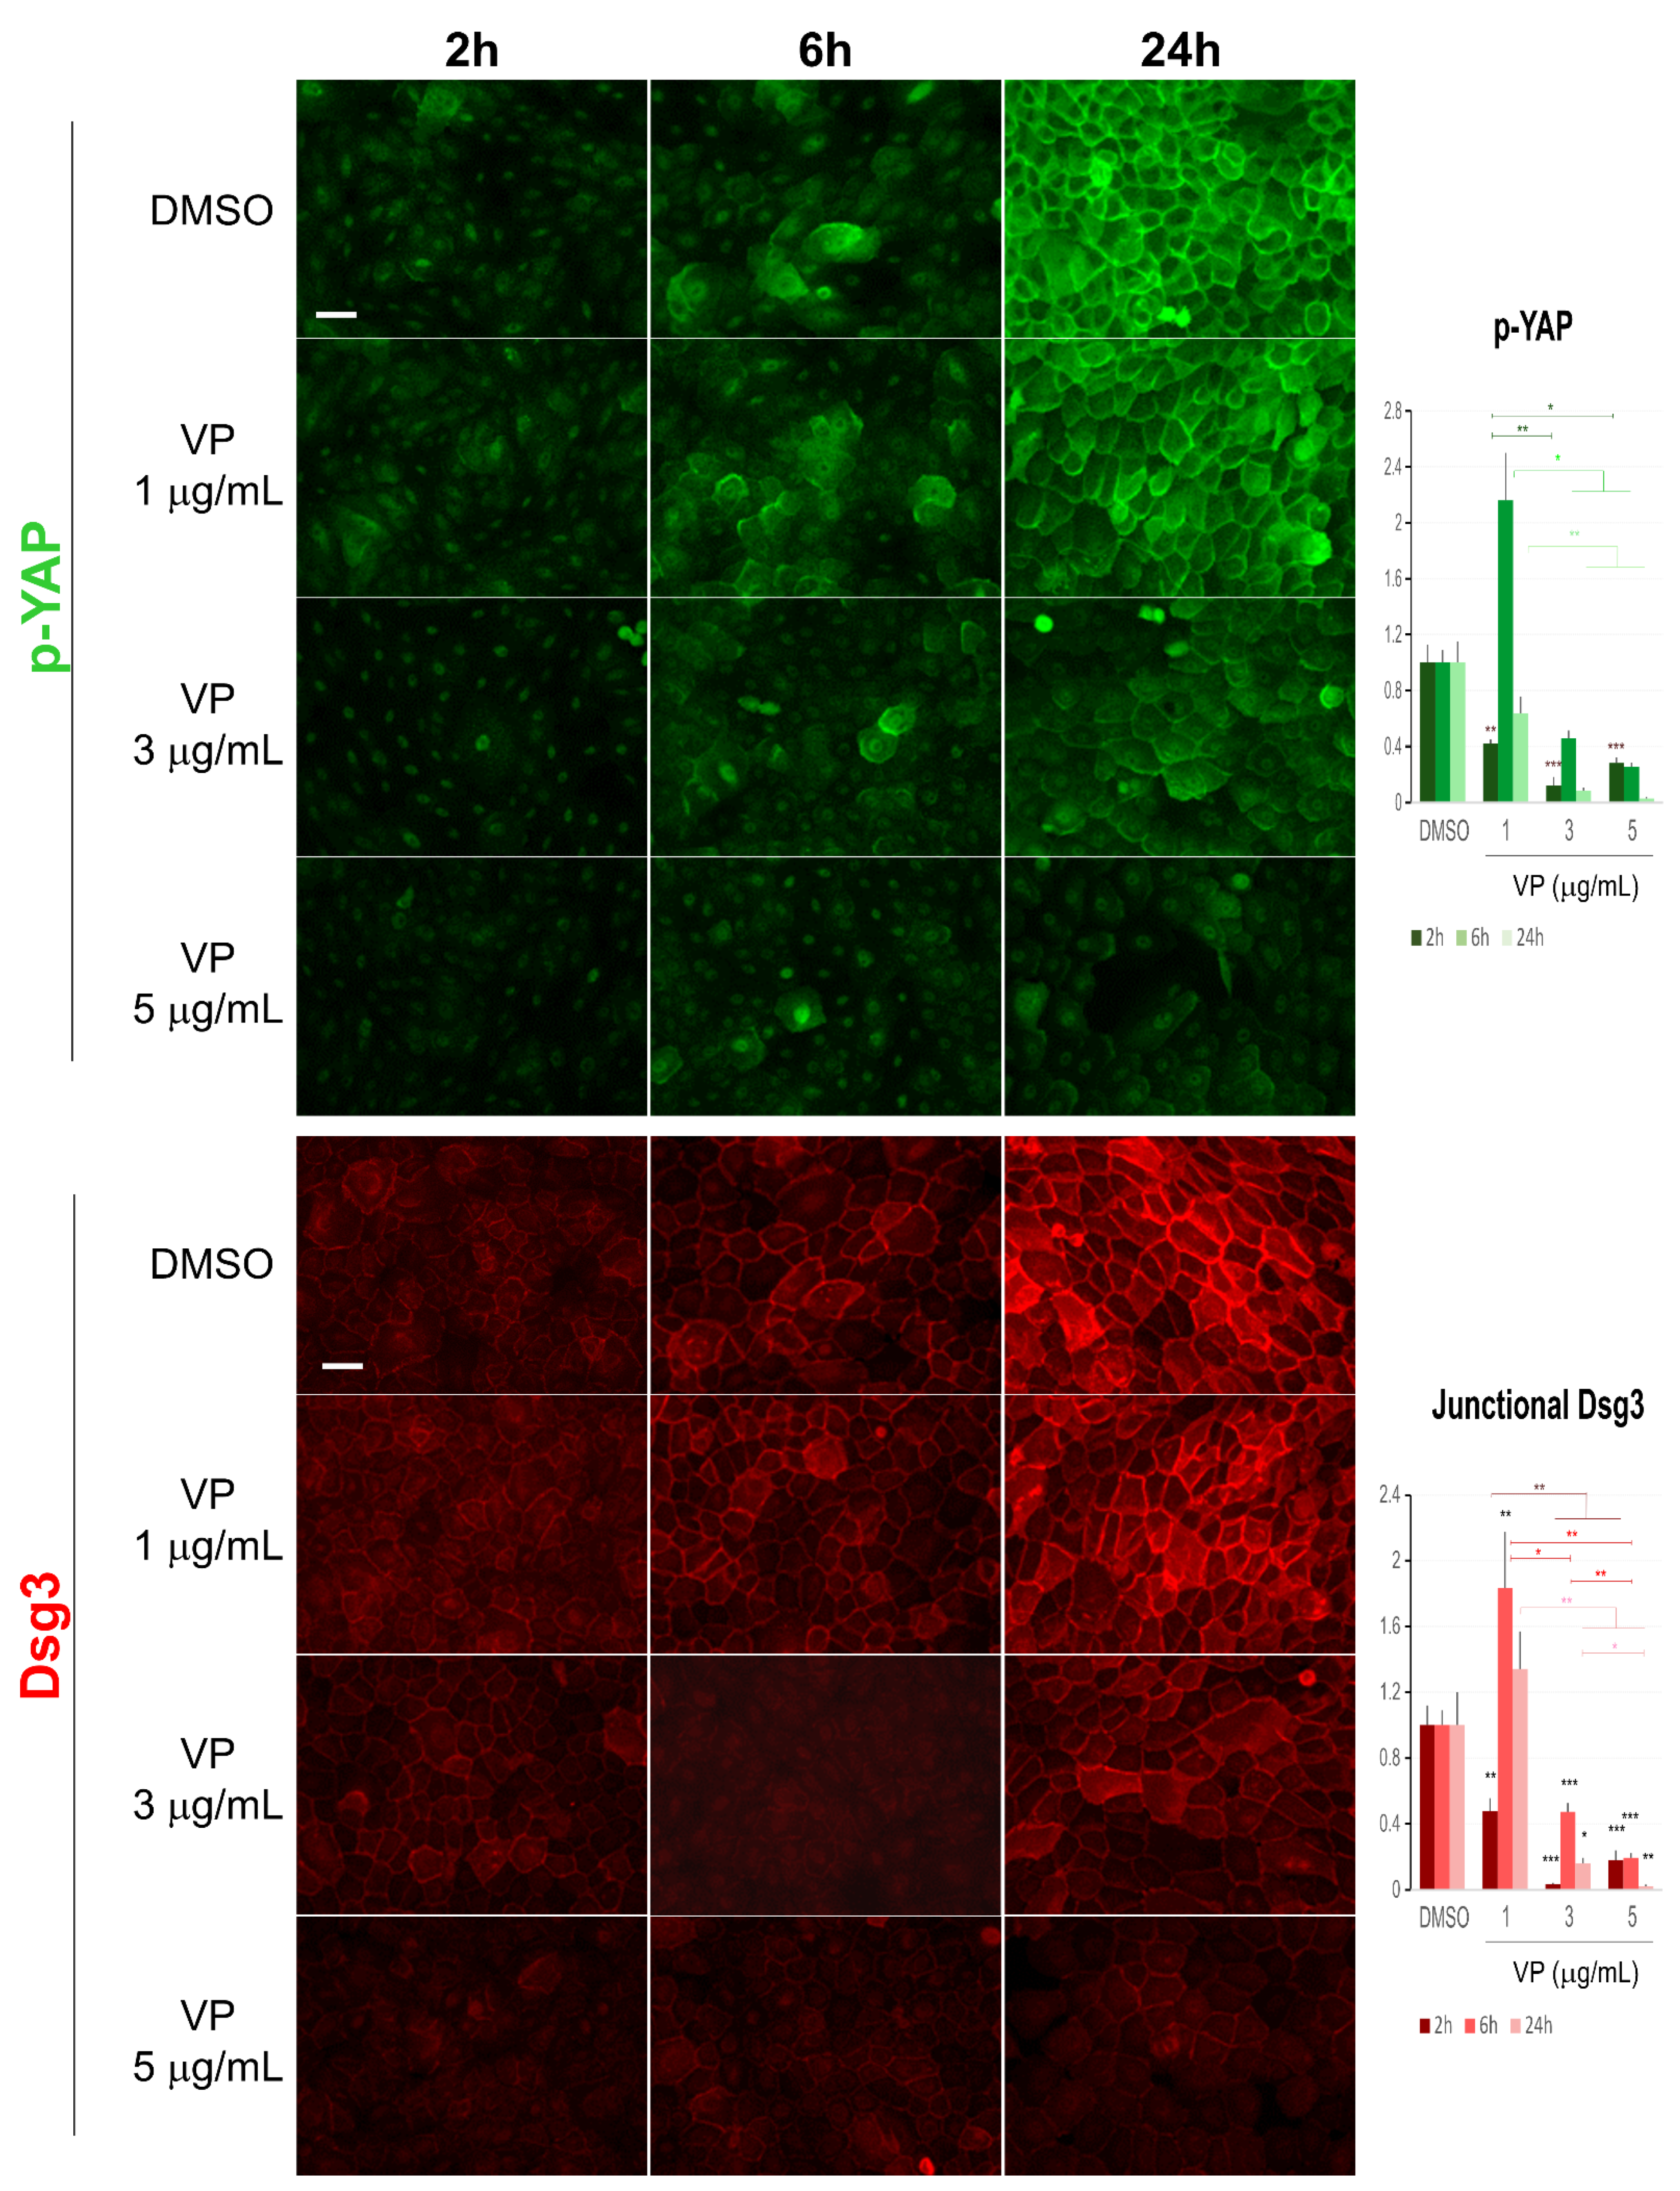
Figure 8.
Immunofluorescence for Dsg3 and p-YAP indicates their concurrent regulation in N/TERT cells in response to VP treatment. The epi-fluorescent microscopic images showed a clear trend of a dose and time-dependent reduction in Dsg3 and p-YAP in cells treated with VP at increasing concentrations, i.e., 1, 3, and 5 µg/mL for 2, 6 and 24 h. Image quantitation for both proteins was shown in the bar charts on the right. IMF intensities for each time point were normalised against DMSO vehicle control (n = 5 images/coverslips, data were the representative of at least three independent experiments, Mean ± SEM, two-way ANOVA was used to determine the statistical significance, * p < 0.05, ** p < 0.01, *** p < 0.001). Note that a concurrent sharp increase in both Dsg3 and p-YAP was shown in cells exposed to VP at the concentration of 1 µg/mL for 6 h, but in general, there was a trend of a time and dose-dependent loss of both proteins in the VP treated cells compared to DMSO controls. Scale bar, 20 µm.
![Life 12 00792 g008]()
Figure 9.
Immunofluorescent analysis of α-Catenin and keratin 14 also showed a dose-dependent reduction in VP treated cells. (A) Confocal images of N/TERTs were treated in the presence and absence of VP for 6 and 24 h, respectively, and double labelled for α-Catenin (α-Cat) and keratin 14 (K14). K14 perinuclear retraction was apparent in VP treated cells at 6 h time point compared to DMSO control. (B) Image quantitation for the protein staining shown in A (n = 5 images/coverslips, data were a representative of two independent experiments, Mean ± SEM, one-way ANOVA was used to determine statistical significance, * p < 0.05, ** p < 0.01, *** p < 0.001, **** p < 0.0001). A clear dose-dependent reduction in both proteins was shown in VP-treated cells at 6 h time point. At the 24 h, however, an increased expression of α-Catenin was detected in the VP treated cells at the concentration of 3 µg/mL but with a marked reduction at the concentration of 5 µg/mL accompanied by decreased K14. Scale bar, 20 µm.
![Life 12 00792 g009]()
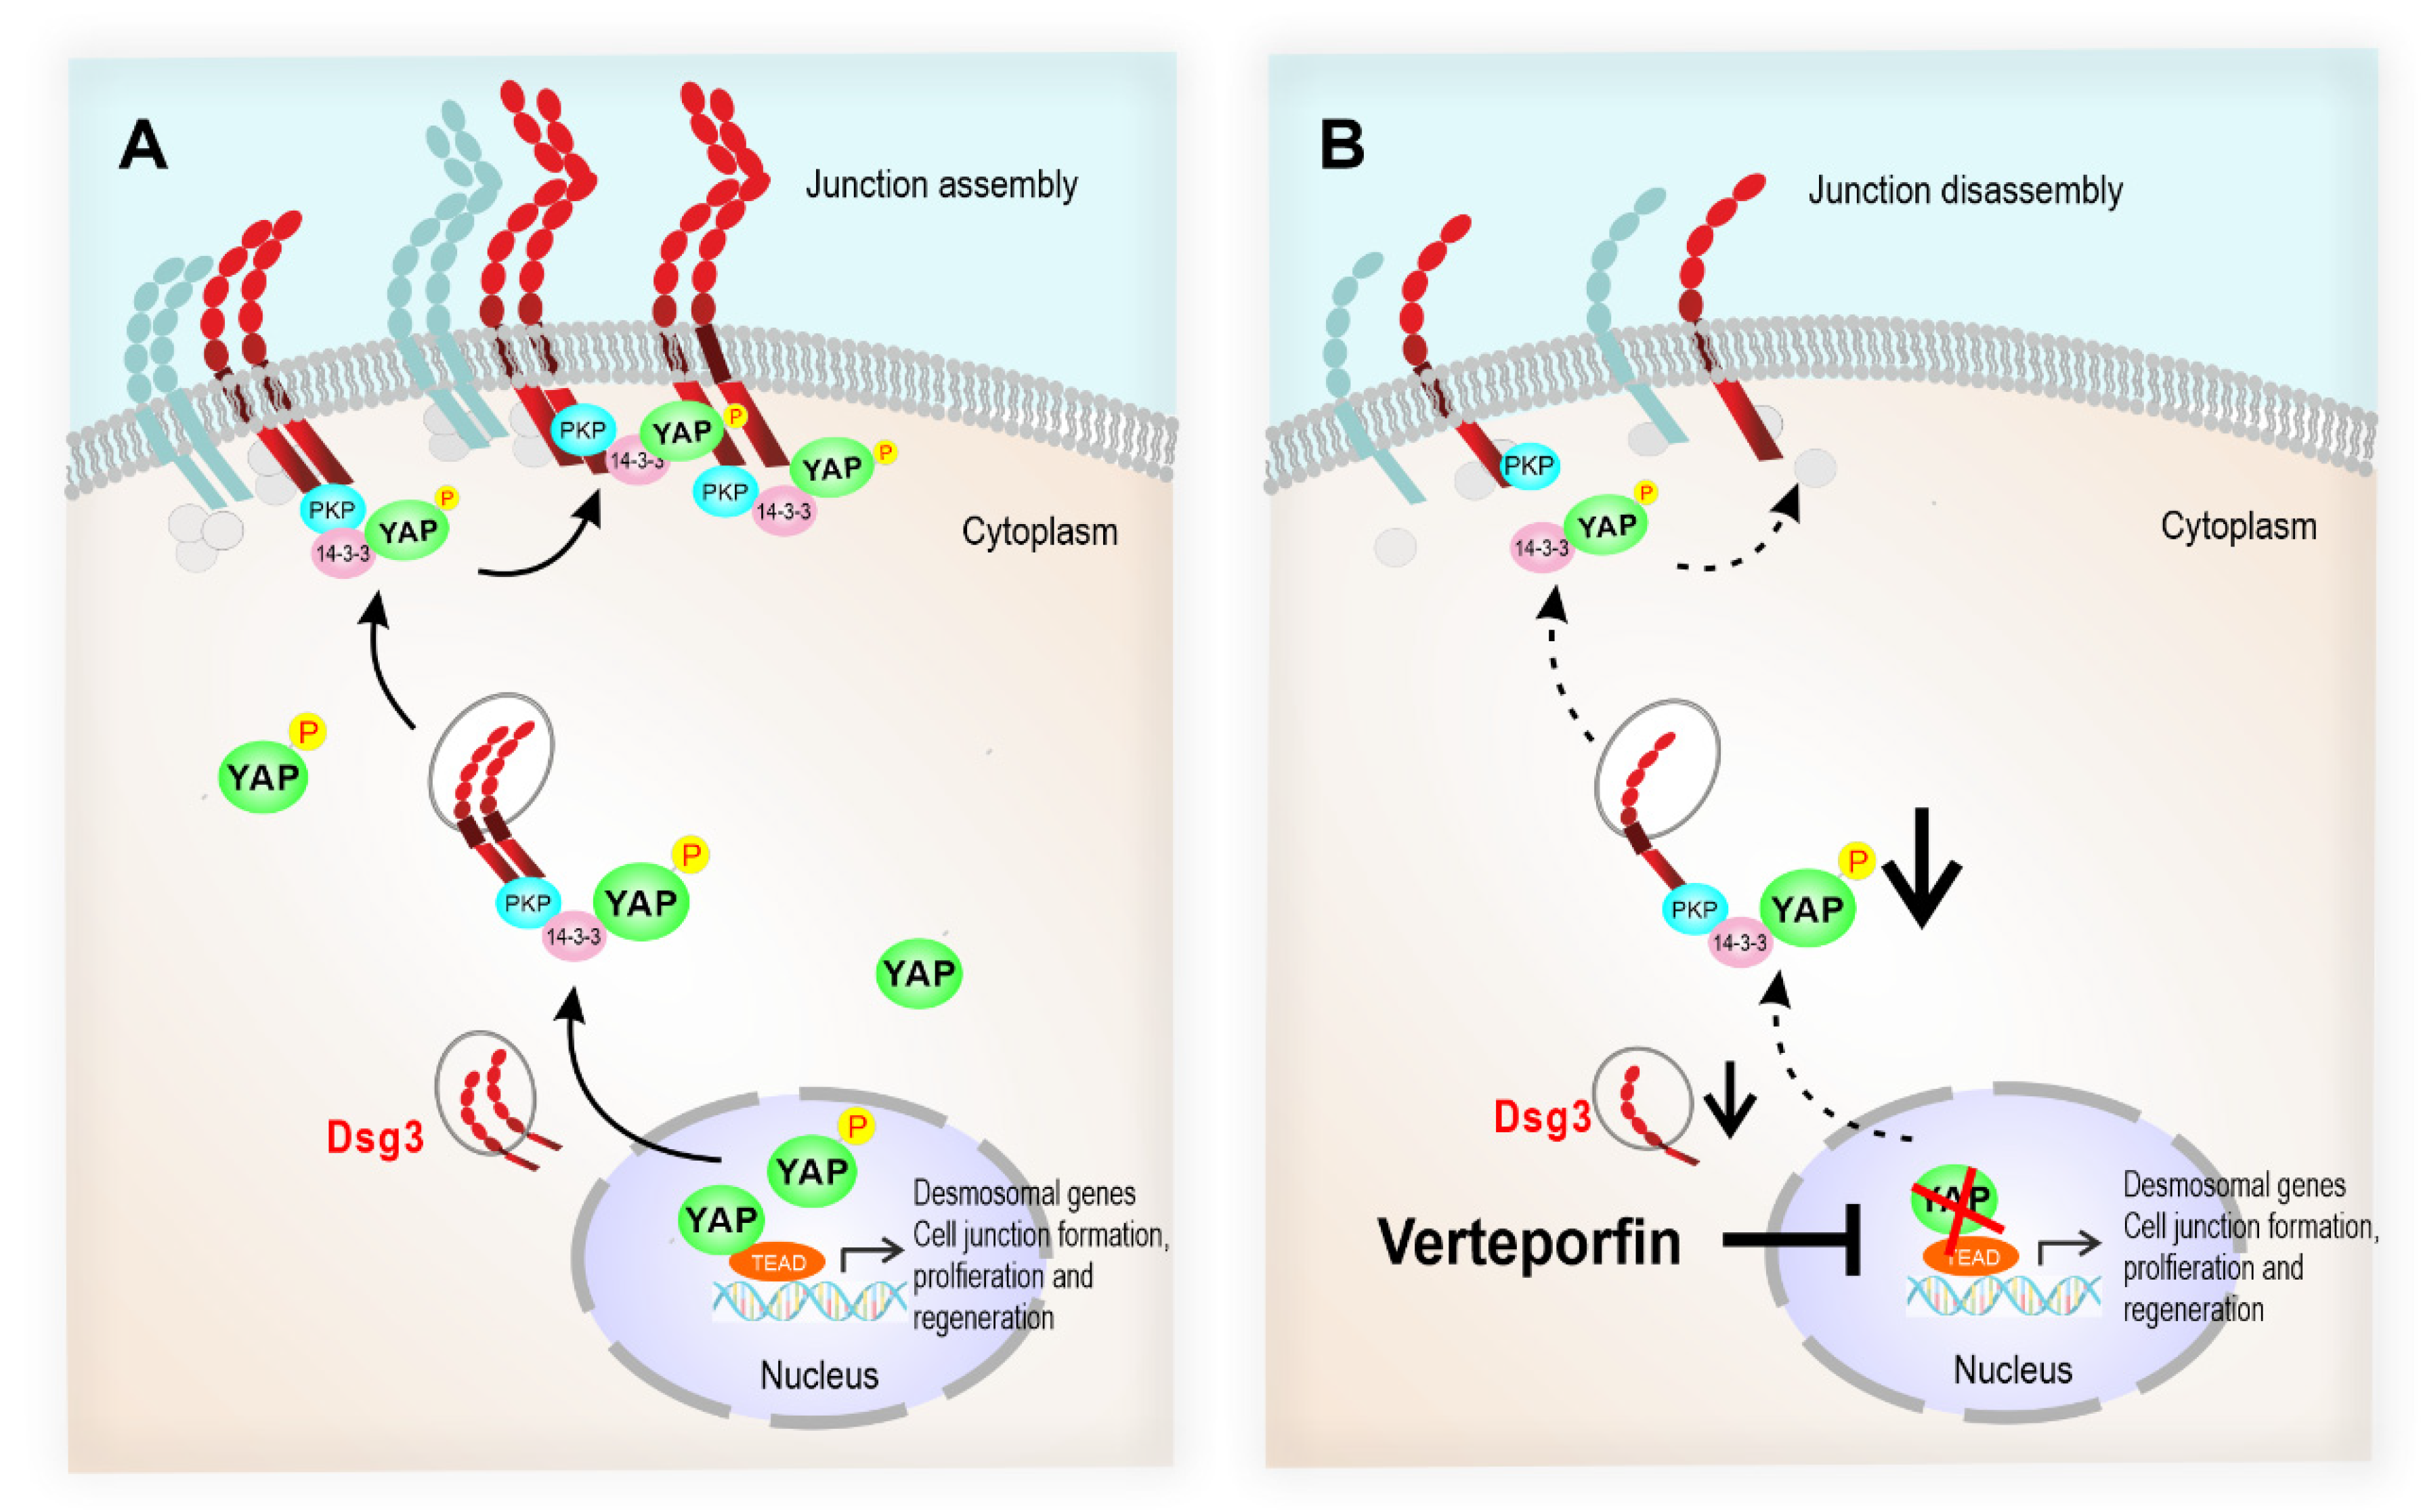
Figure 10.
The schematic model illustrates that the desmosomal genes are the YAP transcriptional targets, and the Dsg3/p-YAP complex is required for epithelial cell junction formation. (A) Upon activation of YAP during the epithelial regeneration, the expression of Dsg3, along with other cell junction proteins, is induced which leads to YAP phosphorylation and cytoplasmic translocation and eventually sequestered by Dsg3 to the cell surface to facilitate junction assembly. (B) In contrast, YAP inhibition by Verteporfin causes suppression of desmosomal gene transcription including Dsg3 and therefore the attenuation of the Dsg3/p-YAP complex, leading to the defect in junction assembly and ultimately the disintegration of cell junctions.


