Article

Growth Parameters and Mortality Rates Estimated for Seven Data-Deficient Fishes from the Azores Based on Length-Frequency Data

by
Régis Santos
1,2,*,
Ualerson Iran Peixoto
1,2,
Wendell Medeiros-Leal
1,2,
Ana Novoa-Pabon
1 and
Mário Pinho
1,2
1
Okeanos—UAc Instituto de Investigação em Ciências do Mar, Universidade dos Açores, Rua Prof. Dr. Frederico Machado 4, 9900-138 Horta, Portugal
2
IMAR Instituto do Mar, Universidade dos Açores, Rua Prof. Dr. Frederico Machado 4, 9901-862 Horta, Portugal
*
Author to whom correspondence should be addressed.
Life 2022, 12(6), 778; https://doi.org/10.3390/life12060778
Submission received: 28 March 2022 / Revised: 22 April 2022 / Accepted: 23 May 2022 / Published: 24 May 2022
(This article belongs to the Section Animal Science)

Abstract

:
Given the scarcity of information suitable for stock assessments, the growth and mortality of seven exploited marine fishes in Azorean waters were estimated based on length-frequency data. The studied species were Trachurus picturatus, Sparisoma cretense, Scomber colias, Scorpaena scrofa, Serranus atricauda, Seriola spp. and Aphanopus carbo. The growth parameters L (cm), k (year−1) and ϕ’ estimated through the ELEFAN_GA_boot routine were set at 55.87, 0.08 and 2.39 for T. picturatus; 55.03, 0.11 and 2.53 for S. cretense; 55.93, 0.18 and 2.76 for S. colias; 61.11, 0.11 and 2.61 for S. scrofa; 52.10, 0.12 and 2.51 for S. atricauda; 107.33, 0.12 and 3.18 for Seriola spp.; and 133.16, 0.09 and 3.19 for A. carbo; respectively. The total mortality rate estimated using the length–converted catch curve method was 0.22, 0.35, 0.58, 0.32, 0.31, 0.39 and 0.22 year−1; the natural mortality included 0.15, 0.20, 0.30, 0.20, 0.21, 0.21 and 0.16 year−1; and fishing mortality rate 0.07, 0.15, 0.28, 0.12, 0.10, 0.18 and 0.06 year−1, respectively, for the species mentioned. The relatively large sizes and slow growth with a low natural mortality rate indicate a high vulnerability to overfishing. Therefore, assessment and management initiatives are highly encouraged to ensure the sustainability of the resources.

1. Introduction

Knowledge of fish population dynamics (e.g., recruitment, growth and mortality) is essential for improving stock assessment and fisheries management [1,2]. Failure to manage fish populations efficiently may have devastating consequences for biodiversity as well as the livelihoods and socioeconomic situations of millions of people who rely heavily on these resources. Management strategies that successfully conserve the stocks and maximize sustainable yields are based on sufficient knowledge to understand the population dynamics and infer causal linkages between management measures (e.g., harvest control rules) and a fish population [3,4].
Growth parameters and mortality rates of fishes are crucial inputs for stock assessments. This is because they provide valuable information on the variation of fish size over time and the decline in population biomass due to fishing and/or natural causes [1,5]. Traditional methods for determining the growth parameters include direct readings of rigid structures (e.g., otoliths, spines and vertebrae) to estimate the age of fish or indirect estimations based on length distribution data over time [1]. While well-conducted growth studies using otoliths, scales or other rigid structures should produce more accurate growth estimates than studies using solely length-frequency data, length-based approaches are highly desirable, mainly when age data collection is resource-demanding or accurate aging is not possible [6,7,8]. Mortality estimates may be determined by assessing changes in the relative abundance of a certain group or age class of fish in the age-composition data [9]. As an alternative to using age-composition data to predict mortality, a combination of length-composition and growth curve data for the species can then be used [9].
To date, information on the growth and mortality of blue jack mackerel Trachurus picturatus, parrotfish Sparisoma cretense, Atlantic chub mackerel Scomber colias, red scorpionfish Scorpaena scrofa, blacktail comber Serranus atricauda, amberjacks nei Seriola spp., and black scabbardfish Aphanopus carbo is still scarce [10,11,12,13,14,15,16,17,18,19,20,21,22,23,24,25,26,27,28,29,30,31] or nonexistent. Traditionally, these species have been caught by small-scale communities that depend on the multi-species catch in nearshore ecosystems to maintain their livelihoods and food security. In the Azores (from 36° to 40° N and from 24° to 32° W), T. picturatus, S. cretense, S. colias, S. scrofa, S. atricauda, Seriola spp. (as S. dumerili and S. rivoliana are landed in the ports of the region due to their morphological similarity) and A. carbo were recently identified as priority species for assessment and management under the European Union Marine Strategy Framework Directive (MSFD; Descriptor 3) and United Nations Sustainable Development Goal 14 (SDG; Indicator 14.4.1) because of their economic, ecological and socio-cultural relevance [32].
Trachurus picturatus and S. colias are mostly caught by a small coastal fleet that operates with several types of surface nets in the Azores, the most important being the boat-operated purse-seine and lift net. These species are also caught by bottom longlines and handlines, but not as target species [10]. Trachurus picturatus and S. colias are used for local human consumption or as live bait in the tuna fishery, and during the last years, official landings have averaged 850 t and 300 t per year, respectively [32]. Sparisoma cretense and S. atricauda are targeted by coastal fisheries using gillnets and hook and lines, with landings of 210 t and 60 t on average per year [10,32]. Scorpaena scrofa and Seriola spp. are mostly caught by a small-scale bottom longline fishery, whose vessels (mostly less than 12 m in length) operate throughout the year around the islands and seamounts [10]. Aphanopus carbo is mainly targeted by a drifting longline fishery that operates in deep waters [32]. Official landings of these last three species have ranged from 30 to 100 t per year [32]. As management measures to reduce fishing impacts on these resources, fishing area restrictions and total allowable catch/quotas have been implemented over the last decades in the Azores [10].
Nevertheless, most of these resources are thought to be intensively exploited [32], and some species have shown a decreasing pattern in their catches [10]. On the other hand, the exploitation and stock status relative to the maximum sustainable yield are unclear due to a deficiency of data on populational aspects [10,32]. Life-history information available concerning growth parameters of those species is restricted to studies of Isidro [33] and Garcia et al. [17] for T. picturatus, Carvalho et al. [12] for S. colias and Amorim et al. [30] for S. atricauda. Studies on the mortality rate have only been undertaken in the Azores for S. colias [12] (Table 1).
Due to the relatively low time and financial cost of data collection, some information on length frequency derived from Azorean commercial landings is available for those species. The objective of this study was, therefore, to provide updated and new information on growth parameters and mortality rates of the data-deficient T. picturatus, S. cretense, S. colias, S. scrofa, S. atricauda, Seriola spp. and A. carbo species based on length-frequency data to inform stock assessment and improve fisheries management.

2. Materials and Methods

2.1. Data Collection

Fish species (blue jack mackerel T. picturatus, parrotfish S. cretense, Atlantic chub mackerel S. colias, red scorpionfish S. scrofa, blacktail comber S. atricauda, amberjacks nei Seriola spp. and black scabbardfish A. carbo) landed at the Azorean fish markets were sampled under the European Commission’s data collection framework (DCF) [37]. DCF sampling design and protocols were developed in accordance with the recommendations of the International Council for the Exploration of the Sea (ICES) working groups on commercial catches (WGCATCH; https://www.ices.dk/community/groups/Pages/WGCATCH.aspx; accessed on 10 January 2022) and biological parameters (WGBIOP; https://www.ices.dk/community/groups/Pages/WGBIOP.aspx; accessed on 10 January 2022) [38]. For fish species with a forked tail, the fork length (LF) was obtained instead of the total length (LT). Table 2 summarizes the number of individuals sampled by species, sampling time and measure of fish size.

2.2. Growth Parameters

Growth parameters were estimated through the von Bertalanffy growth function (VBGF) [7] using monthly length-frequency data (2 cm class interval for S. cretense, S. colias, S. scrofa and S. atricauda; and 3 cm class interval for T. picturatus, Seriola spp. and A. carbo) obtained from commercial landings. Data from Seriola spp. were grouped for this analysis due to a lack of data in some months. As the length data were not separated for males and females, growth parameters were estimated for pooled sexes. The original VBGF model [7] was altered to remove theoretical age at length zero (t0) as follows:
Lt = L (1 − ek(t))
where Lt is the fish length (cm) at age t (year), L is the asymptotic length (cm), i.e., the length that the fish of a population would reach if they were to grow indefinitely, and k is the growth coefficient that expresses the rate (year−1) at which the asymptotic length is approached. The asymptotic length (L), growth coefficient (k) and growth performance index (ϕ′) were computed by electronic length-frequency analysis using a bootstrapped method with a genetic algorithm (ELEFAN_GA_boot; [39]) within the TropFishR [40,41] and fishboot [39,42] packages in R [43]. Bootstrap experiments based on 1000 resamples.

2.3. Mortality Rates

The total mortality rate (Z; year−1) was estimated based on the linearized length–converted catch curve [44] within the TropFishR R package [40,41]. For this, it was assumed that the fisheries dynamics associated with each of the stocks analyzed remained reasonably steady during the chosen period. The natural mortality (M; year−1) was calculated as the average value of natural mortality assessed using different methods [45,46,47,48,49,50,51,52,53,54,55,56,57] (Table 3). The mean annual water temperature (T) was set at 18 °C following the mean annual water temperature of the study area [58,59,60]. Fishing mortality (F; year−1) was obtained from the relationship: F = Z − M.

3. Results

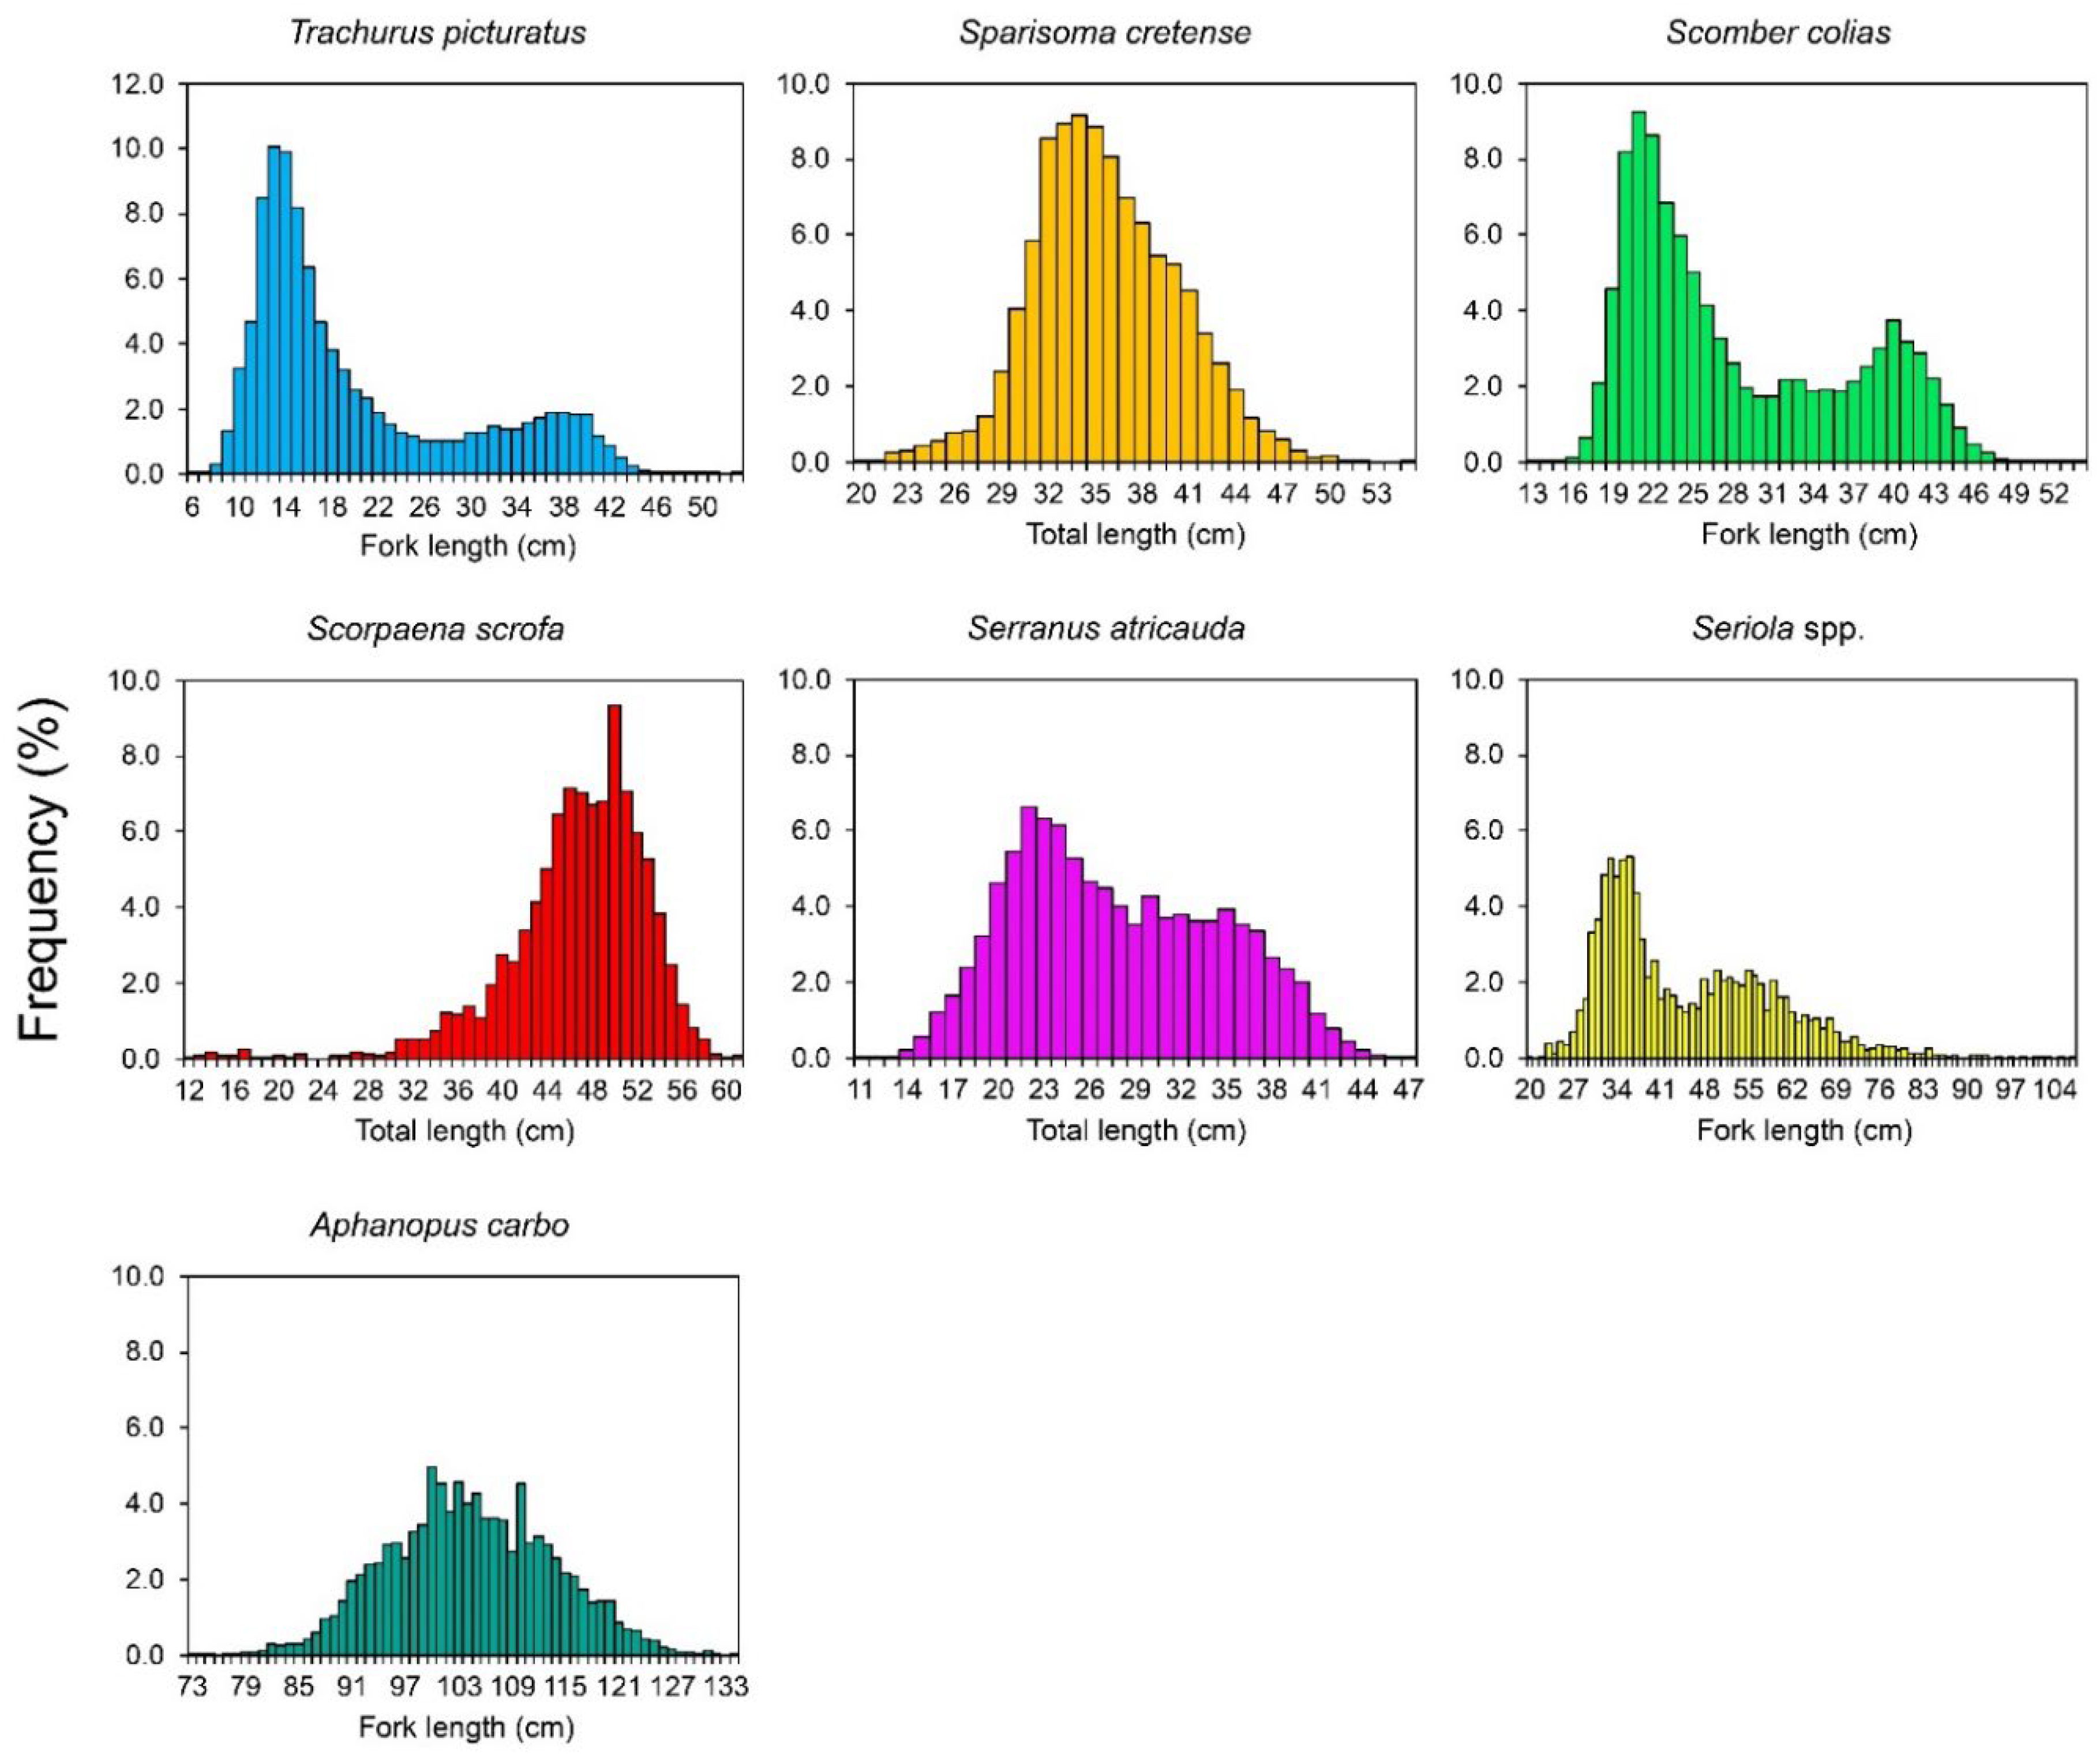
3.1. Length Distribution

The size range of individuals varied from 6 to 53 cm fork length (LF; mean length ± standard deviation: 24.04 ± 10.8) for Trachurus picturatus, from 20 to 55 cm total length (LT; 36.48 ± 5.50) for Sparisoma cretense, from 13 to 54 cm LF (30.89 ± 8.68) for Scomber colias, from 12 to 61 cm LT (46.85 ± 6.03) for Scorpaena scrofa, from 11 to 47 cm LT (30.25 ± 6.78) for Serranus atricauda, from 20 to 107 cm LF (49.22 ± 14.58) for Seriola spp. and from 73 to 134 cm LF (104.67 ± 10.53) for Aphanopus carbo (Figure 1).

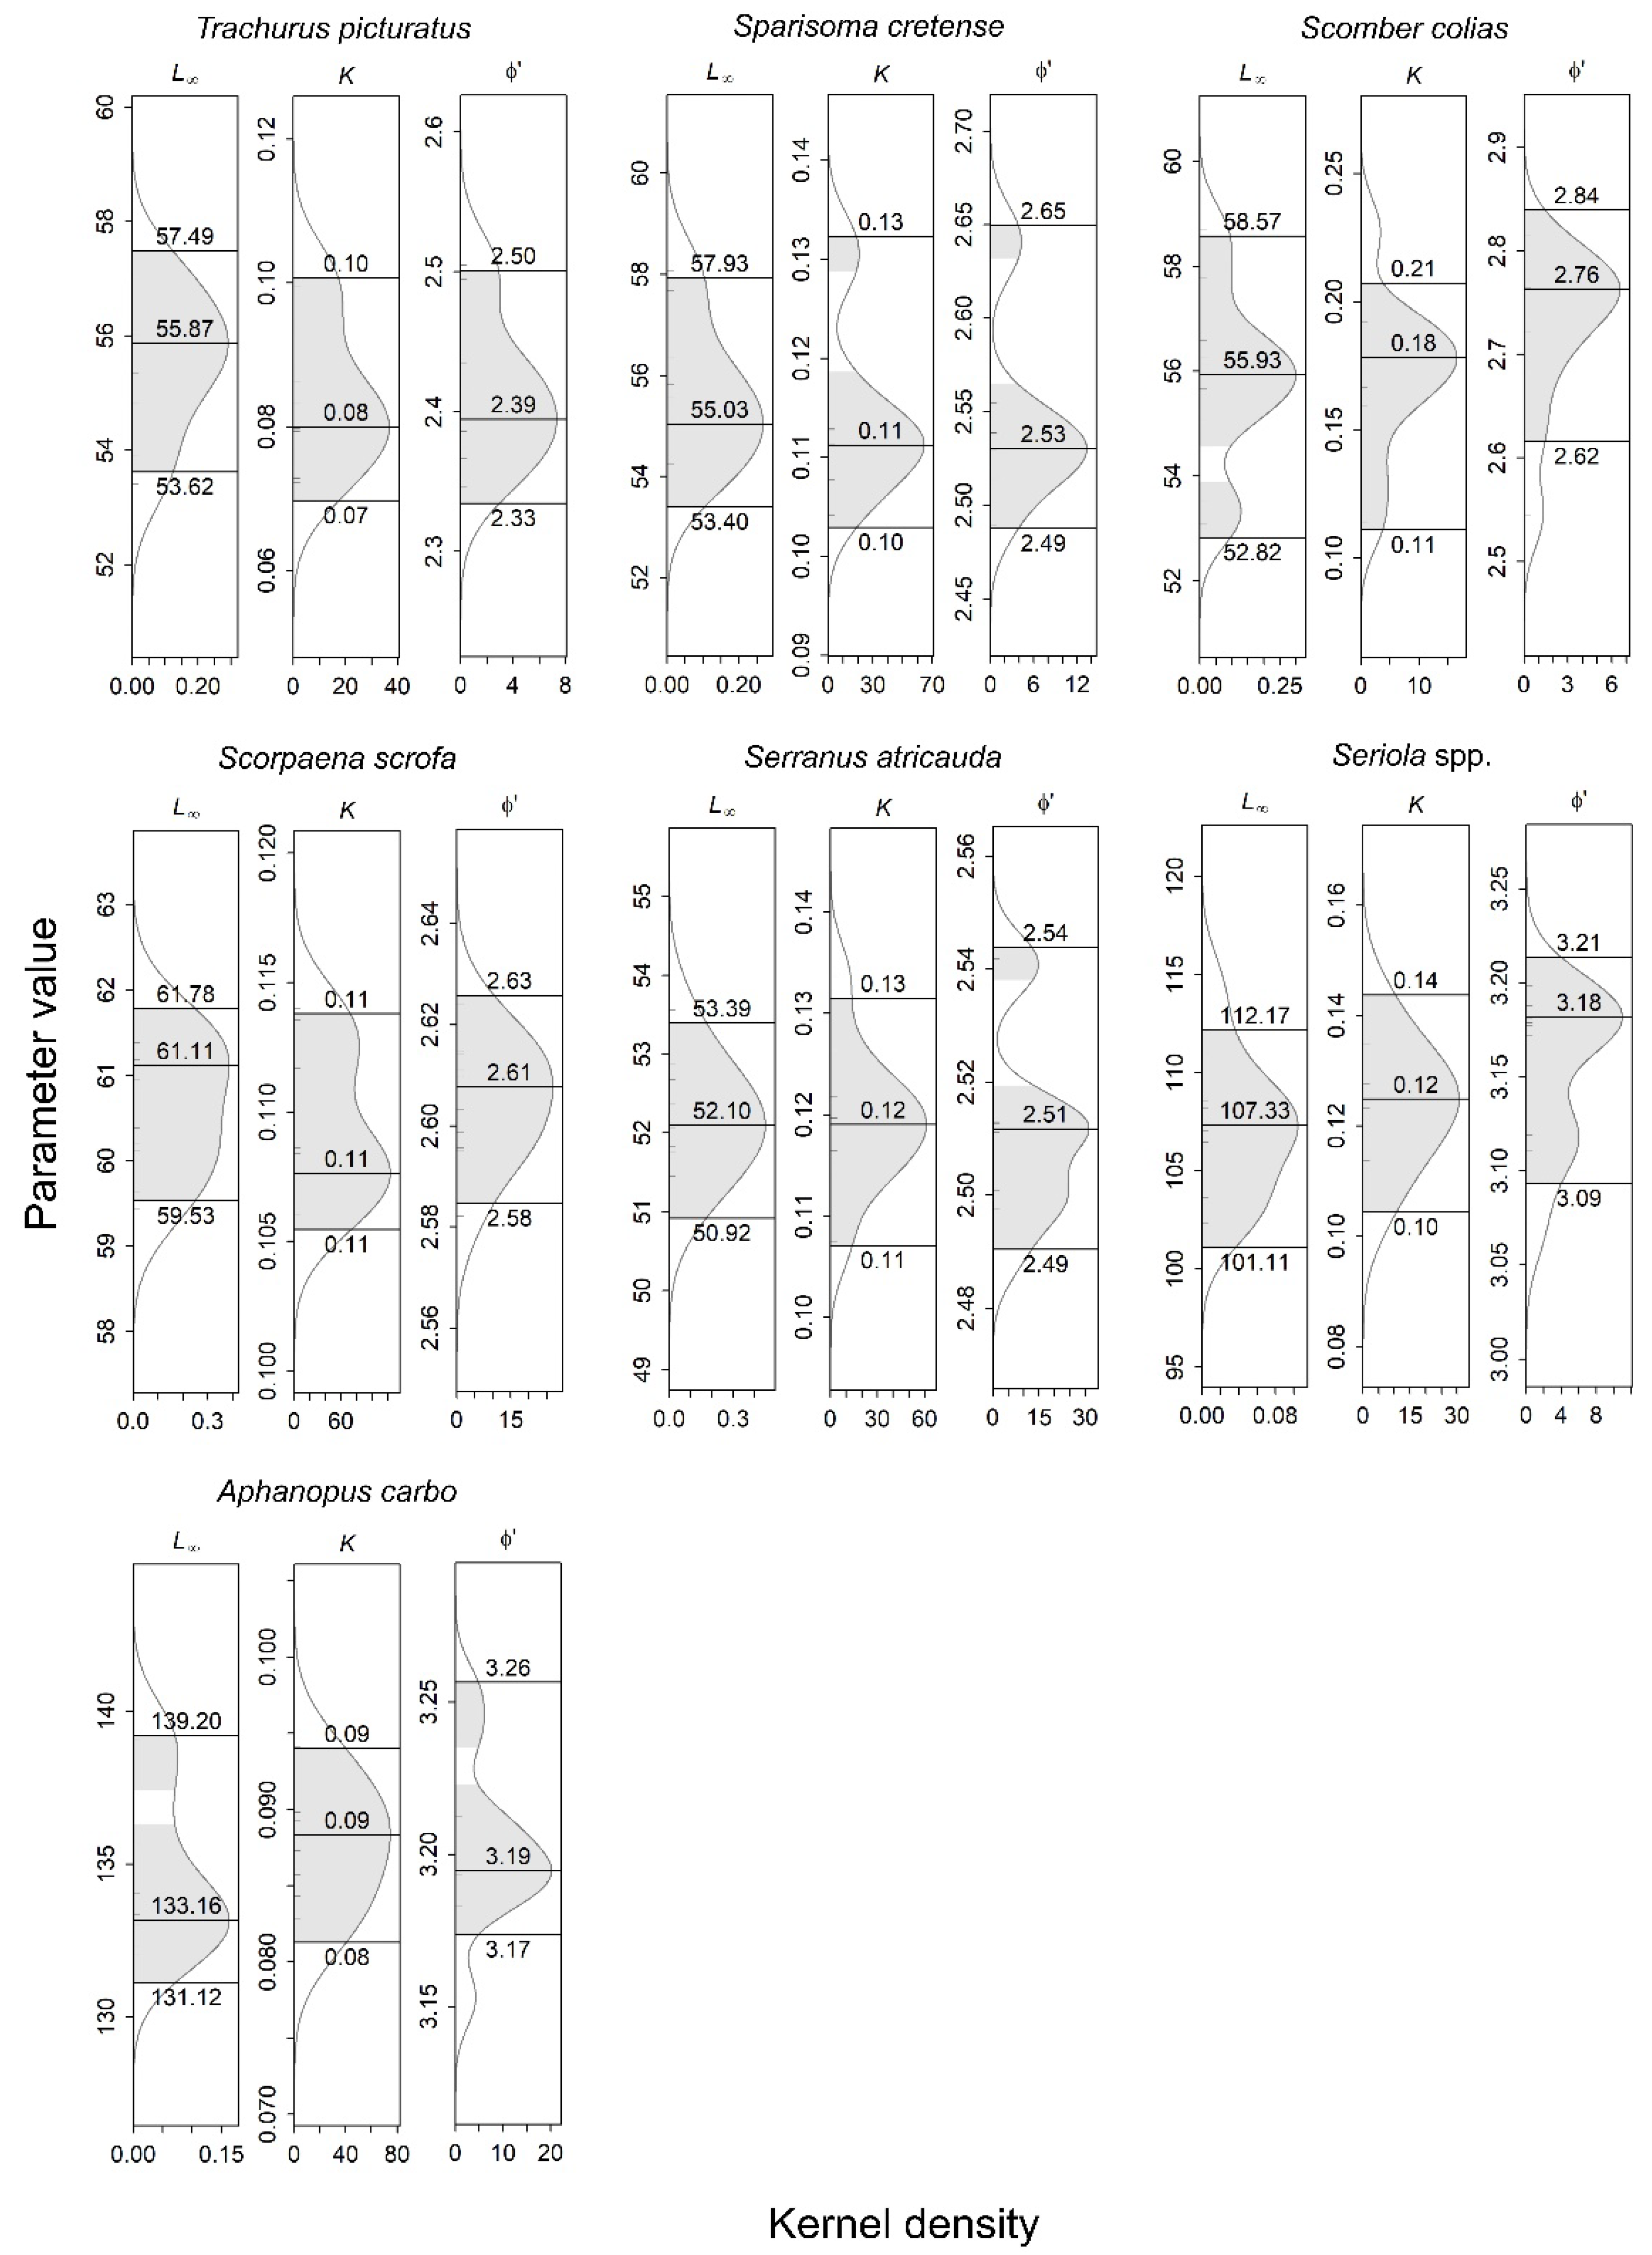
3.2. Growth Parameters

For growth parameters, the asymptotic lengths (L) were 55.87, 55.03, 55.93, 61.11, 52.10, 107.33 and 133.16 cm for T. picturatus, S. cretense, S. colias, S. scrofa, S. atricauda, Seriola spp. and A. carbo, respectively. The estimated growth coefficients (k) were 0.08, 0.11, 0.18, 0.11, 0.12, 0.12 and 0.09 year−1, respectively, while the calculated growth performance indices (ϕ′) were 2.39, 2.53, 2.76, 2.61, 2.51, 3.18 and 3.19, respectively, for the same species mentioned. The estimated growth parameters with their 0.95 confidence intervals are shown in Figure 2.

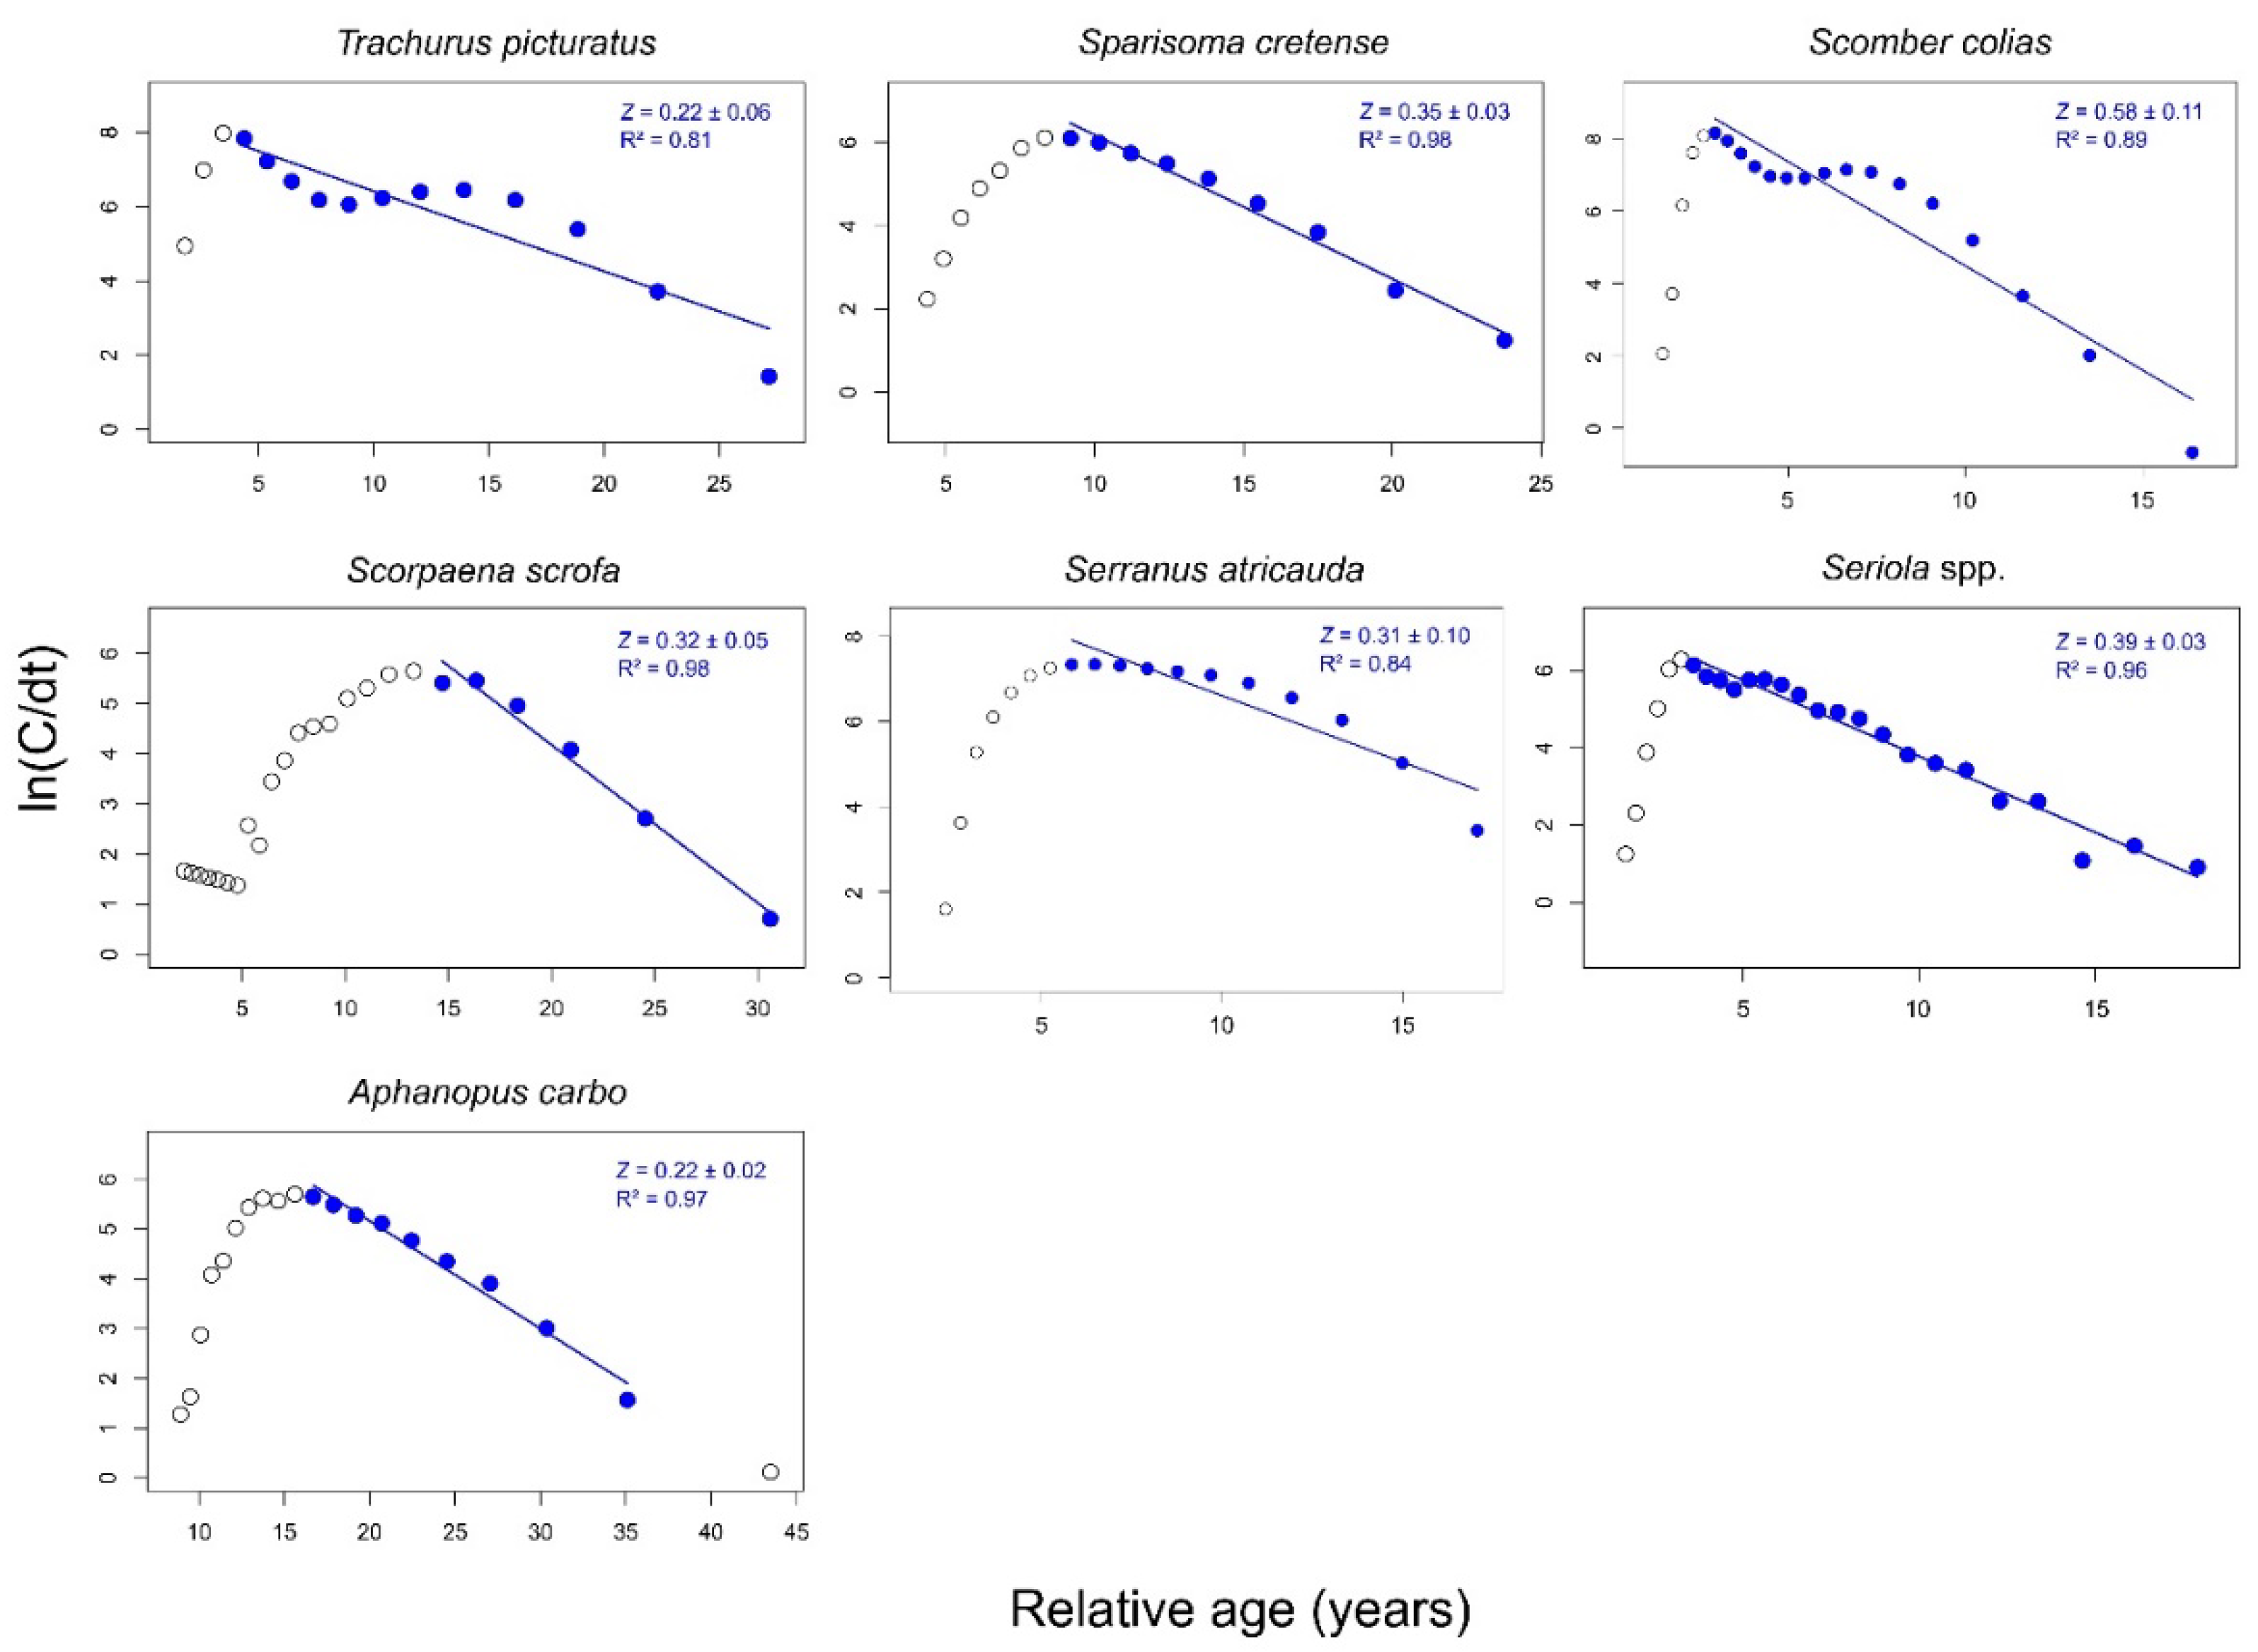
3.3. Mortality Rates

The total mortality rate (Z; mean value ± 0.95 confidence interval) estimated from the linearized length–converted catch curve method was 0.22 ± 0.06, 0.35 ± 0.03, 0.58 ± 0.11, 0.32 ± 0.05, 0.31 ± 0.10, 0.39 ± 0.03 and 0.22 ± 0.02 year−1 for T. picturatus, S. cretense, S. colias, S. scrofa, S. atricauda, Seriola spp. and A. carbo, respectively (Figure 3). The mean values of natural mortality (M) were 0.15, 0.20, 0.30, 0.20, 0.21, 0.21 and 0.16 year−1 (Table 3); hence, the fishing mortality rate (F) was computed as 0.07, 0.15, 0.28, 0.12, 0.10, 0.18 and 0.06 year−1, respectively, for the same species mentioned.

4. Discussion

In general, the current investigation indicates a favorable environment for reaching the maximum length compared to all existing records. The maximum LF of 53 cm for T. picturatus and the maximum LT of 47 cm for S. atricauda observed in the present study were close to the maximum LF of 54 cm for T. picturatus observed by Garcia et al. [17] and the maximum LT of 46 cm for S. atricauda reported by Rosa et al. [62]. S. cretense and S. scrofa had maximum LT of 55 cm and 61 cm, respectively, which were greater than the 52 cm reported by Afonso et al. [63] for S. cretense and the 59 cm reported by Rosa et al. [62] for S. scrofa. On the other hand, the maximum LT of 65 cm (60 cm LF) for S. colias [64] and 160 cm (139 cm LF) for Seriola spp. [18] were found in the literature to be greater than the maximum length obtained in this study. The maximum LT of A. carbo ranged between 120 cm [65] and 148 cm [66], implying that the 134 cm LF recorded in this study was near the maximum value. Due to the scarcity of existing data for T. picturatus, S. cretense, S. colias, S. scrofa, S. atricauda, Seriola spp., and A. carbo in the literature, the findings from this study will undoubtedly contribute to the available records.
The growth parameters of fish population dynamics (asymptotic length L and growth coefficient k) are critical for stock assessment and fisheries management. Some reported L for T. picturatus in Madeira and Canaries (Table 1) were shorter than the present findings. However, an L of 55.9 cm LF obtained in this study agreed with the values previously estimated for the Azores by Garcia et al. [17] through direct otolith readings (58.3 cm LF). The variations among these Macaronesian islands are probably due to stock differences in spatial scale [67]. For S. cretense, estimates for the Greek coast from scale readings (L = 38.9 cm LT) were much lower than those observed for the Azores (L = 57.9 cm LT). Longer L than those reported in the literature for S. colias [12,13,16,22,29] and S. atricauda [30,31] were also observed in this study. These differences are most likely due to the larger specimens present in this study. On the other hand, S. scrofa, Seriola spp., and A. carbo were found to have smaller L in the Azores compared to other regions in the Atlantic [19,20,21,23,25,26] and Mediterranean [18,35].
Considering the estimated growth coefficients (k) for T. picturatus, S. cretense, S. colias, S. scrofa, S. atricauda, Seriola spp. and A. carbo calculated in the present study, Sparre and Venema [1] proposed that k = 1.0 year−1 indicates fast growth, k = 0.5 year−1 moderate growth and k = 0.2 year−1 indicates slow growth, suggesting that the seven species described here grow at a relatively slow rate. The estimated k values are smaller or approximately equal to those previously observed in the Azores, Madeira and Canaries for T. picturatus; Greece for S. cretense; Azores, Gulf of Cádiz, Alboran Sea, Adriatic Sea and Mauritania for S. colias; Azores and Canaries for S. atricauda; NW Atlantic, Gulf of Mexico and Adriatic Sea for Seriola spp.; and Canaries and Madeira for A. carbo (Table 1). For S. scrofa, the estimated k was higher than that observed by Shahrani and Shakman [35] on the Libyan coast (Table 1).
Within the same species, variations in L and k can be attributed to various causes, including variations in water conditions, food availability, metabolic rate, fishing pressure and pollution [1]. For example, as fishing gear is selective and oriented toward harvesting larger individuals, large individuals may become rare in overexploited fisheries, and a scarcity of these individuals in a given sample will inevitably underestimate growth parameters [68,69]. On the other hand, while analyzing fish growth, the validation of growth parameter estimations often arises due to the reliability of some of the methodologies employed to produce such estimates. In this regard, the growth performance index (ϕ’) can indicate estimation reliability since it has been suggested that ϕ’ values are similar for the same species and genera [39,70,71]. The values of ϕ’ obtained from this study (Figure 2) were close to or within the range of values obtained for stocks of T. picturatus, S. cretense, S. colias, S. scrofa, S. atricauda, Seriola spp. and A. carbo from other Atlantic areas and the Mediterranean, which were estimated either by direct or indirect methods (Table 1).
The natural mortalities (year−1) estimated in this study (Table 3) were not in agreement with the natural mortalities found for T. picturatus in Madeira and Canaries, S. cretense on the Greek coast, S. colias in the Azores, Adriatic Sea and Mauritania, and Seriola spp. in the Adriatic Sea (Table 1). Natural mortality varies with age, density, disease, parasites, food supply, predator abundance, water temperature, sex and size; therefore, observed variances could be related to these factors [72]. However, it is interesting to note that the values of natural mortality of the seven fish species in the Azores indicated lower natural mortality, as the values found in this study were mostly at the lower limit of the modal mortality rate (i.e., 0.20) derived from 175 fish stocks as given by Pauly [52]. No reports of mortality parameters for S. scrofa, S. atricauda, or A. carbo are currently available in the literature.
Natural mortality (M) and fishing mortality (F) can denote the indication of an overfishing status [5]. The optimal scenario for a population is when fishing mortality equals natural mortality, which means that fishing operations exploit the portion of the population that would otherwise be lost due to natural mortality [73]. With knowledge of these parameters, one can manage the stocks and establish the optimal exploitation rate (i.e., E = F/(F + M) = 0.5) that maximizes catch while maintaining the reproductive proportion of the population [73]. Values of M and F were estimated as 0.15 and 0.07 year−1 (E = 0.3) for T. picturatus, 0.20 and 0.15 year−1 (E = 0.4) for S. cretense, 0.30 and 0.28 year−1 (E = 0.5) for S. colias, 0.20 and 0.12 year−1 (E = 0.4) for S. scrofa, 0.21 and 0.10 year−1 (E = 0.3) for S. atricauda, 0.21 and 0.18 year−1 (E = 0.5) for Seriola spp., and 0.16 and 0.06 year−1 (E = 0.3) for A. carbo. These values suggest that S. cretense, S. colias and Seriola spp. have optimum exploitation rate (MF), but T. picturatus, S. scrofa, S. atricauda and A. carbo are underexploited (M > F).
However, the exploitation status suggested from this study should be treated with caution because, as population growth estimates have, in some cases, large confidence intervals (see Figure 2) as well as fishing-related uncertainties, the mortality rate scenario may be of more concern. For T. picturatus, S. colias and Seriola spp., for example, the total mortality estimates may also be biased due to the different fishing gears operating over this stock (surface nets and longlines for T. picturatus and S. colias [10,32]) or the different species (i.e., S. dumerili and S. rivoliana) grouped as the same stock (i.e., Seriola spp.). This condition may even be associated with the bimodal patterns in length-frequency distribution (Figure 1) and catch curves (Figure 3) observed for these species and implies that mortality estimates should ideally be estimated by fishery separately or, in the case of Seriola spp., by species. However, the length of data used in this study did not allow this separation, and it should be re-evaluated to make these analyses possible in the future.
For stock assessment, fisheries experts prefer to use age-composition data acquired by reading rigid structures since these data are more likely to reflect the real age composition of the stock than those produced using a proxy for the age composition obtained using length-composition data. However, measuring the length of a fish is significantly less expensive than determining its age, and most of the biological data acquired for Azorean fish populations are in the form of length composition rather than age composition. Therefore, in the absence of otoliths, length-frequency data may be useful for estimating growth parameters and mortality rates for those data-deficient species. Nevertheless, to reduce imprecision and improve accuracy, it would be desirable to confirm these estimations by comparing the results of the analysis to those produced from age-based approaches. This is highly encouraged to be conducted, at least for blue jack mackerel T. picturatus, parrotfish S. cretense, Atlantic chub mackerel S. colias, red scorpionfish S. scrofa, blacktail comber S. atricauda, amberjacks nei Seriola spp. and black scabbardfish A. carbo that are data-deficient and at the same time classified as priority stocks for the region.
Since harvesting of the studied species is not sex-based, stock assessment models should need a single set of population parameters. Nonetheless, the disparities in development between the sexes may require a change in management regulations to limit effort, especially on the target component, which is particularly vulnerable to overexploitation. Future research should therefore investigate these particularities since the dataset used in this study did not allow progress in this way. This is even more important when it involves sequential hermaphroditic species with sexual dimorphism, such as S. cretense [27]. Additionally, captures of resources such as T. picturatus, S. cretense, S. colias, S. atricauda and Seriola spp. are not completely landed since they are also fished for self-consumption or utilized as live bait in tuna fisheries [10,32]. Therefore, samples from the commercial landings may be under-represented, and special attention will need to be given to the sampling design to ensure that representative samples are taken. In addition to that, stock units for all the studied stocks are not clearly defined [10]. As a result, it is impossible to know whether the stocks were fully sampled across their entire range of distribution and dynamic aspects of the population or whether the samples analyzed referred only to a fraction of the population.
Although the results of this study have certain limitations, it adds new information on species for which there is little or no information available. The information reported greatly improve understanding of population structure, mortality and exploitation status of blue jack mackerel T. picturatus, parrotfish S. cretense, Atlantic chub mackerel S. colias, red scorpionfish S. scrofa, blacktail comber S. atricauda, amberjacks nei Seriola spp. and black scabbardfish A. carbo and inform additional stock assessment initiatives. Stock assessment is a long-term and dynamic process, and a complete picture of the situation can only be obtained when the conclusions from one analysis are compared with those of a different analysis and the different results are used critically to gauge conclusions, improve the data and thus enable future assessments to be more accurate [74].

5. Conclusions

The seven fish species examined (i.e., blue jack mackerel T. picturatus, parrotfish S. cretense, Atlantic chub mackerel S. colias, red scorpionfish S. scrofa, blacktail comber S. atricauda, amberjacks nei Seriola spp. and black scabbardfish A. carbo) are economically important food fish, and therefore, the estimated population parameters constitute a landmark in the development of stock assessment studies. This information can be implemented into age-structured or length-based models and allow understanding of the dynamics of marine resources and estimating the sustainable yield of the target population. However, uncertainties regarding the representativeness of commercial landing samples in this study have been raised for some species, particularly those that escape the auction control or are used as live bait in other fisheries. In addition, natural mortality and growth patterns are often associated with the ecosystem, species behavior and fishing pressure. As a result, further study should focus on feeding habits, predation–prey relationships, migration patterns, recruitment and the reliability of the current sampling programs for these species. The latter is critical for integrating different data sources to guarantee that small, medium and large individuals are included in the analyses and prevent misleading results. Finally, studies focused on stock delimitation are essential in the stock assessment process because they will allow to estimate reliable population parameters, develop optimal harvest and monitoring strategies, and propose effective conservation measures.

Author Contributions

R.S. conceived the original idea, performed the analysis and interpretation of data, and wrote the manuscript. U.I.P. and W.M.-L. helped to perform the analysis. W.M.-L., A.N.-P. and M.P. provided critical feedback and helped shape the final manuscript. R.S. supervised the project. All authors have read and agreed to the published version of the manuscript.

Funding

This work is part of the PESCAz project (ref. MAR–01.03.02–FEAMP–0039) financed by the European Maritime and Fisheries Fund (EMFF) through the Regional Government of the Azores under the MAR2020 operational program. A.N.-P. was funded by an FCT Ph.D. fellowship (ref. SFRH/BD/124720/2016).

Institutional Review Board Statement

No ethical approval was required as this study is non-experimental, and the data analyzed came from commercial fishery activities.

Data Availability Statement

The data underlying this article will be shared upon reasonable request to the corresponding author.

Acknowledgments

The authors thank all who participated in data collection in the fisheries sector in the Azores under the EU Data Collection Framework (EU–DCF).

Conflicts of Interest

The authors declare no conflict of interest.

References

  1. Sparre, P.; Venema, S.C. Introduction to Tropical Fish Stock Assessment. Pt. 1: Manual. Pt. 2: Exercises; FAO: Rome, Italy, 1998; ISBN 0429-9345. [Google Scholar]
  2. Cadima, E.L. Fish Stock Assessment Manual; FAO: Rome, Italy, 2003; ISBN 9251045054. [Google Scholar]
  3. Cochrane, K.L. A Fishery Manager’s Guidebook: Management Measures and Their Application; FAO: Rome, Italy, 2002. [Google Scholar]
  4. ICES. Guide to ICES Advisory Framework and Principles. In Report of the ICES Advisory Committee. ICES Advice; ICES: Copenhagen, Denmark, 2020; pp. 1–8. [Google Scholar]
  5. Pauly, D. Some Simple Methods for the Assessment of Tropical Fish Stocks; FAO: Rome, Italy, 1983. [Google Scholar]
  6. Then, A.Y.; Hoenig, J.M.; Huynh, Q.C. Estimating Fishing and Natural Mortality Rates, and Catchability Coefficient, from a Series of Observations on Mean Length and Fishing Effort. ICES J. Mar. Sci. 2017, 75, 610–620. [Google Scholar] [CrossRef]
  7. Von Bertalanffy, L. A Quantitative Theory of Organic Growth (Inquires on Growth Laws. II). Hum. Biol. 1938, 10, 181–213. [Google Scholar]
  8. Gedamke, T.; Hoenig, J.M. Estimating Mortality from Mean Length Data in Nonequilibrium Situations, with Application to the Assessment of Goosefish. Trans. Am. Fish. Soc. 2006, 135, 476–487. [Google Scholar] [CrossRef]
  9. Quinn, T.J.; Deriso, R.B. Quantitative Fish Dynamics; Oxford University Press: Oxford, UK, 1999. [Google Scholar]
  10. Santos, R.; Medeiros-Leal, W.; Pinho, M. Synopsis of Biological, Ecological and Fisheries-Related Information on Priority Marine Species in the Azores Region. Arquipel. Life Mar. Sci. 2020, 1, 1–138. [Google Scholar]
  11. Vasconcelos, J.; Alves, A.; Gouveia, E.; Faria, G. Age and Growth of the Blue Jack Mackerel, Trachurus picturatus Bowdich, 1825 (Pisces: Teleostei) off Madeira Archipelago. Arquipél. Life Mar. Sci. 2006, 23A, 47–57. [Google Scholar]
  12. Carvalho, N.; Perrotta, R.G.; Isidro, E. Age, Growth and Maturity in the Chub Mackerel (Scomber japonicus Houttuyn, 1782) from the Azores. Arquipel. Life Mar. Sci. 2002, 19A, 93–99. [Google Scholar]
  13. Daley, T.T.; Leaf, R.T. Age and Growth of Atlantic Chub Mackerel (Scomber colias) in the Northwest Atlantic. J. Northwest Atl. Fish. Sci. 2019, 50, 1–12. [Google Scholar] [CrossRef]
  14. Delgado, J.; Reis, S.; González, J.A.; Isidro, E.; Biscoito, M.; Freitas, M.; Tuset, V.M. Reproduction and Growth of Aphanopus carbo and A. intermedius (Teleostei: Trichiuridae) in the Northeastern Atlantic. J. Appl. Ichthyol. 2013, 29, 1008–1014. [Google Scholar] [CrossRef]
  15. Vasconcelos, J.; Sousa, R.; Riera, R.; Delgado, J.; Faria, G.; Serrano Gordo, L. Stock Assessment of the Blue Jack Mackerel, Trachurus picturatus, in the North-Eastern Atlantic. Fish. Manag. Ecol. 2018, 25, 233–239. [Google Scholar] [CrossRef]
  16. Jurado-Ruzafa, A.; Hernández, E.; Santamaría, T.G. Age, Growth and Natural Mortality of Atlantic Chub Mackerel Scomber colias Gmelin 1789 (Perciformes: Scombridae), from Mauritania (NW Africa). Vieraea 2017, 45, 53–64. [Google Scholar] [CrossRef]
  17. Garcia, A.; Canha, Â.; Reis, D.; Diogo, H. Others Life History Parameters of Blue Jack Mackerel Trachurus picturatus (Teleostei: Carangidae) from North-East Atlantic. J. Mar. Biol. Assoc. U. K. 2015, 95, 401–410. [Google Scholar] [CrossRef]
  18. Kožul, V.; Skaramuca, B.; Kraljević, M.; Dulčić, J.; Glamuzina, B. Age, Growth and Mortality of the Mediterranean Amberjack Seriola dumerili (Risso 1810) from the South-Eastern Adriatic Sea. J. Appl. Ichthyol. 2001, 17, 134–141. [Google Scholar] [CrossRef]
  19. Morales-Nin, B.; Sena-Carvalho, D. Age and Growth of the Black Scabbard Fish (Aphanopus carbo) off Madeira. Fish. Res. 1996, 25, 239–251. [Google Scholar] [CrossRef]
  20. Pajuelo, J.G.; González, J.A.; Santana, J.I.; Lorenzo, J.M.; García-Mederos, A.; Tuset, V. Biological Parameters of the Bathyal Fish Black Scabbardfish (Aphanopus carbo Lowe, 1839) off the Canary Islands, Central-East Atlantic. Fish. Res. 2008, 92, 140–147. [Google Scholar] [CrossRef]
  21. Thompson, B.A.; Beasley, M.; Wilson, C.A. Age Distribution and Growth of Greater Amberjack, Seriola dumerili, from the North-Central Gulf of Mexico. Fish. Bull. 1999, 97, 362–371. [Google Scholar]
  22. Velasco, E.M.; Del Arbol, J.; Baro, J.; Sobrino, I. Age and Growth of the Spanish Chub Mackerel Scomber Colias off Southern Spain: A Comparison between Samples from the NE Atlantic and the SW Mediterranean. Rev. Biol. Mar. Oceanogr. 2011, 46, 27–34. [Google Scholar] [CrossRef]
  23. Harris, P.J.; Wyanski, D.M.; White, D.B.; Mikell, P.P.; Eyo, P.B. Age, Growth, and Reproduction of Greater Amberjack off the Southeastern U.S. Atlantic Coast. Trans. Am. Fish. Soc. 2007, 136, 1534–1545. [Google Scholar] [CrossRef]
  24. Navarro, M.R.; Landa, J.; Villamor, B.; Domínguez-Petit, R. First Approach to the Growth and Age Corroboration of Northeast Atlantic Chub Mackerel (Scomber colias) in Northern Iberian Waters. Estuar. Coast. Shelf Sci. 2021, 259, 107433. [Google Scholar] [CrossRef]
  25. Manooch, C.S., III; Potts, J.C. Age, Growth and Mortality of Greater Amberjack from the Southeastern United States. Fish. Res. 1997, 30, 229–240. [Google Scholar] [CrossRef]
  26. Manooch, C.S., III; Potts, J.C. Age, Growth, and Mortality of Greater Amberjack, Seriola dumerili, from the U.S. Gulf of Mexico Headboat Fishery. Bull. Mar. Sci. 1997, 61, 671–683. [Google Scholar]
  27. Petrakis, G.; Papaconstantinou, C. Biology of Sparisoma cretense in the Dodecanese (Greece). J. Appl. Ichthyol. 1990, 6, 14–23. [Google Scholar] [CrossRef]
  28. Jurado-Ruzafa, A.; Santamaría, M.T.G. Age, Growth and Natural Mortality of Blue Jack Mackerel Trachurus picturatus (Carangidae) from the Canary Islands, Spain (NW Africa). Afr. J. Mar. Sci. 2018, 40, 451–460. [Google Scholar] [CrossRef]
  29. Čikeš Keč, V.; Zorica, B. Length–Weight Relationship, Age, Growth and Mortality of Atlantic Chub Mackerel Scomber colias in the Adriatic Sea. J. Mar. Biol. Assoc. U. K. 2013, 93, 341–349. [Google Scholar] [CrossRef]
  30. Amorim, P.; Sousa, P.; Menezes, G.M. Sustainability Status of the Grouper Fishery in the Azores Archipelago: A Length-Based Approach. Mar. Policy 2021, 130, 104562. [Google Scholar] [CrossRef]
  31. Tuset, V.M.; González, J.A.; Lozano, I.J.; García-Díaz, M.M. Age and Growth of the Blacktail Comber, Serranus atricauda (Serranidae), off the Canary Islands (Central-Eastern Atlantic). Bull. Mar. Sci. 2004, 74, 53–68. [Google Scholar]
  32. Santos, R.; Medeiros-Leal, W.; Pinho, M. Stock Assessment Prioritization in the Azores: Procedures, Current Challenges and Recommendations. Arquipel. Life Mar. Sci. 2020, 37, 20–45. [Google Scholar]
  33. Isidro, H.A. Age and Growth of Trachurus picturatus (Bowdich, 1825) (Teleostei: Carangidae) from the Azores. Arquipel. Life Mar. Sci. 1990, 8, 45–54. [Google Scholar]
  34. Neves, A.; Vieira, A.R.; Sequeira, V.; Silva, E.; Silva, F.; Duarte, A.M.; Mendes, S.; Ganhão, R.; Assis, C.; Rebelo, R.; et al. Modelling Fish Growth with Imperfect Data: The Case of Trachurus picturatus. Fishes 2022, 7, 52. [Google Scholar] [CrossRef]
  35. Shahrani, S.; Shakman, E. Biological Aspects of Scorpaena scrofa Linnaeus, 1758 in the Western Libyan Coast. Libyan J. Mar. Sci. 2015, 14, 29–42. [Google Scholar]
  36. Vieira, A.R.; Farias, I.; Figueiredo, I.; Neves, A.; Morales-Nin, B.; Sequeira, V.; Martins, M.R.; Gordo, L.S. Age and Growth of Black Scabbardfish (Aphanopus carbo Lowe, 1839) in the Southern NE Atlantic. Sci. Mar. 2009, 73, 33–46. [Google Scholar] [CrossRef] [Green Version]
  37. EU. Council Regulation (EC) No 199/2008 of 25 February 2008 Concerning the Establishment of a Community Framework for the Collection, Management and Use of Data in the Fisheries Sector and Support for Scientific Advice Regarding the Common Fisheries Policy. Off. J. Eur. Union L 2008, 60, 1–12. [Google Scholar]
  38. DGRM. Work Plan for Data Collection in the Fisheries and Aquaculture Sectors; DGRM: Lisbon, Portugal, 2016. [Google Scholar]
  39. Schwamborn, R.; Mildenberger, T.K.; Taylor, M.H. Assessing Sources of Uncertainty in Length-Based Estimates of Body Growth in Populations of Fishes and Macroinvertebrates with Bootstrapped ELEFAN. Ecol. Modell. 2019, 393, 37–51. [Google Scholar] [CrossRef] [Green Version]
  40. Mildenberger, T.K.; Taylor, M.H.; Wolff, M. TropFishR: An R Package for Fisheries Analysis with Length-Frequency Data. Methods Ecol. Evol. 2017, 8, 1520–1527. [Google Scholar] [CrossRef] [Green Version]
  41. Taylor, M.H.; Mildenberger, T.K. Extending Electronic Length Frequency Analysis in R. Fish. Manag. Ecol. 2017, 24, 230–238. [Google Scholar] [CrossRef]
  42. Schwamborn, R.; Mildenberger, T.K.; Taylor, M.H. Fishboot: Bootstrap-Based Methods for the Study of Fish Stocks and Aquatic Populations; R Foundation for Statistical Computing: Vienna, Austria, 2018. [Google Scholar]
  43. R Core Team. R: A Language and Environment for Statistical Computing; R Foundation for Statistical Computing: Vienna, Austria, 2020. [Google Scholar]
  44. Ricker, W.E. Computation and Interpretation of Biological Statistics of Fish Populations. Bull. Fish. Res. Bd. Can. 1975, 191, 1–382. [Google Scholar]
  45. Beverton, R.J.H.; Holt, S.J. A Review of the Lifespans and Mortality Rates of Fish in Nature, and Their Relation to Growth and Other Physiological Characteristics. In Proceedings of the CIBA Foundation Colloquia on Ageing, Boston, MA, USA, 1 January 1959; Volume 5, pp. 142–180. [Google Scholar]
  46. Taylor, C.C. Temperature, Growth, and Mortality—The Pacific Cockle. ICES J. Mar. Sci. 1960, 26, 117–124. [Google Scholar] [CrossRef]
  47. Cubillos, L.A.; Alarcón, R.; Brante, A. Empirical Estimates of Natural Mortality for the Chilean Hake (Merluccius gayi): Evaluation of Precision. Fish. Res. 1999, 42, 147–153. [Google Scholar] [CrossRef]
  48. Frisk, M.G.; Miller, T.J.; Fogarty, M.J. Estimation and Analysis of Biological Parameters in Elasmobranch Fishes: A Comparative Life History Study. Can. J. Fish. Aquat. Sci. 2001, 58, 969–981. [Google Scholar] [CrossRef]
  49. Hewitt, D.A.; Hoenig, J.M. Comparison of Two Approaches for Estimating Natural Mortality Based on Longevity. Fish. Bull. 2005, 103, 433. [Google Scholar]
  50. Tanaka, S. Studies on the Dynamics and the Management of Fish Populations. Bull. Tokai Fish. Res. Lab. 1960, 28, 1–200. [Google Scholar]
  51. Alverson, D.L.; Carney, M.J. A Graphic Review of the Growth and Decay of Population Cohorts. ICES J. Mar. Sci. 1975, 36, 133–143. [Google Scholar] [CrossRef]
  52. Pauly, D. On the Interrelationships between Natural Mortality, Growth Parameters, and Mean Environmental Temperature in 175 Fish Stocks. ICES J. Mar. Sci. 1980, 39, 175–192. [Google Scholar] [CrossRef]
  53. Hoenig, J.M. Empirical Use of Longevity Data to Estimate Mortality Rates. Fish. Bull. 1983, 82, 898–903. [Google Scholar]
  54. Alagaraja, K. Simple Methods for Estimation of Parameters for Assessing Exploited Fish Stocks. Indian J. Fish. 1984, 31, 177–208. [Google Scholar]
  55. Djabali, F.; Mehailia, A.; Koudil, M.; Brahmi, B. Empirical Equations for the Estimation of Natural Mortality in Mediterranean Teleosts. Naga ICLARM Q. 1993, 16, 35–37. [Google Scholar]
  56. Pauly, D.; Binohlan, C. FishBase and AUXIM as Tools for Comparing Life-History Patterns, Growth and Natural Mortality of Fish: Applications to Snappers and Groupers; International Center for Living Aquatic Resources Management (ICLARM): Bayan Lepas, Malaysia, 1996; pp. 218–243. [Google Scholar]
  57. Jensen, A.L. Beverton and Holt Life History Invariants Result from Optimal Trade-off of Reproduction and Survival. Can. J. Fish. Aquat. Sci. 1996, 53, 820–822. [Google Scholar] [CrossRef]
  58. Lafon, V.; Martins, A.; Figueiredo, M.; Rodrigues, M.; Bashmachnikov, I.; Mendonça, A.; Macedo, L.; Goulart, N. Sea Surface Temperature Distribution in the Azores Region. Part I: AVHRR Imagery and in Situ Data Processing. Arquipel. Life Mar. Sci. 2004, 21A, 1–18. [Google Scholar]
  59. Martins, A.; Bashmachnikov, I.; Mendonça, A. Multi-Sensor (SeaWiFS/MODIS/AVHRR) Surface Signature of the Azores Current. Geophys. Res. Abstr. 2008, 10, EGU2008-A-11379. [Google Scholar]
  60. ICES. Azores Ecoregion—Ecosystem Overview. In Report of the ICES Advisory Committee, 2020. ICES Advice 2020; ICES: Copenhagen, Denmark, 2020. [Google Scholar]
  61. Froese, R.; Binohlan, C. Empirical Relationships to Estimate Asymptotic Length, Length at First Maturity and Length at Maximum Yield per Recruit in Fishes, with a Simple Method to Evaluate Length Frequency Data. J. Fish Biol. 2000, 56, 758–773. [Google Scholar] [CrossRef]
  62. Rosa, A.; Menezes, G.; Melo, O.; Pinho, M.R. Weight–Length Relationships of 33 Demersal Fish Species from Azores Archipelago. Fish. Res. 2006, 80, 329–332. [Google Scholar] [CrossRef]
  63. Afonso, P.; Morato, T.; Santos, R.S. Spatial Patterns in Reproductive Traits of the Temperate Parrotfish Sparisoma cretense. Fish. Res. 2008, 90, 92–99. [Google Scholar] [CrossRef]
  64. Navarro, M.R.; Villamor, B.; Myklevoll, S.; Gil, J.; Abaunza, P.; Canoura, J. Maximum Size of Atlantic Mackerel (Scomber scombrus) and Atlantic Chub Mackerel (Scomber colias) in the Northeast Atlantic. Cybium 2012, 36, 406–408. [Google Scholar]
  65. Kelly, C.J.; Connolly, P.L.; Clarke, M.W. The Deep Water Fisheries of the Rockall Trough: Some Insights Gleaned from Irish Survey Data. In ICES CM Documents; International Council for the Exploration of the Sea (ICES): Copenhangen, Denmark, 1998; Volume O:40, p. 22. [Google Scholar]
  66. ICES. Black Scabbardfish (Aphanopus carbo) in Subareas 1, 2, 4–8, 10, and 14, and Divisions 3.a, 9.a, and 12.b (Northeast Atlantic and Arctic Ocean). In ICES Advice on Fishing Opportunities, Catch, and Effort; ICES: Copenhagen, Denmark, 2020. [Google Scholar]
  67. Moreira, C.; Froufe, E.; Sial, A.N.; Caeiro, A.; Vaz-Pires, P.; Correia, A.T. Population Structure of the Blue Jack Mackerel (Trachurus picturatus) in the NE Atlantic Inferred from Otolith Microchemistry. Fish. Res. 2018, 197, 113–122. [Google Scholar] [CrossRef]
  68. Wang, K.; Zhang, C.; Sun, M.; Xu, B.; Ji, Y.; Xue, Y.; Ren, Y. Fishing Pressure and Lifespan Affect the Estimation of Growth Parameters Using ELEFAN. Fish. Res. 2021, 238, 105903. [Google Scholar] [CrossRef]
  69. Tu, C.-Y.; Chen, K.-T.; Hsieh, C. Fishing and Temperature Effects on the Size Structure of Exploited Fish Stocks. Sci. Rep. 2018, 8, 7132. [Google Scholar] [CrossRef] [PubMed]
  70. Pauly, D. Gill Size and Temperature as Governing Factors in Fish Growth: A Generalization of von Bertalanffy’s Growth Formula; Institut für Meereskunde: Hamburg, Germany, 1979. [Google Scholar]
  71. Pauly, D.; Munro, J.L. Once More on the Comparison of Growth in Fish and Invertebrates. Fishbyte 1984, 2, 1–21. [Google Scholar]
  72. Vetter, E.F. Estimation of Natural Mortality in Fish Stocks: A Review. Fish. Bull. 1988, 86, 25–43. [Google Scholar]
  73. Gulland, J.A. Fish Stock Assessment. A Manual of Basic Method; FAO/Wiley Series on Food and Agriculture; FAO: Rome, Italy, 1983. [Google Scholar]
  74. Bonfil, R. The Purpose of Stock Assessment and the Objectives of Fisheries. In Management Techniques for Elasmobranch Fisheries; Musick, J.A., Bonfil, R., Eds.; Food & Agriculture Organization: Rome, Italy, 2005; pp. 6–14. [Google Scholar]
Figure 1. Length-frequency distributions of blue jack mackerel Trachurus picturatus, parrotfish Sparisoma cretense, Atlantic chub mackerel Scomber colias, red scorpionfish Scorpaena scrofa, blacktail comber Serranus atricauda, amberjacks nei Seriola spp. and black scabbardfish Aphanopus carbo collected from commercial landings in the Azores between 1990 and 2017 (species-specific sampling periods are shown in Table 2).
Life 12 00778 g001
Figure 2. Estimates of asymptotic length (L; cm), growth rate coefficient (k; year−1), and growth performance index (ϕ’) with 0.95 confidence intervals for blue jack mackerel Trachurus picturatus, parrotfish Sparisoma cretense, Atlantic chub mackerel Scomber colias, red scorpionfish Scorpaena scrofa, blacktail comber Serranus atricauda, amberjacks nei Seriola spp. and black scabbardfish Aphanopus carbo in the Azores between 1990 and 2017 (species-specific sampling periods are shown in Table 2). y-axis—growth parameter value; x-axis—kernel density estimate; horizontal lines—location of the mode (maximum density peak) and the lower and upper 95% quantiles of the univariate kernel density distributions.
Life 12 00778 g002
Figure 3. Estimates of total mortality rate (Z) from the linearized length–converted catch curve method for blue jack mackerel Trachurus picturatus, parrotfish Sparisoma cretense, Atlantic chub mackerel Scomber colias, red scorpionfish Scorpaena scrofa, blacktail comber Serranus atricauda, amberjacks nei Seriola spp. and black scabbardfish Aphanopus carbo in the Azores between 1990 and 2017 (species-specific sampling periods are shown in Table 2).
Life 12 00778 g003
Table 1. Summary of growth and mortality studies of Trachurus picturatus, Sparisoma cretense, Scomber colias, Scorpaena scrofa, Serranus atricauda, Seriola spp. and Aphanopus carbo.
AreaMethodnSizeGrowth ParameterMortality Rate
Lkϕ′ZMF
T. picturatus
Isidro [33]AzoresDR516LF52.90.202.75
Vasconcelos et al. [11]MadeiraDR578LT42.30.162.46
Vasconcelos et al. [11]MadeiraBC229LT48.30.132.50
Garcia et al. [17]AzoresDR1420LF58.30.092.48
Garcia et al. [17]AzoresBC796LF52.90.112.49
Jurado-Ruzafa and Santamaria [28]CanariesDR913LT34.90.212.42 0.40
Vasconcelos et al. [15]MadeiraIM10,713LT 0.16 0.75–1.640.33
Neves et al. [34]Mainland PortugalBC376LT46.70.152.51
Neves et al. [34]Mainland PortugalDR575LT63.30.072.45
S. cretense
Petrakis and Papaconstantinou [27]GreeceDR399LT38.90.162.380.810.380.43
S. colias
Carvalho et al. [12]AzoresDR349LT57.50.202.82 0.19
Velasco et al. [22]Gulf of CádizBC121LT43.00.252.7
Velasco et al. [22]SW MediterraneanBC98LT40.00.372.77
Čikeš Keč and Zorica [29]Adriatic SeaDR280LF45.30.182.570.910.350.56
Jurado-Ruzafa et al. [16]MauritaniaBC163LT48.40.252.76 0.47
Daley and Leaf [13]Gulf of MexicoDR60LT33.61.753.29
S. scrofa
Shahrani and Shakman [35]LibyaDR94LT116.00.052.82
S. atricauda
Tuset et al. [31]CanariesDR406LT43.90.162.49
Tuset et al. [31]CanariesBC15LT52.30.092.39
Tuset et al. [31]CanariesMX490LT49.50.112.43
Amorim et al. [30]AzoresEF-LT41.40.262.65
Seriolaspp.
Manooch and Potts [25]SE U.S.A.BC190LF151.40.123.440.60–0.65
Manooch and Potts [26]Gulf of MexicoBC291LF110.90.233.450.68–0.70
Thompson et al. [21]Gulf of MexicoDR552LF138.90.253.68
Kožul et al. [18]Adriatic SeaDR298LT174.60.193.760.410.30.11
Harris et al. [23]SE U.S.A.DR1985LF124.20.283.64
A. carbo
Morales-Nin and Sena-Carvalho [19]MadeiraDR649LT138.60.253.68
Pajuelo et al. [20]CanariesDR298LT147.70.203.64
Vieira et al. [36]MadeiraBC436LT146.1–158.60.12–0.153.48–3.49
Vieira et al. [36]Mainland PortugalBC1075LT124.0–135.40.17–0.213.49–3.50
Delgado et al. [14]MadeiraBC587LT131.9–136.20.15–0.173.45–3.46
Notes: DR—direct reading; BC—back-calculation; IM—indirect method; MX—mixing; EF—empirical formula; n—number of individuals; LT—total length; LF—fork length; L—asymptotic length (cm); k—growth coefficient (year−1); ϕ′—growth performance index; Z—total mortality rate (year−1); M—natural mortality rate (year−1); F—fishing mortality rate (year−1).
Table 2. Sampling period and sample size (n) of fish species.
Scientific NameCommon NameSampling PeriodnSize Measurement
Trachurus picturatusBlue jack mackerel2010–2017104,299LF
Sparisoma cretenseParrotfish2010–201710,217LT
Scomber coliasAtlantic chub mackerel2010–201757,723LF
Scorpaena scrofaRed scorpionfish2010–20172983LT
Serranus atricaudaBlacktail comber2010–201731,045LT
Seriola spp.Amberjacks nei1990–20173998LF
Aphanopus carboBlack scabbardfish2011–20146029LF
Notes: LF—fork length. LT—total length.
Table 3. Estimates of natural mortality (M; year−1) for blue jack mackerel Trachurus picturatus, parrotfish Sparisoma cretense, Atlantic chub mackerel Scomber colias, red scorpionfish Scorpaena scrofa, blacktail comber Serranus atricauda, amberjacks nei Seriola spp. and black scabbardfish Aphanopus carbo from the empirical relationships between the estimated asymptotic length (L; cm) and growth rate coefficient (k; year−1).
Empirical FormulaSourceSpecies
Trachurus picturatusSparisoma cretenseScomber coliasScorpaena scrofaSerranus atricaudaSeriola spp.Aphanopus carbo
M = 5/tmax[45]0.130.180.300.180.200.200.15
M = 2.996/tmax[46]0.080.110.180.110.120.120.09
M = 3/tmax[50]0.080.110.180.110.120.120.09
M = 3 k/(exp(0.38 tmax × k − 1))[51]0.210.290.470.290.310.310.24
M = exp(− 0.0066 − 0.279 log(L) + 0.6543 log(k) + 0.4634 log(T))[52]0.530.580.670.580.600.550.50
M = 3/tmax[53]0.080.110.180.110.120.120.09
M = 4.6/tmax[54]0.120.170.280.170.180.180.14
M = 1.0661 L− 0.1172 × k 0.5092[55]0.180.220.280.210.230.210.18
M = − 0.1778 + 3.1687 k[56]0.080.170.390.170.200.200.11
M = 1.6 k[57]0.130.180.290.180.190.190.14
M = 1.5 k[57]0.120.170.270.170.180.180.14
M = 1.4 k[47]0.110.150.250.150.170.170.13
M = 4.22/tmax[48]0.110.150.250.150.170.170.13
M = 4.22/tmax[49]0.110.150.250.150.170.170.13
Mean value 0.150.200.300.200.210.210.16
Notes: tmax—the approximate maximum age (years) = 3/k [61]; T—water temperature (°C).
Publisher’s Note: MDPI stays neutral with regard to jurisdictional claims in published maps and institutional affiliations.

