
The Energetic Costs of Uphill Locomotion in Trail Running: Physiological Consequences Due to Uphill Locomotion Pattern—A Feasibility Study

Abstract
:1. Introduction
2. Materials and Methods
2.1. Study Design
2.2. Ethical Consideration
2.3. Participating Trail Running Athletes
2.4. Outdoor Uphill Field Measurements
2.5. Statistical Analysis
3. Results
4. Discussion
5. Conclusions
Author Contributions
Funding
Institutional Review Board Statement
Informed Consent Statement
Data Availability Statement
Acknowledgments
Conflicts of Interest
References
- Balducci, P.; Clémençon, M.; Morel, B.; Quiniou, G.; Saboul, D.; Hautier, C.A. Comparison of Level and Graded Treadmill Tests to Evaluate Endurance Mountain Runners. J. Sports Sci. Med. 2016, 15, 239–246. [Google Scholar] [PubMed]
- Ehrström, S.; Tartaruga, M.P.; Easthope, C.S.; Brisswalter, J.; Morin, J.-B.; Vercruyssen, F. Short Trail Running Race: Beyond the Classic Model for Endurance Running Performance. Med. Sci. Sports Exerc. 2018, 50, 580–588. [Google Scholar] [CrossRef] [PubMed] [Green Version]
- Saugy, J.; Place, N.; Millet, G.Y.; Degache, F.; Schena, F.; Millet, G.P. Alterations of Neuromuscular Function after the World’s Most Challenging Mountain Ultra-Marathon. PLoS ONE 2013, 8, e65596. [Google Scholar] [CrossRef] [PubMed] [Green Version]
- Millet, G.P.; Millet, G.Y. Ultramarathon Is an Outstanding Model for the Study of Adaptive Responses to Extreme Load and Stress. BMC Med. 2012, 10, 77. [Google Scholar] [CrossRef] [PubMed] [Green Version]
- Millet, G.Y.; Tomazin, K.; Verges, S.; Vincent, C.; Bonnefoy, R.; Boisson, R.-C.; Gergelé, L.; Féasson, L.; Martin, V. Neuromuscular Consequences of an Extreme Mountain Ultra-Marathon. PLoS ONE 2011, 6, e17059. [Google Scholar] [CrossRef] [Green Version]
- Hoffman, M.D.; Ingwerson, J.L.; Rogers, I.R.; Hew-Butler, T.; Stuempfle, K.J. Increasing Creatine Kinase Concentrations at the 161-Km Western States Endurance Run. Wilderness Environ. Med. 2012, 23, 56–60. [Google Scholar] [CrossRef] [Green Version]
- Scheer, V.; Janssen, T.I.; Vieluf, S.; Heitkamp, H.-C. Predicting Trail Running Performance With Laboratory Exercise Tests and Field Based Results. Int. J. Sports Physiol. Perform. 2018, 14, 30–133. [Google Scholar] [CrossRef]
- Lemire, M.; Remetter, R.; Hureau, T.J.; Kouassi, B.Y.L.; Lonsdorfer, E.; Geny, B.; Isner-Horobeti, M.-E.; Favret, F.; Dufour, S.P. High-Intensity Downhill Running Exacerbates Heart Rate and Muscular Fatigue in Trail Runners. J. Sports Sci. 2021, 39, 815–825. [Google Scholar] [CrossRef]
- Beltz, N.M.; Gibson, A.L.; Janot, J.M.; Kravitz, L.; Mermier, C.M.; Dalleck, L.C. Graded Exercise Testing Protocols for the Determination of VO2 Max: Historical Perspectives, Progress, and Future Considerations. J. Sport. Med. 2016, 2016, 1–12. [Google Scholar] [CrossRef] [Green Version]
- Cassirame, J.; Godin, A.; Chamoux, M.; Doucende, G.; Mourot, L. Physiological Implication of Slope Gradient during Incremental Running Test. Int. J. Environ. Res. Public Health 2022, 19, 12210. [Google Scholar] [CrossRef]
- Lemire, M.; Hureau, T.J.; Remetter, R.; Geny, B.; Kouassi, B.Y.L.; Lonsdorfer, E.; Isner-Horobeti, M.-E.; Favret, F.; Dufour, S.P. Trail Runners Cannot Reach V˙O2max during a Maximal Incremental Downhill Test. Med. Sci. Sports Exerc. 2020, 52, 1135–1143. [Google Scholar] [CrossRef]
- di Prampero, P.E.; Atchou, G.; Brückner, J.C.; Moia, C. The Energetics of Endurance Running. Eur. J. Appl. Physiol. Occup. Physiol. 1986, 55, 259–266. [Google Scholar] [CrossRef]
- Lemire, M.; Hureau, T.J.; Favret, F.; Geny, B.; Kouassi, B.Y.L.; Boukhari, M.; Lonsdorfer, E.; Remetter, R.; Dufour, S.P. Physiological Factors Determining Downhill vs. Uphill Running Endurance Performance. J. Sci. Med. Sport 2021, 24, 85–91. [Google Scholar] [CrossRef]
- Breiner, T.J.; Ortiz, A.L.R.; Kram, R. Level, Uphill and Downhill Running Economy Values Are Strongly Inter-Correlated. Eur. J. Appl. Physiol. 2019, 119, 257–264. [Google Scholar] [CrossRef]
- Vernillo, G.; Giandolini, M.; Edwards, W.B.; Morin, J.-B.; Samozino, P.; Horvais, N.; Millet, G.Y. Biomechanics and Physiology of Uphill and Downhill Running. Sports Med. 2017, 47, 615–629. [Google Scholar] [CrossRef]
- Kasch, F.W.; Wallace, J.P.; Huhn, R.R.; Krogh, L.A.; Hurl, P.M. VO2max during Horizontal and Inclined Treadmill Running. J. Appl. Physiol. 1976, 40, 982–983. [Google Scholar] [CrossRef]
- Davis, J.A.; Whipp, B.J.; Lamarra, N.; Huntsman, D.J.; Frank, M.H.; Wasserman, K. Effect of Ramp Slope on Determination of Aerobic Parameters from the Ramp Exercise Test. Med. Sci. Sports Exerc. 1982, 14, 339–343. [Google Scholar] [CrossRef]
- Paavolainen, L.; Nummela, A.; Rusko, H. Muscle Power Factors and VO2max as Determinants of Horizontal and Uphill Running Performance. Scand. J. Med. Sci. Sports 2000, 10, 286–291. [Google Scholar] [CrossRef] [PubMed]
- Scheer, V.; Ramme, K.; Reinsberger, C.; Heitkamp, H.-C. VO2max Testing in Trail Runners: Is There a Specific Exercise Test Protocol? Int. J. Sports Med. 2018, 39, 456–461. [Google Scholar] [CrossRef] [PubMed]
- Pringle, J.S.M.; Carter, H.; Doust, J.H.; Jones, A.M. Oxygen Uptake Kinetics during Horizontal and Uphill Treadmill Running in Humans. Eur. J. Appl. Physiol. 2002, 88, 163–169. [Google Scholar] [CrossRef] [PubMed]
- Taylor, H.L.; Buskirk, E.; Henschel, A. Maximal Oxygen Intake as an Objective Measure of Cardio-Respiratory Performance. J. Appl. Physiol. 1955, 8, 73–80. [Google Scholar] [CrossRef]
- Schöffl, I.; Jasinski, D.; Ehrlich, B.; Dittrich, S.; Schöffl, V. Outdoor Uphill Exercise Testing for Trail Runners, a More Suitable Method? J. Hum. Kinet. 2021, 79, 123–133. [Google Scholar] [CrossRef]
- Snyder, K.L.; Farley, C.T. Energetically Optimal Stride Frequency in Running: The Effects of Incline and Decline. J. Exp. Biol. 2011, 214, 2089–2095. [Google Scholar] [CrossRef] [Green Version]
- Padulo, J.; Powell, D.; Milia, R.; Ardigò, L.P. A Paradigm of Uphill Running. PLoS ONE 2013, 8, e69006. [Google Scholar] [CrossRef] [Green Version]
- Padulo, J.; Annino, G.; Migliaccio, G.M.; D’ottavio, S.; Tihanyi, J. Kinematics of Running at Different Slopes and Speeds. J. Strength Cond. Res. 2012, 26, 1331–1339. [Google Scholar] [CrossRef]
- Minetti, A.E.; Moia, C.; Roi, G.S.; Susta, D.; Ferretti, G. Energy Cost of Walking and Running at Extreme Uphill and Downhill Slopes. J. Appl. Physiol. 2002, 93, 1039–1046. [Google Scholar] [CrossRef] [Green Version]
- Minetti, A.E.; Ardigò, L.P.; Saibene, F. Mechanical Determinants of the Minimum Energy Cost of Gradient Running in Humans. J. Exp. Biol. 1994, 195, 211–225. [Google Scholar] [CrossRef]
- Hoogkamer, W.; Taboga, P.; Kram, R. Applying the Cost of Generating Force Hypothesis to Uphill Running. PeerJ 2014, 2, e482. [Google Scholar] [CrossRef] [Green Version]
- Lussiana, T.; Fabre, N.; Hébert-Losier, K.; Mourot, L. Effect of Slope and Footwear on Running Economy and Kinematics. Scand. J. Med. Sci. Sports 2013, 23, e246–e253. [Google Scholar] [CrossRef]
- Margaria, R.; Cerretelli, P.; Aghemo, P.; Sassi, G. Energy Cost of Running. J. Appl. Physiol. 1963, 18, 367–370. [Google Scholar] [CrossRef]
- Lacour, J.-R.; Bourdin, M. Factors Affecting the Energy Cost of Level Running at Submaximal Speed. Eur. J. Appl. Physiol. 2015, 115, 651–673. [Google Scholar] [CrossRef] [PubMed]
- Saunders, P.U.; Pyne, D.B.; Telford, R.D.; Hawley, J.A. Factors Affecting Running Economy in Trained Distance Runners. Sports Med. 2004, 34, 465–485. [Google Scholar] [CrossRef] [PubMed]
- Lemire, M.; Remetter, R.; Hureau, T.J.; Geny, B.; Lonsdorfer, E.; Favret, F.; Dufour, S.P. Energy Cost of Running in Well-Trained Athletes: Toward Slope-Dependent Factors. Int. J. Sports Physiol. Perform. 2022, 17, 423–431. [Google Scholar] [CrossRef] [PubMed]
- de Waal, S.J.; Gomez-Ezeiza, J.; Venter, R.E.; Lamberts, R.P. Physiological Indicators of Trail Running Performance: A Systematic Review. Int. J. Sports Physiol. Perform. 2021, 16, 325–332. [Google Scholar] [CrossRef] [PubMed]
- Giovanelli, N.; Sulli, M.; Kram, R.; Lazzer, S. Do Poles Save Energy during Steep Uphill Walking? Eur. J. Appl. Physiol. 2019, 119, 1557–1563. [Google Scholar] [CrossRef] [PubMed]
- Urbaniak, G.C.; Plous, S. Research Randomizer (Version 4.0) [Computer Software]. Available online: https://Randomizer.Org/about/ (accessed on 27 September 2021).
- Harriss, D.J.; MacSween, A.; Atkinson, G. Ethical Standards in Sport and Exercise Science Research: 2020 Update. Int. J. Sports Med. 2019, 40, 813–817. [Google Scholar] [CrossRef] [Green Version]
- Schaun, G.Z. The maximal Oxygen uptake verification phase: A light at the end of the tunnel? Sports Med. Open 2017, 3, 44. [Google Scholar] [CrossRef] [Green Version]
- Shulman, R.G.; Rothman, D.L. The “Glycogen Shunt” in Exercising Muscle: A Role for Glycogen in Muscle Energetics and Fatigue. Proc. Natl. Acad. Sci. USA 2001, 98, 457–461. [Google Scholar] [CrossRef] [Green Version]
- Leti, T.; Mendelson, M.; Laplaud, D.; Flore, P. Prediction of Maximal Lactate Steady State in Runners with an Incremental Test on the Field. J. Sports Sci. 2012, 30, 609–616. [Google Scholar] [CrossRef]
- Bale, P.; Bradbury, D.; Colley, E. Anthropometric and Training Variables Related to 10km Running Performance. Br. J. Sports Med. 1986, 20, 170–173. [Google Scholar] [CrossRef]
- Knechtle, B.; Barandun, U.; Knechtle, P.; Zingg, M.A.; Rosemann, T.; Rüst, C.A. Prediction of Half-Marathon Race Time in Recreational Female and Male Runners. Springerplus 2014, 3, 248. [Google Scholar] [CrossRef] [Green Version]
- Alvero-Cruz, J.; Carnero, E.; García, M.; Alacid, F.; Correas-Gómez, L.; Rosemann, T.; Nikolaidis, P.; Knechtle, B. Predictive Performance Models in Long-Distance Runners: A Narrative Review. Int. J. Environ. Res. Public Health 2020, 17, 8289. [Google Scholar] [CrossRef]
- Svedahl, K.; MacIntosh, B.R. Anaerobic Threshold: The Concept and Methods of Measurement. Can. J. Appl. Physiol. 2003, 28, 299–323. [Google Scholar] [CrossRef] [Green Version]
- Sales, M.M.; Sousa, C.V.; da Silva Aguiar, S.; Knechtle, B.; Nikolaidis, P.T.; Alves, P.M.; Simões, H.G. An Integrative Perspective of the Anaerobic Threshold. Physiol. Behav. 2019, 205, 29–32. [Google Scholar] [CrossRef] [Green Version]
- Scheer, V.; Vieluf, S.; Janssen, T.I.; Heitkamp, H.-C. Predicting Competition Performance in Short Trail Running Races with Lactate Thresholds. J. Hum. Kinet. 2019, 69, 159–167. [Google Scholar] [CrossRef] [Green Version]
- Foster, C.; Lucia, A. Running Economy: The Forgotten Factor in Elite Performance. Sports Med. 2007, 37, 316–319. [Google Scholar] [CrossRef]
- Joyner, M.J.; Coyle, E.F. Endurance Exercise Performance: The Physiology of Champions. J. Physiol. 2008, 586, 35–44. [Google Scholar] [CrossRef]
- McLaughlin, J.E.; Howley, E.T.; Bassett, D.R.; Thompson, D.L.; Fitzhugh, E.C. Test of the Classic Model for Predicting Endurance Running Performance. Med. Sci. Sports Exerc. 2010, 42, 991–997. [Google Scholar] [CrossRef]
- Daniels, J.; Daniels, N. Running Economy of Elite Male and Elite Female Runners. Med. Sci. Sports Exerc. 1992, 24, 483–489. [Google Scholar] [CrossRef]
- Larsen, H.B. Kenyan Dominance in Distance Running. Comp. Biochem. Physiol. A Mol. Integr. Physiol. 2003, 136, 161–170. [Google Scholar] [CrossRef]
- Willis, S.J.; Gellaerts, J.; Mariani, B.; Basset, P.; Borrani, F.; Millet, G.P. Level Versus Uphill Economy and Mechanical Responses in Elite Ultra-Trail Runners. Int. J. Sports Physiol. Perform. 2019, 14, 1001–1005. [Google Scholar] [CrossRef] [PubMed]
- Billat, L.V.; Koralsztein, J.P. Significance of the Velocity at VO2max and Time to Exhaustion at This Velocity. Sports Med. 1996, 22, 90–108. [Google Scholar] [CrossRef] [PubMed]
- Ortiz, A.L.R.; Giovanelli, N.; Kram, R. The Metabolic Costs of Walking and Running up a 30-Degree Incline: Implications for Vertical Kilometer Foot Races. Eur. J. Appl. Physiol. 2017, 117, 1869–1876. [Google Scholar] [CrossRef] [PubMed]
- Giovanelli, N.; Ortiz, A.L.R.; Henninger, K.; Kram, R. Energetics of Vertical Kilometer Foot Races; Is Steeper Cheaper? J. Appl. Physiol. 2016, 120, 370–375. [Google Scholar] [CrossRef] [Green Version]
- Itoh, H.; Ohkuwa, T.; Yamazaki, Y.; Miyamura, M. Human Blood Lactate and Ammonia Levels after Supramaximal Uphill and Downhill Running. Nagoya J. Med. Sci. 1996, 59, 135–142. [Google Scholar] [PubMed]
- Midgley, A.W.; McNaughton, L.R.; Polman, R.; Marchant, D. Criteria for Determination of Maximal Oxygen Uptake. Sport. Med. 2007, 37, 1019–1028. [Google Scholar] [CrossRef]
- Costill, D.L.; Jansson, E.; Gollnick, P.D.; Saltin, B. Glycogen Utilization in Leg Muscles of Men during Level and Uphill Running. Acta Physiol. Scand. 1974, 91, 475–481. [Google Scholar] [CrossRef]
- Armstrong, R.B.; Laughlin, M.H.; Rome, L.; Taylor, C.R. Metabolism of Rats Running up and down an Incline. J. Appl. Physiol. Respir. Environ. Exerc. Physiol. 1983, 55, 518–521. [Google Scholar] [CrossRef]
- Bernardi, E.; Pratali, L.; Mandolesi, G.; Spiridonova, M.; Roi, G.S.; Cogo, A. Thoraco-Abdominal Coordination and Performance during Uphill Running at Altitude. PLoS ONE 2017, 12, e0174927. [Google Scholar] [CrossRef] [Green Version]
- Gladwell, V.F.; Coote, J.H. Heart rate at the onset of muscle contraction and during passive muscle stretch in humans: A role for mechanoreceptors. J. Physiol. 2002, 540, 1095–1102. [Google Scholar] [CrossRef]
- Zimmermann, P.; Schöffl, I.; Schöffl, V.; Zimmermann, L.; Eckstein, M.L.; Moser, O.; Wüstenfeld, J. Physiological Effects of Training in Elite German Winter Sport Athletes: Sport Specific Remodeling Determined Using Echocardiographic Data and CPET Performance Parameters. J. Cardiovasc. Dev. Dis. 2022, 9, 235. [Google Scholar] [CrossRef]
- Gregor, R.J.; Costill, D.L. A Comparison of the Energy Expenditure during Positive and Negative Grade Running. J. Sports Med. Phys. Fit. 1973, 13, 248–252. [Google Scholar]
- Abe, D.; Yanagawa, K.; Yamanobe, K.; Tamura, K. Assessment of Middle-Distance Running Performance in Sub-Elite Young Runners Using Energy Cost of Running. Eur. J. Appl. Physiol. Occup. Physiol. 1998, 77, 320–325. [Google Scholar] [CrossRef]
- Mooses, M.; Mooses, K.; Haile, D.W.; Durussel, J.; Kaasik, P.; Pitsiladis, Y.P. Dissociation between Running Economy and Running Performance in Elite Kenyan Distance Runners. J. Sports Sci. 2015, 33, 136–144. [Google Scholar] [CrossRef]
- Giovanelli, N.; Taboga, P.; Rejc, E.; Lazzer, S. Effects of Strength, Explosive and Plyometric Training on Energy Cost of Running in Ultra-Endurance Athletes. Eur. J. Sport Sci. 2017, 17, 805–813. [Google Scholar] [CrossRef]
- Lazzer, S.; Salvadego, D.; Taboga, P.; Rejc, E.; Giovanelli, N.; di Prampero, P.E. Effects of the Etna Uphill Ultramarathon on Energy Cost and Mechanics of Running. Int. J. Sports Physiol. Perform. 2015, 10, 238–247. [Google Scholar] [CrossRef]
- Giandolini, M.; Vernillo, G.; Samozino, P.; Horvais, N.; Edwards, W.B.; Morin, J.-B.; Millet, G.Y. Fatigue Associated with Prolonged Graded Running. Eur. J. Appl. Physiol. 2016, 116, 1859–1873. [Google Scholar] [CrossRef]

| Male n = 10 | Female n = 4 | p-Value | |
|---|---|---|---|
| Age (y) | 36.2 ± 9.2 | 38.3 ± 4.0 | n.s. |
| Height (cm) | 183.3 + 5.4 | 168.3 ± 2.5 | 0.0002 |
| Body mass (kg) | 75.3 ± 7.1 | 58.3 ± 2.2 | 0.0006 |
| BMI (kg/m2) | 22.5 ± 1.8 | 20.8 ± 1.3 | n.s. |
| Parameter | Meant ± SD |
|---|---|
| Favorite TR race distance | 43.69 ± 26.56 km |
| Race participation per annum | 5.38± 4.41 |
| Current training period | Race: 7.69% Tapering 23.08 Recreation: 69.23 |
| Denivelation running per training week | 1200.00 ± 769.58 m |
| Training distance per week | 60.41 ± 26.15 km |
| Competition in road level running | Yes: 69.24% No: 30.76 |
| Best time in 10 km official race | 44.6 ± 0.10 min |
| Best time in 1000 m denivelation official race | 63.83 ± 3.00 min |
| Years of specific TR training | 4.27 ± 3.99 |
Uphill locomotion strategy
| Running 57.14% Walking 35.71 Both combined: 7.15 |
| Severe Injury break during TR career | Yes: 21.43% No: 78.57 |
| Parameter | Uphill Running (n = 14) Male Female | Uphill Walking (n = 14) Male Female | p-Value Male | p-Value Female | Overall p-Value |
|---|---|---|---|---|---|
| (mL·kg−1·min−1) | 57.61 ± 37.0 49.3 ± 3.4 55.2 ± 7.2 | 56.5 ± 6.6 49.0 ± 2.2 54.4 ± 6.6 | ns | ns | 0.362 |
| Peak O2 pulse (mL/bpm) | 26.3 ± 2.4 17.5 ± 1.7 23.7 ± 4.7 | 24.8 ± 2.0 17.3 ± 1.0 22.6 ± 4.0 | ns | ns | 0.154 |
| Breath frequencypeak (Hz) | 55.5 ± 7.7 54.5 ± 8.6 55.2 ± 7.6 | 54.9 ± 7.4 49.0 ± 3.5 53.2 ± 7.0 | ns | ns | 0.191 |
| TimeRER1.01 (min) | 2.0 ± 1.6 3.2 ± 2.8 1.83 + 1.44 | 2.5 ± 2.3 3.3 ± 3.2 2.73 ± 2.47 | ns | ns | 0.212 |
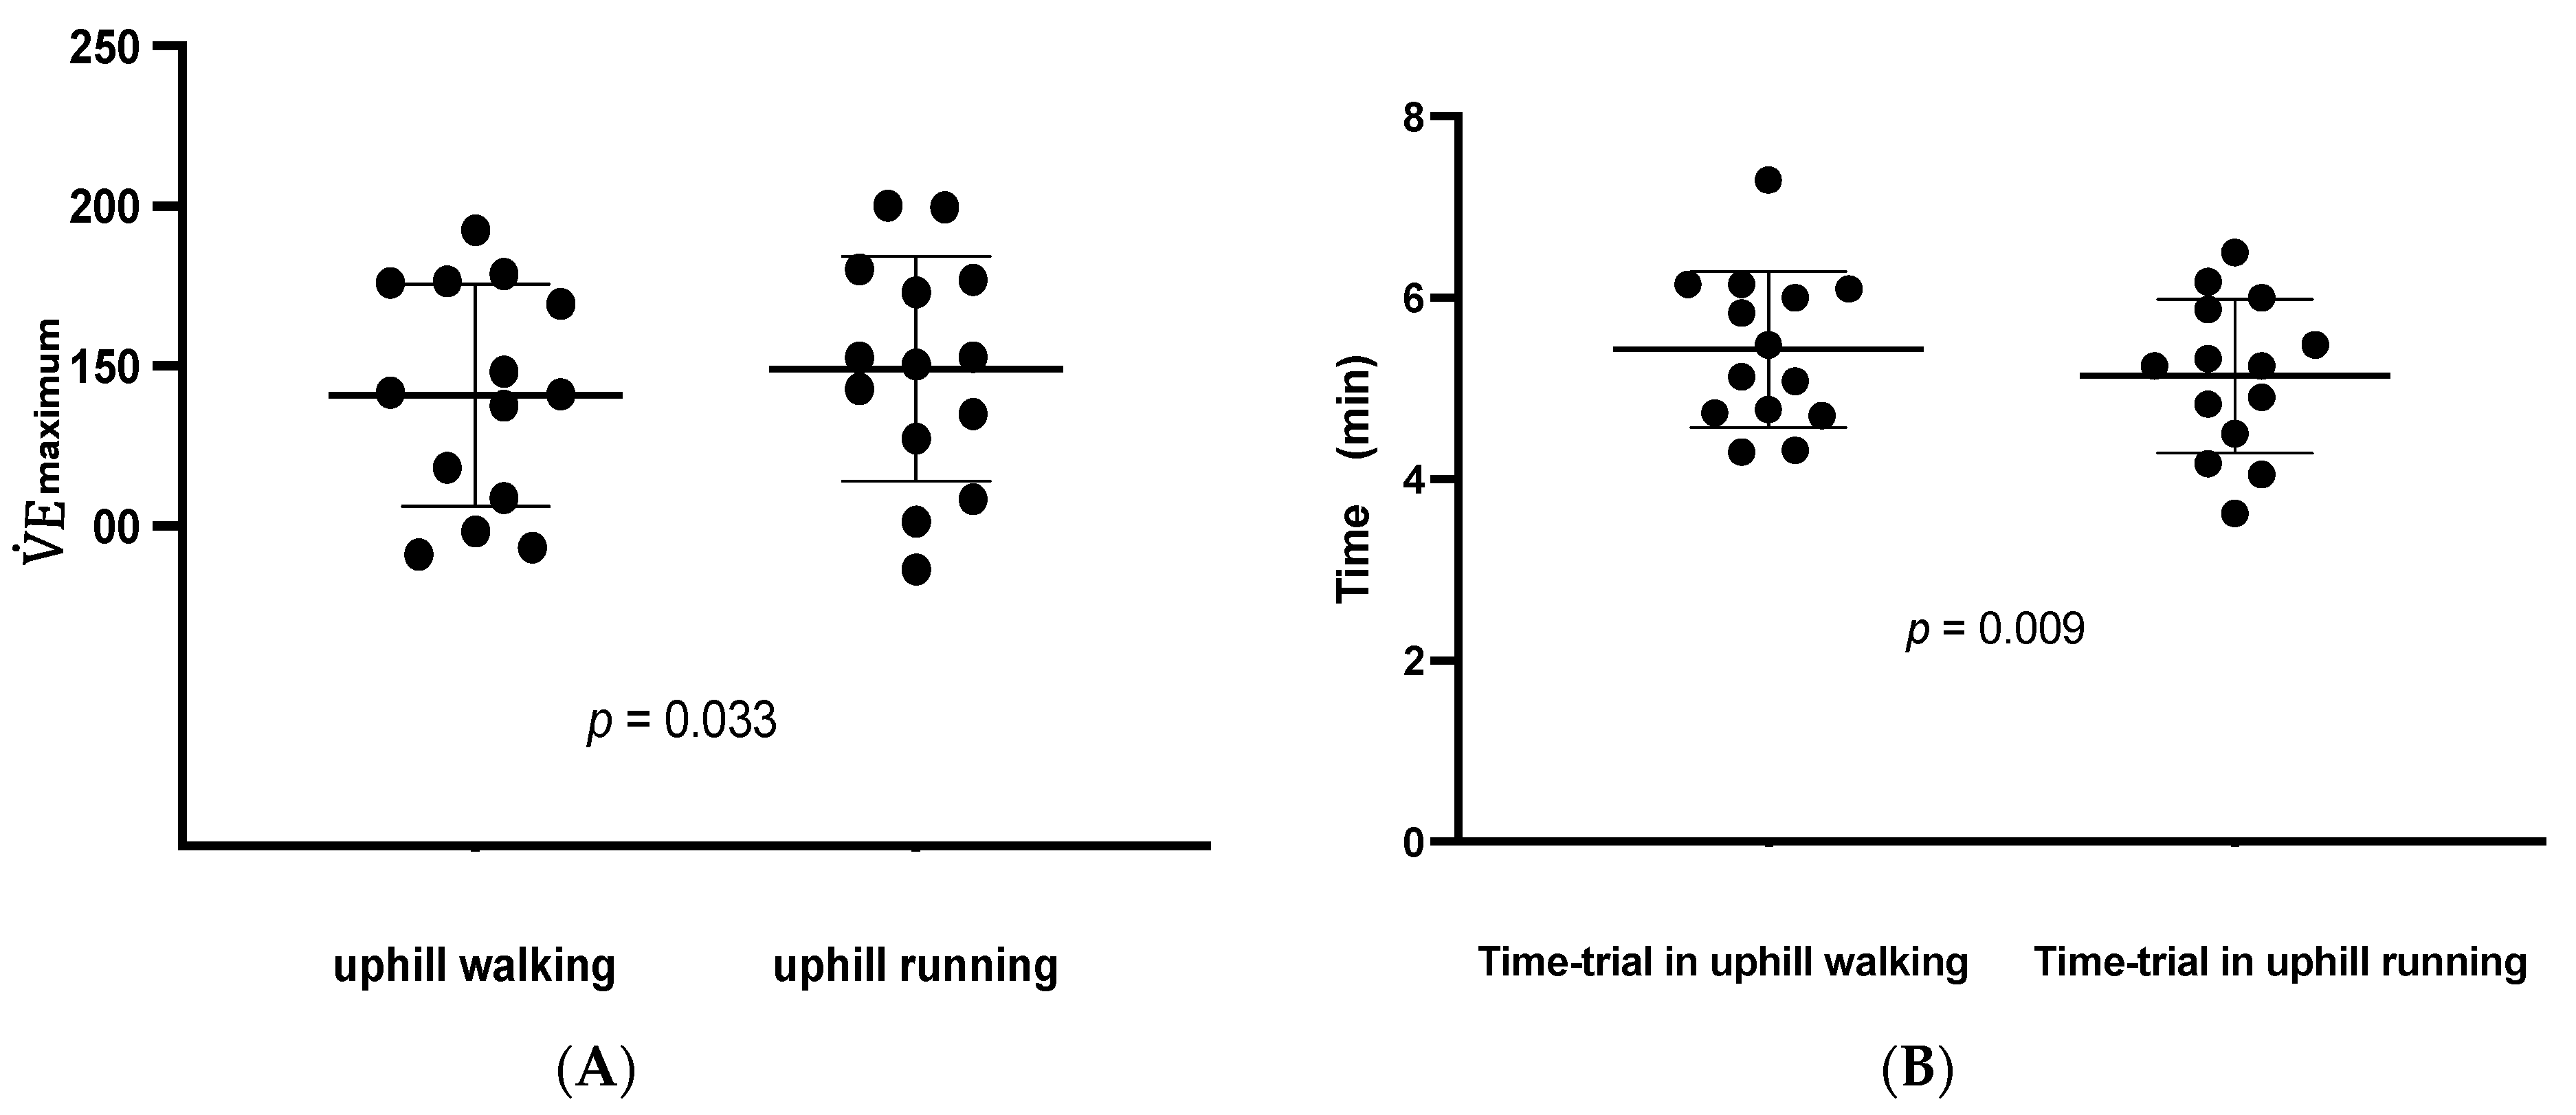
| VE maximum (L·min) | 166.4 ± 23.0 105.9 ± 17.0 149.2 + 35.2 | 158.0 ± 23.7 97.9 ± 7.8 140.8 ± 34.6 | 0.096 | 0.2330 | 0.033 * |
| Peak heart rate (bpm) | 176.2 ± 12.4 171.8 ± 3.0 175 ± 11 | 177.5 ± 11.7 172.3 ± 2.6 176 ± 10 | ns | ns | 0.297 |
| Lacdatepeak exercise (mmol·L−1) | 9.4 ± 3.8 9.7 ± 3.2 8.7 ± 4.1 | 9.6 ± 3.3 8.0 ± 2.1 9.1 ± 4.3 | ns | ns | 0.752 |
| Cr locomotionmean (J·kg−1·m−1) | 7.1 ± 2.0 6.5 ± 2.1 6.87 ± 2.25 | 7.2 ± 2.3 6.6 ± 2.2 7.02 ± 2.51 | ns | ns | 0.581 |
| Timeuphill (min) | 4.7 ± 1.1 6.1 ± 0.4 5.13 ± 0.86 | 5.1 ± 0.6 6.4 ± 0.5 5.42 ± 0.86 | 0.0217 | 0.312 | 0.009 * |
Publisher’s Note: MDPI stays neutral with regard to jurisdictional claims in published maps and institutional affiliations. |
© 2022 by the authors. Licensee MDPI, Basel, Switzerland. This article is an open access article distributed under the terms and conditions of the Creative Commons Attribution (CC BY) license (https://creativecommons.org/licenses/by/4.0/).
Share and Cite
Zimmermann, P.; Müller, N.; Schöffl, V.; Ehrlich, B.; Moser, O.; Schöffl, I. The Energetic Costs of Uphill Locomotion in Trail Running: Physiological Consequences Due to Uphill Locomotion Pattern—A Feasibility Study. Life 2022, 12, 2070. https://doi.org/10.3390/life12122070
Zimmermann P, Müller N, Schöffl V, Ehrlich B, Moser O, Schöffl I. The Energetic Costs of Uphill Locomotion in Trail Running: Physiological Consequences Due to Uphill Locomotion Pattern—A Feasibility Study. Life. 2022; 12(12):2070. https://doi.org/10.3390/life12122070
Chicago/Turabian StyleZimmermann, Paul, Nico Müller, Volker Schöffl, Benedikt Ehrlich, Othmar Moser, and Isabelle Schöffl. 2022. "The Energetic Costs of Uphill Locomotion in Trail Running: Physiological Consequences Due to Uphill Locomotion Pattern—A Feasibility Study" Life 12, no. 12: 2070. https://doi.org/10.3390/life12122070
APA StyleZimmermann, P., Müller, N., Schöffl, V., Ehrlich, B., Moser, O., & Schöffl, I. (2022). The Energetic Costs of Uphill Locomotion in Trail Running: Physiological Consequences Due to Uphill Locomotion Pattern—A Feasibility Study. Life, 12(12), 2070. https://doi.org/10.3390/life12122070