
Which Body Density Equations Calculate Body Fat Percentage Better in Olympic Wrestlers?—Comparison Study with Air Displacement Plethysmography

 ,
,  , , ,
, , ,  and
and 
Abstract
:1. Introduction
2. Material and Methods
2.1. Participants
2.2. Anthropometric Measurements
2.3. Criterion Method
2.4. Statistical Analysis
3. Results
4. Discussion
5. Conclusions
Author Contributions
Funding
Institutional Review Board Statement
Informed Consent Statement
Data Availability Statement
Acknowledgments
Conflicts of Interest
References
- Finley, M.; Pleket, H. Wrestling. In The Olympic Games: The First Thousand Years; Dover Publications, INC.: Mincola, NY, USA, 2005; pp. 74–75. [Google Scholar]
- Oppliger, R.; Case, H.; Horswill, C.; Landry, G.; Shelter, A. American College of Sports Medicine position stand. Weight loss in wrestlers. Med. Sci. Sports Exerc. 1996, 28, 9–12. [Google Scholar] [CrossRef] [Green Version]
- Oppliger, R.A.; Case, H.S.; Horswill, C.A.; Landry, G.L.; Shelter, A.C. Weight loss in wrestlers. Med. Sci. Sports Exerc. 1996, 28, ix–xii. [Google Scholar] [CrossRef] [Green Version]
- Khodaee, M.; Olewinski, L.; Shadgan, B.; Kiningham, R.R. Rapid weight loss in sports with weight classes. Curr. Sports Med. Rep. 2015, 14, 435–441. [Google Scholar] [CrossRef] [PubMed] [Green Version]
- Reale, R.; Slater, G.; Burke, L.M. Acute-weight-loss strategies for combat sports and applications to olympic success. Int. J. Sports Physiol. Perform. 2017, 12, 142–151. [Google Scholar] [CrossRef]
- Remick, D.; Chancellor, K.; Pederson, J.; Zambraaki, E.J.; Sawka, M.N.; Wenger, C.B. Hyperthermia and dehydration-related deaths associated with intentional rapid weight loss in three collegiate wrestlers- North Carolina, Wisconsin, and Michigan, November-December 1997. J. Am. Med. Assoc. 1998, 279, 824–825. [Google Scholar]
- NCAA. 2017-18 NCAA Wrestling Weight Management Program; The National Collegiate Athletic Association: Indianapolis, IN, USA, 2017. [Google Scholar]
- Clarke, K.S. Wrestling and Weight Control. JAMA J. Am. Med. Assoc. 1967, 201, 541–543. [Google Scholar] [CrossRef]
- Zaccagni, L. Anthropometric characteristics and body composition of Italian national wrestlers. Eur. J. Sport Sci. 2012, 12, 145–151. [Google Scholar] [CrossRef]
- Clark, R.R.; Sullivan, J.C.; Bartok, C.; Schoeller, D.A. Multicomponent cross-validation of minimum weight predictions for college wrestlers. Med. Sci. Sports Exerc. 2003, 35, 342–347. [Google Scholar] [CrossRef] [Green Version]
- Clark, R.R.; Bartok, C.; Sullivan, J.C.; Schoeller, D.A. Minimum Weight Prediction Methods Cross-Validated by the Four-Component Model. Med. Sci. Sports Exerc. 2004, 36, 639–647. [Google Scholar] [CrossRef] [PubMed]
- Kasper, A.M.; Langan-Evans, C.; Hudson, J.F.; Brownlee, T.E.; Harper, L.D.; Naughton, R.J.; Morton, J.P.; Close, G.L. Come back skinfolds, all is forgiven: A narrative review of the efficacy of common body composition methods in applied sports practice. Nutrients 2021, 13, 1075. [Google Scholar] [CrossRef]
- Forsyth, H.; Sinning, W. The anthropometric estimation of body density and lean body weight of male athletes. Med. Sci. Sports Exerc. 1973, 5, 174–180. [Google Scholar] [CrossRef]
- Stewart, A.D.; James Hannan, W. Prediction of fat and fat-free mass in male athletes using dual x-ray absorptiometry as the reference method. J. Sports Sci. 2000, 18, 263–274. [Google Scholar] [CrossRef] [PubMed]
- Thorland, W.; Tipton, C.; Lohman, T.; Bowers, R.; Housh, T.; Johnson, G.; Kelly, J.; Oppliger, R.; Tcheng, T. Midwest wrestling study: Prediction of minimal weight for high school wrestlers. Med. Sci. Sports Exerc. 1991, 23, 1102–1110. [Google Scholar] [CrossRef]
- Thorland, W.; Johnson, G.; Tharp, G.; Housh, T.; Cisar, C. Estimation of body density in adolescent athletes. Hum. Biol. 1984, 56, 439–448. [Google Scholar]
- White, J.; Mayhew, J.; Piper, F. Prediction of body composition in college football players. J. Sports Med. Phys. Fitness 1980, 20, 317–324. [Google Scholar]
- Evans, E.M.; Rowe, D.A.; Misic, M.M.; Prior, B.M.; Arngrímsson, S.Á. Skinfold prediction equation for athletes developed using a four-component model. Med. Sci. Sports Exerc. 2005, 37, 2006–2011. [Google Scholar] [CrossRef] [PubMed]
- Durnin, J.V.G.A.; Womersley, J. Body fat assessed from total body density and its estimation from skinfold thickness: Measurements on 481 men and women aged from 16 to 72 Years. Br. J. Nutr. 1974, 32, 77–97. [Google Scholar] [CrossRef] [PubMed] [Green Version]
- Jackson, A.; Pollock, M.; Ward, A. Generalized equations for predicting body density of women. Med. Sci. Sports Exerc. 1980, 12, 175–181. [Google Scholar] [CrossRef] [Green Version]
- Jackson, A.S.; Pollock, M.L. Generalized equations for predicting body density of men. Br. J. Nutr. 1978, 40, 497–504. [Google Scholar] [CrossRef] [PubMed] [Green Version]
- Lohman, T. Skinfolds and body density and their relation to body fatness: A review. Hum. Biol. 1981, 53, 181–225. [Google Scholar] [PubMed]
- Reilly, T.; George, K.; Marfell-Jones, M.; Scott, M.; Sutton, L.; Wallace, J.A. How well do skinfold equations predict percent body fat in elite soccer players? Int. J. Sports Med. 2009, 30, 607–613. [Google Scholar] [CrossRef]
- Munguía-Izquierdo, D.; Suárez-Arrones, L.; Di Salvo, V.; Paredes-Hernández, V.; Ara, I.; Mendez-Villanueva, A. Estimating fat-free mass in elite youth male soccer players: Cross-validation of different field methods and development of prediction equation. J. Sports Sci. 2019, 37, 1197–1204. [Google Scholar] [CrossRef]
- Munguia-Izquierdo, D.; Suarez-Arrones, L.; Di Salvo, V.; Paredes-Hernandez, V.; Alcazar, J.; Ara, I.; Kreider, R.; Mendez-Villanueva, A. Validation of Field Methods to Assess Body Fat Percentage in Elite Youth Soccer Players. Int. J. Sports Med. 2018, 39, 349–354. [Google Scholar] [CrossRef]
- Clark, R.R.M.; Oppliger, R.; Sullivan, J. Cross-validation of the NCAA method to predict body fat for minimum weight in collegiate wrestlers. Clin. J. Sport. Med. 2002, 12, 285–290. [Google Scholar] [CrossRef]
- Elliott-Sale, K.J.; Minahan, C.L.; de Jonge, X.A.K.J.; Ackerman, K.E.; Sipilä, S.; Constantini, N.W.; Lebrun, C.M.; Hackney, A.C. Methodological Considerations for Studies in Sport and Exercise Science with Women as Participants: A Working Guide for Standards of Practice for Research on Women. Sport. Med. 2021, 51, 843–861. [Google Scholar] [CrossRef]
- Esparza-Ros, F.; Vaquero-Cristóbal, R.; Marfell-Jones, M. International Standards for Anthropometric Assessment (2019); International Society for the Advancement of Kinanthropometry: Murcia, Spain, 2019; ISBN 978-84-16045-27-3. [Google Scholar]
- ACSM’s Guidelines for Exercise Testing and Prescription, 6th ed.; Lippincott, Williams, and Wilkins: Philadelphia, PA, USA, 2000.
- Brožek, J.; Grande, F.; Anderson, J.T.; Keys, A. Densitometric analysis of body composition: Revision of some quantitative assumptions. Ann. N. Y. Acad. Sci. 1963, 110, 113–140. [Google Scholar] [CrossRef]
- Hopkins, W.G.; Marshall, S.W.; Batterham, A.M.; Hanin, J. Progressive statistics for studies in sports medicine and exercise science. Med. Sci. Sports Exerc. 2009, 41, 3–12. [Google Scholar] [CrossRef] [PubMed] [Green Version]
- Bland, J.M.; Altman, D.G. Measuring agreement in method comparison studies. Stat. Methods Med. Res. 1999, 8, 135–160. [Google Scholar] [CrossRef]
- Santos, D.A.; Dawson, J.A.; Matias, C.N.; Rocha, P.M.; udia Minderico, C.S.; Allison, D.B.; Sardinha, L.B.; Silva, A.M. Reference Values for Body Composition and Anthropometric Measurements in Athletes. PLoS ONE 2014, 9, e97846. [Google Scholar] [CrossRef] [PubMed] [Green Version]
- Utter, A.C.; Goss, F.L.; Swan, P.D.; Harris, G.S.; Robertson, R.J.; Trone, G.A. Evaluation of Air Displacement for Assessing Body Composition of Collegiate Wrestlers. Med. Sci. Sports Exerc. 2003, 35, 500–505. [Google Scholar] [CrossRef] [PubMed] [Green Version]
- Dixon, C.B.; Deitrick, R.W.; Pierce, J.R.; Cutrufello, P.T.; Drapeau, L.L. Evaluation of the BOD POD and leg-to-leg bioelectrical impedance analysis for estimating percent body fat in National Collegiate Athletic Association Division III collegiate wrestlers. J. Strength Cond. Res. 2005, 19, 85–91. [Google Scholar] [CrossRef] [PubMed]

| Male Wrestlers (n = 61) | Female Wrestlers (n = 25) | |||
|---|---|---|---|---|
| <18 Age (n = 33) | ≥18 Age (n = 28) | <18 Age (n = 14) | ≥18 Age (n = 11) | |
| Age (years) | 16.24 ± 0.79 | 19.78 ± 1.57 * | 16.21 ± 0.97 | 19.00 ± 1.09 * |
| Height (cm) | 169.41 ± 7.61 ¶ | 171.33 ± 6.21 ¶ | 162.31 ± 7.51 ¶ | 159.93 ± 6.76 ¶ |
| Body mass (kg) | 70.45 ± 15.2 ¶ | 74.74 ± 10.88 ¶ | 60.95 ± 8.76 ¶ | 59.48 ± 11.69 ¶ |
| BMI (kg.m−2) | 24.35 ± 3.89 | 25.50 ± 2.86 ¶ | 23.11 ± 2.01 | 23.07 ± 3.17 ¶ |
| Skinfolds (mm) | ||||
| Biceps | 4.32 ± 1.47 | 4.10 ± 0.98 | 4.08 ± 0.86 | 4.56 ± 1.42 |
| Triceps (mm) | 8.97 ± 2.61 | 7.92 ± 2.70 ¶ | 10.71 ± 3.36 | 11.85 ± 4.52 |
| Subscapular (mm) | 10.31 ± 3.79 | 10.22 ± 2.74 | 8.62 ± 1.86 | 9.03 ± 2.65 |
| Iliac crest (mm) | 7.22 ± 4.01 | 6.31 ± 2.37 | 5.98 ± 1.68 | 7.12 ± 2.24 |
| Abdominal (mm) | 11.44 ± 6.57 | 10.19 ± 4.80 | 9.35 ± 3.11 | 11.23 ± 4.69 |
| Midaxillary (mm) | 7.84 ± 3.63 | 7.36 ± 2.89 | 6.48 ± 1.94 | 6.96 ± 2.34 |
| Chest (mm) | 6.55 ± 2.06 ¶ | 5.25 ± 1.50 * | 5.11 ± 1.35 ¶ | 6.14 ± 1.16 |
| Anterior thigh (mm) | 11.53 ± 5.24 ¶ | 10.36 ± 4.52 ¶ | 17.34 ± 3.57 ¶ | 18.54 ± 6.93 |
| Medial calf (mm) | 7.39 ± 2.72 ¶ | 9.24 ± 4.04 * | 9.88 ± 4.97 ¶ | 9.56 ± 4.55 |
| Sum of skinfolds (mm) | ||||
| Sum of 2 skinfolds (mm) b | 21.76 ± 10.19 | 20.41 ± 7.24 | 17.98 ± 4.77 | 20.27 ± 6.83 |
| Sum of 3 skinfolds-1 (mm) c | 27.13 ± 9.11 | 25.51 ± 7.32 | 25.82 ± 6.18 | 27.85 ± 8.35 |
| Sum of 3 skinfolds-2 (mm) d | 30.73 ± 11.81 | 28.33 ± 9.26 | 28.70 ± 7.30 | 32.12 ± 10.94 |
| Sum of 4 skinfolds-1 (mm) e | 38.58 ± 15.34 | 35.70 ± 11.92 | 35.18 ± 9.08 | 39.09 ± 12.65 |
| Sum of 7 skinfolds (mm) f | 63.89 ± 25.47 | 57.62 ± 18.85 | 63.62 ± 14.21 | 70.90 ± 21.66 |
| Sum of 8 skinfolds (mm) g | 68.22 ± 25.30 | 61.72 ± 18.81 | 67.71 ± 14.16 | 75.47 ± 21.77 |
| Body Fat (%) | ||||
| BODPOD | 8.84 ± 5.47 ¶ | 9.38 ± 7.43 ¶ | 18.23 ± 4.18 ¶ | 19.31 ± 5.43 ¶ |
| Durnin and Womersley | 15.62 ± 3.86 ¶ | 12.39 ± 2.72 * ¶ | 20.03 ± 2.73 ¶ | 19.69 ± 3.02 ¶ |
| Jackson and Pollock (3SKF) | 8.02 ± 3.56 ¶ | 7.33 ± 2.78 ¶ | 14.42 ± 2.67 ¶ | 15.67 ± 4.17 ¶ |
| Jackson and Pollock (7SKF) | 8.14 ± 3.42 ¶ | 7.69 ± 2.67 | 13.95 ± 2.27 ¶ | 15.21 ± 3.32 |
| Lohman | 11.31 ± 3.54 | 10.59 ± 2.79 | 10.71 ± 2.21 | 11.74 ± 3.28 |
| Forsyth and Sinning (2SKF) | 12.52 ± 5.60 | 11.79 ± 4.12 | 10.29 ± 2.67 | 11.52 ± 3.86 |
| Forsyth and Sinning (4SKF) | 12.21 ± 5.71 | 11.20 ± 4.20 | 10.78 ± 3.07 | 12.37 ± 4.93 |
| Stewart and Hannan | 8.61 ± 4.81 | 8.04 ± 3.98 ¶ | 11.16 ± 3.53 | 12.62 ± 5.46 ¶ |
| Thorland et al. (3SKF) | 10.55 ± 4.37 | 9.78 ± 3.61 | 9.96 ± 3.07 | 10.93 ± 4.03 |
| Thorland et al. (3SKF)-2 | 11.67 ± 3.55 | 10.95 ± 2.80 | 11.06 ± 2.22 | 12.09 ± 3.29 |
| White et al. | 7.98 ± 2.56 | 7.38 ± 1.74 ¶ | 8.90 ± 1.30 | 9.58 ± 2.36 ¶ |
| Evans et al. (3SKF) | 10.53 ± 3.19 ¶ | 9.67 ± 2.69 ¶ | 18.22 ± 2.30 ¶ | 19.26 ± 3.80 ¶ |
| Evans et al. (7SKF) | 10.22 ± 3.07 ¶ | 9.46 ± 2.28 ¶ | 18.25 ± 1.71 ¶ | 19.13 ± 2.62 ¶ |
| Skinfolds | Coefficient of Variation (%) | Absolute (mm) | Relative (%) |
|---|---|---|---|
| Biceps | 0.62 | 0.09 | 1.96 |
| Triceps | 0.62 | 0.07 | 0.73 |
| Subscapular | 0.55 | 0.08 | 0.79 |
| Iliac crest | 0.97 | 0.14 | 1.27 |
| Abdominal | 0.65 | 0.09 | 0.89 |
| Midaxillary | 0.77 | 1.11 | 1.01 |
| Chest | 0.82 | 0.09 | 1.57 |
| Anterior Thigh | 0.36 | 1.04 | 1.25 |
| Medial Calf | 1.70 | 0.14 | 1.56 |
| Male Olympic Wrestlers (n = 61) | ||||||
|---|---|---|---|---|---|---|
| <18 Age (n = 33) | ≥18 Age (n = 28) | |||||
| Estimates of BF% | Correlation (95 CI%) | Bias (±LoA) | Standardized Differences (95% CI) | Correlation (95 CI%) | Bias (±LoA) | Standardized Differences (95% CI) |
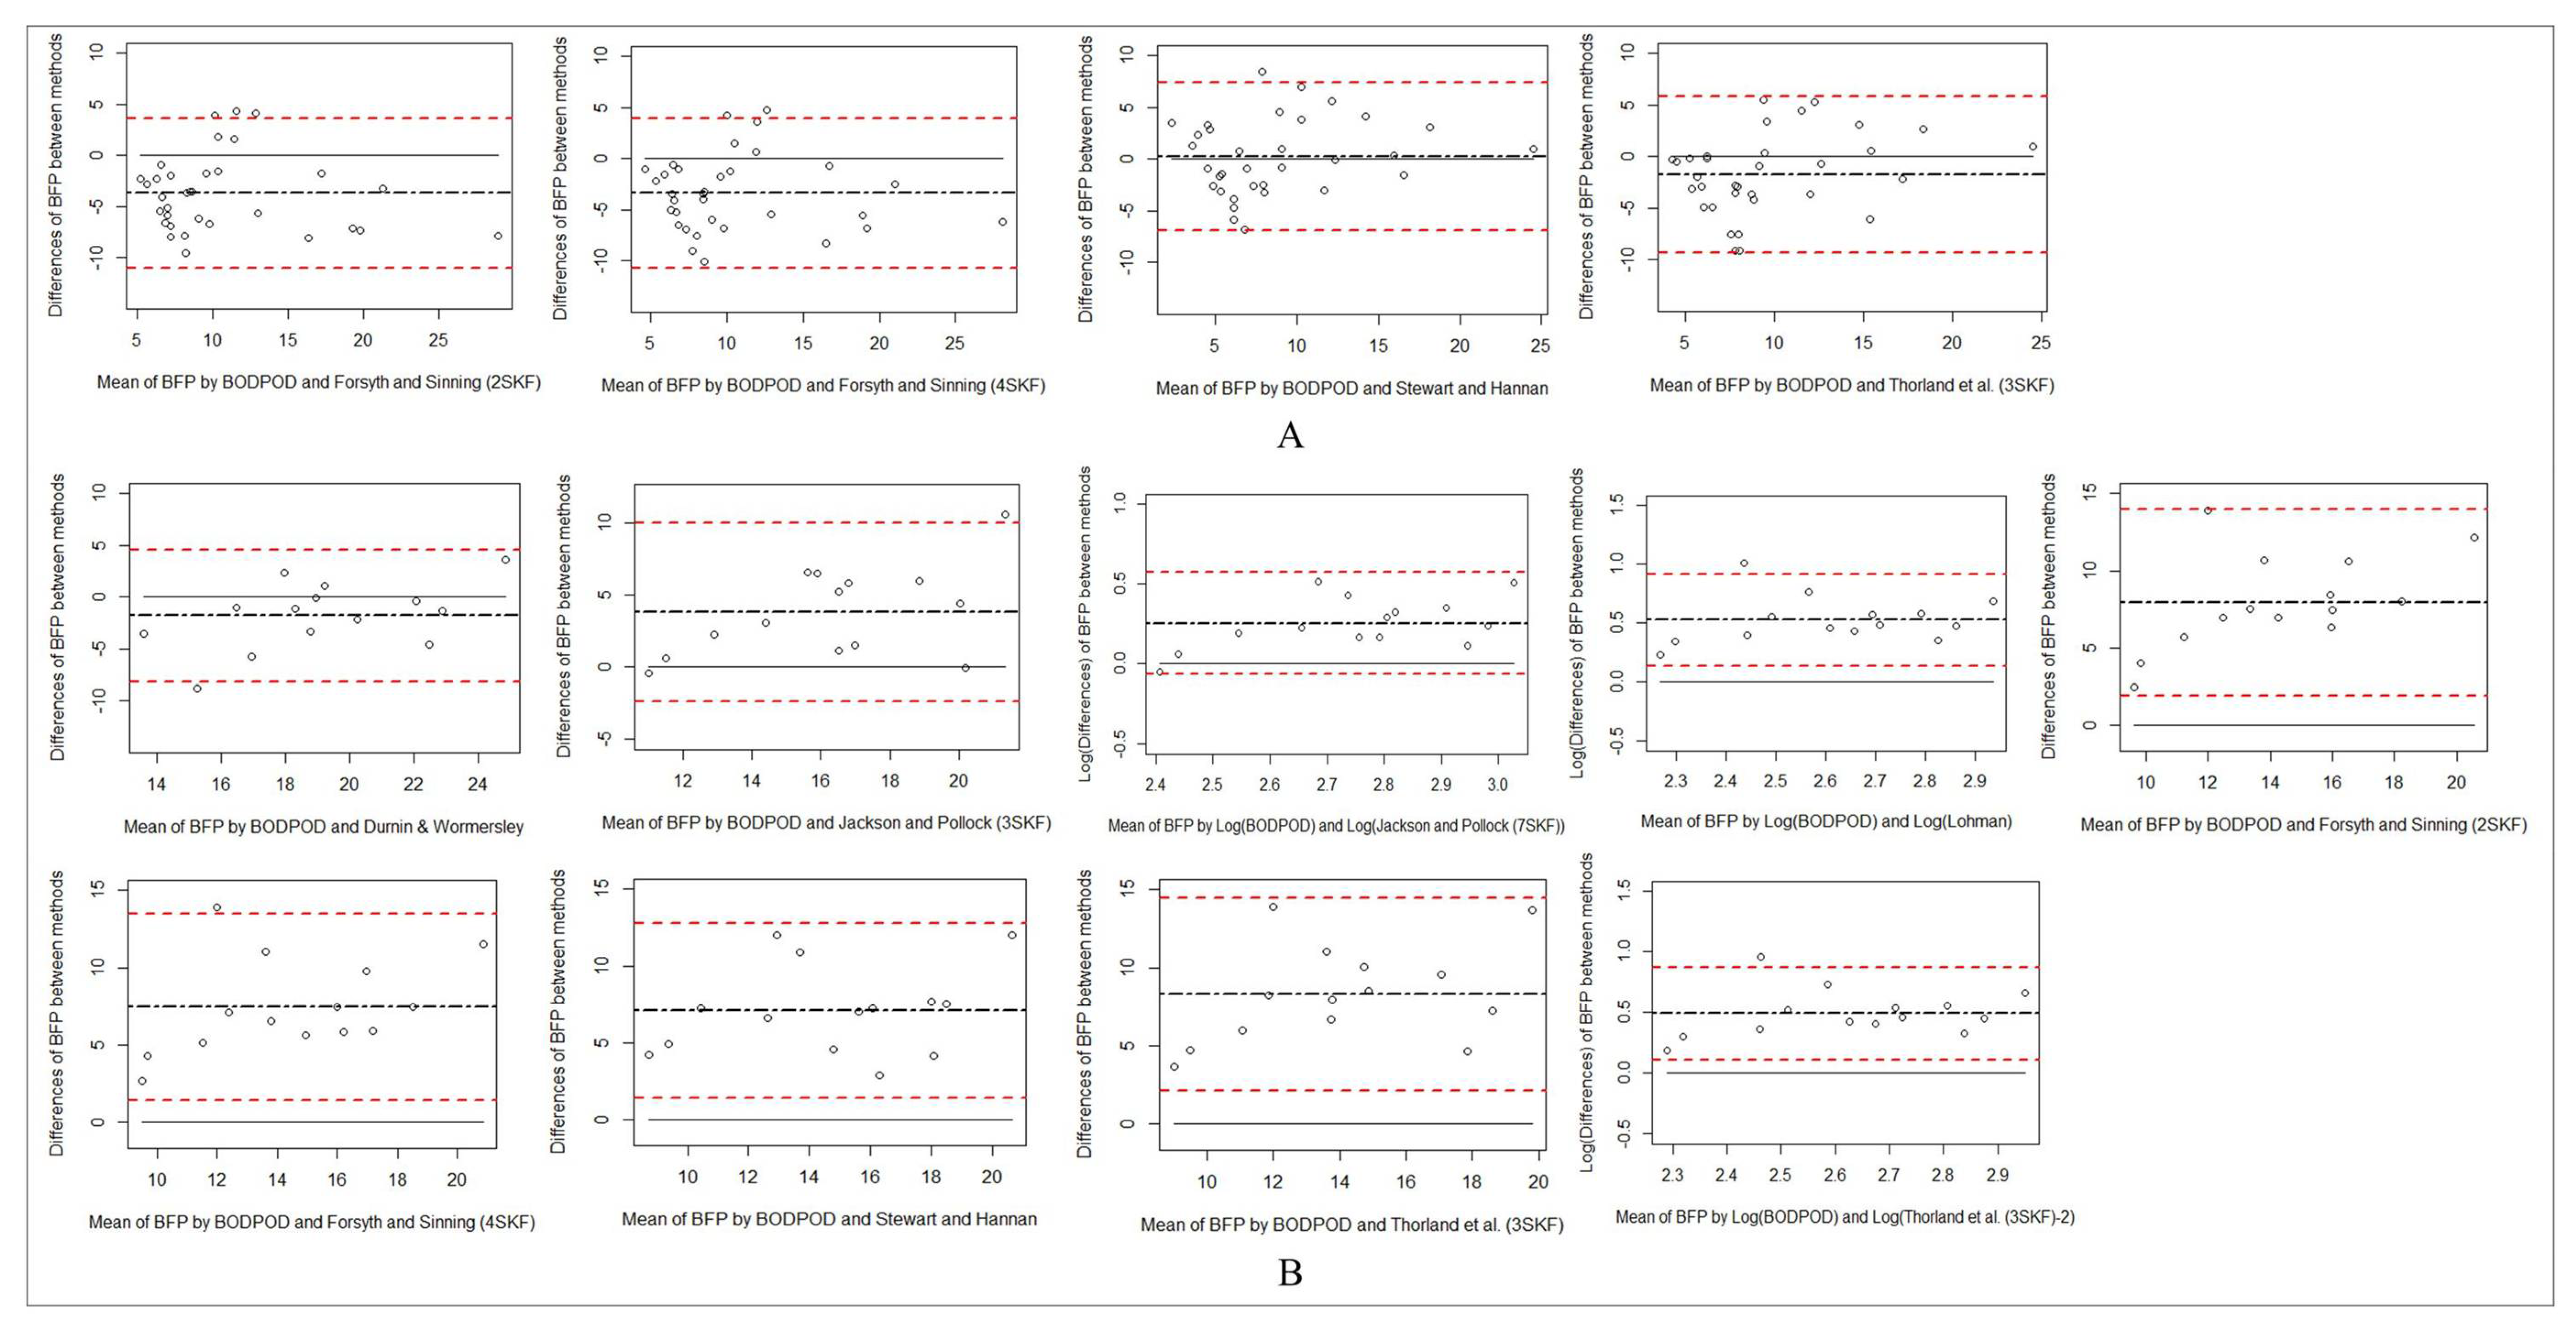
| Durnin and Womersley | 0.57 (0.26; 0.77) | −6.76 *(±7.20) a | −1.8 (−2.38; −1.26) | 0.65 (0.32; 0.84) | −4.23 * (±6.49) a | −1.24 (−1.76; −0.76) |
| Jackson and Pollock (3SKF) | 0.54 (0.19; 0.78) | 0.82 (±6.70) a | 0.24 (−0.11; 0.58) | 0.76 (0.53; 0.88) | 0.82 (±5.09) a | 0.31 (−0.07; 0.68) |
| Jackson and Pollock (7SKF) | 0.52 (0.15; 0.78) | 0.70 (±6.87) a | 0.19 (−0.15; 0.54) | 0.77 (0.55; 0.89) | 0.46 (±5.27) a | 0.17 (−0.20; 0.54) |
| Lohman | 0.49 (0.11; 0.74) | −2.47 * (±7.01) a | −0.67 (−1.06; −0.30) | 0.75 (0.50; 0.88) | −2.44 * (±5.20) a | −0.89 (−1.34; −0.47) |
| Forsyth and Sinning (2SKF) | 0.46 (0.09; 0.74) | −3.68 * (±7.35) | −0.96 (−1.38; −0.55) | 0.68 (0.41; 0.85) | −3.63 * (±5.23) | −1.32 (−1.85; −0.83) |
| Forsyth and Sinning (4SKF) | 0.48 (0.11; 0.75) | −3.36 * (±7.32) | −0.88 (−1.29; −0.48) | 0.74 (0.47; 0.87) | −3.05 * (±5.11) | −1.14 (−1.63; −0.68) |
| Stewart and Hannan | 0.52 (0.16; 0.76) | 0.23 (±7.18) | 0.06 (−0.28; 0.40) | 0.78 (0.55; 0.89) | 0.12 (±4.77) | 0.05 (−0.32; 0.41) |
| Thorland et al. (3SKF) | 0.50 (0.13; 0.75) | −1.71 * (±7.57) | −0.43 (−0.79; −0.08) | 0.76 (0.51; 0.89) | −1.63 * (±5.53) | −0.56 (−0.96; −0.17) |
| Thorland et al. (3SKF)−2 | 0.49 (0.13; 0.75) | −2.83 * (±7.01) a | −0.77 (−1.17; −0.39) | 0.75 (0.49; 0.88) | −2.80 * (±5.20) a | −1.02 (−1.50; −0.58) |
| White et al. | 0.56 (0.19; 0.80) | 0.87 (±7.43) a | 0.22 (−0.12; 0.57) | 0.71 (0.44; 0.86) | 0.77 (±6.25) a | 0.24 (−0.13; 0.61) |
| Evans et al. (3SKF) | 0.54 (0.16; 0.79) | −1.69 * (±7.07)a | −0.46 (−0.82; −0.10) | 0.80 (0.60; 0.89) | −1.52 * (±5.17) a | −0.56 (−0.96; −0.17) |
| Evans et al. (7SKF) | 0.53 (0.17; 0.79) | −1.38 * (±6.99)a | −0.38 (−0.73; −0.03) | 0.78 (0.55; 0.90) | −1.31 * (±5.54) a | −0.45 (−0.84; −0.07) |
| Female Olympic Wrestlers (n = 25) | ||||||
| <18 age (n = 15) | ≥18 age (n = 10) | |||||
| Estimates of BF% | Correlation (95 CI%) | Bias (±LoA) | Standardized Differences (95% CI) | Correlation (95 CI%) | Bias (±LoA) | Standardized Differences (95% CI) |
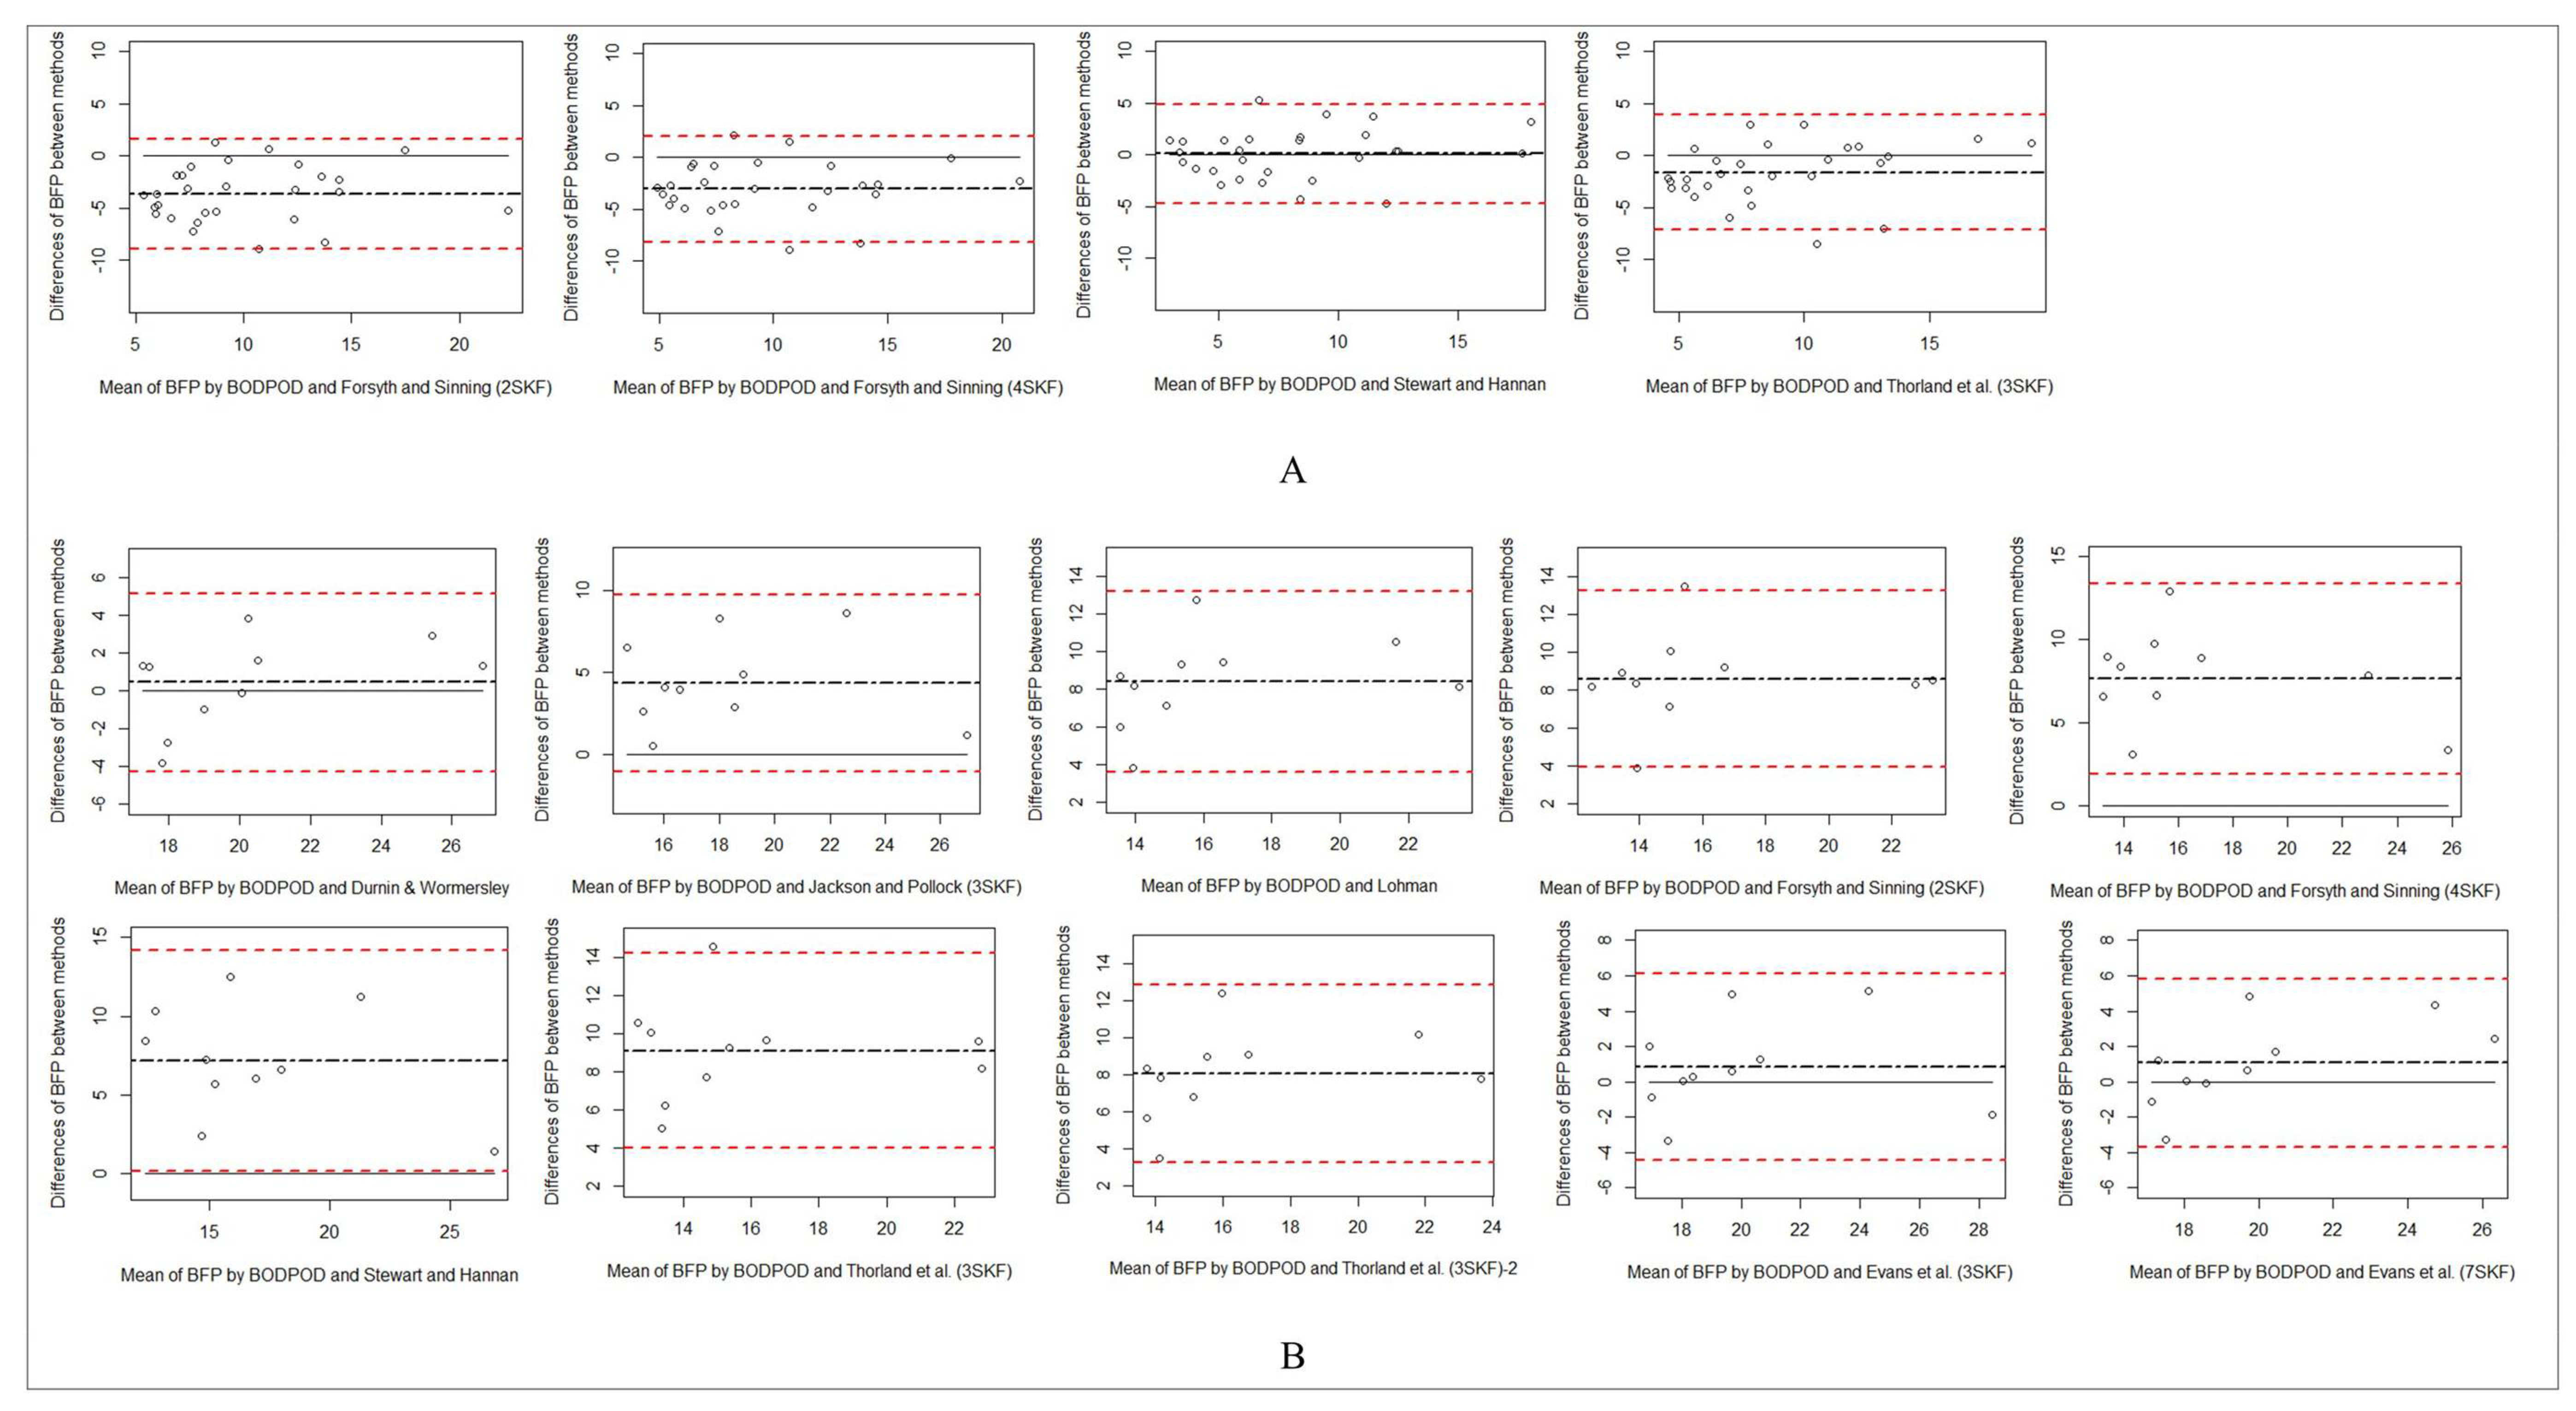
| Durnin and Womersley | 0.62 (0.14; 0.87) | −1.80 (±6.41) | −0.52 (−1.08; 0.02) | 0.81 (0.36; 0.95) | 0.46 (±4.70) | 0.18 (−0.42; 0.78) |
| Jackson and Pollock (3SKF) | 0.65 (0.19; 0.88) | 3.81 * (±6.20) | 1.13 (0.48; 1.84) | 0.58 (−0.17; 0.99) | 4.34 * (±5.41) | 1.44 (0.59; 2.41) |
| Jackson and Pollock (7SKF) | 0.73 (0.33; 0.91) | 1.28 * (±1.37) ¥ | 1.37 (0.66; 2.15) | 0.81 (0.38; 0.95) | 4.91 * (±4.61) | 1.91 (0.91; 3.09) |
| Lohman | 0.68 (0.24; 0.89) | 1.69 * (±1.47) ¥ | 2.27 (1.32; 3.38) | 0.42 (−0.45; 0.96) | 8.41 * (±4.78) | 3.15 (1.69; 4.93) |
| Forsyth and Sinning (2SKF) | 0.68 (0.23; 0.89) | 7.95 * (±6.04) | 2.43 (1.42; 3.59) | 0.54 (−0.25; 1.00) | 8.61 * (±4.66) | 3.31 (1.79; 5.17) |
| Forsyth and Sinning (4SKF) | 0.68 (0.23; 0.89) | 7.45 * (±6.03) | 2.28 (1.32; 3.38) | 0.42 (−0.46; 0.96) | 7.65 * (±5.74) | 2.39 (1.21; 3.79) |
| Stewart and Hannan | 0.71 (0.36; 0.92) | 7.07 * (±5.68) | 2.3 (1.33; 3.41) | 0.73 (0.19; 0.93) | 7.18 * (±7.03) | 1.83 (0.85; 2.97) |
| Thorland et al. (3SKF) | 0.66 (0.20; 0.88) | 8.27 * (±6.17) | 2.47 (1.45; 3.65) | 0.50 (−0.30; 0.92) | 9.10 * (±5.10) | 3.20 (1.72; 5.00) |
| Thorland et al. (3SKF)−2 | 0.68 (0.24; 0.89) | 1.64 * (±1.47) ¥ | 2.17 (1.24; 3.23) | 0.42 (−0.48; 0.96) | 8.05 * (±4.78) | 3.02 (1.61; 4.73) |
| White et al. | 0.71 (0.29; 0.90) | 9.33 * (±6.62) a | 2.6 (1.54; 3.83) | 0.78 (0.30; 0.95) | 2.09 * (±1.32) ¥ | 3.66 (2.00; 5.69) |
| Evans et al. (3SKF) | 0.67 (0.22; 0.89) | 0.01 (±6.16) a | 0.004 (−0.51; 0.52) | 0.59 (−0.18; 1.00) | 0.83 (±5.28) | 0.28 (−0.32; 0.90) |
| Evans et al. (7SKF) | 0.73 (0.32; 0.91) | −0.01 (±6.19) a | −0.004 (−0.52; 0.51) | 0.82 (0.39; 0.96) | 1.07 (±4.76) | 0.40 (−0.21; 1.04) |
| Variable | r | p |
|---|---|---|
| Skinfolds | ||
| Biceps | −0.012 | 0.912 |
| Triceps | 0.514 | 0.001 |
| Subscapular | 0.282 | 0.009 |
| Iliac crest | 0.442 | 0.001 |
| Abdominal | 0.448 | 0.001 |
| Midaxillary | 0.359 | 0.001 |
| Chest | 0.258 | 0.017 |
| Anterior thigh | 0.684 | 0.001 |
| Medial calf | 0.290 | 0.007 |
| Sum of Skinfolds | ||
| Sum of 2 skinfolds (mm) a | 0.396 | 0.001 |
| Sum of 3 skinfolds-1 (mm) b | 0.460 | 0.001 |
| Sum of 3 skinfolds-2 (mm) c | 0.483 | 0.001 |
| Sum of 4 skinfolds-1 (mm) d | 0.464 | 0.001 |
| Sum of 7 skinfolds (mm) e | 0.551 | 0.001 |
| Model | R2 | Adjusted R2 | SEE | R2 Change | F | F Change | Significant F Change |
|---|---|---|---|---|---|---|---|
| 1 | 0.639 | 0.635 | 3.943 | 0.639 | 133.1 | 133.1 | <0.001 |
| 2 | 0.832 | 0.827 | 2.711 | 0.193 | 183.1 | 84.705 | <0.001 |
| 3 | 0.838 | 0.831 | 2.682 | 0.006 | 125.6 | 2.5991 | 0.1112 |
| 4 | 0.844 | 0.835 | 2.647 | 0.006 | 97.42 | 2.929 | 0.0913 |
| 5 | 0.849 | 0.839 | 2.62 | 0.005 | 80.07 | 2.511 | 0.1175 |
| 6 | 0.852 | 0.84 | 2.613 | 0.003 | 67.28 | 1.351 | 0.249 |
| 7 | 0.852 | 0.837 | 2.631 | 0 | 56.92 | 0.0792 | 0.7792 |
Publisher’s Note: MDPI stays neutral with regard to jurisdictional claims in published maps and institutional affiliations. |
© 2021 by the authors. Licensee MDPI, Basel, Switzerland. This article is an open access article distributed under the terms and conditions of the Creative Commons Attribution (CC BY) license (https://creativecommons.org/licenses/by/4.0/).
Share and Cite
Devrim-Lanpir, A.; Badem, E.A.; Işık, H.; Çakar, A.N.; Kabak, B.; Akınoğlu, B.; Kocahan, T.; Hasanoğlu, A.; Rosemann, T.; Knechtle, B. Which Body Density Equations Calculate Body Fat Percentage Better in Olympic Wrestlers?—Comparison Study with Air Displacement Plethysmography. Life 2021, 11, 707. https://doi.org/10.3390/life11070707
Devrim-Lanpir A, Badem EA, Işık H, Çakar AN, Kabak B, Akınoğlu B, Kocahan T, Hasanoğlu A, Rosemann T, Knechtle B. Which Body Density Equations Calculate Body Fat Percentage Better in Olympic Wrestlers?—Comparison Study with Air Displacement Plethysmography. Life. 2021; 11(7):707. https://doi.org/10.3390/life11070707
Chicago/Turabian StyleDevrim-Lanpir, Aslı, Ebru Arslanoğlu Badem, Hatice Işık, Aslıhan Nefes Çakar, Banu Kabak, Bihter Akınoğlu, Tuğba Kocahan, Adnan Hasanoğlu, Thomas Rosemann, and Beat Knechtle. 2021. "Which Body Density Equations Calculate Body Fat Percentage Better in Olympic Wrestlers?—Comparison Study with Air Displacement Plethysmography" Life 11, no. 7: 707. https://doi.org/10.3390/life11070707
APA StyleDevrim-Lanpir, A., Badem, E. A., Işık, H., Çakar, A. N., Kabak, B., Akınoğlu, B., Kocahan, T., Hasanoğlu, A., Rosemann, T., & Knechtle, B. (2021). Which Body Density Equations Calculate Body Fat Percentage Better in Olympic Wrestlers?—Comparison Study with Air Displacement Plethysmography. Life, 11(7), 707. https://doi.org/10.3390/life11070707