
Waist Circumference and BMI Are Strongly Correlated with MRI-Derived Fat Compartments in Young Adults

 ,
,  ,
, 


Abstract
:1. Introduction
2. Materials and Methods
2.1. Participants
2.2. Ethical Considerations
2.3. Anthropometry
2.4. Biochemical Analysis of Blood
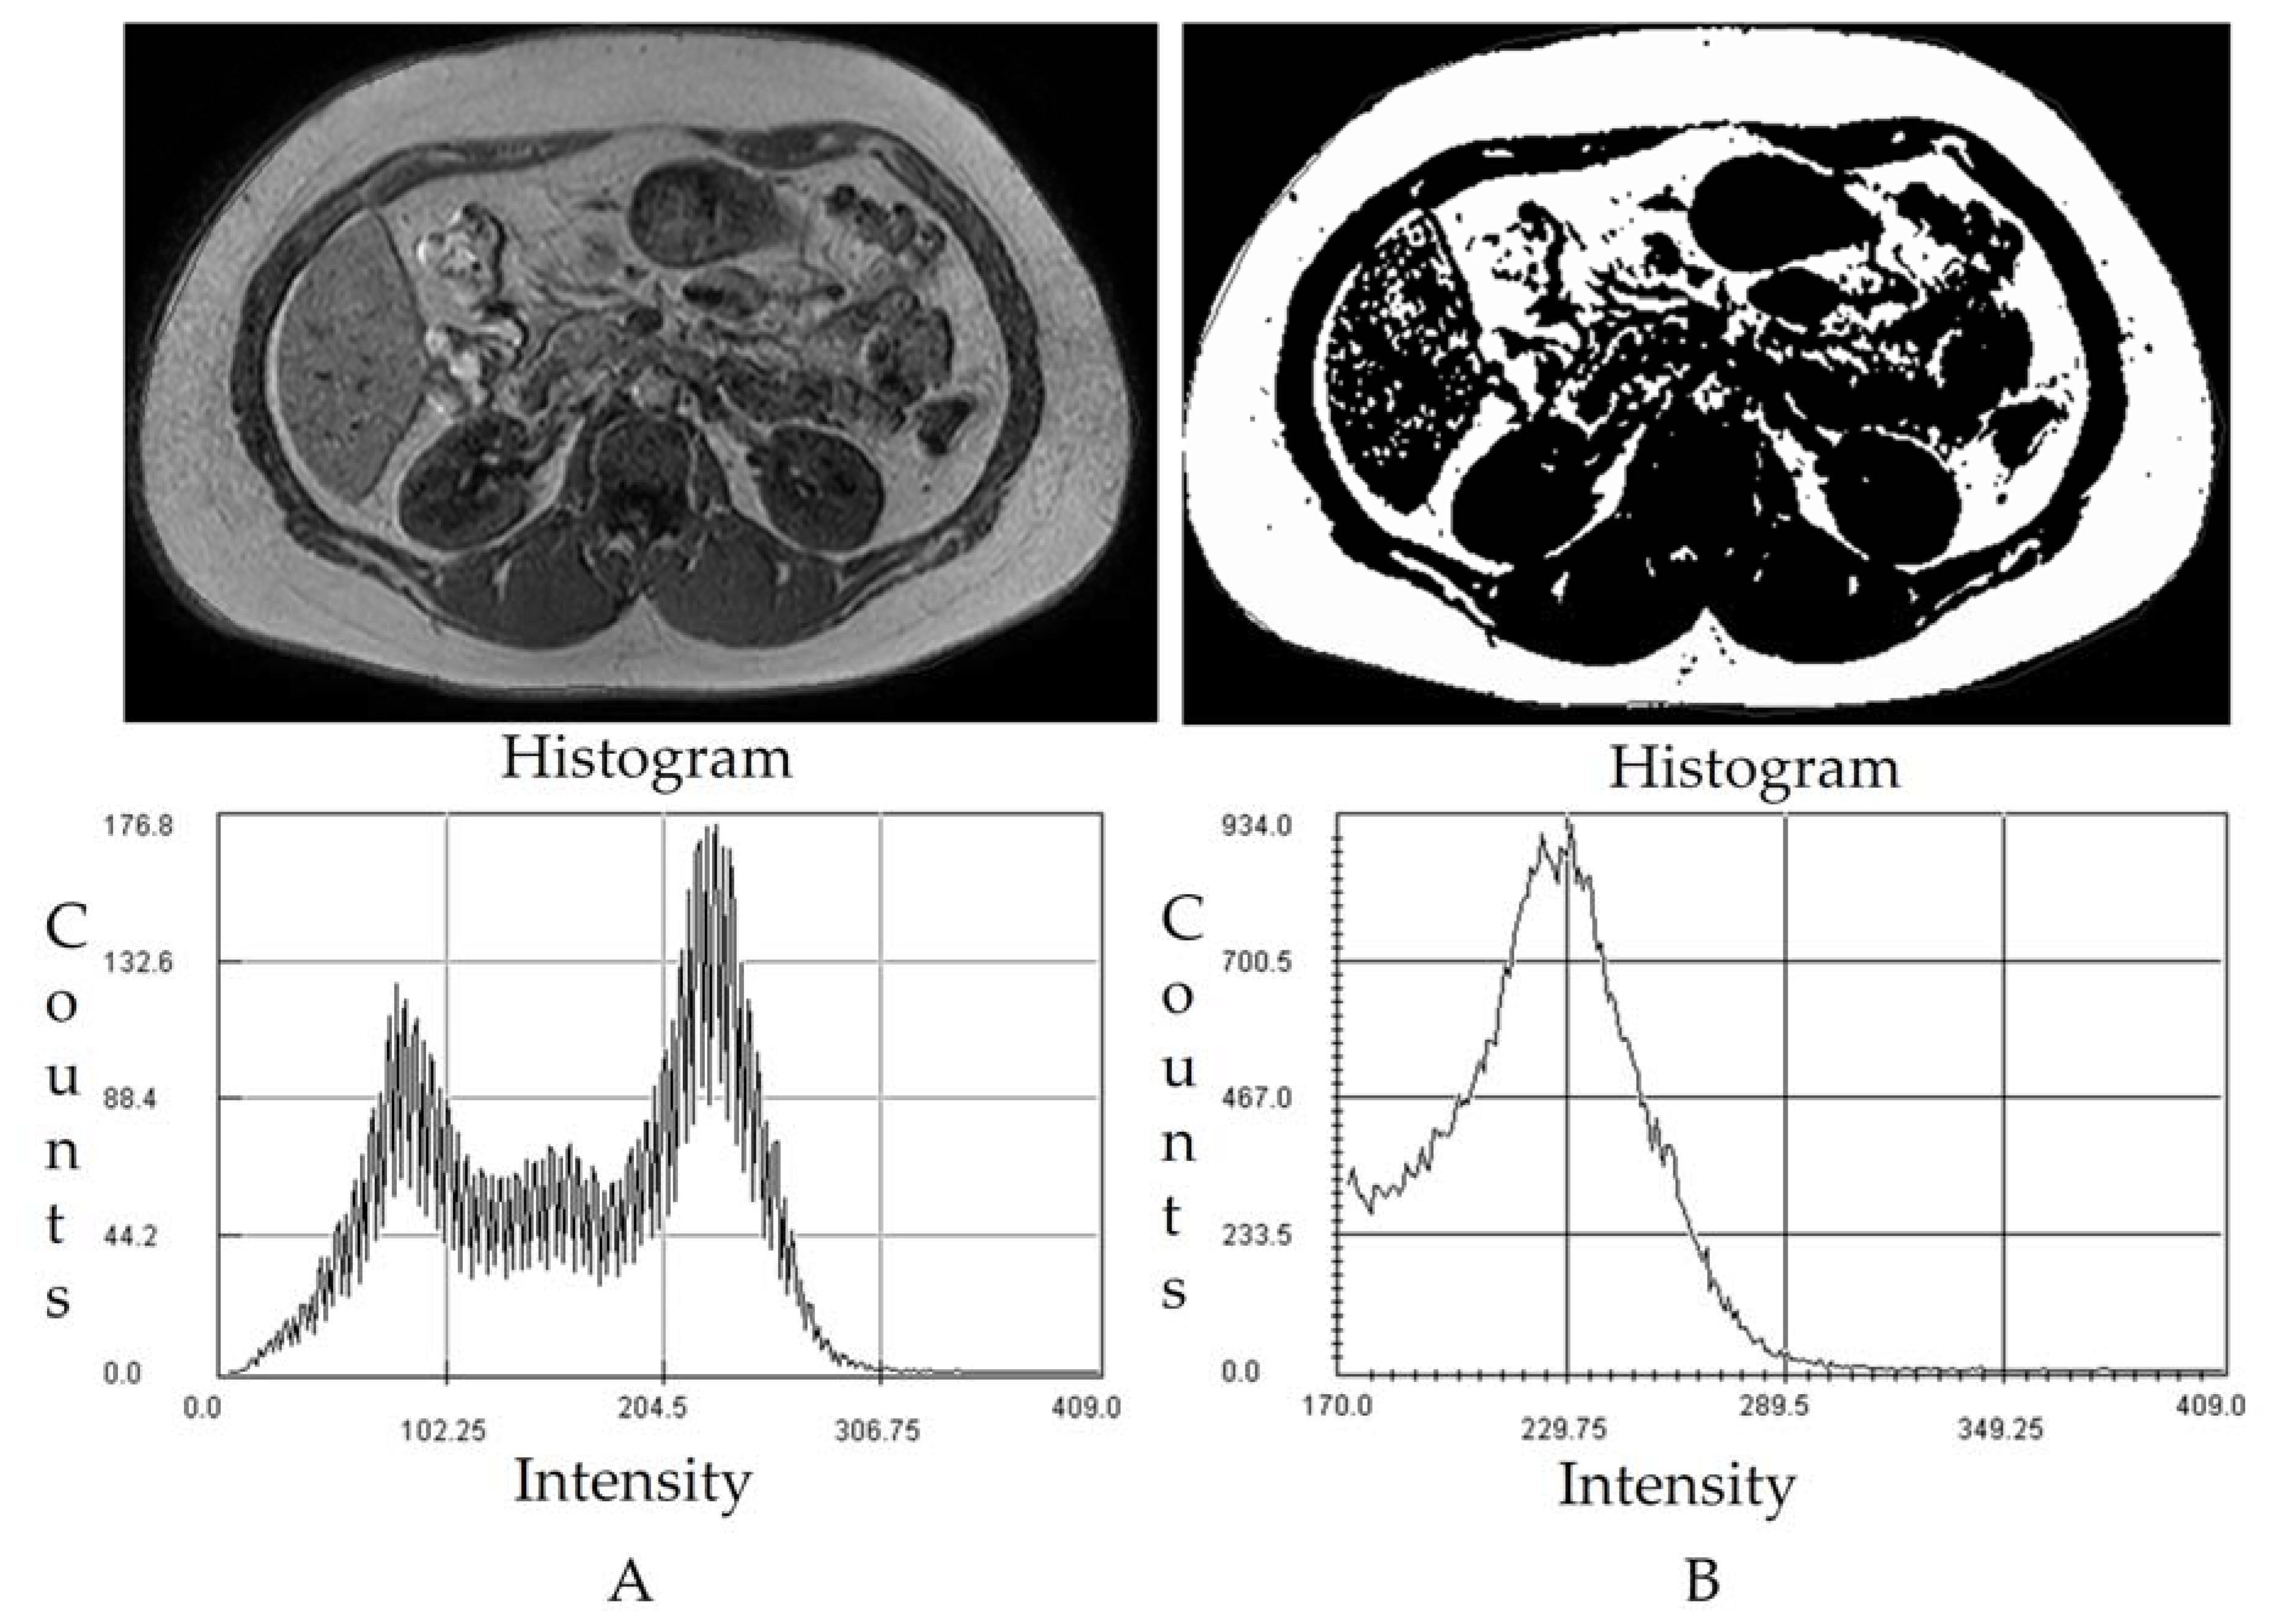
2.5. MRI Images Acquisition and Image Processing
2.6. Statistical Analysis
3. Results
3.1. Anthropometric
3.2. Abdominal Fat Compartments and Laboratory Characteristics
4. Discussion
Limitations and Directions for Future Research
5. Conclusions
Author Contributions
Funding
Institutional Review Board Statement
Informed Consent Statement
Acknowledgments
Conflicts of Interest
References
- Poobalan, A.; Aucott, L. Obesity Among Young Adults in Developing Countries: A Systematic Overview. Curr. Obes. Rep. 2016, 5, 2–13. [Google Scholar] [CrossRef] [PubMed] [Green Version]
- Thorpe, M.G.; Kestin, M.; Riddell, L.J.; Keast, R.S.; McNaughton, S.A. Diet quality in young adults and its association with food-related behaviours. Public Health Nutr. 2014, 17, 1767–1775. [Google Scholar] [CrossRef] [PubMed] [Green Version]
- Johnson, P.H.; Annesi, J.J. Factors Related to Weight Gain/Loss among Emerging Adults with Obesity. Am. J. Health Behav. 2018, 42, 3–16. [Google Scholar] [CrossRef]
- Liu, K.; Daviglus, M.L.; Loria, C.M.; Colangelo, L.A.; Spring, B.; Moller, A.C.; Lloyd-Jones, D.M. Healthy Lifestyle Through Young Adulthood and the Presence of Low Cardiovascular Disease Risk Profile in Middle Age. Circulation 2012, 125, 996–1004. [Google Scholar] [CrossRef] [PubMed] [Green Version]
- Zheng, Y.; Manson, J.E.; Yuan, C.; Liang, M.H.; Grodstein, F.; Stampfer, M.J.; Willett, W.C.; Hu, F.B. Associations of Weight Gain From Early to Middle Adulthood with Major Health Outcomes Later in Life. JAMA 2017, 318, 255–269. [Google Scholar] [CrossRef]
- Bondini, S.; Younossi, Z.M. Non-alcoholic fatty liver disease and hepatitis C infection. Minerva Gastroenterol. Dietol. 2006, 52, 135–143. [Google Scholar]
- Alberti, K.G.M.M.; Eckel, R.H.; Grundy, S.M.; Zimmet, P.Z.; Cleeman, J.I.; Donato, K.A.; Fruchart, J.-C.; James, W.P.T.; Loria, C.M.; Smith, S.C. Harmonizing the Metabolic Syndrome. Circulation 2009, 120, 1640–1645. [Google Scholar] [CrossRef] [Green Version]
- Westphal, S.A. Obesity, abdominal obesity, and insulin resistance. Clin. Cornerstone 2008, 9, 23–29. [Google Scholar] [CrossRef]
- Nolan, P.B.; Carrick-Ranson, G.; Stinear, J.W.; Reading, S.A.; Dalleck, L.C. Prevalence of metabolic syndrome and metabolic syndrome components in young adults: A pooled analysis. Prev. Med. Rep. 2017, 7, 211–215. [Google Scholar] [CrossRef]
- Eloi, J.C.; Epifanio, M.; de Goncalves, M.M.; Pellicioli, A.; Vieira, P.F.; Dias, H.B.; Bruscato, N.; Soder, R.B.; Santana, J.C.; Mouzaki, M.; et al. Quantification of Abdominal Fat in Obese and Healthy Adolescents Using 3 Tesla Magnetic Resonance Imaging and Free Software for Image Analysis. PLoS ONE 2017, 12, e0167625. [Google Scholar] [CrossRef]
- Golan, R.; Shelef, I.; Rudich, A.; Gepner, Y.; Shemesh, E.; Chassidim, Y.; Harman-Boehm, I.; Henkin, Y.; Schwarzfuchs, D.; Ben Avraham, S.; et al. Abdominal superficial subcutaneous fat: A putative distinct protective fat subdepot in type 2 diabetes. Diabetes Care 2012, 35, 640–647. [Google Scholar] [CrossRef] [Green Version]
- Micklesfield, L.K.; Goedecke, J.H.; Punyanitya, M.; Wilson, K.E.; Kelly, T.L. Dual-energy X-ray performs as well as clinical computed tomography for the measurement of visceral fat. Obesity 2012, 20, 1109–1114. [Google Scholar] [CrossRef]
- Tong, Y.; Udupa, J.K.; Torigian, D.A. Optimization of abdominal fat quantification on CT imaging through use of standardized anatomic space: A novel approach. Med. Phys. 2014, 41, 063501. [Google Scholar] [CrossRef] [PubMed] [Green Version]
- Schaudinn, A.; Linder, N.; Garnov, N.; Kerlikowsky, F.; Blüher, M.; Dietrich, A.; Schütz, T.; Karlas, T.; Kahn, T.; Busse, H. Predictive accuracy of single- and multi-slice MRI for the estimation of total visceral adipose tissue in overweight to severely obese patients. NMR Biomed. 2015, 28, 583–590. [Google Scholar] [CrossRef]
- Shen, W.; Punyanitya, M.; Wang, Z.; Gallagher, D.; St-Onge, M.P.; Albu, J.; Heymsfield, S.B.; Heshka, S. Total body skeletal muscle and adipose tissue volumes: Estimation from a single abdominal cross-sectional image. J. Appl. Physiol. 2004, 97, 2333–2338. [Google Scholar] [CrossRef] [PubMed] [Green Version]
- Hu, H.; Goran, M.; Nayak, K. Assessment of Abdominal Adiposity and Organ Fat with Magnetic Resonance Imaging. In Role of the Adipocyte in Development of Type 2 Diabetes; Croniger, C., Ed.; IntechOpen: London, UK, 2011. [Google Scholar]
- Klopfenstein, B.J.; Kim, M.S.; Krisky, C.M.; Szumowski, J.; Rooney, W.D.; Purnell, J.Q. Comparison of 3 T MRI and CT for the measurement of visceral and subcutaneous adipose tissue in humans. Br. J. Radiol. 2012, 85, e826–e830. [Google Scholar] [CrossRef] [PubMed] [Green Version]
- Pasanta, D.; Tungjai, M.; Chancharunee, S.; Sajomsang, W.; Kothan, S. Body mass index and its effects on liver fat content in overweight and obese young adults by proton magnetic resonance spectroscopy technique. World J. Hepatol. 2018, 10, 924–933. [Google Scholar] [CrossRef] [PubMed]
- Pasanta, D.; Htun, K.T.; Pan, J.; Tungjai, M.; Kaewjaeng, S.; Kim, H.; Kaewkhao, J.; Kothan, S. Magnetic Resonance Spectroscopy of Hepatic Fat from Fundamental to Clinical Applications. Diagnostics 2021, 11, 842. [Google Scholar] [CrossRef]
- Martin, S.S.; Blaha, M.J.; Elshazly, M.B.; Toth, P.P.; Kwiterovich, P.O.; Blumenthal, R.S.; Jones, S.R. Comparison of a novel method vs the Friedewald equation for estimating low-density lipoprotein cholesterol levels from the standard lipid profile. JAMA 2013, 310, 2061–2068. [Google Scholar] [CrossRef]
- Sathiyakumar, V.; Park, J.; Golozar, A.; Lazo, M.; Quispe, R.; Guallar, E.; Blumenthal, R.S.; Jones, S.R.; Martin, S.S. Fasting Versus Nonfasting and Low-Density Lipoprotein Cholesterol Accuracy. Circulation 2018, 137, 10–19. [Google Scholar] [CrossRef]
- Pasanta, D.; Chancharunee, S.; Tungjai, M.; Kim, H.J.; Kothan, S. Effects of obesity on the lipid and metabolite profiles of young adults by serum H-1-NMR spectroscopy. PeerJ 2019, 7, e7137. [Google Scholar] [CrossRef] [Green Version]
- Expert Panel on Detection, Evaluation. Executive Summary of the Third Report of the National Cholesterol Education Program (NCEP) Expert Panel on Detection, Evaluation, and Treatment of High Blood Cholesterol in Adults (Adult Treatment Panel III). JAMA 2001, 285, 2486–2497. [Google Scholar] [CrossRef] [PubMed]
- International Expert Committee. International Expert Committee report on the role of the A1C assay in the diagnosis of diabetes. Diabetes Care 2009, 32, 1327–1334. [Google Scholar] [CrossRef] [PubMed] [Green Version]
- Sezgin, M.; Sankur, B. Survey over Image Thresholding Techniques and Quantitative Performance Evaluation; SPIE: Bellingham, WA, USA, 2004; Volume 13, pp. 146–165. [Google Scholar]
- Romero-Saldaña, M.; Tauler, P.; Vaquero-Abellán, M.; López-González, A.-A.; Fuentes-Jiménez, F.-J.; Aguiló, A.; Álvarez-Fernández, C.; Molina-Recio, G.; Bennasar-Veny, M. Validation of a non-invasive method for the early detection of metabolic syndrome: A diagnostic accuracy test in a working population. BMJ Open 2018, 8, e020476. [Google Scholar] [CrossRef] [Green Version]
- Smith, J.D.; Borel, A.-L.; Nazare, J.-A.; Haffner, S.M.; Balkau, B.; Ross, R.; Massien, C.; Alméras, N.; Després, J.-P. Visceral Adipose Tissue Indicates the Severity of Cardiometabolic Risk in Patients with and without Type 2 Diabetes: Results from the INSPIRE ME IAA Study. J. Clin. Endocrinol. Metab. 2012, 97, 1517–1525. [Google Scholar] [CrossRef] [Green Version]
- Allison, D.B.; Kotler, D.P.; Janssen, I.; Heymsfield, S.B.; Ross, R. Body mass index and waist circumference independently contribute to the prediction of nonabdominal, abdominal subcutaneous, and visceral fat. Am. J. Clin. Nutr. 2002, 75, 683–688. [Google Scholar] [CrossRef] [Green Version]
- Borruel, S.; Moltó, J.F.; Alpañés, M.; Fernández-Durán, E.; Álvarez-Blasco, F.; Luque-Ramírez, M.; Escobar-Morreale, H.F. Surrogate Markers of Visceral Adiposity in Young Adults: Waist Circumference and Body Mass Index Are More Accurate than Waist Hip Ratio, Model of Adipose Distribution and Visceral Adiposity Index. PLoS ONE 2014, 9, e114112. [Google Scholar] [CrossRef] [PubMed] [Green Version]
- Sommer, I.; Teufer, B.; Szelag, M.; Nussbaumer-Streit, B.; Titscher, V.; Klerings, I.; Gartlehner, G. The performance of anthropometric tools to determine obesity: A systematic review and meta-analysis. Sci. Rep. 2020, 10, 12699. [Google Scholar] [CrossRef]
- Xiang, M.; Hu, H.; Imai, T.; Nishihara, A.; Sasaki, N.; Ogasawara, T.; Hori, A.; Nakagawa, T.; Yamamoto, S.; Honda, T.; et al. Association between anthropometric indices of obesity and risk of cardiovascular disease in Japanese men. J. Occup. Health 2020, 62, e12098. [Google Scholar] [CrossRef] [Green Version]
- Zhang, Y.; Gu, Y.; Wang, N.; Zhao, Q.; Ng, N.; Wang, R.; Zhou, X.; Jiang, Y.; Wang, W.; Zhao, G. Association between anthropometric indicators of obesity and cardiovascular risk factors among adults in Shanghai, China. BMC Public Health 2019, 19, 1–9. [Google Scholar] [CrossRef]
- Beraldo, R.A.; Meliscki, G.C.; Silva, B.R.; Navarro, A.M.; Bollela, V.R.; Schmidt, A.; Foss-Freitas, M.C. Comparing the ability of anthropometric indicators in identifying metabolic syndrome in HIV patients. PLoS ONE 2016, 11, e0149905. [Google Scholar] [CrossRef]
- Burgos, M.S.; Burgos, L.T.; Camargo, M.D.; Franke, S.I.R.; Prá, D.; Silva, A.M.V.d.; Borges, T.S.; Todendi, P.F.; Reckziegel, M.B.; Reuter, C.P. Relationship between anthropometric measures and cardiovascular risk factors in children and adolescents. Arq. Bras. Cardiol. 2013, 101, 288–296. [Google Scholar] [CrossRef]
- Bjorntorp, P. “Portal” adipose tissue as a generator of risk factors for cardiovascular disease and diabetes. Arteriosclerosis 1990, 10, 493–496. [Google Scholar] [CrossRef] [PubMed] [Green Version]
- Luo, Y.; Ma, X.; Shen, Y.; Hao, Y.; Hu, Y.; Xiao, Y.; Bao, Y.; Jia, W. Positive Relationship between Serum Low-Density Lipoprotein Cholesterol Levels and Visceral Fat in a Chinese Nondiabetic Population. PLoS ONE 2014, 9, e112715. [Google Scholar] [CrossRef]
- Sukkriang, N.; Chanprasertpinyo, W.; Wattanapisit, A.; Punsawad, C.; Thamrongrat, N.; Sangpoom, S. Correlation of body visceral fat rating with serum lipid profile and fasting blood sugar in obese adults using a noninvasive machine. Heliyon 2021, 7, e06264. [Google Scholar] [CrossRef] [PubMed]
- Hoenig, M.R.; Cowin, G.; Buckley, R.; McHenery, C.; Coulthard, A. Low density lipoprotein cholesterol is inversely correlated with abdominal visceral fat area: A magnetic resonance imaging study. Lipids Health Dis. 2011, 10, 1–6. [Google Scholar] [CrossRef] [PubMed] [Green Version]
- Sam, S.; Haffner, S.; Davidson, M.H.; D’Agostino, R.B.; Feinstein, S.; Kondos, G.; Perez, A.; Mazzone, T. Relationship of abdominal visceral and subcutaneous adipose tissue with lipoprotein particle number and size in type 2 diabetes. Diabetes 2008, 57, 2022–2027. [Google Scholar] [CrossRef] [PubMed] [Green Version]
- Doyle, S.L.; Donohoe, C.L.; Lysaght, J.; Reynolds, J.V. Visceral obesity, metabolic syndrome, insulin resistance and cancer. Proc. Nutr. Soc. 2012, 71, 181–189. [Google Scholar] [CrossRef] [Green Version]
- Magge, S.N.; Goodman, E.; Armstrong, S.C. The metabolic syndrome in children and adolescents: Shifting the focus to cardiometabolic risk factor clustering. Pediatrics 2017, 140. [Google Scholar] [CrossRef] [Green Version]
- Graffy, P.M.; Pickhardt, P.J. Quantification of hepatic and visceral fat by CT and MR imaging: Relevance to the obesity epidemic, metabolic syndrome and NAFLD. Br. J. Radiol. 2016, 89, 20151024. [Google Scholar] [CrossRef] [Green Version]
- Mantatzis, M.; Milousis, T.; Katergari, S.; Delistamatis, A.; Papachristou, D.N.; Prassopoulos, P. Abdominal adipose tissue distribution on MRI and diabetes. Acad. Radiol. 2014, 21, 667–674. [Google Scholar] [CrossRef] [PubMed]
- Huber, F.A.; Del Grande, F.; Rizzo, S.; Guglielmi, G.; Guggenberger, R. MRI in the assessment of adipose tissues and muscle composition: How to use it. Quant. Imaging Med. Surg. 2020, 10, 1636–1649. [Google Scholar] [CrossRef] [PubMed]


| N = 60 | Mean ± SD | ||
|---|---|---|---|
| Male/Female (27/33) | Male (27) | Female (33) | p-Value |
| AbdFat% | 33.91 ± 12.25 | 27.99 ± 12.72 | 0.073 |
| ScFat% | 22.48 ± 9.63 | 21.80 ± 9.99 | 0.791 |
| VisFat% | 10.63 ± 4.95 | 5.42 ± 3.41 | <0.001 * |
| Age (year) | 22.74 ± 2.10 | 22.21 ± 1.05 | 0.211 |
| BMI (kg/m2) | 28.03 ± 4.45 | 24.04 ± 5.65 | <0.05 * |
| WC (cm) | 93.13 ± 14.96 | 82.51 ± 14.59 | <0.05 * |
| HC (cm) | 102.96 ±11.69 | 97.41 ± 12.55 | 0.084 |
| W/H ratio | 0.90 ± 0.08 | 0.84 ± 0.06 | <0.05 * |
| FG (mg/dL) | 89.19 ± 5.81 | 85.91 ± 7.92 | 0.079 |
| Cho (mg/dL) | 200.96 ± 40.99 | 194.27 ± 44.13 | 0.549 |
| Tri (mg/dL) | 114.00 ± 56.62 | 84.73 ± 35.25 | <0.05 * |
| HDL (mg/dL) | 47.26 ± 9.02 | 57.73 ± 15.71 | <0.05 * |
| LDL (mg/dL) | 131.00 ± 35.27 | 118.57 ± 35.79 | 0.183 |
| HbA1c (%) | 5.26 ± 0.44 | 5.29 ± 0.68 | 0.817 |
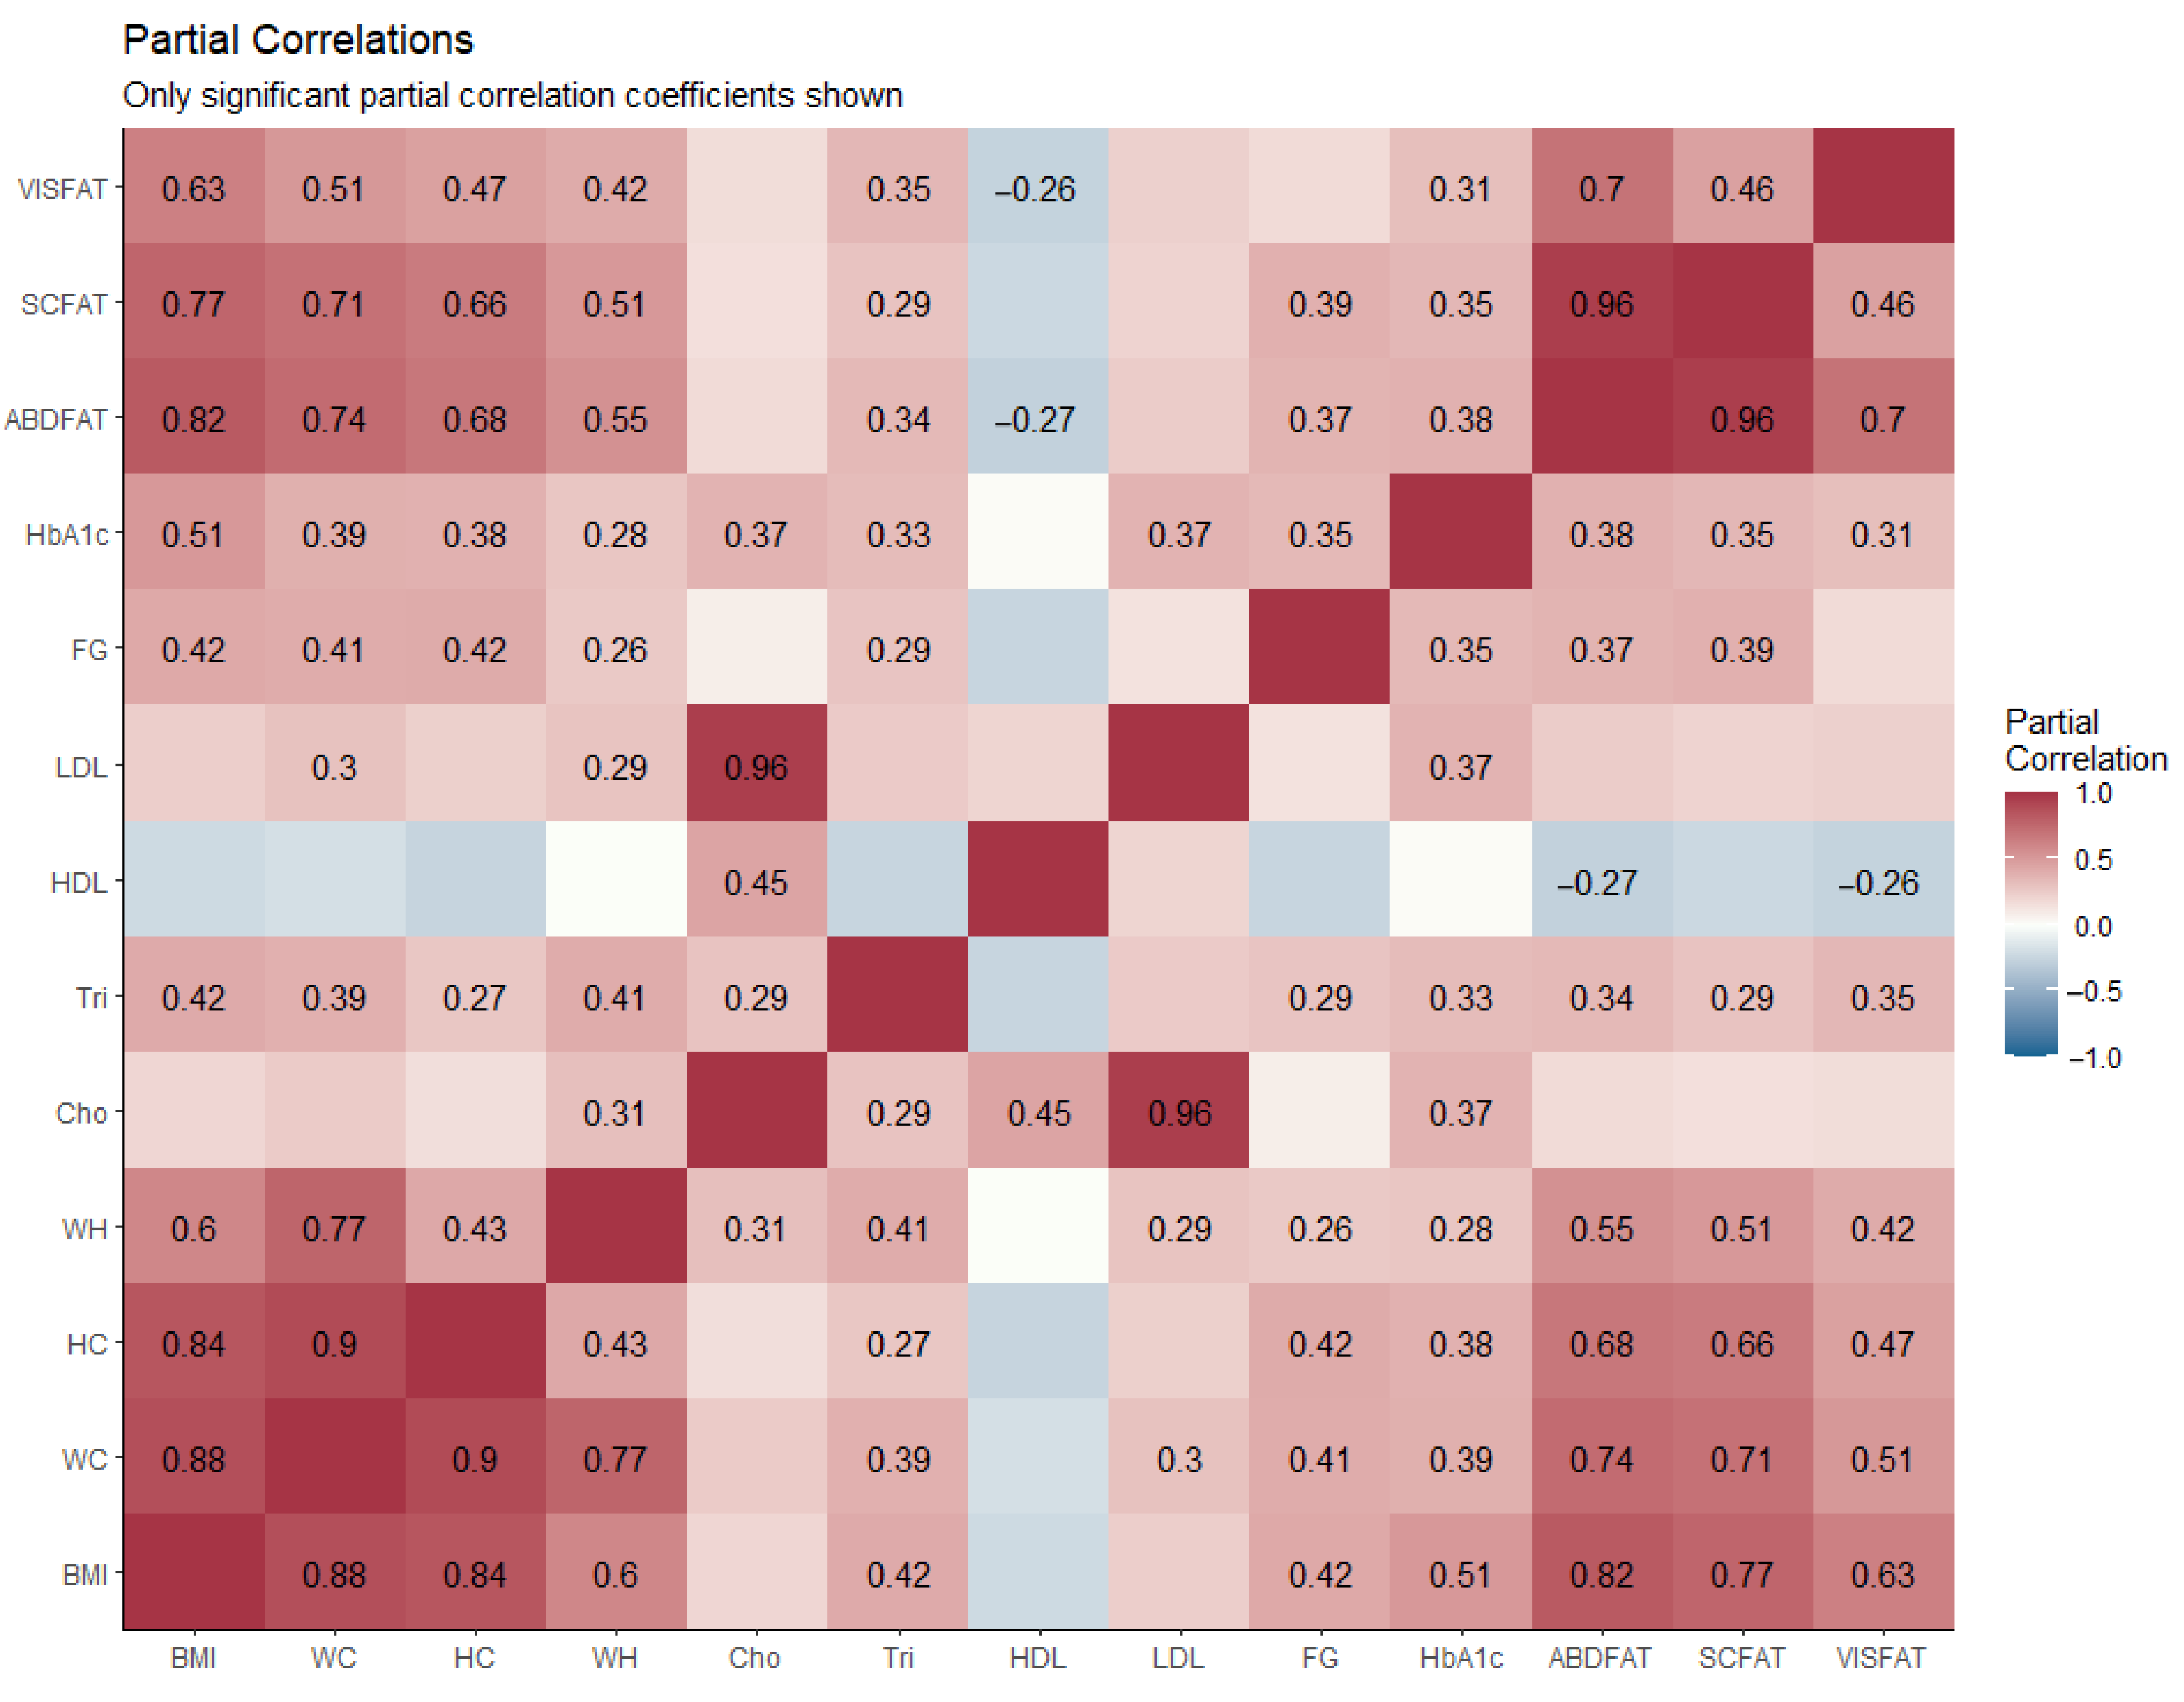
| N = 60 | Partial Correlation | |||||
|---|---|---|---|---|---|---|
| Gender (Male/Female) 27/33 | Abdominal Fat (%) | Subcutaneous Fat (%) | Visceral Fat (%) | |||
| R | p-Value | r | p-Value | r | p-Value | |
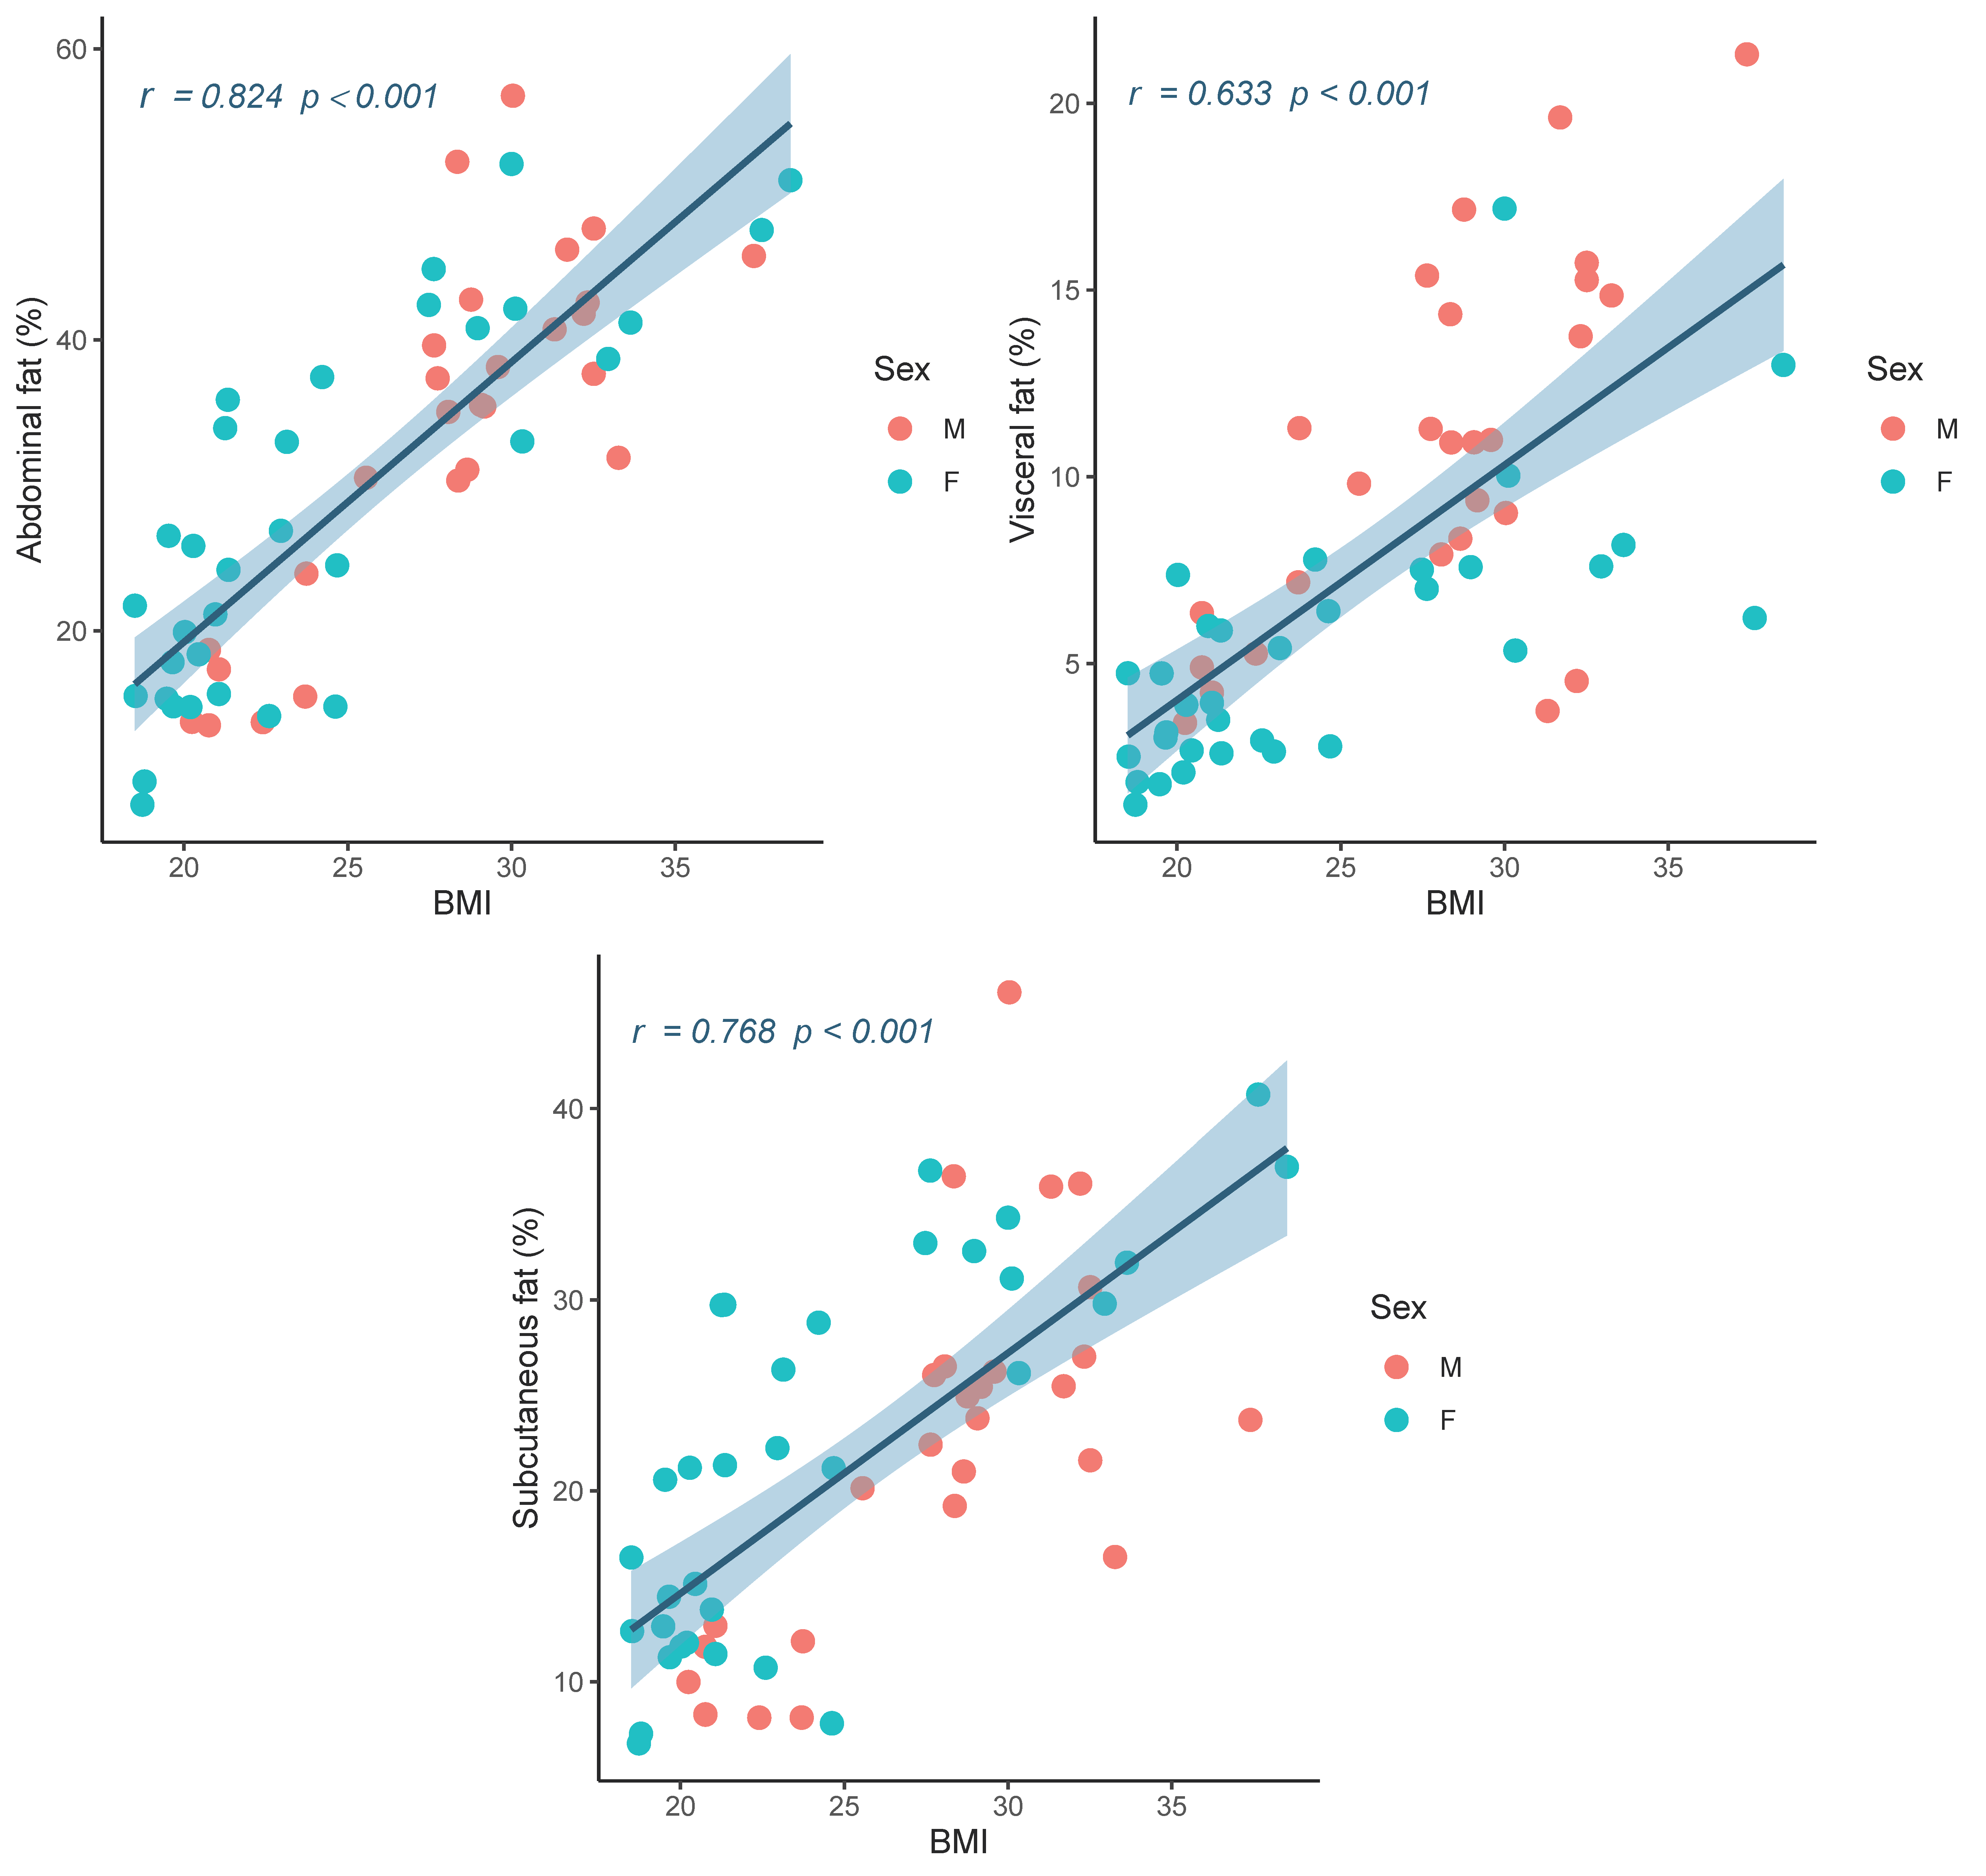
| BMI (kg/m2) | 0.824 | <0.001 * | 0.768 | <0.001 * | 0.633 | <0.001 * |
| WC (cm) | 0.737 | <0.001 * | 0.707 | <0.001 * | 0.512 | <0.001 * |
| HC (cm) | 0.680 | <0.001 * | 0.656 | <0.001 * | 0.467 | <0.001 * |
| W/H ratio | 0.547 | <0.001 * | 0.508 | <0.001 * | 0.416 | 0.001 * |
| FG (mg/dL) | 0.369 | 0.004 * | 0.386 | 0.003 * | 0.263 | 0.048 * |
| Cho (mg/dL) | 0.175 | 0.190 | 0.151 | 0.259 | 0.165 | 0.216 |
| Tri (mg/dL) | 0.343 | 0.008 * | 0.292 | 0.026 * | 0.352 | 0.007 * |
| HDL (mg/dL) | –0.270 | 0.040 * | –0.227 | 0.086 | –0.261 | 0.048 * |
| LDL (mg/dL) | 0.247 | 0.062 | 0.212 | 0.109 | 0.257 | 0.048 * |
| HbA1c (%) | 0.381 | 0.003 * | 0.351 | 0.007 * | 0.315 | 0.016 * |
Publisher’s Note: MDPI stays neutral with regard to jurisdictional claims in published maps and institutional affiliations. |
© 2021 by the authors. Licensee MDPI, Basel, Switzerland. This article is an open access article distributed under the terms and conditions of the Creative Commons Attribution (CC BY) license (https://creativecommons.org/licenses/by/4.0/).
Share and Cite
Pasanta, D.; Htun, K.T.; Pan, J.; Tungjai, M.; Kaewjaeng, S.; Chancharunee, S.; Tima, S.; Kim, H.J.; Kæwkhao, J.; Kothan, S. Waist Circumference and BMI Are Strongly Correlated with MRI-Derived Fat Compartments in Young Adults. Life 2021, 11, 643. https://doi.org/10.3390/life11070643
Pasanta D, Htun KT, Pan J, Tungjai M, Kaewjaeng S, Chancharunee S, Tima S, Kim HJ, Kæwkhao J, Kothan S. Waist Circumference and BMI Are Strongly Correlated with MRI-Derived Fat Compartments in Young Adults. Life. 2021; 11(7):643. https://doi.org/10.3390/life11070643
Chicago/Turabian StylePasanta, Duanghathai, Khin Thandar Htun, Jie Pan, Montree Tungjai, Siriprapa Kaewjaeng, Sirirat Chancharunee, Singkome Tima, Hong Joo Kim, Jakrapong Kæwkhao, and Suchart Kothan. 2021. "Waist Circumference and BMI Are Strongly Correlated with MRI-Derived Fat Compartments in Young Adults" Life 11, no. 7: 643. https://doi.org/10.3390/life11070643
APA StylePasanta, D., Htun, K. T., Pan, J., Tungjai, M., Kaewjaeng, S., Chancharunee, S., Tima, S., Kim, H. J., Kæwkhao, J., & Kothan, S. (2021). Waist Circumference and BMI Are Strongly Correlated with MRI-Derived Fat Compartments in Young Adults. Life, 11(7), 643. https://doi.org/10.3390/life11070643