
Electroretinography and Gene Expression Measures Implicate Phototransduction and Metabolic Shifts in Chick Myopia and Hyperopia Models


Abstract
1. Introduction
2. Materials and Methods
2.1. Electroretinogram of Retinal Function
2.1.1. Animals and Rearing
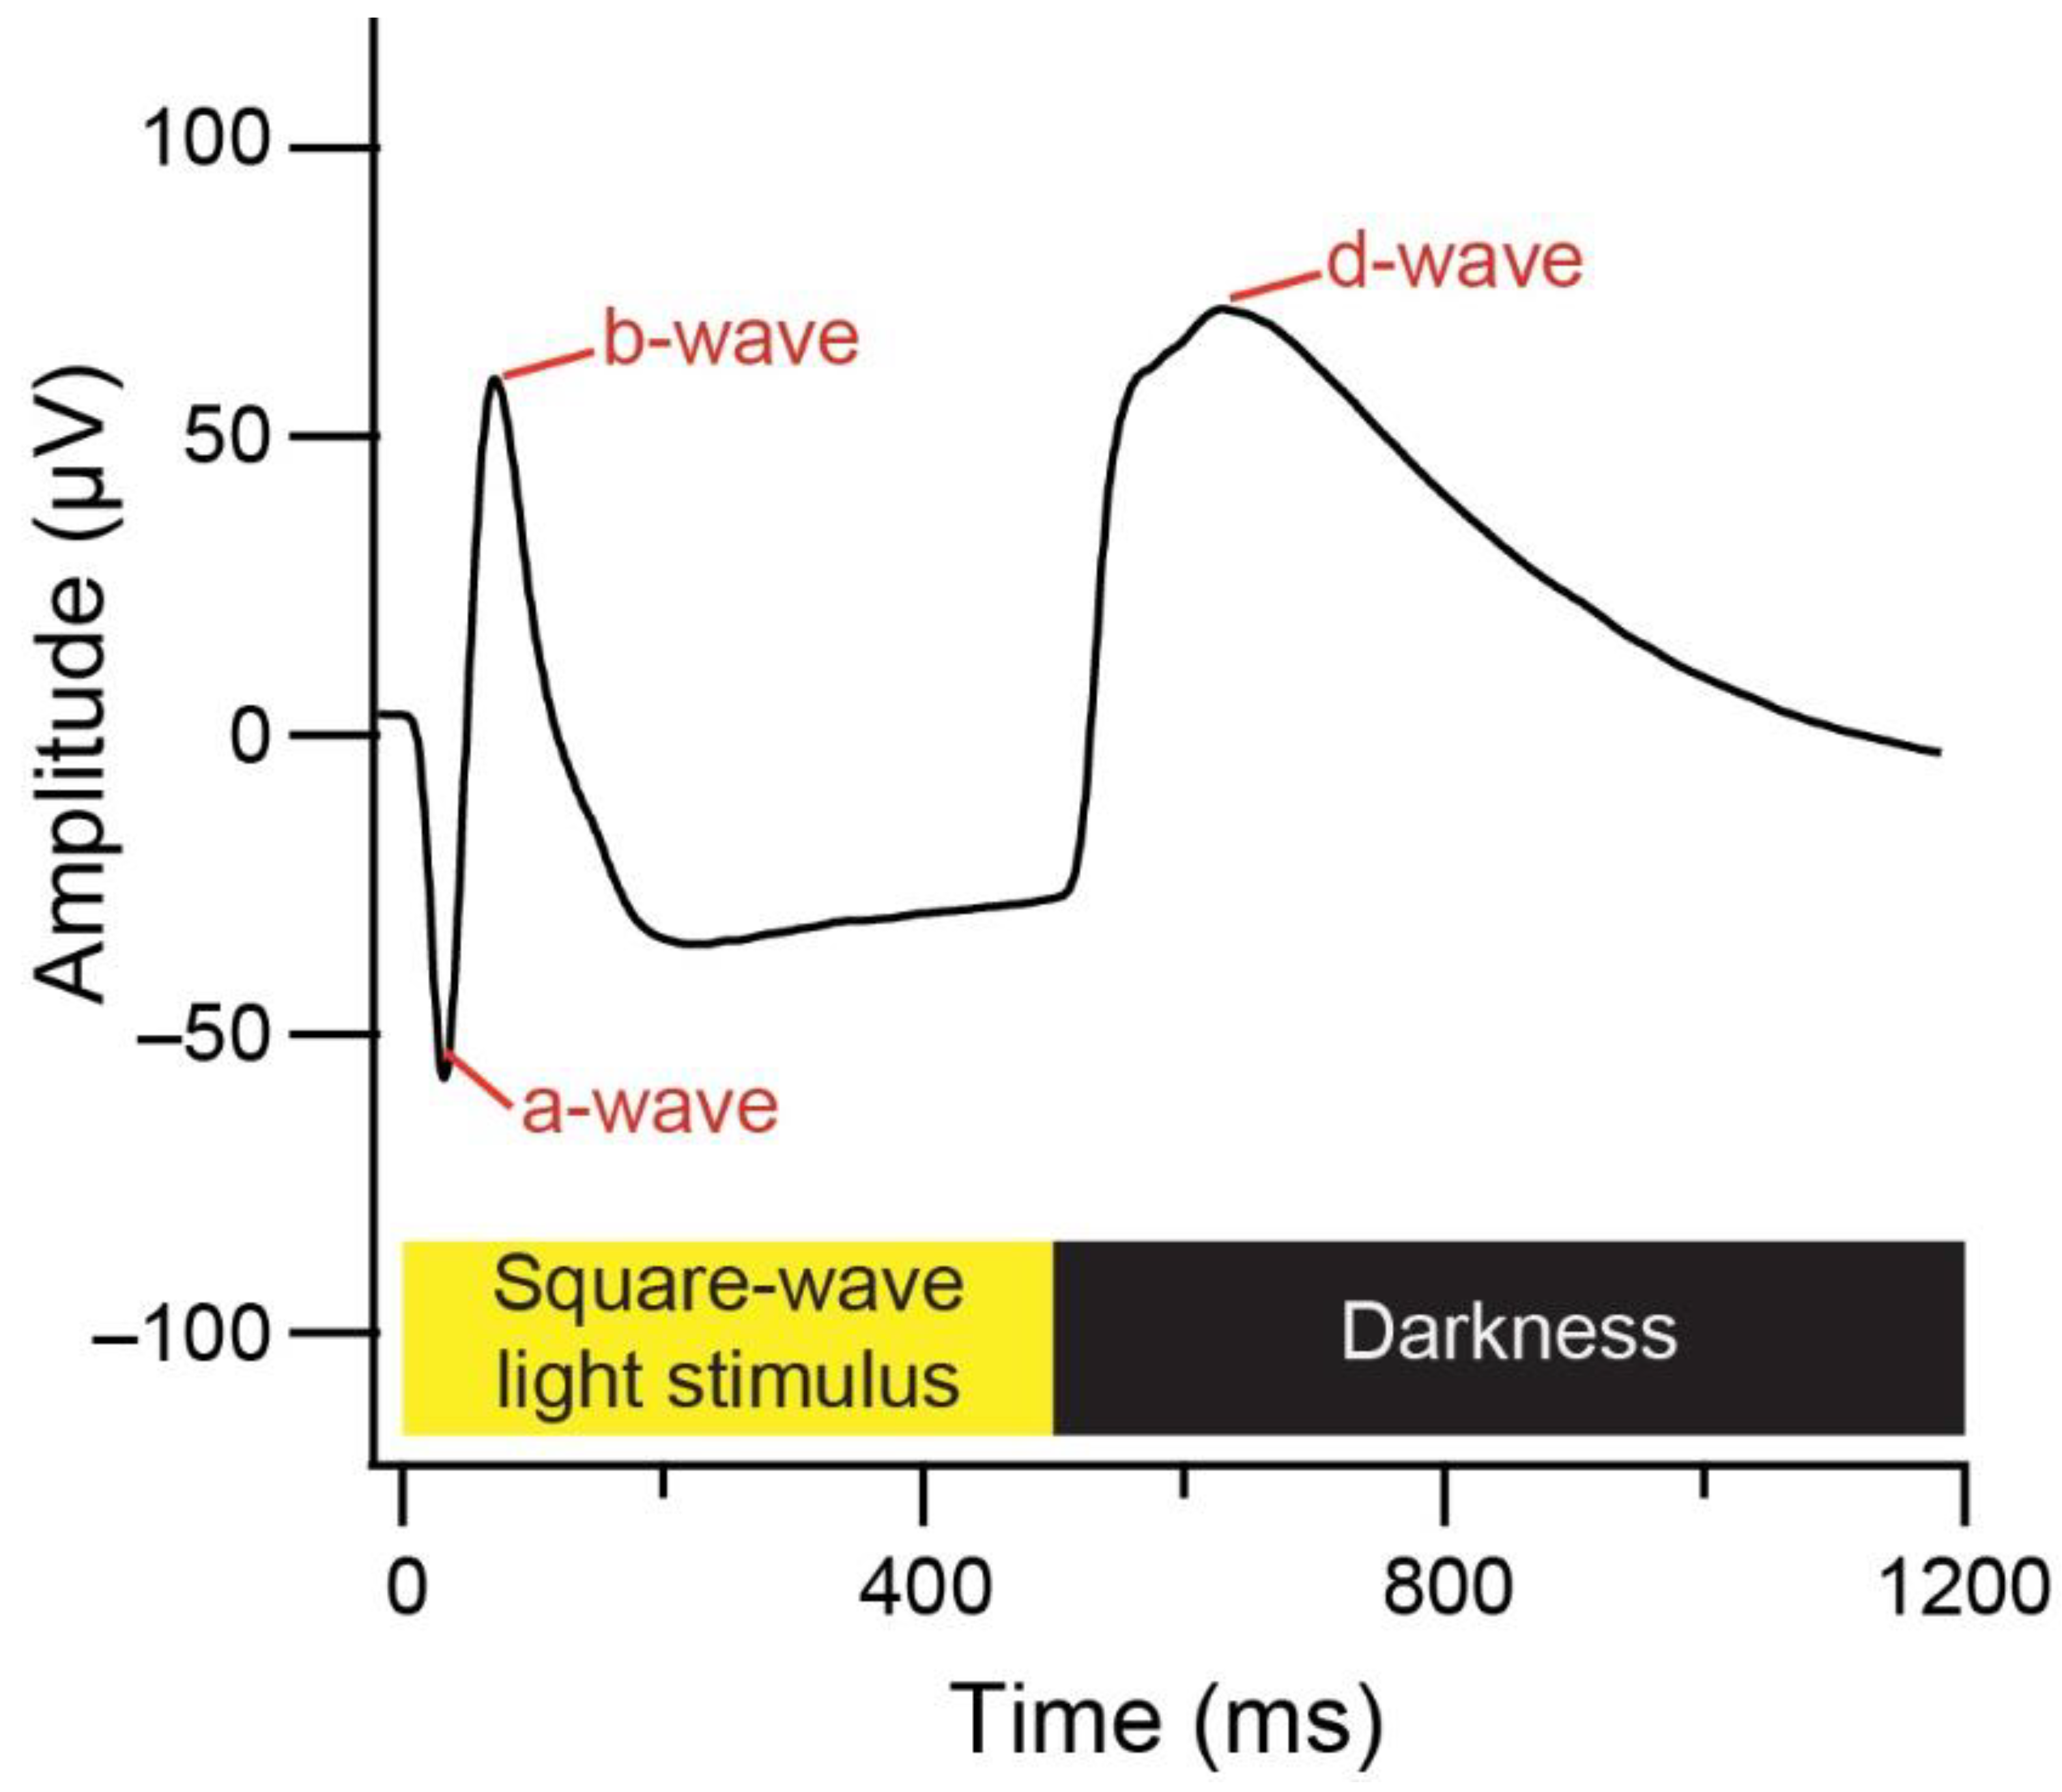
2.1.2. Electroretinograms
2.1.3. Data Analysis
2.2. Microarray Measures of Retina/RPE Gene Expression
2.2.1. Data Pre-Processing
2.2.2. Gene Set Enrichment and Leading Edge Subset Analysis
3. Results
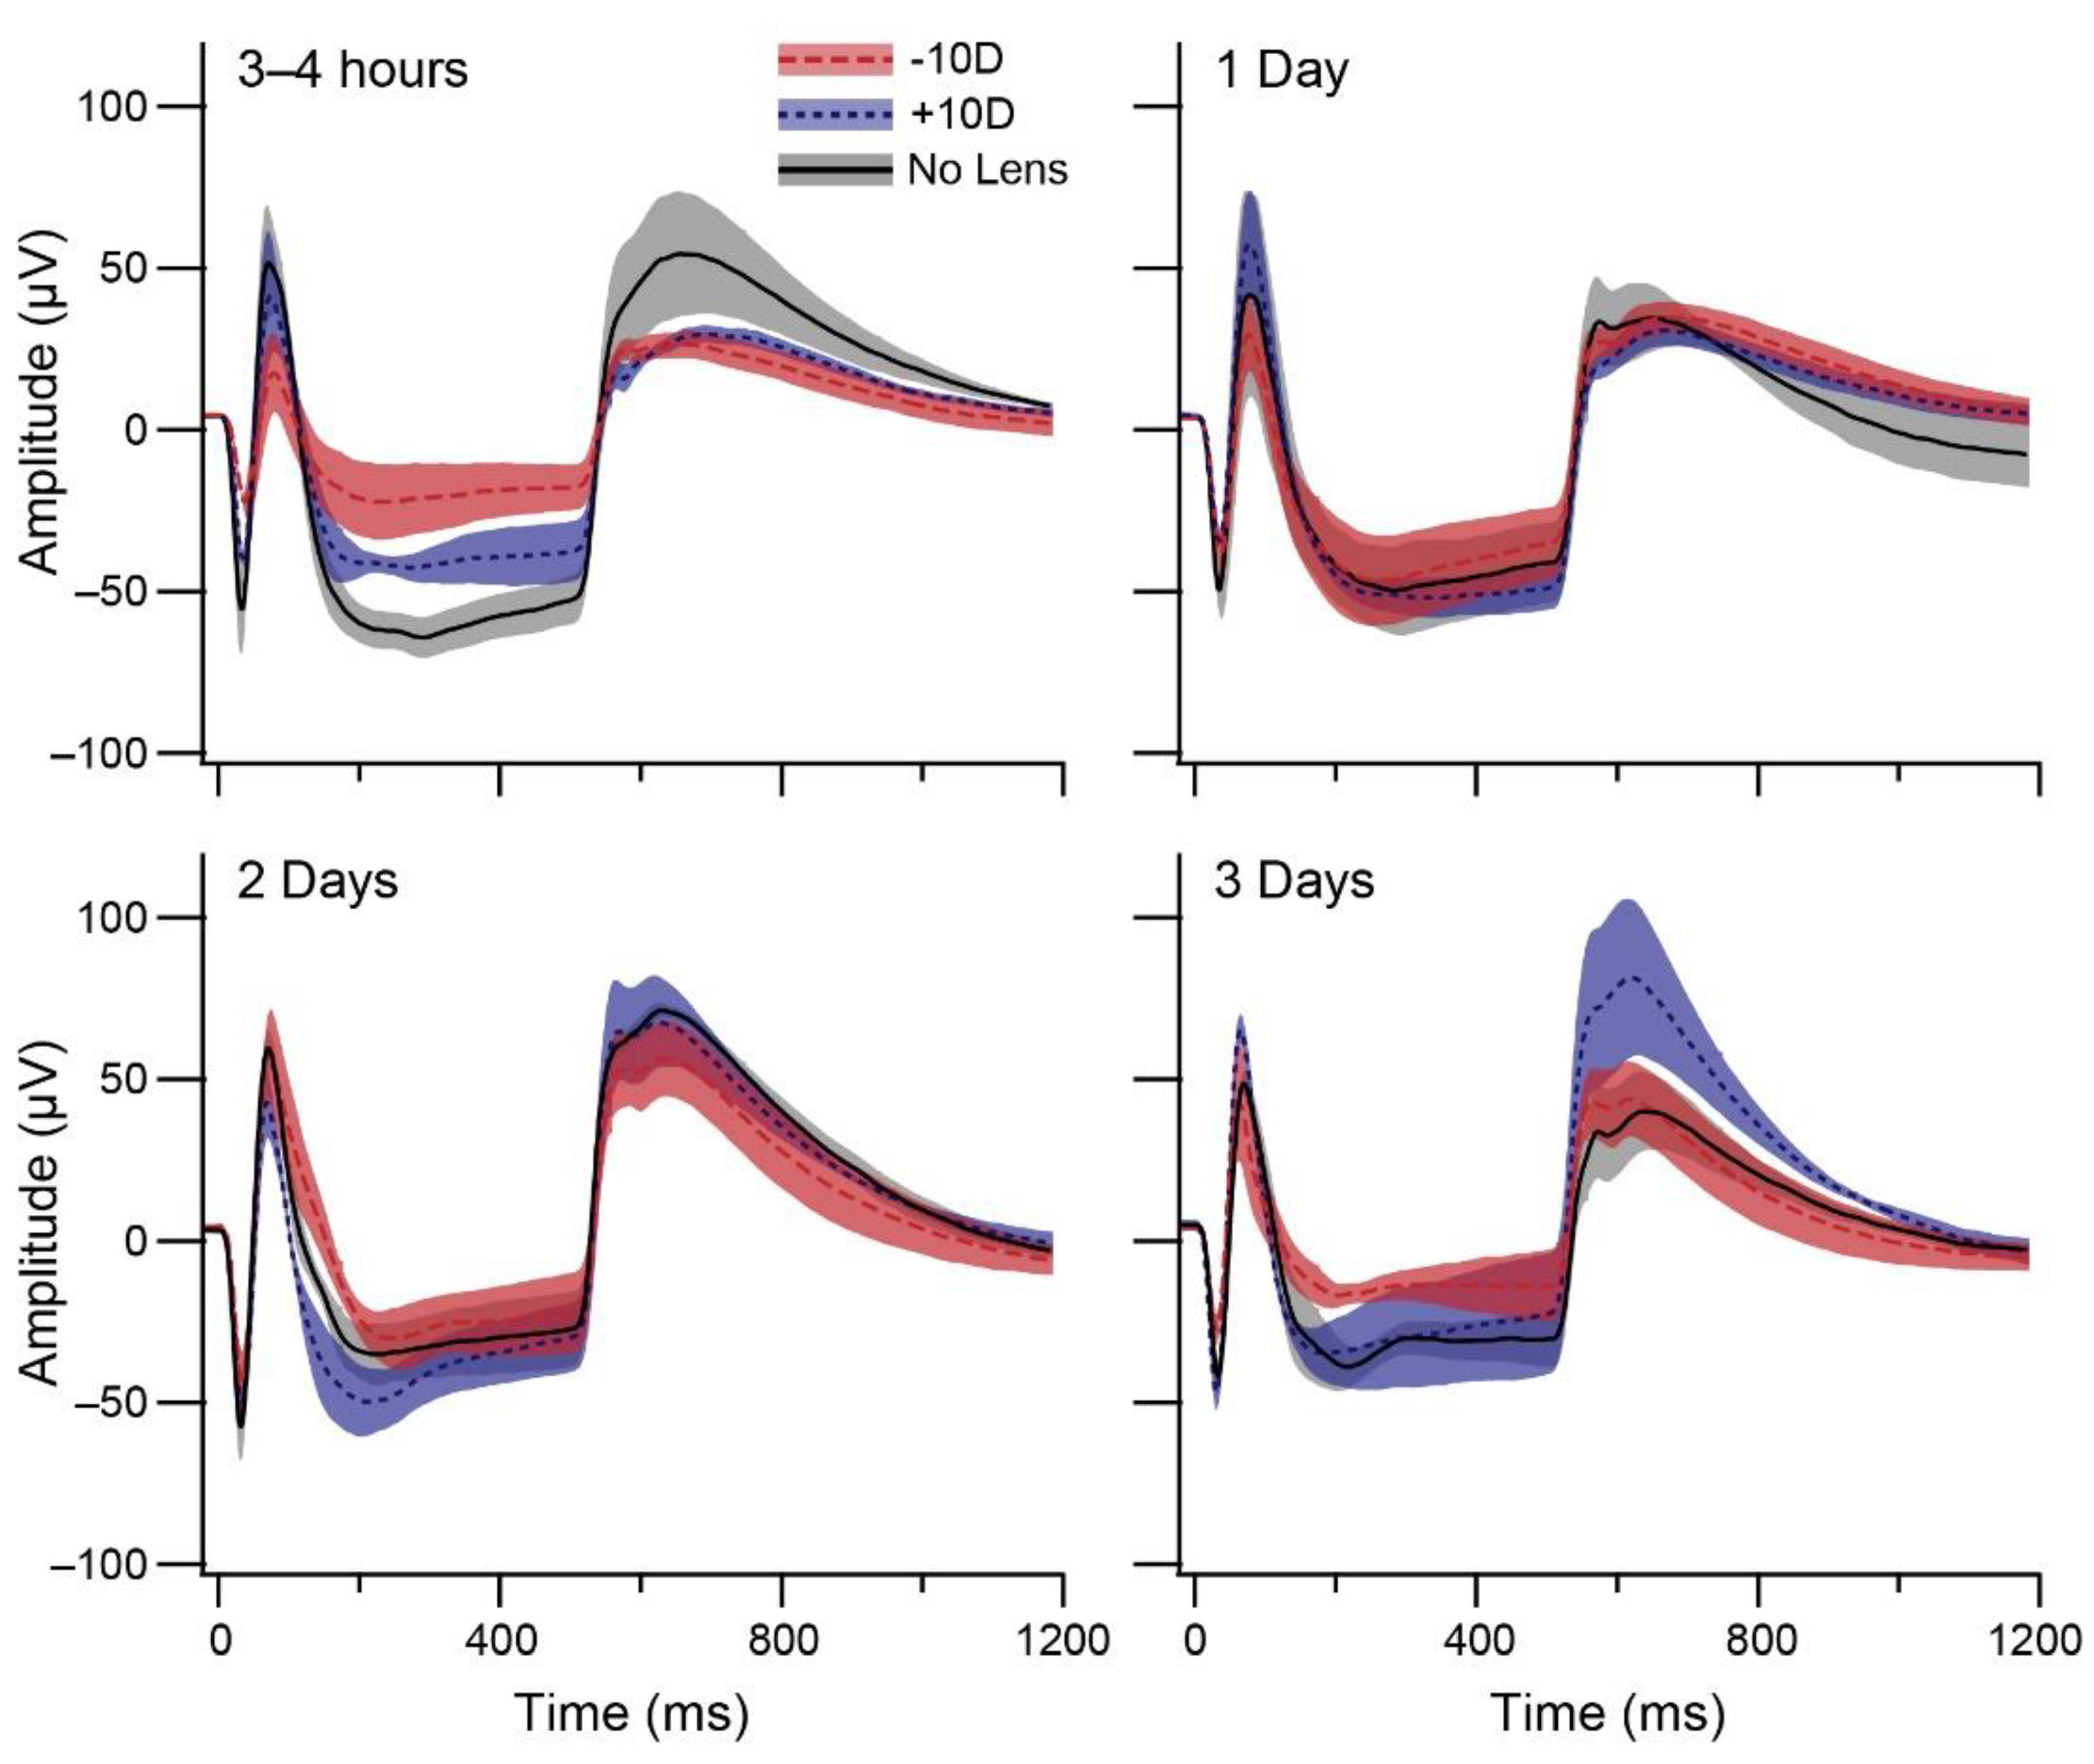
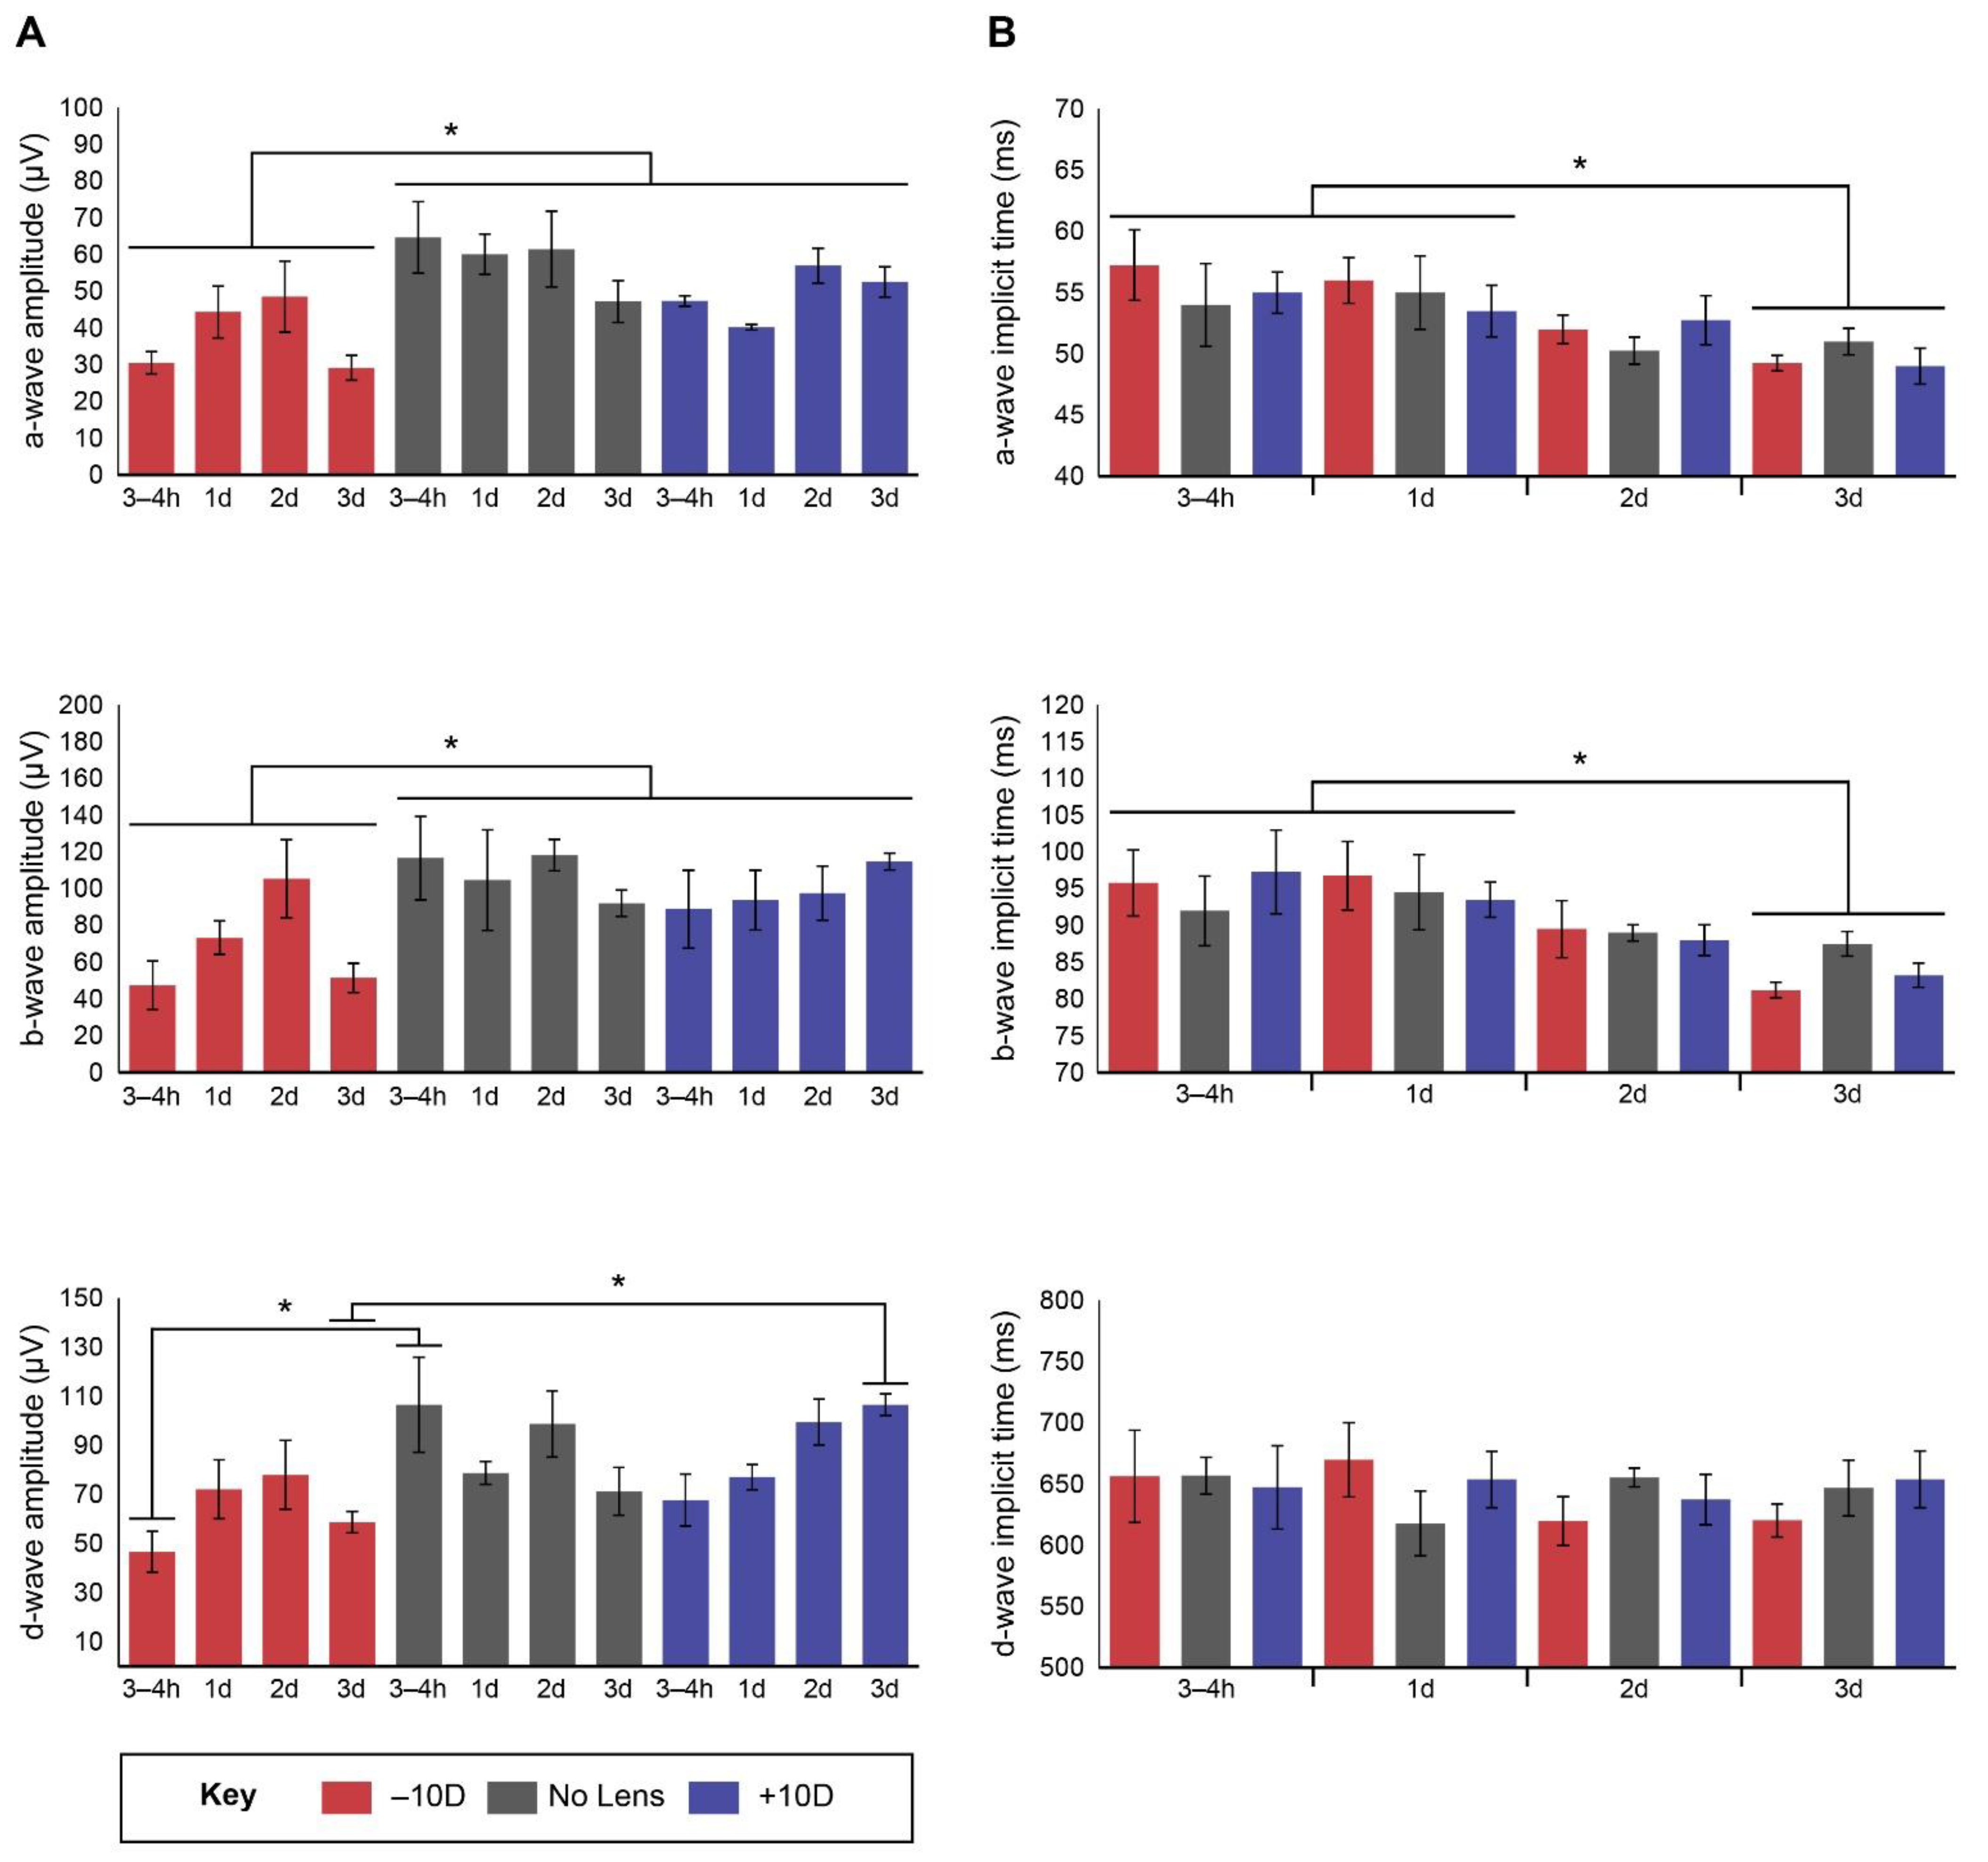
3.1. Electroretinography
3.2. Gene Pathway Enrichment
4. Discussion
5. Limitations
6. Conclusions
Author Contributions
Funding
Institutional Review Board Statement
Informed Consent Statement
Data Availability Statement
Conflicts of Interest
References
- Holden, B.A.; Fricke, T.R.; Wilson, D.A.; Jong, M.; Naidoo, K.S.; Sankaridurg, P.; Wong, T.Y.; Naduvilath, T.J.; Resnikoff, S. Global Prevalence of Myopia and High Myopia and Temporal Trends from 2000 through 2050. Ophthalmology 2016, 123, 1036–1042. [Google Scholar] [CrossRef]
- Hashemi, H.; Fotouhi, A.; Yekta, A.; Pakzad, R.; Ostadimoghaddam, H.; Khabazkhoob, M. Global and regional estimates of prevalence of refractive errors: Systematic review and meta-analysis. J. Curr. Ophthalmol. 2018, 30, 3–22. [Google Scholar] [CrossRef]
- Verhoeven, V.J.; Wong, K.T.; Buitendijk, G.H.; Hofman, A.; Vingerling, J.R.; Klaver, C.C. Visual consequences of refractive errors in the general population. Ophthalmology 2015, 122, 101–109. [Google Scholar] [CrossRef] [PubMed]
- Flitcroft, D.I. The complex interactions of retinal, optical and environmental factors in myopia aetiology. Prog. Retin. Eye Res. 2012, 31, 622–660. [Google Scholar] [CrossRef] [PubMed]
- Saw, S.M.; Gazzard, G.; Shih-Yen, E.C.; Chua, W.H. Myopia and associated pathological complications. Ophthalmic Physiol. Opt. 2005, 25, 381–391. [Google Scholar] [CrossRef]
- Troilo, D.; Smith, E.L., 3rd; Nickla, D.L.; Ashby, R.; Tkatchenko, A.V.; Ostrin, L.A.; Gawne, T.J.; Pardue, M.T.; Summers, J.A.; Kee, C.S.; et al. IMI—Report on Experimental Models of Emmetropization and Myopia. Investig. Ophthalmol. Vis. Sci. 2019, 60, M31–M88. [Google Scholar] [CrossRef] [PubMed]
- Crewther, D.P. The role of photoreceptors in the control of refractive state. Prog. Retin. Eye Res. 2000, 19, 421–457. [Google Scholar] [CrossRef]
- Chakraborty, R.; Pardue, M.T. Molecular and biochemical aspects of the retina on refraction. Prog. Mol. Biol. Transl. Sci. 2015, 134, 249–267. [Google Scholar]
- Wallman, J.; Winawer, J. Homeostasis of eye growth and the question of myopia. Neuron 2004, 43, 447–468. [Google Scholar] [CrossRef]
- Liang, H.; Crewther, S.; Crewther, D.; Dickson, M.; Junghans, B. X-ray microanalysis of the chick choroid and retina in experimental myopia. Investig. Ophthalmol. Vis. Sci. 1998, 39, S504. [Google Scholar]
- Liang, H.; Crewther, S.G.; Crewther, D.P.; Junghans, B.M. Structural and elemental evidence for edema in the retina, retinal pigment epithelium, and choroid during recovery from experimentally induced myopia. Investig. Ophthalmol. Vis. Sci. 2004, 45, 2463–2474. [Google Scholar] [CrossRef]
- Crewther, S.G.; Liang, H.; Junghans, B.M.; Crewther, D.P. Ionic control of ocular growth and refractive change. Proc. Natl. Acad. Sci. USA 2006, 103, 15663–15668. [Google Scholar] [CrossRef]
- Liang, H.; Crewther, D.; Gillard Crewther, S.; Barila, A. A role for photoreceptor outer segments in the induction of deprivation myopia. Vision Res. 1995, 35, 1217–1225. [Google Scholar] [CrossRef]
- Westbrook, A.M.; Crewther, D.P.; Crewther, S.G. Cone receptor sensitivity is altered in form deprivation myopia in the chicken. Optom. Vis. Sci. 1999, 76, 326–338. [Google Scholar] [CrossRef]
- Rymer, J.; Wildsoet, C.F. The role of the retinal pigment epithelium in eye growth regulation and myopia: A review. Vis. Neurosci. 2005, 22, 251. [Google Scholar] [CrossRef] [PubMed]
- Zhang, Y.; Wildsoet, C.F. RPE and choroid mechanisms underlying ocular growth and myopia. Prog. Mol. Biol. Transl. Sci. 2015, 134, 221–240. [Google Scholar] [PubMed]
- Schaeffel, F.; Glasser, A.; Howland, H.C. Accommodation, refractive error and eye growth in chickens. Vis. Res. 1988, 28, 639–657. [Google Scholar] [CrossRef]
- Crewther, S.G.; Nathan, J.; Kiely, P.M.; Brennan, N.A.; Crewther, D.P. The Effect of Defocusing Contact-Lenses on Refraction in Cynomolgus Monkeys. Clin. Vis. Sci. 1988, 3, 221–228. [Google Scholar]
- Nathan, J.; Crewther, S.G.; Crewther, D.P.; Kiely, P.M. Effects of Retinal Image Degradation on Ocular Growth in Cats. Investig. Ophthalmol. Vis. Sci. 1984, 25, 1300–1306. [Google Scholar]
- Stone, R.A.; Lin, T.; Laties, A.M.; Iuvone, P.M. Retinal dopamine and form-deprivation myopia. Proc. Natl. Acad. Sci. USA 1989, 86, 704–706. [Google Scholar] [CrossRef] [PubMed]
- Wiesel, T.N.; Raviola, E. Myopia and eye enlargement after neonatal lid fusion in monkeys. Nature 1977, 266, 66–68. [Google Scholar] [CrossRef]
- Wallman, J.; Turkel, J.; Trachtman, J. Extreme myopia produced by modest change in early visual experience. Science 1978, 201, 1249–1251. [Google Scholar] [CrossRef]
- Schaeffel, F.; Feldkaemper, M. Animal models in myopia research. Clin. Exp. Optom. 2015, 98, 507–517. [Google Scholar] [CrossRef]
- Riddell, N.; Crewther, S.G. Integrated Comparison of GWAS, Transcriptome, and Proteomics Studies Highlights Similarities in the Biological Basis of Animal and Human Myopia. Investig. Ophthalmol. Vis. Sci. 2017, 58, 660–669. [Google Scholar] [CrossRef] [PubMed]
- Vocale, L.G.; Crewther, S.; Riddell, N.; Hall, N.E.; Murphy, M.; Crewther, D. RNA-seq and GSEA identifies suppression of ligand-gated chloride efflux channels as the major gene pathway contributing to form deprivation myopia. Sci. Rep. 2021, 11, 1–18. [Google Scholar] [CrossRef] [PubMed]
- Riddell, N.; Faou, P.; Murphy, M.; Giummarra, L.; Downs, R.A.; Rajapaksha, H.; Crewther, S.G. The retina/RPE proteome in chick myopia and hyperopia models: Commonalities with inherited and age-related ocular pathologies. Mol. Vis. 2017, 23, 872–888. [Google Scholar] [PubMed]
- Giummarra, L.; Crewther, S.G.; Riddell, N.; Murphy, M.J.; Crewther, D.P. Pathway analysis identifies altered mitochondrial metabolism, neurotransmission, structural pathways and complement cascade in retina/RPE/ choroid in chick model of form-deprivation myopia. PeerJ 2018, 6, e5048. [Google Scholar] [CrossRef]
- Riddell, N.; Faou, P.; Crewther, S.G. Short term optical defocus perturbs normal developmental shifts in retina/RPE protein abundance. BMC Dev. Biol. 2018, 18, 18. [Google Scholar] [CrossRef] [PubMed]
- Riddell, N.; Giummarra, L.; Hall, N.; Crewther, S. Bidirectional Expression of Metabolic, Structural, and Immune Pathways in Early Myopia and Hyperopia. Front. Neurosci. 2016, 10. [Google Scholar] [CrossRef]
- Riddell, N.; Crewther, S.G. Novel evidence for complement system activation in chick myopia and hyperopia models: A meta-analysis of transcriptome datasets. Sci. Rep. 2017, 7, 9719. [Google Scholar] [CrossRef] [PubMed]
- Francisco, B.-M.; Salvador, M.; Amparo, N. Oxidative Stress in Myopia. Oxid. Med. Cell. Longev. 2015, 2015. [Google Scholar] [CrossRef]
- Heckenlively, J.R.; Arden, G.B. Principles and Practice of Clinical Electrophysiology of Vision; MIT press: Cambridge, UK, 2006. [Google Scholar]
- Robson, J.G.; Frishman, L.J. Dissecting the dark-adapted electroretinogram. Doc. Ophthalmol. 1998, 95, 187–215. [Google Scholar] [CrossRef]
- Fujikado, T.; Kawasaki, Y.; Suzuki, A.; Ohmi, G.; Tano, Y. Retinal function with lens-induced myopia compared with form-deprivation myopia in chicks. Graefes Arch. Clin. Exp. Ophthalmol. 1997, 235, 320–324. [Google Scholar] [CrossRef]
- Fujikado, T.; Hosohata, J.; Omoto, T. ERG of form deprivation myopia and drug induced ametropia in chicks. Curr. Eye Res. 1996, 15, 79–86. [Google Scholar] [CrossRef] [PubMed]
- Hodos, W.; Fitzke, F.W.; Hayes, B.P.; Holden, A.L. Experimental myopia in chicks: Ocular refraction by electroretinography. Investig. Ophthalmol. Vis. Sci. 1985, 26, 1423–1430. [Google Scholar]
- Zhu, X.Y.; Park, T.W.; Winawer, J.; Wallman, J. In a matter of minutes, the eye can know which way to grow. Investig. Ophthalmol. Vis. Sci. 2005, 46, 2238–2241. [Google Scholar] [CrossRef] [PubMed]
- Kee, C.; Marzani, D.; Wallman, J. Differences in time course and visual requirements of ocular responses to lenses and diffusers. Investig. Ophthalmol. Vis. Sci. 2001, 42, 575–583. [Google Scholar]
- Schmid, K.L.; Rayner, C.L.; Brown, B. Hemi-field and full-field form-deprivation induce timing changes in multifocal ERG responses in chick. Ophthalmic Physiol. Opt. 2013, 33, 257–266. [Google Scholar] [CrossRef] [PubMed]
- Stone, R.A.; McGlinn, A.M.; Baldwin, D.A.; Tobias, J.W.; Iuvone, P.M.; Khurana, T.S. Image defocus and altered retinal gene expression in chick: Clues to the pathogenesis of ametropia. Investig. Ophthalmol. Vis. Sci. 2011, 52, 5765–5777. [Google Scholar] [CrossRef] [PubMed]
- Subramanian, A.; Tamayo, P.; Mootha, V.K.; Mukherjee, S.; Ebert, B.L.; Gillette, M.A.; Paulovich, A.; Pomeroy, S.L.; Golub, T.R.; Lander, E.S.; et al. Gene set enrichment analysis: A knowledge-based approach for interpreting genome-wide expression profiles. Proc. Natl. Acad. Sci. USA 2005, 102, 15545–15550. [Google Scholar] [CrossRef]
- Manoli, T.; Gretz, N.; Grone, H.J.; Kenzelmann, M.; Eils, R.; Brors, B. Group testing for pathway analysis improves comparability of different microarray datasets. Bioinformatics 2006, 22, 2500–2506. [Google Scholar] [CrossRef]
- Schaeffel, F.; Rohrer, B.; Lemmer, T.; Zrenner, E. Diurnal control of rod function in the chicken. Vis. Neurosci. 1991, 6, 641–653. [Google Scholar] [CrossRef]
- Ookawa, T. Further studies on the ontogenetic development of the chick electroretinogram. Poult. Sci. 1971, 50, 1185–1190. [Google Scholar] [CrossRef] [PubMed]
- Blanca, M.J.; Alarcon, R.; Arnau, J.; Bono, R.; Bendayan, R. Effect of variance ratio on ANOVA robustness: Might 1.5 be the limit? Behav. Res. Methods 2018, 50, 937–962. [Google Scholar] [CrossRef] [PubMed]
- Tabachnick, B.G.; Fidell, L.S.; Ullman, J.B. Using Multivariate Statistics; Pearson: Boston, MA, USA, 2007. [Google Scholar]
- Gautier, L.; Cope, L.; Bolstad, B.M.; Irizarry, R.A. affy—Analysis of Affymetrix GeneChip data at the probe level. Bioinformatics 2004, 20, 307–315. [Google Scholar] [CrossRef] [PubMed]
- Irizarry, R.A.; Bolstad, B.M.; Collin, F.; Cope, L.M.; Hobbs, B.; Speed, T.P. Summaries of Affymetrix GeneChip probe level data. Nucleic Acids Res. 2003, 31, e15. [Google Scholar] [CrossRef] [PubMed]
- Subramanian, A.; Kuehn, H.; Gould, J.; Tamayo, P.; Mesirov, J.P. GSEA-P: A desktop application for Gene Set Enrichment Analysis. Bioinformatics 2007, 23, 3251–3253. [Google Scholar] [CrossRef]
- Kanehisa, M.; Goto, S. KEGG: Kyoto encyclopedia of genes and genomes. Nucleic Acids Res. 2000, 28, 27–30. [Google Scholar] [CrossRef] [PubMed]
- Liberzon, A.; Subramanian, A.; Pinchback, R.; Thorvaldsdottir, H.; Tamayo, P.; Mesirov, J.P. Molecular signatures database (MSigDB) 3.0. Bioinformatics 2011, 27, 1739–1740. [Google Scholar] [CrossRef]
- Gene Set Enrichment Analysis: GSEA User Guide. Available online: https://www.gsea-msigdb.org/gsea/doc/GSEAUserGuideFrame.html (accessed on 21 June 2014).
- Blach, R.K.; Jay, B.; Kolb, H. Electrical activity of the eye in high myopia. Br. J. Ophthalmol. 1966, 50, 629–641. [Google Scholar] [CrossRef]
- Kader, M.A. Electrophysiological study of myopia. Saudi J. Ophthalmol. 2012, 26, 91–99. [Google Scholar] [CrossRef]
- Malik, S.R.; Gupta, A.K.; Gupta, P.C.; Singh, G. E.R.G. in myopia. J. All India Ophthalmol. Soc. 1969, 17, 48–51. [Google Scholar] [PubMed]
- Perlman, I.; Meyer, E.; Haim, T.; Zonis, S. Retinal Function in High Refractive Error Assessed Electroretinographically. Br. J. Ophthalmol. 1984, 68, 79–84. [Google Scholar] [CrossRef] [PubMed]
- Westall, C.A.; Dhaliwal, H.S.; Panton, C.M.; Sigesmun, D.; Levin, A.V.; Nischal, K.K.; Heon, E. Values of electroretinogram responses according to axial length. Doc. Ophthalmol. 2001, 102, 115–130. [Google Scholar] [CrossRef]
- Chen, J.C.; Brown, B.; Schmid, K.L. Delayed mfERG responses in myopia. Vis. Res. 2006, 46, 1221–1229. [Google Scholar] [CrossRef] [PubMed]
- Westall, C.A.; Panton, C.M.; Levin, A.V. Time courses for maturation of electroretinogram responses from infancy to adulthood. Doc. Ophthalmol. 1998, 96, 355–379. [Google Scholar] [CrossRef] [PubMed]
- Birch, D.G.; Anderson, J.L. Standardized full-field electroretinography. Normal values and their variation with age. Arch. Ophthalmol. 1992, 110, 1571–1576. [Google Scholar] [CrossRef]
- Ookawa, T. The onset and development of the chick electroretinogram: The A- and B-waves. Poult. Sci. 1971, 50, 601–608. [Google Scholar] [CrossRef]
- Jelsema, C.L. Light activation of phospholipase A2 in rod outer segments of bovine retina and its modulation by GTP-binding proteins. J. Biol. Chem. 1987, 262, 163–168. [Google Scholar] [CrossRef]
- Jastrzebska, B.; Debinski, A.; Filipek, S.; Palczewski, K. Role of membrane integrity on G protein-coupled receptors: Rhodopsin stability and function. Prog. Lipid Res. 2011, 50, 267–277. [Google Scholar] [CrossRef]
- Sieck, E.; Enzenauer, R.; Pedler, M. Effect of Induced Refractive Error on Electroretinograms. In Proceedings of the ARVO Conference, Baltimore, MD, USA, 7–11 May 2017; p. 4884. [Google Scholar]
- Hurley, J.B.; Lindsay, K.J.; Du, J. Glucose, lactate, and shuttling of metabolites in vertebrate retinas. J. Neurosci. Res. 2015, 93, 1079–1092. [Google Scholar] [CrossRef] [PubMed]
- Shih, Y.-F.; Fitzgerald, M.E.; Norton, T.T.; Gamlin, P.D.; Hodos, W.; Reiner, A. Reduction in choroidal blood flow occurs in chicks wearing goggles that induce eye growth toward myopia. Curr. Eye Res. 1993, 12, 219–227. [Google Scholar] [CrossRef] [PubMed]
- Jin, N.; Stjernschantz, J. Regional blood flow in the myopic chick eye during and after form deprivation: A study with radioactively-labelled microspheres. Exp. Eye Res. 2000, 71, 233–238. [Google Scholar] [CrossRef]
- Lunt, S.Y.; Vander Heiden, M.G. Aerobic glycolysis: Meeting the metabolic requirements of cell proliferation. Annu. Rev. Cell Dev. Biol. 2011, 27, 441–464. [Google Scholar] [CrossRef] [PubMed]
- Barathi, V.A.; Chaurasia, S.S.; Poidinger, M.; Koh, S.K.; Tian, D.; Ho, C.; Iuvone, P.M.; Beuerman, R.W.; Zhou, L. Involvement of GABA transporters in atropine-treated myopic retina as revealed by iTRAQ quantitative proteomics. J. Proteome Res. 2014, 13, 4647–4658. [Google Scholar] [CrossRef] [PubMed]
- Zhang, S.; Zeng, X.; Ren, M.; Mao, X.; Qiao, S. Novel metabolic and physiological functions of branched chain amino acids: A review. J. Anim. Sci. Biotechnol. 2017, 8, 10. [Google Scholar] [CrossRef]
- Kainulainen, H.; Hulmi, J.J.; Kujala, U.M. Potential role of branched-chain amino acid catabolism in regulating fat oxidation. Exerc. Sport Sci. Rev. 2013, 41, 194–200. [Google Scholar] [CrossRef] [PubMed]
- Zeidan, Y.H.; Hannun, Y.A. Translational aspects of sphingolipid metabolism. Trends Mol. Med. 2007, 13, 327–336. [Google Scholar] [CrossRef]
- Bikman, B.T.; Summers, S.A. Ceramides as modulators of cellular and whole-body metabolism. J. Clin. Investig. 2011, 121, 4222–4230. [Google Scholar] [CrossRef]
- Aguilera-Romero, A.; Gehin, C.; Riezman, H. Sphingolipid homeostasis in the web of metabolic routes. Biochim. Biophys. Acta 2014, 1841, 647–656. [Google Scholar] [CrossRef]
- Tian, E.; Hoffman, M.P.; Ten Hagen, K.G. O-glycosylation modulates integrin and FGF signalling by influencing the secretion of basement membrane components. Nat. Commun. 2012, 3. [Google Scholar] [CrossRef]
- Herr, P.; Korniychuk, G.; Yamamoto, Y.; Grubisic, K.; Oelgeschlager, M. Regulation of TGF-beta signalling by N-acetylgalactosaminyltransferase-like 1. Development 2008, 135, 1813–1822. [Google Scholar] [CrossRef] [PubMed]
- Fakhro, K.A.; Choi, M.; Ware, S.M.; Belmont, J.W.; Towbin, J.A.; Lifton, R.P.; Khokha, M.K.; Brueckner, M. Rare copy number variations in congenital heart disease patients identify unique genes in left-right patterning. Proc. Natl. Acad. Sci. USA 2011, 108, 2915–2920. [Google Scholar] [CrossRef]
- Jensen, H.; Kjaergaard, S.; Klie, F.; Moller, H.U. Ophthalmic manifestations of congenital disorder of glycosylation type 1a. Ophthalmic Genet. 2003, 24, 81–88. [Google Scholar] [CrossRef] [PubMed]
- Bayerlova, M.; Jung, K.; Kramer, F.; Klemm, F.; Bleckmann, A.; Beissbarth, T. Comparative study on gene set and pathway topology-based enrichment methods. BMC Bioinform. 2015, 16, 334. [Google Scholar] [CrossRef] [PubMed]
- Bauer-Mehren, A.; Furlong, L.I.; Sanz, F. Pathway databases and tools for their exploitation: Benefits, current limitations and challenges. Mol. Syst. Biol. 2009, 5, 290. [Google Scholar] [CrossRef]
- Chowdhury, S.; Sarkar, R.R. Comparison of human cell signaling pathway databases--evolution, drawbacks and challenges. Database (Oxford) 2015, 2015. [Google Scholar] [CrossRef]
- Ahmad, J.M.; Ioshimoto, G.; Liber, A.; Ventura, D. Scotopic ERG Protocols for Rabbits. Investig. Ophthalmol. Vis. Sci. 2019, 60, 5965. [Google Scholar]
- Czechowski, T.; Bari, R.P.; Stitt, M.; Scheible, W.R.; Udvardi, M.K. Real-time RT-PCR profiling of over 1400 Arabidopsis transcription factors: Unprecedented sensitivity reveals novel root- and shoot-specific genes. Plant J. 2004, 38, 366–379. [Google Scholar] [CrossRef]
- Liang, H.; Crewther, S.G.; Crewther, D.P.; Pirie, B. Morphology of the recovery from form deprivation myopia in the chick. Aust. N. Z. J. Ophthalmol. 1996, 24, 41–44. [Google Scholar] [CrossRef] [PubMed]
- Wang, B.; Liu, Y.; Chen, S.; Wu, Y.; Lin, S.; Duan, Y.; Zheng, K.; Zhang, L.; Gu, X.; Hong, W.; et al. A Novel Potentially Causative Variant of NDUFAF7 Revealed by Mutation Screening in a Chinese Family With Pathologic Myopia. Investig. Ophthalmol. Vis. Sci. 2017, 58, 4182–4192. [Google Scholar] [CrossRef]
- Mo, Y.; He, M.L.; Yu, J.Z.; Xie, X.J. Bioinformatics analysis of the gene expression profile of retinal pigmental epithelial cells based in single-cell RNA sequencing in myopic mice. Arch. Med. Sci. 2021, 17, 574–577. [Google Scholar] [CrossRef]
- Bian, J.; Sze, Y.H.; Tse, D.Y.; To, C.H.; McFadden, S.A.; Lam, C.S.; Li, K.K.; Lam, T.C. SWATH Based Quantitative Proteomics Reveals Significant Lipid Metabolism in Early Myopic Guinea Pig Retina. Int. J. Mol. Sci. 2021, 22, 4721. [Google Scholar] [CrossRef] [PubMed]
- Yang, J.; Reinach, P.S.; Zhang, S.; Pan, M.; Sun, W.; Liu, B.; Li, F.; Li, X.; Zhao, A.; Chen, T.; et al. Changes in retinal metabolic profiles associated with form deprivation myopia development in guinea pigs. Sci. Rep. 2017, 7, 2777. [Google Scholar] [CrossRef] [PubMed]
- Tedja, M.S.; Wojciechowski, R.; Hysi, P.G.; Eriksson, N.; Furlotte, N.A.; Verhoeven, V.J.M.; Iglesias, A.I.; Meester-Smoor, M.A.; Tompson, S.W.; Fan, Q.; et al. Genome-wide association meta-analysis highlights light-induced signaling as a driver for refractive error. Nat. Genet. 2018, 50, 834–848. [Google Scholar] [CrossRef] [PubMed]


| Method | Microarray Data [40] | Riddell et al. Electrophysiology Data |
|---|---|---|
| Breed | White Leghorn | White Leghorn/New Hampshire |
| Refractive error model | Optical defocus | Optical defocus |
| Lens power | +15D; −15D | +10D; −10D |
| Age lens applied | 8 days | 5 days |
| Hours into light phase lens applied | 1 h | 5 h |
| Induction time-points | 6 h, 3 days | 3–4 h and 1, 2 and 3 days |
| Condition | KEGG Pathway | NES | FDR | Tags | List | Signal |
|---|---|---|---|---|---|---|
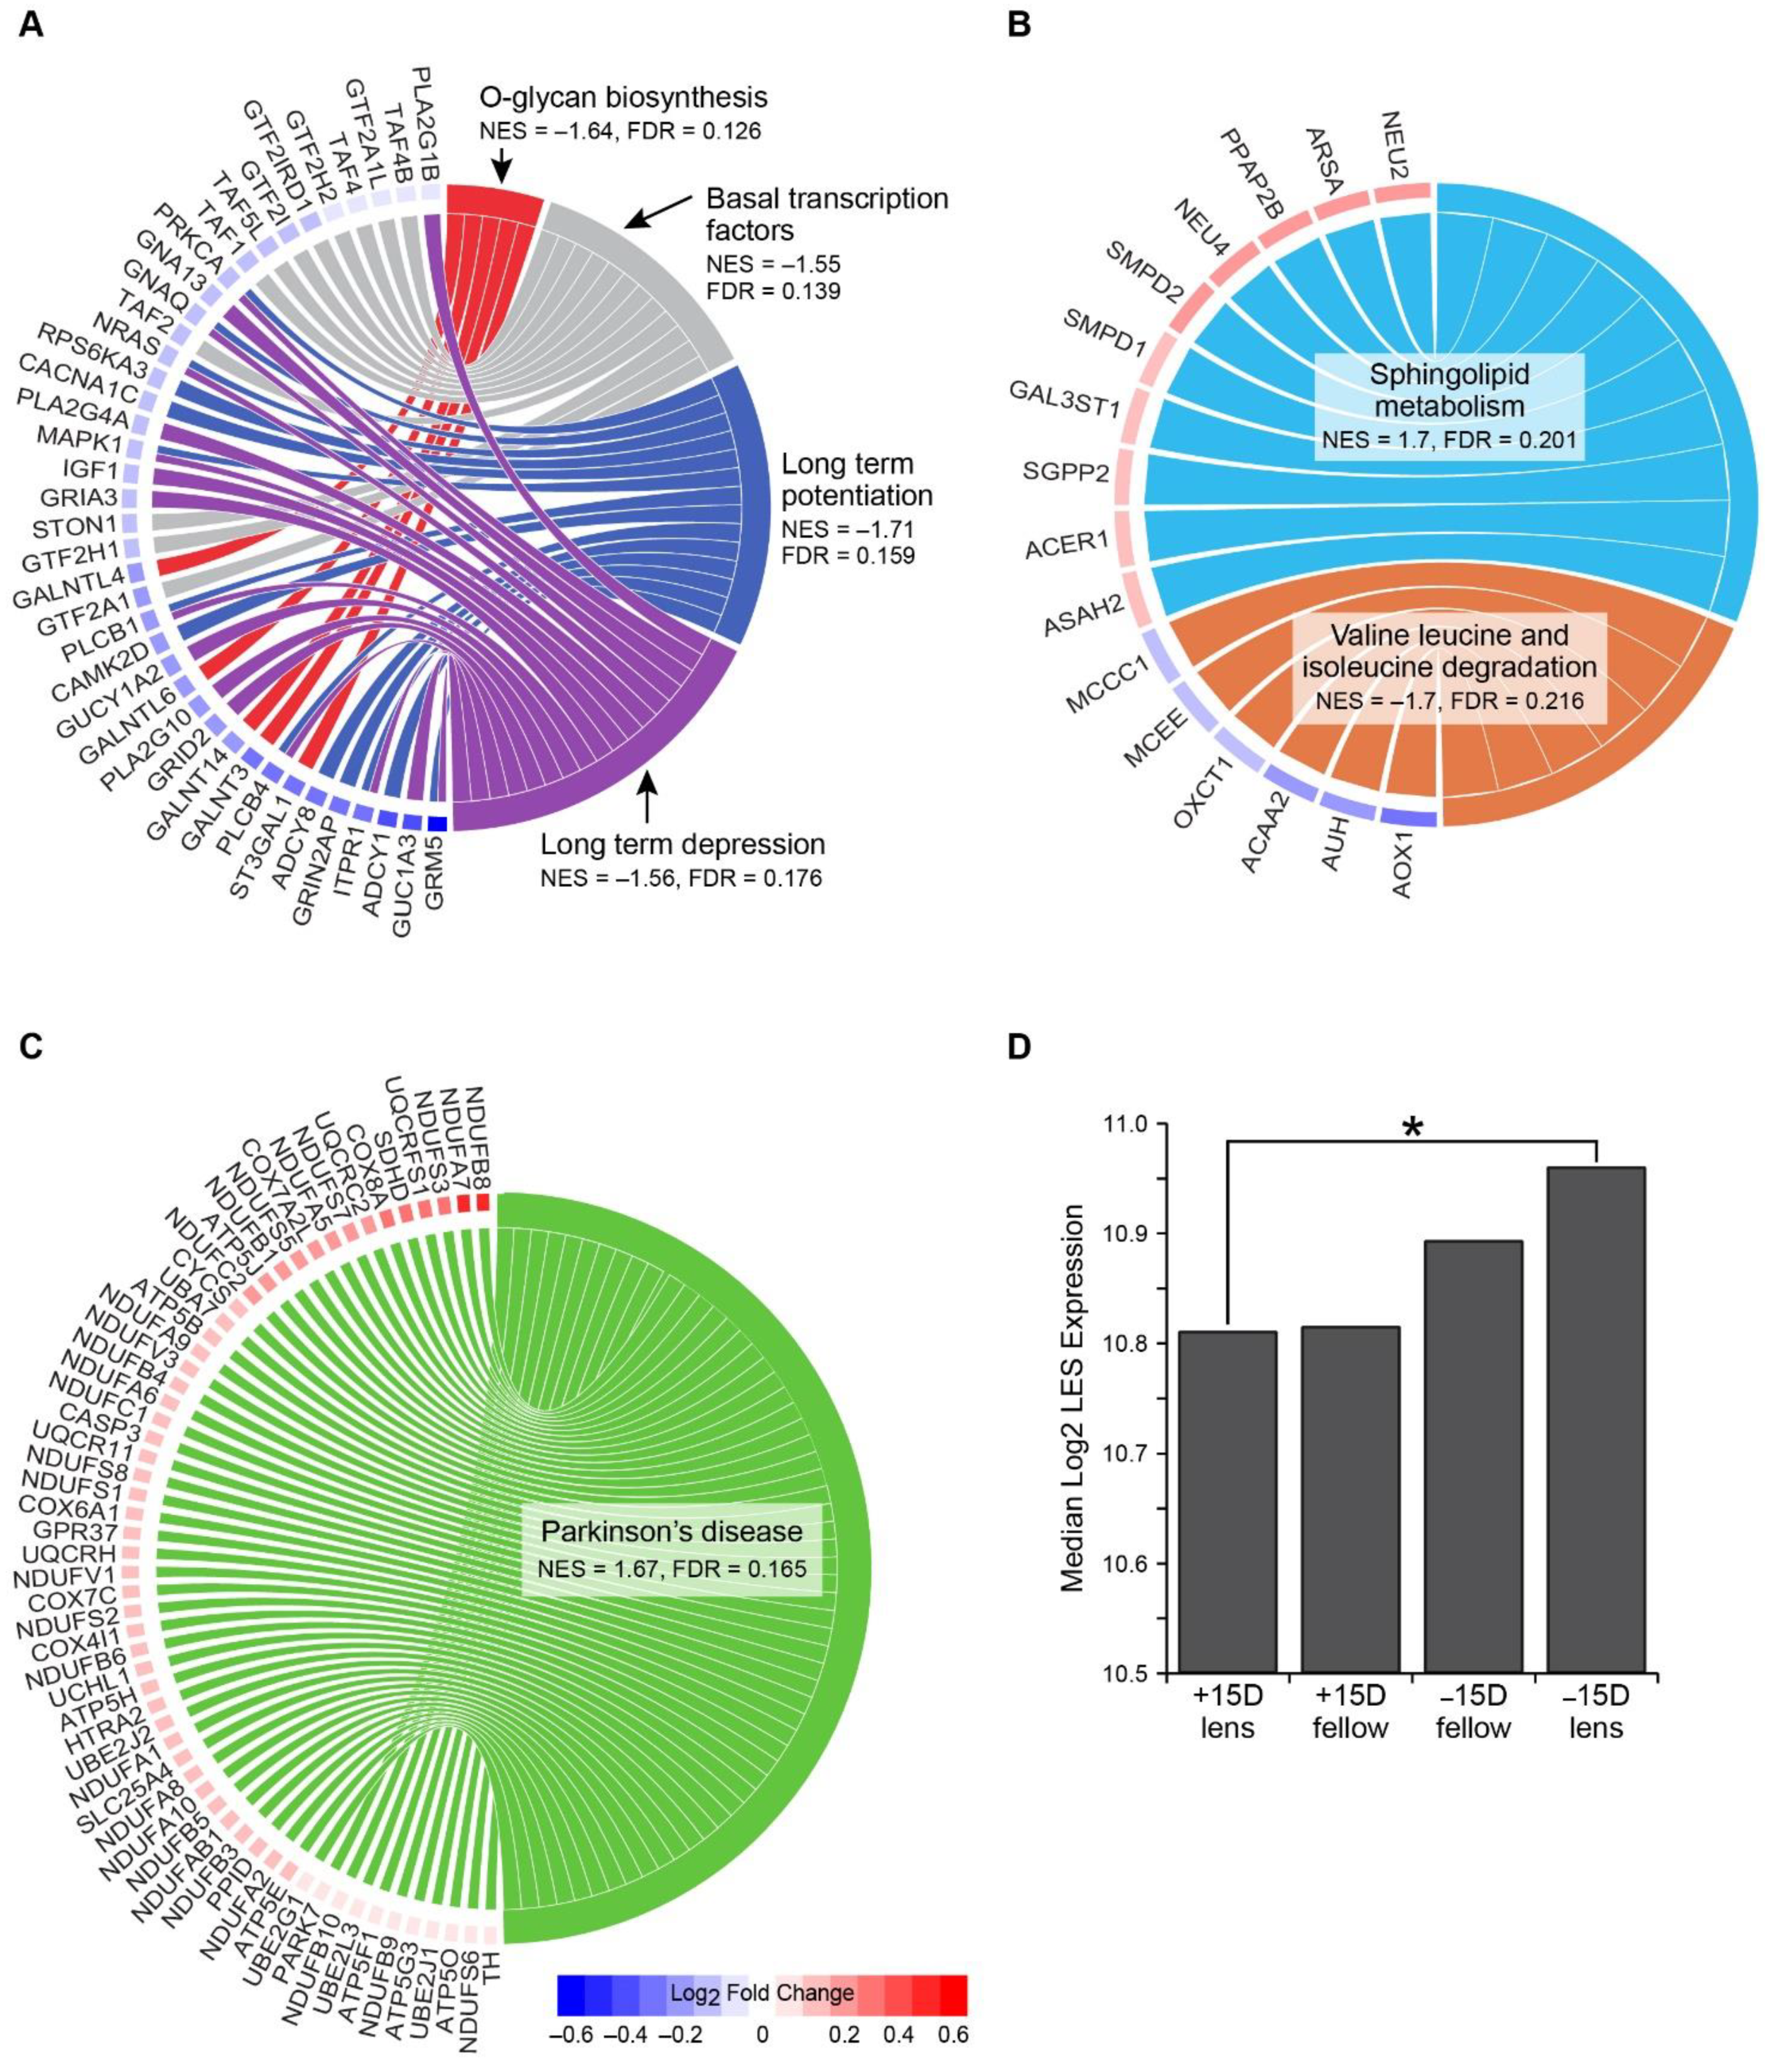
| Negative lens vs. fellow no lens at 6 h | O-glycan biosynthesis | −1.64 | 0.126 | 19% | 7% | 21% |
| Basal transcription factors | −1.55 | 0.139 | 44% | 21% | 57% | |
| Long-term potentiation | −1.71 | 0.159 | 28% | 9% | 31% | |
| Long-term depression | −1.56 | 0.176 | 31% | 13% | 35% | |
| Positive lens vs. fellow no lens at 6 h | Sphingolipid metabolism | 1.70 | 0.201 | 30% | 10% | 34% |
| Valine, leucine, and isoleucine degradation | −1.70 | 0.216 | 15% | 10% | 17% | |
| Negative lens vs. positive lens at 6 h | Parkinson’s disease | 1.67 | 0.165 | 66% | 42% | 114% |
Publisher’s Note: MDPI stays neutral with regard to jurisdictional claims in published maps and institutional affiliations. |
© 2021 by the authors. Licensee MDPI, Basel, Switzerland. This article is an open access article distributed under the terms and conditions of the Creative Commons Attribution (CC BY) license (https://creativecommons.org/licenses/by/4.0/).
Share and Cite
Riddell, N.; Murphy, M.J.; Crewther, S.G. Electroretinography and Gene Expression Measures Implicate Phototransduction and Metabolic Shifts in Chick Myopia and Hyperopia Models. Life 2021, 11, 501. https://doi.org/10.3390/life11060501
Riddell N, Murphy MJ, Crewther SG. Electroretinography and Gene Expression Measures Implicate Phototransduction and Metabolic Shifts in Chick Myopia and Hyperopia Models. Life. 2021; 11(6):501. https://doi.org/10.3390/life11060501
Chicago/Turabian StyleRiddell, Nina, Melanie J. Murphy, and Sheila G. Crewther. 2021. "Electroretinography and Gene Expression Measures Implicate Phototransduction and Metabolic Shifts in Chick Myopia and Hyperopia Models" Life 11, no. 6: 501. https://doi.org/10.3390/life11060501
APA StyleRiddell, N., Murphy, M. J., & Crewther, S. G. (2021). Electroretinography and Gene Expression Measures Implicate Phototransduction and Metabolic Shifts in Chick Myopia and Hyperopia Models. Life, 11(6), 501. https://doi.org/10.3390/life11060501