Abstract
The aim of this study was to identify latent groups of similar trajectories in processing speed through aging, as well as factors that are associated with these trajectories. In the context of the Ageing Trajectories of Health: Longitudinal Opportunities and Synergies (ATHLOS) project, data from the English Longitudinal Study of Aging (ELSA) (n = 12099) were analyzed. Latent groups of similar trajectories in the processing scores as well as their predictors and covariates were investigated, using group-based trajectory models (GBTM). The coefficient estimates for potential group predictors correspond to parameters of multinomial logit functions that are integrated in the model. Potential predictors included sex, level of education, marital status, level of household wealth, level of physical activity, and history of smoking, while time-varying covariates included incidence of cardiovascular disease (CVD), diabetes mellitus, depressive symptoms, and sleep disturbances. Four trajectories were identified and named after their baseline scores and shapes: High (4.4%), Middle/Stable (31.5%), Low/Stable (44.5%), and Low Decline (19.6%). Female sex, higher levels of education, mild level of physical activity, having been married, and higher level of wealth were associated with a higher probability of belonging to any of the higher groups compared to the Low/Decline that was set as reference, while presence of CVD, diabetes mellitus, and depressive symptoms were associated with lower processing speed scores within most trajectories. All the aforementioned factors might be valid targets for interventions to reduce the burden of age-related cognitive impairment.
1. Introduction
Ageing is associated with deterioration in cognitive function. This decline is in turn associated with difficulties in performing tasks of everyday living, leading ultimately to disability and dependence. Perseverance of cognitive abilities, through advancing age, is of great importance for individuals to sustain a good quality of life, as well as for societies and public health systems, especially in a setting of population ageing which is observed currently in most developed countries due to the increasing life expectancy. Given the variation that is observed in age related cognitive decline, a better understanding of the predictors and the determinants of cognitive performance and cognitive deterioration that is associated with ageing holds great importance, as it could set the basis for targeted interventions that could reduce the burden of dependence among older adults.
Cognitive performance is conceptualized as a set of different domains organized in a hierarchical order, with the bottom referring to basic sensory and perceptual abilities and the top referring to more complex functional abilities [1]. These different domains are not independent from one another as lower order functions enable the individual to receive, understand and remember information which will in turn be utilized through higher order functions of analysis and eventually synthesis. However, when examining different domains of cognition separately, there is variation in how these domains change with advancing age [2]. Generally, abilities such as executive function, memory and processing speed are reported to decline from midlife, while general knowledge remains more stable through ageing [3,4].
Processing speed has been described as an inherent ability similar to the clock speed of a computer in the sense that it dictates how long it will take for any cognitive task to be completed [5]. Consequently, processing speed is regarded a fundamental part of the cognitive system and it has been suggested that it is the reduction of this speed that mainly contributes to the impairment of cognitive functioning that is associated with age [6]. In fact, processing speed tends to be the strongest predictor of overall cognitive performance, loading highest in single factor solutions of cognitive ability [1]. However, little is known regarding the trajectories of processing speed performance through aging and their determinants, with a recent study by Bott et al. [7] associating a more stable course with genetic factors, lower inflammation and lifestyle characteristics such as physical activity.
The aim of this study is to identify latent groups of individuals with similar trajectories in processing speed as measured in the English Longitudinal Study of Aging (ELSA) dataset as well as to evaluate potential time-stable and time-varying determinants of each trajectory. Given the large sample and high quality of ELSA along with the significance of processing speed as a potential predictor of cognitive function in general, this analysis might provide valuable insight in the course of this specific cognitive domain through aging as well as age-related cognitive impairment in general.
2. Materials and Methods
2.1. Design and Setting
Data from a national and representative study of the English population, i.e., the English Longitudinal Study of Aging (ELSA), were used in this work [8]. ELSA is large-scale, panel study of 12,099 participants, aged ≥50 years, living in England, and is one of the longitudinal studies included in the ATHLOS project (an EU/HORIZON2020 funded project that aims to identify health trajectories and determinants of aging) [9]. Participants were recruited from households using a multistage stratified random probability design. Study’s participants were re-examined during the study’s course (2002–2012) in six-periodic examinations (waves), every 2 years, i.e., in 2004 (wave 2), 2006 (wave 3), 2008 (wave 4), 2010 (wave 5), and 2012 (wave 6).
All participants have given informed consent. Ethical approval for all the ELSA waves was granted from the National Research Ethics Service (MREC/01/2/91). Details of the ELSA study design, sample and data collection are available at the ELSA’s project website (https://www.elsa-project.ac.uk/, 18 April 2021).
2.2. Measurements
2.2.1. Processing Speed Assessment
Processing speed was assessed with a letter cancellation test. Participants had to identify and cross out as many of two target letters as possible from a page that included random letters in rows and columns in one minute [10]. The total number of correctly crossed out letters provided the measure of processing speed. The same test was performed in every wave that was included in the analysis.
2.2.2. Baseline and Follow-Up Assessments
Participants’ baseline characteristics that were extracted from the ELSA dataset included sociodemographic and lifestyle factors. In particular, sex, age (in years), level of education (A-level or above rated as “high”, secondary education rated as medium and no qualifications rated as low), smoking habits (ever smoked, yes/no), level of physical activity on a weekly basis (rated as low, mild, moderate, and vigorous), marital status (never married, married, divorced or separated and widowed), history of smoking and level of wealth. Moreover, time-varying covariates measured in the 4 following waves included clinical characteristics, and particularly incidence of type 2 diabetes mellitus, any form of cardiovascular disease, as well as self-reported depression symptoms and sleep disturbances. These factors were studied here as they have been associated, directly or indirectly, with the main outcome of interest, cognitive function assessed in this study with processing speed performance.
2.3. Statistical Analysis
Trajectories were estimated using group-based trajectory modeling (GBTM) [11]. This method fits a semi-parametric mixture model to longitudinal data using a maximum-likelihood method. The outcome variable was processing speed scores measured in waves 1 (baseline) to 5. Censored normal distribution model was selected as the outcome variable was handled as a continuous variable. The time metric of the model was the years an individual participated in the study (i.e., 1–8 years) as resulted by the number of waves (i.e., waves 2, 3, 4, and 5 correspond to 2, 4, 6, and 8 years in study, respectively). The number and polynomial shape of trajectories were selected based on the minimum value of the Bayesian Information Criterion (BIC) [12], after testing all potential models for two to four distinct groups for each age group before introducing covariates. The validity of the model was confirmed by calculating average posterior probability for each group as posterior probability higher than 70% indicates optimal fit. The selection of the model was made before introducing covariates. After the optimal model was chosen, time-stable and time-varying covariates were introduced simultaneously. Time stable covariates are baseline characteristics as described above that act as predictors of membership probability for each trajectory. Time-varying covariates are variables that may be positively or negatively correlated with the outcome variable within each trajectory. Categorical variables with more than two categories (education, level of physical activity and marital status) were introduced as dummy variables with one category set as reference. Level of wealth was available as the quintile of total household of each participant. The existing ordinal five-class variable describing participants’ wealth status was reclassified into a binary variable by merging classes 3, 4, and 5 (corresponding to the respective quintiles). Five time points were included in GBTM which were the 5 consecutive waves. The number of subjects varied in each wave. GBTM handles missing data by fitting the model using maximum likelihood estimation, based on the assumption that data are missing at random (MAR). Results are presented as odds ratio (OR) and 95% confidence interval (CI) for ORs for the time-stable covariates are estimated with a logistic function that is incorporated in GBTM package, accounting for for multiple correction and are interpreted as predictors of probability of belonging to each trajectory versus on that was set as baseline (Low). Statistical significance was considered at the level of a p-value < 0.05. The analyses were made using STATA Traj plug-in (Stata Corp., College Station, TX) [13].
3. Results
3.1. Baseline Characteristics of the Study Participants
The sample at baseline consisted of 12.099 individuals. The majority of them were female (55.9%). Their mean age was 64.11 years at baseline (Range 50–94, SD = 10.26). 12.6% had received high level of education, 42.10% were of medium educational, while the remaining 45.3% had received low level education. The majority were married (70.58%), had a history of smoking (63%), and reported a mild level of physical activity (45.2%). Regarding the variables that were measured as time varying covariates, at baseline the majority did not report any history of cardiovascular incidents (85%), no depressive symptoms (80%), no history of diabetes mellitus (92.9%), and reported sleeping disturbances (57.38%). The mean processing speed score was 17.66 letters per minute at baseline. Table 1 summarizes the baseline characteristics of the study participants.

Table 1.
Baseline characteristics of the ELSA study participants that included in the present analyses.
3.2. Trajectories of Processing Speed
A four-group model of first polynomial order for groups one, three and four and cubic for group two presented the best BIC values. More information about the selection of the model is provided in the Appendix A. Trajectory lines were named to describe their baseline scores and shapes as High, Middle/Stable, Low/Stable, and Low/Decline. Overall, 19.6% of the participants were classified the Low/Decline trajectory, 44.5% to the Low/Stable group, 31.5% to the Middle/Stable group, and 4.4% were classified to the High group. Figure 1 depicts trajectory lines.
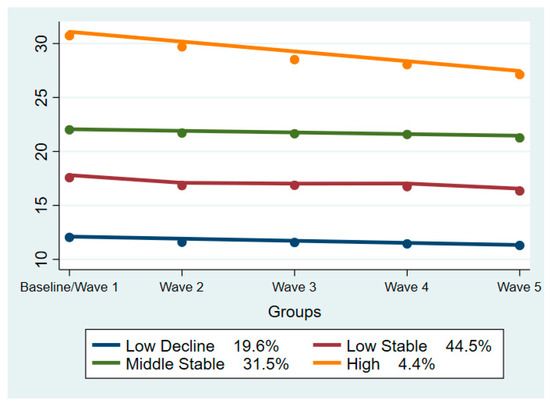
Figure 1.
Trajectories of Processing Speed among the ELSA study participants. Model BIC value: −117,683.39.
Table 2 summarizes the characteristics of time-stable covariates in our model. These parameters were used as predictors of the probability of belonging to each favorable trajectory, expressed as and odds ratio, compared to the probability of belonging to the “Low/Decline” group which was set as reference. Male sex was associated with a significantly lower probability of belonging to any favorable trajectory. The odds ratio was 0.42, 0.17, and 0.10 in the “Low/Stable”, “Middle/Stable”, and “High” groups, respectively.
Table 2.
Results from logistic regression models that evaluated factors associated with processing speed in the ELSA study participants.
On the contrary, higher level of education was a strong a predictor of higher probability of belonging to all three favorable trajectories compared to the “Low/Decline” group. Both “Medium” and “High” level of education presented a statistically significant odds ratio favoring the probability of belonging to the favorable trajectories compared to the “Low” level of education that was set as reference.
Regarding marital status, the category “widowed” was the one that was associated with lower probability of belonging to any of the favorable groups. However, the association was only significant in the “High” vs “Low/Decline” group comparison (p-value = 0.003, OR = 0.43). On the contrary, the categories “Separated or Divorced” and “Married” both presented an increased likelihood of belonging to the favorable groups compared to the category “not married” that was set as reference.
As for level of self-reported physical activity, the category that was associated with most beneficial results was the “Mild”, which was associated with significantly increased probability of belonging to all the favorable groups. On the other hand, both “Moderate” and “Vigorous” levels of physical activity were consistently associated with less likelihood of belonging to any of the favorable trajectories compared to the “No Physical Activity” category that was used as reference.
3.3. Processing Speed Trajectories in Relation to Chronic Illnesses
Incidence of cardiovascular events was inversely associated with the scores of processing speed in all trajectories. This association was statistically significant in all groups except for the “Low/Decline”. The same relationship was also observed between processing speed and presence of diabetes mellitus and was significant in all the groups except for the “High”. The presence of depressive symptoms was also associated with lower scores of processing speed, but this association was only significant in the “Low/Decline” and “Low/Stable” trajectories. Finally, sleeping disturbances were negatively correlated with processing speed scores in the “Low/Decline” trajectory, but positively in the “High” group with a p-value that indicates statistical significance (<0.001 and 0.034 respectively). Table 3 summarizes the time-varying covariates across the four trajectories of processing speed scores, in relation to cardiovascular disease, depressive symptomatology, sleeping disturbances, and diabetes mellitus.
Table 3.
Time-varying covariates of processing speed categories, regarding various health outcomes.
4. Discussion
The present study identified four latent groups of processing speed scores trajectories in our sample. All latent groups presented a slight declining trend over the years. The trajectory with the steepest decreasing trend was the “High” one. This might be mainly attributed to the fact that it is the trajectory that consists of fewer individuals (4.3% of the total sample), so a more rapid decline in some participants will have a greater impact in the overall performance of the group. Previous studies investigating latent classes of cognitive performance assessed with various neuropsychological tests have also identified four or three trajectories [14,15,16] with similar shapes. The slightly less decreasing and more stable trend observed in the trajectories in the present study might be explained by the shorter duration of observation of our study, as cognitive decline is a slow process that might require a longer period to be reflected or the different course of processing speed compared to other cognitive domains. However, what is common in all these studies, including ours, is that the trajectory lines do not mix and higher performance at baseline predicts higher performance also at the end of study, depicting that cognitive performance with advanced age is at some degree dependent on the mental capacity that an individual has at their prime.
Level of education was found to play an important role in the probability of belonging to a favorable trajectory. In particular, medium level of education was a predictor of greater likelihood to belong to all three favorable trajectories, compared to the low level that was set as reference, with a p-value that indicates statistical significance (<0.001 in all three groups). What is interesting is that the OR, that reflects the magnitude of this association, presented an increasing trend from the lowest to the highest trajectory (1.88 in the Low/Stable, 3.48 Middle/Stable, 4.04 in the High). The same trend was observed in the effect of the High level of education, differing but at an even greater scale. The OR of the High level of education versus the low that was set as reference was 2.267, 8.87, 12.39 in the Low/Stable, Middle/Stable and High group respectively. Conclusively, based on these findings, it can be hypothesized that education is a strong predictor of predictor of better cognitive performance and the magnitude of this association increases not only with the increasing level of education but also with the higher cognitive performance. These findings are in line with a recent study be Ferraro et al. [17] where higher number of years of education was associated with better physical, functional and cognitive performance. Education is consistently reported a protective factor for cognitive impairment and dementia [18,19]. The findings of the current study confirm this beneficial effect and highlight the importance of education as a potential modifiable factor that can reduce the burden of cognitive impairment across the ageing population.
Marital status also presented a consistently significant association with our outcome of interest. The categories “Married” and “Divorced or Separated” presented a significantly higher probability of belonging to all three favorable trajectories (except for “High” group with a p value of 0.075 and 0.055 respectively) compared to the “Never Married” category that was set as reference. On the contrary, the category “Widowed” was associated with lower probability of belonging to any favorable group compared to the reference category, which was only significant in the “High” group. Previous studies have also reported the association between widowhood and greater risk for cognitive decline [20] as well as a greater risk for cognitive impairment in single adults compared to those cohabiting with a partner [21]. The findings can be explained by viewing marital status’s effect as part of the overall effect that social life and social isolation have on the cognitive function of older adults [22]. The exact mechanisms behind these effects are not clear, but since this a real-world study any consistent association is worth highlighting as it might set the basis for future research.
The level of self-reported physical activity also presented an interesting association with the trajectories of processing speed in our cohort. “Mild” level of physical activity presented a consistently significant association with greater probability of belonging to any of the favorable trajectories compared to the “no physical activity” that was set as reference. On the contrary, the association between the categories of “Moderate” and “Vigorous” physical activity was just as consistent but inverse, interpreted as less probability of belonging to any of the three favorable groups for both these categories. Physical activity is mainly regarded as a protective factor for the cognitive function of older adults [23]. However, there is no clear consensus regarding its characteristics (type, frequency, duration, intensity) that seem to provide the most beneficial results. In fact, it has been suggested that high intensity exercise might even worsen cognitive performance [24]. From that view, the findings of our study are partly in line with published literature, however based on these alone no further implications can be made.
Finally, level of household wealth also presented a consistent association, as higher level of wealth was a significant predictor of belonging to all three favorable trajectories. This does not come as a surprise as higher socioeconomic status has been associated with better cognitive function in older adults [25] and this is confirmed in the present study.
Regarding time-varying covariates, incidence of cardiovascular events presented a statistically significant negative correlation with processing speed scores across all groups except for the “Low/Decline” where it presented a marginal p-value of 0.094. There is significant evidence in published literature linking cardiovascular fitness and cognitive performance [26]. Aside from vascular dementia where there is the obvious association of cardiovascular health with brain perfusion and cognitive performance, it has been shown that managing cardiovascular risk factors might decrease the risk of other forms of dementia such as Alzheimer’s disease [27]. Although the incidence of diabetes mellitus follows the same principles with the rest of cardiovascular risk factors regarding its association with cognitive function, it seems to hold an exquisite importance [28]. This was reflected in the current study too, where incidence of diabetes mellitus was significantly associated with lower processing speed scores across all trajectories, except for the “High”, where the same association was close to statistical significance with a p-value of 0.062. These findings are in line with those of the study of Marseglia et al. [29] where in a sample of 793 adults over 50 years of age, those with diabetes presented a steeper decline in perceptual speed. Conclusively, based on our findings in addition to what is already known, management of cardiovascular risk factors and especially of diabetes mellitus is an essential target for interventions in order to decrease the burden of cognitive decline in older adults.
Presence of depressive symptoms showed a negative correlation with processing speed scores across all trajectories, which was statistically significant in the two lower groups. Cognitive impairment is mentioned as core feature of depression and not an epiphenomenon [30]. Moreover, it is quite common depressive symptoms (such as memory problems) to be mistakenly attributed to cognitive impairment. Although one cannot establish a clear relationship of cause and effect between cognitive decline and depression, our study confirms the association between these two conditions. The lack of a consistently statistically significant relationship in more trajectories may be partly due to the fact that presence of depressive symptoms was self-reported and not accurately measured with specific neuropsychological scales. Nevertheless, when thinking of targeted interventions, depression should be considered as a potential modifiable factor. Finally, self-reported sleep disturbances did not present a consistent relationship with processing speed scores.
The results of this study should be viewed in the light of its limitations. Firstly, the participants were all living in England, weakening the generalizability of the findings in populations from other countries or continents. Moreover, information on certain variables, such as depressive symptoms, was self-reported and greater detail regarding the duration of these symptoms was not available. Additionally, all participants were included in the analysis. This might result in a degree of heterogeneity, as some of the participants might have already presented mild cognitive impairment or dementia at the beginning of the study, differing significantly in terms of cognitive decline over the years from the rest of the participants. However, despite its limitations this study was based on real world data from a big sample of high-quality longitudinal study and the analyses were made utilizing unbiased techniques. Moreover, this is the first analysis to our knowledge investigating the trajectories of processing speed using the GBTM. Taking these into account, our findings provide useful insight in the course of the processing speed through aging, which in addition to similar analyses of different cognitive domains [9], strengthen our knowledge about the epidemiology of age-related cognitive decline in general.
5. Conclusions
Four latent groups of processing speed were identified in our study. Level of education was a strong predictor of a more favorable trajectory, whereas the presence of cardiovascular diseases and diabetes mellitus were associated with lower processing scores within groups. Depressive symptoms also presented a significant association with lower scores in some groups. The aforementioned factors might represent valid targets for interventions, while future studies might elucidate the significance of the impact of physical activity and social factors, such as marital status, on the cognitive function of older adults.
Author Contributions
Conceptualization, D.P. and V.G.; methodology, D.P. and V.G.; software, G.K. and V.G.; validation, J.M.H., J.L.A., S.C., and D.P.; investigation V.G., and G.K.; writing—original draft preparation, V.G.; writing—review and editing, D.P., A.S.N., F.F.C., S.C., J.M.H., J.L.A., and B.O.; supervision D.P. All authors have read and agreed to the published version of the manuscript.
Funding
This work was supported by the five-year Ageing Trajectories of Health: Longitudinal Opportunities and Synergies (ATHLOS) project. The ATHLOS project has received funding from the European Union’s Horizon 2020 research and innovation program under grant agreement No 635316. ELSA is supported by NationalInstitute on Aging Grants 2R01AG7644–01A1 and2R01AG017644. BO’s work is supported by the PERIS program 2016–2020 “Ajuts per a la Incorporació de Científics i Tecnòlegs” [grant number SLT006/17/00066], with the support of the Health Department of the Generalitat de Catalunya.
Institutional Review Board Statement
Ethical approval for all the ELSA waves was granted from the National Research Ethics Service (MREC/01/2/91).
Informed Consent Statement
All participants have given informed consent.
Acknowledgments
The authors thank the ATHLOS Consortium for useful discussions, and gratefully acknowledge the funding of institutions and the work of people who carried out the studies and provided data for this paper.
Conflicts of Interest
The authors declare no conflict of interest.
Appendix A
Choice of Model
The choice of model was based on the best BIC value. The formula for estimating BIC values in GBTM is BIC = log(L)−0.5klog(N ), and the choice of the model with the highest BIC value is suggested [11]. Alternative models were also tested, but did not differ significantly in the shapes and percentages of the trajectories. After model selection, average posterior probability for each group is estimated to test the fitness of the model. Average posterior probability was calculated and was above 70% percent in all groups, indicating a good fit. Due to one group consisting of less than 5% of the sample, models with three trajectories were also explored. However, they kept producing a similar “high” trajectory consisting of a slightly higher percentage of the sample (7%). Based on these, we decided that the best fitting model was the one that was selected.
Table A1.
Models.
Table A1.
Models.
| Groups | Polynomial Orders | BIC Value |
|---|---|---|
| 4 | 1311 | −117683 |
| 4 | 1312 | −117686 |
| 4 | 1111 | −117686 |
| 4 | 1411 | −117688 |
| 4 | 1112 | −117688 |
| 4 | 2311 | −117688 |
| .. | .. | .. |
| .. | .. | .. |
| 3 | 111 | −118358 |
Table A2.
Average Posterior Probability.
Table A2.
Average Posterior Probability.
| Group | APP |
|---|---|
| 1 | 0.82 |
| 2 | 0.77 |
| 3 | 0.82 |
| 4 | 0.89 |
Table A3.
Participants Per Wave.
Table A3.
Participants Per Wave.
| Wave | Number of Participants |
|---|---|
| 1 | 12,099 |
| 2 | 9432 |
| 3 | 9741 |
| 4 | 11,050 |
| 5 | 10,317 |
Table A4.
Distribution of Determinants Across Trajectories.
Table A4.
Distribution of Determinants Across Trajectories.
| Characteristic | Trajectory | |||
|---|---|---|---|---|
| Marital Status | Low Decline | Middle Decline | Middle Stable | High |
| Single | 219 (2%) | 268 (2.43%) | 51 (0.46%) | 21 (0.19%) |
| Married | 1762 (16%) | 4508 (40.91%) | 1100 (9.98%) | 164 (1.49%) |
| Separated, Divorced | 272 (2.47%) | 561 (5.1%) | 176 (1.6%) | 19 (0.17%) |
| Widowed | 516 (4.68%) | 1030 (9.35%) | 309 (2.8%) | 44 (0.4%) |
| Sex, males | 1749 (15.87%) | 2791 (25.33%) | 436 (3.96%) | 54 (0.5%) |
| Education | ||||
| Low | 1635 (16/27%) | 2497 (24.85%) | 486 (4.84%) | 83 (0.83%) |
| Medium | 800 (7.26%) | 2541 (23.06%) | 678 (6.15%) | 107 (0.97%) |
| High | 116 (1.05%) | 762 (6.91%) | 302 (2.74%) | 41 (0.37%) |
| Physical activity level | ||||
| No Physical Activity | ||||
| Mild | 903 (8.19%) | 2676 (24.28%) | 810 (7.35%) | 119 (1.08%) |
| Moderate | 671 (6.09%) | 1210 (10.1%) | 387 (3.51%) | 54 (0.5%) |
| Vigorous | 339 (3.08%) | 222 (2.01%) | 52 (0.47%) | 3 (0.03%) |
| NA values | ||||
| Ever smoked, yes | 1915 (17.38%) | 4103 (37.23%) | 946 (8.58%) | 149 (1.35%) |
| CVD, yes | 562 (5.1%) | 926 (8.4%) | 192 (1.72%) | 25 (0.23%) |
| Diabetes, yes | 265 (2.41%) | 452 (4.1%) | 88 (0.8%) | 13 (0.12%) |
| Depressive Symptoms, yes | 601 (5.54%) | 949 (8.75%) | 227 (2.09%) | 22 (0.2%) |
| Sleeping Disturbances, yes | 1554 (14.3%) | 3728 (34.31%) | 967 (8.9%) | 161 (1.48%) |
References
- Harvey, P.D. Domains of cognition and their assessment. Dialogues Clin. Neurosci. 2019, 21, 227–237. [Google Scholar] [CrossRef]
- Gale, C.R.; Allerhand, M.; Sayer, A.A.; Cooper, C.; Deary, I.J. The dynamic relationship between cognitive function and walking speed: The English Longitudinal Study of Ageing. Age 2014, 36, 9682. [Google Scholar] [CrossRef] [PubMed]
- Park, D.C.; Reuter-Lorenz, P. The adaptive brain: Aging and neurocognitive scaffolding. Annu. Rev. Psychol. 2009, 60, 173–196. [Google Scholar] [CrossRef] [PubMed]
- Singh-Manoux, A.; Kivimaki, M.; Glymour, M.M.; Elbaz, A.; Berr, C.; Ebmeier, K.P.; Ferrie, J.E.; Dugravot, A. Timing of onset of cognitive decline: Results from Whitehall II prospective cohort study. BMJ 2012, 344, d7622. [Google Scholar] [CrossRef] [PubMed]
- Ridderinkhof, K.R.; van der Molen, M.W. Mental resources, processing speed, and inhibitory control: A developmental perspective. Biol. Psychol. 1997, 21, 241–261. [Google Scholar] [CrossRef]
- Salthouse, T.A. The processing-speed theory of adult age differences in cognition. Psychol. Rev. 1996, 103, 403–428. [Google Scholar] [CrossRef]
- Bott, N.T.; Bettcher, B.M.; Yokoyama, J.S.; Frazier, D.T.; Wynn, M.; Karydas, A.; Yaffe, K.; Kramer, J.H. Youthful Processing Speed in Older Adults: Genetic, Biological, and Behavioral Predictors of Cognitive Processing Speed Trajectories in Aging. Front. Aging Neurosci. 2017, 9, 55. [Google Scholar] [CrossRef]
- Steptoe, A.; Breeze, E.; Banks, J.; Nazroo, J. Cohort Profile: The English Longitudinal Study of Ageing. Int. J. Epidemiol. 2013, 42, 1640–1648. [Google Scholar] [CrossRef] [PubMed]
- Sanchez-Niubo, A.; Egea-Cortés, L.; Olaya, B.; Caballero, F.F.; Ayuso-Mateos, J.L.; Prina, M.; Bobak, M.; Arndt, H.; Tobiasz-Adamczyk, B.; Pająk, A.; et al. The Ageing Trajectories of Health-Longitudinal Opportunities and Synergies (ATHLOS) project. Int. J. Epidemiol. 2019, 48, 1052–1053. [Google Scholar] [CrossRef]
- de la Fuente, J.; Hjelmborg, J.; Wod, M.; de la Torre-Luque, A.; Caballero, F.F.; Christensen, K.; Ayuso-Mateos, J.L. Longitudinal Associations of Sensory and Cognitive Functioning: A Structural Equation Modeling Approach. J. Gerontol. B Psychol. Sci. Soc. Sci. 2019, 74, 1308–1316. [Google Scholar] [CrossRef] [PubMed]
- Nagin, D. Group-Based Modeling of Development; Harvard University Press: Cambridge, MA, USA, 2005. [Google Scholar]
- Nagin, D.S.; Odgers, C.L. Group-Based Trajectory Modeling in Clinical Research. Annu. Rev. Clin. Psychol. 2010, 6, 109–138. [Google Scholar] [CrossRef] [PubMed]
- Jones, B.L.; Nagin, D.S. A Note on a Stata plugin for estimating group-based trajectory models. Sociol. Methods Res. 2013, 42, 608–613. [Google Scholar] [CrossRef]
- Olaya, B.; Bobak, M.; Haro, J.M.; Demakakos, P. Trajectories of Verbal Episodic Memory in Middle-Aged and Older Adults: Evidence from the English Longitudinal Study of Ageing. J. Am. Geriatr. Soc. 2017, 65, 1274–1281. [Google Scholar] [CrossRef] [PubMed]
- Zahodne, L.B.; Wall, M.M.; Schupf, N.; Mayeux, R.; Manly, J.J.; Stern, Y.; Brickman, A.M. Late-life memory trajectories in relation to incident dementia and regional brain atrophy. J. Neurol. 2015, 262, 2484–2490. [Google Scholar] [CrossRef] [PubMed]
- Terrera, G.M.; Brayne, C.; Matthews, F.; the CC75C Study Collaboration Group. One size fits all? Why we need more sophisticated analytical methods in the explanation of trajectories of cognition in older age and their potential risk factors. Int. Psychogeriatr. 2010, 22, 291–299. [Google Scholar] [CrossRef]
- Ferraro, O.E.; Guaita, A.; Villani, S. Cognitive, physical and disability trajectories in community-dwelling elderly people [published online ahead of print, 2021 Feb 16]. Aging Clin. Exp. Res. 2021. [Google Scholar] [CrossRef]
- McDowell, I.; Xi, G.; Lindsay, J.; Tierney, M. Mapping the connections between education and dementia. J. Clin. Exp. Neuropsychol. 2007, 29, 127–141. [Google Scholar] [CrossRef]
- Schmand, B.; Smit, J.; Lindeboom, J.; Smits, C.; Hooijer, C.; Jonker, C.; Deelman, B. Low education is a genuine risk factor for accelerated memory decline and dementia. J. Clin. Epidemiol. 1997, 50, 1025–1033. [Google Scholar] [CrossRef]
- Biddle, K.D.; Jacobs, H.I.L.; d’Oleire Uquillas, F.; Zide, B.S.; Kirn, D.R.; Properzi, M.R.; Rentz, D.M.; Johnson, K.A.; Sperling, R.A.; Donovan, N.J. Associations of Widowhood and β-Amyloid With Cognitive Decline in Cognitively Unimpaired Older Adults. JAMA Netw. Open 2020, 3, e200121. [Google Scholar] [CrossRef]
- Håkansson, K.; Rovio, S.; Helkala, E.-L.; Vilska, A.-R.; Winblad, B.; Soininen, H.; Nissinen, A.; Mohammed, A.H.; Kivipelto, M. Association between mid-life marital status and cognitive function in later life: Population based cohort study. BMJ 2009, 339, b2462. [Google Scholar] [CrossRef]
- Evans, I.E.; Martyr, A.; Collins, R.; Brayne, C.; Clare, L. Social Isolation and Cognitive Function in Later Life: A Systematic Review and Meta-Analysis. J. Alzheimer’s Dis. 2019, 70, S119–S144. [Google Scholar] [CrossRef] [PubMed]
- Northey, J.M.; Cherbuin, N.; Pumpa, K.L.; Smee, D.J.; Rattray, B. Exercise interventions for cognitive function in adults older than 50: A systematic review with meta-analysis. Br. J. Sports Med. 2018, 52, 154–160. [Google Scholar] [CrossRef]
- Chang, H.; Kim, K.; Jung, Y.-J.; Kato, M. Effects of acute high-intensity resistance exercise on cognitive function and oxygenation in prefrontal cortex. J. Exerc. Nutr. Biochem. 2017, 21, 1–8. [Google Scholar] [CrossRef] [PubMed]
- Zhang, M.; Gale, S.D.; Erickson, L.D.; Brown, B.L.; Woody, P.; Hedges, D.W. Cognitive function in older adults according to current socioeconomic status. Neuropsychol. Dev. Cogn. B Aging Neuropsychol. Cogn. 2015, 22, 534–543. [Google Scholar] [CrossRef] [PubMed]
- Stuckenschneider, T.; Askew, C.D.; Rüdiger, S.; Polidori, M.C.; Abeln, V.; Vogt, T.; Krome, A.; Rikkert, M.O.; Lawlor, B.; Schneider, S.; et al. Cardiorespiratory Fitness and Cognitive Function are Positively Related Among Participants with Mild and Subjective Cognitive Impairment. J. Alzheimer’s Dis. 2018, 62, 1865–1875. [Google Scholar] [CrossRef]
- Fillit, H.; Nash, D.T.; Rundek, T.; Zuckerman, A. Cardiovascular risk factors and dementia. Am. J. Geriatr. Pharmacother. 2008, 6, 100–118. [Google Scholar] [CrossRef]
- Moheet, A.; Mangia, S.; Seaquist, E.R. Impact of diabetes on cognitive function and brain structure. Ann. N. Y. Acad. Sci. 2015, 1353, 60–71. [Google Scholar] [CrossRef] [PubMed]
- Marseglia, A.; Aslan, A.K.D.; Fratiglioni, L.; Santoni, G.; Pedersen, N.L.; Xu, W. Cognitive Trajectories of Older Adults With Prediabetes and Diabetes: A Population-Based Cohort Study. J. Gerontol. Ser. A Biol. Sci. Med. Sci. 2018, 73, 400–406. [Google Scholar] [CrossRef]
- Rock, P.L.; Roiser, J.P.; Riedel, W.J.; Blackwell, A.D. Cognitive impairment in depression: A systematic review and meta-analysis. Psychol. Med. 2014, 44, 2029–2040. [Google Scholar] [CrossRef]
Publisher’s Note: MDPI stays neutral with regard to jurisdictional claims in published maps and institutional affiliations. |
© 2021 by the authors. Licensee MDPI, Basel, Switzerland. This article is an open access article distributed under the terms and conditions of the Creative Commons Attribution (CC BY) license (https://creativecommons.org/licenses/by/4.0/).