Prevalence of Epiretinal Membrane among Subjects in a Health Examination Program in Japan

 ,
,
Abstract
1. Introduction
2. Subjects and Methods
2.1. Subjects
2.2. Detection of ERM Using Color Fundus Photographs
2.3. Statistical Analysis
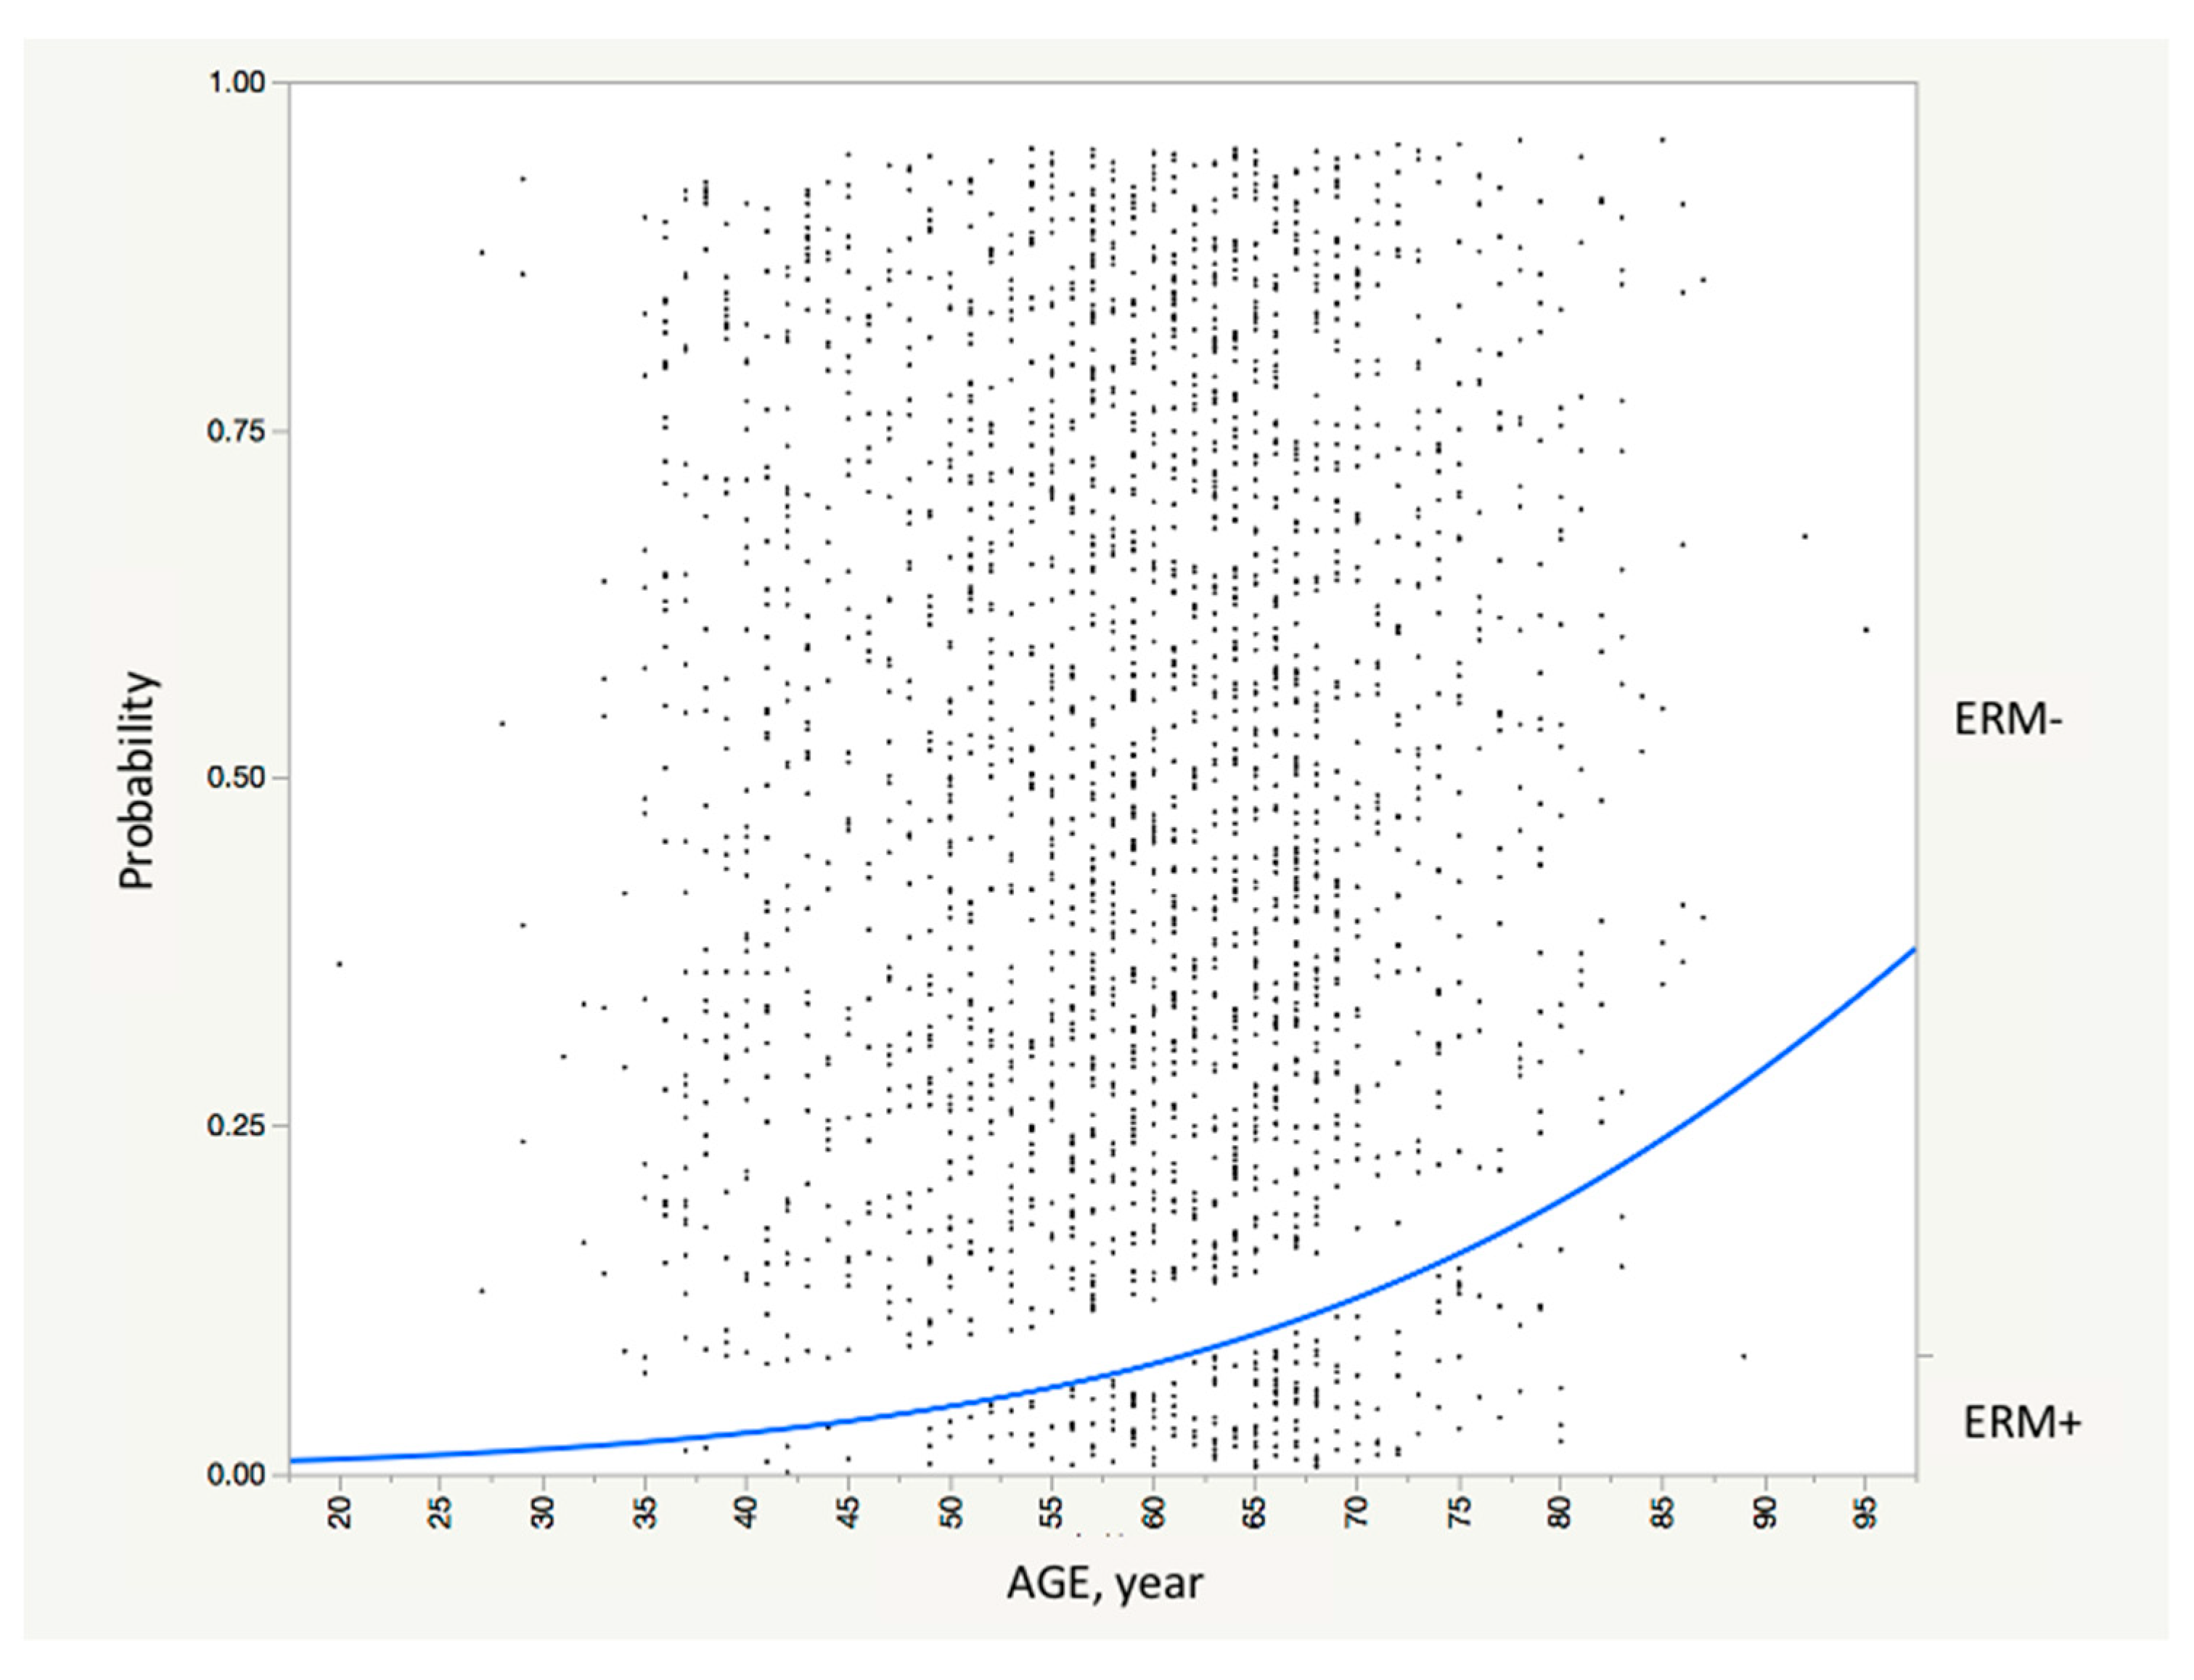
3. Results
4. Discussion
5. Conclusions
Author Contributions
Funding
Institutional Review Board Statement
Informed Consent Statement
Data Availability Statement
Conflicts of Interest
References
- Folk, J.C.; Adelman, R.A.; Flaxel, C.J.; Hyman, L.; Pulido, J.S.; Olsen, T.W. Idiopathic epiretinal membrane and vitreomacular traction preferred practice pattern® guidelines. Ophthalmology 2016, 123, P152–P181. [Google Scholar] [CrossRef] [PubMed]
- Klein, R.; Klein, B.E.; Wang, Q.; Moss, S.E. The epidemiology of epiretinal membranes. Trans. Am. Ophthalmol. Soc. 1994, 92, 403–430. [Google Scholar] [PubMed]
- Fraser-Bell, S.; Ying-Lai, M.; Klein, R.; Varma, R. Prevalence and associations of epiretinal membranes in latinos: The Los Angeles Latino Eye Study. Investig. Ophthalmol. Vis. Sci. 2004, 45, 1732–1736. [Google Scholar] [CrossRef] [PubMed]
- Ng, C.H.; Cheung, N.; Wang, J.J.; Islam, A.F.; Kawasaki, R.; Meuer, S.M.; Cotch, M.F.; Klein, B.E.; Klein, R.; Wong, T.Y. Prevalence and risk factors for epiretinal membranes in a multi-ethnic United States population. Ophthalmology 2011, 118, 694–699. [Google Scholar] [CrossRef]
- Cheung, N.; Tan, S.P.; Lee, S.Y.; Cheung, G.C.M.; Tan, G.; Kumar, N.; Cheng, C.Y.; Wong, T.Y. Prevalence and risk factors for epiretinal membrane: The Singapore Epidemiology Of Eye Disease Study. Br. J. Ophthalmol. 2017, 101, 371–376. [Google Scholar] [CrossRef]
- Kawasaki, R.; Wang, J.J.; Mitchell, P.; Aung, T.; Saw, S.M.; Wong, T.Y. Racial difference in the prevalence of epiretinal membrane between Caucasians and Asians. Br. J. Ophthalmol. 2008, 92, 1320–1324. [Google Scholar] [CrossRef]
- Koh, V.; Cheung, C.Y.; Wong, W.L.; Cheung, C.M.; Wang, J.J.; Mitchell, P.; Younan, C.; Saw, S.M.; Wong, T.Y. Prevalence and risk factors of epiretinal membrane in Asian Indians. Investig. Ophthalmol. Vis. Sci. 2012, 53, 1018–1022. [Google Scholar] [CrossRef]
- Duan, X.R.; Liang, Y.B.; Friedman, D.S.; Sun, L.P.; Wei, W.B.; Wang, J.J.; Wang, G.L.; Liu, W.; Tao, Q.S.; Wang, N.L.; et al. Prevalence and associations of epiretinal membranes in a rural Chinese adult population: The Handan Eye Study. Investig. Ophthalmol. Vis. Sci. 2009, 50, 2018–2023. [Google Scholar] [CrossRef]
- Ye, H.; Zhang, Q.; Liu, X.; Cai, X.; Yu, W.; Yu, S.; Wang, T.; Lu, W.; Li, X.; Hu, Y.; et al. Prevalence and associations of epiretinal membrane in an elderly urban Chinese population in China: The Jiangning Eye Study. Br. J. Ophthalmol. 2015, 99, 1594–1597. [Google Scholar] [CrossRef]
- You, Q.; Xu, L.; Jonas, J.B. Prevalence and associations of epiretinal membranes in adult Chinese: The Beijing Eye Study. Eye 2008, 22, 874–879. [Google Scholar] [CrossRef]
- Zhu, X.F.; Peng, J.J.; Zou, H.D.; Fu, J.; Wang, W.W.; Xu, X.; Zhang, X. Prevalence and risk factors of idiopathic epiretinal membranes in Beixinjing blocks, Shanghai, China. PLoS ONE 2012, 7, e51445. [Google Scholar] [CrossRef] [PubMed]
- Bae, J.H.; Song, S.J.; Lee, M.Y. Five-year incidence and risk factors for idiopathic epiretinal membranes. Retina 2019, 39, 753–760. [Google Scholar] [CrossRef] [PubMed]
- Kim, J.M.; Lee, H.; Shin, J.P.; Ahn, J.; Yoo, J.M.; Song, S.J.; Kim, S.J.; Kang, S.W. Epiretinal membrane: Prevalence and risk factors from the Korea National Health And Nutrition Examination Survey, 2008 through 2012. Korean J. Ophthalmol. 2017, 31, 514–523. [Google Scholar] [CrossRef] [PubMed]
- Aung, K.Z.; Makeyeva, G.; Adams, M.K.; Chong, E.W.; Busija, L.; Giles, G.G.; English, D.R.; Hopper, J.; Baird, P.N.; Guymer, R.H.; et al. The prevalence and risk factors of epiretinal membranes: The Melbourne Collaborative Cohort Study. Retina 2013, 33, 1026–1034. [Google Scholar] [CrossRef] [PubMed]
- Keel, S.; Xie, J.; Foreman, J.; van Wijngaarden, P.; Taylor, H.R.; Dirani, M. Prevalence and associations of epiretinal membranes in the Australian National Eye Health Survey. Acta Ophthalmol. 2017, 95, e796–e798. [Google Scholar] [CrossRef][Green Version]
- Mitchell, P.; Smith, W.; Chey, T.; Wang, J.J.; Chang, A. Prevalence and associations of epiretinal membranes. The blue mountains eye study, Australia. Ophthalmology 1997, 104, 1033–1040. [Google Scholar] [CrossRef]
- Wang, S.B.; Mitchell, P.; Plant, A.J.; Phan, K.; Liew, G.; Chiha, J.; Thiagalingam, A.; Burlutsky, G.; Gopinath, B. Prevalence and risk factors of epiretinal membrane in a cohort with cardiovascular disease risk, compared with the Blue Mountains Eye Study. Br. J. Ophthalmol. 2015, 99, 1601–1605. [Google Scholar] [CrossRef]
- Delyfer, M.N.; Legout, P.; Le Goff, M.; Blaizeau, M.; Rougier, M.B.; Schweitzer, C.; Korobelnik, J.F.; Delcourt, C. Prevalence of epiretinal membranes in the ageing population using retinal colour images and sd-oct: The Alienor Study. Acta Ophthalmol. 2020, 98, e830–e838. [Google Scholar] [CrossRef]
- Miyazaki, M.; Nakamura, H.; Kubo, M.; Kiyohara, Y.; Iida, M.; Ishibashi, T.; Nose, Y. Prevalence and risk factors for epiretinal membranes in a Japanese population: The Hisayama Study. Graefes Arch. Clin. Exp. Ophthalmol 2003, 241, 642–646. [Google Scholar] [CrossRef]
- Kawasaki, R.; Wang, J.J.; Sato, H.; Mitchell, P.; Kato, T.; Kawata, S.; Kayama, T.; Yamashita, H.; Wong, T.Y. Prevalence and associations of epiretinal membranes in an adult Japanese population: The Funagata Study. Eye (London) 2009, 23, 1045–1051. [Google Scholar] [CrossRef]
- Mitaki, S.; Takayoshi, H.; Nakagawa, T.; Nagai, A.; Oguro, H.; Yamaguchi, S. Metabolic syndrome is associated with incidence of deep cerebral microbleeds. PLoS ONE 2018, 13, e0194182. [Google Scholar] [CrossRef] [PubMed]
- Takahashi, S.; Hara, K.; Sano, I.; Onoda, K.; Nagai, A.; Yamaguchi, S.; Tanito, M. Systemic factors associated with intraocular pressure among subjects in a health examination program in Japan. PLoS ONE 2020, 15, e0234042. [Google Scholar] [CrossRef] [PubMed]
- Scheie, H.G. Evaluation of ophthalmoscopic changes of hypertension and arteriolar sclerosis. AMA Arch. Ophthalmol. 1953, 49, 117–138. [Google Scholar] [CrossRef] [PubMed]
- Society, J.G. Guidelines For Glaucoma, 4th ed. 2018. Available online: http://www.ryokunaisho.jp/english/guidelines.html (accessed on 27 January 2021).
- Xiao, W.; Chen, X.; Yan, W.; Zhu, Z.; He, M. Prevalence and risk factors of epiretinal membranes: A systematic review and meta-analysis of population-based studies. BMJ Open 2017, 7, e014644. [Google Scholar] [CrossRef]
- Ahmad, O.B.; Boschi-Pinto, C.; Lopez, A.D.; Murray, C.J.L.; Lozano, R.; Inoue, M. Age Standardization of Rates: A New WHO Standard. In GPE Disccussion Paper Series No. 31, EIP/GPE/EBD World Health Organization; WHO: Geneva, Switzerland, 2001; pp. 1–12. [Google Scholar]
- Blanc, J.; Seydou, A.; Ben Ghezala, I.; Deschasse, C.; Meillon, C.; Bron, A.M.; Binquet, C.; Creuzot-Garcher, C. Vitreomacular interface abnormalities and glaucoma in an elderly population (the Montrachet Study). Investig. Ophthalmol. Vis. Sci. 2019, 60, 1996–2002. [Google Scholar] [CrossRef]
- Muraoka, Y.; Tsujikawa, A.; Hata, M.; Yamashiro, K.; Ellabban, A.A.; Takahashi, A.; Nakanishi, H.; Ooto, S.; Tanabe, T.; Yoshimura, N. Paravascular inner retinal defect associated with high myopia or epiretinal membrane. JAMA Ophthalmol. 2015, 133, 413–420. [Google Scholar] [CrossRef]
- McCarty, D.J.; Mukesh, B.N.; Chikani, V.; Wang, J.J.; Mitchell, P.; Taylor, H.R.; McCarty, C.A. Prevalence and associations of epiretinal membranes in the visual impairment project. Am. J. Ophthalmol. 2005, 140, 288–294. [Google Scholar] [CrossRef]


| Parameters | ERM+ | ERM− | p-Value |
|---|---|---|---|
| Eye-based | |||
| ERM, n (%) | 275 (5.5) | 4767 (94.5) | |
| Scheie’s H grade | |||
| mean ± SD | 0.67 ± 0.60 | 0.46 ± 0.57 | <0.0001 † |
| 95%CI | 0.60–0.74 | 0.44–0.47 | |
| Scheie’s S grade | |||
| Mean ± SD | 1.00 ± 0.55 | 0.64 ± 0.54 | <0.0001 † |
| 95%CI | 0.62–0.65 | 0.01–0.62 | |
| Glaucoma | |||
| yes, n (%) | 26 (9.5) | 301 (6.3) | 0.0440 ‡ |
| no, n (%) | 249 (90.5) | 4466 (93.7) | |
| Possible cause of ERM | 3 BRVO | ||
| 1 MA | |||
| 1 PRP | |||
| CMR, n (%) | 169 (3.4) | 4873 (96.6) | |
| PMF, n (%) | 106 (2.1) | 4936 (97.9) | |
| Subject-based | |||
| Available photographs | |||
| Both eyes, n (%) | 213 (98.2) | 2277 (97.5) | 0.8163 ‡ |
| One eye, n (%) | 4 (1.8) | 58 (2.5) | |
| ERM, n | 217 (8.5) | 2335 (91.5) | |
| Both eyes, n (%) | 58 (26.7) | ||
| One eye, n (%) | 159 (73.3) | ||
| CMR, n | 138 (5.4) | ||
| both eyes, n (%) | 31 (22.5) | ||
| one eye, n (%) | 107 (77.5) | ||
| PMF, n | 97 (3.8) | ||
| Both eyes, n (%) | 9 (9.3) | ||
| One eye, n (%) | 88 (90.7) | ||
| ERM Subject breakdown, n | 217 | ||
| CMR in both eyes, n (%) | 31 (14.3) | ||
| CMR in one eye, n (%) | 89 (41.0) | ||
| CMR and PMF in one eye each, n (%) | 18 (8.3) | ||
| PMF in both eyes, n (%) | 9 (4.1) | ||
| PMF in one eye, n (%) | 70 (32.3) |
| Parameters | ERM+ | ERM− | p-Value |
|---|---|---|---|
| Age, years | |||
| n | 217 | 2335 | |
| mean ± SD | 64.3 ± 8.3 | 58.7 ± 11.0 | <0.0001 † |
| 95%CI | 63.2–65.5 | 58.2–59.1 | |
| Sex | |||
| male, n (%) | 112 (51.6) | 1293 (55.4) | 0.3179 ‡ |
| female, n (%) | 105 (48.4) | 1042 (44.6) | |
| Hypertension | |||
| yes, n (%) | 121 (56.3) | 1025 (45.6) | 0.0033 ‡ |
| no, n (%) | 94 (43.7) | 1225 (54.4) | |
| Hypertension medication | |||
| yes, n (%) | 70 (33.3) | 527 (24.0) | 0.0034 ‡ |
| no, n (%) | 140 (66.7) | 1670 (76.0) | |
| Diabetes | |||
| yes, n (%) | 19 (8.9) | 216 (9.7) | 0.8082 ‡ |
| no, n (%) | 194 (91.1) | 2016 (90.3) | |
| Diabetes medication | |||
| yes, n (%) | 3 (1.5) | 61 (2.9) | 0.2527 ‡ |
| no, n (%) | 197 (98.5) | 2015 (97.1) | |
| Hyperlipidemia | |||
| yes, n (%) | 111 (51.9) | 997 (44.6) | 0.0441 ‡ |
| no, n (%) | 103 (48.1) | 1240 (55.4) | |
| Hyperlipidemia medication | |||
| yes, n (%) | 51 (23.9) | 361 (16.4) | 0.0074 ‡ |
| no, n (%) | 162 (76.1) | 1840 (83.6) | |
| Cardiovascular disease | |||
| yes, n (%) | 48 (22.5) | 477 (21.4) | 0.7269 ‡ |
| no, n (%) | 165 (77.5) | 1752 (78.6) | |
| Stroke | |||
| yes, n (%) | 8 (3.8) | 41 (1.8) | 0.0691 ‡ |
| no, n (%) | 205 (96.2) | 2189 (98.2) | |
| Smoking habit | |||
| yes, n (%) | 23 (10.8) | 336 (15.0) | 0.1611 ‡ |
| no, n (%) | 131 (61.2) | 1362 (60.9) | |
| past smoking, n (%) | 80 (28.0) | 540 (24.1) | |
| Height (cm) | |||
| n | 217 | 2332 | |
| mean ± SD | 159.7 ± 8.7 | 161.3 ± 9.1 | 0.0122 † |
| 95%CI | 158.5–160.8 | 160.9–161.7 | |
| Weight (kg) | |||
| n | 217 | 2331 | |
| mean ± SD | 59.3 ± 11.7 | 60.5 ± 11.4 | 0.1270 † |
| 95%CI | 57.8–60.7 | 60.0–61.0 | |
| BMI | |||
| n | 217 | 2331 | |
| mean ± SD | 23.1 ± 3.0 | 23.1 ± 3.2 | 0.9891 † |
| 95%CI | 22.7–23.6 | 23.0–23.3 | |
| Systolic BP (mmHg) | |||
| n | 216 | 2331 | |
| mean ± SD | 130.6 ± 17.1 | 127.3 ± 17.4 | 0.0078 † |
| 95%CI | 128.3–132.9 | 126.6–128.0 | |
| Diastolic BP (mmHg) | |||
| n | 216 | 2331 | |
| mean ± SD | 75.1 ± 11.7 | 73.8 ± 11.5 | 0.1049 † |
| 95%CI | 73.5–76.7 | 73.3–74.2 | |
| Mean IMT (mm) | |||
| n | 211 | 2201 | |
| mean ± SD | 0.92 ± 0.41 | 0.86 ± 0.36 | 0.0318 † |
| 95%CI | 0.86–0.97 | 0.85–0.88 |
| Parameters | ERM+ | ERM− | p-Value |
|---|---|---|---|
| TP (g/dL) | |||
| n | 217 | 2329 | |
| Mean ± SD | 7.4 ± 0.4 | 7.4 ± 0.4 | 0.2520 † |
| 95%CI | 7.4–7.5 | 7.4–7.4 | |
| Albumin (g/dL) | |||
| n | 217 | 2334 | |
| Mean ± SD | 4.4 ± 0.2 | 4.4 ± 0.2 | 0.7648 † |
| 95%CI | 4.4–4.5 | 4.4–4.4 | |
| A/G | |||
| n | 217 | 2334 | |
| mean ± SD | 1.5 ± 0.2 | 1.5 ± 0.2 | 0.1146 † |
| 95%CI | 1.5–1.5 | 1.5–1.5 | |
| Total bilirubin (mg/dL) | |||
| n | 217 | 2334 | |
| mean ± SD | 0.8 ± 0.3 | 0.8 ± 0.3 | 0.5122 † |
| 95%CI | 0.7–0.8 | 0.8–0.9 | |
| AST (IU/L) | |||
| n | 217 | 2334 | |
| mean ± SD | 24.3 ± 9.4 | 24.7 ± 11.7 | 0.6108 † |
| 95%CI | 23.0–25.6 | 24.2–25.2 | |
| ALT (IU/L) | |||
| n | 217 | 2334 | |
| mean ± SD | 22.4 ± 12.8 | 24.0 ± 15.9 | 0.1277 † |
| 95%CI | 20.6–24.1 | 23.4–24.7 | |
| γGTP (IU/L) | |||
| n | 217 | 2334 | |
| Mean ± SD | 41.5 ± 65.3 | 44.0 ± 65.5 | 0.5982 † |
| 95%CI | 32.8–50.3 | 41.3–46.6 | |
| ALP (IU/L) | |||
| n | 217 | 2334 | |
| mean ± SD | 219.4 ± 63.3 | 219.9 ± 66.5 | 0.9176 † |
| 95%CI | 211.0–227.9 | 217.2–222.6 | |
| Total cholesterol (mg/dL) | |||
| n | 217 | 2332 | |
| mean ± SD | 213.5 ± 29.2 | 209.7 ± 33.3 | 0.0979 † |
| 95%CI | 209.6-217.4 | 208.3-211.0 | |
| Triglycerides (mg/dL) | |||
| n | 217 | 2334 | |
| mean ± SD | 125.5 ± 78.9 | 115.8 ± 76.9 | 0.0750 † |
| 95%CI | 114.9–136.1 | 112.6–118.9 | |
| HDL-C (mg/dL) | |||
| n | 217 | 2334 | |
| mean ± SD | 63.0 ± 16.2 | 63.3 ± 16.5 | 0.7547 † |
| 95%CI | 60.8–65.1 | 62.7–64.0 | |
| LDL-C (mg/dL) | |||
| n | 217 | 2329 | |
| mean ± SD | 122.6 ± 27.8 | 121.1 ± 30.8 | 0.4750 † |
| 95%CI | 118.9–126.3 | 119.8–122.3 | |
| HbA1c (%) | |||
| n | 217 | 2329 | |
| mean ± SD | 5.5 ± 0.5 | 5.5 ± 0.7 | 0.4757 † |
| 95%CI | 5.4–5.6 | 5.4–5.5 | |
| WBC (×102/mL) | |||
| n | 217 | 2334 | |
| mean ± SD | 57.6 ± 15.5 | 57.0 ± 15.3 | 0.5927 † |
| 95%CI | 55.6–60.0 | 56.4–57.7 | |
| RBC (×104/mL) | |||
| n | 217 | 2333 | |
| mean ± SD | 461.8 ± 42.5 | 464.8 ± 42.0 | 0.3188 † |
| 95%CI | 456.1–467.5 | 463.1–466.5 | |
| Hemoglobin (g/dL) | |||
| n | 217 | 2334 | |
| mean ± SD | 14.3 ± 1.4 | 14.4 ± 1.4 | 0.2525 † |
| 95%CI | 14.1–14.5 | 14.3–14.5 | |
| Hematocrit (%) | |||
| n | 217 | 2334 | |
| mean ± SD | 43.0 ± 3.5 | 42.9 ± 3.7 | 0.6541 † |
| 95%CI | 42.5–43.5 | 42.7–43.0 | |
| Platelet (×104/mL) | |||
| n | 217 | 2334 | |
| mean ± SD | 22.3 ± 5.4 | 22.9 ± 6.1 | 0.2134 † |
| 95%CI | 21.6–23.1 | 22.6–23.1 | |
| Fibrinogen (mg/dL) | |||
| n | 210 | 2285 | |
| mean ± SD | 288.7 ± 60.3 | 287.2 ± 60.0 | 0.7316 † |
| 95%CI | 280.5–296.9 | 284.7–289.6 | |
| BUN (mg/dL) | |||
| n | 217 | 2333 | |
| mean ± SD | 15.0 ± 3.8 | 14.5 ± 3.8 | 0.1107 † |
| 95%CI | 14.5–15.5 | 14.4–14.7 | |
| Creatinine (mg/dL) | |||
| n | 217 | 2334 | |
| mean ± SD | 0.73 ± 0.17 | 0.74 ± 0.18 | 0.2776 † |
| 95%CI | 0.71–0.75 | 0.74–0.75 | |
| Na (mEq/L) | |||
| n | 200 | 1849 | |
| mean ± SD | 142.0 ± 1.9 | 141.9 ± 1.9 | 0.8357 † |
| 95%CI | 141.7–142.2 | 141.9–142.0 | |
| K (mEq/L) | |||
| n | 200 | 1849 | |
| mean ± SD | 4.1 ± 0.3 | 4.1 ± 0.3 | 0.2572 † |
| 95%CI | 4.1–4.2 | 4.1–4.2 | |
| Cl (mEq/L) | |||
| n | 200 | 1849 | |
| mean ± SD | 103.2 ± 2.1 | 1033 ± 2.4 | 0.5761 † |
| 95%CI | 102.9–103.5 | 103.2–103.4 | |
| Ca (mg/dL) | |||
| n | 199 | 1847 | |
| mean ± SD | 9.3 ± 0.3 | 9.3 ± 0.3 | 0.7528 † |
| 95%CI | 9.3–9.4 | 9.3–9.4 | |
| Uric acid (mg/dL) | |||
| n | 216 | 2334 | |
| mean ± SD | 5.2 ± 1.2 | 5.3 ± 1.3 | 0.1713 † |
| 95%CI | 5.0–5.3 | 5.2–5.4 | |
| Amylase (IU/L) | |||
| n | 216 | 2333 | |
| mean ± SD | 84.6 ± 26.8 | 80.9 ± 27.5 | 0.0566 † |
| 95%CI | 81.0–88.2 | 79.7–82.0 |
| Age, Years | ERM+, n | ERM-, n | Prevalence, % |
|---|---|---|---|
| 0–4 | 0 | 0 | 0 |
| 5–9 | 0 | 0 | 0 |
| 10–14 | 0 | 0 | 0 |
| 15–20 | 0 | 0 | 0 |
| 20–24 | 0 | 2 | 0 |
| 25–29 | 0 | 14 | 0 |
| 30–34 | 0 | 22 | 0 |
| 35–39 | 2 | 254 | 0.8 |
| 40–44 | 4 | 316 | 1.3 |
| 45–49 | 4 | 327 | 1.2 |
| 50–54 | 14 | 536 | 2.5 |
| 55–59 | 41 | 854 | 4.6 |
| 60–64 | 54 | 939 | 5.4 |
| 65–69 | 91 | 872 | 9.4 |
| 70–74 | 32 | 329 | 8.9 |
| 75–79 | 24 | 196 | 10.9 |
| 80–84 | 8 | 80 | 9.1 |
| 85–89 | 1 | 23 | 4.2 |
| 90–94 | 0 | 2 | 0 |
| 95–100 | 0 | 1 | 0 |
| 100– | 0 | 0 | 0 |
| Total | 275 | 4767 | 5.5 |
| Age, Years | ERM+, n | ERM−, n | Prevalence, % | WHO Standard Age Distribution, % (/Total) * | Age-Standardized Prevalence, % (/Total) | Age-Standardized Prevalence (>40 Years), % (/Total) | Age-Standardized Prevalence (>65 Years), % (/Total) |
|---|---|---|---|---|---|---|---|
| 0–4 | 0 | 0 | 0 | 8.86 | 0.00 | ||
| 5–9 | 0 | 0 | 0 | 8.69 | 0.00 | ||
| 10–14 | 0 | 0 | 0 | 8.60 | 0.00 | ||
| 15–20 | 0 | 0 | 0 | 8.47 | 0.00 | ||
| 20–24 | 0 | 1 | 0 | 8.22 | 0.00 | ||
| 25–29 | 0 | 7 | 0 | 7.93 | 0.00 | ||
| 30–34 | 0 | 11 | 0 | 7.61 | 0.00 | ||
| 35–39 | 2 | 126 | 1.6 | 7.15 | 0.11 | ||
| 40–44 | 4 | 157 | 2.5 | 6.59 | 0.16 | 0.47 | |
| 45–49 | 4 | 162 | 2.4 | 6.04 | 0.15 | 0.42 | |
| 50–54 | 13 | 263 | 4.7 | 5.37 | 0.25 | 0.73 | |
| 55–59 | 32 | 419 | 7.1 | 4.55 | 0.32 | 0.93 | |
| 60–64 | 42 | 459 | 8.4 | 3.72 | 0.31 | 0.90 | |
| 65–69 | 72 | 418 | 14.7 | 2.96 | 0.43 | 1.26 | 5.25 |
| 70–74 | 24 | 161 | 13.0 | 2.21 | 0.29 | 0.83 | 3.46 |
| 75–79 | 17 | 95 | 15.2 | 1.52 | 0.23 | 0.67 | 2.79 |
| 80–84 | 6 | 43 | 12.2 | 0.91 | 0.11 | 0.32 | 1.35 |
| 85–89 | 1 | 11 | 8.3 | 0.44 | 0.04 | 0.11 | 0.44 |
| 90–94 | 0 | 1 | 0 | 0.15 | 0.00 | 0.00 | 0.00 |
| 95–100 | 0 | 1 | 0 | 0.04 | 0.00 | 0.00 | 0.00 |
| 100– | 0 | 0 | 0 | 0.05 | 0.00 | 0.00 | 0.00 |
| Total | 217 | 2335 | 8.5 | 100 | 2.4 | 6.7 | 13.3 |
Publisher’s Note: MDPI stays neutral with regard to jurisdictional claims in published maps and institutional affiliations. |
© 2021 by the authors. Licensee MDPI, Basel, Switzerland. This article is an open access article distributed under the terms and conditions of the Creative Commons Attribution (CC BY) license (http://creativecommons.org/licenses/by/4.0/).
Share and Cite
Shimizu, H.; Asaoka, R.; Omoto, T.; Fujino, Y.; Mitaki, S.; Onoda, K.; Nagai, A.; Yamaguchi, S.; Tanito, M. Prevalence of Epiretinal Membrane among Subjects in a Health Examination Program in Japan. Life 2021, 11, 93. https://doi.org/10.3390/life11020093
Shimizu H, Asaoka R, Omoto T, Fujino Y, Mitaki S, Onoda K, Nagai A, Yamaguchi S, Tanito M. Prevalence of Epiretinal Membrane among Subjects in a Health Examination Program in Japan. Life. 2021; 11(2):93. https://doi.org/10.3390/life11020093
Chicago/Turabian StyleShimizu, Hiroshi, Ryo Asaoka, Takashi Omoto, Yuri Fujino, Shingo Mitaki, Keiichi Onoda, Atsushi Nagai, Shuhei Yamaguchi, and Masaki Tanito. 2021. "Prevalence of Epiretinal Membrane among Subjects in a Health Examination Program in Japan" Life 11, no. 2: 93. https://doi.org/10.3390/life11020093
APA StyleShimizu, H., Asaoka, R., Omoto, T., Fujino, Y., Mitaki, S., Onoda, K., Nagai, A., Yamaguchi, S., & Tanito, M. (2021). Prevalence of Epiretinal Membrane among Subjects in a Health Examination Program in Japan. Life, 11(2), 93. https://doi.org/10.3390/life11020093