Article

The Molecular Effects of a High Fat Diet on Endometrial Tumour Biology

1
Department of Gynaecological Oncology, UCD School of Medicine, Mater Misericordiae Universtity Hospital, Eccles Street, Dublin 7, D07 AX57 Dublin, Ireland
2
UCD Diabetes Complications Research Centre, UCD Conway Institute, University College Dublin, D14 NN96 Dublin, Ireland
3
Department of Pathology, St Vincent’s University Hospital, Elm Park, Dublin 4, D04 YN63 Dublin, Ireland
4
Biomedical Facility, Hanover Medical School, 30625 Hanover, Germany
5
Department of Pathology, National Maternity Hospital, Holles Street, Dublin 2, D02 YH21 Dublin, Ireland
6
Cancer Biology and Therapeutic Laboratory, UCD School of Biomolecular and Biomedical Science Ireland, UCD Conway Institute, University College Dublin, D14 NN96 Dublin, Ireland
7
Systems Biology Ireland, UCD School of Medicine, Belfield, Dublin 4, D14 NN96 Dublin, Ireland
*
Authors to whom correspondence should be addressed.
These authors contributed equally.
Life 2020, 10(9), 188; https://doi.org/10.3390/life10090188
Submission received: 13 August 2020 / Revised: 30 August 2020 / Accepted: 2 September 2020 / Published: 10 September 2020
(This article belongs to the Section Medical Research)

Abstract

:
We sought to validate the BDII/Han rat model as a model for diet-induced obesity in endometrial cancer (EC) and determine if transcriptomic changes induced by a high fat diet (HFD) in an EC rat model can be used to identify novel biomarkers in human EC. Nineteen BDII/Han rats were included. Group A (n = 7) were given ad lib access to a normal calorie, normal chow diet (NCD) while Group B (n = 12) were given ad lib access to a calorie rich HFD for 15 months. RNAseq was performed on endometrial tumours from both groups. The top-ranking differentially expressed genes (DEGs) were examined in the human EC using The Cancer Genome Atlas (TCGA) to assess if the BDII/Han rat model is an appropriate model for human obesity-induced carcinogenesis. Weight gain in HFD rats was double the weight gain of NCD rats (50 g vs. 25 g). The incidence of cancer was similar in both groups (4/7—57% vs. 4/12—33%; p = 0.37). All tumours were equivalent to a Stage 1A, Grade 2 human endometrioid carcinoma. A total of 368 DEGs were identified between the tumours in the HFD group compared to the NCD group. We identified two upstream regulators of the DEGs, mir-33 and Brd4, and a pathway analysis identified downstream enrichment of the colorectal cancer metastasis and ovarian cancer metastasis pathways. Top-ranking DEGs included Tex14, A2M, Hmgcs2, Adamts5, Pdk4, Crabp2, Capn12, Npw, Idi1 and Gpt. A2M expression was decreased in HFD tumours. Consistent with these findings, we found a significant negative correlation between A2M mRNA expression levels and BMI in the TCGA cohort (Spearman’s Rho = −0.263, p < 0.001). A2M expression was associated with improved overall survival (HR = 0.45, 95% CI 0.23–0.9, p = 0.024). Crabp2 expression was increased in HFD tumours. In human EC, CRABP2 expression was associated with reduced overall survival (HR = 3.554, 95% CI 1.875–6.753, p < 0.001). Diet-induced obesity can alter EC transcriptomic profiles. The BDII/Han rat model is a suitable model of diet-induced obesity in endometrial cancer and can be used to identify clinically relevant biomarkers in human EC.

1. Introduction

Endometrial cancer is the most common cancer of the female genital tract and the fourth commonest cancer in women worldwide. In 2016, in the United States of America, there were 60,050 new cases of endometrial cancer and over 10,000 deaths [1]. The lifetime risk of endometrial cancer in women in Europe is thought to be between 1.7 and 2%, equating to a lifetime risk of approximately 1/80 [2]. The incidence of endometrial cancer has increased by over 20% since 2008, owing in large part to the growing epidemic of obesity and diabetes, both of which are considerable risk factors for endometrial cancer [2].
Obesity is the greatest risk factor for endometrial cancer, and there is a growing need to understand its effect on transcriptomic alterations within the endometrium. Obesity is generally associated with low-grade [3,4], low mutational burden, microsatellite-stable, p53 wild-type adenocarcinomas of the endometrium, which usually develop on a background of complex atypical endometrial hyperplasia. Loss-of-function mutations in PTEN are found in the majority of low-grade endometrial tumours as well as in complex atypical hyperplasia, suggesting that they are an initiating event in tumorigenesis [5,6]. The most frequently mutated genes in low-grade endometrial cancer are PTEN, PIK3CA, CTNNB1, ARID1A and PIK3R1 [7]. Gain-of-function mutations in CTNNB1 exon 3 are particularly prevalent in young women with obesity, and a diagnosis of low-grade endometrioid cancer is associated with a poor prognosis [8].
Given the well-established interaction between obesity, metabolism and inflammation, immunocompetent animal models of endometrial cancer that replicate this obesity-related phenotype and genotype are necessary to improve our understanding of the underlying molecular mechanisms. The BDII/Han rat model is a spontaneous, immunocompetent model in which up to ninety percent of animals develop endometrial cancer during their lifetime (26–28 months) [9,10]. BDII/Han endometrial tumours express oestrogen and progesterone receptors [11,12], respond to progestogen and are histologically similar to obesity-related endometrial cancers in humans, which were previously referred to as Type 1 tumours [13]. Endometrial tumours from BDII/Han rats have many molecular similarities to obesity-related human endometrial cancer, including microsatellite stability [14], a lack of Erbb2 mutations and reduced expression of Pten—albeit without evidence of loss-of-function mutations [15,16]. Unlike human low-grade tumours, p53 mutations have been reported in the BD/II Han rat model, occurring in up to 67% of cases, and this model is believed to reflect high-grade Type 1 endometrial cancers in humans [16].
As a result of the molecular and histological similarities between the BDII/Han rat model and human obesity-related endometrial carcinoma, we sought to examine the impact of diet-induced obesity on the incidence and molecular profiles of endometrial cancers arising in this model. The aims of our study were to assess if BDII/Han rats respond to a high fat diet and develop diet-induced obesity. We also sought to assess obesity-induced transcriptomic alterations in BD/II Han endometrial tumours and to ascertain if these alterations could be used to identify novel targets in human endometrial cancer.

2. Results

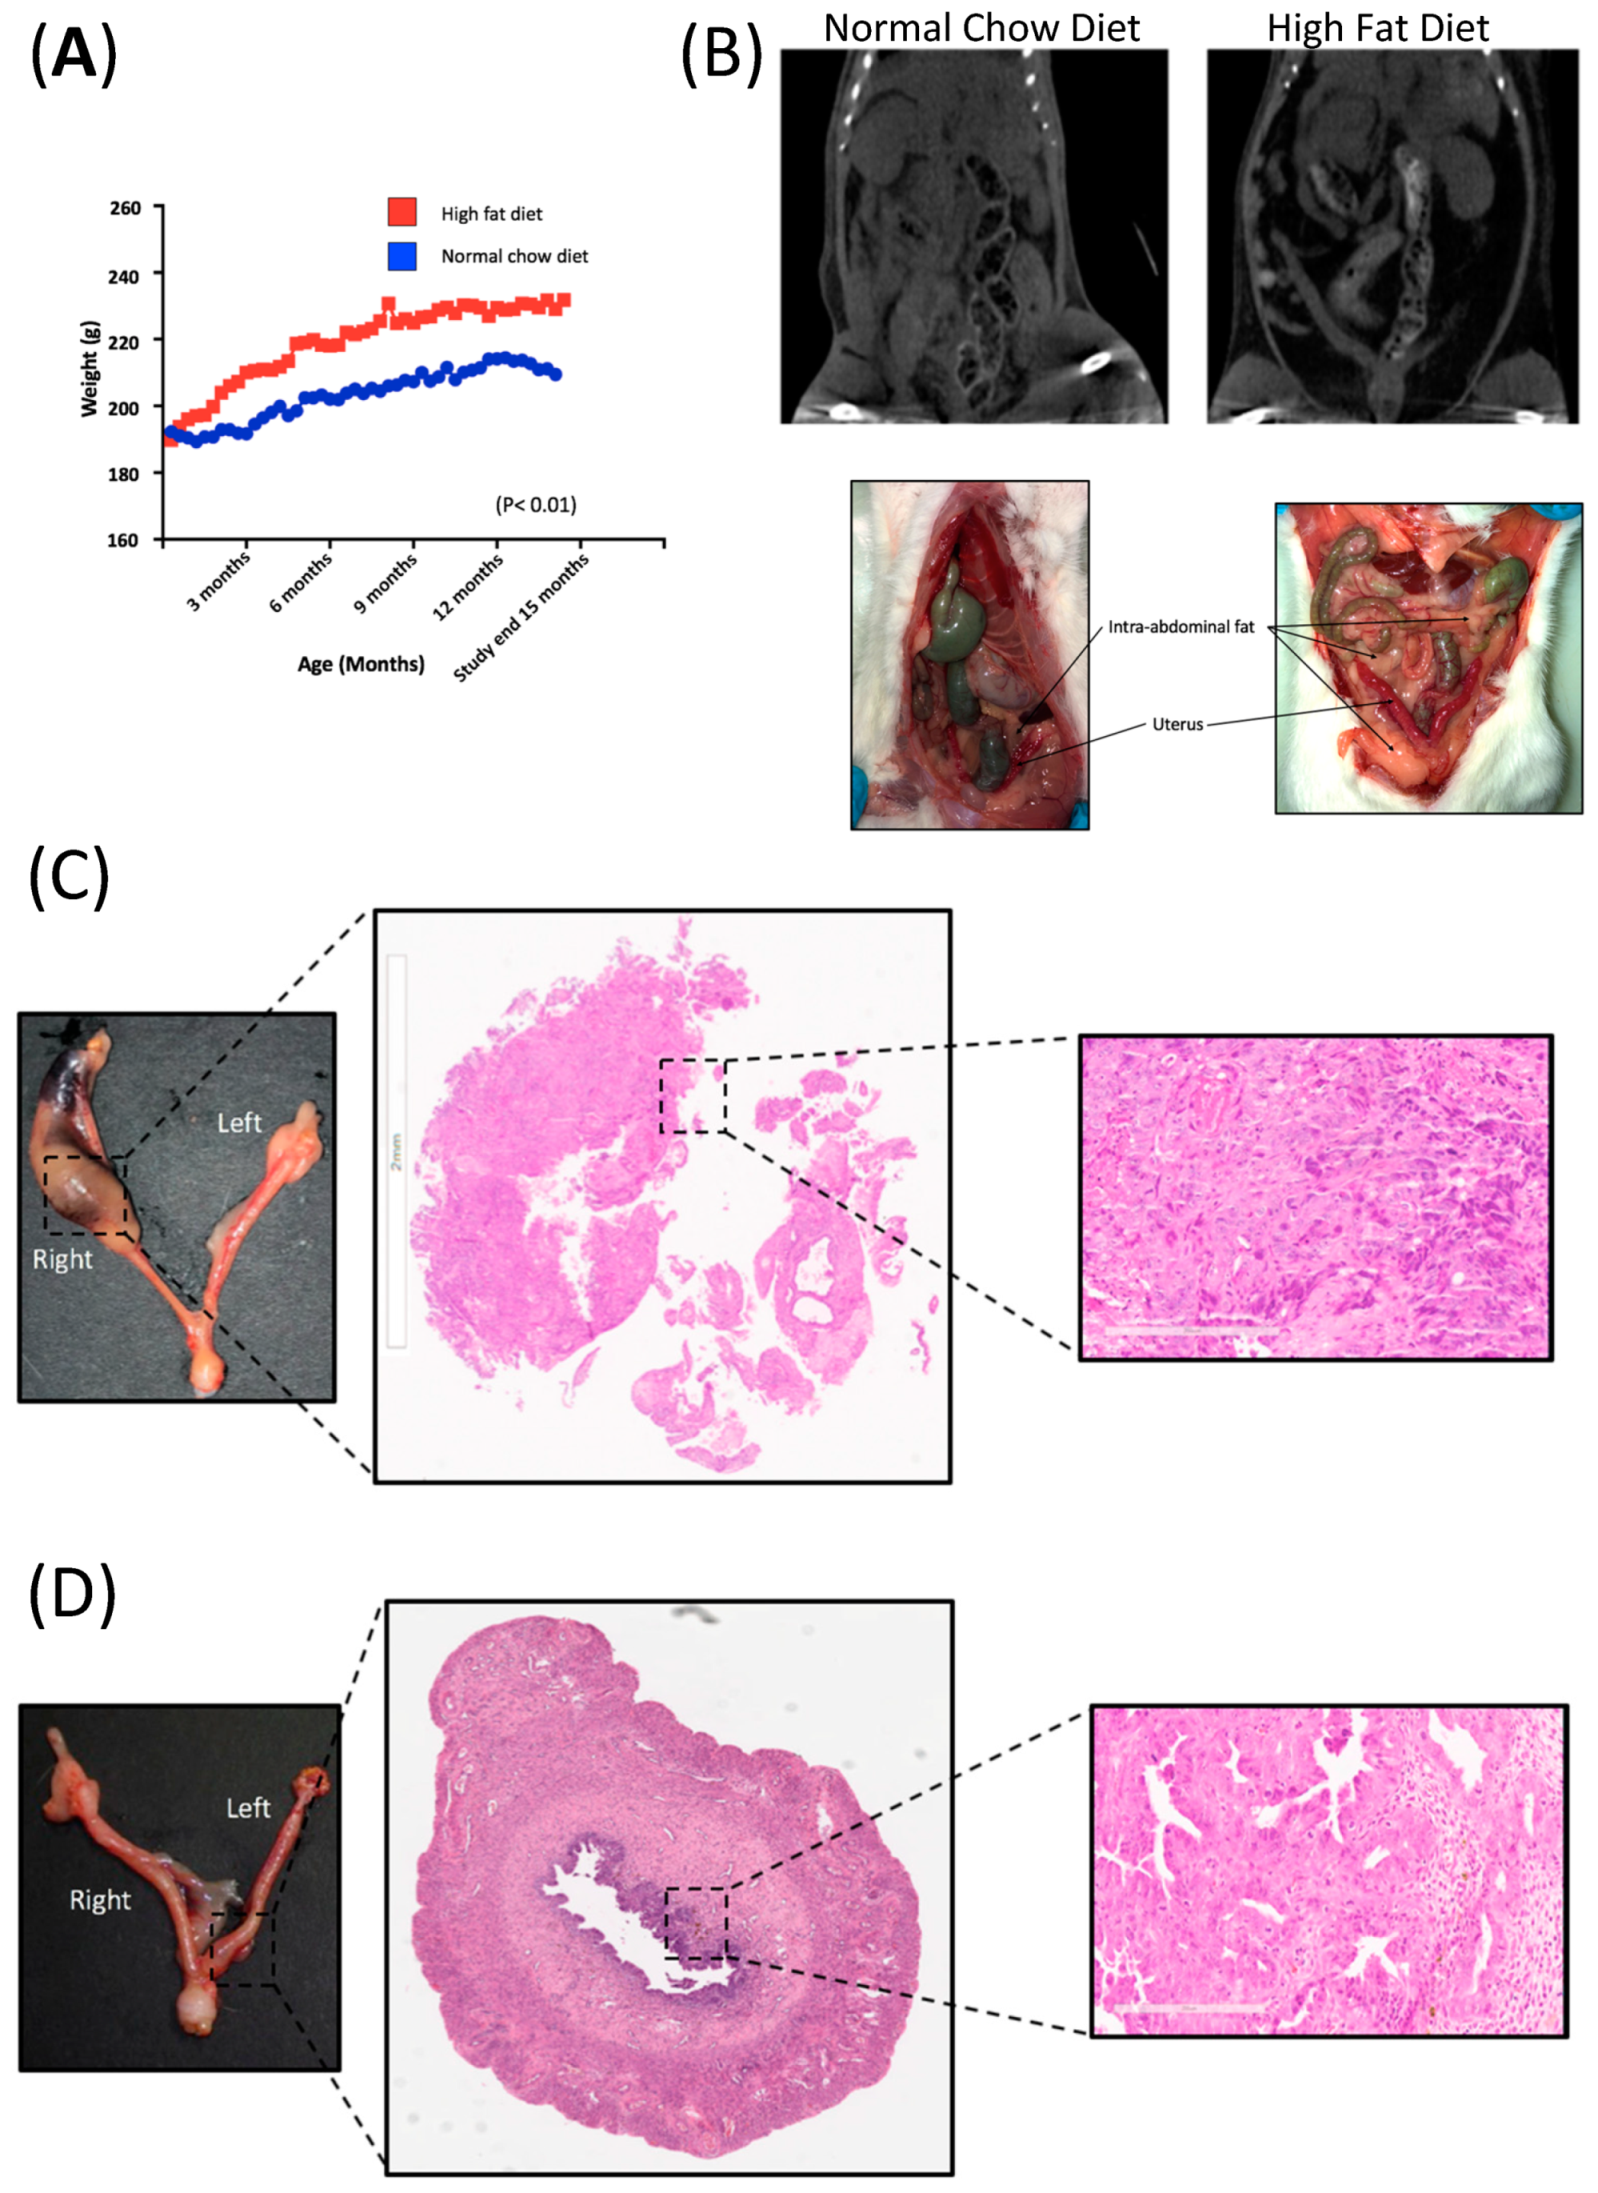
2.1. High Fat Diet-Induced Visceral Obesity in BD/II Han Rats

The average age of all the rats commencing this study was 106 days. The mean weight of the rats in the NCD group was 185.7 g (SD 8.0) and 177.2 g (SD 18.7) in the HFD group. The average age of both groups was similar at the study’s end: 451 days (range 446–459) in the NCD group and 442.8 days (range 429–454 days) in the HFD group.
This group remained on “ad lib” NCD and water for the study duration to an average age of 451.1 days (range 446–459). Weight gain in the HFD group was double the weight gain of the NCD group (50 g (SD 27.3) vs. 25 g (SD 7.5), p = 0.01). The average weight of the NCD group was 211 g (SD 6.4) vs. 227 g (SD 12.4), p = 0.01) in the HFD group (Figure 1A). This coincided with a subjective increase in abdominal and perivisceral fat in all animals in the HFD relative to animals in the NCD, indicating that diet-induced obesity can be achieved in this animal model. The increased volume in fat distribution was particularly noticeable in the omentum, peri-renal and peri-vesical areas across all rats in this group and was easily distinguishable on imaging (Figure 1B).

2.2. Diet-Induced Obesity Did Not Increase the Endometrial Cancer Burden in BDII/Han Rats

The overall incidence of endometrial cancer in this study was 42% (8 of 19 rats). The incidence of endometrial cancer in the NCD group was 57.1% (4 of 7 rats) and was 33.3% (4 of 12 rats) in the HFD (p = 0.37). There was no evidence of metastatic disease and all tumours were confined to the inner half of the myometrium. A blinded histological assessment did not identify any histological difference in the tumours from either group as all were Grade 2 endometroid adenocarcinomas with cellular pleomorphism and prominent nucleoli (Figure 1C,D).

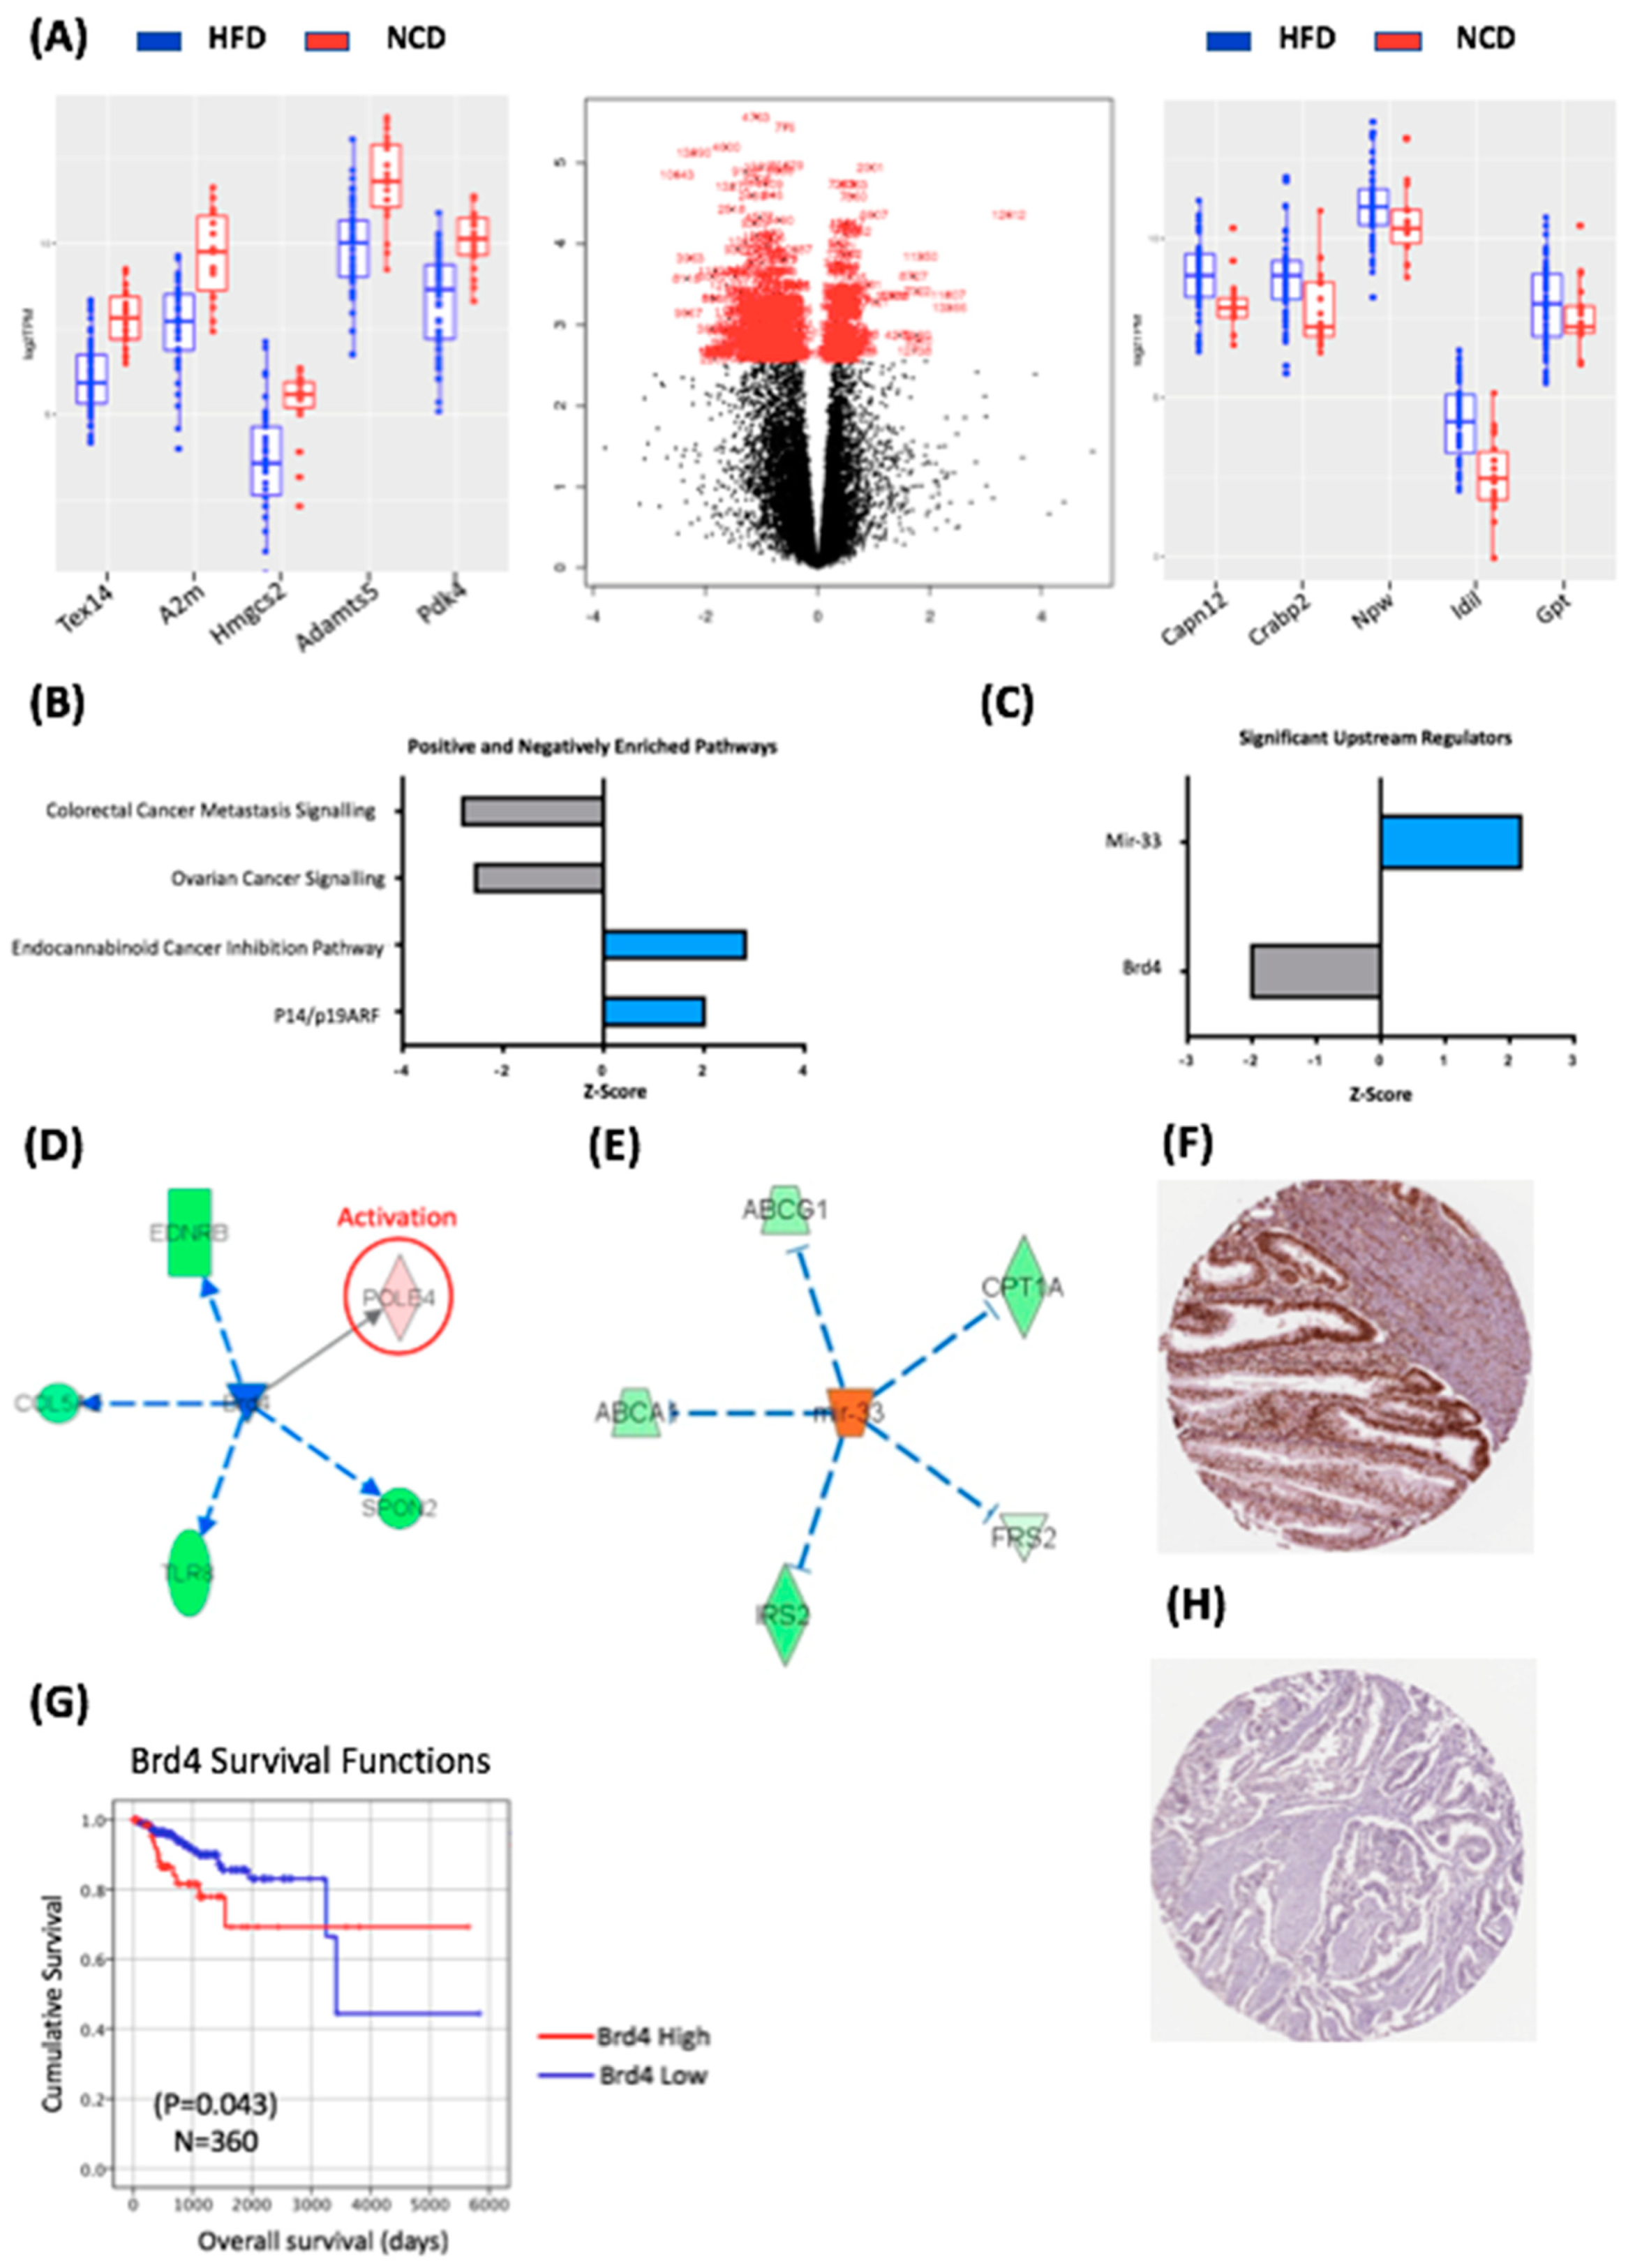
2.3. Diet-Induced Obesity Caused Specific Transcriptomic Changes in BDII/Han Endometrial Tumours

A total of 26 RNA samples were isolated from tumours with 14 samples from the NCD tumours (n = 4) and 12 from the HFD group tumours (n = 4), respectively. Multiple samples were extracted from different tumours to control for heterogeneity (see Supplementary Table S5). The mean number of raw reads across all samples was 45 million (SD 2.2 million). Approximately 78.3% of the reads aligned to the Rattus norvegicus dataset (Rnor_6.0), with high quality scores (≥Q30). After normalization and scaling of gene expression differential gene expression analysis identified 383 statistically significant differentially expressed transcripts (FDR p < 0.05) in the HFD group relative to the NCD group, of which 368 were mapped to genes (Figure 2A). The top ten DEGs in the HFD group relative to the tumours in the NCD group are presented in Figure 2A.
We sought to investigate pathway enrichment within the significant DEGs from the HFD versus NCD groups comparison using an Ingenuity Pathway Analysis (IPA; Qiagen, MD, USA). There were 329 significantly enriched canonical pathways, of which 173 reached a threshold log-fold expression of 1.3, and with many reaching statistical significance (p < 0.001). The most significantly enriched pathways based on a Z-score > 2 or <−2 are presented in Figure 2B, which demonstrate the positively enriched pathways were p14/p19 ARF and the endocabinoid pathways, while the negatively enriched pathways were the colorectal cancer metastasis pathway (Z = −2.80) and ovarian cancer signalling pathways (Z = −2.54). The identification of p14/ARF as an enriched pathway is consistent with the fact that the expression levels of p14 increase in Grade 1 tumours compared to a normal endometrium and are then reduced in higher-grade tumours [17].
To further understand the impact of diet-induced obesity on the endometrial cancer transcriptome in BDII/Han rats, we used IPA to identify the putative upstream regulators of the 368 DEGs. We identified 13 enriched upstream regulators with a Z-score ≥ 2 or ≤ −2 (Figure 2C); however, only two reached statistical significance: mir-33, which was positively enriched in HFD group, and Brd4, which was negatively enriched in the HFD group (Figure 2C). Although little is known about mir-33 in cancer, mir-33 knockout mice are predisposed to obesity, metabolic dysfunction and insulin resistance, suggesting that mir-33 activity may be a protective mechanism in rats exposed to an HFD [18].
Brd4 is a member of the Bromodomain family of proteins, which play a key role in the epigenetic regulation of transcription and interacts with the oestrogen receptor in animal models of endometrial and breast cancer [19]. Brd4 regulated the expression of five genes from our dataset: Ednrb, Col5a2, Tlr8, Spon2 and Pole4 (Figure 2D). Kaplan–Meier analysis demonstrated increased levels of BRD4 were associated with decreased OS (p = 0.043) in the TCGA cohort (Figure 2E), which is consistent with previous findings that demonstrated that the NSD3CHD8BRD4 pathway is amplified in approximately 9% of serous carcinomas, and this amplification leads to a reduced overall survival [20]. We also sought to assess BRD4 protein expression in endometrial cancer using the Human Protein Atlas; this demonstrated “strong” BRD4 protein expression in 9/11 endometrial cancers (Figure 2F). Univariate Cox regression analysis demonstrated that decreased mRNA expression of BRD4 was associated with decreased OS (HR = 2.034, 95% CI 1.009–4.102, p = 0.047) in the TCGA endometrial cancer cohort however this did not remain significant in a multivariate models (Supplementary Table S2).
Taken together these data suggest that alterations induced by diet-induced obesity alters the transcriptome in a rat model of spontaneous endometrial cancer. We identified a well-established obesity regulator of lipid metabolism, mir-33, as an important upstream regulator in the HFD group, and we highlighted for the first time a potentially important role for Brd4 in the regulation of genes altered by diet-induced obesity.

2.4. Obesity-Regulated Genes Can Be Used as Biomarkers in Human Endometrial Cancer

To assess the clinical relevance of our findings in the rat model, we examined the relationship between the 10 most differentially expressed genes identified in the rat model and the clinico-pathological variables in the TCGA dataset (Figure 3A). In human EC, expression levels of all 10 genes were distributed across all four human endometrial cancer molecular subtypes—POLE, microsatellite instable, copy number low and copy number high.
From these ten genes, Alpha-2 macroglobulin (A2M) and Cellular Retinoic Acid Binding Protein 2 (CRABP2) demonstrated the highest number of alterations in human EC (Figure 3A), and thus were chosen for further assessment. In our rat study, A2M expression was significantly reduced in endometrial tumours from the HFD compared to NCD group (Figure 2A). Consistent with these findings, we found a significant negative correlation between A2M mRNA expression levels and BMI in the TCGA cohort (Spearman’s Rho = −0.263, p < 0.001; Table 1). A2M alterations were identified in 13% of human endometrial cancers in the TCGA dataset (Figure 3A). All of the mutations identified were missense mutations of uncertain significance (Figure 3A). Regression tree analysis demonstrated the optimal threshold for A2M for survival analysis was a Log2TPM value of 7.303. Using this threshold, A2M mRNA expression was associated with low grade (p < 0.001) endometrioid tumours (p = 0.003; Table 1) and the Kaplan–Meier analysis demonstrated increased levels of A2M were associated with improved OS (p = 0.02; Figure 3B). Univariate Cox regression analysis demonstrated that increased expression of A2M was associated with improved OS (HR = 0.45, 95% CI 0.23–0.9, p = 0.024); however, this did not remain significant in a multivariate model (Table 2). We also assessed A2M protein expression in endometrial cancer using the Human Protein Atlas; this demonstrated “strong” A2M expression in 3/11 endometrial cancers (Figure 3C).
Crabp2 expression was upregulated in endometrial tumours from rats fed an HFD. CRABP2 alterations were identified in 13% of endometrial cancers in the TCGA dataset (Figure 3A). All of the mutations identified were missense mutations of uncertain significance. Regression tree analysis demonstrated the optimal threshold for CRABP2 for survival analysis was a log2TPM value of 7.319. Using this threshold, CRABP2 expression was associated with a high grade (p = 0.0001), serous histology (p = 0.001), advanced stage (p = 0.005) and the copy number high molecular subtype (p = 0.001; Table 1). The Kaplan–Meier analysis demonstrated that increased levels of CRABP2 were associated with reduced OS (p ≤ 0.001; Figure 3D). Univariate Cox regression analysis demonstrated that increased expression of CRABP2 was associated with reduced OS (HR = 3.554, 95% CI 1.875–6.753, p < 0.001; Table 1). Multivariate analysis demonstrated increased CRABP2 expression was associated with a reduced OS after controlling for age, grade, histological subtype and FIGO stage (HR = 3.13, 95% CI 1.52–6.44, p = 0.002; Table 2). Assessment of protein expression in endometrial cancer using the Human Protein Atlas demonstrated CRABP2 expression in 3 of 11 endometrial cancers (Figure 3E).

2.5. Mutation and Expression of Tp53, Molecular Characterisation

To further define the rat model as being relevant to obesity-related human endometrial cancer, which generally is associated with functional p53, we assessed the Tp53 variants using RNAseq in the rat model [21,22]. We found a highly prevalent Tp53 frameshift variant, p.Pro320ThrfsTer10, extant in 37/65 samples, with 15 individual rats having at least one sample with the variant (Supplementary Table S3). A total of 15/18 (84%) samples from the NCD group were found with the variant compared with 22/47 (49%) in the HFD group. Because of this disparity, which could confound the groupings, we examined the role of this variant and other rare (essentially private) variants in relation to Tp53 expression.
Samples with the p.Pro320ThrfsTer10 frameshift, located in the p53 tetramerisation protein domain, were not found to have significantly different expression of Tp53 at the gene level or transcript level (5 expressed isoforms) compared to samples without (Wilcox tests). Samples with at least one of the 15 other variants found within the coding sequence of Tp53 were also not found to have a significantly different expression at the gene-level, but two lowly expressed isoforms did show significant difference (see Supplementary Results). Of those 15 variants, 8 were found to have a direct human ortholog in the COSMIC database [23] (see Supplementary Table S4) and all occurred within the DNA-binding protein domain. No comparable human variant of the p.Pro320ThrfsTer10 frameshift was found in COSMIC.
Downstream genes regulated by TP53 in humans were investigated using the MSigDB [24] HALLMARK_P53_PATHWAY, which contains 195 human genes with an appropriate rat ortholog. Using t-test with false discovery rate adjustment, we found no significant divergence in expression grouped by the mutant or wild-type p.Pro320ThrfsTer10 frameshift (p < 0.01). We found 2/195 genes with significantly divergent expression when grouping by presence of any other missense, frameshift or nonsense variant in Tp53 vs. no variant. These were Cdkn2a and Hexim1 (see Supplementary Results). We found only 8 total mutations in these genes, 7 of which occurred in Cdkn2a and none of which occurred in more than three samples. We do not expect that these mutations explain the observed divergent expression.
To further categorise the model, assuming it reflects a Tp53 wild-type phenotype, we estimated microsatellite stability using the “preMSIm” R package [25]. This method uses the scaled expression of 15 human genes, of which 10 orthologs were extant in the rat model. We found 51/65 sample to be microsatellite instable (MSI) vs. microsatellite stable (MSS), with no significant difference between tumour and normal tissue (24, 27 MSI and 7, 7 MSS, respectively). Only two individual rats were MSS (i.e., no samples determined to be MSI), these contributing 7 total samples to the study, and one each in the different diet groups.
Finally, we investigated the overall variant levels. We annotated all variants and removed those with a low coverage (7 REF reads, 3 ALT reads) and denoted those that were fixed in the population. Of a total of 1,339,616 variants, 761,902 were denoted as fixed in the population, with 539,933 at low coverage with 46,833 overlap. A further 90 were removed as being multiallelic. Using the remaining 84,524 variants, 74% are private (i.e., only found in 1 sample) and 6% are universal (all samples; see Supplementary Table S5). We calculated mutational burden similarly to tumour mutation burden (TMB, [26]), taking all variants and dividing by the total region sequenced and variant-called (~854 megabases). Mean mutational burden was 10.7 (min 99.4, max 14.3), and was not significantly different in tissue (tumour vs. normal, Fisher Exact test). Taken together, these findings demonstrate that the BD/II Han EC model corresponds with a human microsatellite unstable model.

3. Discussion

Understanding obesity-related carcinogenesis is a research priority, as a clear understanding of the underlying molecular mechanisms will be a key foundation to any public health measures focused on weight loss as a preventative or therapeutic intervention. Here we present data on a well-established spontaneous immune-competent EC model. We demonstrate that BDII/Han rats are susceptible to diet-induced obesity, causing an increased volume of intrabdominal and perivisceral fat in all animals in the HFD group, suggesting that this model warrants further investigation. Unfortunately, diet-induced obesity did not result in a statistically significant increased tumour burden (57.1% vs. 33.3%, p = 0.37; Supplementary Table S1). This may be due to the small sample size; however, the overall incidence of cancer in the rats in this study was 49%, which is slightly lower than expected. [9]. A post-hoc power analysis showed that the study would require 116 rats to demonstrate a statistically significant difference in the endometrial cancer incidence in the NCD and HFD groups.
A second reason as to why diet-induced obesity did not increase the tumour burden in these rats is likely related to the underlying genetics of this model. In particular, we confirm previous findings [16] that p53 mutations are common in the BDII/Han tumours but these do not appear to be a key driver in this model. A pan-cancer analysis of human p53 recently showed a significantly decreased transcript and protein expression of p53 when truncating variants were present versus wild-type or missense variants [27]. The p.Pro320ThrfsTer10 frameshift found in our rat model occurs in the p53 tetramerisation domain and has no human equivalent. The majority of human p53 variants, as well as the other variants found in our data, occur in the p53 DNA-binding domain. We hypothesise that the prevalent frameshift found herein is not functional in truncating the protein based on the gene’s comparable expression to “true” wild-type samples. While two lowly-expressed isoforms are significantly different in the Tp53 expression grouping on the non-p.Pro320ThrfsTer10 variants, the two major isoforms are unaffected. Further, the investigated TP53 hallmark pathway was completely unaffected by p.Pro320ThrfsTer10 presence, and 2/195 genes were affected by the non-p.Pro320ThrfsTer10 variants, which could be due to non-p53-related effects.
In human EC, p53 mutations are associated with serous carcinoma and the copy number high molecular subtype, which are not classically associated with obesity. Despite this important molecular difference, the histology of all rat tumours in this study was similar to the histological appearances of obesity-related human endometrial cancer, furthering the idea that these rats have functional p53. The presence of functional p53 means this rat model is a more realistic model of human obesity-related EC. Our findings of MSI and high TMB suggest that this model is most closely related to the microsatellite unstable human molecular subtype. While diet did not significantly affect cancer incidence, it did alter the EC transcriptome and we identified 368 DEGs between tumours in the HFD group and tumours in the NCD group. We sequenced multiple samples from individual tumours to try to control for heterogeneity and were able to identify a number of clinically important alterations in human endometrial cancer. Specifically, we identified Brd4 as a key upstream regulator in our dataset, which correlates with an extensive body of literature describing Brd4 as a regulator of the oestrogen response genes in both endometrial and breast cancer [19,28].
Our diet-induced obesity study was used to identify two novel biomarkers for endometrial cancer, A2M and CRABP2, both of which appear to have important prognostic implications. A2M’s role in cancer biology is likely due to its ability to act as a signalling molecule and transporter of growth factors, such as TGFβ and IL6, and as a modulator of protease activity [29]. Serum A2M levels are inversely correlated with PSA in advanced prostate cancer, suggestive of a tumour-suppressive effect—as demonstrated in this study (Figure 3B) [30]. Serum levels of A2M decrease with age and obesity in humans [31]; our findings of a negative correlation between A2M mRNA expression and BMI in the TCGA cohort suggest that the BDII/Han rat model can be used to study specific interventions and identify molecular alterations that are relevant to human endometrial cancer.
We also present novel data on the role of CRABP2 in endometrial cancer. CRABP2 is a retinoic acid binding protein and along with the retinoic acid receptor (RAR) are important regulators of cellular turnover in the endometrium [32]. CRABP2 is a highly conserved protein that functions in the retinoic acid signalling pathway, where it transports RA to the retinoic acid nuclear receptors (RAR and RXR), which regulates transcription of target genes involved in cell proliferation, differentiation and apoptosis. It also functions as a transcriptional coactivator: in the presence of CRABP2, transactivation by the RA–RXR–RAR complex is increased [33]. More recently, it has been reported that CRABP2 can affect biological behaviour independently of RA or RAR [34].
Abnormal CRABP2 expression is associated with numerous cancers, including non-small cell lung cancer (NSCLC) [35], pancreatic cancer [36] and serous ovarian cancer [37]. CRABP2 ′s role in breast cancer may be related to oestrogen signalling that suppresses the ubiquitination of Lats1 to activate the Hippo pathway, which inhibits invasion and metastasis in ER-positive tumours but not in ER-negative tumours [38]. Given our recent description of the different roles of ER in breast and endometrial cancer, the interaction between CRABP2 and ER in endometrial cancer warrants further investigation [39]. Our finding that CRABP2 is an independent prognostic marker in endometrial cancer requires further validation; however, it is maybe an important novel biomarker in CN-high cancers, which have a poor prognosis.

4. Materials and Methods

Nineteen female, virgin BDII/Han rats were sourced from the Central Animal Facility (CAF) at the Hanover Medical School in Germany. The BDII/Han rats were divided into two groups: the normal chow diet group (NCD group, n = 7) and the high fat diet group (HFD group, n = 12). The rats were received from the CAF in Hanover at three months of age having been on normal chow diet from the time of weaning. Rats were age-matched and housed in spacious ventilated cages with hard floors in groups of 3–4 rats. They had 24 h access to ad lib food and water. The NCD group remained on normal chow diet until the study end at fifteen months of age. Normal chow with 3% kCal fat content was used as the chosen diet in the NCD group as it is generally accepted as the standard diet for research rats. The HFD group were immediately placed on a high fat diet from the time of arrival at three months of age and continued on this diet until the study end at fifteen months of age. The high fat diet included 60% kCal fat, 20% kCal carbohydrate and 20% kCal protein (Research Diets, NJ, USA). At fifteen months of age, CT imaging was carried out followed by euthanasia and systematic harvesting of animal organs was performed.

4.1. CT Imaging

CT scans were performed on a LabPET4 Triumph PET CT scanner (Trifoil Imaging Inc., Chatsworth, CA, USA) under isoflurane anaesthesia. Cone beam CT images (focal spot size, 33 mm) were acquired over ~ 5 min with 512 projections at a geometric magnification equal to a 1.3. X-ray tube voltage and the currents were 50 kVP and 350 µA, respectively, and the exposure was 232 ms. CT images were reconstructed with X-O CT software (V5.2.0.0 Trifoil Imaging Inc., Chatsworth, CA, USA), using a filtered back-projection algorithm to a voxel size of 0.2 × 0.2 × 0.2 mm3.

4.2. Assessment of Endometrial Cancer Burden

At the time of tissue harvest the animals were administered anaesthesia by inhalation of sevoflurane gas. A midline laparotomy and thoracotomy were performed. Euthanasia was performed by a terminal bleed from the aorta. Clinical photographs were taken and an assessment of the intrabdominal and peri-visceral fat was made and recorded on each animal. Complete organ harvest followed with organs dissected in order of research priority; uterus, ovaries, liver, omentum and lung. This allowed for complete staging of any endometrial cancer found.

4.3. Retrieval of Endometrial Tissue for Histology and RNA Isolation

A standardised method for the harvesting of uterine tissue was performed, as described by Ruehl-Fehlert [40,41]. One half of each tumour specimen was placed immediately in formalin and prepared for immunohistochemistry and histological assessment while the other half was “snap-frozen” in liquid nitrogen for interval RNA isolation and subsequent RNA sequencing. Parallel samples of normal endometrial tissue were also taken for histological and molecular assessment. Samples for histology were fixed in 4% formalin for 24 h before paraffin embedding. A total of 14 tumour samples were analysed from 4 affected rats in the NCD group while 12 tumour samples were analysed from the 4 affected rats in the HFD group. Histopathological assessment was performed by a histopathologist specializing in gynaecological oncology.

4.4. RNA Extraction, Library Prep and Sequencing

RNA was isolated from normal (n = 34 samples from n = 23 individual rats) and endometrial tumour (n = 31 from n = 13 individual rats) tissue using the EZ-RNA Total RNA Isolation Kit, according to the manufacturer’s protocol (Omega Bio-Tek, Norcross, GA, USA). Next-generation sequencing was performed by BGI Genomics (Shenzhen, China). After quality control procedures, individual RNAseq libraries were pooled based on their respective sample-specific, 7 bp adapters, and sequenced at a 2 × 75 bp paired-end read length using an Illumina NextSeq 500 sequencer. (see Appendix A).

4.5. RNAseq Processing, Differential Expression Analysis and Variant Calling

Raw sequence reads were first checked for quality using fastq software [42] and were then trimmed of low-quality reads using BBDuk [42]. The Kallisto [43] pseudo-aligner was used to map reads to the Rattus norvegicus Rnor_6.0 transcriptome from Ensembl release 94. The Sleuth [44] R package was used to read the Kallisto output, and to normalise and scale the transcript and gene expression values using the default settings. Limma [23], which uses a negative binomial distribution model to account for both biological and technical variation, was applied to identify statistically significant (corrected p value < 0.05) differentially expressed genes (DEGs), using the “voom” function and the robust empirical Bayes model. Limma was chosen as it allows correction for multiple samples taken from the same individual animal using the “duplicate Correlation” function. Variant calling was conducted using the HaplotypeCaller module of the Genome Analysis Toolkit following best practices for RNA. Filtering was conducted using custom Perl scripts. All RNAseq analysis methods are available from https://github.com/brucemoran/rdl_RNAseq.

4.6. Pathway and Functional Enrichment Analysis

Over-represented biological functions from the DEG sets were identified by functional enrichment analysis using Ingenuity Pathway Analysis (IPA; v. 8.8, Ingenuity Systems, Mountain View, CA, USA; http://www.ingenuity.com). The enrichment analysis was applied to the statistically significant differentially expressed genes.

4.7. TCGA Comparative Model

In order to draw comparisons between the animal data and human data we created a comparative data set from TCGA (n = 373) [7]. Two samples were excluded as raw sequence data was unavailable, leaving a final n = 371 samples. Further comparisons between the genes of interest from our animal model and human data were performed using Oncolnc [24], the Human Protein Atlas [25] and cBioportal [26]. Differences in the distribution of clinical data and tumour characteristics between genes of interest were evaluated using the chi-square test, Fisher exact test and independent t-test. Kaplan–Meier analysis and the log-rank test were used to illustrate differences between overall survival based on expression levels of A2M and Crabp2. Unsupervised decision tree analysis with a 10-fold cross-validation was used to identify the Z-score thresholds for the Kaplan–Meier analysis. Cox regression proportional hazards models were used to estimate the impact of the A2M and Crabp2 expression overall survival (OS) in both univariate and multivariate analysis. Variables found to be significant in the univariate analysis were included in the multivariate models. Analysis were performed using SPSS version 20.0 (IBM Corp, Armonk, NY, USA). All statistical tests were two-sided and p < 0.05 was considered statistically significant.

4.8. Ethics

This study was granted full ethical approval by the both the Animal Research Ethics Committee (AREC17-06) and the Health Product Regulatory Authority (AE1892/P119) on the 26th of July 2017.

5. Conclusions

Diet-induced obesity had a significant effect on the tumour transcriptome in a BDII/Han rat model of endometrial cancer. The BDII/Han rat model is an acceptable model to study obesity-related carcinogenesis and the impact of weight loss intervention on endometrial cancer biology and may be used to identify the clinically relevant genes of human endometrial cancer.

Supplementary Materials

The following are available online at https://www.mdpi.com/2075-1729/10/9/188/s1, Table S1: Study Group; Table S2: Cox regression analysis of Overall Survival for Brd; Table S3: Rat variants within the Tp53 gene region; Table S4: Rat- human TP53 variant orthologs; Table S5: MSI status, TMB and metadata.

Author Contributions

Data curation: M.W., P.S.(Piriyah Sinclair), L.D.-T., P.S. (Patrick Swan); writing—original draft preparation: M.W.; writing—review and editing: M.W., B.M., W.M.G., P.D., K.S., N.D., C.l.R., D.J.B.; project administration: M.W., P.S. (Patrick Swan); formal analysis: M.W., B.M.; investigation: M.W.; validation: M.W., B.M.; methodology: M.W., P.S. (Piriyah Sinclair), C.l.R., D.J.B.; study design: P.S. (Piriyah Sinclair); ethical approval: P.S. (Piriyah Sinclair); software: B.M.; conceptualization: D.W., N.D., C.l.R., D.J.B.; assisted with in vivo study: E.C., W.M.G.; supervised RNA extraction and optimization: E.B.; histopathology support: P.D., K.S.; data analysis: P.D., K.S.; resources: C.l.R., D.J.B.; supervision: C.l.R., D.J.B. All authors have read and agreed to the published version of the manuscript.

Funding

This work was supported in part by the RCSI, UCD and NUIG pursuant to a grant from Science Foundation Ireland (SFI) under grant number 18/RI/5759 and a grant from Science Foundation Ireland (SFI) and the European Regional Development Fund (ERDF) under grant number 13/RC/2073, the Irish Cancer Society Collaborative Cancer Research Centre BREAST PREDICT (CCRC13GAL), the Science Foundation Ireland Investigator Programme OPTi-PREDICT (grant code 15/IA/3104), the Science Foundation Ireland Strategic Partnership Programme Precision Oncology Ireland (grant code 18/SPP/3522), The Ireland East Hospital Group and the UCD Wellcome Institutional Strategic Support Fund, which was financed jointly by University College Dublin and the SFI-HRB-Wellcome Biomedical Research Partnership (ref 204844/Z/16/Z).

Conflicts of Interest

The authors declare no conflict of interest.

Appendix A

RNA Extraction, Library Prep and Sequencing

RNA was isolated from normal and endometrial tumour tissue using the EZ-RNA Total RNA Isolation Kit according to the manufacturer’s protocol (Omega Bio-Tek, Norcross, GA, USA). RNA quantity and quality were determined using the Nanodrop spectrophotometer ND-1000 (Nanodrop Technologies, DE, USA) and Agilent Bioanalyzer 2100 (Agilent Technologies, Wokingham, United Kingdom). Next-generation sequencing was performed by BGI Genomics, Shenzhen, China. The mRNA molecules were purified from total RNA using oligo (DT)-attached magnetic beads. The mRNA was then fragmented into small pieces using a fragmentation reagent. First-strand cDNA was generated using random hexamer-primed reverse transcription, followed by a second strand c-DNA synthesis. The synthesised cDNA was subjected to end-repair and then adenylated at the 3′ end. Adapters were ligated to the ends of these 3′ adenylated cDNA fragments. PCR was used to amplify the cDNA fragments with the adapters used in the 3′ adenylation. The products from the PCR were purified with Ampure XP Beads (AGENCOURT) and dissolved in EB solution. The subsequent library was validated on the Agilent Technologies 2100 bioanalyzer. The double-stranded PCR products were then heat denatured and circularized by the splint oligo sequence. The single-strand circle DNA (ssCir DNA) was formatted as the final library. The library was amplified with phi29 to make the DNA nanoball and the RNA was isolated from endometrial tissue samples (10mg) in the “discovery set” (n = 20) using the EZ-RNA Total RNA Isolation Kit according to the manufacturer’s protocol (Omega Bio-Tek). RNA quantity and quality were determined using the Nanodrop spectrophotometer ND-1000 (Nanodrop Technologies, DE, USA) and Agilent Bioanalyzer 2100 (Agilent Technologies, UK). Next-generation sequencing libraries were prepared using the NeoPrep Automated Library Prep System and Illumina Truseq stranded mRNA library prep kit using the manufacturer’s instructions (Illumina, San Diego, CA, USA). A total of 100ng of RNA was used as input to the Illumina Truseq stranded mRNA library Prep for the Neoprep kit. The system automates mRNA purification and fragmentation from the total RNA. Complement DNA (cDNA) was synthesized from the RNA fragments using reverse transcriptase (Superscript II) and random primers. This was followed by second-strand cDNA synthesis and the resulting double-stranded DNA (dsDNA) went through an end-repair process, the addition of a single A base and ligation of the adapters. The resulting adapter-ligated cDNA was then enriched by polymerase chain reaction (PCR). Finally, the 10 nM normalised cDNA libraries were validated on the Agilent Bioanalyser 2100 using the DNA 1000 Nano Lab Chip kit, ensuring the library fragment size was approximately 300 bp. After the quality-control procedures, individual RNAseq libraries were pooled based on their respective sample-specific, 7 bp adapters, and sequenced at a 2 × 75 bp paired-end read length using an Illumina NextSeq 500 sequencer.

References

  1. Siegel, R.L.; Miller, K.D.; Jemal, A. Cancer statistics, 2018. CA Cancer J. Clin. 2018, 68, 7–30. [Google Scholar] [CrossRef] [PubMed]
  2. Colombo, N.; Creutzberg, C.; Amant, F.; Bosse, T.; Gonzalez-Martin, A.; Ledermann, J.; Marth, C.; Nout, R.; Querleu, D.; Mirza, M.R.; et al. ESMO-ESGO-ESTRO consensus conference on endometrial cancer: Diagnosis, treatment and follow-up. Radiother. Oncol. J. Eur. Soc. Ther. Radiol. Oncol. 2015, 117, 559–581. [Google Scholar] [CrossRef] [PubMed] [Green Version]
  3. Setiawan, V.W.; Yang, H.P.; Pike, M.C.; McCann, S.E.; Yu, H.; Xiang, Y.B.; Wolk, A.; Wentzensen, N.; Weiss, N.S.; Webb, P.M.; et al. Type I and II endometrial cancers: Have they different risk factors? J. Clin. Oncol. Off. J. Am. Soc. Clin. Oncol. 2013, 31, 2607–2618. [Google Scholar] [CrossRef] [PubMed]
  4. Lauby-Secretan, B.; Scoccianti, C.; Loomis, D.; Grosse, Y.; Bianchini, F.; Straif, K. Body Fatness and Cancer--Viewpoint of the IARC Working Group. N. Engl. J. Med. 2016, 375, 794–798. [Google Scholar] [CrossRef] [Green Version]
  5. Levine, R.L.; Cargile, C.B.; Blazes, M.S.; van Rees, B.; Kurman, R.J.; Ellenson, L.H. PTEN mutations and microsatellite instability in complex atypical hyperplasia, a precursor lesion to uterine endometrioid carcinoma. Cancer Res. 1998, 58, 3254–3258. [Google Scholar]
  6. Maxwell, G.L.; Risinger, J.I.; Gumbs, C.; Shaw, H.; Bentley, R.C.; Barrett, J.C.; Berchuck, A.; Futreal, P.A. Mutation of the PTEN tumor suppressor gene in endometrial hyperplasias. Cancer Res. 1998, 58, 2500–2503. [Google Scholar]
  7. Kandoth, C.; Schultz, N.; Cherniack, A.D.; Akbani, R.; Liu, Y.; Shen, H.; Robertson, A.G.; Pashtan, I.; Shen, R.; Benz, C.C.; et al. Integrated genomic characterization of endometrial carcinoma. Nature 2013, 497, 67–73. [Google Scholar] [CrossRef] [Green Version]
  8. Liu, Y.; Patel, L.; Mills, G.B.; Lu, K.H.; Sood, A.K.; Ding, L.; Kucherlapati, R.; Mardis, E.R.; Levine, D.A.; Shmulevich, I.; et al. Clinical significance of CTNNB1 mutation and Wnt pathway activation in endometrioid endometrial carcinoma. J. Natl. Cancer Inst. 2014, 106. [Google Scholar] [CrossRef] [Green Version]
  9. Deerberg, F.; Kaspareit, J. Endometrial carcinoma in BD II/Han rats: Model of a spontaneous hormone-dependent tumor. J. Natl. Cancer Inst. 1987, 78, 1245–1251. [Google Scholar]
  10. Vollmer, G. Endometrial cancer: Experimental models useful for studies on molecular aspects of endometrial cancer and carcinogenesis. Endocr. Relat. Cancer 2003, 10, 23–42. [Google Scholar] [CrossRef] [Green Version]
  11. Hogarty, M.D.; Norris, M.D.; Davis, K.; Liu, X.; Evageliou, N.F.; Hayes, C.S.; Pawel, B.; Guo, R.; Zhao, H.; Sekyere, E.; et al. ODC1 is a critical determinant of MYCN oncogenesis and a therapeutic target in neuroblastoma. Cancer Res. 2008, 68, 9735–9745. [Google Scholar] [CrossRef] [PubMed] [Green Version]
  12. Karlsson, A.; Helou, K.; Walentinsson, A.; Hedrich, H.J.; Szpirer, C.; Levan, G. Amplification of Mycn, Ddx1, Rrm2, and Odc1 in rat uterine endometrial carcinomas. Genes Chromosomes Cancer 2001, 31, 345–356. [Google Scholar] [CrossRef]
  13. Deerberg, F.; Pohlmeyer, G.; Lorcher, K.; Petrow, V. Total suppression of spontaneous endometrial carcinoma in BDII/Han rats by melengestrol acetate. Oncology 1995, 52, 319–325. [Google Scholar] [CrossRef] [PubMed]
  14. Adamovic, T.; Trosso, F.; Roshani, L.; Andersson, L.; Petersen, G.; Rajaei, S.; Helou, K.; Levan, G. Oncogene amplification in the proximal part of chromosome 6 in rat endometrial adenocarcinoma as revealed by combined BAC/PAC FISH, chromosome painting, zoo-FISH, and allelotyping. Genes Chromosomes Cancer 2005, 44, 139–153. [Google Scholar] [CrossRef] [PubMed]
  15. Helou, K.; Walentinsson, A.; Beckmann, B.; Johansson, A.; Hedrich, H.J.; Szpirer, C.; Klinga-Levan, K.; Levan, G. Analysis of genetic changes in rat endometrial carcinomas by means of comparative genomic hybridization. Cancer Genet. Cytogenet. 2001, 127, 118–127. [Google Scholar] [CrossRef]
  16. Samuelson, E.; Hedberg, C.; Nilsson, S.; Behboudi, A. Molecular classification of spontaneous endometrial adenocarcinomas in BDII rats. Endocr. Relat. Cancer 2009, 16, 99–111. [Google Scholar] [CrossRef]
  17. Watanabe, J.; Nishizaki, R.; Jobo, T.; Kamata, Y.; Hata, H.; Nishimura, Y.; Fujisawa, T.; Okayasu, I.; Kuramoto, H. Expression of tumor suppressor gene product p14ARF in endometrioid adenocarcinoma of the uterine corpus. Int. J. Gynecol. Pathol. 2004, 23, 234–240. [Google Scholar] [CrossRef]
  18. Price, N.L.; Singh, A.K.; Rotllan, N.; Goedeke, L.; Wing, A.; Canfrán-Duque, A.; Diaz-Ruiz, A.; Araldi, E.; Baldán, Á.; Camporez, J.P.; et al. Genetic Ablation of miR-33 Increases Food Intake, Enhances Adipose Tissue Expansion, and Promotes Obesity and Insulin Resistance. Cell Rep. 2018, 22, 2133–2145. [Google Scholar] [CrossRef] [Green Version]
  19. Nagarajan, S.; Hossan, T.; Alawi, M.; Najafova, Z.; Indenbirken, D.; Bedi, U.; Taipaleenmaki, H.; Ben-Batalla, I.; Scheller, M.; Loges, S.; et al. Bromodomain protein BRD4 is required for estrogen receptor-dependent enhancer activation and gene transcription. Cell Rep. 2014, 8, 460–469. [Google Scholar] [CrossRef] [Green Version]
  20. Jones, D.H.; Lin, D.I. Amplification of the NSD3-BRD4-CHD8 pathway in pelvic high-grade serous carcinomas of tubo-ovarian and endometrial origin. Mol. Clin. Oncol. 2017, 7, 301–307. [Google Scholar] [CrossRef] [Green Version]
  21. Talhouk, A.; McConechy, M.K.; Leung, S.; Yang, W.; Lum, A.; Senz, J.; Boyd, N.; Pike, J.; Anglesio, M.; Kwon, J.S.; et al. Confirmation of ProMisE: A simple, genomics-based clinical classifier for endometrial cancer. Cancer 2017, 123, 802–813. [Google Scholar] [CrossRef] [PubMed] [Green Version]
  22. Britton, H.; Huang, L.; Lum, A.; Leung, S.; Shum, K.; Kale, M.; Burleigh, A.; Senz, J.; Yang, W.; McConechy, M.; et al. Molecular classification defines outcomes and opportunities in young women with endometrial carcinoma. Gynecol. Oncol. 2019, 153, 487–495. [Google Scholar] [CrossRef] [PubMed]
  23. Ritchie, M.E.; Phipson, B.; Wu, D.; Hu, Y.; Law, C.W.; Shi, W.; Smyth, G.K. limma powers differential expression analyses for RNA-sequencing and microarray studies. Nucleic Acids Res. 2015, 43, e47. [Google Scholar] [CrossRef] [PubMed]
  24. Oncolnc. Available online: http://www.oncolnc.org (accessed on 1 July 2020).
  25. Atlas, T.H.P. The Human Protein Atlas. Available online: https://www.proteinatlas.org (accessed on 1 July 2020).
  26. cBioportal. Available online: https://www.cbioportal.org (accessed on 1 July 2020).
  27. Pimentel, H.; Bray, N.L.; Puente, S.; Melsted, P.; Pachter, L. Differential analysis of RNA-seq incorporating quantification uncertainty. Nat. Methods 2017, 14, 687–690. [Google Scholar] [CrossRef] [PubMed]
  28. Lee, M.; Tayyari, F.; Pinnaduwage, D.; Bayani, J.; Bartlett, J.M.S.; Mulligan, A.M.; Bull, S.B.; Andrulis, I.L. Tumoral BRD4 expression in lymph node-negative breast cancer: Association with T-bet+ tumor-infiltrating lymphocytes and disease-free survival. BMC Cancer 2018, 18, 750. [Google Scholar] [CrossRef] [Green Version]
  29. Kurz, S.; Thieme, R.; Amberg, R.; Groth, M.; Jahnke, H.G.; Pieroh, P.; Horn, L.C.; Kolb, M.; Huse, K.; Platzer, M.; et al. The anti-tumorigenic activity of A2M-A lesson from the naked mole-rat. PLoS ONE 2017, 12, e0189514. [Google Scholar] [CrossRef] [PubMed]
  30. Kostova, M.B.; Brennen, W.N.; Lopez, D.; Anthony, L.; Wang, H.; Platz, E.; Denmeade, S.R. PSA-alpha-2-macroglobulin complex is enzymatically active in the serum of patients with advanced prostate cancer and can degrade circulating peptide hormones. Prostate 2018, 78, 819–829. [Google Scholar] [CrossRef] [PubMed]
  31. Birkenmeier, G.; Muller, R.; Huse, K.; Forberg, J.; Glaser, C.; Hedrich, H.; Nicklisch, S.; Reichenbach, A. Human alpha2-macroglobulin: Genotype-phenotype relation. Exp. Neurol. 2003, 184, 153–161. [Google Scholar] [CrossRef]
  32. Ochiai, A.; Kuroda, K.; Ozaki, R.; Ikemoto, Y.; Murakami, K.; Muter, J.; Matsumoto, A.; Itakura, A.; Brosens, J.J.; Takeda, S. Resveratrol inhibits decidualization by accelerating downregulation of the CRABP2-RAR pathway in differentiating human endometrial stromal cells. Cell Death Dis. 2019, 10, 276. [Google Scholar] [CrossRef] [Green Version]
  33. Delva, L.; Bastie, J.N.; Rochette-Egly, C.; Kraïba, R.; Balitrand, N.; Despouy, G.; Chambon, P.; Chomienne, C. Physical and functional interactions between cellular retinoic acid binding protein II and the retinoic acid-dependent nuclear complex. Mol. Cell. Biol. 1999, 19, 7158–7167. [Google Scholar] [CrossRef] [Green Version]
  34. Vreeland, A.C.; Yu, S.; Levi, L.; de Barros Rossetto, D.; Noy, N. Transcript stabilization by the RNA-binding protein HuR is regulated by cellular retinoic acid-binding protein 2. Mol. Cell. Biol. 2014, 34, 2135–2146. [Google Scholar] [CrossRef] [PubMed] [Green Version]
  35. Wu, J.-I.; Lin, Y.-P.; Tseng, C.-W.; Chen, H.-J.; Wang, L.-H. Crabp2 Promotes Metastasis of Lung Cancer Cells via HuR and Integrin β1/FAK/ERK Signaling. Sci. Rep. 2019, 9, 845. [Google Scholar] [CrossRef] [PubMed]
  36. Yu, S.; Parameswaran, N.; Li, M.; Wang, Y.; Jackson, M.W.; Liu, H.; Xin, W.; Zhou, L. CRABP-II enhances pancreatic cancer cell migration and invasion by stabilizing interleukin 8 expression. Oncotarget 2017, 8, 52432–52444. [Google Scholar] [CrossRef] [PubMed]
  37. Toyama, A.; Suzuki, A.; Shimada, T.; Aoki, C.; Aoki, Y.; Umino, Y.; Nakamura, Y.; Aoki, D.; Sato, T.A. Proteomic characterization of ovarian cancers identifying annexin-A4, phosphoserine aminotransferase, cellular retinoic acid-binding protein 2, and serpin B5 as histology-specific biomarkers. Cancer Sci. 2012, 103, 747–755. [Google Scholar] [CrossRef]
  38. Feng, X.; Zhang, M.; Wang, B.; Zhou, C.; Mu, Y.; Li, J.; Liu, X.; Wang, Y.; Song, Z.; Liu, P. CRABP2 regulates invasion and metastasis of breast cancer through hippo pathway dependent on ER status. J. Exp. Clin. Cancer Res. 2019, 38, 361. [Google Scholar] [CrossRef]
  39. Baxter, E.; Windloch, K.; Kelly, G.; Lee, J.S.; Gannon, F.; Brennan, D.J. Molecular basis of distinct oestrogen responses in endometrial and breast cancer. Endocr. Relat. Cancer 2019, 26, 31–46. [Google Scholar] [CrossRef]
  40. Ruehl-Fehlert, C.; Kittel, B.; Morawietz, G.; Deslex, P.; Keenan, C.; Mahrt, C.R.; Nolte, T.; Robinson, M.; Stuart, B.P.; Deschl, U. Revised guides for organ sampling and trimming in rats and mice—Part 1. Exp. Toxicol. Pathol. 2003, 55, 91–106. [Google Scholar] [CrossRef] [Green Version]
  41. Morawietz, G.; Ruehl-Fehlert, C.; Kittel, B.; Bube, A.; Keane, K.; Halm, S.; Heuser, A.; Hellmann, J. Revised guides for organ sampling and trimming in rats and mice—Part 3. A joint publication of the RITA and NACAD groups. Exp. Toxicol. Pathol. 2004, 55, 433–449. [Google Scholar] [CrossRef]
  42. Chen, S.; Zhou, Y.; Chen, Y.; Gu, J. fastp: An ultra-fast all-in-one FASTQ preprocessor. Bioinformatics 2018, 34, i884–i890. [Google Scholar] [CrossRef]
  43. Bray, N.L.; Pimentel, H.; Melsted, P.; Pachter, L. Near-optimal probabilistic RNA-seq quantification. Nat. Biotechnol. 2016, 34, 525–527. [Google Scholar] [CrossRef]
  44. Li, L.; Feng, Q.; Wang, X. PreMSIm: An R package for predicting microsatellite instability from the expression profiling of a gene panel in cancer. Comput. Struct. Biotechnol. J. 2020, 18, 668–675. [Google Scholar] [CrossRef] [PubMed]
Figure 1. Diet-induced obesity in BDII/Han rats. (A) Graphical representation of the weight trajectory of the normal chow diet (NCD; n = 7, blue line) and high fat diet group (HFD; n = 12, red line). (B) Comparative CT imaging and photos taken at necropsy, showing the increase in volume of intra-abdominal fat in the HFD group (right) relative to rats from the NCD group (left). (C) Hysterectomy specimen from a BDII/Han rat from the high fat diet group. H&E showing endometrial adenocarcinoma in the right proximal uterine horn with a magnified (20×) view of the histology slide showing a solid area of the endometrial adenocarcinoma. (D) Hysterectomy specimen from a normal chow-fed BDII/Han rat. H&E showing endometrial adenocarcinoma in the left distal uterine horn, with a magnified (20×) view of the histology slide showing a gland-rich endometrial adenocarcinoma.
Life 10 00188 g001
Figure 2. Transcriptomic characteristics of the impact of diet-induced obesity on BDII/Han endometrial tumours. (A) Volcano plot showing the differentially expressed genes between tumours from the HFD and NCD groups. The genes delineated in red are those that reached statistical significance (p < 0.05). The box plot on the left shows the top 5 genes with reduced expression in the HFD group relative to the NCD group. The box plot on the right shows the top 5 genes with increased expression in the HFD group relative to the NCD group. The HFD group is delineated in blue and the NCD group in red. (B) Top ranking canonical pathways in HFD and NCD tumour tissue. (C) Upstream regulators of DEGs in HFD and NCD tumours. (D) Brd4 was a statistically significant upstream regulator, imparting a downstream effect on five DEGs. (E) mir-33 was a statistically significant upstream regulator, imparting a downstream effect on five DEGs. (G) Brd4 is prognostic in human endometrial cancer with decreased expression leading to lower overall survival. (F) Antibody stain showing high expression of Brd4 in 9/11 endometrial cancer samples from the Human Protein Atlas TCGA pathology database. (H) Corresponding antibody stain showing low expression of Brd4 in 3/11 human thyroid cancer samples from the Human Protein Atlas TCGA pathology database. The Human Protein Atlas was accessed July 2020.
Life 10 00188 g002
Figure 3. Genes altered by obesity in the BDII/Han model are clinically relevant in human endometrial cancer. (A) Genomic and transcriptomic alterations of the top 10 differentially expressed genes identified in human endometrial cancers. (B) Increased expression of A2M leads to a significant improved overall survival in human endometrial cancer. (C) Immunohistochemistry from the Human Protein Atlas demonstrates the expression of the A2M protein in human endometrial cancer. (D) Increased expression of CRABP2 leads to a significantly improved reduced survival in human endometrial cancer. (E) Immunohistochemistry from the Human Protein Atlas demonstrates the expression of CRABP2 protein in human endometrial cancer. The Human Protein Atlas was accessed July 2020.
Life 10 00188 g003
Table 1. A2M and Crabp2 mRNA expression and clinicopathological variables.
A2M Low
(n = 191)
A2M High
(n = 180)
p-ValueCrabp2 Low
(n = 265)
Crabp2 High
(n = 106)
p-Value
Age Median (range)63 (35–90)63 (31–90)0.66563 (33–90)65 (31–90)0.093 *
BMI Median (range)33.1 (19–82)32.3 (17–61)<0.001 *33 (17–82)31 (19–68)0.485 *
Histology
Endometrioid147 (77)158 (87)0.003238(90)67 (63)<0.001
Serous32 (16.7)21 (12) 20 (7)33 (31)
Mixed12 (6.3)1 (1) 7 (3)6 (6)
Stage
1120 (63.1)132(74.2)0.15194 (74)59 (55)0.005
216 (8.4)10 (5) 16 (6)10 (9)
344 (23.1)30 (16.8) 47 (18)28 (26)
411 (5.4)8 (4) 8 (2)9 (9)
Grade
131 (16.2)58 (32.2)<0.00174 (28)15 (14)0.001
250 (26.1)55 (30.5) 77 (29)28 (26)
3110 (57.7)67 (37.3) 114 (43)63 (59)
TCGA molecular subtype
POLE11 (10.2)6 (4.8)0.2816 (10)1 (2)<0.001
MSI 30 (28)35 (28) 58 (35)7 (10)
CN Low32 (30)58 (46.4) 65 (39)25 (37)
CN High34 (31.8)26 (20.8) 26 (16)34 (51)
Values in parenthesis are percentages unless otherwise stated. Abbreviations: BMI—body mass index; SEM—standard error of the mean; TCGA—The Cancer Genome Atlas; MSI—microsatellite instable; CN—copy number. * Mann–Whitney U test.
Table 2. Cox regression analysis of OS for A2M and Crabp2.
Univariate Multivariate
HR95.0% CIp-ValueHR95.0% CIp-Value
Overall SurvivalLowerUpperLowerUpper
A2M (low vs. high)0.4550.230.90.0240.6120.3051.2290.167
Age (continuous)1.0411.0091.0750.0131.0531.0151.0920.005
Histology (endometrioid vs. non-endometrioid2.2981.184.4750.0140.7050.3111.5950.401
Stage (1 and 2 vs. 3 and 4)4.6542.4488.849<0.0013.9121.9038.042<0.001
Grade (1 and 2 vs. 3)3.3931.6526.9690.0011.8480.7964.2890.153
HR95.0% CIp-ValueHR95.0% CIp-Value
Overall SurvivalLowerUpperLowerUpper
Crabp2 (low vs. high)3.5541.8756.735<0.0013.1341.5246.4430.002
Age (continuous)1.0411.0091.0750.0131.0461.0111.0830.01
Histology (endometrioid vs. non-endometrioid)2.2981.184.4750.0140.4510.1931.0520.065
Stage (1 and 2 vs. 3 and 4)4.6542.4488.849<0.0013.8751.8688.036<0.001
Grade (1 and 2 vs. 3)3.3931.6526.9690.0011.8020.7754.190.171
Abbreviations: A2M—alpha2macroglobulin; CI—confidence interval; HR—hazard ratio; OS—overall survival.

