Histological and SEM Assessment of Blood Stasis in Kidney Blood Vessels after Repeated Intra-Arterial Application of Radiographic Contrast Media

 , , ,
, , ,  and
and 
Abstract
1. Introduction
2. Methods
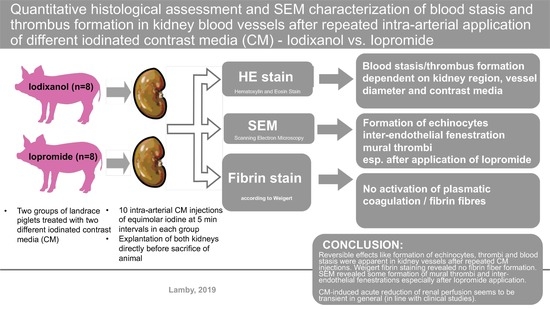
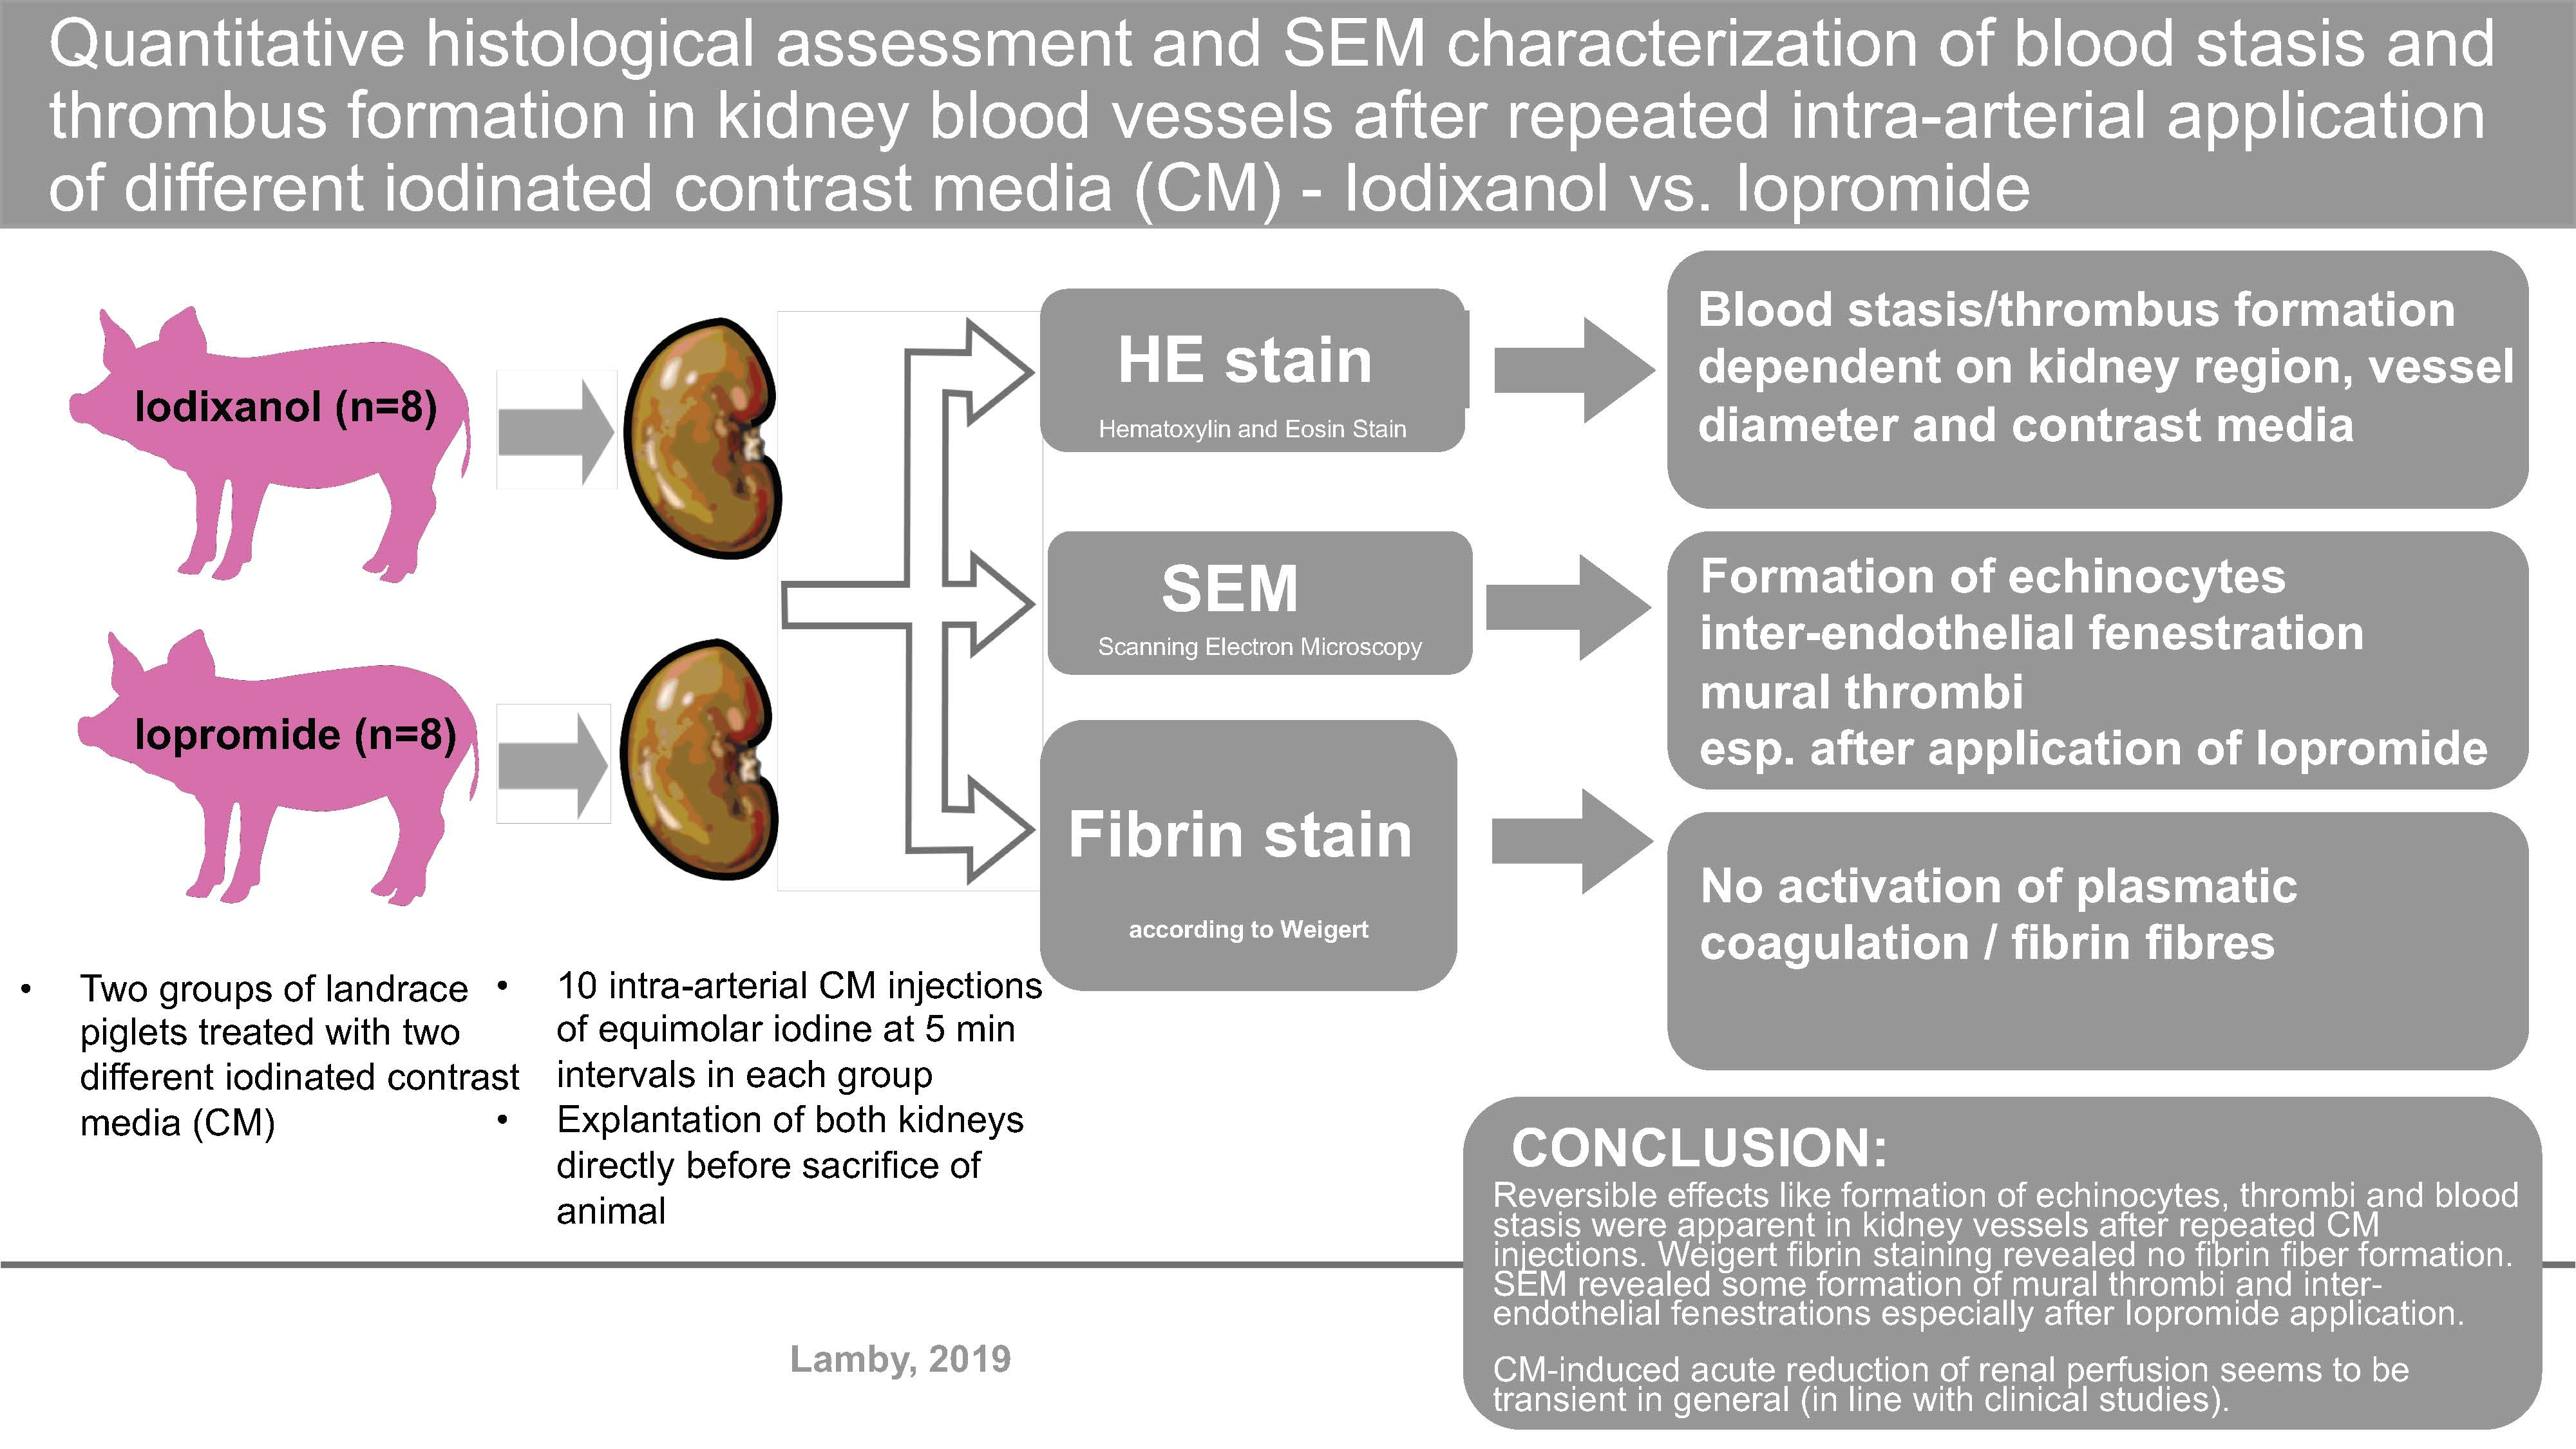
2.1. Study Design
2.2. Animals
2.3. Iodinated Contrast Media
2.4. Kidney Explantation
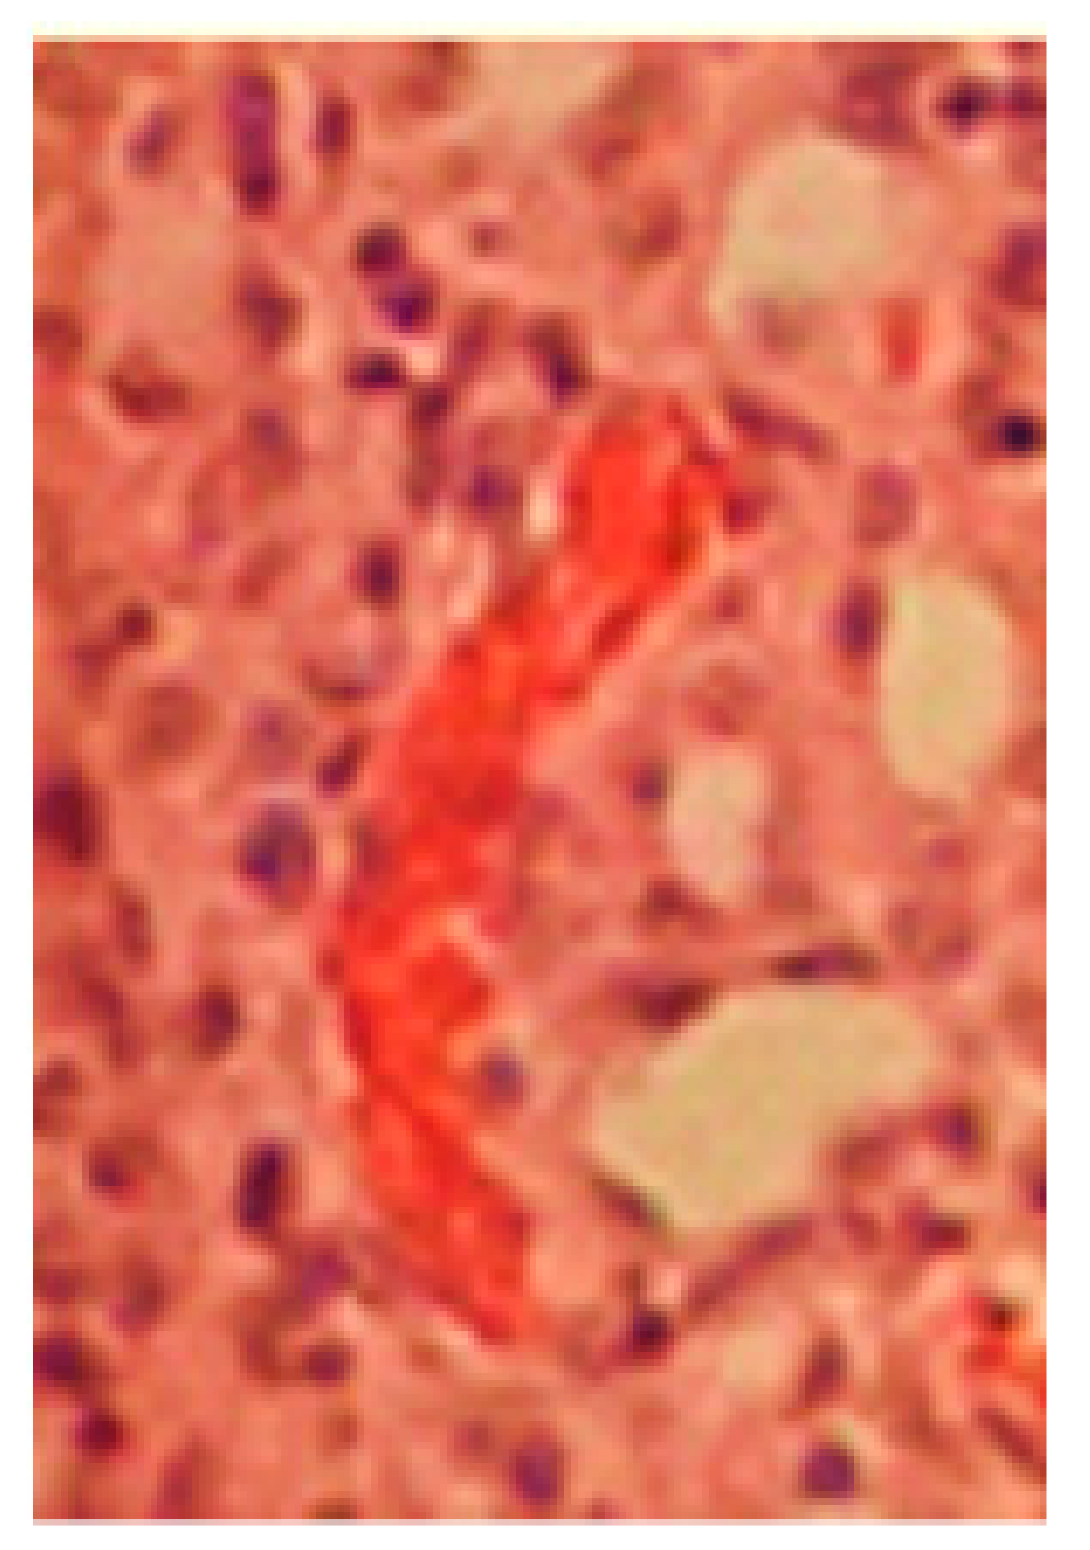
2.5. Hematoxylin and Eosin Staining (HE Staining)
2.5.1. Microscopic Evaluation of The Samples
2.5.2. Staining Quality
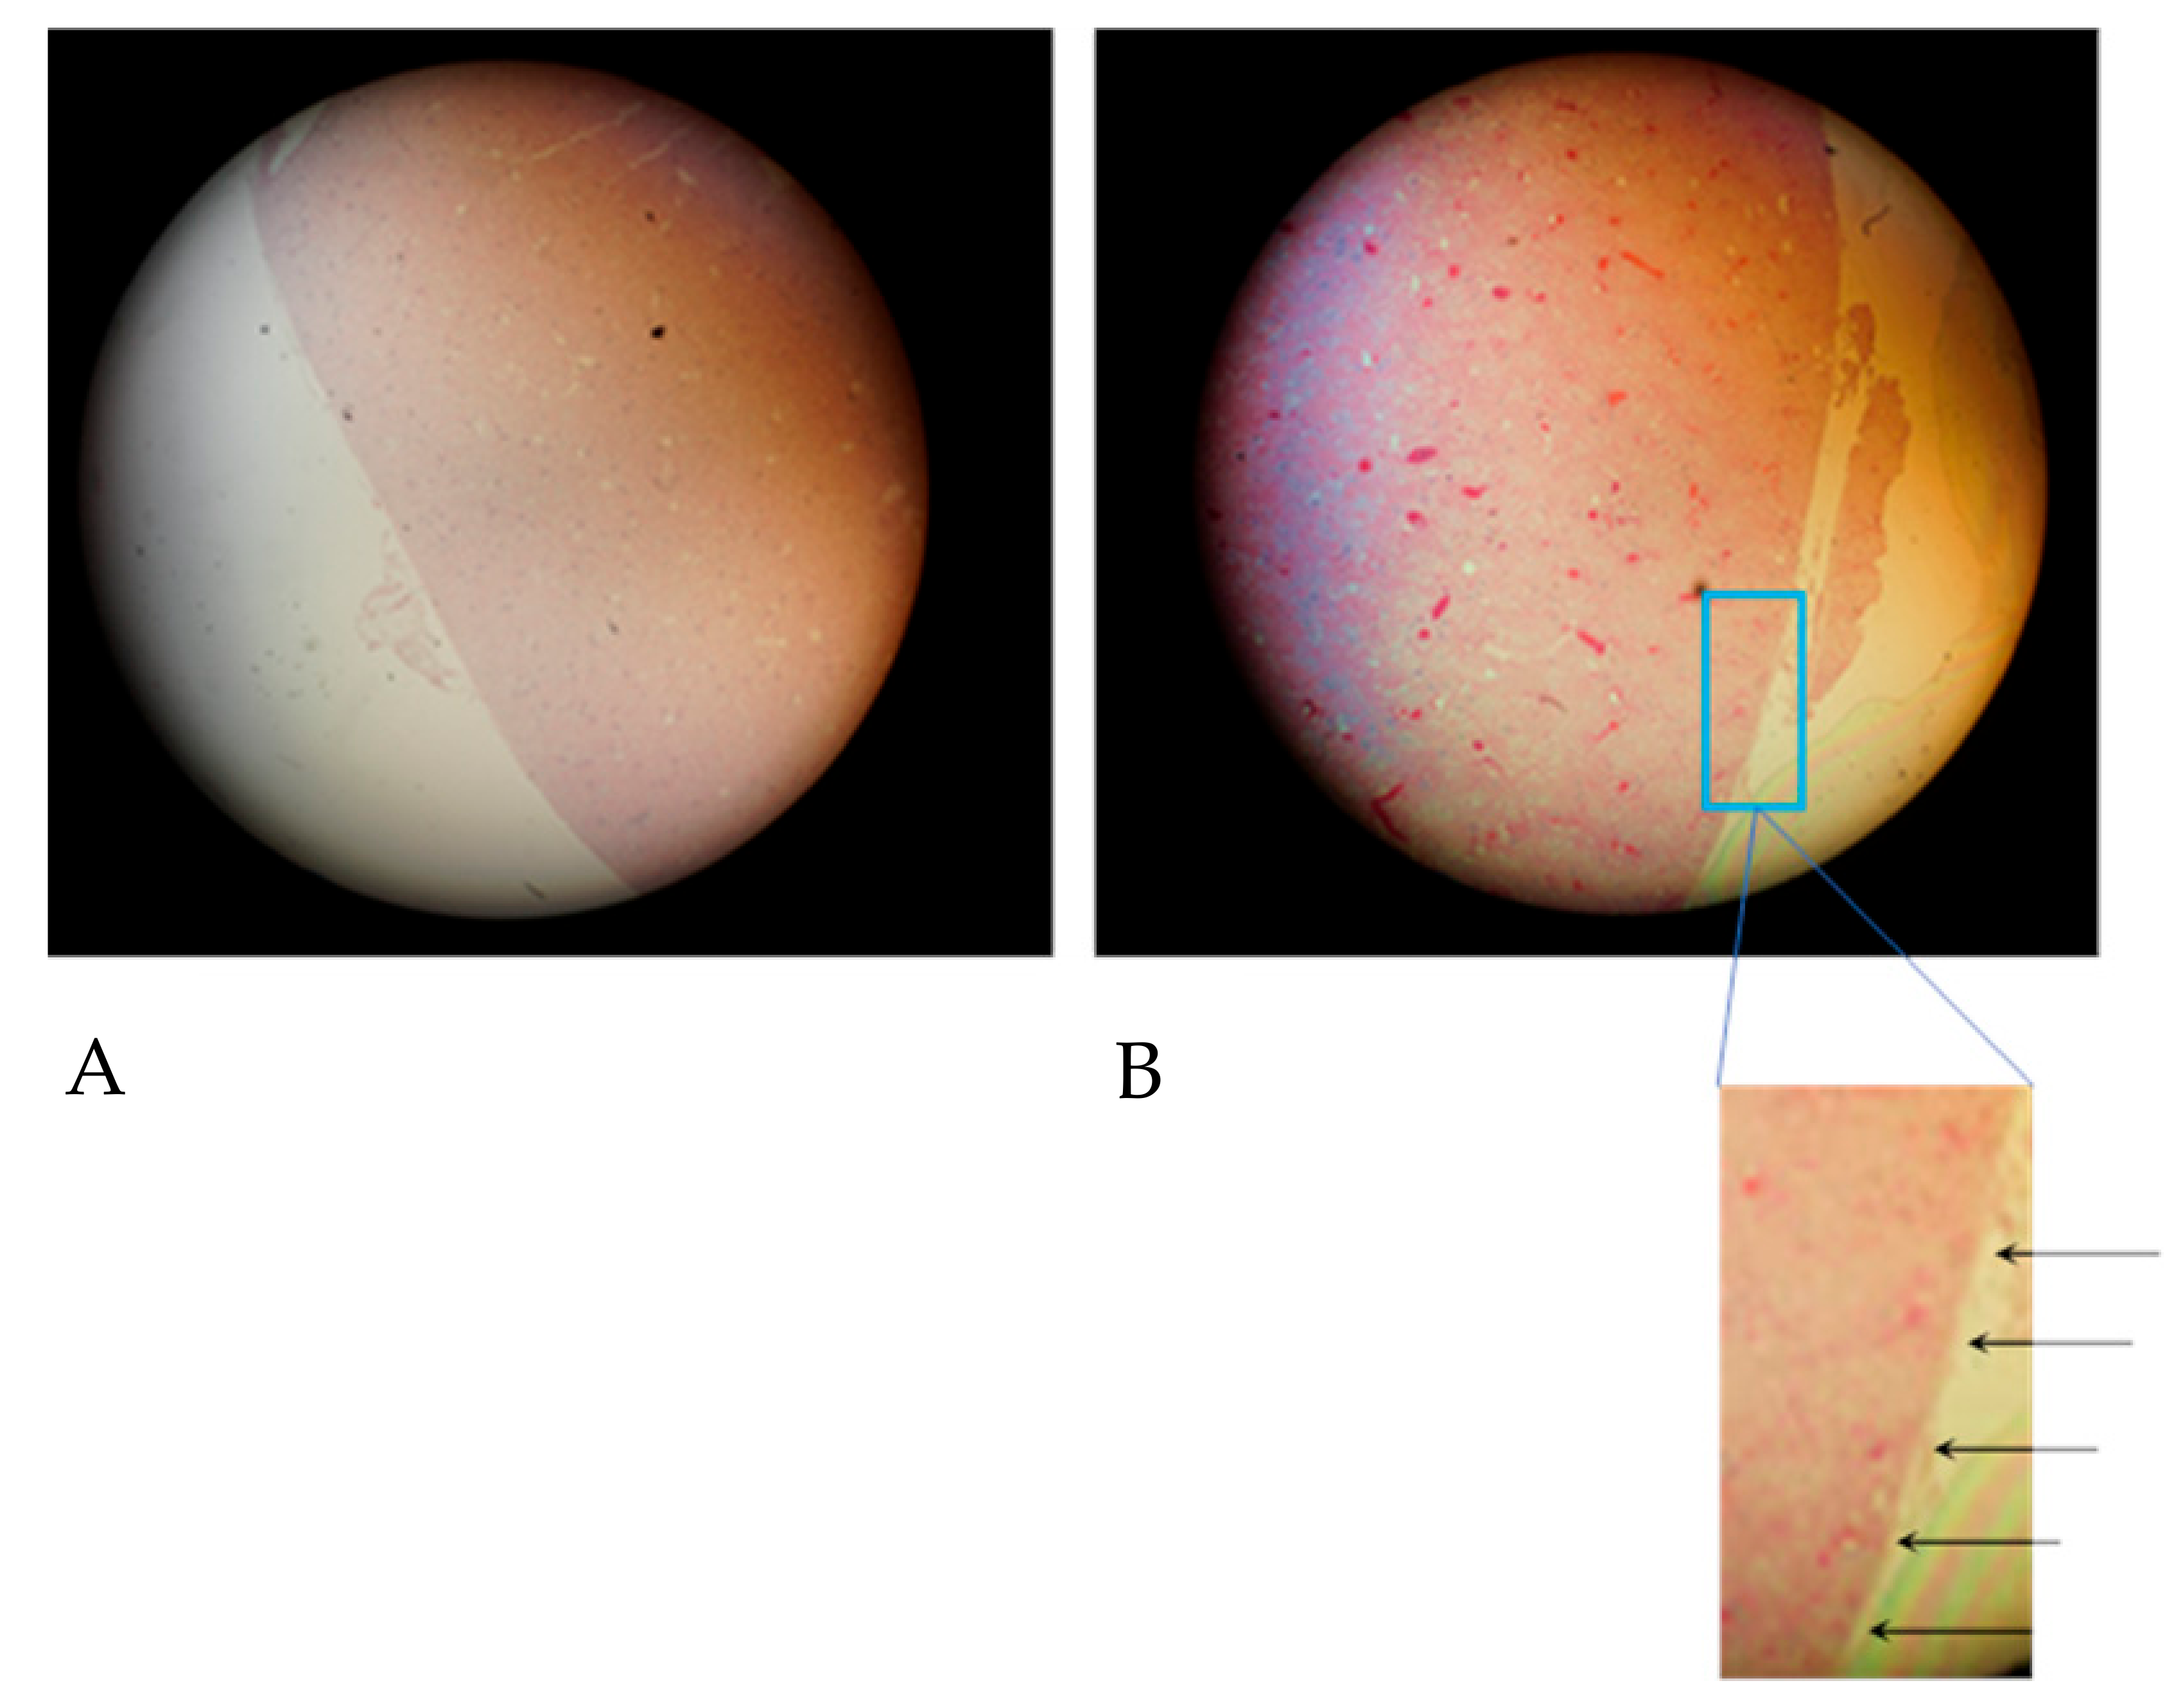
2.6. Fibrin Stain According to Weigert
2.7. Detection of Blood Stasis
2.8. Preparation of Samples for Scanning Electron Microscopy (SEM)
2.9. Statistics
3. Results
3.1. HE Staining
3.1.1. Blood Stasis in Kidney Vessels
3.1.2. Correlation Between Blood Stasis and Kidney Regions
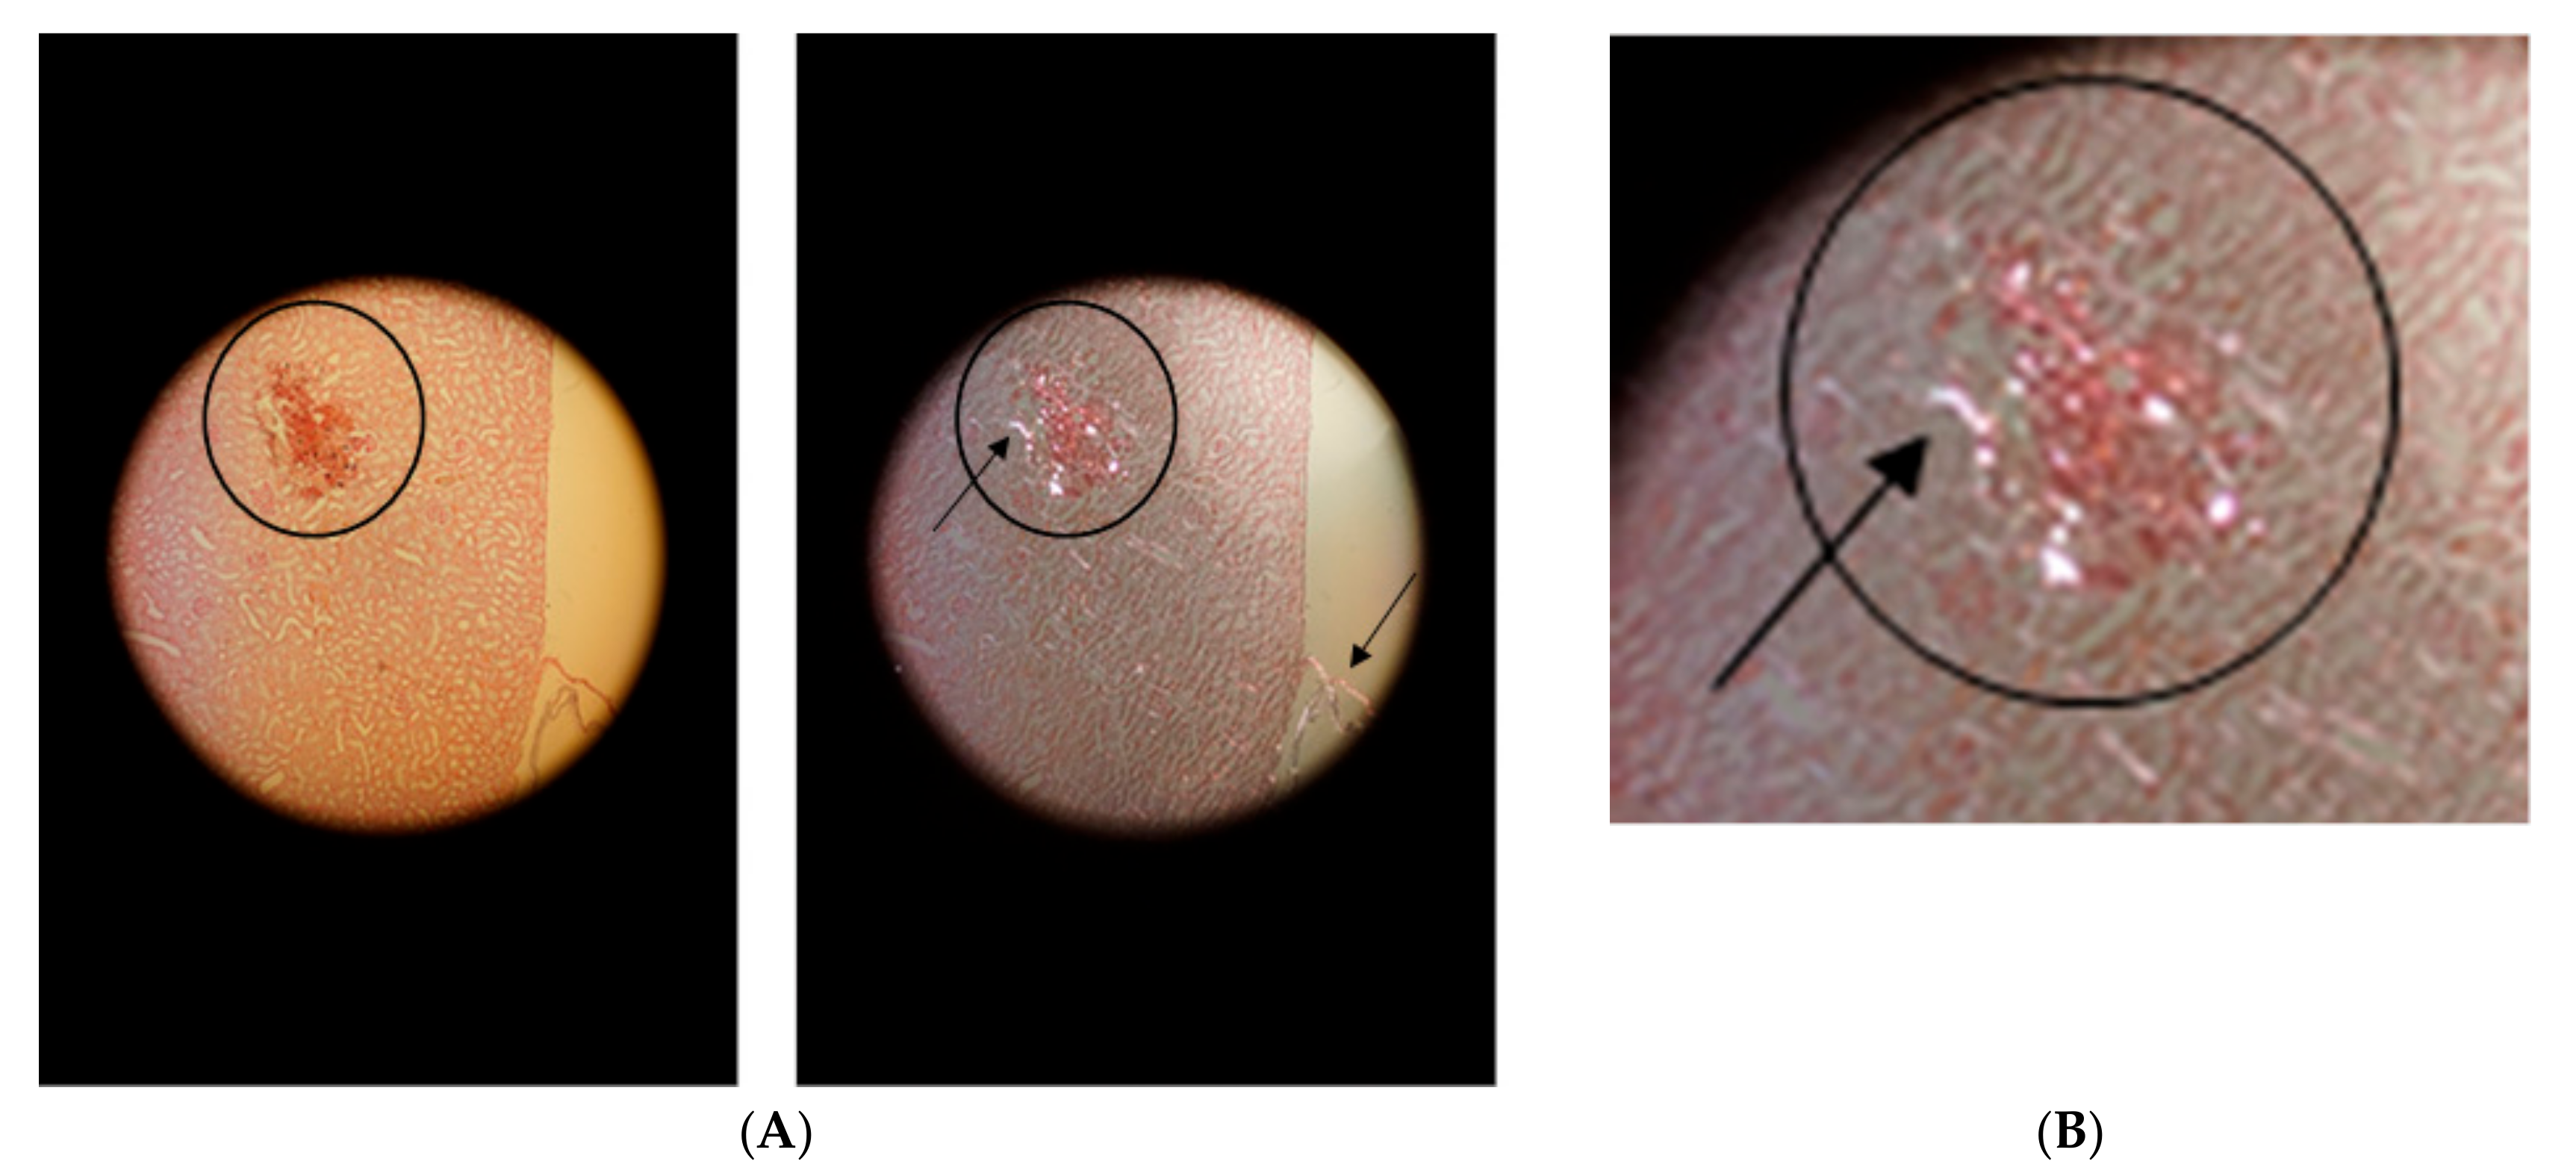
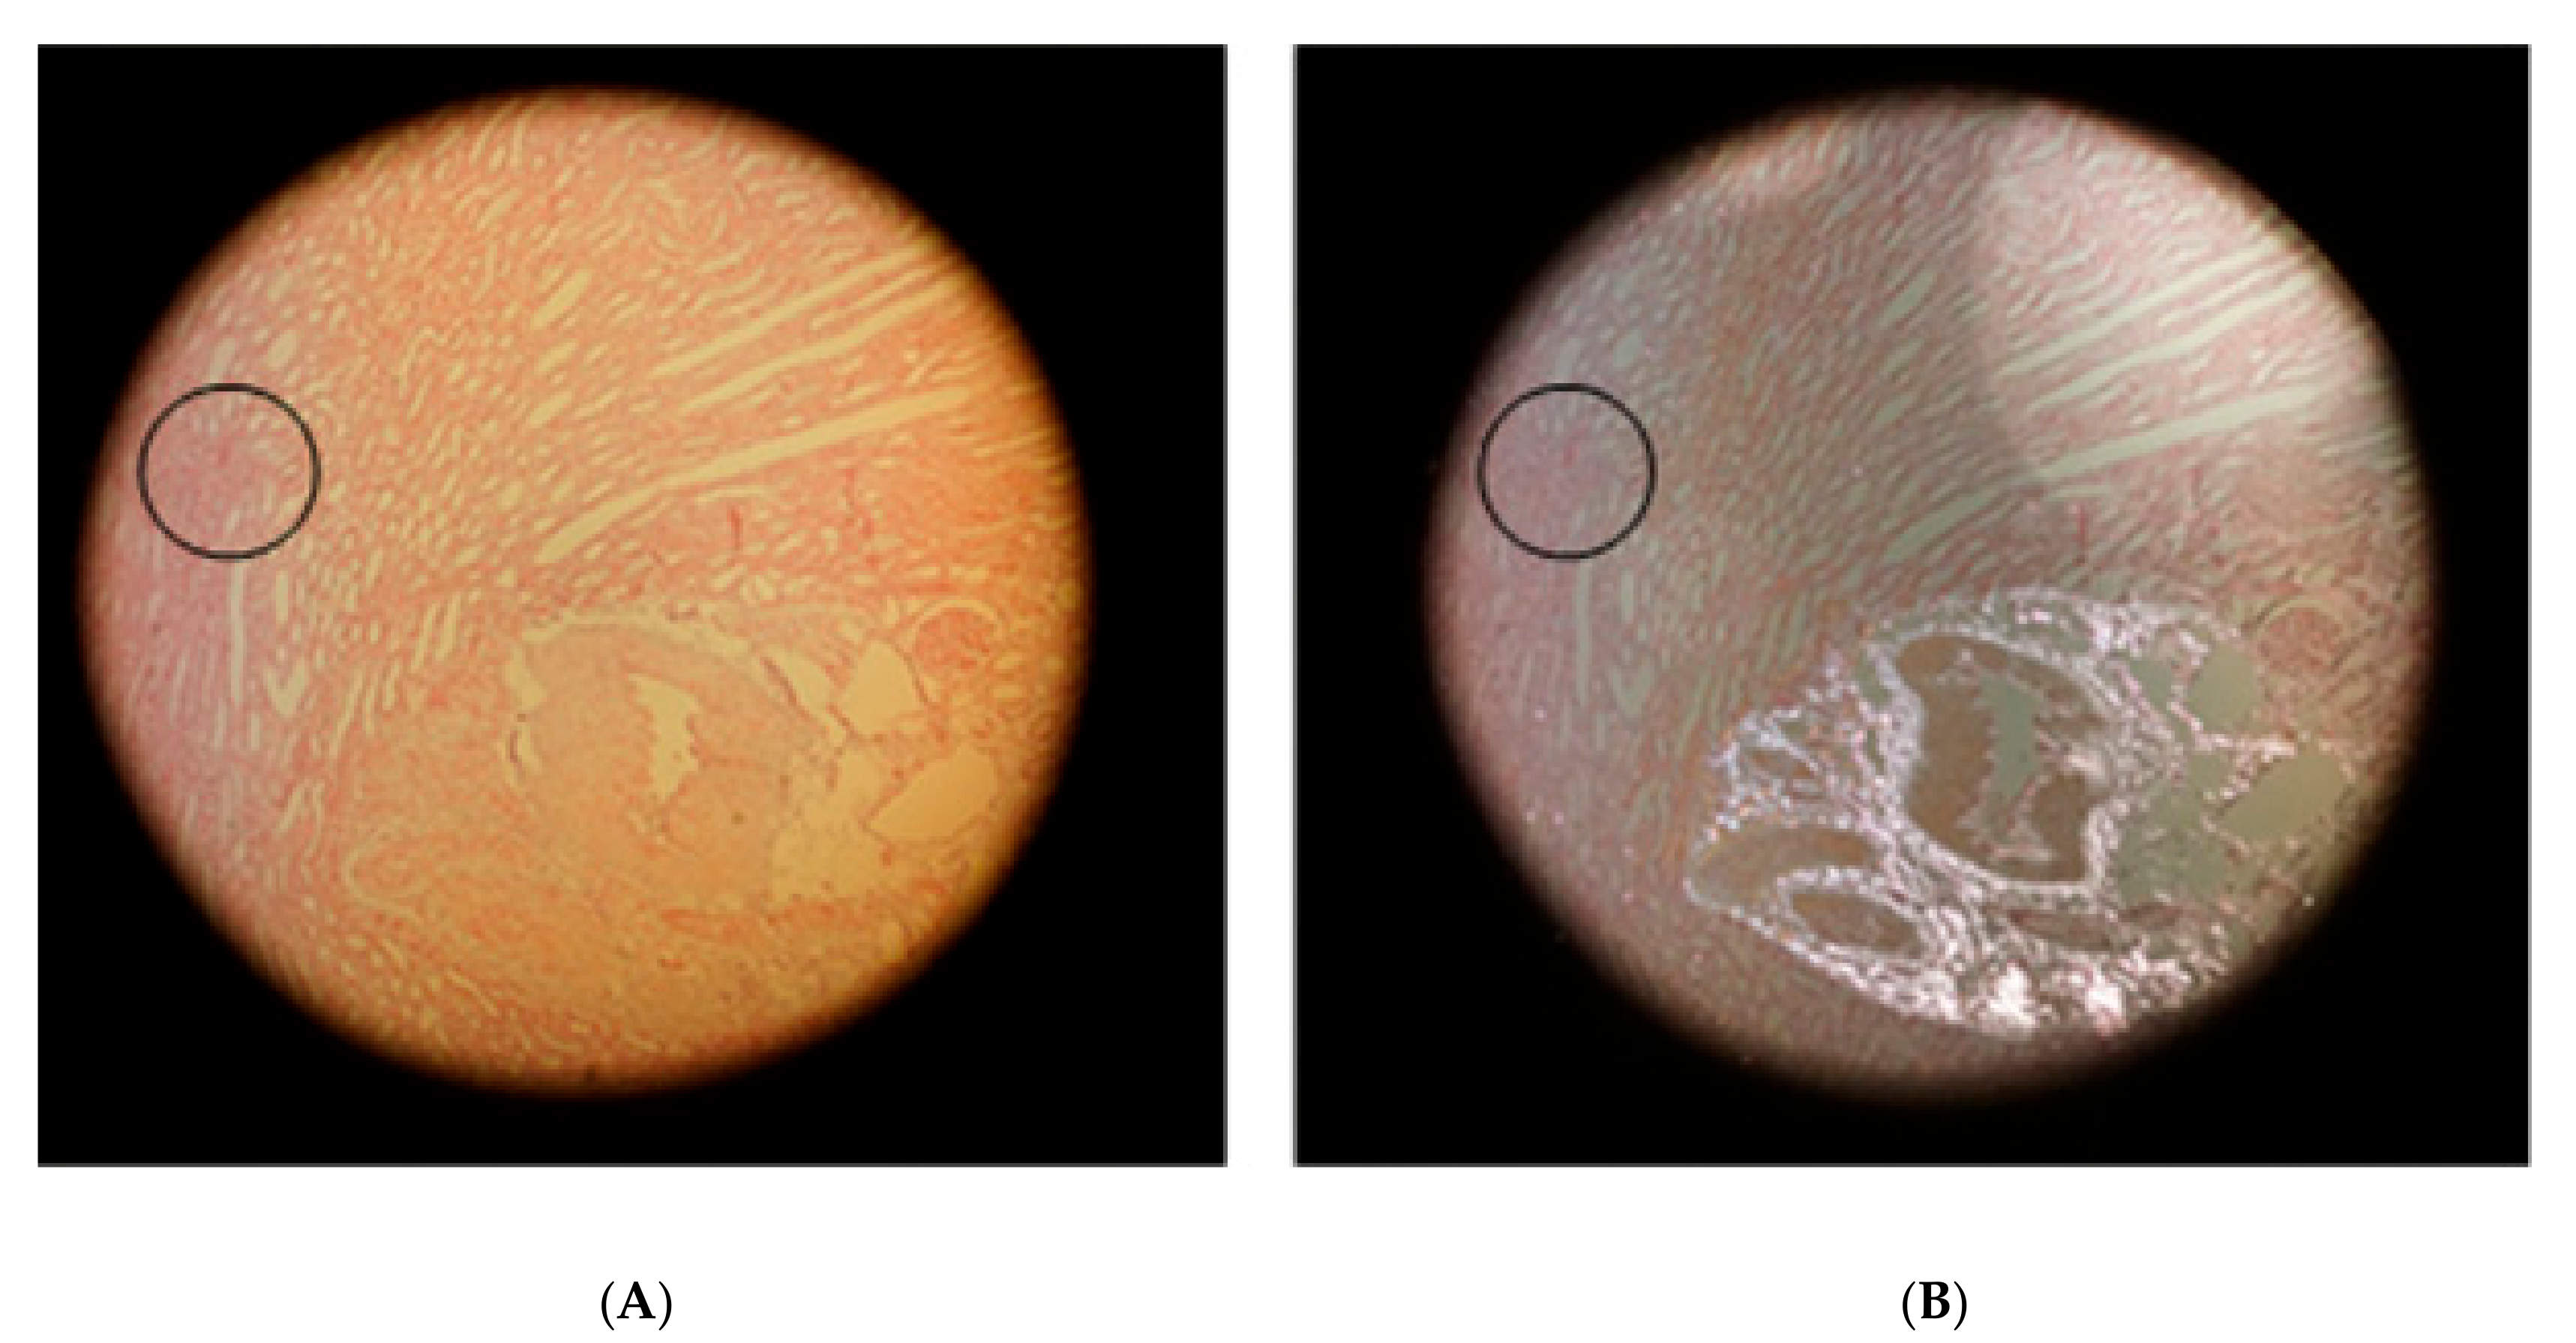
3.2. Fibrin Staining According to Weigert
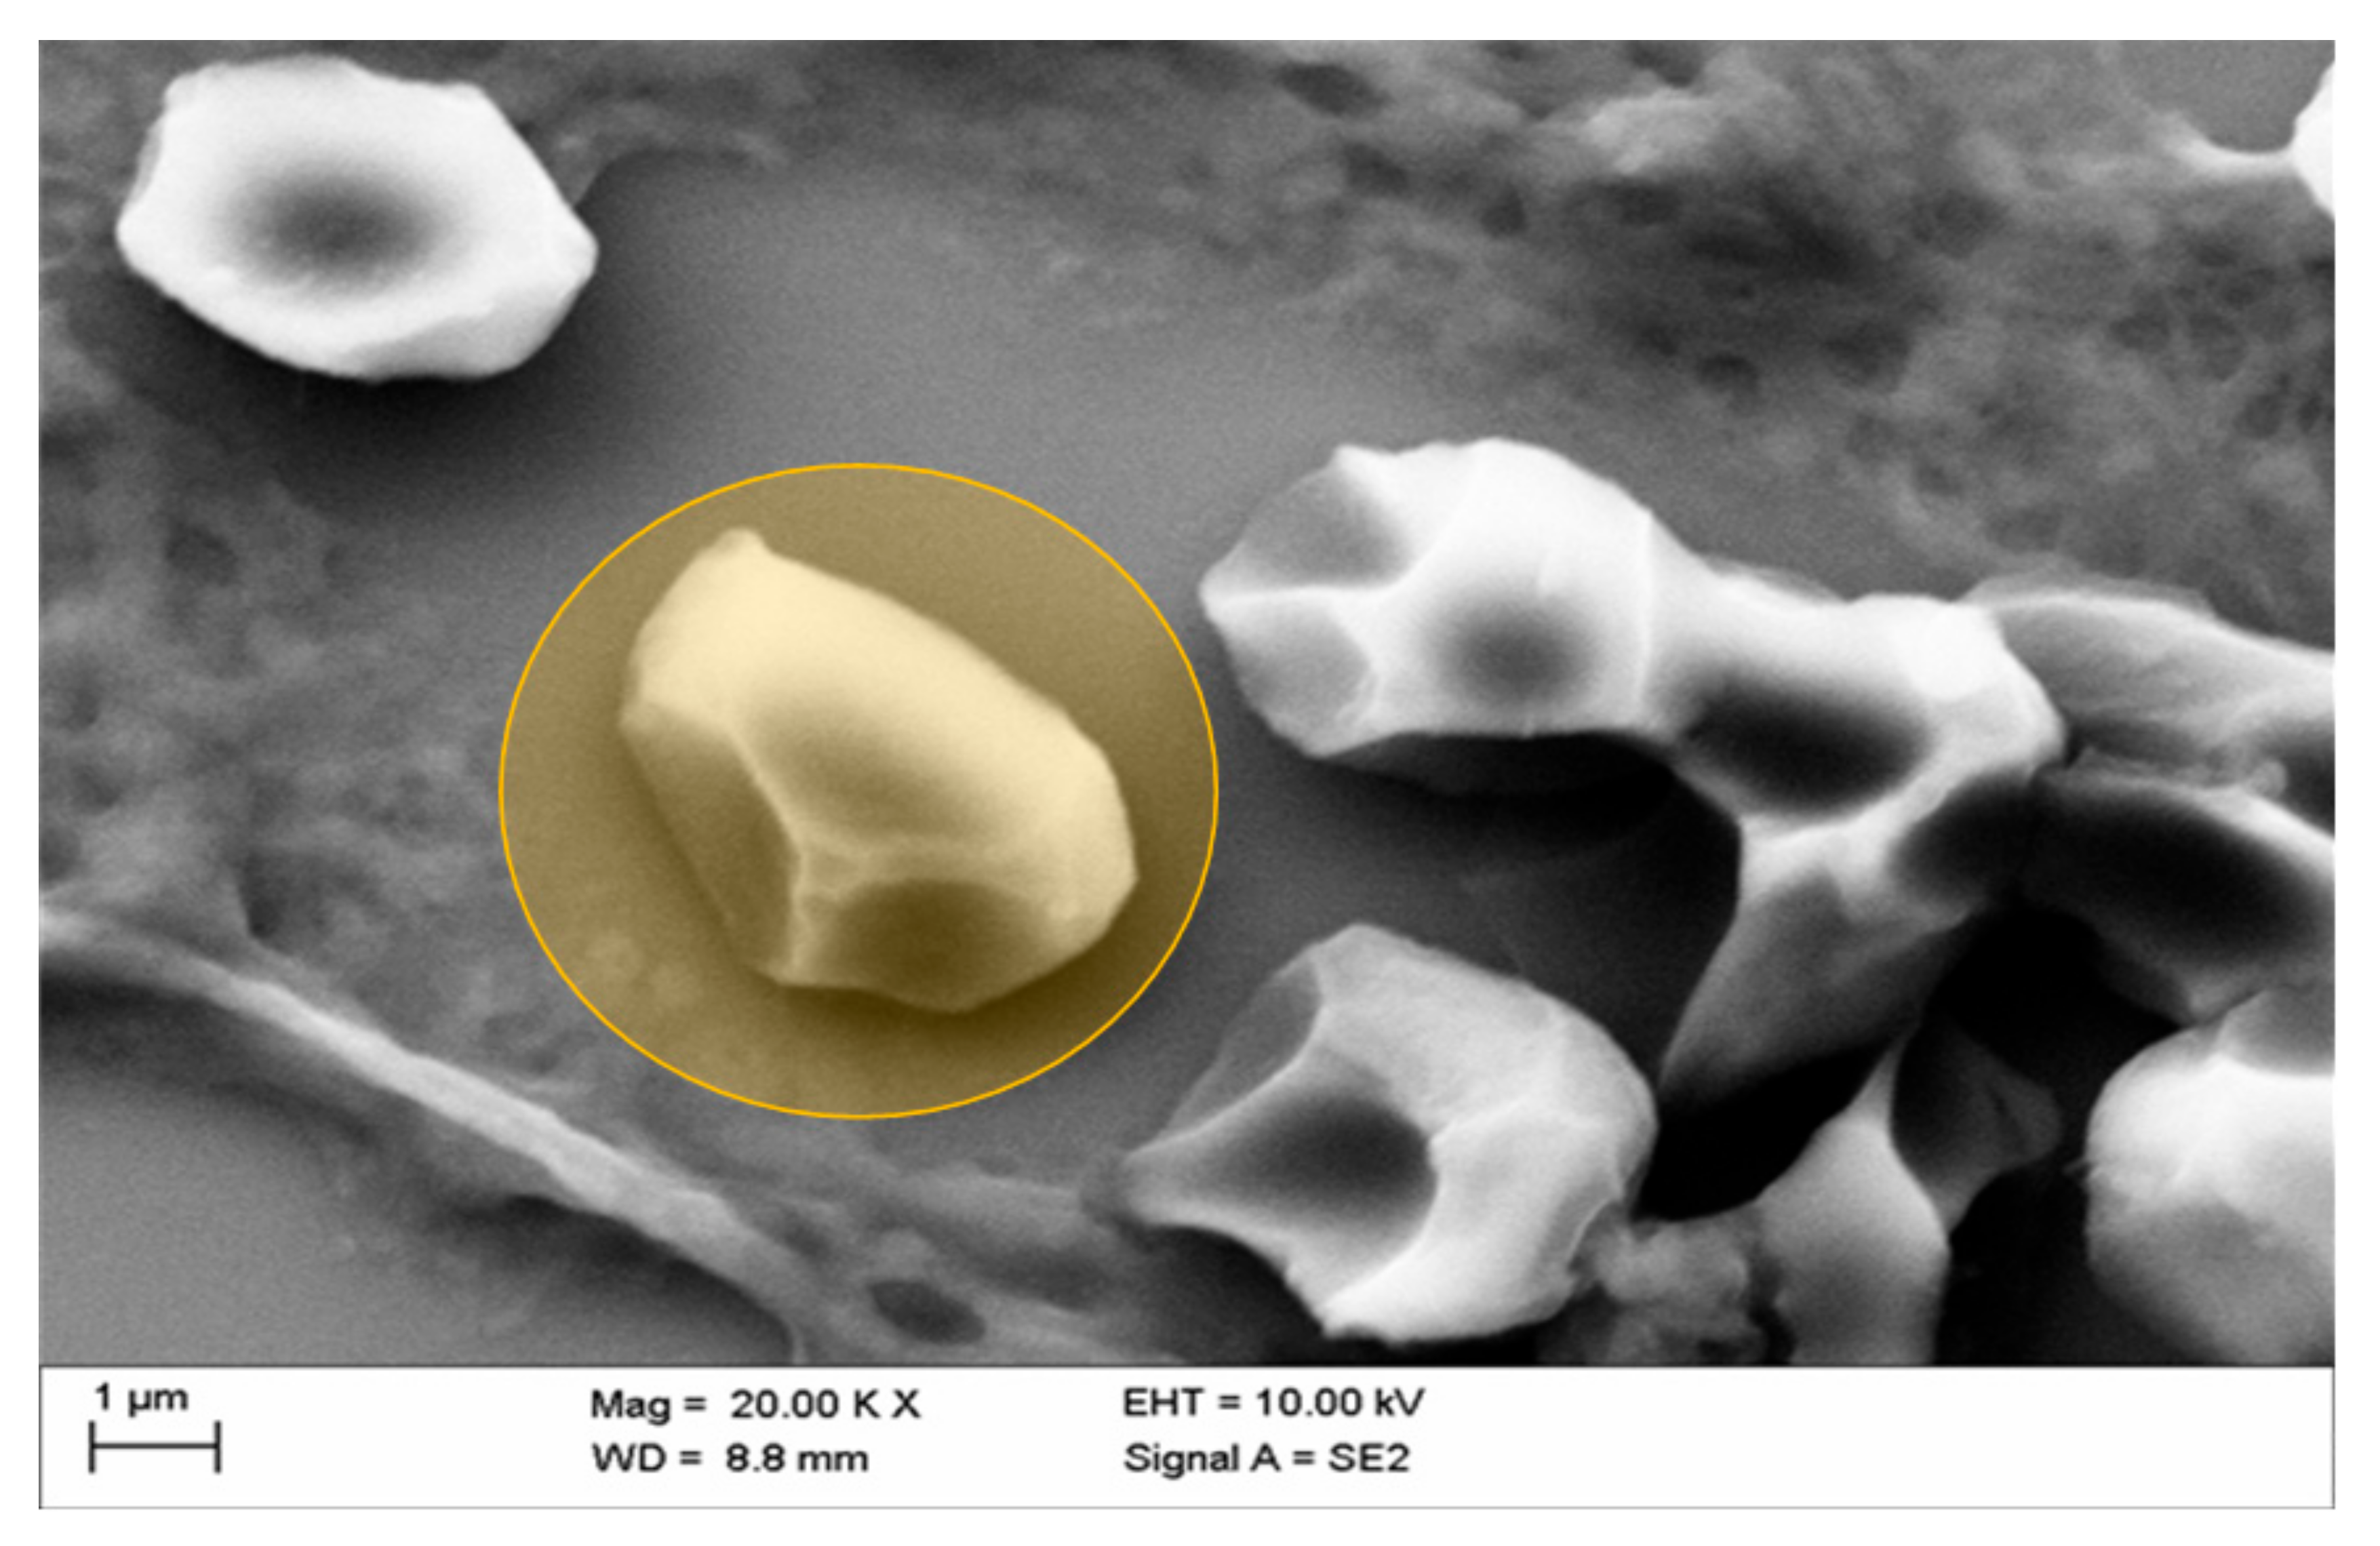
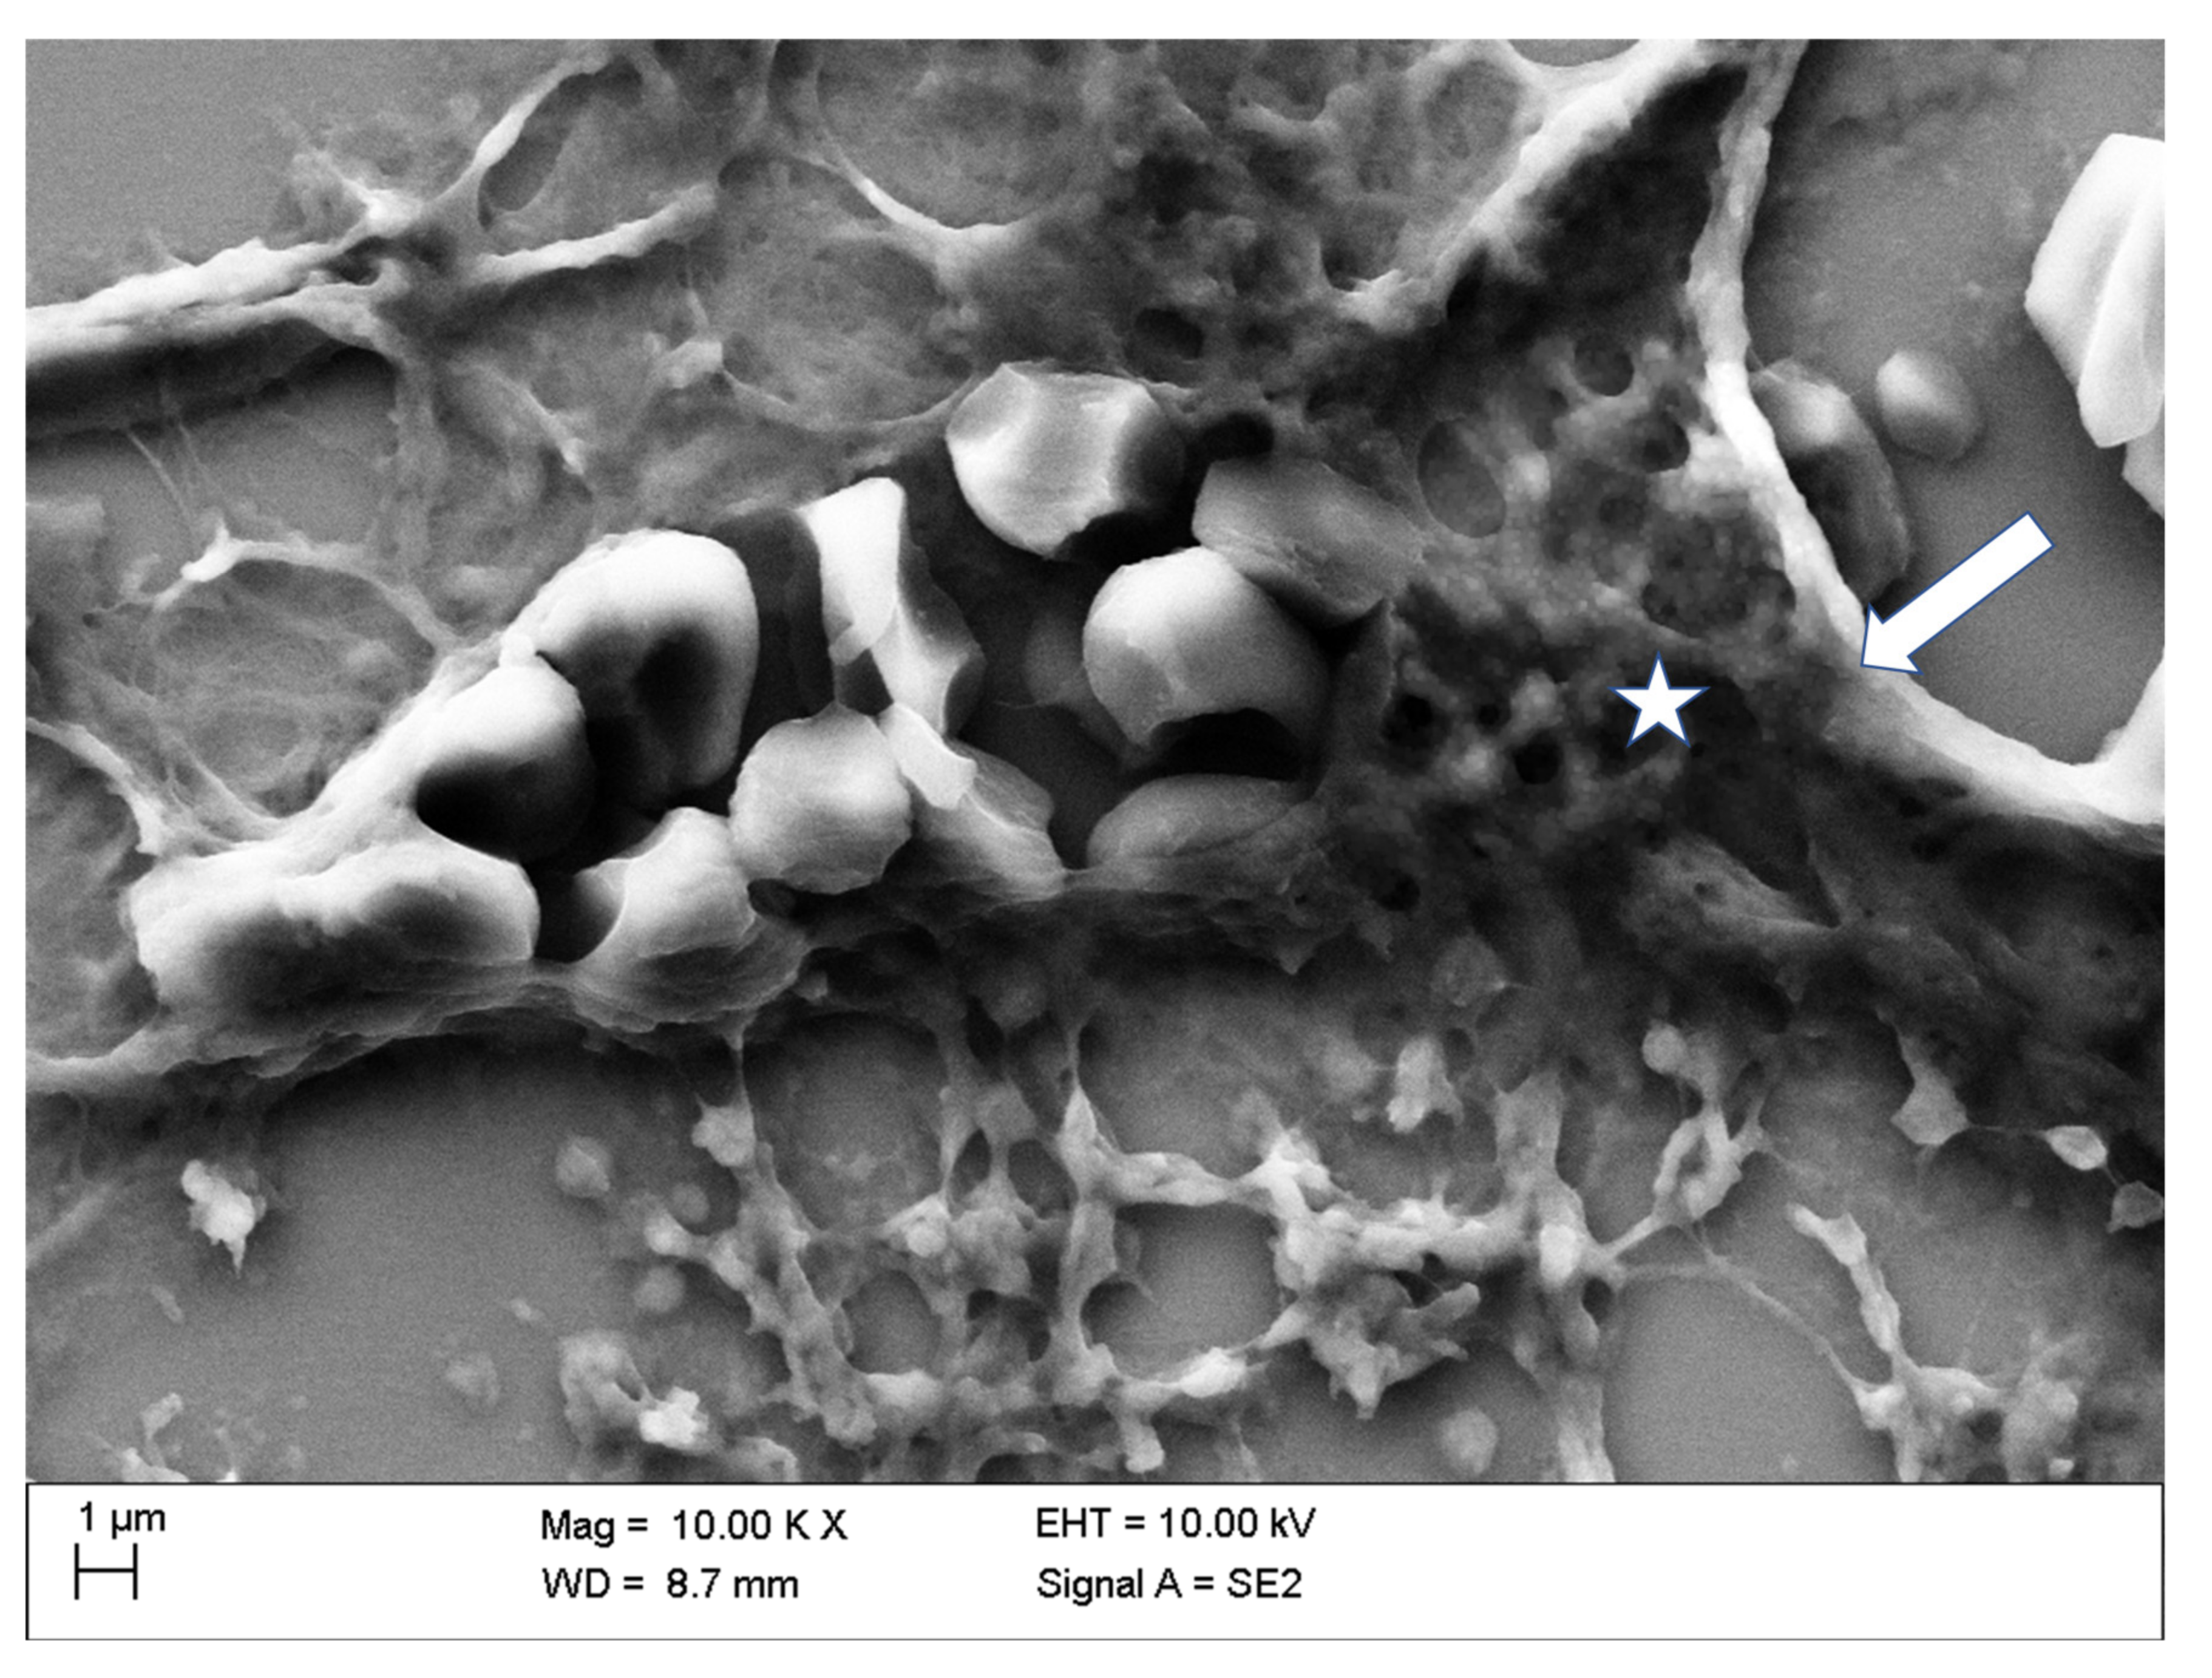
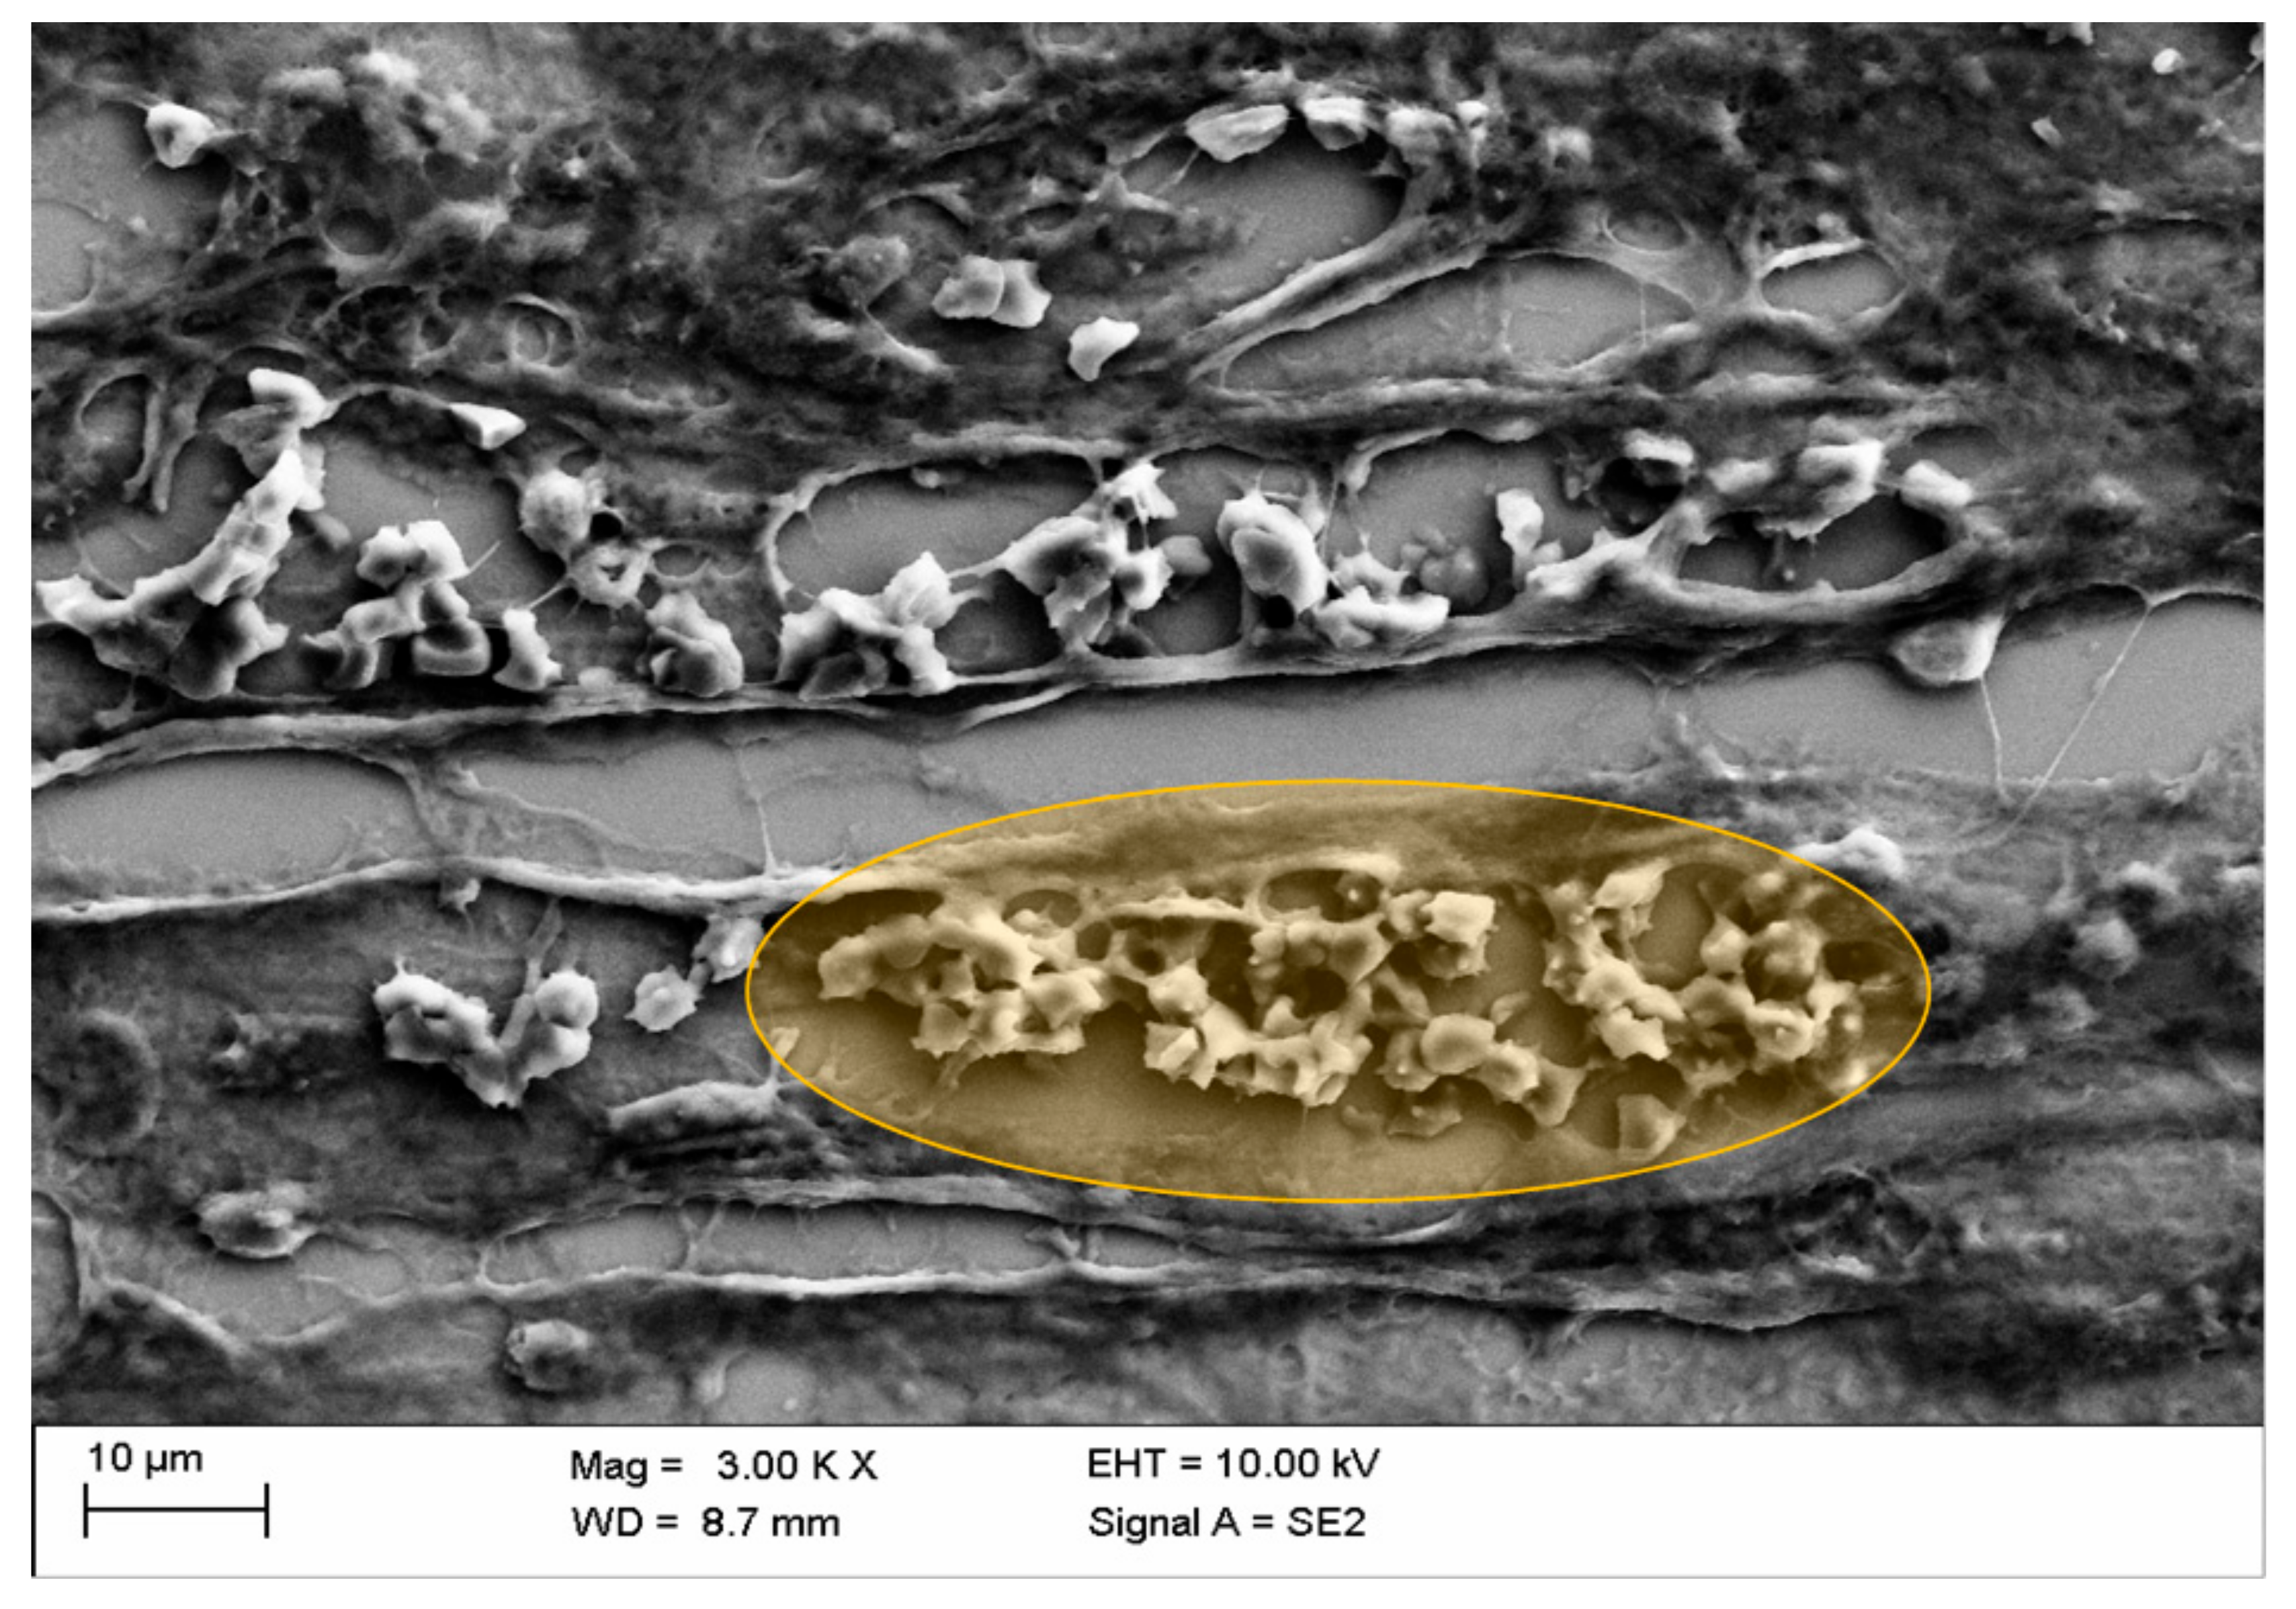
3.3. SEM Analyses
4. Discussion
5. Conclusions
Author Contributions
Funding
Conflicts of Interest
References
- Akgullu, C.; Eryilmaz, U.; Gungor, H.; Huyut, A.; Zencir, C.; Hekim, T. A clinical study about contrast nephropathy: Risk factors and the role of beta blockers. Anatol. J. Cardiol. 2015, 15, 232–240. [Google Scholar] [CrossRef] [PubMed]
- Aspelin, P.; Stacul, F.; Thomsen, H.S.; Morcos, S.K.; van der Molen, A.J. Effects of iodinated contrast media on blood and endothelium. Eur. Radiol. 2006, 16, 1041–1049. [Google Scholar] [CrossRef] [PubMed]
- Funaki, B. Contrast-induced nephropathy: What we know, what we think we know, and what we don’t know. Semin. Interv. Radiol. 2005, 22, 108–113. [Google Scholar] [CrossRef] [PubMed]
- Toprak, O.; Cirit, M.; Tanrisev, M.; Yazici, C.; Canoz, O.; Sipahioglu, M.; Uzum, A.; Ersoy, R.; Sozmen, E.Y. Preventive effect of nebivolol on contrast-induced nephropathy in rats. Nephrol. Dial. Transpl. 2007, 23, 853–859. [Google Scholar] [CrossRef]
- Abd ElHafeez, S.; Tripepi, G.; Quinn, R.; Naga, Y.; Abdelmonem, S.; AbdelHady, M.; Liu, P.; James, M.; Zoccali, C.; Ravani, P. Risk, predictors, and outcomes of acute kidney injury in patients admitted to intensive care units in Egypt. Sci. Rep. 2017, 1, 1–7. [Google Scholar] [CrossRef]
- Bei, W.; Li, H.; Lin, K.; Wang, K.; Chen, S.; Guo, X.; Liu, Y.; Tan, N.; Chen, J.; Yang, X.; et al. Post-hoc study: Intravenous hydration treatment in Chinese patients with high risk of contrast-induced nephropathy following percutaneous coronary intervention. Sci. Rep. 2017, 7, 1285. [Google Scholar] [CrossRef]
- Franke, R.P.; Jung, F. Pathophysiology of the contrast media-induced nephropathy (CIN) in patients undergoing coronary interventions. Clin. Hemorheol. Microcirc. 2013, 53, 143–153. [Google Scholar] [CrossRef]
- Mitchell, A.M.; Jones, A.E.; Tumlin, J.A.; Kline, J.A. Incidence of contrast-induced nephropathy after contrast-enhanced computed tomography in the outpatient setting. Clin. J. Am. Soc. Nephrol. 2010, 5, 4–9. [Google Scholar] [CrossRef]
- Roger, V.L.; Go, A.S.; Lloyd-Jones, D.M.; Adams, R.J.; Berry, J.D.; Brown, T.M.; Carnethon, M.R.; Dai, S.; De Simone, G.; Ford, E.S.; et al. Heart disease and stroke statistics—2011 update: A report from the American Heart Association. Circulation 2011, 123, e18–e209. [Google Scholar] [CrossRef]
- Roger, V.L.; Go, A.S.; Lloyd-Jones, D.M.; Adams, R.J.; Berry, J.D.; Brown, T.M.; Carnethon, M.R.; Dai, S.; De Simone, G.; Ford, E.S.; et al. Contrast-induced nephropathy and long-term adverse events: Cause and effect? Clin. J. Am. Soc. Nephrol. 2009, 4, 1162–1169. [Google Scholar]
- Wu, J.; Jia, J.; Li, Z.; Pan, H.; Wang, A.; Guo, X.; Wu, S.; Zhao, X. Association of estimated glomerular filtration rate and proteinuria with all-cause mortality in community-based population in China: A Result from Kailuan Study. Sci. Rep. 2018, 8, 1–8. [Google Scholar] [CrossRef] [PubMed]
- Reed, P.S.; Dixon, S.R.; Boura, J.A.; O’Neill, W.W.; Kahn, J.K. Comparison of the usefulness of gadodiamide and iodine mixture versus iodinated contrast alone for prevention of contrast-induced nephropathy in patients with chronic kidney disease undergoing coronary angiography. Am. J. Cardiol. 2007, 100, 1090–1093. [Google Scholar] [CrossRef]
- Gupta, R.; Gurm, H.S.; Bhatt, D.L.; Chew, D.P.; Ellis, S.G. Renal failure after percutaneous coronary intervention is associated with high mortality. Cathet. Cardiovasc. Interv. 2005, 64, 442–448. [Google Scholar] [CrossRef]
- McCullough, P. Outcomes of contrast-induced nephropathy: Experience in patients undergoing cardiovascular intervention. Cathet. Cardiovasc. Interv. 2006, 67, 335–343. [Google Scholar] [CrossRef]
- Lamby, P.; Jung, F.; Falter, J.; Mrowietz, C.; Graf, S.; Schellenberg, L.; Platz Batista da Silva, N.; Prantl, L.; Franke, R.P.; Jung, E.M. Effect of radiographic contrast media on renal perfusion—First results. Clin. Hemorheol. Microcirc. 2017, 64, 287–295. [Google Scholar] [CrossRef] [PubMed]
- Treitl, M.; Rupprecht, H.; Wirth, S.; Korner, M.; Reiser, M.; Rieger, J. Assessment of renal vasoconstriction in vivo after intra-arterial administration of the isosmotic contrast medium iodixanol compared to the low-osmotic contrast medium iopamidol. Nephrol. Dial. Transplant. 2009, 24, 1478–1485. [Google Scholar] [CrossRef][Green Version]
- Lamby, P.; Jung, F.; Graf, S.; Schellenberg, L.; Falter, J.; Platz-da-Silva, N.; Schreml, S.; Prantl, L.; Franke, R.P.; Jung, E.M. Effect of iodinated contrast media on renal perfusion: A randomized comparison study in pigs using quantitative contrast-enhanced ultrasound (CEUS). Sci. Rep. 2017, 7, 1–10. [Google Scholar] [CrossRef]
- Lamby, P.; Prantl, L.; Krueger-Genge, A.; Franke, R.P.; Jung, E.M.; Jung, F. Influence of Ultrasound Microbubbles on kidney oxygen tension. Clin. Hemorheol. Microcirc. 2017, 67, 211–214. [Google Scholar] [CrossRef]
- Bach, R.; Jung, F.; Scheller, B.; Hummel, B.; Özbek, C.; Spitzer, S.; Schieffer, H. Influence of a non-ionic radiography contrast medium on the microcirculation. Acta Radiol. 1996, 37, 214–217. [Google Scholar] [CrossRef]
- Gerk, U.; Mrowietz, C.; Sternitzky, R.; Franke, R.P.; Spitzer, S.G.; Jung, F. Effect of Ioxaglate on the cutaneous microcirculation in patients with coronary artery disease: Randomized, double blind, placebo-controlled study. Clin. Hemorheol. Microcirc. 2017, 64, 297–304. [Google Scholar] [CrossRef]
- Jung, F.; Spitzer, S.; Mrowietz, C.; Sternitzky, R.; Bach, R. Influence of radiographic contrast media (Iomeprol 350 versus Iopentol 350) on cutaneous microcirculation: Single-center prospective randomized double-blind phase iv study in parallel-group design. J. Invasive Cardiol. 1999, 11, 2–8. [Google Scholar]
- Matschke, K.; Gerk, U.; Mrowietz, C.; Park, J.W.; Jung, F. Influence of radiographic contrast media on myocardial oxygen tension: A randomized, NaCL-controlled comparative study of iodixanol versus iomeprol in pigs. Acta Radiol. 2016, 48, 292–299. [Google Scholar] [CrossRef]
- Sendeski, M.; Patzak, A.; Pallone, T.L.; Cao, C.; Persson, A.E.; Persson, P.B. Iodixanol, constriction of medullary descending vasa recta, and risk for contrast medium–induced nephropathy. Radiology 2009, 251, 697–704. [Google Scholar] [CrossRef]
- Aspelin, P. Effect of ionic and non-ionic contrast media on morphology of human erythrocytes. Acta Radiol. Diagn. 2016, 19, 675–687. [Google Scholar] [CrossRef]
- Hardemann, M.R.; Goedhart, P.; Koen, I.Y. The effect of low-osmolar ionic and nonionic contrast media on human blood viscosity, erythrocyte morphology, and aggregation behavior. Investig. Radiol. 1991, 26, 810–818. [Google Scholar] [CrossRef]
- Jung, F.; Mrowietz, C.; Rickert, D.; Hiebl, B.; Park, J.W.; Franke, R.P. The effect of radiographic contrast media on the morphology of human erythrocytes. Clin. Hemorheol. Microcirc. 2008, 38, 1–11. [Google Scholar]
- Kerl, J.M.; Nguyen, S.A.; Lazarchick, J.; Powell, J.W.; Oswald, M.W.; Alvi, F.; Costello, P.; Vogl, T.J.; Schoepf, U.J. Iodinated contrast media: Effect of osmolarity and injection temperature on erythrocyte morphology in vitro. Acta Radiol. 2008, 49, 337–343. [Google Scholar] [CrossRef]
- Losco, P.; Nash, G.; Stone, P.; Ventre, J. Comparison of the effects of radiographic contrast media on dehydration and filterability of red blood cells from donors homozygous for hemoglobin A or hemoglobin S. Am. J. Hematol. 2001, 68, 149–158. [Google Scholar] [CrossRef]
- Mrowietz, C.; Franke, R.P.; Jung, F. Influence of different radiographic contrast media on the echinocyte formation of human erythrocytes. Clin. Hemorheol. Microcirc. 2012, 50, 35–47. [Google Scholar] [CrossRef]
- Reinhart, W.H.; Pleisch, B.; Harris, L.G.; Lutolf, M. Influence of contrast media (iopromide, ioxaglate, gadolinium-DOTA) on blood viscosity, erythrocyte morphology and platelet function. Clin. Hemorheol. Microcirc. 2005, 32, 227–239. [Google Scholar]
- Franke, R.-P.; Fuhrmann, R.; Hiebl, B.; Jung, F. Influence of various radiographic contrast media on the buckling of endothelial cells. Microvasc. Res. 2008, 76, 110–113. [Google Scholar] [CrossRef] [PubMed]
- Romeis, B. Mikroskopische Technik (17. Neubearbeitete und Erweiterte Auflage, e.d. P. BÖCK); Urban und Schwarzenberg: München, Germany; Wien, Austria; Baltimore, MD, USA, 1989; ISBN 3-541-11227-1. [Google Scholar]
- Rasband, W. ImageJ; National Institute of Health: Bethesda, MD, USA, 2012. [Google Scholar]
- Bessis, M.; Weed, R.I.; Leblond, P.F. Red Cell Shapes. An Illustrated Classification and its Rationale. In Red Cell Shape; Bessis, M., Ed.; Springer: Berlin/Heidelberg, Germany, 1973. [Google Scholar]
- Begent, N.; Born, G.V. Growth rate in vivo of platelet thrombi, produced by iontophoresis of ADP, as a function of mean blood flow velocity. Nature 1970, 227, 926–930. [Google Scholar] [CrossRef] [PubMed]
- Chabanel, A.; Reinhart, W.; Chien, S. Increased resistance to membrane deformation of shape-transformed human red blood cells. Blood 1987, 69, 739–743. [Google Scholar] [CrossRef] [PubMed]
- Meiselman, H.J. Morphological determinants of red cell deformability. Scand. J. Clin. Lab. Investig. 2009, 41, 27–34. [Google Scholar] [CrossRef]
- Strey, H.; Peterson, M.; Sackmann, E. Measurement of erythrocyte membrane elasticity by flicker eigenmode decomposition. Biophys. J. 1995, 69, 478–488. [Google Scholar] [CrossRef]
- Franke, R.P.; Scharnweber, T.; Fuhrmann, R.; Mrowietz, C.; Jung, F. Effect of radiographic contrast media (Iodixanol, Iopromide) on the spectrin/actin-network of the membranous cytoskeleton of erythrocytes. Clin. Hemorheol. Microcirc. 2013, 54, 273–285. [Google Scholar] [CrossRef]
- Franke, R.P.; Fuhrmann, R.; Park, J.W.; Rickert, D.; Hiebl, B.; Jung, F. The effect of radiographic contrast media on the morphology of human venous endothelial cells. Clin. Hemorheol. Microcirc. 2007, 37, 329–338. [Google Scholar]
- Franke, R.P.; Krüger, A.; Scharnweber, T.; Wenzel, F.; Jung, F. Effects of radiographic contrast media on the micromorphology of the junctional complex of erythrocytes visualized by immunocytology. Int. J. Mol. Sci. 2014, 15, 16134–16152. [Google Scholar] [CrossRef]
- Franke, R.P.; Scharnweber, T.; Fuhrmann, R.; Wenzel, F.; Krüger, A.; Mrowietz, C.; Jung, F. Effect of radiographic contrast media on the Spectrin/Band3-network of the membrane skeleton of erythrocytes. PLoS ONE 2014, 9, e89512. [Google Scholar] [CrossRef]
- van der Molen, A.J.; Reimer, P.; Dekkers, I.A.; Bongartz, G.; Bellin, M.F.; Bertolotto, M.; Clement, O.; Heinz-Peer, G.; Stacul, F.; Webb, J.A.; et al. Post-contrast acute kidney injury—Part 1: Definition, clinical features, incidence, role of contrast medium and risk factors. Eur. Radiol. 2018, 28, 2845–2855. [Google Scholar] [CrossRef]
- Azzalini, L.; Poletti, E.; Lombardo, F.; Laricchia, A.; Beneduce, A.; Moscardelli, S.; Bellini, B.; Maccagni, D.; Cappelletti, A.; Ancona, M.B.; et al. Risk of contrast-induced nephropathy in patients undergoing complex percutaneous coronary intervention. Int. J. Cardiol. 2019, 290, 59–63. [Google Scholar] [CrossRef]
- Davidson, C.J. Cardiovascular and renal toxicity of a nonionic radiographic contrast agent after cardiac catheterization. Ann. Intern. Med. 1989, 110, 119–124. [Google Scholar] [CrossRef] [PubMed]
- Katzberg, R.W.; Lamba, R. Contrast-induced nephropathy after intravenous administration: Fact or fiction? Radiol. Clin. N. Am. 2009, 47, 789–800. [Google Scholar] [CrossRef] [PubMed]
- Mrowietz, C.; Hiebl, B.; Franke, R.P.; Park, J.-W.; Jung, F. Reversibility of echinocyte formation after contact of erythrocytes with various radiographic contrast media. Clin. Hemorheol. Microcirc. 2008, 39, 281–286. [Google Scholar] [CrossRef]
- Sadat, U. Radiographic contrast-media-induced acute kidney injury: Pathophysiology and prophylactic strategies. ISRN Radiol. 2013, 2013, 1–21. [Google Scholar] [CrossRef]


| Contrast Media | Iodine Concentration [mg/mL] | Osmolality [mOsmol/kg Water] | Viscosity (37 °C) [mPa.s] |
|---|---|---|---|
| Iodixanol (Visipaque™) | 320 | 290 | 11.4 |
| Iopromide (Ultravist™) | 370 | 770 | 9.5 |
| Renal Region | Capillaries | Capillaries | Vessel Ø 15–30 µm | Vessel Ø 15–30 µm | Vessel Ø 30–300 µm | Vessel Ø 30–300 µm | Vessel Ø >300 µm | Vessel Ø >300 µm |
|---|---|---|---|---|---|---|---|---|
| Iodixanol | Iopromide | Iodixanol | Iopromide | Iodixanol | Iopromide | Iodixanol | Iopromide | |
| Capsule-Near Cortex | 0 | 10 | 4 | 2 | 0 | 8 | 0 | 1 |
| Mid-Cortex | 0 | 5 | 0 | 11 | 0 | 10 | 0 | 3 |
| Cortico-Medullary Transition | 0 | 20 | 27 | 46 | 2 | 44 | 0 | 0 |
| Mid-Medulla | 2 | 20 | 18 | 95 | 1 | 59 | 0 | 0 |
| Papilla-Near Medulla | 1 | 11 | 7 | 35 | 0 | 25 | 0 | 0 |
© 2020 by the authors. Licensee MDPI, Basel, Switzerland. This article is an open access article distributed under the terms and conditions of the Creative Commons Attribution (CC BY) license (http://creativecommons.org/licenses/by/4.0/).
Share and Cite
Lamby, P.; Minkow, A.; Handt, S.; Falter, J.; Schellenberg, E.-L.; Graf, S.; Hiebl, B.; Haerteis, S.; Gemeinhardt, O.; Krüger-Genge, A.; et al. Histological and SEM Assessment of Blood Stasis in Kidney Blood Vessels after Repeated Intra-Arterial Application of Radiographic Contrast Media. Life 2020, 10, 167. https://doi.org/10.3390/life10090167
Lamby P, Minkow A, Handt S, Falter J, Schellenberg E-L, Graf S, Hiebl B, Haerteis S, Gemeinhardt O, Krüger-Genge A, et al. Histological and SEM Assessment of Blood Stasis in Kidney Blood Vessels after Repeated Intra-Arterial Application of Radiographic Contrast Media. Life. 2020; 10(9):167. https://doi.org/10.3390/life10090167
Chicago/Turabian StyleLamby, Philipp, Alexander Minkow, Stefan Handt, Johannes Falter, Eva-Lotte Schellenberg, Stefanie Graf, Bernhard Hiebl, Silke Haerteis, Ole Gemeinhardt, Anne Krüger-Genge, and et al. 2020. "Histological and SEM Assessment of Blood Stasis in Kidney Blood Vessels after Repeated Intra-Arterial Application of Radiographic Contrast Media" Life 10, no. 9: 167. https://doi.org/10.3390/life10090167
APA StyleLamby, P., Minkow, A., Handt, S., Falter, J., Schellenberg, E.-L., Graf, S., Hiebl, B., Haerteis, S., Gemeinhardt, O., Krüger-Genge, A., Klosterhalfen, B., Jung, E.-M., Franke, R.-P., Momeni, A., Prantl, L., & Jung, F. (2020). Histological and SEM Assessment of Blood Stasis in Kidney Blood Vessels after Repeated Intra-Arterial Application of Radiographic Contrast Media. Life, 10(9), 167. https://doi.org/10.3390/life10090167