Article

Multi-Objective Lightweight Optimization of Parameterized Suspension Components Based on NSGA-II Algorithm Coupling with Surrogate Model

1
College of Mechanical and Electrical Engineering, Qingdao University, Qingdao 266071, China
2
State Key Laboratory of Automotive Simulation and Control, Jilin University, Changchun 130022, China
*
Author to whom correspondence should be addressed.
Machines 2021, 9(6), 107; https://doi.org/10.3390/machines9060107
Submission received: 23 April 2021 / Revised: 17 May 2021 / Accepted: 22 May 2021 / Published: 24 May 2021

Abstract

:
In order to reduce the negative effect of lightweighting of suspension components on vehicle dynamic performance, the control arm and torsion beam widely used in front and rear suspensions were taken as research objects for studying the lightweight design method of suspension components. Mesh morphing technology was employed to define design variables. Meanwhile, the rigid–flexible coupling vehicle model with flexible control arm and torsion beam was built for vehicle dynamic simulations. The total weight of control arm and torsion beam was taken as optimization objective, as well as ride comfort and handling stability performance indexes. In addition, the fatigue life, stiffness, and modal frequency of control arm and torsion beam were taken as the constraints. Then, Kriging model and NSGA-II were adopted to perform the multi-objective optimization of control arm and torsion beam for determining the lightweight scheme. By comparing the optimized and original design, it indicates that the weight of the optimized control arm and torsion beam are reduced 0.505 kg and 1.189 kg, respectively, while structural performance and vehicle performance satisfy the design requirement. The proposed multi-objective optimization method achieves a remarkable mass reduction, and proves to be feasible and effective for lightweight design of suspension components.

1. Introduction

Lightweight is an important way to achieve energy saving and emission reduction [1,2]. Whether traditional or new energy vehicles, reducing the vehicle weight has the advantages of reducing energy consumption, improving power performance and braking performance [3,4]. In the “Made in China 2025” strategy, lightweight technology is listed as one of the core technologies to achieve the development goals of energy saving and new energy vehicles.
Scholars have carried out many related researches on automobile lightweight, and the main contents are how to realize automobile lightweight by optimizing structural design, applying lightweight materials and adopting advanced manufacturing processes [5,6]. In terms of lightweight design method, Paz et al. [7] improved the energy absorption characteristics of automobile energy absorption device and reduced the mass by using surrogate model technology and multi-objective genetic algorithm. Velea et al. [8] carried out multi-objective optimization for the composite body of electric vehicle considering the weight, cost, and stiffness. Duan et al. [9] used multi-objective particle swarm optimization algorithm for lightweight design of body-in-white structure to meet the reliability requirements. Li et al. [10] improved the crashworthiness of the vehicle under low-speed collision by optimizing the front structure of the vehicle body. Wang et al. [11] carried out lightweight multi-objective optimization design of bus body frame using modular local topology optimization design method. The above research mainly focuses on the lightweight design of automobile body structure. The lightweight of suspension structure is an important part of vehicle lightweight. It is necessary to study the lightweight design method of suspension structure.
Recently, the parametric modeling method based on mesh morphing technology is widely used in the field of automobile lightweight. Sharma [12] used mesh morphing technology to establish an interdisciplinary parametric model in the process of vehicle structure optimization. Wang et al. [13] combined with mesh deformation technology and optimization method for lightweight design of car subframe. Lian [14] used parameterized mesh deformation function to quickly generate finite element models of buses with different sizes for building approximate models. Fang et al. [15] performed multi-objective shape optimization of body-in-white frame beam based on mesh morphing technology to reduce weight. Suspension structure usually has a relatively complex structure, and its lightweight design is only considering the thickness of the plate, which leads to the optimization space is limited, and the lightweight effect is not obvious. Compared with size optimization, the parametric model based on mesh morphing technology is used for shape optimization [16], which can fully exploit the weight reduction potential of suspension structure and make its lightweight effect more significant.
The lightweight design of suspension structure will change its structural performance such as stiffness and mode, which will cause the change of suspension performance, and then affects the vehicle performance such as ride comfort and handling stability [17]. At the same time, there is a coupling relationship between the performance of the front and rear suspensions. The lightweight design of the front suspension structure or the rear suspension structure alone, while ignoring the synergy between them, often reduces the engineering applicability of the lightweight scheme. Therefore, the lightweight design of suspension structure is a complex system optimization problem. In the design process, it is necessary to consider not only its own structural performance index, but also the coupling relationship between the front and rear suspension structural parameters to ensure that the vehicle performance such as ride comfort and handling stability meets the requirements. In addition, the suspension structure is an important bearing part of the chassis, which needs to bear the force and torque from the three directions between the road and the body during the vehicle driving. The load condition is complex, especially the lightweight design will usually improve the structural stress level, which is easy to cause structural fatigue failure [18]. Therefore, the fatigue resistance is also one of the important evaluation indexes to be considered in the lightweight design of suspension structure.
The lightweight design of suspension components has a negative effect on vehicle dynamic performance such as ride comfort and handling stability. Also, there is a synergy between front and rear suspensions, which affects the engineering applicability of lightweight scheme of suspension component. Hence, it is necessary to conducted the lightweight design of suspension components while considering their structural performance and the vehicle dynamic performance. In this paper, the lower control arm of the McPherson front suspension and the torsion beam of the rear suspension are taken as the research objects. The parametric modeling of the control arm and the torsion beam is carried out based on the mesh morphing technology. The shape parameters and thickness reflecting the structural characteristics are selected as the design variables, and the rigid–flexible coupling model of the vehicle considering the flexibility of the control arm and the torsion beam is established. On this basis, the structural performance such as fatigue life, stiffness and modal frequency, and the vehicle performance such as ride comfort and handling stability are comprehensively considered. Combined with the Kriging surrogate model and the NSGA-II algorithm, the size optimization and shape optimization of the control arm and the torsion beam are carried out simultaneously, for realizing the lightweight design of suspension components.
The rest of this paper is structured as follows: The parametric models of control arm and torsion beam are presented in Section 2. In Section 3, the vehicle rigid–flexible coupling model is established. In Section 4, the lightweight design of control arm and torsion beam is performed based on NSGA-II algorithm coupling with surrogate model. The multi-objective optimization results are discussed and analyzed in Section 5. Finally, the main conclusions are outlined in Section 6.

2. Parametric Modeling of Control Arm and Torsion Beam

2.1. Mesh Morphing Technology

The mesh morphing technology realizes the node movement of finite element model through the mathematical form of matrix representation or the geometric form defined by the target shape. It can quickly change the size and shape of the mesh model, and greatly reduce the processing time of CAE model in structural lightweight design [19].
In mesh morphing technology, the nodes of finite element model are defined as fixed nodes, control nodes, and deformable nodes. In the deformation process, the fixed node remains fixed, which is used to define the boundary of the mesh deformation zone. The control nodes transform the initial mesh to the target mesh by translation, rotation, scaling, and projection. The deformable node will move with control node, and the displacement of the deformable node after deformation can be calculated by the equation
D = C N n e w C N c u r r e n t D N n e w = f ( D , ϕ , φ ) D N c u r r e n t
where D is the control node displacement variable matrix. C N i c u r r e n t and C N i n e w are the coordinate matrices of control nodes before and after deformation, respectively. D N i c u r r e n t and D N i n e w are the coordinate matrices of deformable nodes before and after deformation, respectively. f ( D , ϕ , φ ) is the deformation shape function.

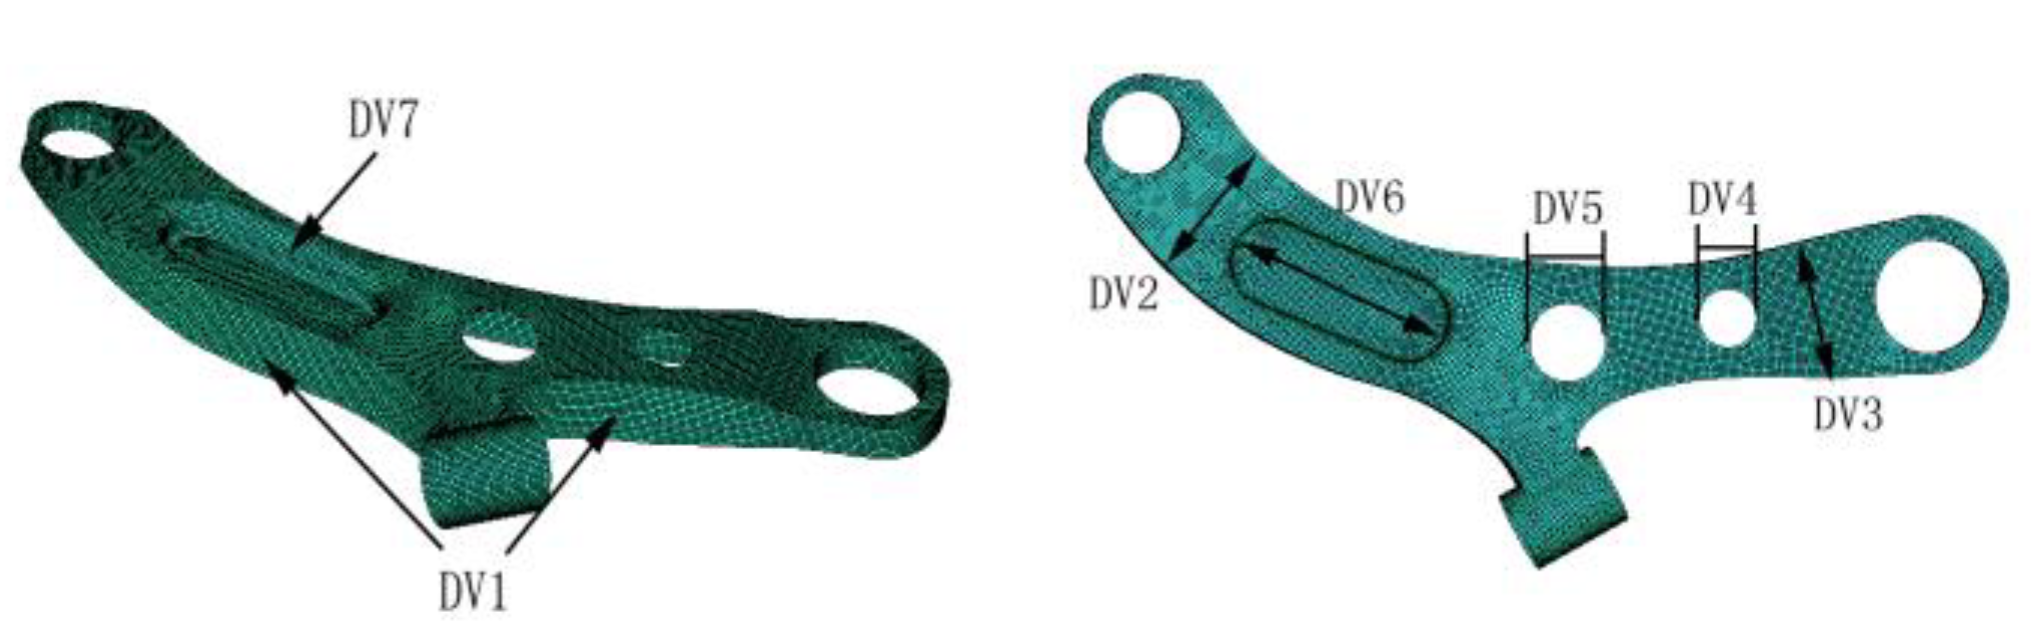
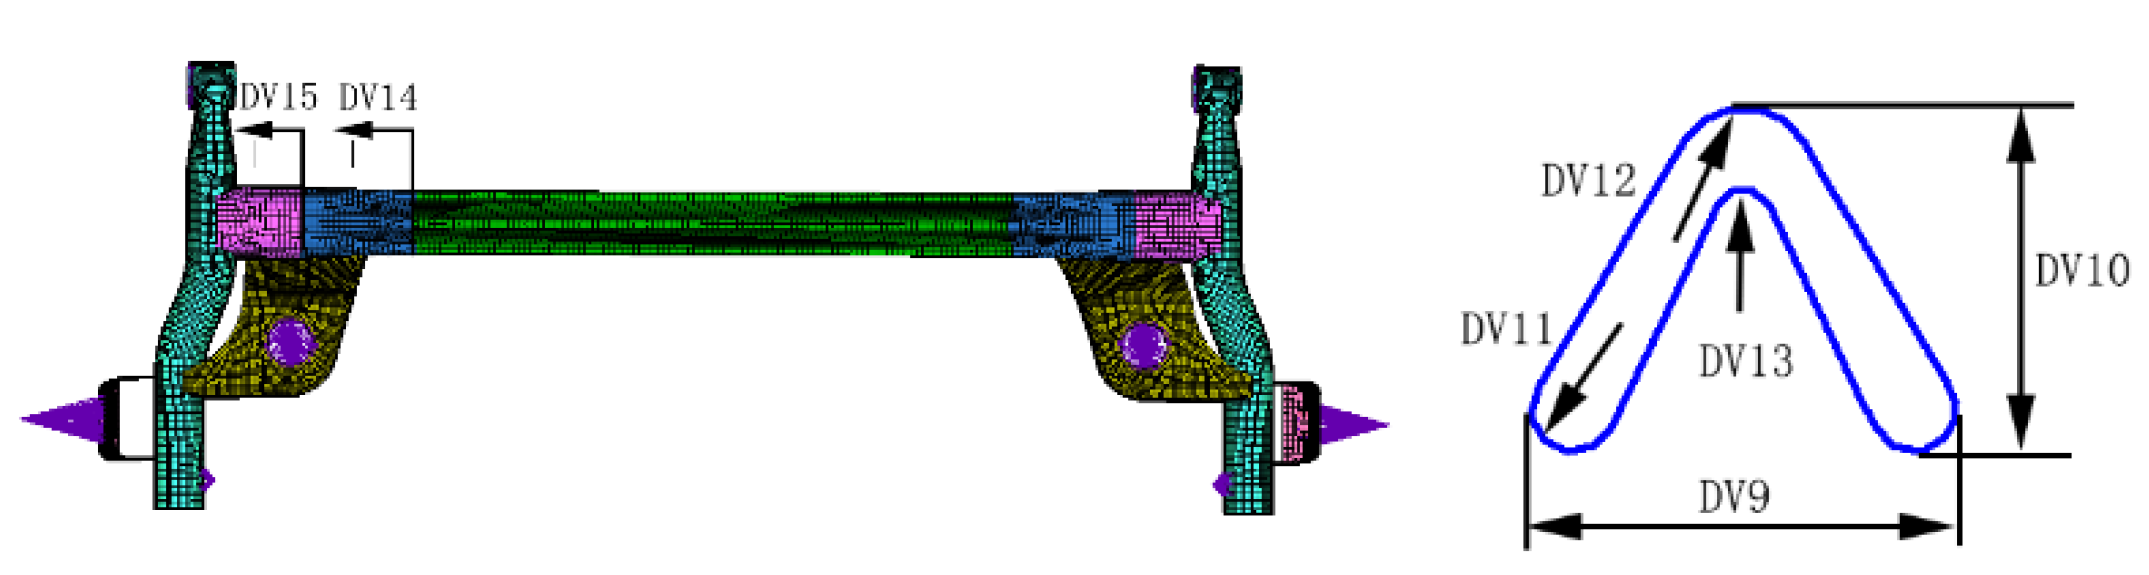
2.2. Parametric Modeling

In this paper, mesh morphing technology was used for parametric modeling of control arm and torsion beam. In the parametric model, the mesh morphing is mainly realized through free-form deformation and control block-based deformation, which adopt two different deformation shape functions respectively. The former adopts parabolic or spherical polynomial equation, while the latter adopts linear polynomial equation as deformation shape function. The free-form deformation morphs the meshes directly, which can get a smooth transition deformation zone and is more suitable for local deformation. Meanwhile, the control block-based deformation indirectly controls the mesh deformation by the control blocks which is more suitable for the overall deformation of the model.
Firstly, the geometric models of the control arm and torsion beam are appropriately simplified and meshed by shell elements, to build the finite element models. Then, the two deformation methods mentioned above are used to parameterized the geometric feature of the control arm and torsion beam. Finally, the parametric finite element models of the control arm and torsion beam are obtained, as shown in Figure 1 and Figure 2.
The shape variables are used to describe the key structure feature of the control arm and torsion beam. The sheet thickness of control arm and torsion beam are also defined as design variables. By adjusting the value of the variables, a new shape can be obtained from the existing finite element model. In order to avoid the distortion of the model, it is necessary to set a reasonable value range of theses variables. The design variables and their value ranges defined in the parametric models of the control arm and torsion beam are shown in Table 1 and Table 2. The symmetric variables in the torsion beam are treated as one independent variable.

3. Establishment of Vehicle Rigid–Flexible Coupling Model

3.1. Flexible Body Models of Control Arm and Torsion Beam

The modal neutral files of control arm and torsion beam containing mass, node position and modal information were obtained through finite element analysis. Then, the modal neutral files were imported into Adams/Car software to generate the flexible body models for multi-body dynamics simulation analysis. In order to verify the accuracy of the flexible body model, the modal tests of control arm and torsional beam under free state were carried out by hammer impulse method. During the tests, the specimens were suspended by elastic rope to make them in a free state, as shown in Figure 3.
The free modal simulation results of control arm and torsion beam are compared with the test results. Table 3 shows the simulation and test values of the first-order to sixth-order natural frequencies. Through Table 3, it can be found that the natural frequencies of control arm and torsion beam are basically consistent with the test values, and the maximum relative errors are 5.8% and 4.3%, respectively. It shows that the flexible body models of the control arm and torsion beam are accurate and reasonable.

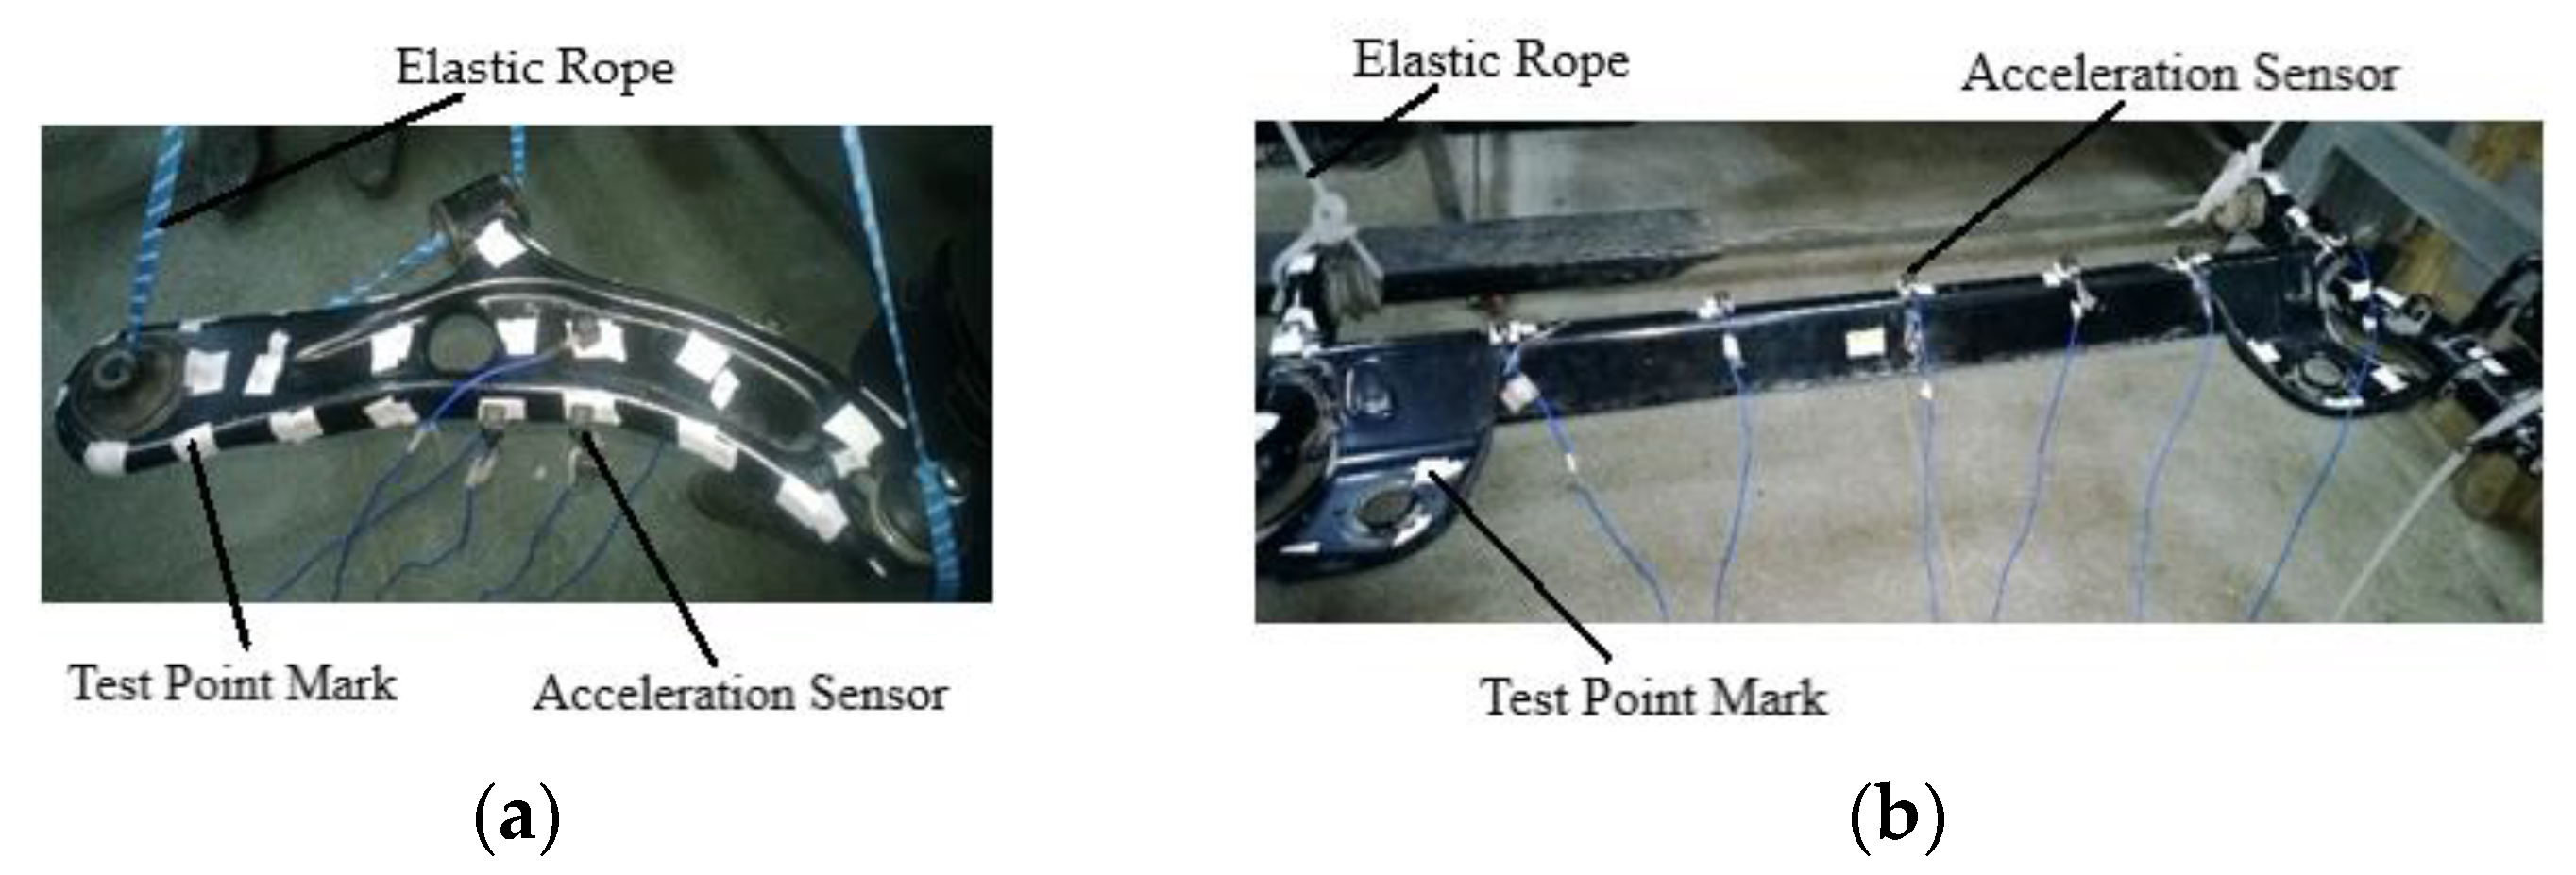
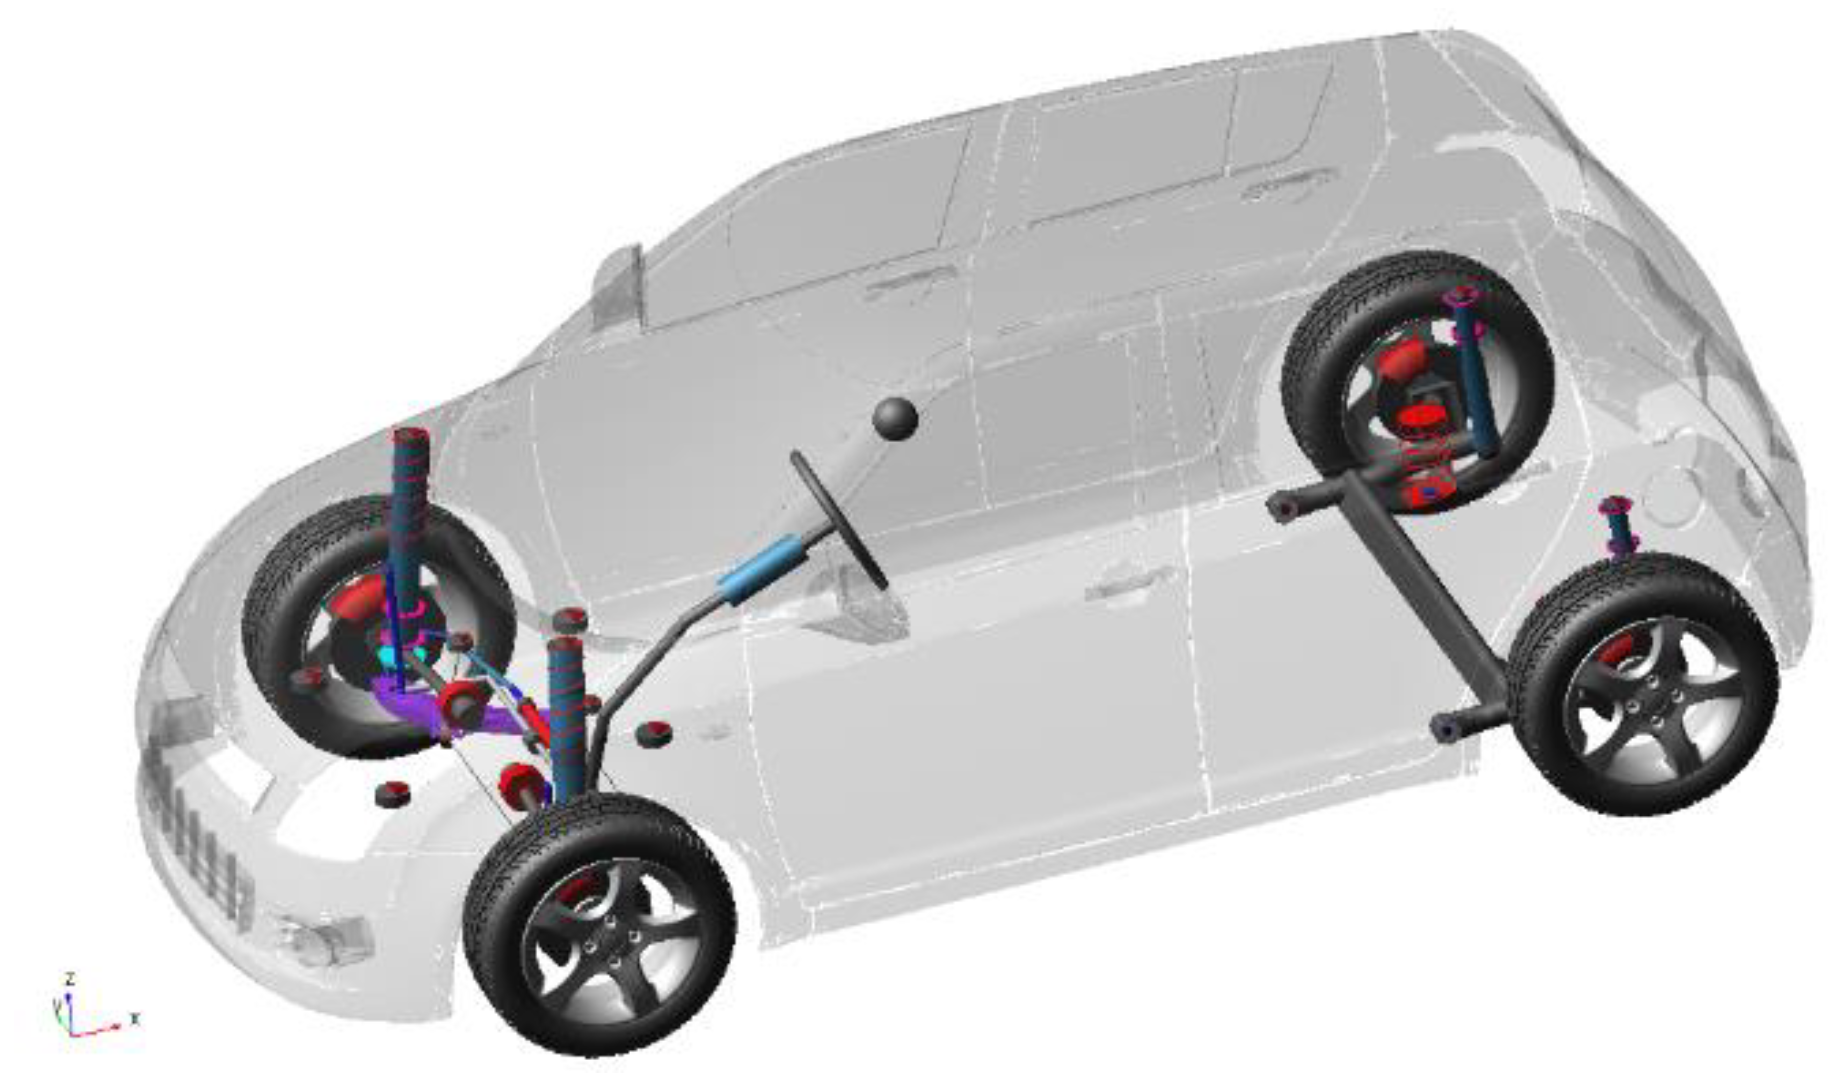
3.2. Establishment and Verification of Rigid–Flexible Coupling Vehicle Model

The flexible body models of control arm and torsion beam are imported into the front and rear suspension subsystems respectively, as they connect to other components through the external nodes. According to the topological relationship, the subsystems such as body, powertrain, front suspension, rear suspension, tires, steering, and braking system are assembled into a rigid–flexible coupling multi-body dynamic model of the passenger car, as shown in Figure 4.
In order to ensure that the accuracy of the rigid–flexible coupling dynamic model of the vehicle meets the requirements, the simulation analysis for ride comfort and handling stability is carried out, and the results are compared with the vehicle road test results. Figure 5 shows the simulation and test values of the total weighted root mean square (RMS) of seat rail acceleration under grade A road excitation. Figure 6 shows the simulation and test results of the change of the vehicle roll angle with the lateral acceleration under the steady circular condition.
It can be seen from Figure 5 and Figure 6 that the simulation values of the total weighted root mean square of seat rail acceleration are basically consistent with the test values, and the maximum relative error is 8.6%. The simulation results of the relationship curve between vehicle roll angle and lateral acceleration are basically consistent with the test results. It indicates that the rigid–flexible coupling vehicle model has enough accuracy for ride comfort and handling stability simulation.

4. Lightweight Design of Control Arm and Torsion Beam

4.1. Optimization Formulation

In this paper, multi-objective optimization method is used to perform the lightweight design of control arm and torsion beam by optimizing their geometrical size and shape. The optimization aim is to realize weight reduction of control arm and torsion beam and vehicle dynamic performance improvement, simultaneously. The longitudinal stiffness of control arm and torsion stiffness of torsion beam have contributions to suspension stiffness, which affects the body acceleration representing by seat rail acceleration. Meanwhile, the lateral stiffness of control arm and torsion stiffness of torsion beam have effects on roll stiffness, which is used to calculate the vehicle roll angle. Therefore, the first objective of the multi-objective optimization problem is to minimize total weight of control arm and torsion beam. The other objectives are to minimize the total weighted root mean square of seat rail acceleration and maximum vehicle roll angle, which are used for evaluating ride comfort and handling stability. Meanwhile, the fatigue life calculated according to the combined durability pavement model [20], is given as a constraint. Moreover, the combined durability pavement model is built by referring to the corresponding durability test specification of automobile test ground. The length of durability pavement model is 160 m, which includes a pebble road of 40 m, a washboard road of 40 m, and a Belgian road of 80 m. In addition, the stiffness and natural frequency should satisfy the design requirements. Thus, the multi-objective optimization problem of the control arm and torsion beam can be formulated in the following form:
f i n d x = ( DV 1   , DV 2 ,   ,   DV 16 ) T { min { m 1 ( x ) + m 2 ( x ) ,   a v ( x ) ,   φ max ( x ) } s . t . N 1 ( x ) 30,000     N 2 ( x ) 30,000   | K 11 ( x ) K L | 0.2 K L   | K 12 ( x ) K T | 0.2 K T   | K 2 ( x ) K N | 0.2 K N   | f 1 ( x ) F 1 | 0.1 F 1   | f 2 ( x ) F 2 | 0.1 F 2   D V L x D V U
where x is the design vector; m 1 ( x ) and m 2 ( x ) are the mass of control arm and torsion beam, respectively; a v ( x ) is the total weighted root mean square of seat rail acceleration at the speed of 60 km/h under grade B road excitation; φ max ( x ) is the maximum vehicle roll angle in double lane change simulation with vehicle speed of 80 km/h; N 1 ( x ) and N 2 ( x ) are the minimum fatigue life of control arm and torsion beam, respectively; K 11 ( x ) and K 12 ( x )  represent the longitudinal stiffness and lateral stiffness of control arm, and KL is set as 3.76 kN/m while KT is set as 40.6 kN/m; K 2 ( x ) denote the torsional stiffness of torsion beam and KN is set as 40.8 N·m/°; f 1 ( x ) and f 2 ( x ) are first order modal frequencies of control arm and torsion beam, F1 = 212.0 Hz, F2 = 40.6 Hz; DVL and DVU are the lower and upper limits of design vector x, respectively.

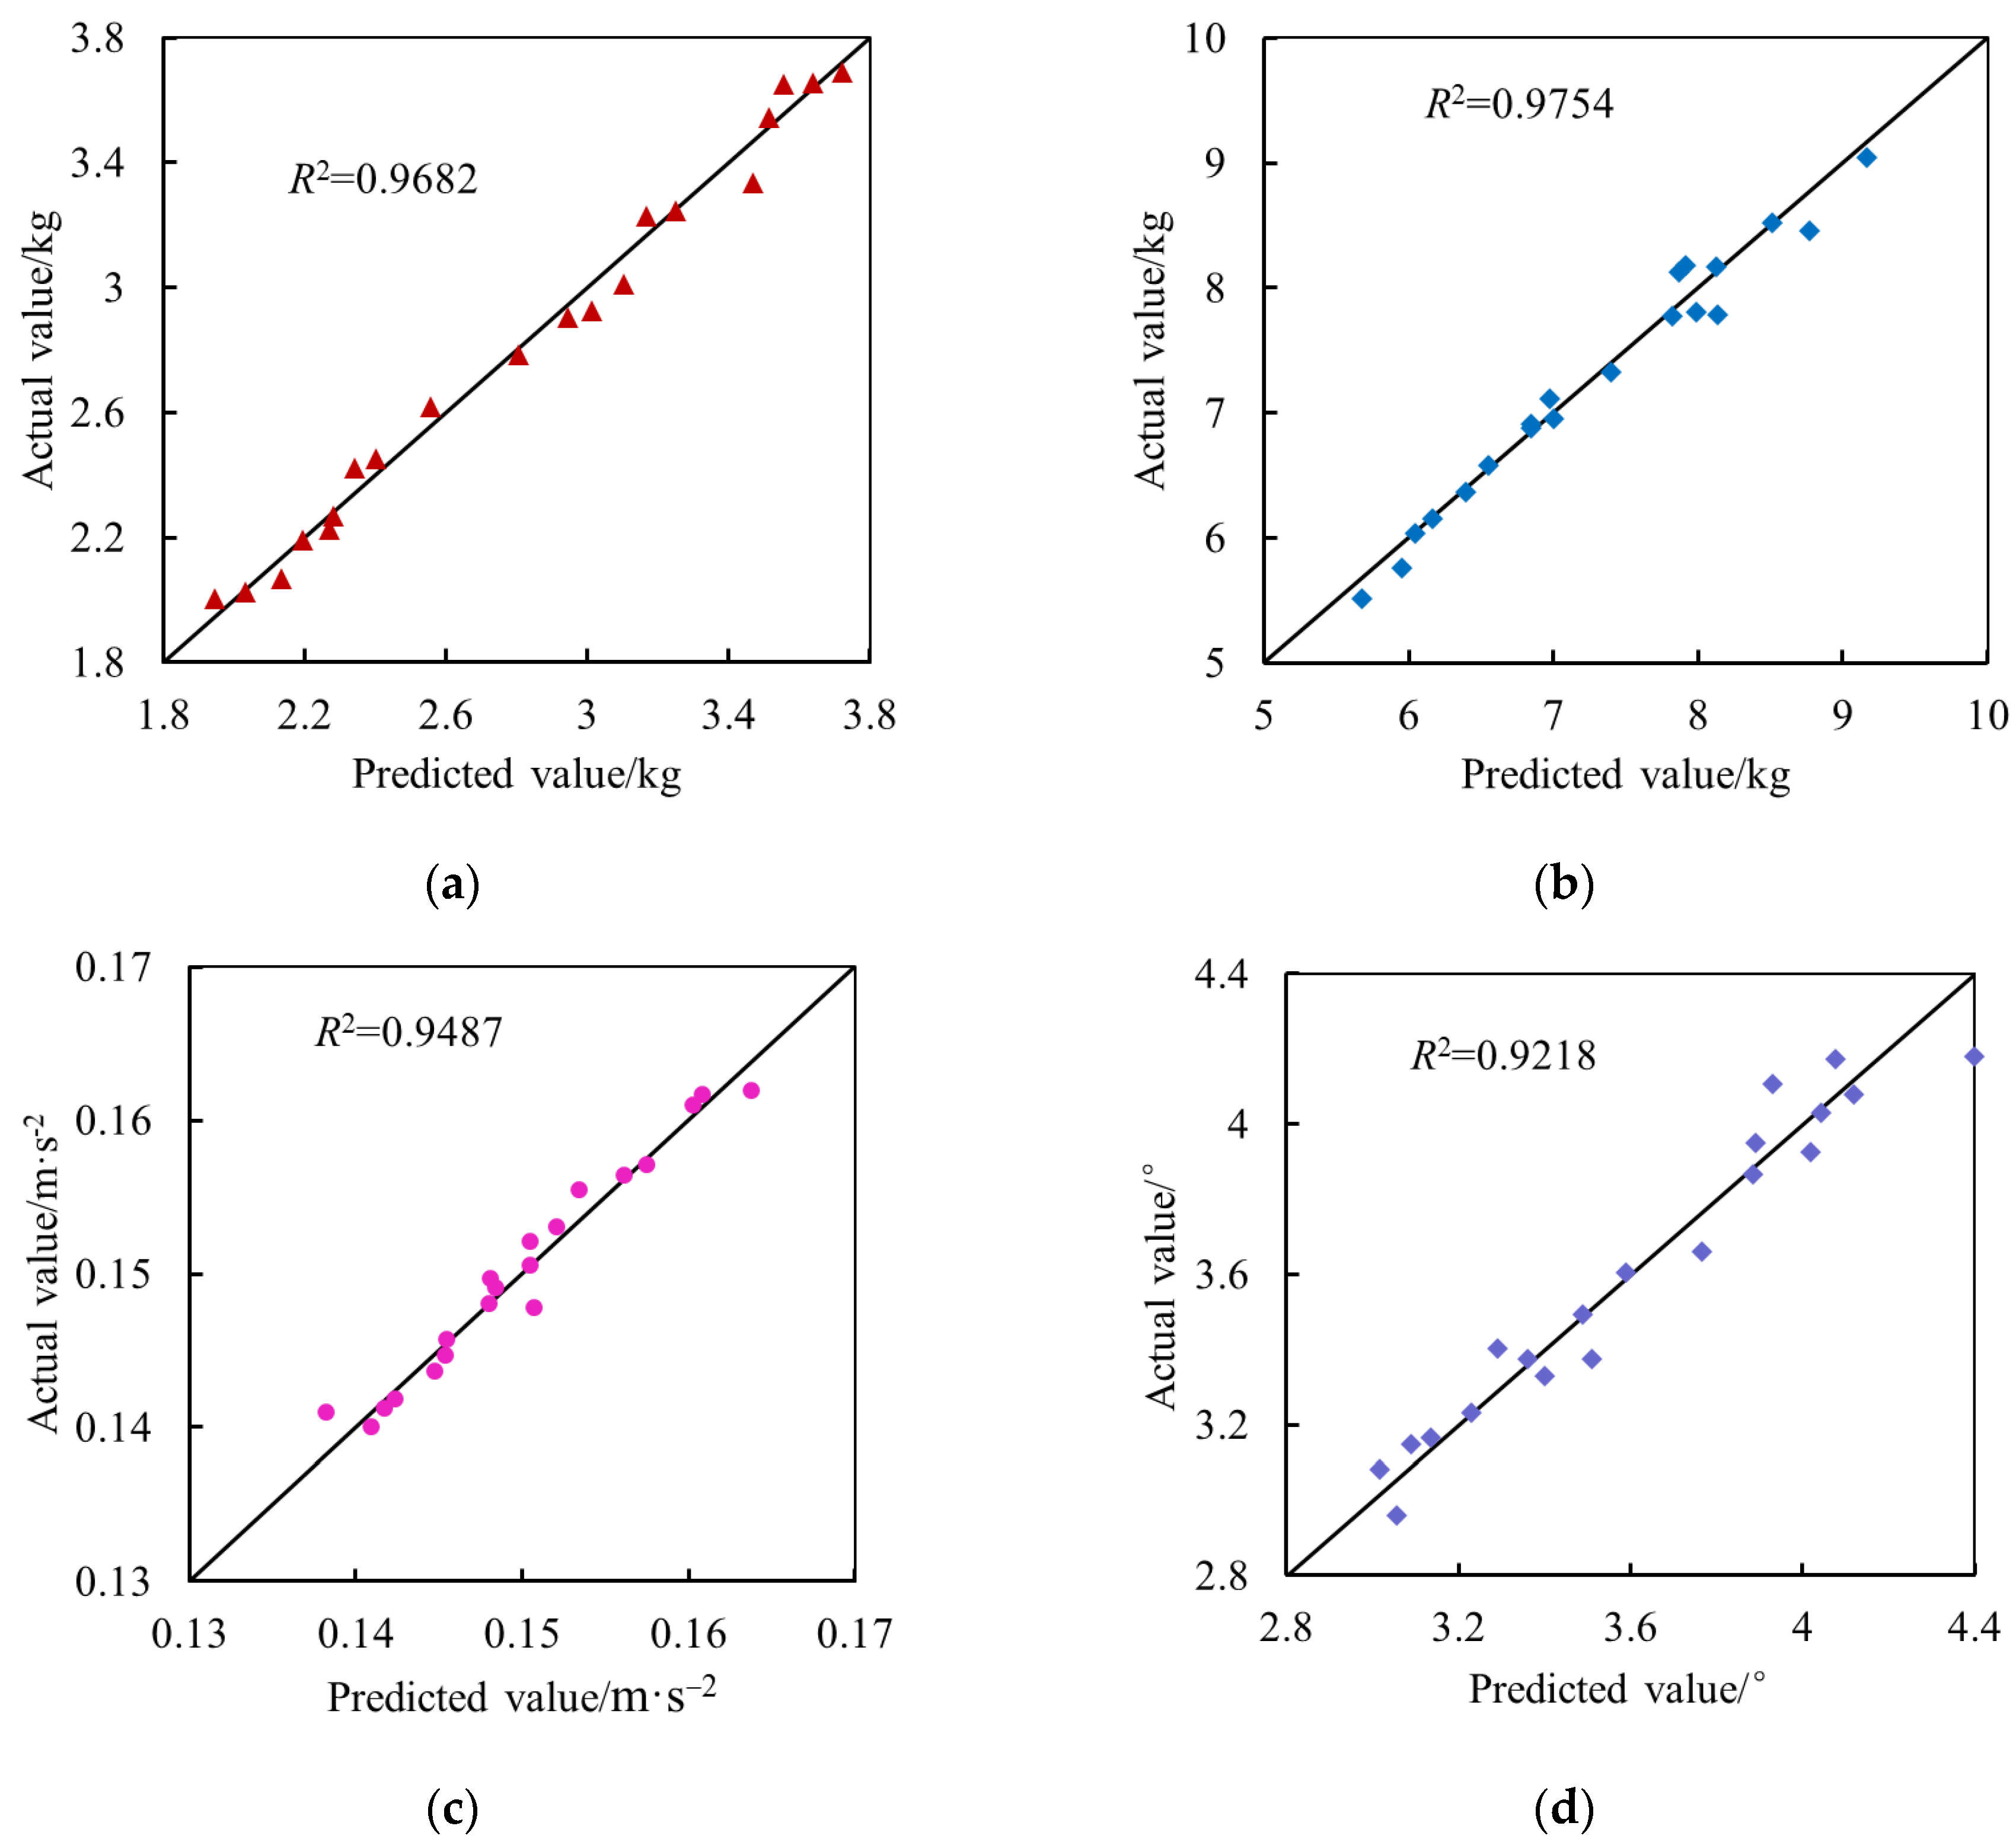
4.2. Surrogate Model

In order to improve the efficiency for solving the multi-objective optimization problem, Kriging surrogate models are used for replacing the numerical simulation models to perform the lightweight design of control arm and torsion beam under the premise of ensuring accuracy. The optimal Latin square sampling method is used to generate 200 sample points, which are applied to build Kriging surrogate models between design variables and optimization objectives, constraints. The accuracy of surrogate model can be verified by decision coefficient, which is expressed as
R 2 = i = 1 n ( y ^ i y ¯ ) 2 i = 1 n ( y i y ¯ ) 2
where n denotes sample points for accuracy verification; y ^ i and y i represent the predicted and actual value of the ith response, respectively; y ¯ is the mean value.
The value range for decision coefficient is 0–1. The closer the decision coefficient is to 1, the higher the accuracy of the surrogate model. Thus, 20 sample points randomly selected in the design space are used to calculate the decision coefficient values of the established Kriging surrogate models. The accuracy verification results for the weight of control arm and torsion beam, the total weighted root mean square of seat rail acceleration and maximum vehicle roll angle are shown in Figure 7. The decision coefficients are 0.9682, 0.9754, 0.9487, and 0.9218, respectively, which show that the surrogate models have a good prediction accuracy.

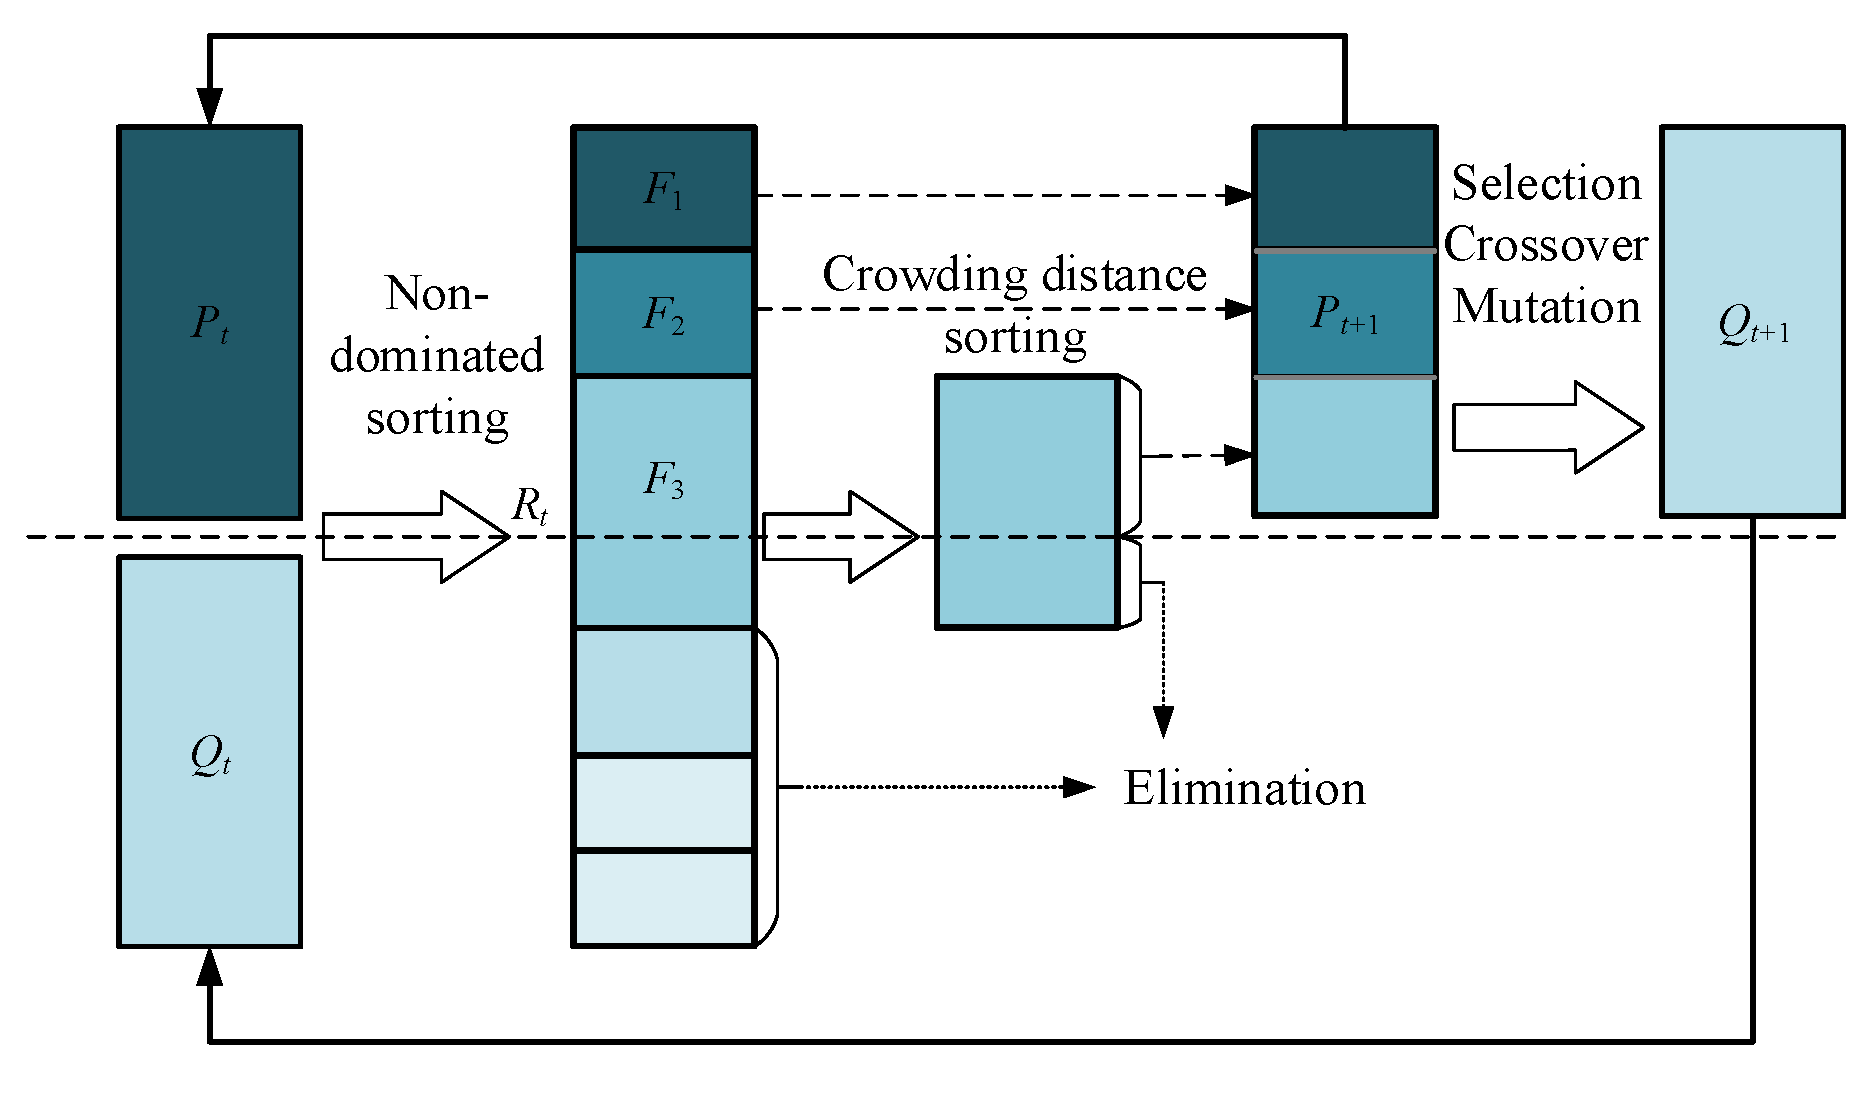
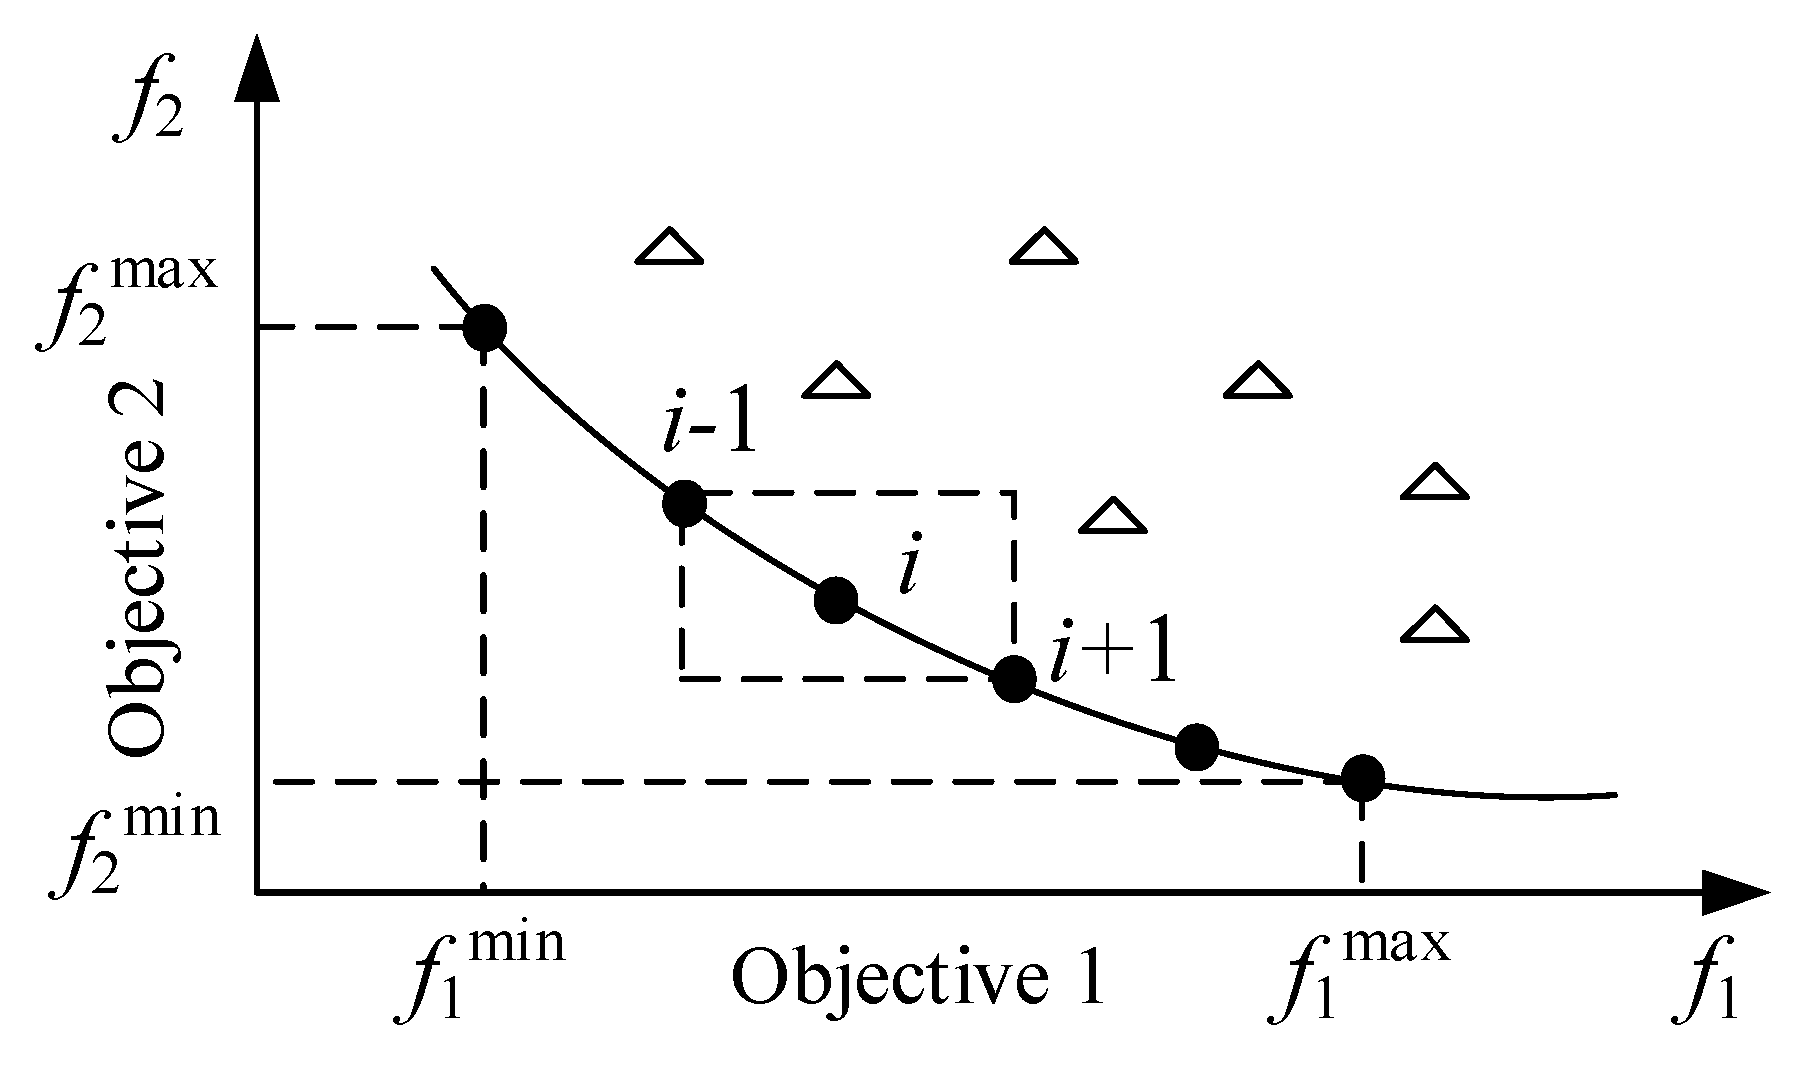
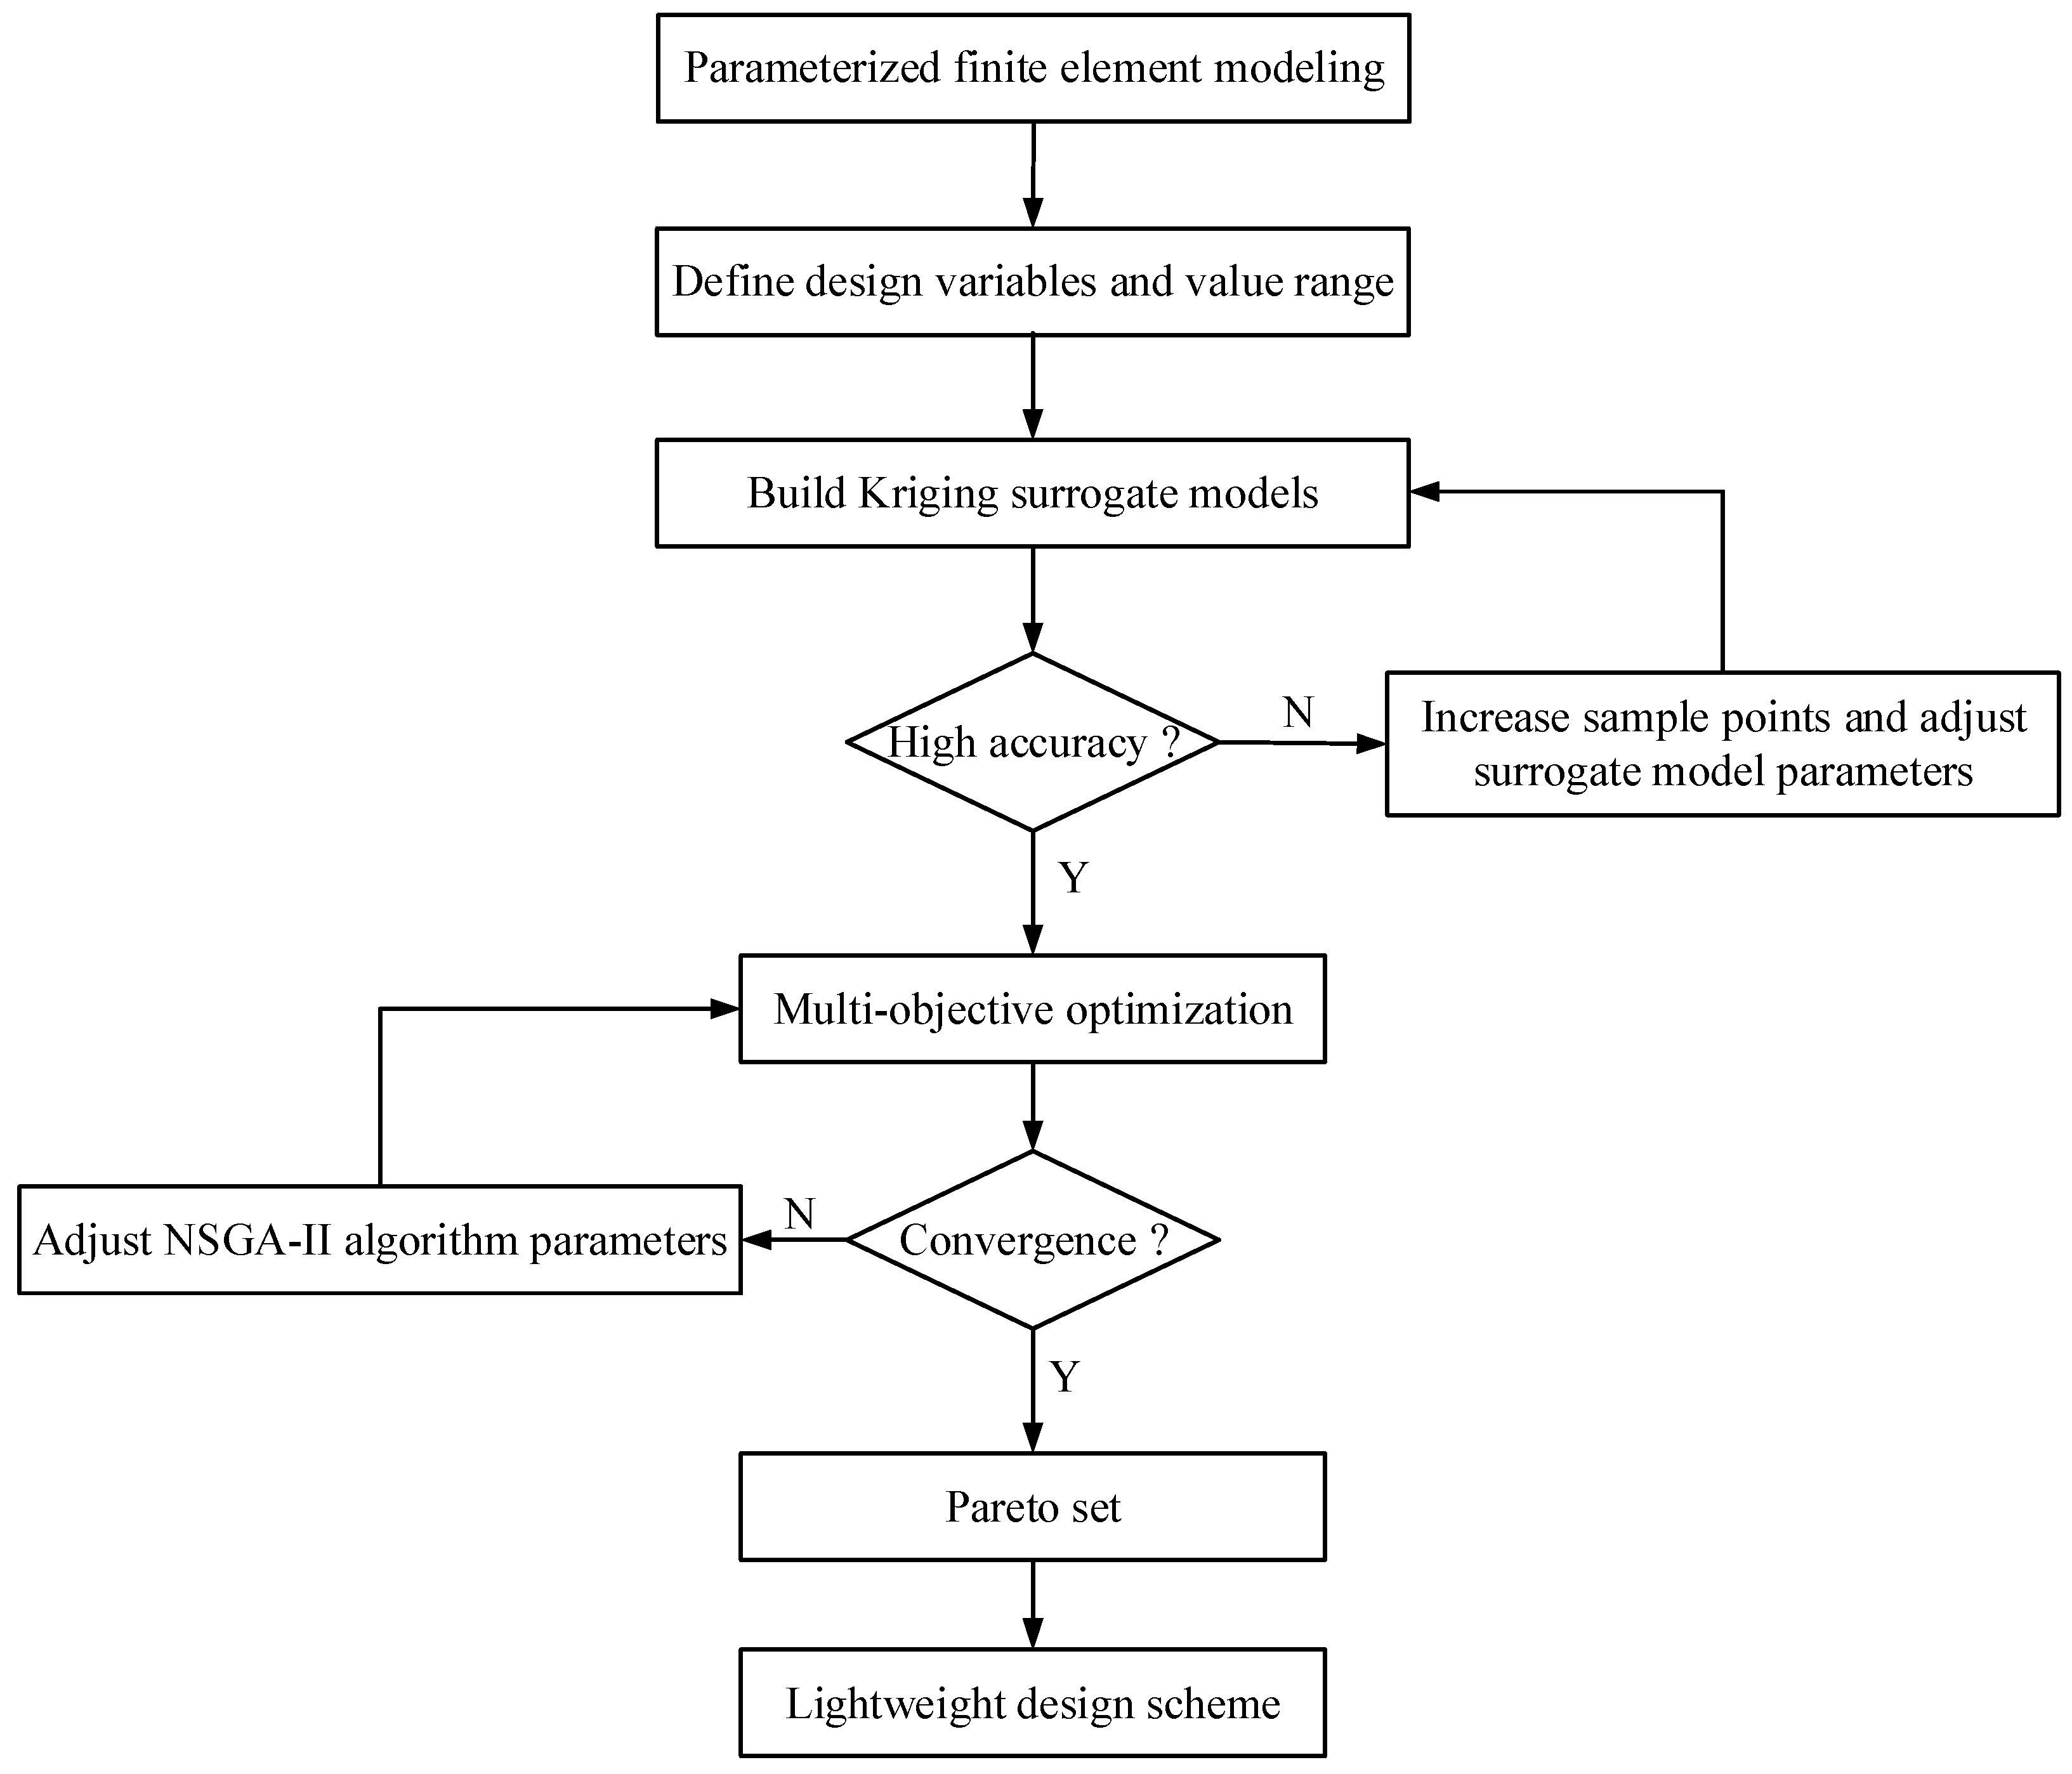
4.3. Multi-Objective Optimization Based on NSGA-II Algorithm

The elitist non-dominated sorting genetic algorithm (NSGA-II) is one of the most efficient and popular multi-objective evolutionary algorithm, which is first proposed by K. Deb [21]. Compared with the traditional genetic algorithm, fast non-dominated sorting method, elitist maintenance strategy, and efficient crowding distance estimation procedure are introduced into the NSGA-II. Then it greatly improves iterative convergence rate, reduces computational complexity and ensures population diversity [22]. Figure 8 shows the principle of NSGA-II algorithm, and its basic steps are as follows:
Step 1: Randomly generate an initial population (t = 0) of size N based on the problem range and constraints. Generate offspring population Qt (t = 0) from Pt using GA operators of selection, crossover, and mutation. Then calculate the fitness value of each individual.
Step 2: Combine population Pt and Qt to create a new population with size of 2 N. Perform non-dominated sorting of population Rt and classify them into several fronts (F1, F2, F3, …). Then calculate the crowding distance for a set of population individuals, where the definition of crowding distance for the ith individual is shown in Figure 9. It can be calculated as
d i = j = 1 k | f j i + 1 f j i 1 f j max f j min |
where di is the crowding distance of the ith individual; k is the number of objective functions; f j i + 1 and f j i 1 denote the jth objective function of the (i − 1)th and (i + 1)th individual, respectively; f j max and f j min represent the maximum and minimum of the jth objective function, respectively.
Step 3: Select the best N individuals according to the order of front dominance and crowding distance to form a new population Pt+1. Select the individuals of fronts with low order of dominance first, and then select the individuals with a large crowding distance in the same front.
Step 4: Perform selection, crossover and mutation on population Pt+1 to generate a new offspring Qt+1 with size of N.
Step 5: Repeat the procedure from Step 2 if the termination criterion is not satisfied. Otherwise, stop and output the non-dominated solution set.
As mentioned above, the mesh morphing technology, the Kriging surrogate model as well as the NSGA-II algorithm are integrated into a multi-objective optimization procedure. The mesh morphing technology is used to parameterize the control arm and torsion beam finite element models for defining the design variables firstly. The Kriging surrogate models are then employed to describe the relations between design variables and objectives, constraints of the optimization problem. After that, The NSGA-II procedure is performed to search the Pareto solutions to the multi-objective optimization problem. Figure 10 shows a flowchart to summarize the solution procedure for this multi-objective optimization problem.

5. Results and Discussion

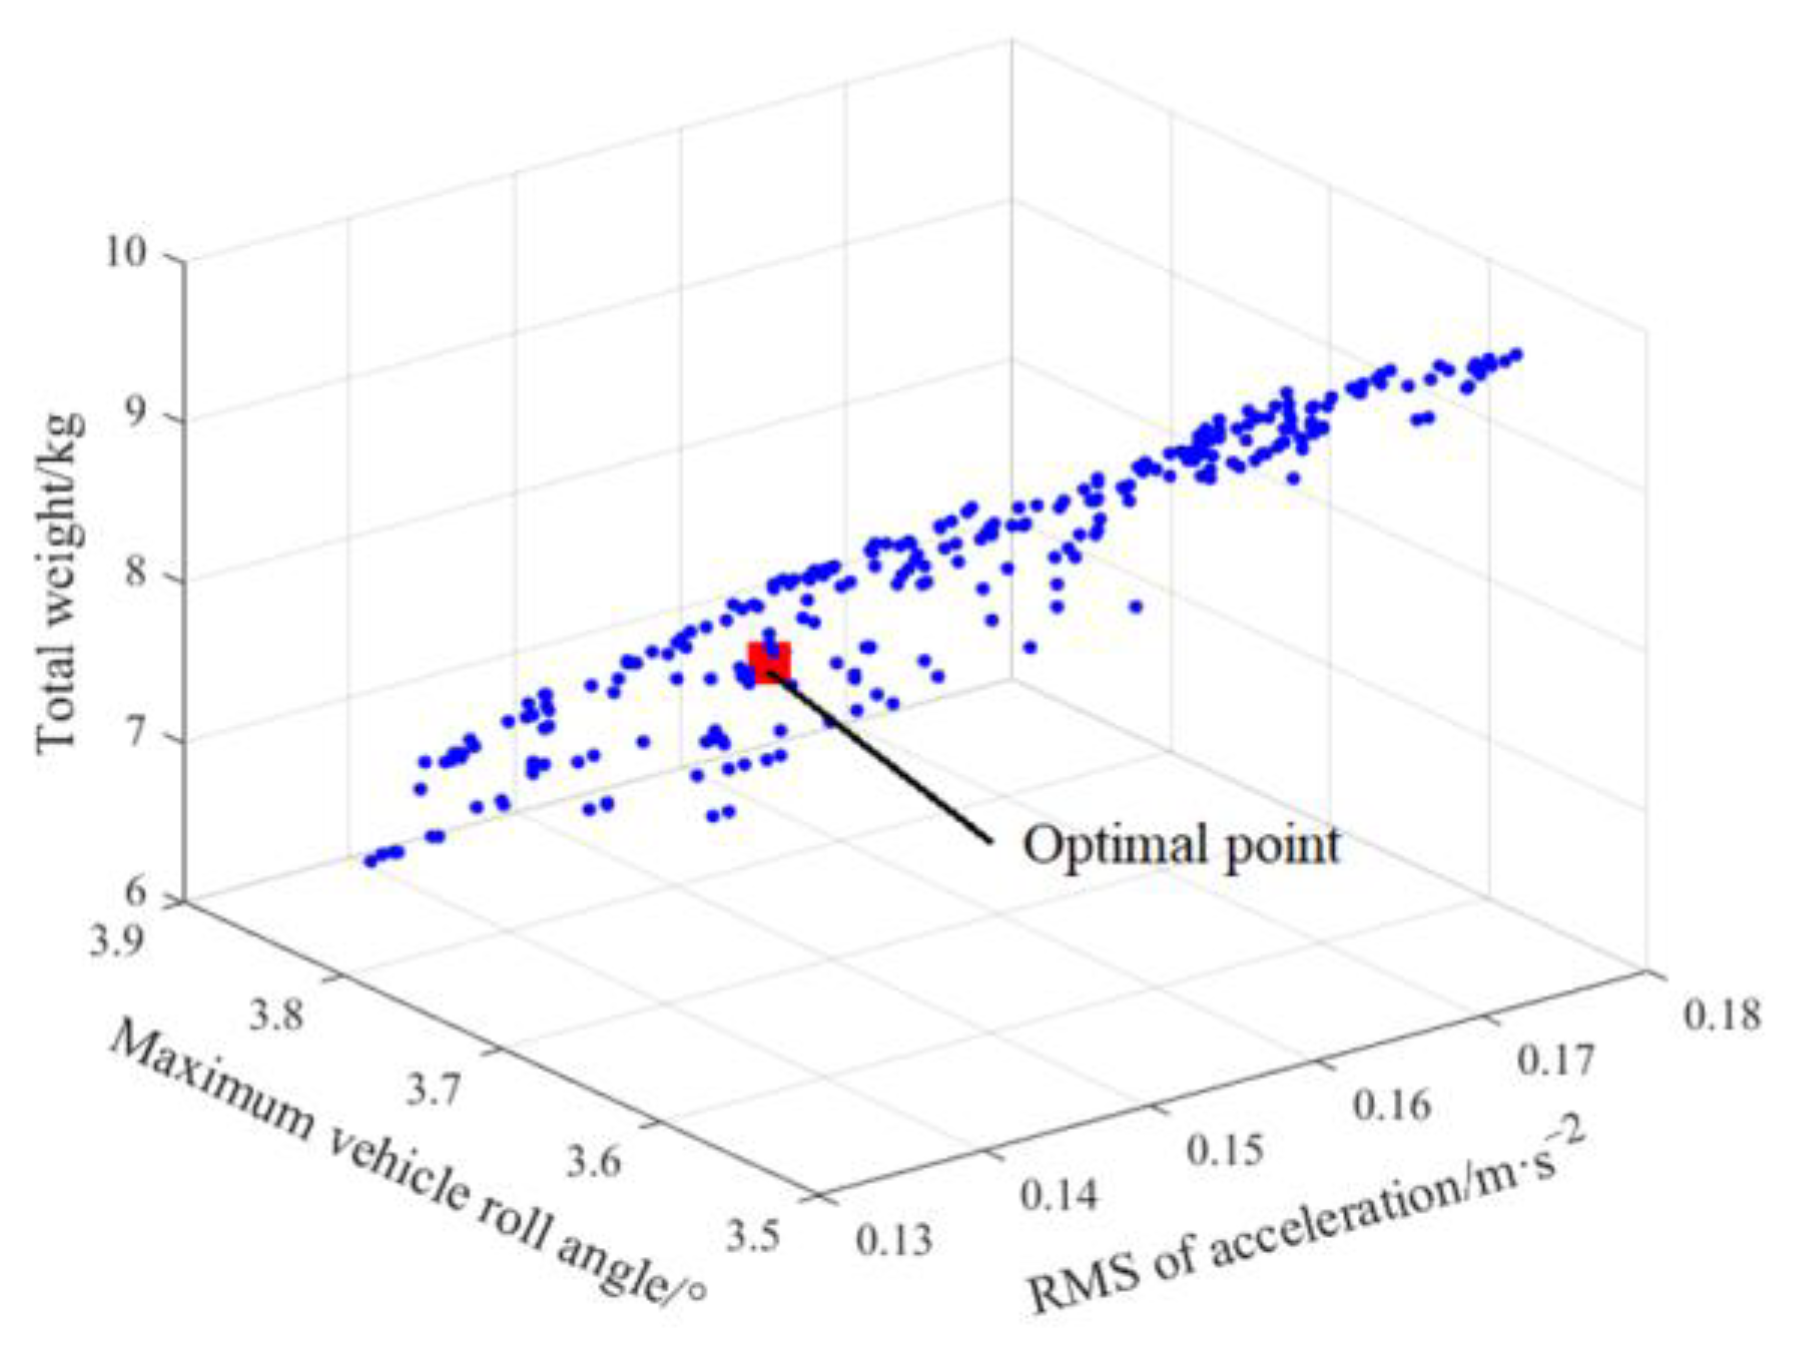
5.1. Optimization Results

In this paper, NSGA-II algorithm is adopted to solve the multi-objective optimization problem. The population size and maximum generation are set to 80 and 100, respectively. Meanwhile, a crossover probability of 0.9 and mutation probability of 0.1 are employed in this algorithm. The Pareto front of the multi-objective optimization of lightweight design for control arm and torsion beam is obtained by NSGA-II algorithm, as shown in Figure 11.
In the Pareto solution set, the solution with smaller total weight of control arm and torsion beam and better vehicle dynamic index is selected as the optimal design result, which is labeled as optimal point in Figure 11. The optimal design variables are appropriately modified to make them more practicable. The optimization results of design variables are listed in Table 4.
The weight of control arm and torsion beam are calculated by finite element models based on the corrected values of design variables. The weight of control arm is reduced from the original model of 2.521 kg to optimized model of 2.016 kg, with a mass reduction of 20.03%. Meanwhile, the weight of torsion beam is reduced from 7.459 kg to 6.270 kg, achieving a mass reduction of 15.94%. It indicates that the optimal design of control arm and torsion beam achieve a remarkable weight saving compared with the original design.
In order to ensure the feasibility of the lightweight design scheme of control arm and torsion beam, it is necessary to make compare between the original design and optimum design for structural performance, as well as the vehicle dynamic performance. Structural performance of control arm and torsion beam mainly consider the fatigue life, stiffness, and modal frequency, while the vehicle dynamic performance consider the ride comfort and handling stability.

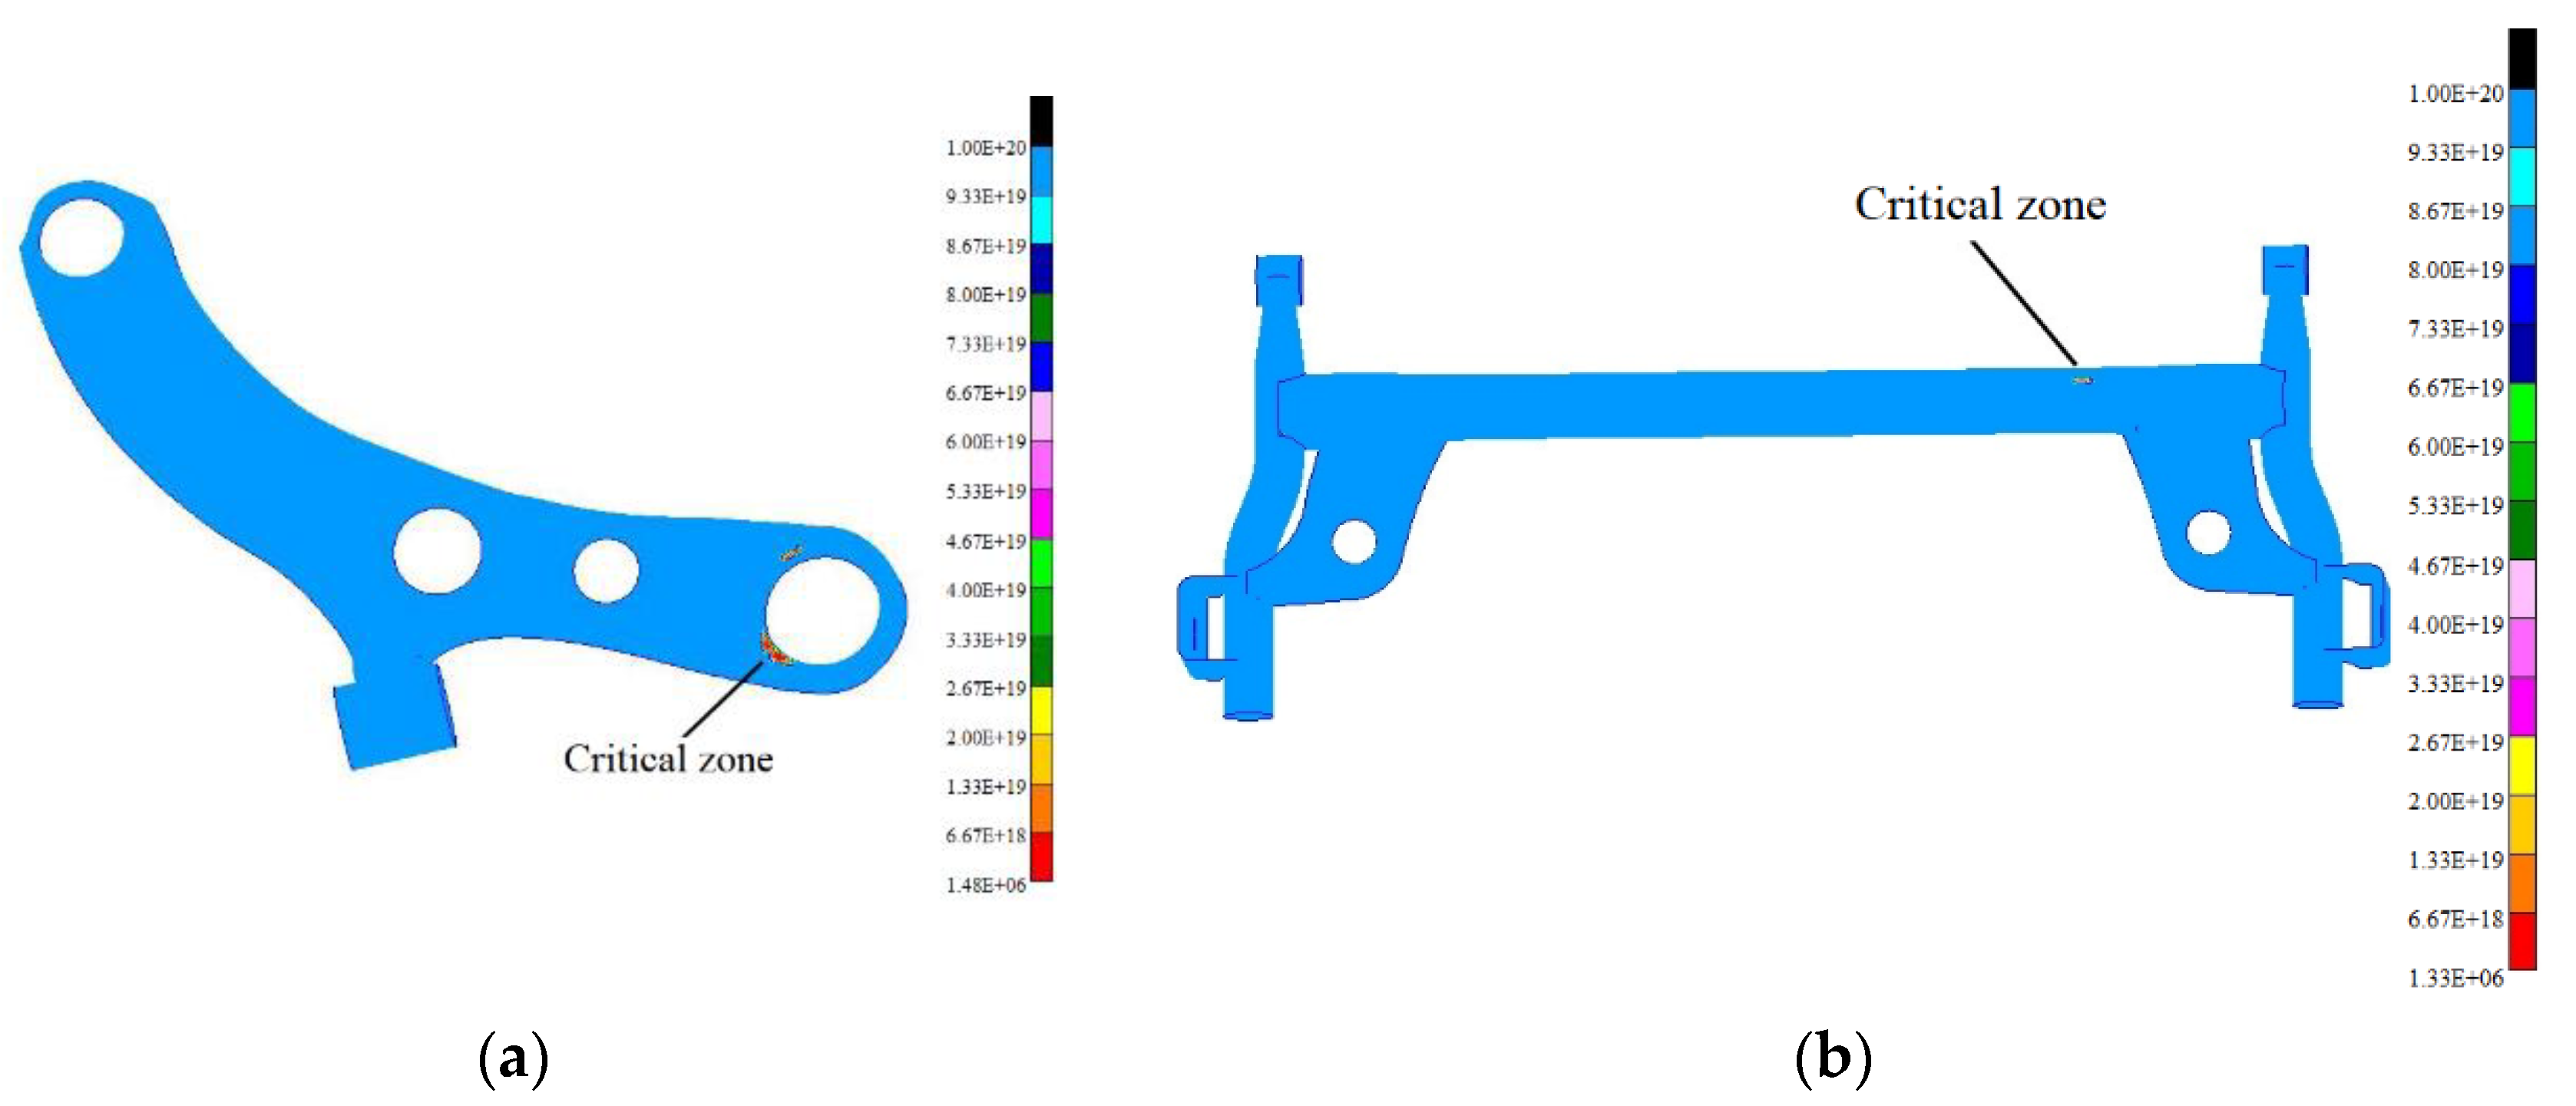
5.2. Structural Performance of Control Arm and Torsion Beam

The control arm and torsion beam are the main load bearing components of vehicle chassis. Thus, it is need to ensure optimized components have sufficient fatigue life, which is closely related with vehicle safety and reliability. The fatigue life of control arm and torsion beam are calculated according to the combined durability pavement model, whose contours are shown in Figure 12. It can be seen that the minimum life of control arm after lightweight design appears beside the rear connection point between control arm and sub-frame. The minimum cycle life is 1.48 × 10⁶, which is converted into the kilometrage of the combined durability pavement of 236,800 km. Moreover, the minimum life position of the torsion beam appears at the crossbeam. The kilometrage of the combined durability pavement is 212,800 km, calculated by the minimum cycle life of 1.33 × 10⁶. It indicates that both of them satisfy the requirement of fatigue life.
The longitudinal and lateral stiffness of control arm and the torsional stiffness of torsion beam have an important influence on the vehicle performance such as ride comfort and handling stability. They are calculated by the optimized finite element model, and then compared with the original design, as shown in Table 5. Obviously, the longitudinal and lateral stiffness of optimized control arm exhibit a slight decrease, while the torsional stiffness of optimized torsion beam acquires a little increment, compared with the original design. They are still within reasonable design requirement.
There is a relationship between the mode of suspension component and vehicle vibration. It is necessary to investigate the natural frequency changes of control arm and torsion beam after lightweight design, for ensuring they are within a reasonable range. Free modal analysis of optimized control arm and torsion beam are carried out, respectively. Then their first six order modal frequencies are extracted and compared with the modal frequencies of original design, as shown in Table 6. It can be clearly seen from the comparison that some improvements of modal frequencies of optimized control arm and torsion beam have been achieved.

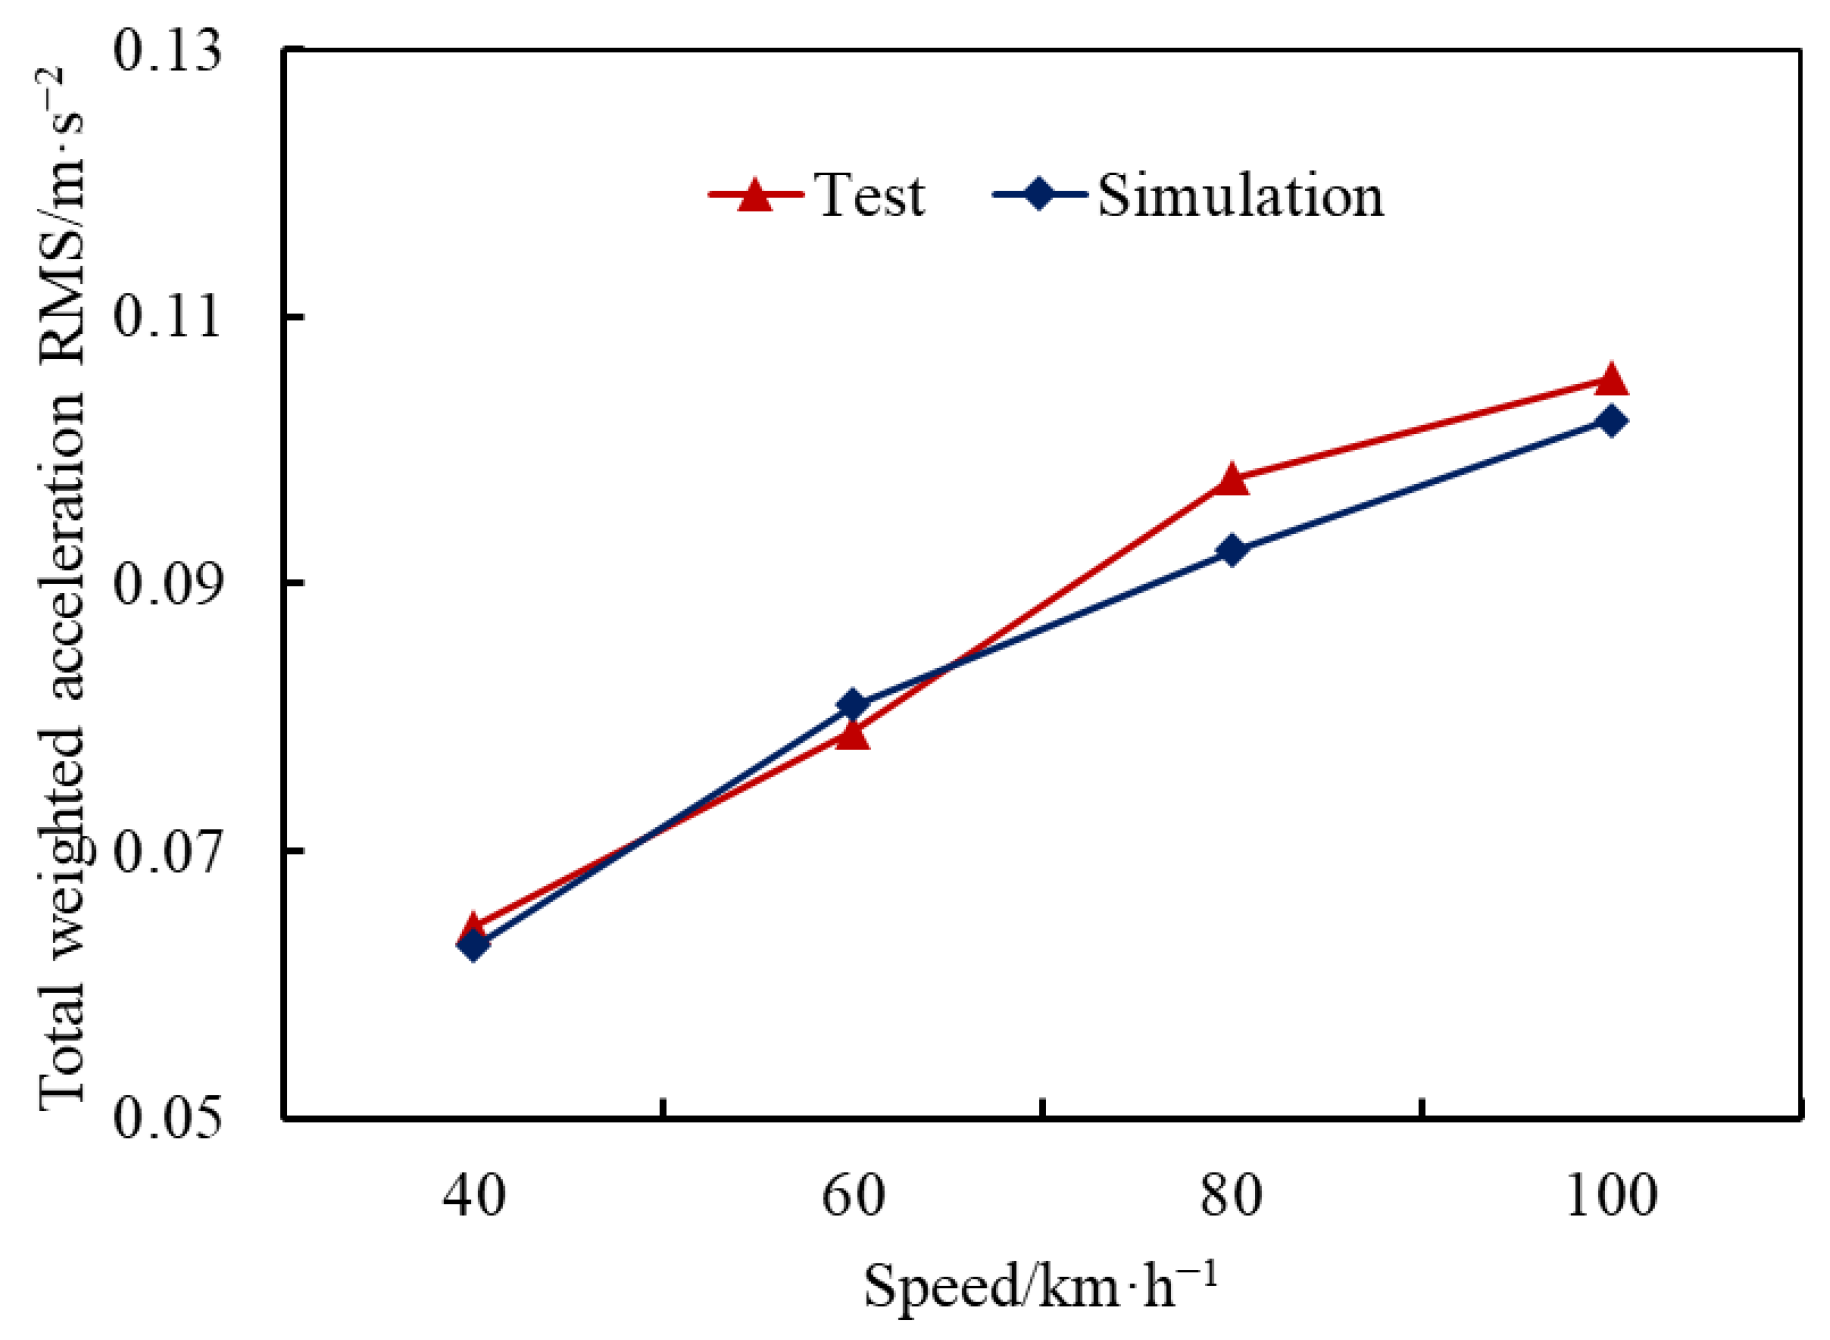
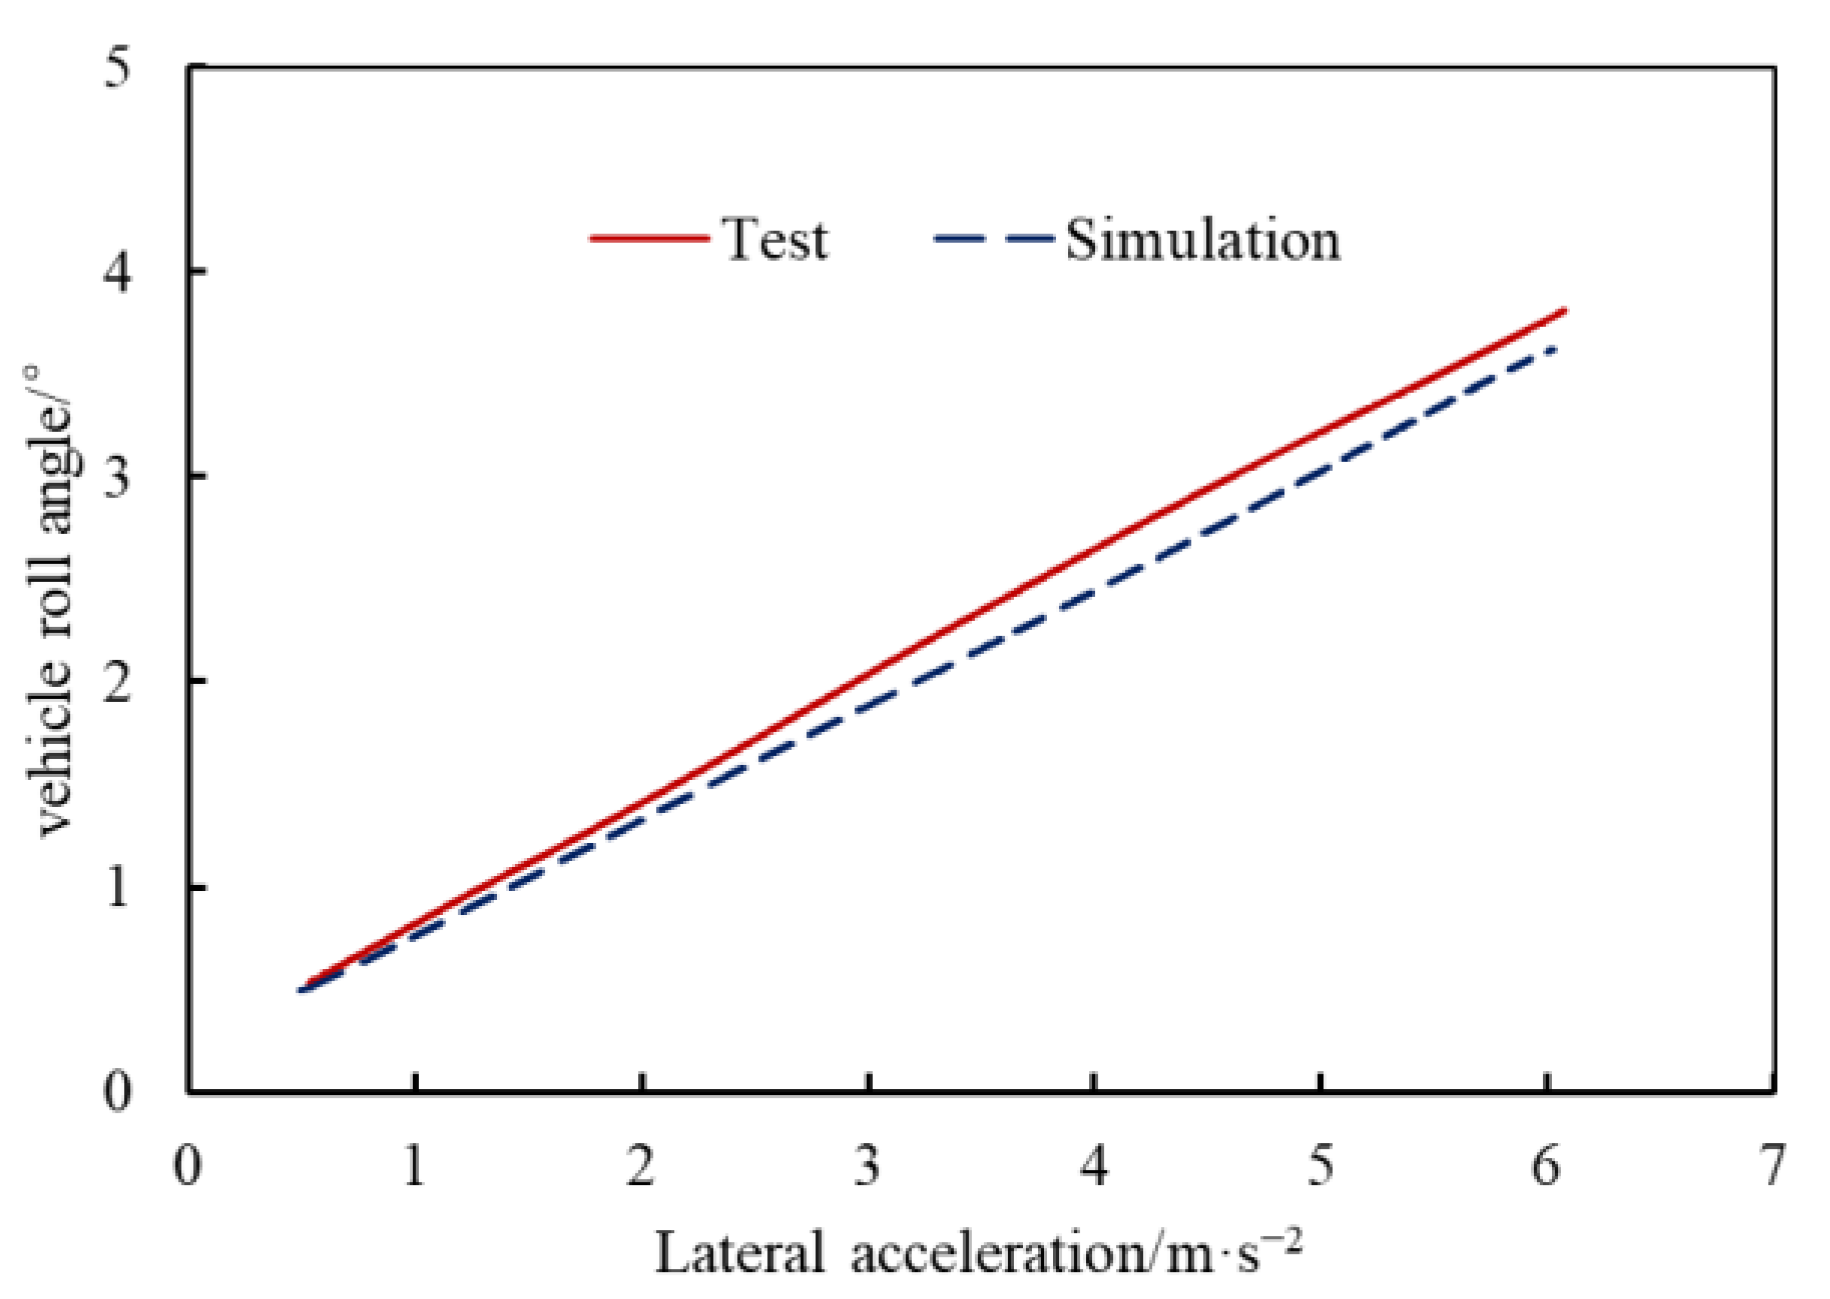
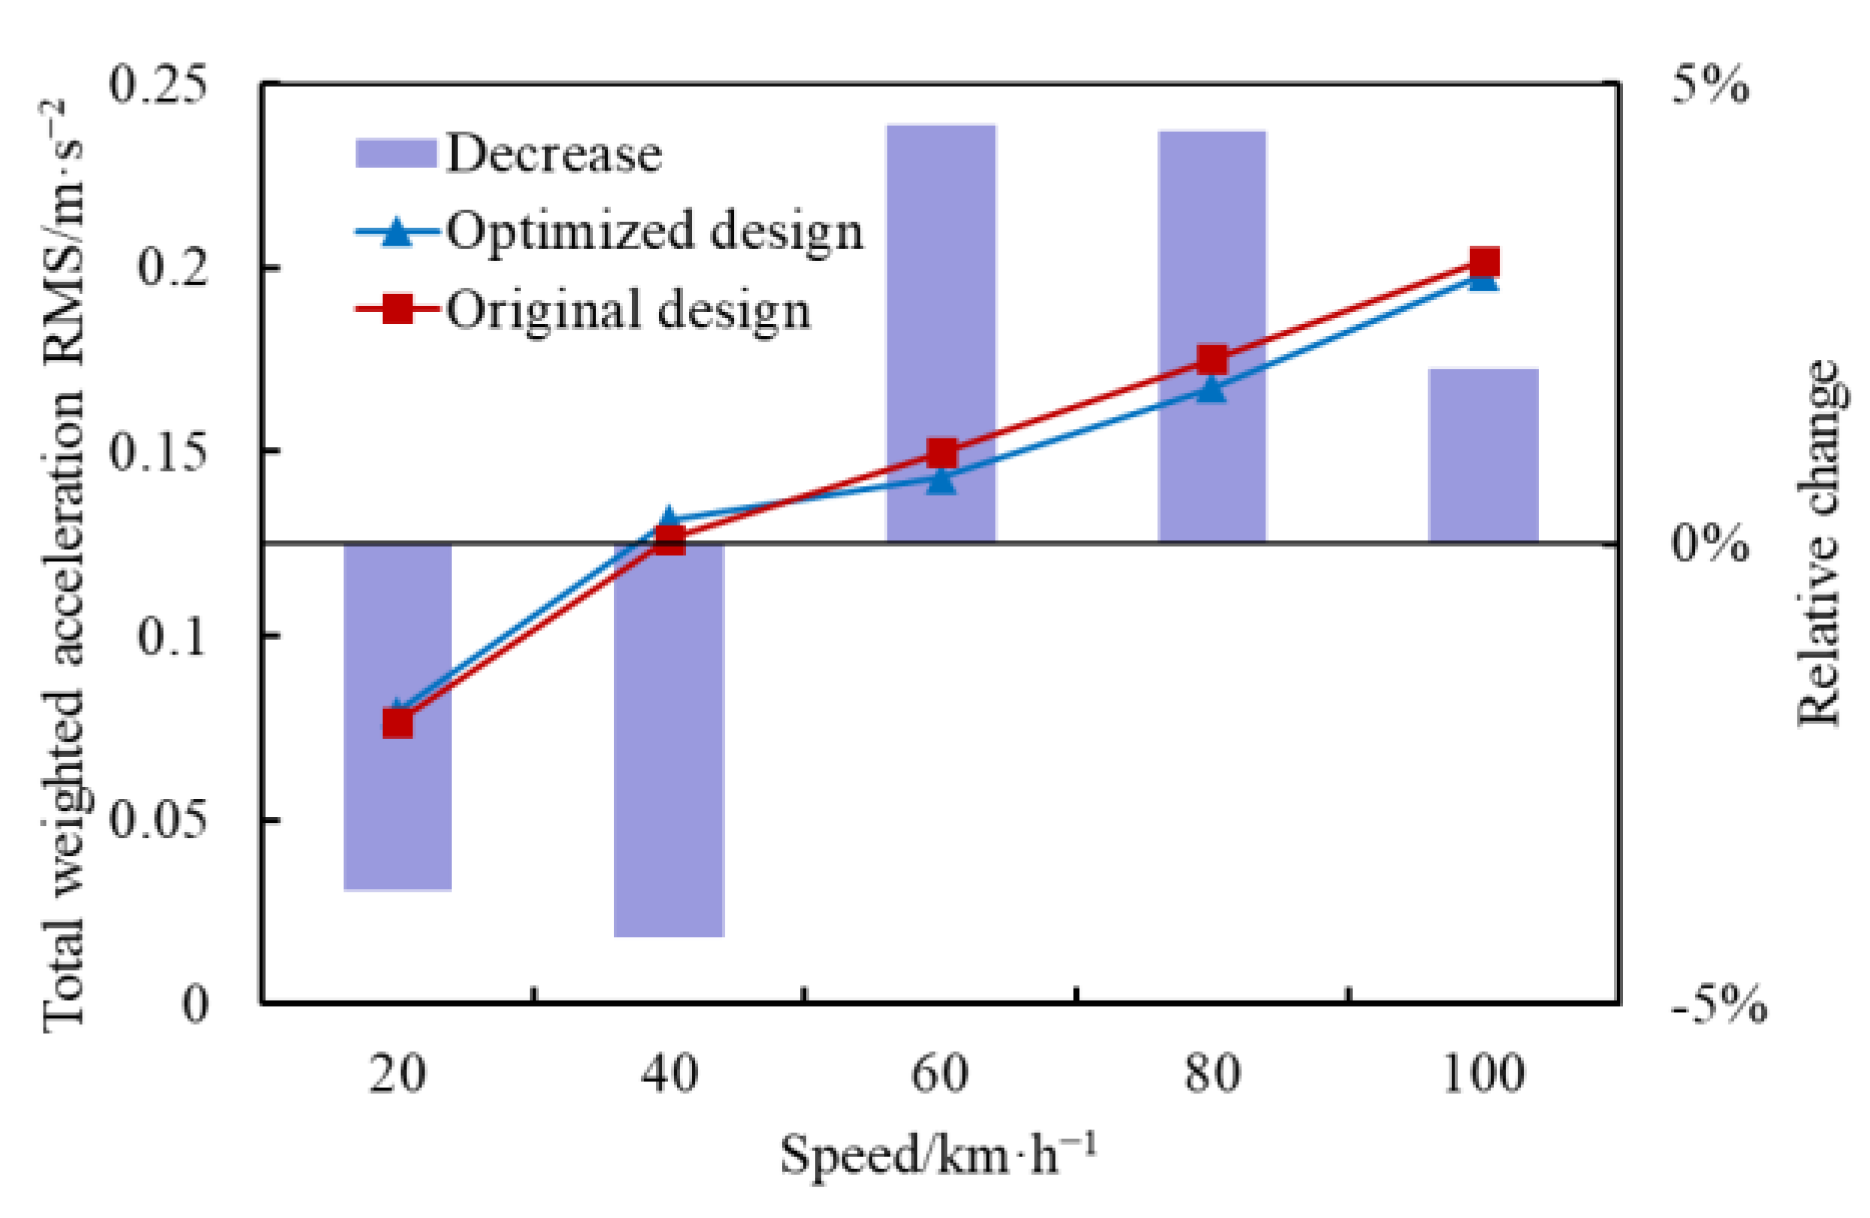
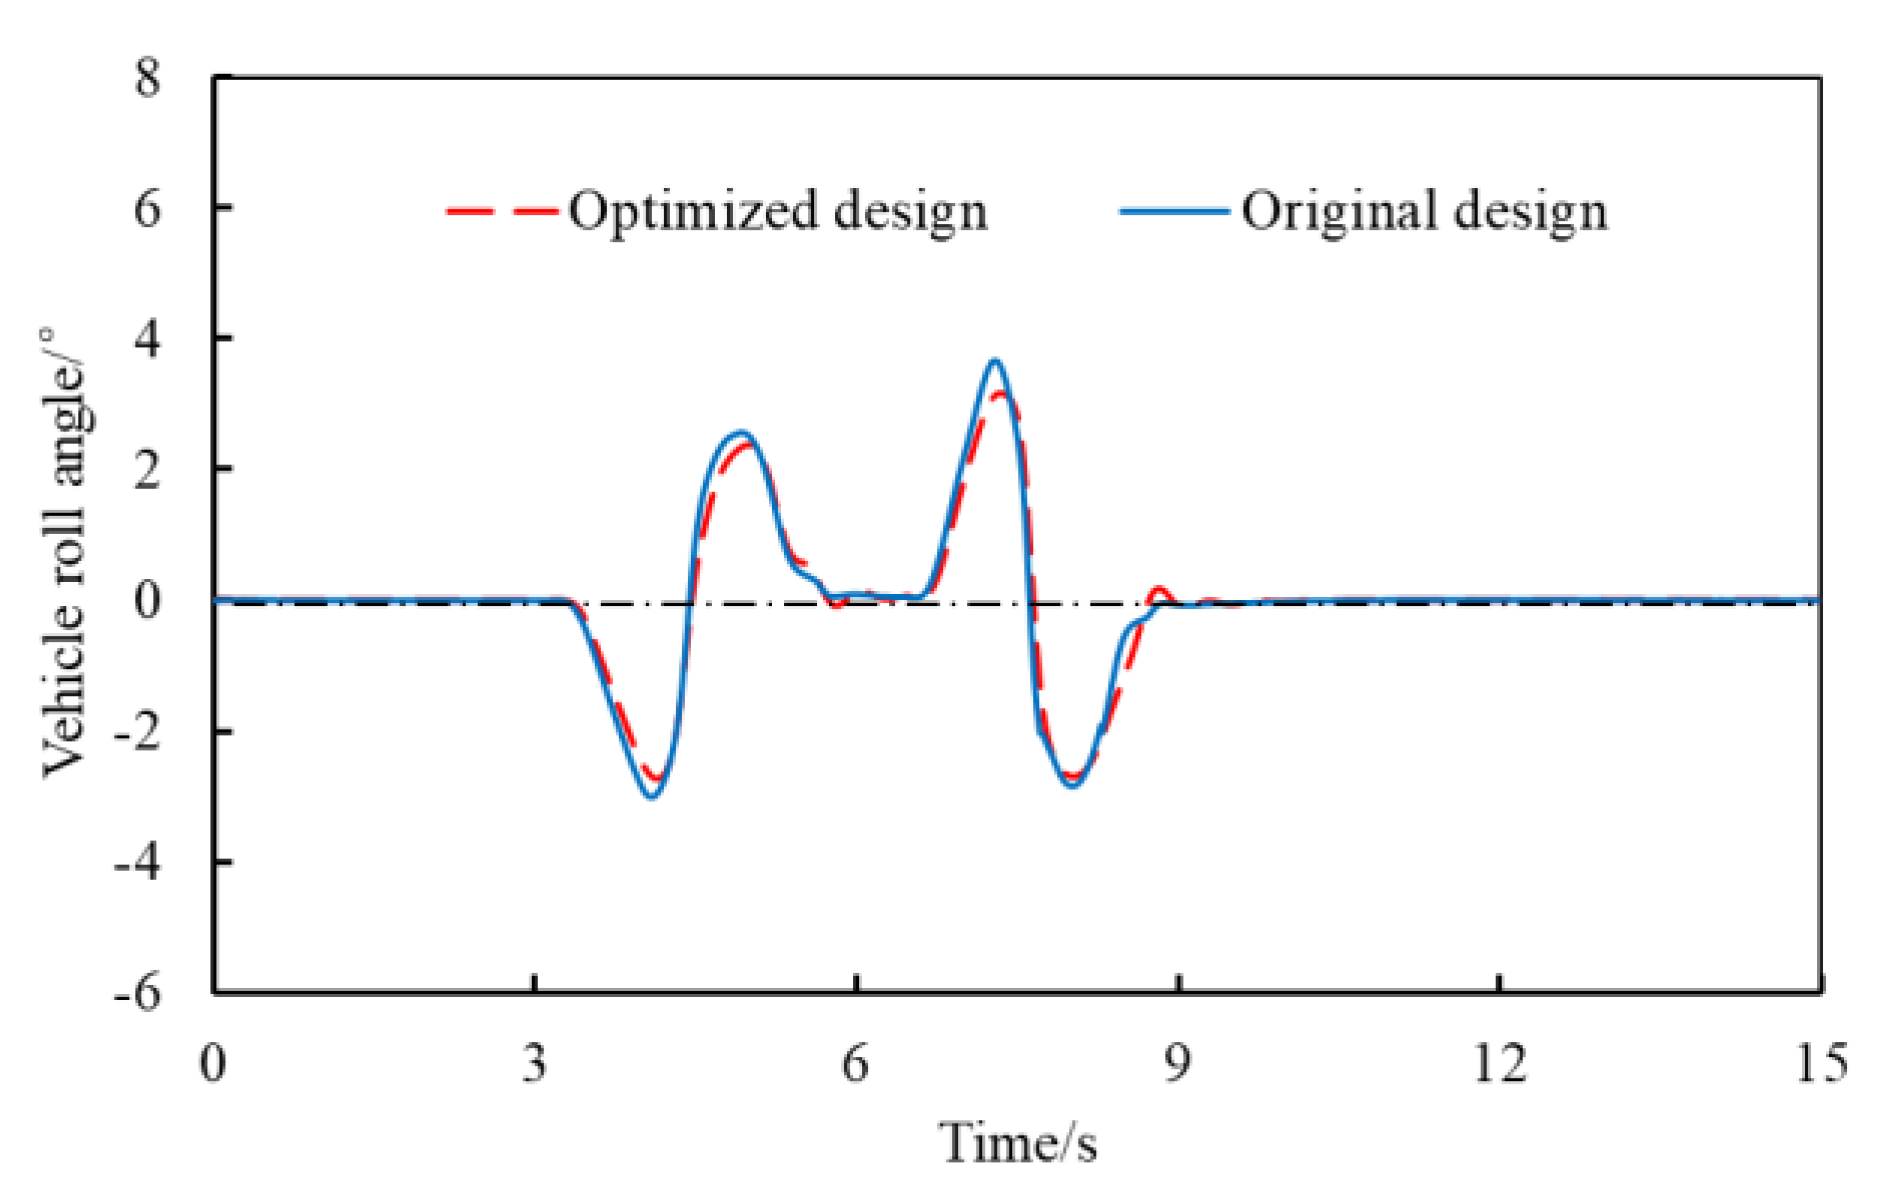
5.3. Vehicle Dynamic Performance

The optimized control arm and torsion beam are assembled into the rigid–flexible coupling vehicle model to investigate the change trend of vehicle dynamic performance consisting of ride comfort and handling stability. The ride comfort simulations are carried out with vehicle speed of 20, 40, 60, 80, and 100 km/h, under grade B road excitation. For evaluating ride comfort, the total weighted root mean square of seat rail acceleration of optimized design is compared with the original design, as shown in Figure 13. It is observed that after optimization, the total weighted RMS of seat rail acceleration increases slightly when the vehicle speed is less than 50 km/h, and the maximum relative change is 4.28%. However, as the vehicle speed is greater than 50 km/h, the acceleration RMS gets a slight decrease, with maximum relative change of 4.49%. It means that the ride comfort achieves some improvement for high-speed condition after the lightweight design of control arm and torsion beam.
After the optimization of control arm and torsion beam, double lane change simulation is adopted to study the handling stability. The vehicle roll angle of optimized design and original design is compared in Figure 14. Obviously, the maximum vehicle roll angle of optimized design decreases slightly with respect to the original design. It means that the lightweight design of the control arm and torsion beam makes improvement in vehicle handling stability.

6. Conclusions

In this paper, the lightweight design method of suspension components is study based on multi-objective optimization algorithm and surrogate model by considering structural performance and vehicle dynamics. The parameterized models of the control arm and torsion beam are first developed to define the design variables based on mesh morphing technology. The lightweight design problem is formulated with three conflicting objectives, including total weight of control arm and torsion beam, total weighted root mean square of seat rail acceleration for evaluating ride comfort, and maximum vehicle roll angle for handling stability evaluation. The structural performance, such as fatigue life, stiffness, and modal frequency, are considered as constraints as well. Subsequently, the Kriging models are constructed to describe the relations between design variables and responses. The NSGA-II algorithm is then adopted to identify the Pareto front. The lightweight design scheme is determined from these non-dominated solutions by balancing the weight and vehicle dynamic performance.
By comparing optimized and original design scheme, it is concluded that the lightweight design of the control arm and torsion beam not only achieves a remarkable mass reduction, but also gets some improvement for structural performance and vehicle dynamic performance. The proposed lightweight method is proved to be feasible and effective for simultaneous lightweight design of front and rear suspension components.

Author Contributions

Conceptualization, R.J. and D.W.; Methodology, software, validation, R.J. and Z.J.; Writing—original draft preparation, writing—review and editing, R.J., Z.J. and D.L. All authors have read and agreed to the published version of the manuscript.

Funding

This research is funded by National Natural Science Foundation of China (grant no. 51805286), and Shandong Province Natural Science Foundation (grant no. 2017PEE004).

Institutional Review Board Statement

Not applicable.

Informed Consent Statement

Not applicable.

Conflicts of Interest

The authors declare no conflict of interest.

References

  1. Cavazzuti, M.; Baldini, A.; Bertocchi, E.; Costi, D.; Torricelli, E.; Moruzzi, P. High performance automotive chassis design: A topology optimization based approach. Struct. Multidiscip. Optim. 2011, 44, 45–56. [Google Scholar] [CrossRef]
  2. Ozcanli, M.; Yilmaz, M. Effect of foam application in bus structure for conservation of residual space during rollovers. Int. J. Heavy Veh. Syst. 2014, 21, 56–63. [Google Scholar] [CrossRef]
  3. Del Pero, F.; Berzi, L.; Antonacci, A.; Delogu, M. Automotive Lightweight Design: Simulation Modeling of Mass-Related Consumption for Electric Vehicles. Machines 2020, 8, 51. [Google Scholar] [CrossRef]
  4. Yu, L.; Gu, X.; Qian, L.; Jiang, P.; Wang, W.; Yu, M. Application of tailor rolled blanks in optimum design of pure electric vehicle crashworthiness and lightweight. Thin Wall. Struct. 2021, 161, 107410. [Google Scholar] [CrossRef]
  5. Miao, B.R.; Luo, Y.X.; Peng, Q.M.; Qiu, Y.Z.; Chen, H.; Yang, Z.K. Multidisciplinary design optimization of lightweight carbody for fatigue assessment. Mater. Des. 2020, 194, 108910. [Google Scholar] [CrossRef]
  6. Jiang, R.; Zhang, T.; Sun, H.; Liu, D.; Chen, H.; Wang, D. Study on lightweighting of CFRP bumper beam using entropy-based TOPSIS approach. Automot. Eng. 2021, 43, 421–428. [Google Scholar]
  7. Paz, J.; Díaz, J.; Romera, L.; Costas, M. Crushing analysis and multi-objective crashworthiness optimization of GFRP honeycomb-filled energy absorption devices. Finite Elem. Anal. Des. 2014, 91, 30–39. [Google Scholar] [CrossRef] [Green Version]
  8. Velea, M.N.; Wennhage, P.; Zenkert, D. Multi-objective optimisation of vehicle bodies made of FRP sandwich structures. Compos. Struct. 2014, 111, 75–84. [Google Scholar] [CrossRef] [Green Version]
  9. Duan, L.; Li, G.; Cheng, A.; Sun, G.; Song, K. Multi-objective system reliability-based optimization method for design of a fully parametric concept car body. Eng. Optimiz. 2017, 49, 1247–1263. [Google Scholar] [CrossRef]
  10. Li, Z.; Yu, Q.; Zhao, X.; Chen, J.; Fan, Q. Crashworthiness and lightweight optimization for frontal structure of automobile under low-speed impact. China J. Highw. Transp. 2016, 29, 149–158. [Google Scholar]
  11. Wang, D.; Mao, A.; Niu, Y.; Wei, J.; Shi, X. Lightweight multi-objective optimization design for body frame of pure electric large bus based on topology optimization. China J. Highw. Transp. 2017, 30, 136–143. [Google Scholar]
  12. Sharma, B. CAE driven multi disciplinary optimization of vehicle systems and sub systems. SAE Tech. Pap. 2014, 2014, 0804. [Google Scholar]
  13. Wang, D.; Jiang, R.; Wu, Y. A hybrid method of modified NSGA-II and TOPSIS for lightweight design of parameterized passenger car sub-frame. J. Mech. Sci. Technol. 2016, 30, 4909–4917. [Google Scholar] [CrossRef]
  14. Lian, Z. Study on Multi-Objective Optimization of a Coach Retrofit Design Based on the Mesh Morphing Method. Master’s Thesis, Jilin University, Changchun, China, 2015. [Google Scholar]
  15. Fang, J.; Gao, Y.; Wang, J.; Wang, Y. Multi-objective shape optimization of body-in-white based on mesh morphing technology. Chin. J. Mech. Eng. 2013, 48, 119–126. [Google Scholar] [CrossRef]
  16. Wang, Y.; Fang, J.; Wang, J.; Tian, L. A research on the application of mesh morphing technology to car body retrofit design. Automot. Eng. 2012, 34, 847–851. [Google Scholar]
  17. Park, J.H.; Kim, K.J.; Lee, J.W.; Yoon, J.K. Light-weight design of automotive suspension link based on design of experiment. Int. J. Automot. Technol. 2015, 16, 67–71. [Google Scholar] [CrossRef]
  18. Gu, Z.; Mi, C.; Wang, Y.; Jiang, J. A-type frame fatigue life estimation of a mining dump truck based on modal stress recovery method. Eng. Fail. Anal. 2012, 26, 89–99. [Google Scholar] [CrossRef]
  19. Van der Auweraer, H.; Van Langenhove, T.; Brughmans, M.; Bosmans, I.; El Masri, N.; Donders, S. Application of mesh morphing technology in the concept phase of vehicle development. Int. J. Veh. Des. 2007, 43, 281–305. [Google Scholar] [CrossRef]
  20. Jiang, R.; Wang, D.; Qin, M.; Jiang, Y. Lightweight design of twist beam of rear suspension of passenger car based on fatigue life. J. Jilin Univ. (Eng. Technol. Ed.) 2016, 46, 35–42. [Google Scholar]
  21. Deb, K.; Pratap, A.; Agarwal, S.; Meyarivan, T. A fast and elitist multiobjective genetic algorithm: NSGA-II. IEEE Trans. Evolut. Comput. 2002, 6, 182–197. [Google Scholar] [CrossRef] [Green Version]
  22. Huang, W.; Huang, J.; Yin, C. Optimal Design and Control of a Two-Speed Planetary Gear Automatic Transmission for Electric Vehicle. Appl. Sci. 2020, 10, 6612. [Google Scholar] [CrossRef]
Figure 1. Parametric model of control arm.
Machines 09 00107 g001
Figure 2. Parametric model of torsion beam.
Machines 09 00107 g002
Figure 3. Free modal tests: (a) control arm; (b) torsion beam.
Machines 09 00107 g003
Figure 4. Rigid–flexible coupling vehicle model.
Machines 09 00107 g004
Figure 5. Total weighted RMS of seat rail acceleration.
Machines 09 00107 g005
Figure 6. Vehicle roll angle versus lateral acceleration.
Machines 09 00107 g006
Figure 7. Accuracy verification results of Kriging surrogate models: (a) weight of control arm; (b) weight of torsion beam; (c) total weighted acceleration RMS; (d) maximum vehicle roll angle.
Machines 09 00107 g007
Figure 8. NSGA-II algorithm schematic diagram.
Machines 09 00107 g008
Figure 9. Calculation of crowding distance.
Machines 09 00107 g009
Figure 10. Multi-objective optimization flowchart of lightweight design for suspension components.
Machines 09 00107 g010
Figure 11. Pareto front.
Machines 09 00107 g011
Figure 12. Fatigue life contours: (a) Control arm; (b) Torsion beam.
Machines 09 00107 g012
Figure 13. Total Weighted Acceleration RMS.
Machines 09 00107 g013
Figure 14. Comparison of vehicle roll angle under double lane change.
Machines 09 00107 g014
Table 1. Design variables of parametric model of control arm.
VariablesDescriptionDeformation ModeInitial ValueUpper LimitLower Limit
DV1/mmSide heightFree-form0−5.05.0
DV2Scaling of front widthControl block1.00.901.1
DV3Scaling of rear widthControl block1.00.901.1
DV4Scaling of small hole diameterFree-form1.00.901.1
DV5Scaling of big hole diameterFree-form1.00.901.1
DV6Scaling of groove lengthControl block1.00.951.05
DV7/mmGroove depthFree-form0−5.05.0
DV8/mmThickness 4.02.06.0
Table 2. Design variables of parametric model of torsion beam.
VariablesDescriptionDeformation ModeInitial ValuesUpper LimitLower Limit
DV9Scaling of beam widthControl block1.00.901.1
DV10Scaling of beam heightControl block1.00.901.1
DV11Scaling of bottom circle arcFree-form1.00.951.05
DV12Scaling of outer circle arcFree-form1.00.951.05
DV13Scaling of inner circle arcFree-form1.00.951.05
DV14V-beam lengthControl block0−10.010.0
DV15/mmTransition zone lengthControl block0−10.010.0
DV16/mmThickness 3.02.04.0
Table 3. Comparison between simulation results and test results of natural frequency.
OrderControl Arm/HzRelative ErrorTorsion Beam/HzRelative Error
SimulationTestSimulationTest
1212.0204.73.4%40.642.13.7%
2246.1235.74.2%65.768.54.3%
3396.9378.84.6%99.099.90.9%
4715.6674.15.8%102.3106.13.7%
5928.4909.52.0%137.2139.81.9%
6994.9970.22.5%169.1167.21.1%
Table 4. Optimization results of design variables.
Design VariableOptimal ResultsModified Value
DV1/mm3.35773.4
DV20.91090.91
DV31.05791.06
DV41.08941.09
DV51.03871.04
DV60.99140.99
DV7/mm−2.3306−2.3
DV8/mm3.53743.5
DV91.02271.02
DV100.96570.97
DV110.98780.99
DV121.02911.03
DV131.03281.03
DV14/mm−9.1089−9.1
DV15/mm3.09723.1
DV16/mm2.53292.5
Table 5. Comparison of structural stiffness between original and optimized design.
StiffnessOriginalOptimumVariation
Control armLongitudinal stiffness(kN/mm)3.763.05−0.71
Lateral stiffness(kN/mm)40.6034.84−5.76
Torsion beamTorsional stiffness(N·m/°)40.842.1+1.3
Table 6. Modal frequency comparison of original and optimized design.
ModeControl Arm/HzTorsion Beam/Hz
OriginalOptimumVariationOriginalOptimumVariation
1212.0224.7+12.740.644.1+3.5
2246.1328.4+82.365.786.8+21.1
3396.9502.6+105.799.0130.6+31.6
4715.6878.1+162.5102.3202.6+100.3
5928.41024.1+95.7137.2260.1+122.9
6994.91227.4+232.5169.1335.4+166.3
Publisher’s Note: MDPI stays neutral with regard to jurisdictional claims in published maps and institutional affiliations.

