Article

Optimizing Main Process Parameters When Conducting Powder-Mixed Electrical Discharge Machining of Hardened 90CrSi

1
Faculty of Mechanical Engineering, University of Economics—Technology for Industries, 456 Minh Khai Street, Vinh Tuy Ward, Hanoi 11622, Vietnam
2
Faculty of Mechanical Engineering, Thai Nguyen University of Technology, 3/2 Street, Tichluong Ward, Thai Nguyen City 251750, Vietnam
3
National Research Institute of Mechanical Engineering, Hanoi 511309, Vietnam
4
Faculty of Mechanical Engineering, Nguyen Tat Thanh University, 300A Nguyen Tat Thanh Street, Ward 13, District 4, Ho Chi Minh City 754000, Vietnam
*
Author to whom correspondence should be addressed.
Machines 2021, 9(12), 375; https://doi.org/10.3390/machines9120375
Submission received: 12 November 2021 / Revised: 16 December 2021 / Accepted: 17 December 2021 / Published: 20 December 2021
(This article belongs to the Section Advanced Manufacturing)

Abstract

:
In the current study, an optimization process of powder-mixed electrical discharge machining (PMEDM) process when machining cylindrically shaped parts made of hardened 90CrSi steel is reported. In this study, SiC powder was mixed into the Diel MS 7000 dielectric solution. Additionally, graphite was chosen as the electrode material. The multi-objective functions were minimizing the surface roughness (SR) and electrode wear rate (EWR) and maximizing the material removal rate (MRR). The used input parameters of the optimization process included the powder concentration, the pulse-on time, the pulse-off time, the pulse current, and the servo voltage. A combination between the Taguchi method and the grey relation analysis (GRA) method with the support of Minitab R19 software was used to design the experiment and analyze the results. It was found that the optimal set of process parameters that can satisfy the above responses are Cp of 0.5 g/L, Ton of 8 µs, Toff of 8 µs, IP of 5 A, and SV of 4 V.

1. Introduction

In order to remove the materials on the surfaces of mechanical parts made of difficult-to-cut materials, research communities and industry have successfully applied electrical discharge machining (EDM), an advanced machining process. Additionally, EDM is also able to generate complicated geometrical shapes. This operation has shown its advantages compared to those of traditional machining processes such as grinding [1,2,3,4,5,6,7,8,9,10,11,12,13,14]. In recent decades, EDM has been widely utilized in the automotive industry, aerospace, mold, and die made of conductive materials irrespective of the physical properties of machined materials. Nevertheless, it is noticed that the machinability of the EDM process is crucially limited by the low removing speed of materials or by the low material removal rate (MRR), bad surface quality, and the quick acceleration of tool wear. To solve the weakness of EDM, powder-mixed electrical discharge machining (PMEDM) has been proposed [15,16,17,18,19,20,21]. In this context, fine powder is mixed with the dielectric to satisfy the properties of EDM, e.g., high precision, better surface quality, and improving material removal rate.
It has been proven that the added powder has a strong effect on the dielectric fluid increase in the MRR [1,6,22]. W.S. Zhao et al. [6] conducted the experimental evaluation to test the influences of PMEDM on machining efficiency compared with traditional EDM operation. The surface roughness and machining efficiency resulting from both PMEDM and traditional EDM were measured and compared. It was revealed that the machining efficiency of PMEDM was smaller than that of traditional EDM. Inversely, in terms of the surface roughness, PMEDM exhibited a much smaller value than that generated by traditional EDM. This can be explained by the fact that in the case of PMEDM, the discharge gaps and passage are normally bigger than those of EDM machining, hence pulse discharge energy is much lost in discharge gaps. Moreover, ejecting force of discharge on the melted materials is reduced by extended discharge gaps. Finally, these reasons significantly impact the lower efficiency of PMEDM machining when compared to that of traditional EDM. On the other hand, the similar discharge parameters, and evenly distributed and “large and shadow” shaped etched cavities make better machining quality of PMEDM. With a similar purpose, Jeswani et al. [1] quantitatively investigated the effectiveness of mixing the powder into the traditional EDM process to increase MRR and reduce EWR. It has been found that adding 4 g of fine graphite powder per little of kerosene causes to augment MRR by 60%. This might be due to the reduction in the breakdown voltage of the kerosene dielectric generated by adding the powder. The advantages of PMEDM compared to traditional EDM machining have also been documented in other studies [10,17,23].
It should be noticed that PMEDM and traditional EDM processes have different machining characteristics, some parameters may be suitable to the former, but unreasonable to the latter. Hence, in order to get the proper set of parameters that can much better improve the advantages of PMEDM, there have been research works dealing with the optimization process [18,20,23,24,25]. Kanssal et al. [21] applied the response surface method to plan and analyze the experiments for optimizing the process parameters such as pulse-on time, duty cycle, peak current, and concentration of the silicon powder. The responses in this study are minimizing surface roughness and maximizing the material removal rate. It shows that peak current factor and concentration are the most influential parameters on MRR and SR. The reliability of the proposed method is confirmed by a small error percentage between predictions and experiments. In another study [20], the authors have similar conclusions about the most influential factors of the peak current and the concentration of the silicon powder. However, in this study, the responses selected were machining rate (MR), SR, and tool wear rate (TWR). The important impact of powder-mixed concentration was documented in some studies [5,17,23]. Regarding the materials of mixed powder, some kinds have been adopted in the research community such as SiC, silicon carbide, titanium, and aluminum [17,20,23,25]. When comparing the effectiveness of each mixed powder material, Narumiya et al. [2] reported that under suitably mastered machining conditions, surface quality resulting from aluminum and graphite powders is better than that generated by silicon powder in the dielectric. However, there have been few studies dealing with comparing the capability of each mixed powder material. The Taguchi method, analysis of variance (ANOVA), and response surface method have been widely adopted to optimize the process parameters in PMEDM machining [17,20,21,24] when single responses are required. However, in several studies, it is reported that the Taguchi method is combined with GRA [15] to solve the multi-objective responses. Recently, there have been a few studies on PMEDM when processing cylindrically shaped parts [15,26,27]. They have contributed to improving productivity and accuracy when machining tablet-shaped punches (Figure 1).
From the above analysis, it can be seen that there have been many studies on PMEDM so far. However, there has been no research on the optimization of the PMEDM process when machining cylindrically shaped parts with the use of graphite electrodes. Moreover, solving PMEDM with the multi-objective function is a crucial requirement in practice, but there have been few studies dealing with this issue type until now. In this work, an optimization process will be conducted to find the set of optimal main process parameters which can minimize SR and EWR, and maximize MRR. The input parameters are the powder concentration, the pulse-on time, the pulse-off time, the pulse current, and the servo voltage. The PMEDM cylindrical-shaped workpiece and the gray relation analysis (GRA) method combined with the Taguchi method for simultaneously solving multi-objective functions with the support of Minitab R19 software are used to design the experiment and analyze the results. The materials of mixed powder to the dielectric are SiC. The optimal set of main process parameters will be confirmed by experiments.

2. Experimental Setup and Optimization Methodology

2.1. Experimental Setup

The specimens in this study are prepared in a cylindrical shape and made of 90CrSi tool steel. The graphite electrodes, SiC powder with 100 nm size, and Diel MS7000 dielectric solution are adopted. The PMEDM process is conducted by a Sodick A30 EDM machine. The setup of the experiment is presented in Figure 2. The chosen input parameters and their investigated levels are listed in Table 1. Except for servo voltage with two levels, other parameters are investigated by three levels.
The Taguchi method and Minitab R19 software are utilized to design the experiment plans and analyze the results in which the design of L18 (2^1 + 3^4) is selected. For this reason, it has a total of 18 tests. The experimental results for each run are measured three times and presented in Table 2.

2.2. Optimization Methodology

The Taguchi method is a useful tool of experimental design and analysis. The experimental design introduced by Taguchi involved orthogonal arrays to organize the parameters that affect the process and the levels that need to be changed. The Taguchi method does not test for all possible combinations, but only a few. This testing will generate a key set of data that can determine which factors have the most impact on product quality with minimal testing to save time and money. However, the original Taguchi method has been designed to optimize a single performance characteristic. The treatment of many performance characteristics by the Taguchi method needs further investigation. In this study, MRR is a “higher-the-better” performance characteristic. Nevertheless, SR and EWR are “lower-the-better” performance characteristics. Consequently, an improvement of one performance characteristic may lead to a deterioration of another. Therefore, optimizing multiple performance characteristics is much more complex than optimizing a single performance characteristic. In this research, GRA is purposely applied to investigate the multiple performance characteristics in the PMEDM process.
GRA has been widely applied to evaluate the degree of relationship between sequences based on the gray relational grade. This method has also been applied to optimize the control parameters with multi-responses through the gray relational grade. Gray relational analysis is widely used to combine all the considered performance characteristics into a single value that can be used as the single characteristic in optimization problems. This advantage is impossible to obtain in other methods. The process of combination between Taguchi method and GRA will be detailed in the next part.

3. Multi-Objective Optimization

The responses in this study are minimizing SR and EWR, and maximizing MRR. As previously mentioned, with the single utilization of the Taguchi method it is impossible to get the multi-objective optimization with three requirements, hence, the GRA method and Taguchi method will be applied to simultaneously optimize the three above-stated targets. According to this combination, firstly the S/N ratio of SR, EWR, and MRR should be determined:
For   the   maximum   MRR : S / N = 10 log 10 ( 1 n i = 1 n 1 y i 2 )
For   the   minimum   SR   and   EWR :   S / N = 10 log 10 ( 1 n i = 1 n y i 2 )
The average values of S/N ratios of three responses are exhibited in Table 3.
In order to analyze gray relation based on the S/N ratio, the value of this ratio should be converted into a series compared to unitless quantities. Hence, the data have to be normalized. The determined values of S/N ratios are normalized by using Zi where 0 ≤ Zi ≤ 1 and:
Z i = S / N i min S / N i , i = 1 , 2 , , n max ( S / N i , i = 1 , 2 , , n ) min ( S / N i , i = 1 , 2 , , n )
where n is the number of experimental runs (n = 18). The calculated values of normalized Zi are shown in Table 4.
The gray relation coefficient yj(k) is identified by the following equation:
y i ( k ) = Δ min ( k ) + ζ . Δ max ( k ) Δ i ( k ) + ζ . Δ max ( k )   i = 1 ,   2 , ,   n
where n is the number of tests (n = 18); k is the number of output responses (k = 3); Δi(k) is the absolute value of reference value determined by: Δi(k) = ||Z0(k) – Zi(k)||; it is the absolute value of the difference between Z 0 k (reference value Z0(k) = 1) and Z i k ) (Z-value of the i t h experiment of the k t h target). Δmin(k) is the minimum value of i(k); max(k) is the maximum value of i(k); ζ is the discriminant coefficient, determined in the range 0 ≤ ζ ≤ 1, in experimental research ζ = 0.5.
The degree of gray relation can be calculated through the average gray relation value of the output objectives:
y i ¯ = 1 k j = 0 k y i j ( k )
where y i j is the gray relation value of the j t h output aims in the i t h experiment. The determined results of gray relation value y i and the average gray relation value y i ¯ of the experiments are shown in Table 5.

4. Result and Discussions

In order to ensure consistency among the output parameters, the average gray relation values should be higher-the-better. Therefore, the multi-objective function can be considered as a single objective function with the output being the average gray relation values. Taguchi method is applied to estimate the effects of the PMEDM process parameters on the average gray relation values. For that reason, the S/N ratio of y i ¯ can be calculated by Equations (1) and (2), and this series is analyzed by the ANOVA shown in Table 6.
There is the fact that the influencing degree of each parameter is represented by its p-value shown in Table 6. This means that one parameter has static significance when its p-value is minor to a confidence level of 0.05. Based on the results presented in Table 6, it is seen that P-values of IP, Toff, Ton, SV, and Cp are 0.000, 0.012, 0.014, 0.02, and 0.118, respectively. Except for the case of Cp having a p-value higher than 0.05, the remainder have static significance. The influencing order of process parameters on the average gray relation values y i ¯ is peak current (IP) of 74.18% (with the strongest influence), pulse-off time (Toff) of 7.88%, pulse-on time (Ton) of 7.59%, servo voltage (SV) of 3.64%, and finally powder concentration (CP) of 2.78%, which can be considered as non-static significance. This influencing order can be shown in tabular form as in Table 7.
It is realized that from Table 7 the influence order of input parameters on the average gray relation values are IP, Toff, T
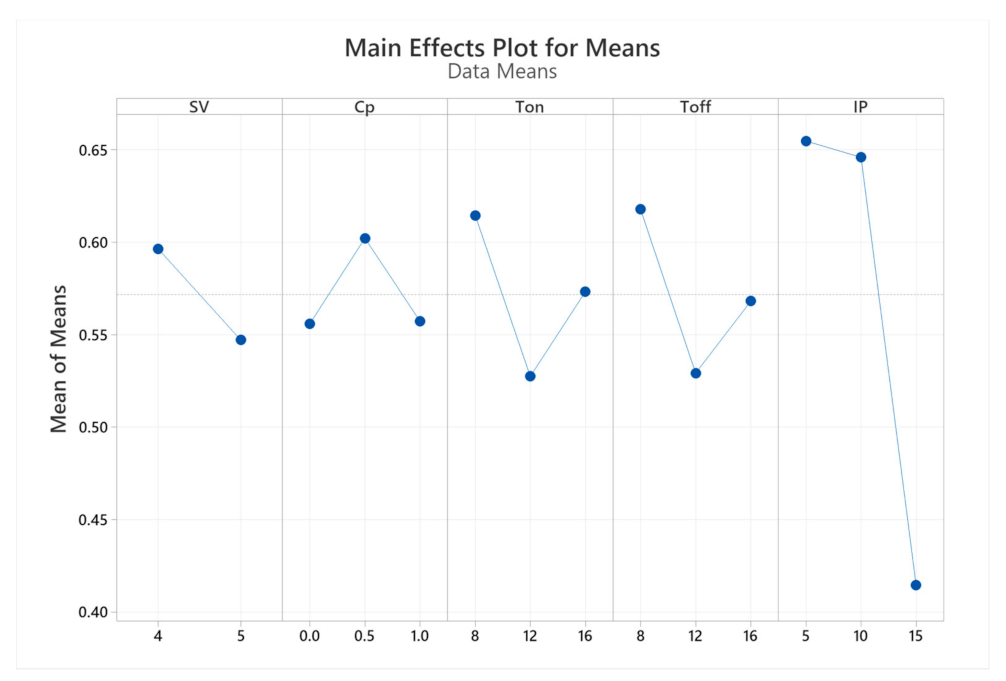
on, SV, and Cp. Moreover, this influence can be graphically described by using the main effects plot for means as exhibited in Figure 3.
In order to achieve a clearer understanding of the evolution of input parameters and the average gray relation values, the next part discusses the results presented in Figure 3. It is noticed that when SV is increased from 4 V to 5 V, the values of y i ¯ are reduced. For the powder concentration parameter, compared to unmixed powder (traditional EDM) the powder concentration of 0.5 g/L leads to an increase in y i ¯ . Nevertheless, y i ¯ is reduced when the powder concentration reaches 1 g/L. Regarding the two parameters of Ton and Toff, both have a similar varying tendency, e.g., when they are increased from 8 µs to 12 µs, y i ¯ lessens. However, y i ¯ increases when Ton and Toff come to 16 µs. Finally, for Pear current parameter, y i ¯ slightly decreases when IP is varied from 5 A to 10 A, and y i ¯ significantly declines when IP reaches 15 A. This is the factor with the strongest impact on y i ¯ .
It is noted that to determine the optimal set of process parameters, the effects of noise through the values of the S/N ratio should be considered. As the objective function of this study, in order to achieve the largest average gray relation value, the largest S/N value for each input parameter means that at that survey level it is less affected. The influence of the input parameters on the S/N ratio is described in Table 8.
As in the earlier analysis, the parameters have a statistical significance when their P-values are bigger than the confidence level of 0.05. Similarly, the influence order of parameters is identically observed as those presented in Table 6 where except for Cp, the others have statistical significance on the response. According to the analysis results in Table 8, IP parameters also have the greatest influence on the S/N ratio with 81.19%, followed by the influence of the following parameters: Toff (6.39%), Ton (5.34%), SV (2.4%), and Cp (1.66%), respectively. The influence order of the input parameters and the S/N ratio at the survey levels are shown in Table 9. Table 9 also shows that the influence order of input parameters is IP, Toff, Ton, SV, and Cp, respectively. At the same time, the S/N ratio of the input parameters through the survey levels is also clearly shown in Figure 4. From this chart in Figure 4, it is possible to determine the S/N value of each survey level of the input parameters and determine the maximum S/N value.
As analyzed above, the parameter set with the highest S/N value y ¯ for each input parameter is the most reasonable set of parameters. From the chart in Figure 4, the trend of influence of each input parameter on the S/N value is shown and the multi-objective optimal parameter set is determined, specifically in Table 10.

4.1. Validating the Optimal Set of Main Process Parameters

In order to confirm the optimal values of input parameters, experiments were conducted. The experimental values of SR, MRS, and EWR are presented in Table 11. It is observed that the error percents showing variation between predictions and experiments are small. For example, for SR the predicted and experimental values are 2.456 μm and 2.324 μm, respectively. This difference corresponds to the error percent of 5.38. The highest error percent belongs to EWR by 6.62%. For these results, it can be concluded that the suggested model is significantly confirmed and reliable.

4.2. Evaluating the Reliability of the Proposed Experimental Method

The experimental model is evaluated through error distribution charts as shown in Figure 5. It can be seen that in the normal distribution error distribution chart, the errors of the experimental points corresponding to the blue points on the distribution chart around the normal distribution line (red solid color line) indicate that the error is small. Histogram reveals the frequency of errors shows that the errors appear in the range −0.1 to 0.1, accounting for a large proportion. The remaining two graphs show the random distribution of experimental errors, which means that the built model is largely influenced by the selected input parameters and is not affected by the order of the experiment.

4.3. Evaluation of Mode Fit

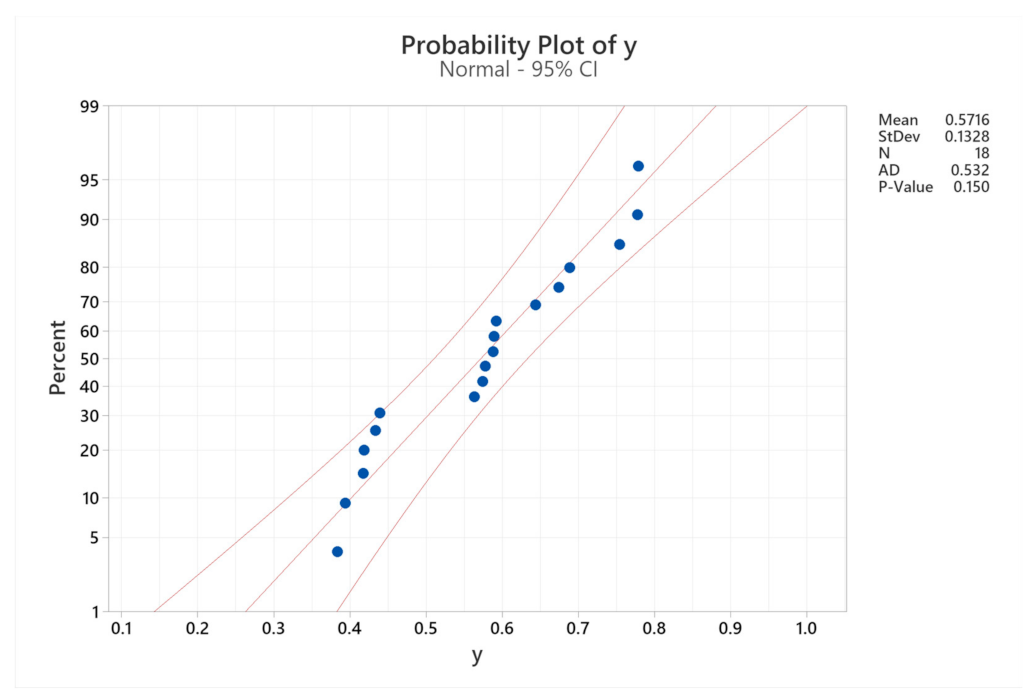
The appropriateness of the experimental model verified by the Anderson–Darling method in Figure 6 shows that the data corresponding to the experimental points (blue dots) are in the region bounded by two upper and lower bounds with the standard deviation of 95%. The P-value of 0.150 is greater than the value of α = 0.05. This indicates that the applied experimental model is suitable.

5. Conclusions

The optimal set of process parameters that can minimize surface roughness, electrode wear rate, and maximize material removal rate is found in this study. Powder-mixed electrical discharge machining (PMEDM) with SiC powder-mixed-dielectric of hardened 90CrSi steel is conducted. The used input parameters of the optimization process are the powder concentration, the pulse-on time, the pulse-off time, the pulse current, and the servo voltage. A combination of the Taguchi method and the grey relation analysis (GRA) method with the support of Minitab R19 software was used to design the experiment and analyze the results. The following conclusions can be made:
  • The results reveal that peak current has the strongest influence by 74.18% on the responses, pulse-off time (Toff) by 7.88%, pulse-on time (Ton) by 7.59%, servo voltage (SV) by 3.64%, and finally, powder concentration (CP) by 2.78% follow.
  • Thanks to the use of GRA, the three initial objective functions such as minimizing SR and EWR and maximizing MRR can be optimized through an average gray relation value of GRA to find an optimal set of input parameters. The optimal parameters of PMEDM are a powder concentration of 0.5 g/L, a pulse-on time of 8 µs, a pulse-off time of 8 µs, a peak current of 5 A, and a servo voltage of 4 V.
  • Experiments were carried out to confirm the optimal values of input parameters. It is revealed that the difference between the predicted values and experimental values of the responses is small. Hence, the proposed model is significantly confirmed and reliable.
  • The appropriateness of the experimental model is verified by the Anderson–Darling method. It shows that the applied experimental model is suitable.

Author Contributions

All authors have discussed the original idea. A.-T.N., M.-C.N., V.-T.N. and N.-P.V. designed and analyzed the experiment; D.-N.N. wrote this manuscript with support from X.-H.L., D.-P.P., Q.-H.T. and A.-T.N. All authors discussed the manuscript and gave critical feedback. N.-P.V. supervised this work and revised the paper. All authors have read and agreed to the published version of the manuscript.

Funding

This work was financially supported by the scientific project No. B2021-TNA-04.

Acknowledgments

The authors wish to thank the Thai Nguyen University of Technology for supporting this work.

Conflicts of Interest

The authors state no conflict of interest.

Nomenclature

PMEDMPowder-mixed electrical discharge machining
EDMElectrical discharge machining
SRSurface roughness
EWRElectrode wear rate
MMRMaterial removal rate
GRAGray relation analysis
ANOVAAnalysis of variance
CpPowder concentration
TonPulse-on time
Toff Pulse off time
IP Servo current
SV Servo voltage
yj(k)Gray relation coefficient
y i ¯ Average gray relation value

References

  1. Jeswani, M.L. Effect of the addition of graphite powder to kerosene used as the dielectric fluid in electrical discharge machining24. Wear 1981, 7, 133–139. [Google Scholar] [CrossRef]
  2. Narumiya, H.; Mohri, N.; Saito, N.; Otake, H.; Tsnekawa, Y.; Takawashi, T.; Kobayashi, K. EDM by powder suspended working fluid. In Proceedings of the 9th ISEM, Nagoya, Japan, 10–14 April 1989; pp. 5–8. [Google Scholar]
  3. Mohri, N.; Saito, N.; Higashi, M.; Kinoshita, N. A New Process of Finish Machining on Free Surface by EDM Methods. CIRP Ann. 1991, 40, 207–210. [Google Scholar] [CrossRef]
  4. Wong, Y.S.; Lim, L.C.; Rahuman, I.; Tee, W.M. Near-mirror-finish phenomenon in EDM using powder-mixed dielectric. J. Mater. Process. Technol. 1998, 79, 30–40. [Google Scholar] [CrossRef]
  5. Tzeng, Y.F.; Lee, C.Y. Effects of Powder Characteristics on Electrodischarge Machining Efficiency. Int. J. Adv. Manuf. Technol. 2001, 17, 586–592. [Google Scholar] [CrossRef]
  6. Zhao, W.S.; Meng, Q.G.; Wang, Z.L. The application of research on powder mixed EDM in rough machining. J. Mater. Process. Technol. 2002, 129, 30–33. [Google Scholar] [CrossRef]
  7. Ho, K.H.; Newman, S.T. State of the art electrical discharge machining (EDM). Int. J. Mach. Tools Manuf. 2003, 43, 1287–1300. [Google Scholar] [CrossRef]
  8. Kumar, A.; Maheshwari, S.; Sharma, C.; Beri, N. Research Developments in Additives Mixed Electrical Discharge Machining (AEDM): A State of Art Review. Mater. Manuf. Process. 2010, 25, 1166–1180. [Google Scholar] [CrossRef]
  9. Mondal, S.; Paul, C.P.; Kukreja, L.M.; Bandyopadhyay, A.; Pal, P.K. Application of Taguchi-based gray relational analysis for evaluating the optimal laser cladding parameters for AISI1040 steel plane surface. Int. J. Adv. Manuf. Technol. 2012, 66, 91–96. [Google Scholar] [CrossRef]
  10. Prayogo, G.S.; Lusi, N. Application of Taguchi technique coupled with grey relational analysis for multiple performance characteristics optimization of EDM parameters on ST 42 steel. In AIP Conference Proceedings; AIP Publishing LLC: Melville, NY, USA, 2016; p. 020061. [Google Scholar]
  11. Raut, V.; Gandhi, M.; Nagare, N.; Deshmukh, A. Application of Taguchi Grey Relational Analysis to optimize the process parameters in wire electrical discharge machine. Int. J. Innov. Sci. Eng. Technol. 2016, 3, 108–115. [Google Scholar]
  12. Muthuramalingam, T.; Saravanakumar, D.; Babu, L.G.; Huu Phan, N.; Pi, V.N. Experimental Investigation of White Layer Thickness on EDM Processed Silicon Steel Using ANFIS Approach. Silicon 2019, 1–7. [Google Scholar] [CrossRef]
  13. Markopoulos, A.P.; Papazoglou, E.-L.; Karmiris-Obratański, P. Experimental Study on the Influence of Machining Conditions on the Quality of Electrical Discharge Machined Surfaces of aluminum alloy Al5052. Machines 2020, 8, 12. [Google Scholar] [CrossRef] [Green Version]
  14. Le, V.T.; Banh, T.L.; Tran, X.T.; Nguyen, T.H.M.; Le, V.T. Studying the microhardness on the surface of SKD61 in PMEDM using tungsten carbide powder. Int. J. Mod. Phys. B 2020, 34, 2040164. [Google Scholar] [CrossRef]
  15. Tran, T.-H.; Nguyen, M.-C.; Luu, A.-T.; Do, T.-V.; Le, T.-Q.; Vu, T.-T.; Tran, N.-G.; Do, T.-T.; Vu, N.-P. Electrical Discharge Machining with SiC Powder-Mixed Dielectric: An Effective Application in the Machining Process of Hardened 90CrSi Steel. Machines 2020, 8, 36. [Google Scholar] [CrossRef]
  16. Le Xuan, H.; Tran Thanh, H.; Vu Ngoc, P. A Study on Modelling Surface Finish in Electrical Discharge Machining Tablet Shape Punches Using Response Surface Methodology. J. Environ. Sci. Eng. B 2017, 6. [Google Scholar] [CrossRef] [Green Version]
  17. Long, B.T.; Phan, N.H.; Cuong, N.; Jatti, V.S. Optimization of PMEDM process parameter for maximizing material removal rate by Taguchi’s method. Int. J. Adv. Manuf. Technol. 2016, 87, 1929–1939. [Google Scholar] [CrossRef]
  18. Ojha, K.; Garg, R.K.; Singh, K.K. Parametric Optimization of PMEDM Process using Chromium Powder Mixed Dielectric and Triangular Shape Electrodes. J. Miner. Mater. Charact. Eng. 2011, 10, 1087. [Google Scholar] [CrossRef]
  19. Kansal, H.K.; Singh, S.; Kumar, P. Technology and research developments in powder mixed electric discharge machining (PMEDM). J. Mater. Process. Technol. 2007, 184, 32–41. [Google Scholar] [CrossRef]
  20. Kansal, H.K.; Singh, S.; Kumar, P. Performance parameters optimization (multi-characteristics) of powder mixed electric discharge machining (PMEDM) through Taguchi’s method and utility concept. IJEMS 2006, 13, 209–216. [Google Scholar]
  21. Kansal, H.K.; Singh, S.; Kumar, P. Parametric optimization of powder mixed electrical discharge machining by response surface methodology. J. Mater. Process. Technol. 2005, 169, 427–436. [Google Scholar] [CrossRef]
  22. Uno, Y.; Okada, A. Surface Generation Mechanism in Electrical Discharge Machining with Silicon Powder Mixed Fluid. Int. J. Electr. Mach. 1997, 2, 13–18. [Google Scholar]
  23. Singh, P.; Kumar, A.; Beri, N.; Kumar, V. Influence of electrical parameters in powder mixed electric discharge machining (PMEDM) of hastelloy. J. Eng. Res. Stud. 2010, 1, 93–105. [Google Scholar]
  24. Al-Khazraji, A.; Amin, S.A.; Ali, S.M. The effect of SiC powder mixing electrical discharge machining on white layer thickness, heat flux and fatigue life of AISI D2 die steel. Eng. Sci. Technol. Int. J. 2016, 19, 1400–1415. [Google Scholar] [CrossRef] [Green Version]
  25. Razak, M.A.; Abdul-Rani, A.M.; Nanimina, A.M. Improving EDM Efficiency with Silicon Carbide Powder-Mixed Dielectric Fluid. Int. J. Mater. Mech. Manuf. 2015, 3, 40–43. [Google Scholar] [CrossRef]
  26. Ky, L.H.; Danh, B.T.; Cuong, N.V.; Hong, T.T.; Vinh, N.T.; Nguyen, T.Q.D.; Le, T.P.T.; Cuong, N.M. Effect of input parameters on electrode wear in PMEDM cylindrical shaped parts. In Key Engineering Materials; Trans Tech Publications Ltd.: Bäch, Switzerland, 2020; pp. 136–142. [Google Scholar]
  27. Hong, T.T.; Cuong, N.V.; Danh, B.T.; Ky, L.H.; Linh, N.H.; Lien, V.T.; Vinh, N.T.; Cuong, N.M. Multi-Objective Optimization of PMEDM Process of 90CrSi Alloy Steel for Minimum Electrode Wear Rate and Maximum Material Removal Rate with Silicon Carbide Powder. In Materials Science Forum; Trans Tech Publications Ltd.: Bäch, Switzerland, 2021; pp. 51–58. [Google Scholar]
Figure 1. Tablet-shaped punches made by the EDM process [15].
Machines 09 00375 g001
Figure 2. Experimental setup of PMEDM machining.
Machines 09 00375 g002
Figure 3. The effects of input parameters on the average gray relation values.
Machines 09 00375 g003
Figure 4. Effect of parameters on the S/N value of y ¯ .
Machines 09 00375 g004
Figure 5. Residual plots for y ¯ .
Machines 09 00375 g005
Figure 6. Probability graph of the fit of the experimental model for y ¯ .
Machines 09 00375 g006
Table 1. Input factors and their levels.
No.Input ParametersCodeUnitLevel
123
1Powder concentrationCpg/L00.51
2Pulse-on timeTonμs81216
3Pulse-off timeToffμs81216
4Servo currentIPA51015
5Servo voltageSVV45-
Table 2. Input parameters and experimental results.
No.Input FactorsRa (μm)MRS (g/h)EWR (g/h)
CpSpTonToffSVTrail 1Trail 2Trail 3Trail 1Trail 2Trail 3Trail 1Trail 2Trail 3
10.088542.0092.1351.9790.7510.7150.7260.05410.05530.0533
20.012121042.9473.0052.8321.2381.5311.2630.05770.05270.0559
30.016161547.6357.7767.7013.9163.9733.7790.04650.04400.0474
40.5881041.9982.1002.1090.7790.8130.8060.08880.08950.0991
50.512121544.8634.8875.0117.0647.1716.9740.01460.01490.0141
60.51616546.9546.8376.9980.8260.8020.8120.31970.32570.3153
71.0812541.8892.0221.9851.4031.4001.3900.03120.02950.0292
81.012161042.7982.6492.8673.9323.8133.7160.14340.14510.1440
91.01681544.5544.5374.5984.3854.1884.6610.03870.03980.0390
100.08161553.6023.5193.5827.0436.9766.8900.00590.00630.0061
110.0128554.7894.9524.7821.9871.8791.9650.20150.19460.1895
120.016121053.6893.7583.7211.4281.4111.4450.07130.06320.0675
130.58121552.9512.8562.8016.9907.0537.2580.00500.00450.0052
140.51216554.0014.1774.1992.0872.5632.3350.19950.19650.1969
150.51681052.8642.8982.9651.1581.3601.2260.19350.19090.1922
161.08161051.6871.6351.7011.9762.2302.0580.03890.04180.0409
171.01281553.4673.5973.6327.2127.0167.0860.02980.02780.0290
181.01612553.0022.9602.8952.4202.6552.6180.11570.11790.1161
Table 3. Average values and S/N of SR, EWR, and MRR.
No.Input FactorsRa (μm)EWR (g/h)MRR (g/h)
CpTonToffIpSVMeanS/NMeanS/NMeanS/N
10.088542.0410−6.20160.0542525.31140.73061−2.7320
20.012121042.9280−9.33400.0554625.11481.344092.4522
30.016161547.7040−17.73460.0459426.75223.8894411.7920
40.5881042.0690−6.31780.0924620.66920.79922−1.9511
50.512121544.9203−13.84060.0145236.75777.0694116.9860
60.51616546.9297−16.81470.320229.89020.81356−1.7941
71.0812541.9653−5.87230.0299630.46601.397842.9090
81.012161042.7713−8.85850.1441716.82253.8203611.6351
91.01681544.5630−13.18510.0391828.13704.4114412.8666
100.08161553.5677−11.04810.0060944.30016.9693916.8628
110.0128554.8410−13.69980.1952314.18651.943475.7639
120.016121053.7227−11.41730.0673423.42391.428223.0947
130.58121552.8693−9.15760.0049346.12697.1003417.0222
140.51216554.1257−12.31190.1976514.08202.328297.2484
150.51681052.9090−9.27580.1922214.32391.247931.8666
161.08161051.6743−4.47810.0405027.84782.088146.3624
171.01281553.5653−11.04370.0288530.79317.1045717.0291
181.01612552.9523−9.40430.1165618.66892.564528.1581
Table 4. The calculated values of normalized Zi.
TTS/NZi
RaEWRMRSRaEWRMRS
Reference Values
1.0001.0001.000
1−6.201625.3114−2.73200.87000.57441.0000
2−9.334025.11482.45220.63370.57990.7377
3−17.734626.752211.79200.00000.53470.2650
4−6.317820.6692−1.95110.86120.70250.9605
5−13.840636.757716.98600.29370.25860.0022
6−16.81479.8902−1.79410.06941.00000.9525
7−5.872330.46602.90900.89480.43220.7145
8−8.858516.822511.63510.66960.80870.2730
9−13.185128.137012.86660.34320.49650.2106
10−11.048144.300116.86280.50440.05040.0084
11−13.699814.18655.76390.30440.88140.5701
12−11.417323.42393.09470.47650.62650.7051
13−9.157646.126917.02220.64700.00000.0003
14−12.311914.08207.24840.40910.88430.4949
15−9.275814.32391.86660.63810.87760.7673
16−4.478127.84786.36241.00000.50440.5398
17−11.043730.793117.02910.50470.42320.0000
18−9.404318.66898.15810.62840.75770.4489
Table 5. Values of Δi (k) and GRA of responses y i ¯ .
TTΔi (k)Grey Relation Values y y i ¯
RaEWRMRSRaEWRMRS
10.13000.42560.00000.7940.5401.0000.778
20.36630.42010.26230.5770.5430.6560.592
31.00000.46530.73500.3330.5180.4050.419
40.13880.29750.03950.7830.6270.9270.779
50.70630.74140.99780.4150.4030.3340.384
60.93060.00000.04750.3501.0000.9130.754
70.10520.56780.28550.8260.4680.6370.644
80.33040.19130.72700.6020.7230.4070.578
90.65680.50350.78940.4320.4980.3880.439
100.49560.94960.99160.5020.3450.3350.394
110.69560.11860.42990.4180.8080.5380.588
120.52350.37350.29490.4890.5720.6290.563
130.35301.00000.99970.5860.3330.3330.418
140.59090.11570.50510.4580.8120.4970.589
150.36190.12240.23270.5800.8030.6820.689
160.00000.49560.46021.0000.5020.5210.674
170.49530.57681.00000.5020.4640.3330.433
180.37160.24230.55110.5740.6740.4760.574
Table 6. Effects of process parameters on average gray relation values.
Analysis of Variance for Means
SourceDFSeq SSAdj SSAdj MSFPC (%)
SV10.0109140.0109140.0109147.410.0263.64
Cp20.0083390.0083390.0041702.830.1182.78
Ton20.0227580.0227580.0113797.730.0147.59
Toff20.0236490.0236490.0118258.030.0127.88
IP20.2224830.2224830.11124175.530.00074.18
Residual Error80.0117830.0117830.001473 3.93
Total170.299927
Model Summary
SR-SqR-Sq(adj)
0.038496.07%91.65%
Table 7. Influencing order of input parameters on the average gray relation values.
Response Table for Means
LevelSVCpTonToffIP
10.59630.55570.61440.61770.6546
20.54700.60210.52740.52910.6458
3 0.55710.57310.56810.4145
Delta0.04920.04630.08710.08860.2401
Rank45321
average gray relation values: 0.572
Table 8. Effect of parameters on the S/N ratio of the mean gray relation values.
Analysis of Variance for SN Ratios
SourceDFSeq SSAdj SSAdj MSFPC (%)
SV11.7631.7631.76276.370.0362.40
Cp21.2191.2190.60962.200.1731.66
Ton23.9193.9191.95967.080.0175.34
Toff24.6874.6872.34368.460.0116.39
IP259.58959.58929.7946107.610.00081.19
Residual Error82.2152.2150.2769 3.02
Total1773.392
Model Summary
SR-SqR-Sq(adj)
0.526296.98%93.59%
Table 9. Order of influence of input parameters S/N ratio of mean gray relation value.
Response Table for Signal to Noise Ratios
Larger is better
LevelSVCpTonToffIP
1−4.775−5.330−4.546−4.435−3.746
2−5.400−4.726−5.685−5.681−3.856
3 −5.207−5.033−5.147−7.660
Delta0.6260.6031.1391.2463.913
Rank45321
Table 10. The optimal set of the process parameters for PMEDM machining.
TTInput FactorsCodeUnitLevelOptimal Value
1Powder concentrationCpg/l20.5
2Pulse-on timeTonμs18
3Pulse-off timeToffμs18
4Peak currentIPA15
5Servo voltageSVV14
Table 11. Comparison of the optimal response values given predictions and experiments.
Input FactorsPredict ValueExperiment ValueError (%)
SVCpTonToffIPRaMRSEWRRaMRSEWRRaMRSEWR
40.58852.4561.630.0992.3241.7020.0925.384.426.62
Publisher’s Note: MDPI stays neutral with regard to jurisdictional claims in published maps and institutional affiliations.

