Article

Modeling of Material Removal Rate and Surface Roughness Generated during Electro-Discharge Machining

1
Department of Mechanical and Aerospace Engineering, Nazarbayev University, Nur-Sultan 010000, Kazakhstan
2
Department of Electrical & Computer Engineering, Nazarbayev University, Nur-Sultan 010000, Kazakhstan
*
Author to whom correspondence should be addressed.
Machines 2019, 7(2), 47; https://doi.org/10.3390/machines7020047
Submission received: 4 May 2019 / Revised: 28 May 2019 / Accepted: 5 June 2019 / Published: 20 June 2019

Abstract

:
This study reports on the numerical model development for the prediction of the material removal rate and surface roughness generated during electrical discharge machining (EDM). A simplified 2D numerical heat conduction equation along with additional assumptions, such as heat effect from previously generated crater on a subsequent crater and instantaneous evaporation of the workpiece, are considered. For the material removal rate, an axisymmetric rectangular domain was utilized, while for the surface roughness, a rectangular domain where every discharge resides at the end of previous crater was considered. Simulated results obtained by solving the heat equation based on a finite element scheme suggested that results are more realistic by considering instantaneous evaporation of the material from the workpiece and the effect of residual heat generated from each spark. Good agreement between our model and previously published data validated the newly proposed models and demonstrate that instantaneous evaporation, as well as residual heat, provide more realistic predictions of the EDM process.

1. Introduction

Electrical discharge machining (EDM) is a popular nonconventional machining process, which is capable of machining materials regardless of their hardness and strength. EDM is an electrothermal process, which erodes material as long as they possess some degree of electrical conductivity. In this process, due to an established electrical field between the workpiece and the tool, a plasma channel is generated in the gap. Ions and electrons in the plasma channel collide with the surfaces of the electrodes, which eventually results in localized heating of the surfaces. This highly intense heat flux results in a very high temperature at the surfaces, and consequently, melting and evaporation of material occurs. At the end of every discharge, part of the molten material is removed from the surface and is flushed away by the dielectric fluid, leaving behind a small crater. The remaining molten materials eventually resolidify and form a recast layer. Depending on the frequency, this process can happen several to hundreds of times in a second, thus creating multiple overlapping craters. Although the EDM process is a combination of different phenomena, such as dielectric break down, plasma formation, heat conduction, fluid dynamics, electrical phenomenon, chemical phenomenon, etc., thermal effects with a small error can be considered as the dominating phenomenon in the EDM process [1,2,3,4,5].
Many researchers have studied the EDM process through three different approaches; namely analytical, experimental, and numerical approaches. Van Dijck and Dutre [6] developed a two-dimensional model where the problem of heat conduction for both infinite and semi-infinite bodies with a constant heat source was solved. DiBitonto et al. [7] developed a point heat source cathode erosion model. Since spherical symmetry was considered in their model, the heat transfer equation in spherical coordinates was implemented. In their model, the constant cathode energy fraction of 0.183 was assumed. In their subsequent study [8], they developed an anode erosion model, by assuming a disk heat source. Beck et al. [9] developed a model to find the temperature distribution of a semi-infinite cylinder with a constant heat source and an insulated boundary. Since this model was not developed particularly for the EDM process, the heat fraction to the workpiece is not considered.
Process performances of EDM have been investigated by many researchers. D’Urso et al. [10] defined a process index based on process parameters and material properties to analyze the process and geometric indexes of micro-EDM process. D’Urso and Ravasio [11], based on a material-technology index (MTI), studied the process performance of micro-EDM. Tsai and Masuzawa [12] analyzed the electrode wear of different electrode materials in a micro-EDM process. Based on experimental results, a new wear resistance index based on modified boiling and melting points for the evaluation of erosion performance was proposed. Marafona and Araujo [13] proposed an additive model to investigate the influence of hardness on the material removal rate and surface roughness. Alshemary et al. [14] studied effects of different process parameters on fabricating cylindrical holes by wire-EDM. Mandal et al. [15] investigated the surface integrity of wire-EDM. They reported that both grinding and etching-grinding techniques removed the recast layer, and hence improved the surface integrity. Prakash et al. [16] proposed altering the EDM process for coating TiO2-TiC-NbO-NbC on Ti-64. They reported that this process improved the mechanical properties on the machined surface. Mahardika et al. [17] based on λ·θ theory (where λ is thermal conductivity and θ melting temperature) proposed a new theory for the determination of the ease of machining a workpiece by EDM. In Mahardika’s theory (λ·θ·ρ theory), electrical resistivity ρ is taken into account since an electric current transfers easily in lower electrical resistivity. Five new parameters for the measurement of the ease of machining in EDM were defined. According to Mahardika, λ·θ·ρ theory is better at predicting the ease of machining than λ·θ theory.
Numerical models are also applied to model the process via finite difference and finite element methods. Izquierdo et al. [18] have performed a numerical study based on the finite difference method. The temperature field was generated by considering the superposition of multiple discharges on the workpiece. By using inverse identification, they have estimated the material removal rate and surface roughness within a 6% error margin. Tlili et al. [19] developed a numerical model based on a finite difference scheme where they assumed instantaneous material removal during discharge. Marafona and Chousal [20] proposed a thermo-electrical model based on finite element method where they considered the Joule effect as a main heat generation mechanism in EDM. Shankar et al. [21] numerically analyzed the EDM process by solving for the electrical potential and heat transfer in the EDM process. Electro-thermal models based on the Joule effect were developed by Marofona et al. and Almacinha et al. [20,22]. Kansal et al. [23] performed simulations on powder-mixed EDM using Ansys finite element software. Assarzadeh and Ghoreishi [24] developed a more convincing model by considering more realistic assumptions such as Gaussian heat flux, temperature dependent material properties, latent heat of melting, and an expanding plasma channel. They reported that their model outperforms other previous thermal models. Jithin et al. [25] developed a model where the plasma flushing efficiency has been taken into account. Shabgard et al. [26] employed a finite element model (FEM) study to find the dependence of fraction of input energy to input parameters.
Very few works have been conducted on the modeling of surface roughness due to an EDM process. Kiran and Joshi [27] developed a theoretical model based on a single discharge cavity configuration to predict surface roughness generated by a micro-EDM process. Tan and Yeo [28] proposed a model for the evaluation of surface roughness using two distinct cases. Izquierdo et al. [18] proposed a very complex and elaborate 3D model based on the finite difference method where the effects of multiple sparks were considered. A theoretical model for the prediction of material removal rate (MRR) and surface roughness based on the crater generated from a single discharge was proposed by Salonitis et al. [29]. Their model predicts that both MRR and surface roughness increases with the increase of discharge current, voltage, and pulse duration.
In most of the modelling works of the EDM process, authors, for sake of simplicity, have tended to ignore many important aspects and parameters of the process. The evaporation of the material is one of the parameters usually ignored. In our work, we have focused, among the other aspects, on the evaporation of the material during discharge, and the remaining heat from previous discharges has been considered too. These parameters have been carefully evaluated and presented. Most important studies in the EDM process assume a single-discharge, while in an actual EDM process, multiple discharges happen that affect the EDM performance. In this study, new numerical models are developed for predicting the material removal rate and surface roughness of surfaces undergoing EDM as a function of process parameters separately. For MRR, a thermal model based on realistic assumptions, such as Gaussian heat distribution and instantaneous evaporation (IE), is developed. On the other hand, for surface roughness, the model is based on a simplified 2D numerical heat conduction equation where the heat effects of each discharge on subsequent discharges are taken into consideration.

2. Model Description

In this study, COMSOL Multiphysics 5.3 (COMSOL Inc., Burlington, MA, USA), a commercial finite element software package, was utilized for the modeling of heat transfer in the EDM process. For simplification, a 2-dimensional continuum was considered for the simulation. Two different set of simulations were performed, one for MRR and the other for surface roughness. For MRR prediction, a single discharge on the top surface of a cylindrical coordinate was implemented. However, for evaluation of the surface roughness, first, a single discharge at the edge of the rectangular computational domain was implemented. After creation of the first crater, the next discharge was positioned at the edge of the first crater. Afterward, the next discharge was applied at the edge of the second crater, and so on. This procedure for the first and second discharge is shown in Figure 1. In both sets of simulations, the melting temperature isotherm curve evaluated from the last time step of each simulation was considered as a boundary of the crater. Since the evaporated material was in gas form, it was expected to escape instantly, and evaporated material from the workpiece was constantly removed as the workpiece was heated, while the melted part was removed at the end of the simulation. A mesh with quadrilateral elements were generated using the COMSOL software. In order to achieve better accuracy for the evaluation of surface roughness, the top region of the computational domain, where craters were generated, smaller elements with a size of 0.25 μm were utilized. The total number of elements in the simulation was about 420,000.
In both sets of our numerical simulation, the following assumptions were made:
  • Gaussian heat flux with expanding plasma channel was considered.
  • Workpiece material was homogeneous and isotropic.
  • The primary mode of heat transfer was conduction. Heat transfer via radiation and convection was ignored.
  • Thermo-physical properties of material (i.e., thermal conductivity, density, and specific heat capacity were constant.
  • Effect of latent heat of fusion was taken into account.
  • In every cycle, only one discharge was assumed.
  • Required time for breakdown of dielectric fluid was considered equal to 500 ns as suggested by Almacinha et al. [22]
The only distinction in assumptions of both set of simulations was that the calculation of the surface roughness considered the residual heat transfer from previous discharges in the formation of the next crater.

2.1. Governing Equations

The Fourier heat transfer equation is utilized to model the process [30]:
1 α T t = 2 T
where T is temperature (K), α is thermal diffusivity (m2/s), ∇2 is Laplace operator and t is time (s). Thermal diffusivity is defined as [30]:
α = k ρ c p
where k, ρ, and cp are the thermal conductivity (W m−1 K−1), density (kg/m3), and heat capacity (J kg−1 K−1)of the material, respectively. For the first model, the Laplace operator in cylindrical coordinates was considered:
2 T = 1 r r ( r   T r ) + 2 T z 2
while for the second model, the simulation was performed in Cartesian coordinates:
2 T = 2 T x 2 + 2 T y 2

2.2. Heat Source

Different techniques to model the heat source have been proposed in the literature. DiBitonto [7] proposed a point heat source, while many researchers [2,6,9,31,32,33] have considered a uniform disk-like heat source. Results of the temperature measurement of the plasma channel have shown that the temperature distribution in the plasma channel is not uniform [18,34]. Many researchers [3,8,18,35,36] have considered a Gaussian heat distribution as a more realistic heat source model. A Gaussian heat distribution is based on the probability distribution function of a Gaussian distribution of variable r [37]:
p ( r ) = 1 σ 2 π e r 2 2 σ 2
where σ is the standard deviation of the distribution. Since 99.7% of values reside in three standard deviation, σ = Rp/3, therefore:
p ( r ) = 3 R p c 2 π e 4.5 r 2 R p c 2
In an EDM process, p(r) is heat flux distribution (Qw). If the maximum heat flux is Qmax, therefore:
Q w ( r ) = Q m a x e 4.5 r 2 R p c 2
The total energy applied over the surface can be calculated by integrating Equation (7):
A Q w ( r )   d A = 0 R p Q m a x e 4.5 r 2 R p c 2 2 π r   d r = 0.2197 π R p 2 Q m a x
On the other hand, this value is equal to the power applied to the workpiece:
F c I   V = 0.2197 π R p 2 Q m a x
It can be written as follows:
Q m a x = 4.57   F c I   V π R p 2
By substitution of Qmax from Equation (10) into Equation (8), the heat flux distribution is given as follows:
Q w ( r ) = 4.57   F c I   V π R p c 2 e 4.5 r 2 R p 2
when the discharge is applied at distance d from the origin, the Gaussian heat distribution is given by:
q ( r , t ) = 4.56   F c   V   I   π   R p ( t ) 2   exp ( 4.5   ( r d ) 2 R p ( t ) 2 )
where Fc, V, I, Rp are the energy fraction to the workpiece, discharge voltage, discharge current, and plasma radius, respectively. In Equation (12), d is the position where the spark is implemented.
The most important factor for simulating the EDM process is perhaps the fraction of energy that is transferred to the workpiece. There is a huge discrepancy in suggested values for the fraction of energy from 14% to 50%. In this research, a value of 0.183, which is suggested by DiBitonto et al. [3] and Yeo et al. [28] was used. Later, a numerical study by Izquierdo [18] reconfirmed this value to be a proper value.

2.3. Plasma Radius

Both constant and expanding plasma heating radii have been used by different researchers [18,19,20,24,38,39]. In this research, the following semi-empirical relation for “equivalent heat input radius,” proposed by Ikai and Hashiguchi [40], was used:
R p   =   2.04   I 0.43 t 0.44
where I is the discharge current in amperes, t is discharge time, and Rp is the plasma radius in micrometers.
For solving Equation (1), appropriate boundary conditions were required. Boundary conditions were as follows (see Figure 1):
For boundary A-B:
k   T y = { q ,   i f   x < R p 0 ,   i f   x > R p }
For boundary B-C and C-D and D-A:
T n = 0
where n is the normal vector.
Since the workpiece was in direct contact with a dielectric, the initial temperature in the computational domain was considered as the dielectric temperature:
T i = T
Latent heat of melting consumed a significant amount of the energy supplied to the electrode. Therefore, the latent heat of melting was taken into account by means of the effective heat capacity cp,eff.
c p , e f f = c p + λ Δ T
where λ is the latent heat of melting (J/kg) and ΔT is the temperature difference between the melting point of the material and dielectric temperature.

3. Results and Discussions

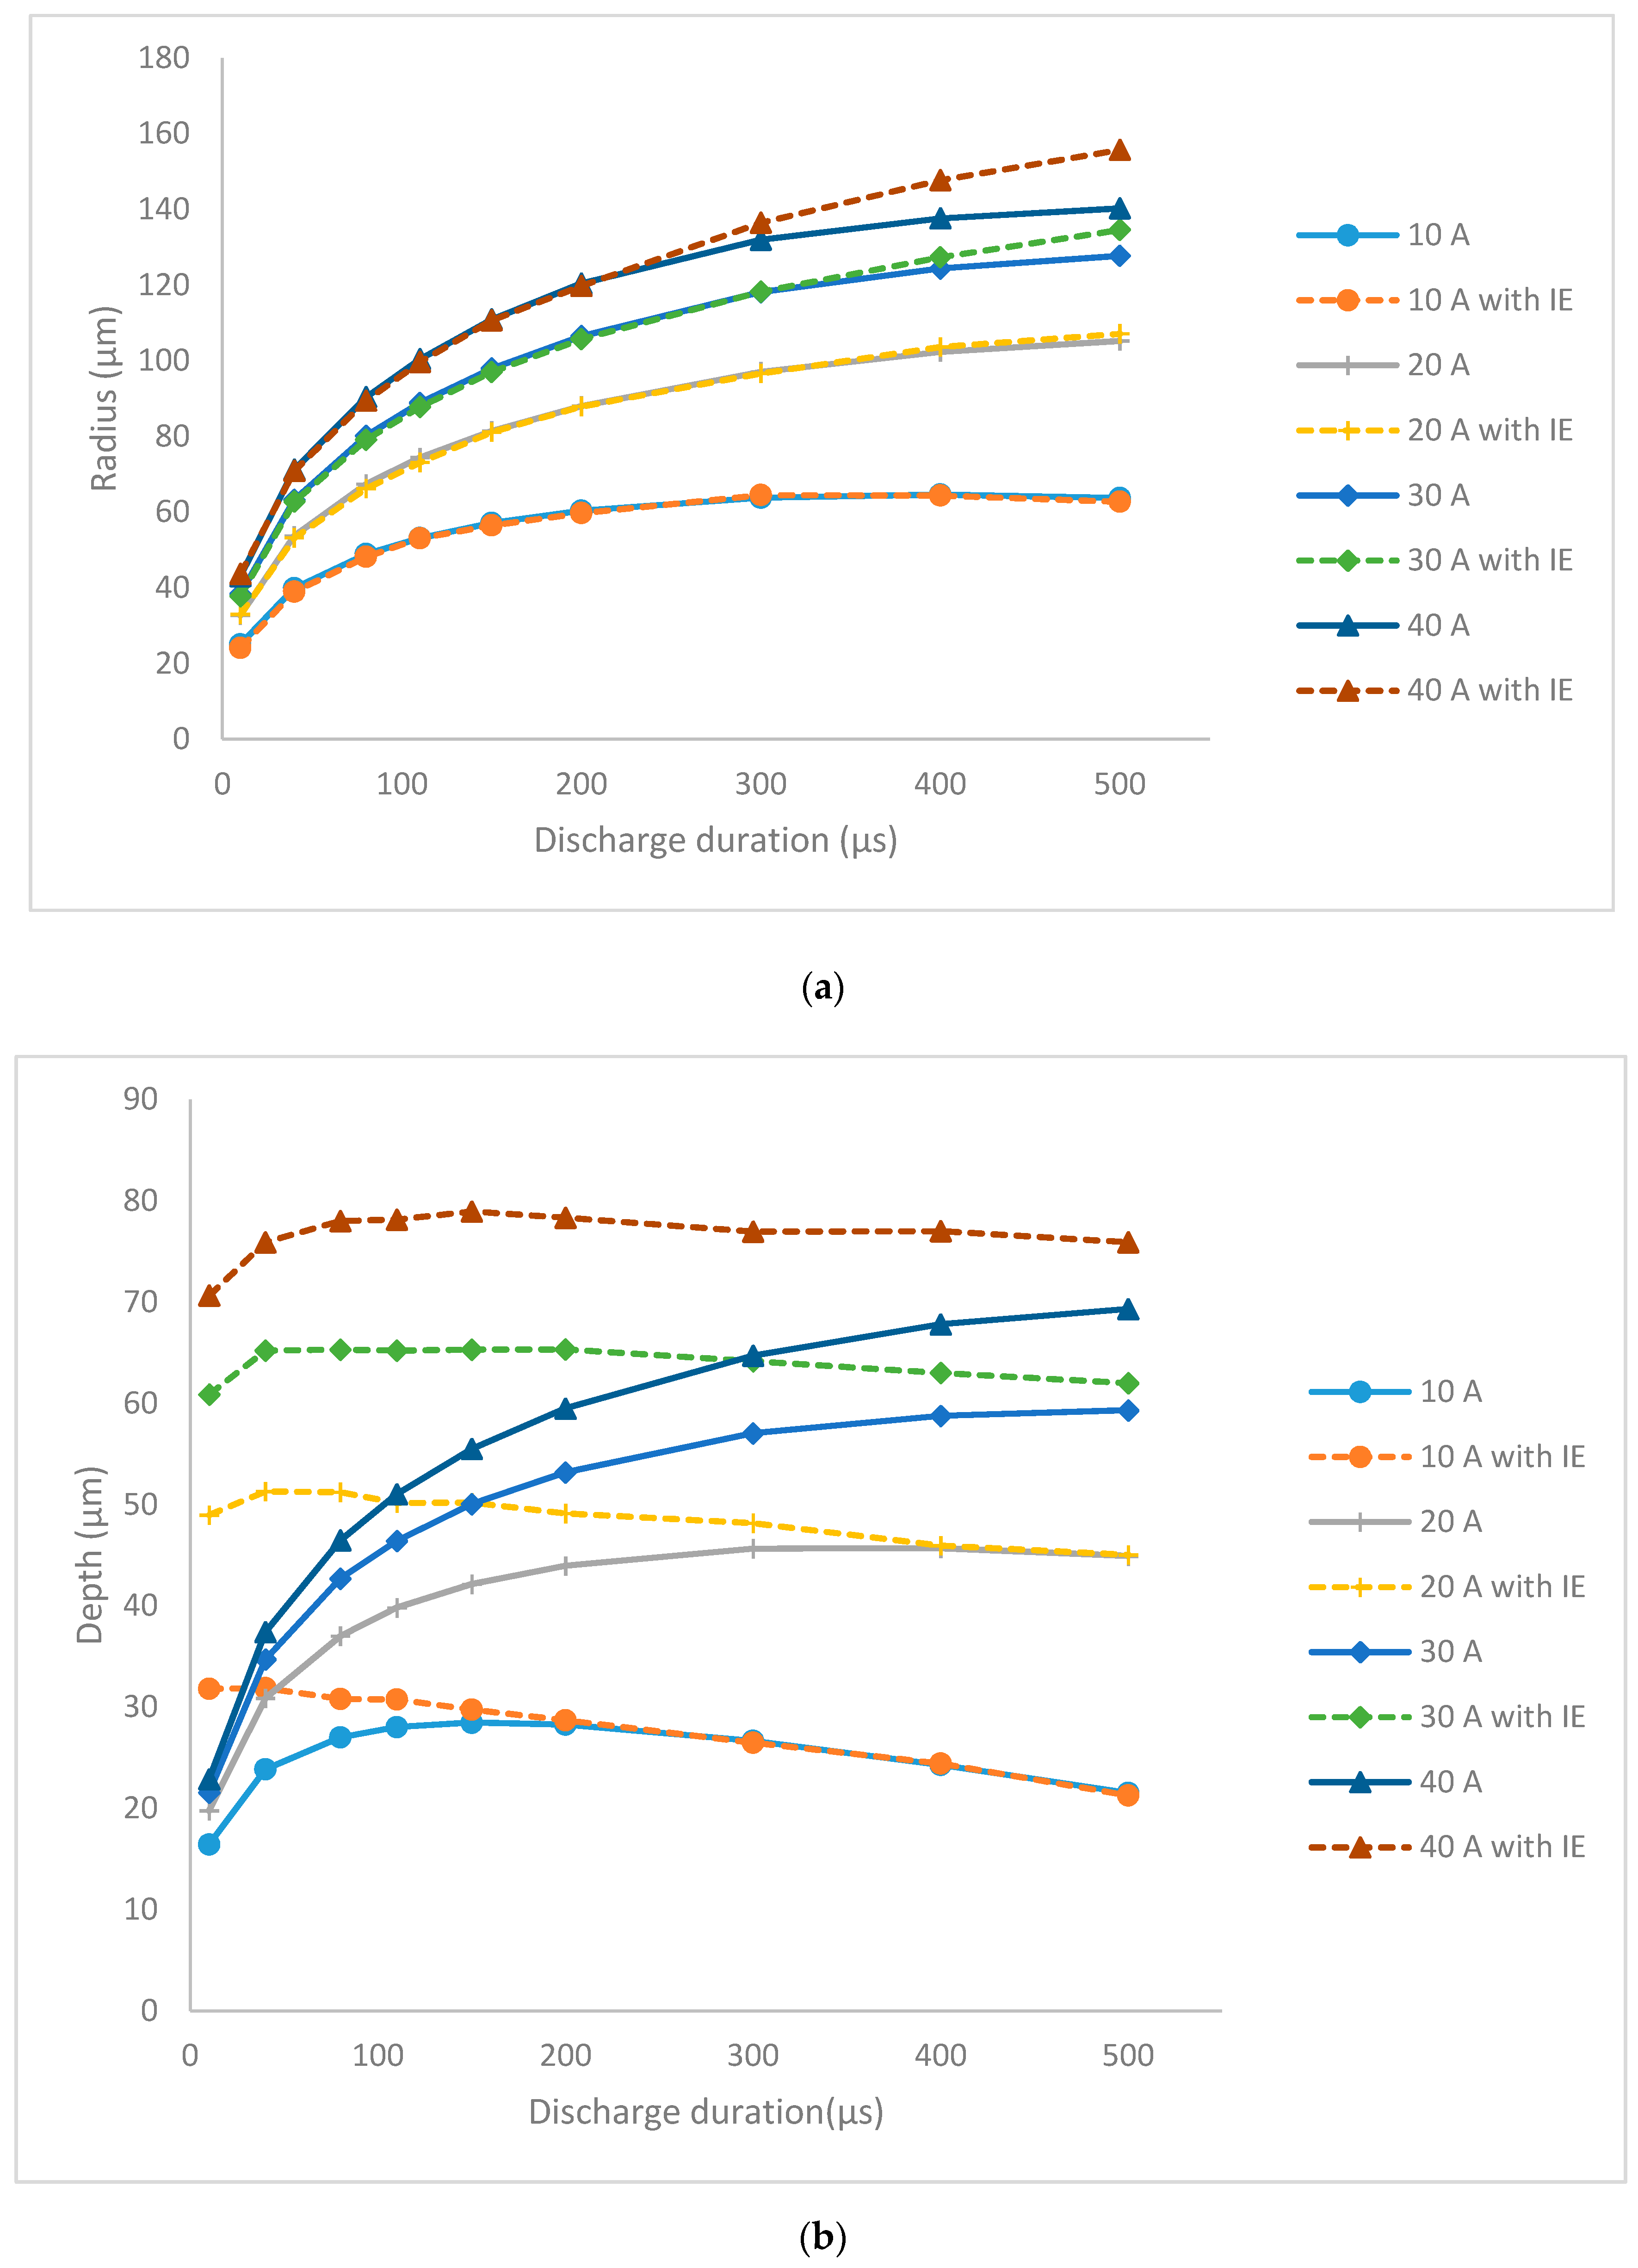
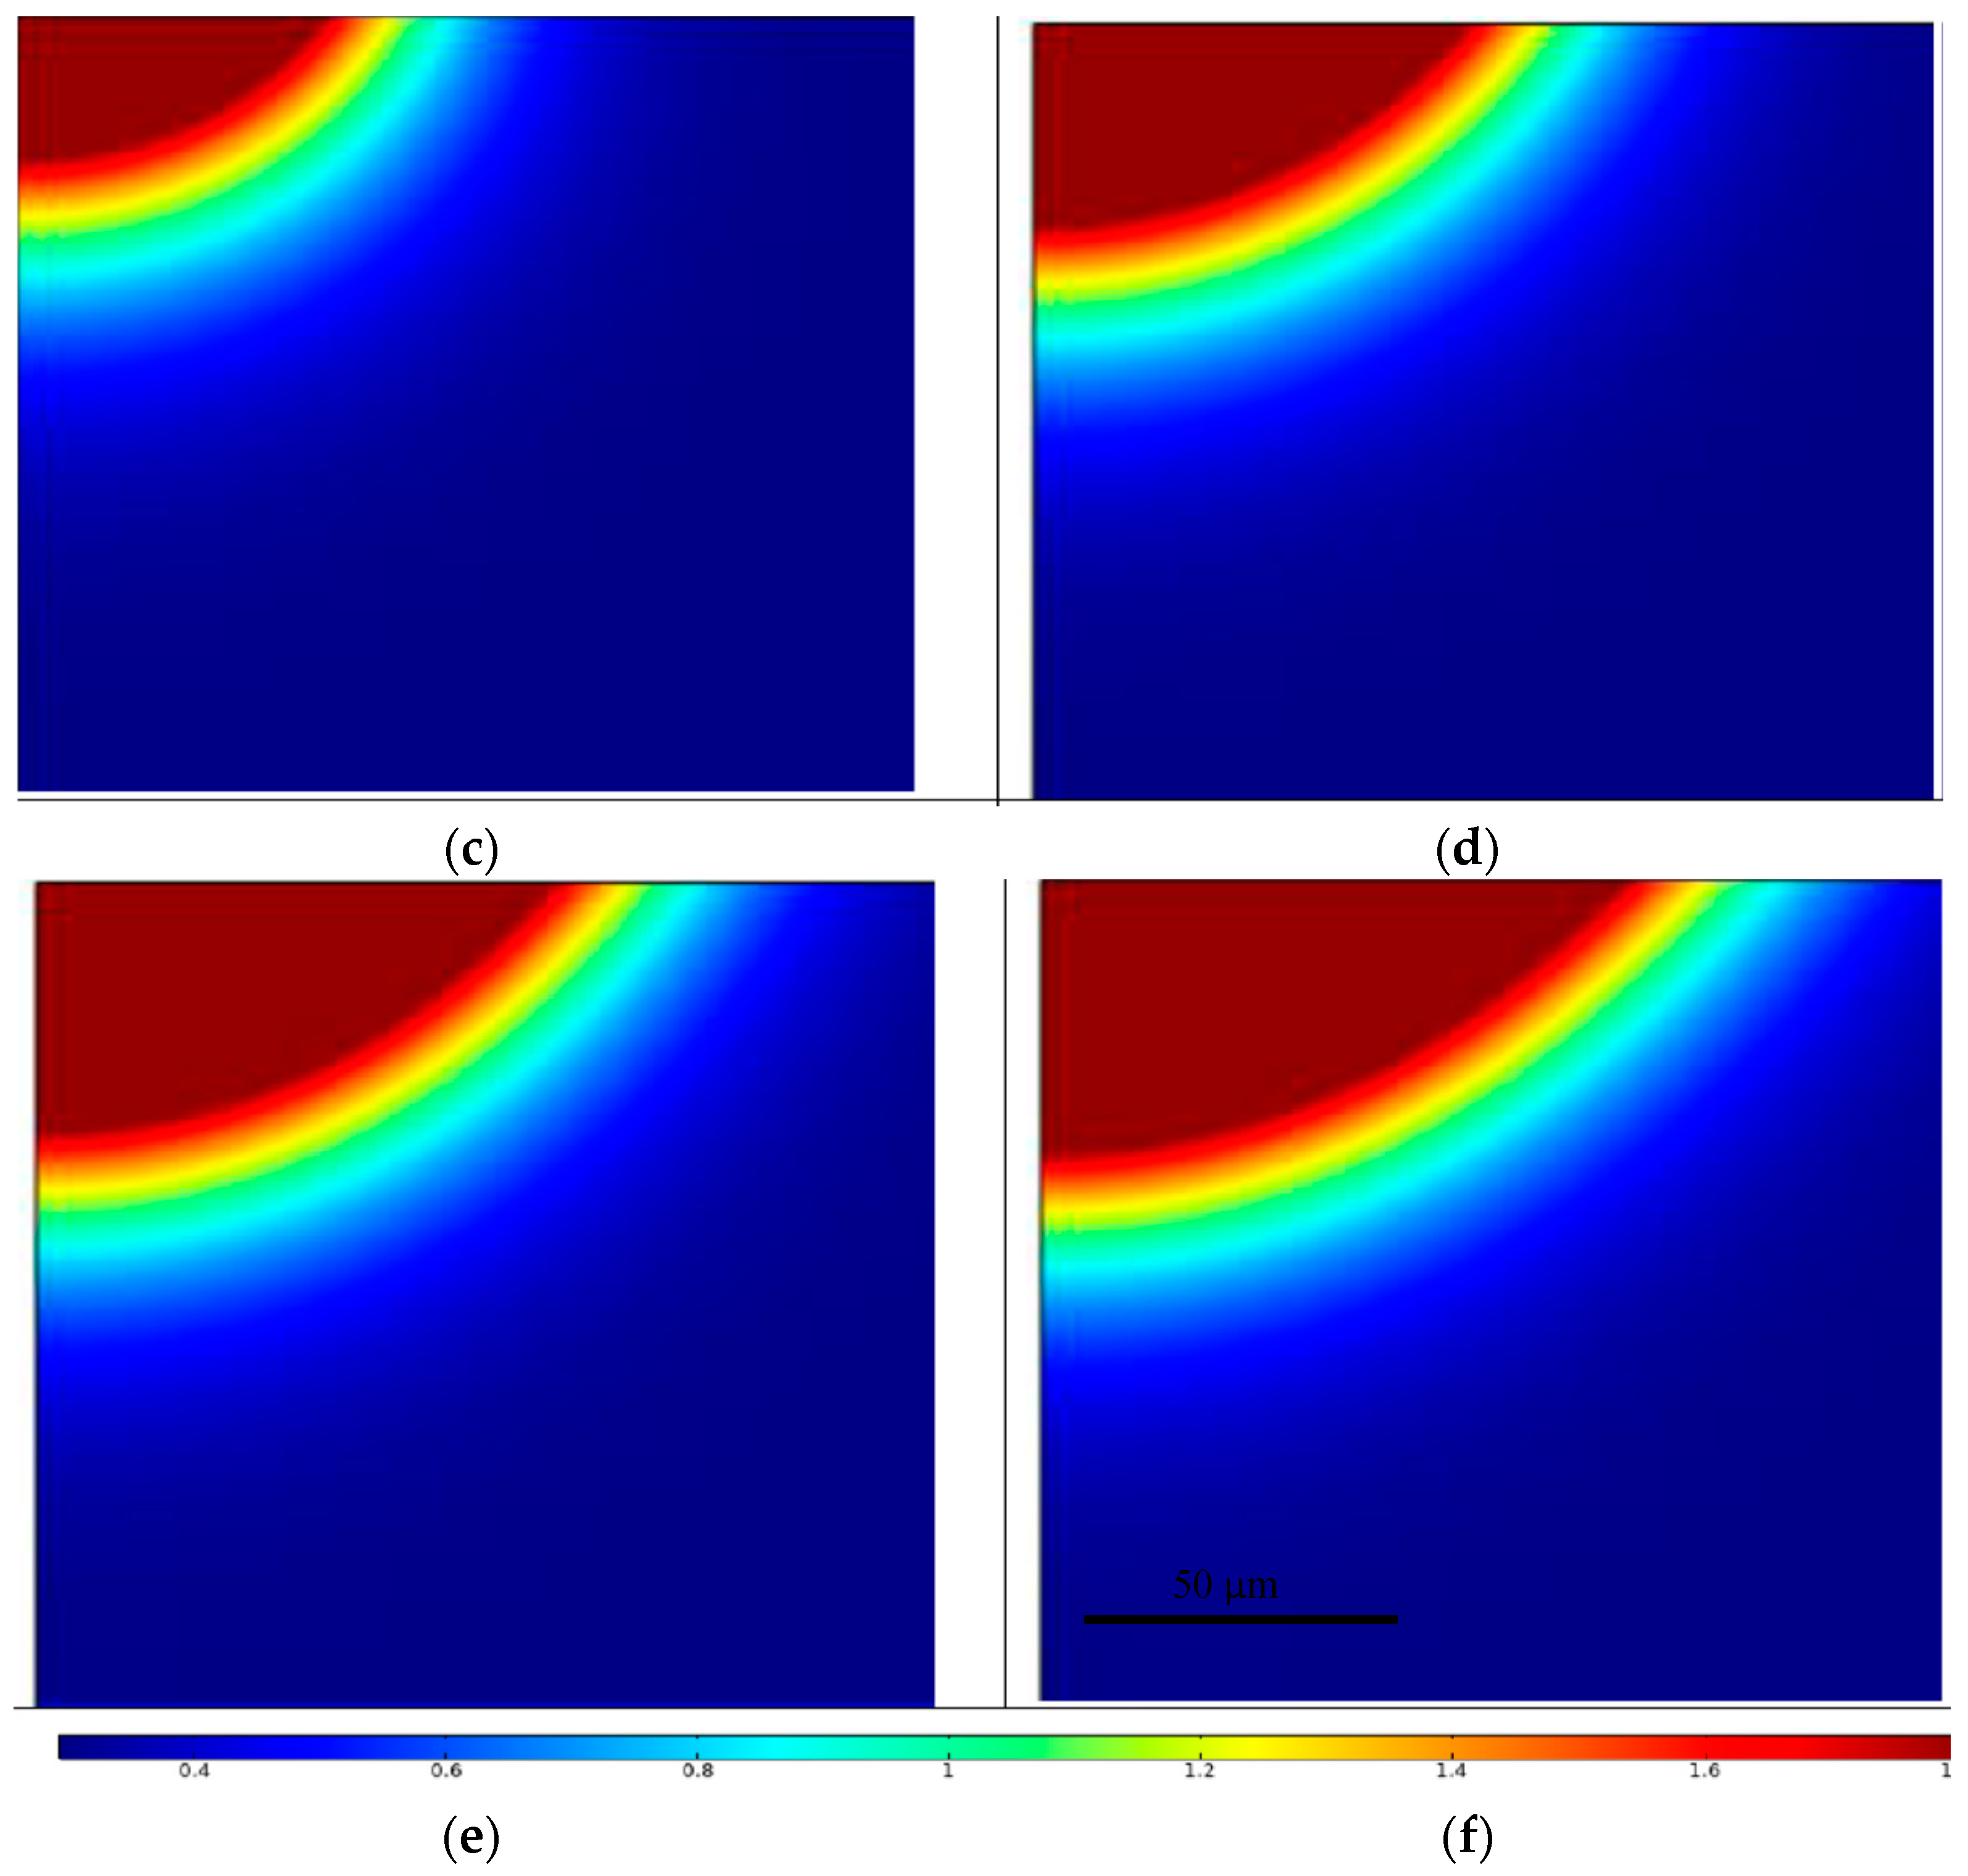
Figure 2a,b illustrates the change in radius and the depth of the crater obtained from a single discharge simulation with a spark duration for different values of current. For low values of discharge time, the radius increased but then approached a constant value. Also, a higher current led to a larger radius. This trend can be explained by considering the dependence of the radius of the plasma channel on both the time and discharge current (Equation (12)). For short discharge times, the depth of the crater showed similar trends. However, during longer discharge times, depending on the discharge current, the depth of crater either approached a constant or decreased. This can be explained by taking into account the trends of heat flux and heat input radius: as the discharge time increased, the heat density on the surface decreased while the plasma radius continued to increase. In addition, when instantaneous evaporation was in effect, while the radius of the crater showed no significant change (Figure 2a), the depth of the crater showed higher values for a short discharge time. Due to a higher heat flux for a short discharge time, the evaporation of material caused deeper craters. As seen in Figure 2b, as the discharge time increased, the depth of crater with instantaneous evaporation approached the depth of the crater without instantaneous evaporation. Similarly, for higher values of the current, more evaporation was expected, and hence the model with IE showed a deeper crater. It is worth noting that there was no significant difference between the radius of the crater predicted by the model with and without instantaneous evaporation. Figure 2c–f shows increasing crater radii for increasing values of current.

3.1. Effects of Process Parameters on Material Removal Rate

For the evaluation of material removal rate, Equation (1) with a 2D axis-symmetry domain was solved. Steel with a thermal conductivity of 65 W/m K, density of 7545 kg/m3, heat capacity of 575 J/(kg K), latent heat of fusion of 247 kJ/kg, and melting point of 1808 K was considered in the simulation [23]. The shape of the crater can be evaluated by removing elements with temperature higher than the melting point. When the shape of the crater is known, volume of the crater can be evaluated using Equation (18):
V c =   i = 0 n D i
where Di is volume of a horizontal disk in the crater.
The material removal rate MRR was calculated using the following equation:
MRR = V c t o n + t o f f
where Vc is crater volume, ton is pulse-on time and toff is the pulse-off time. A program using MATLAB 2018 (MathWorks Inc., Natick, MA, USA), was developed to calculate MRR based on Equations (18) and (19).
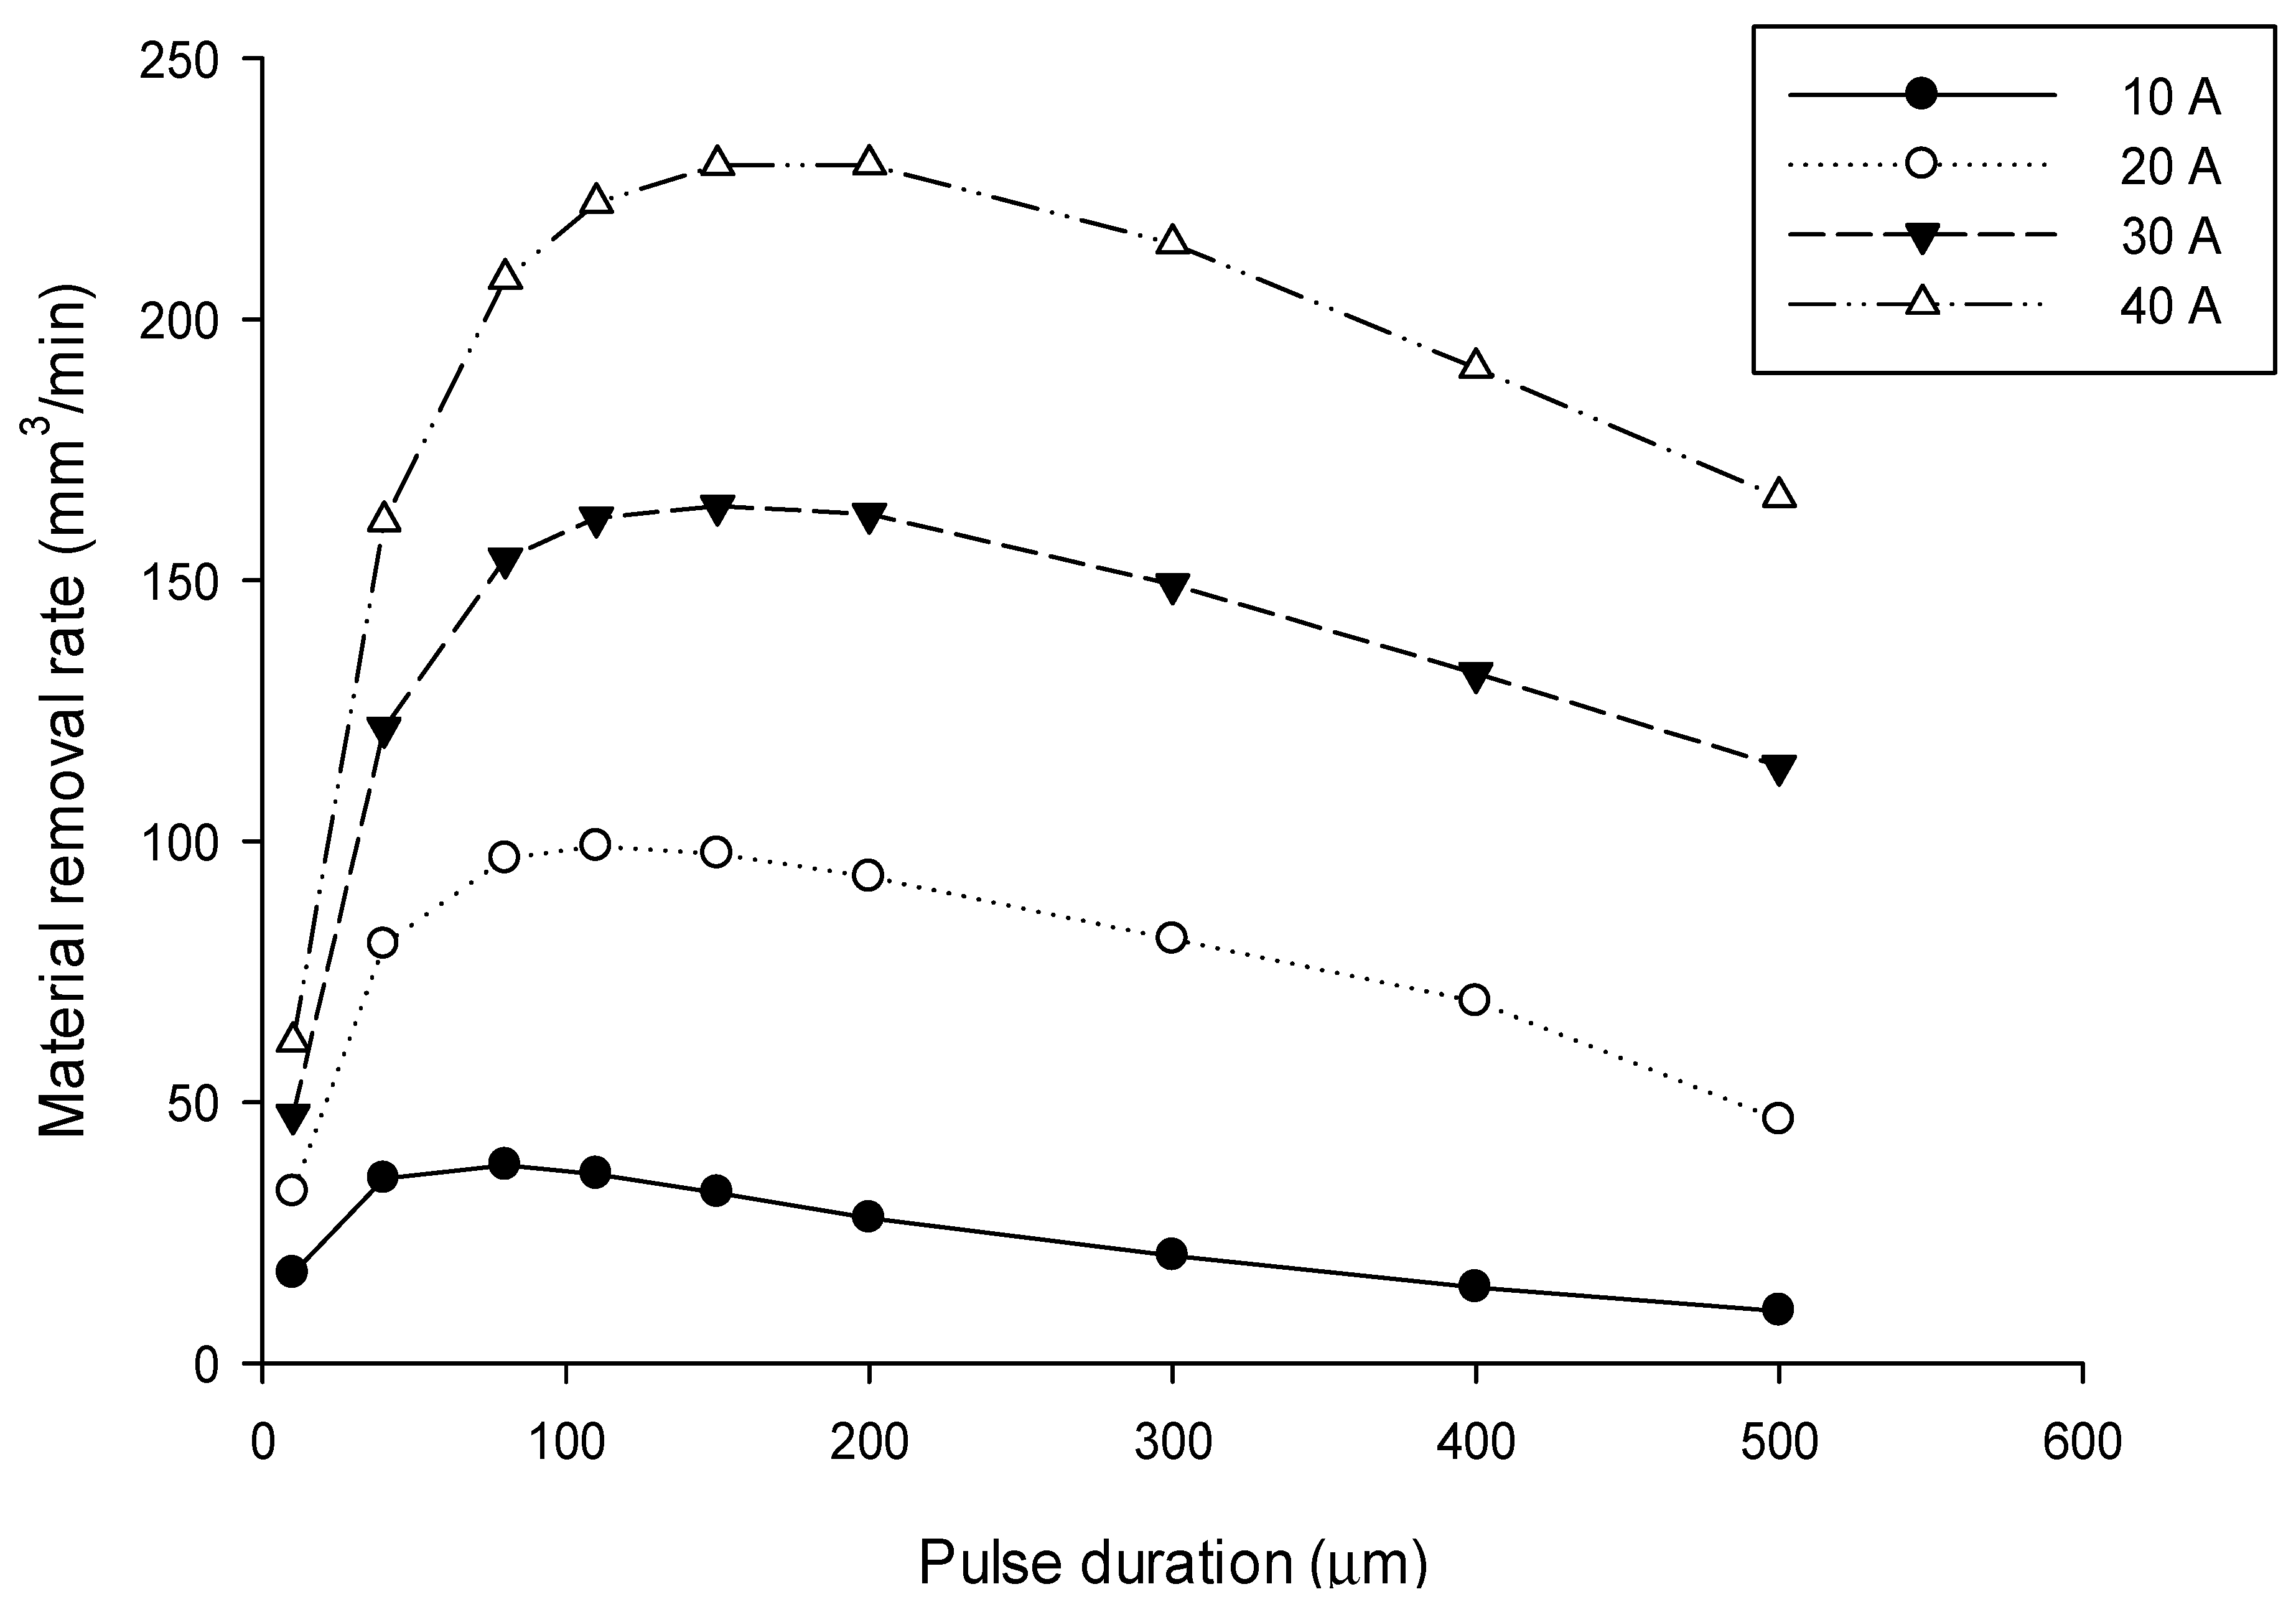
The dependency of MRR on the pulse duration for different currents is shown in Figure 3. For all the discharge currents, MRR was found to increase with pulse duration to a maximum value and then decrease again. The reason for this trend might be the generation of lower heat densities at a higher pulse duration, and hence, MRR decreased. In addition, higher values of discharge current were also related to the higher MRR.
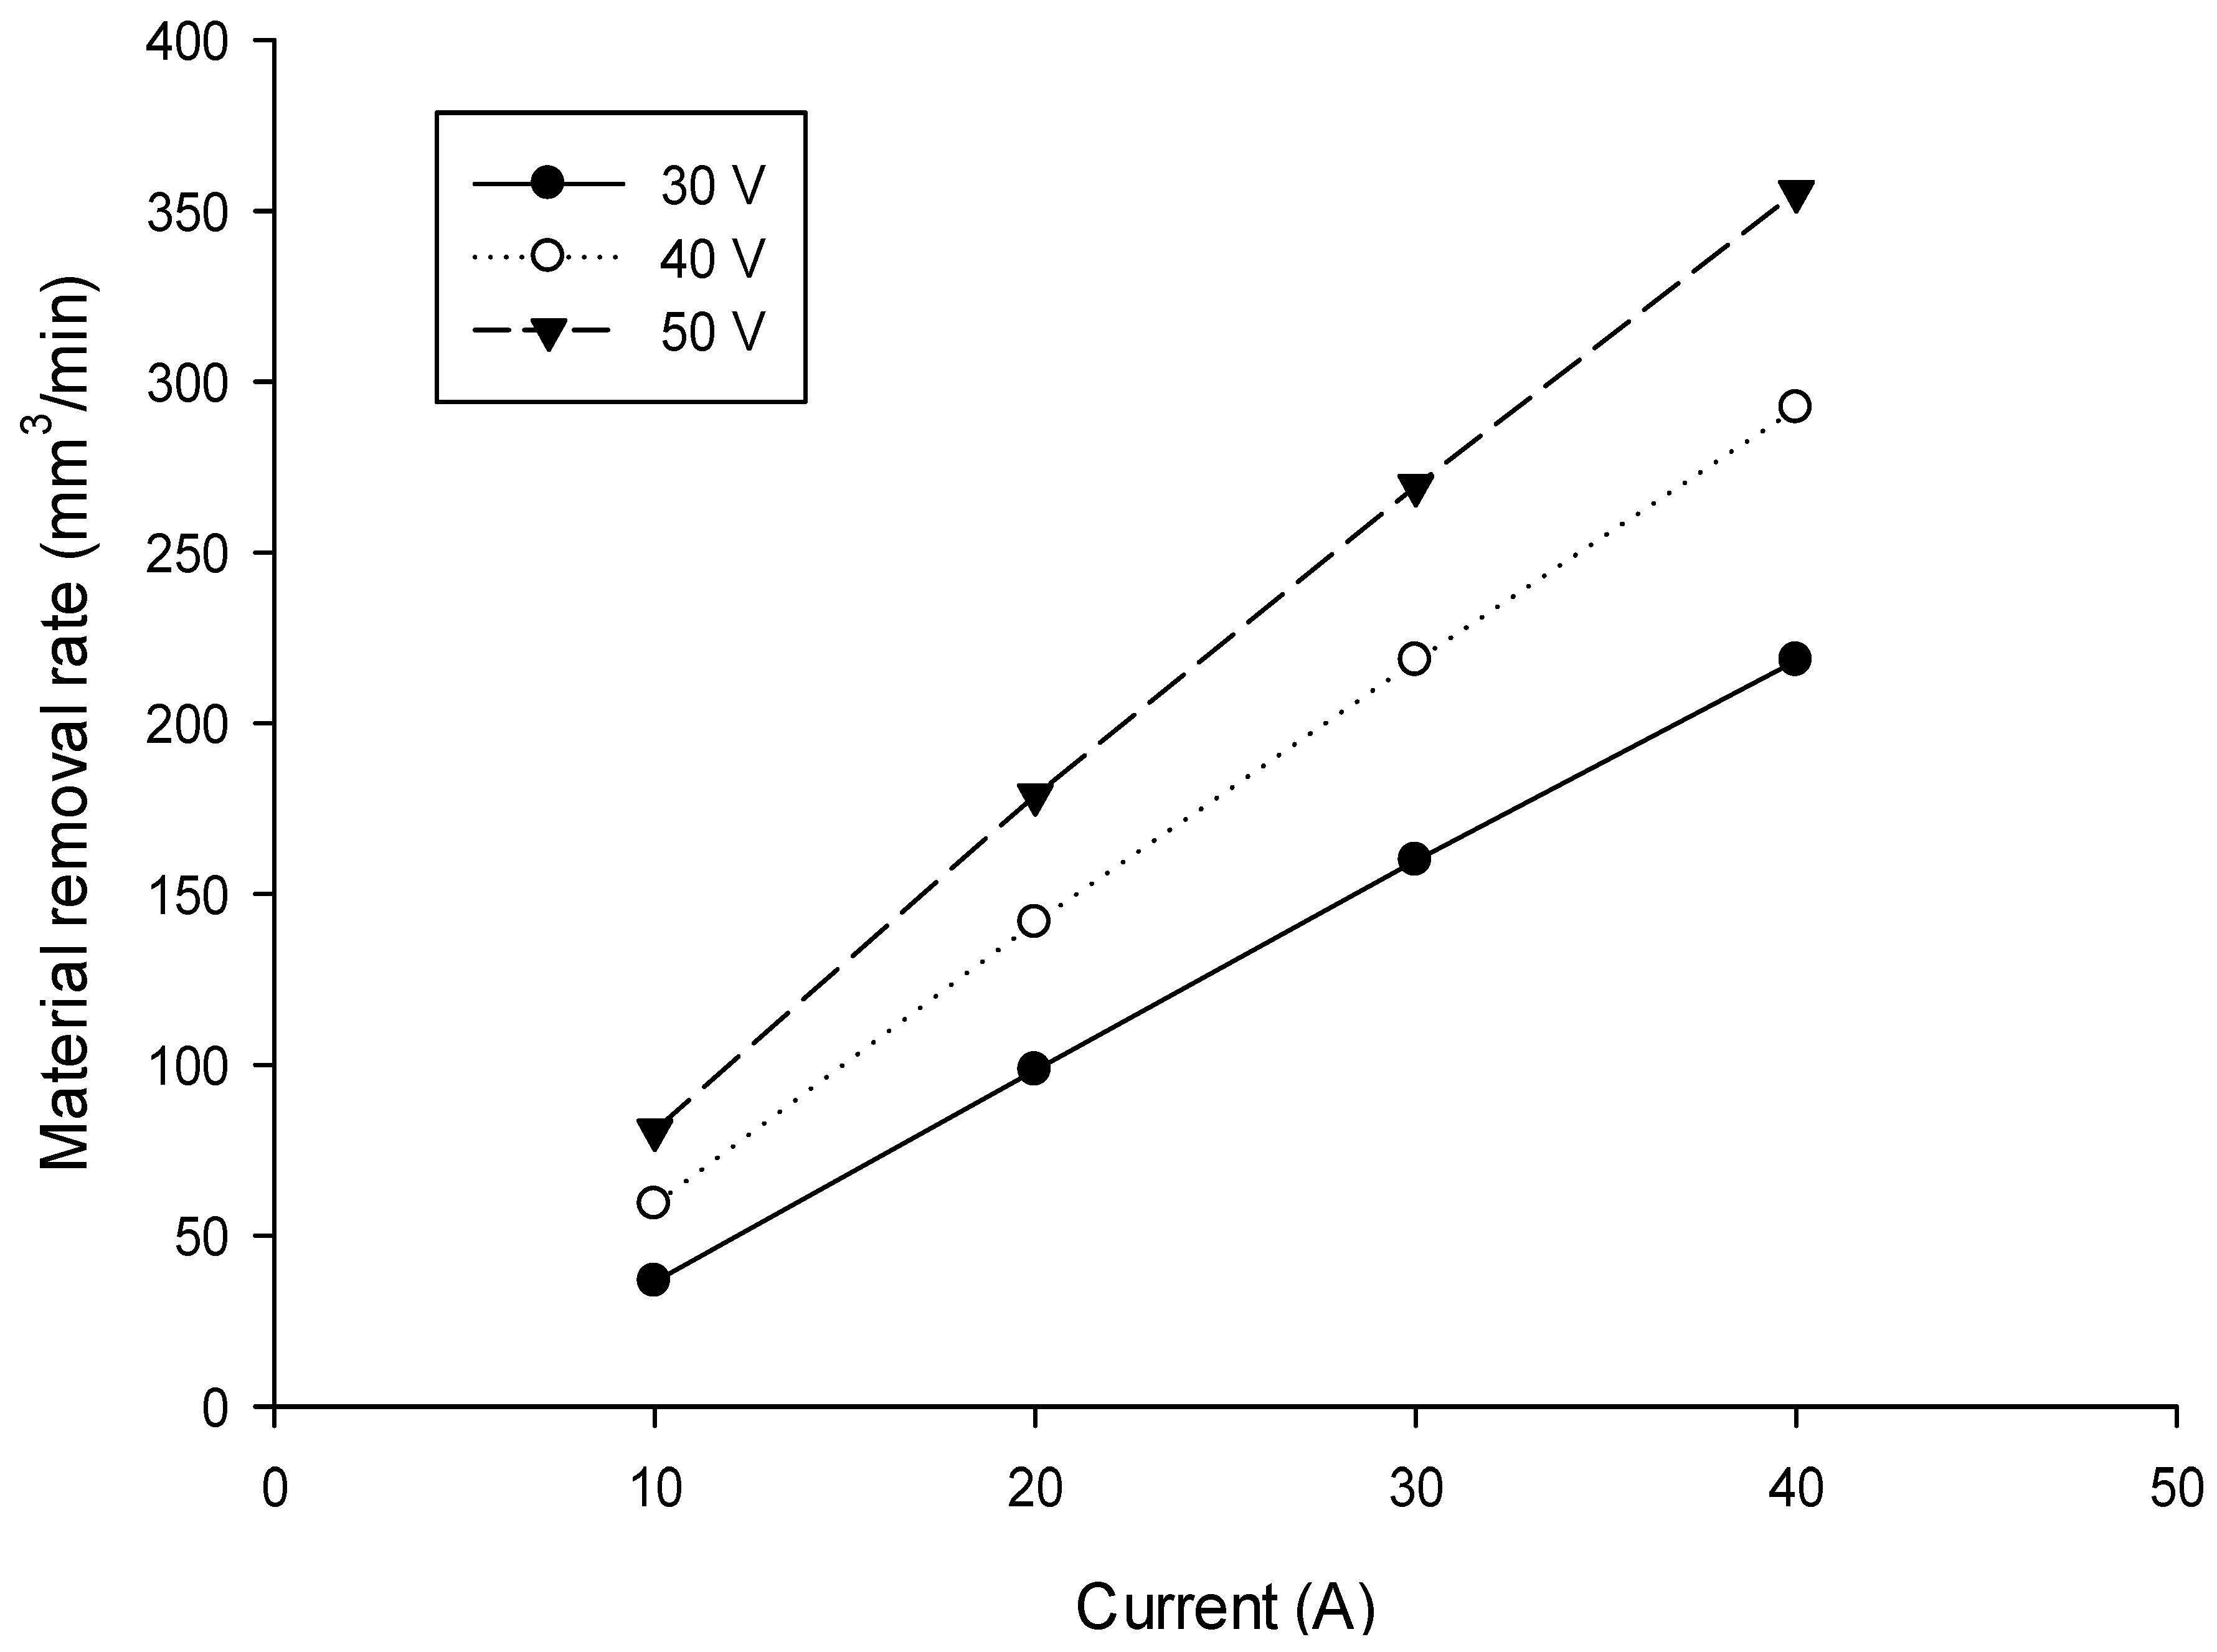
Figure 4 illustrates the effect of the discharge current on MRR for different discharge voltages. Obviously, any increase in current or voltage led to a higher heat flux, which in return caused melting and the removal of a higher amount of material (Equation (3)).

3.2. Effect of Process Parameters on Surface Roughness

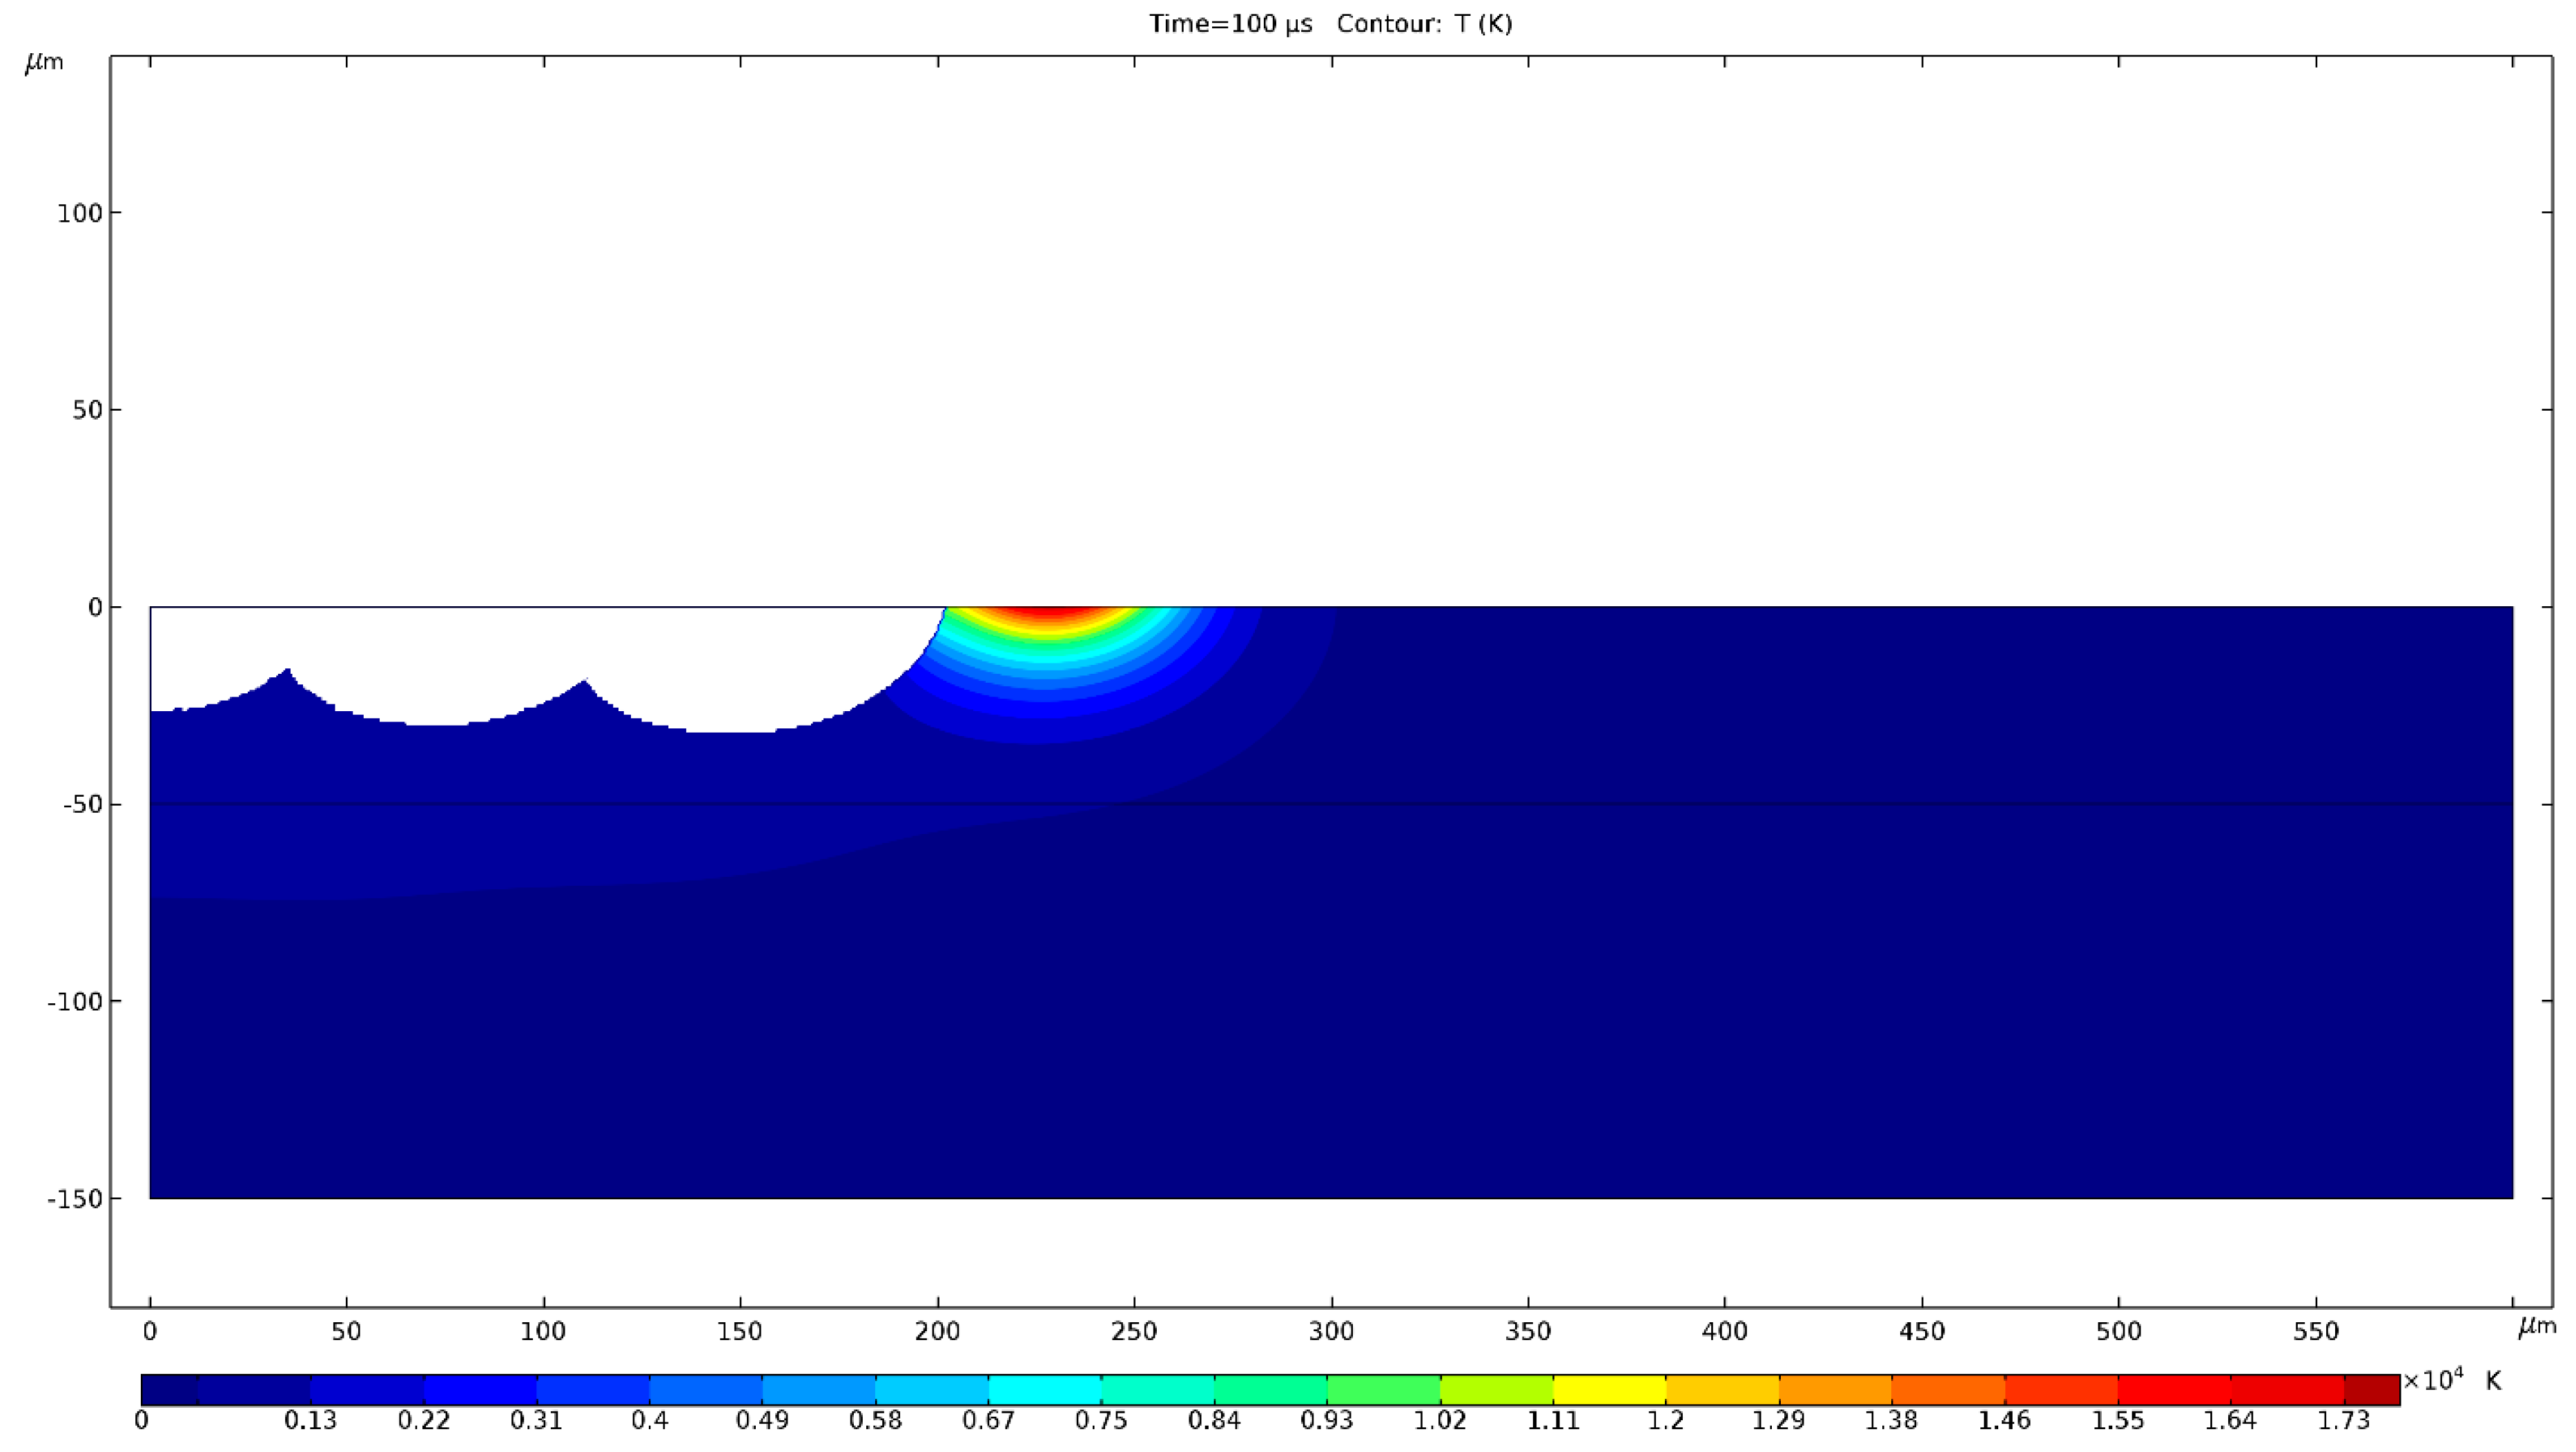
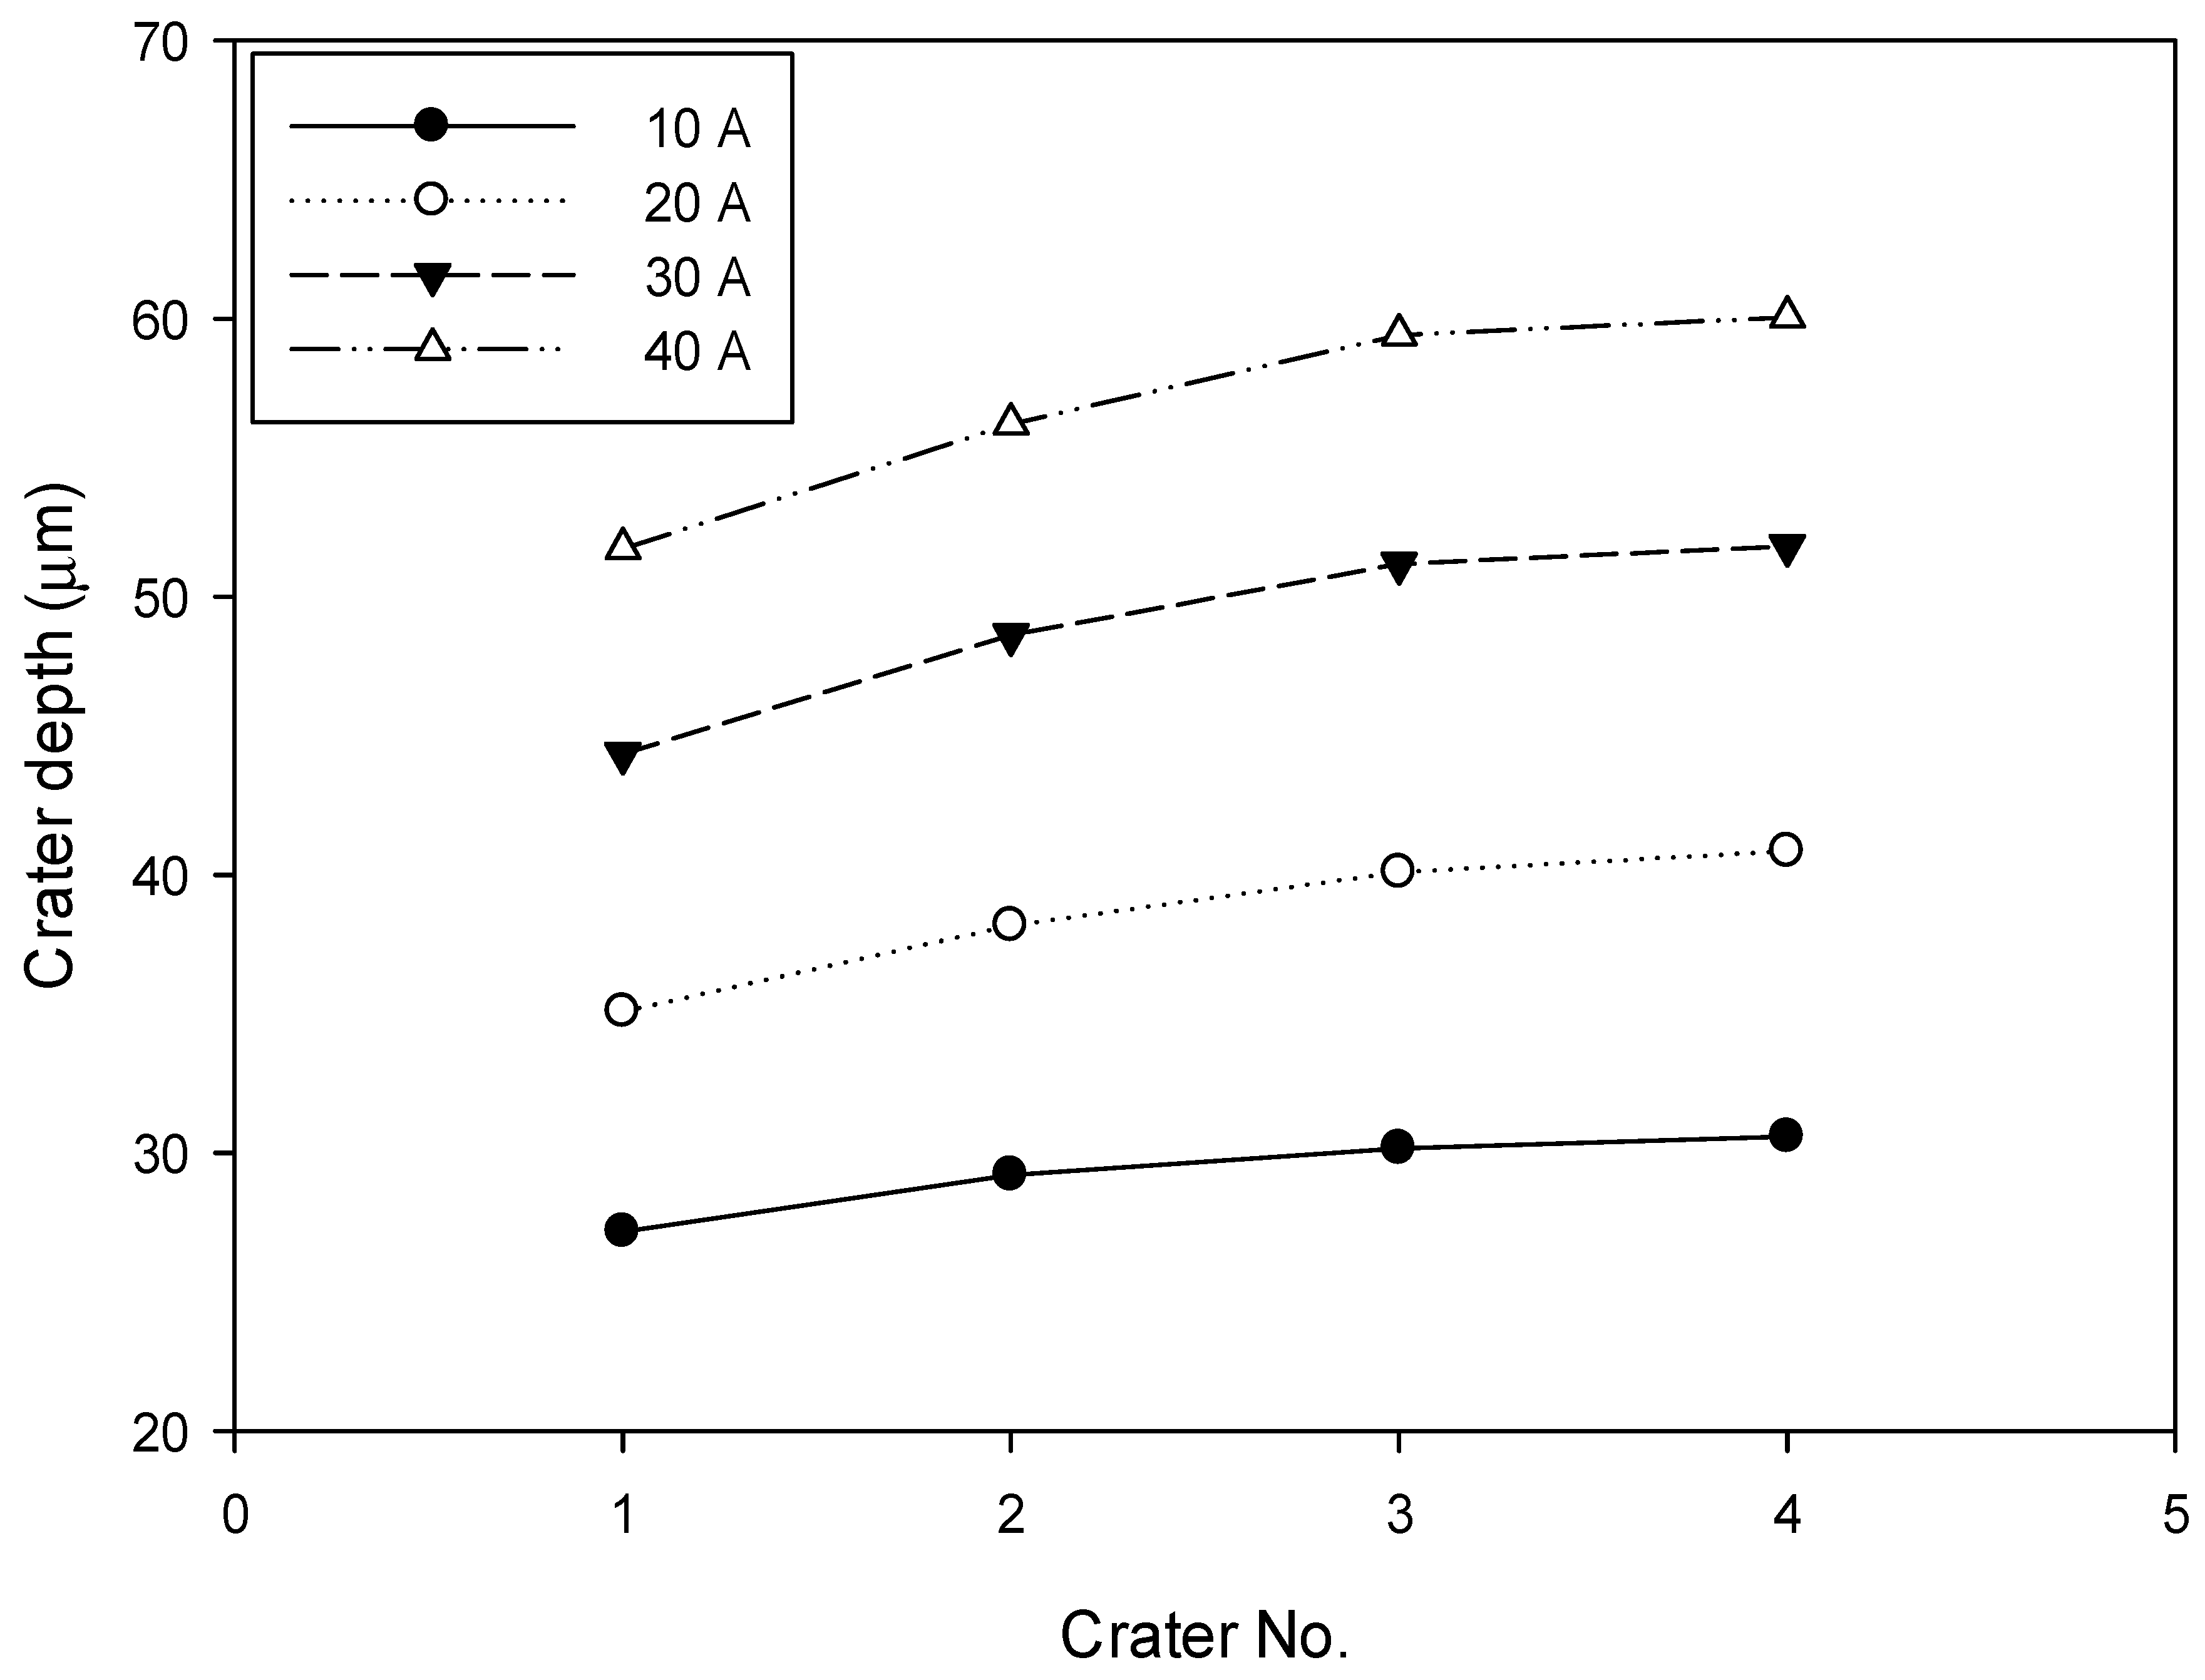
As explained earlier, for the surface roughness evaluation, several discharges on the surface along the x-axis were considered. Figure 5 shows the temperature distribution after the fourth discharge. This figure shows a higher bulk temperature of the workpiece. In addition, a slight increase in the crater depth after each discharge can be seen. Figure 6 shows the depth of the first four craters. In all cases, after four discharges, the crater depth converged to a constant value. Henceforth, the crater was used to calculate the surface roughness.
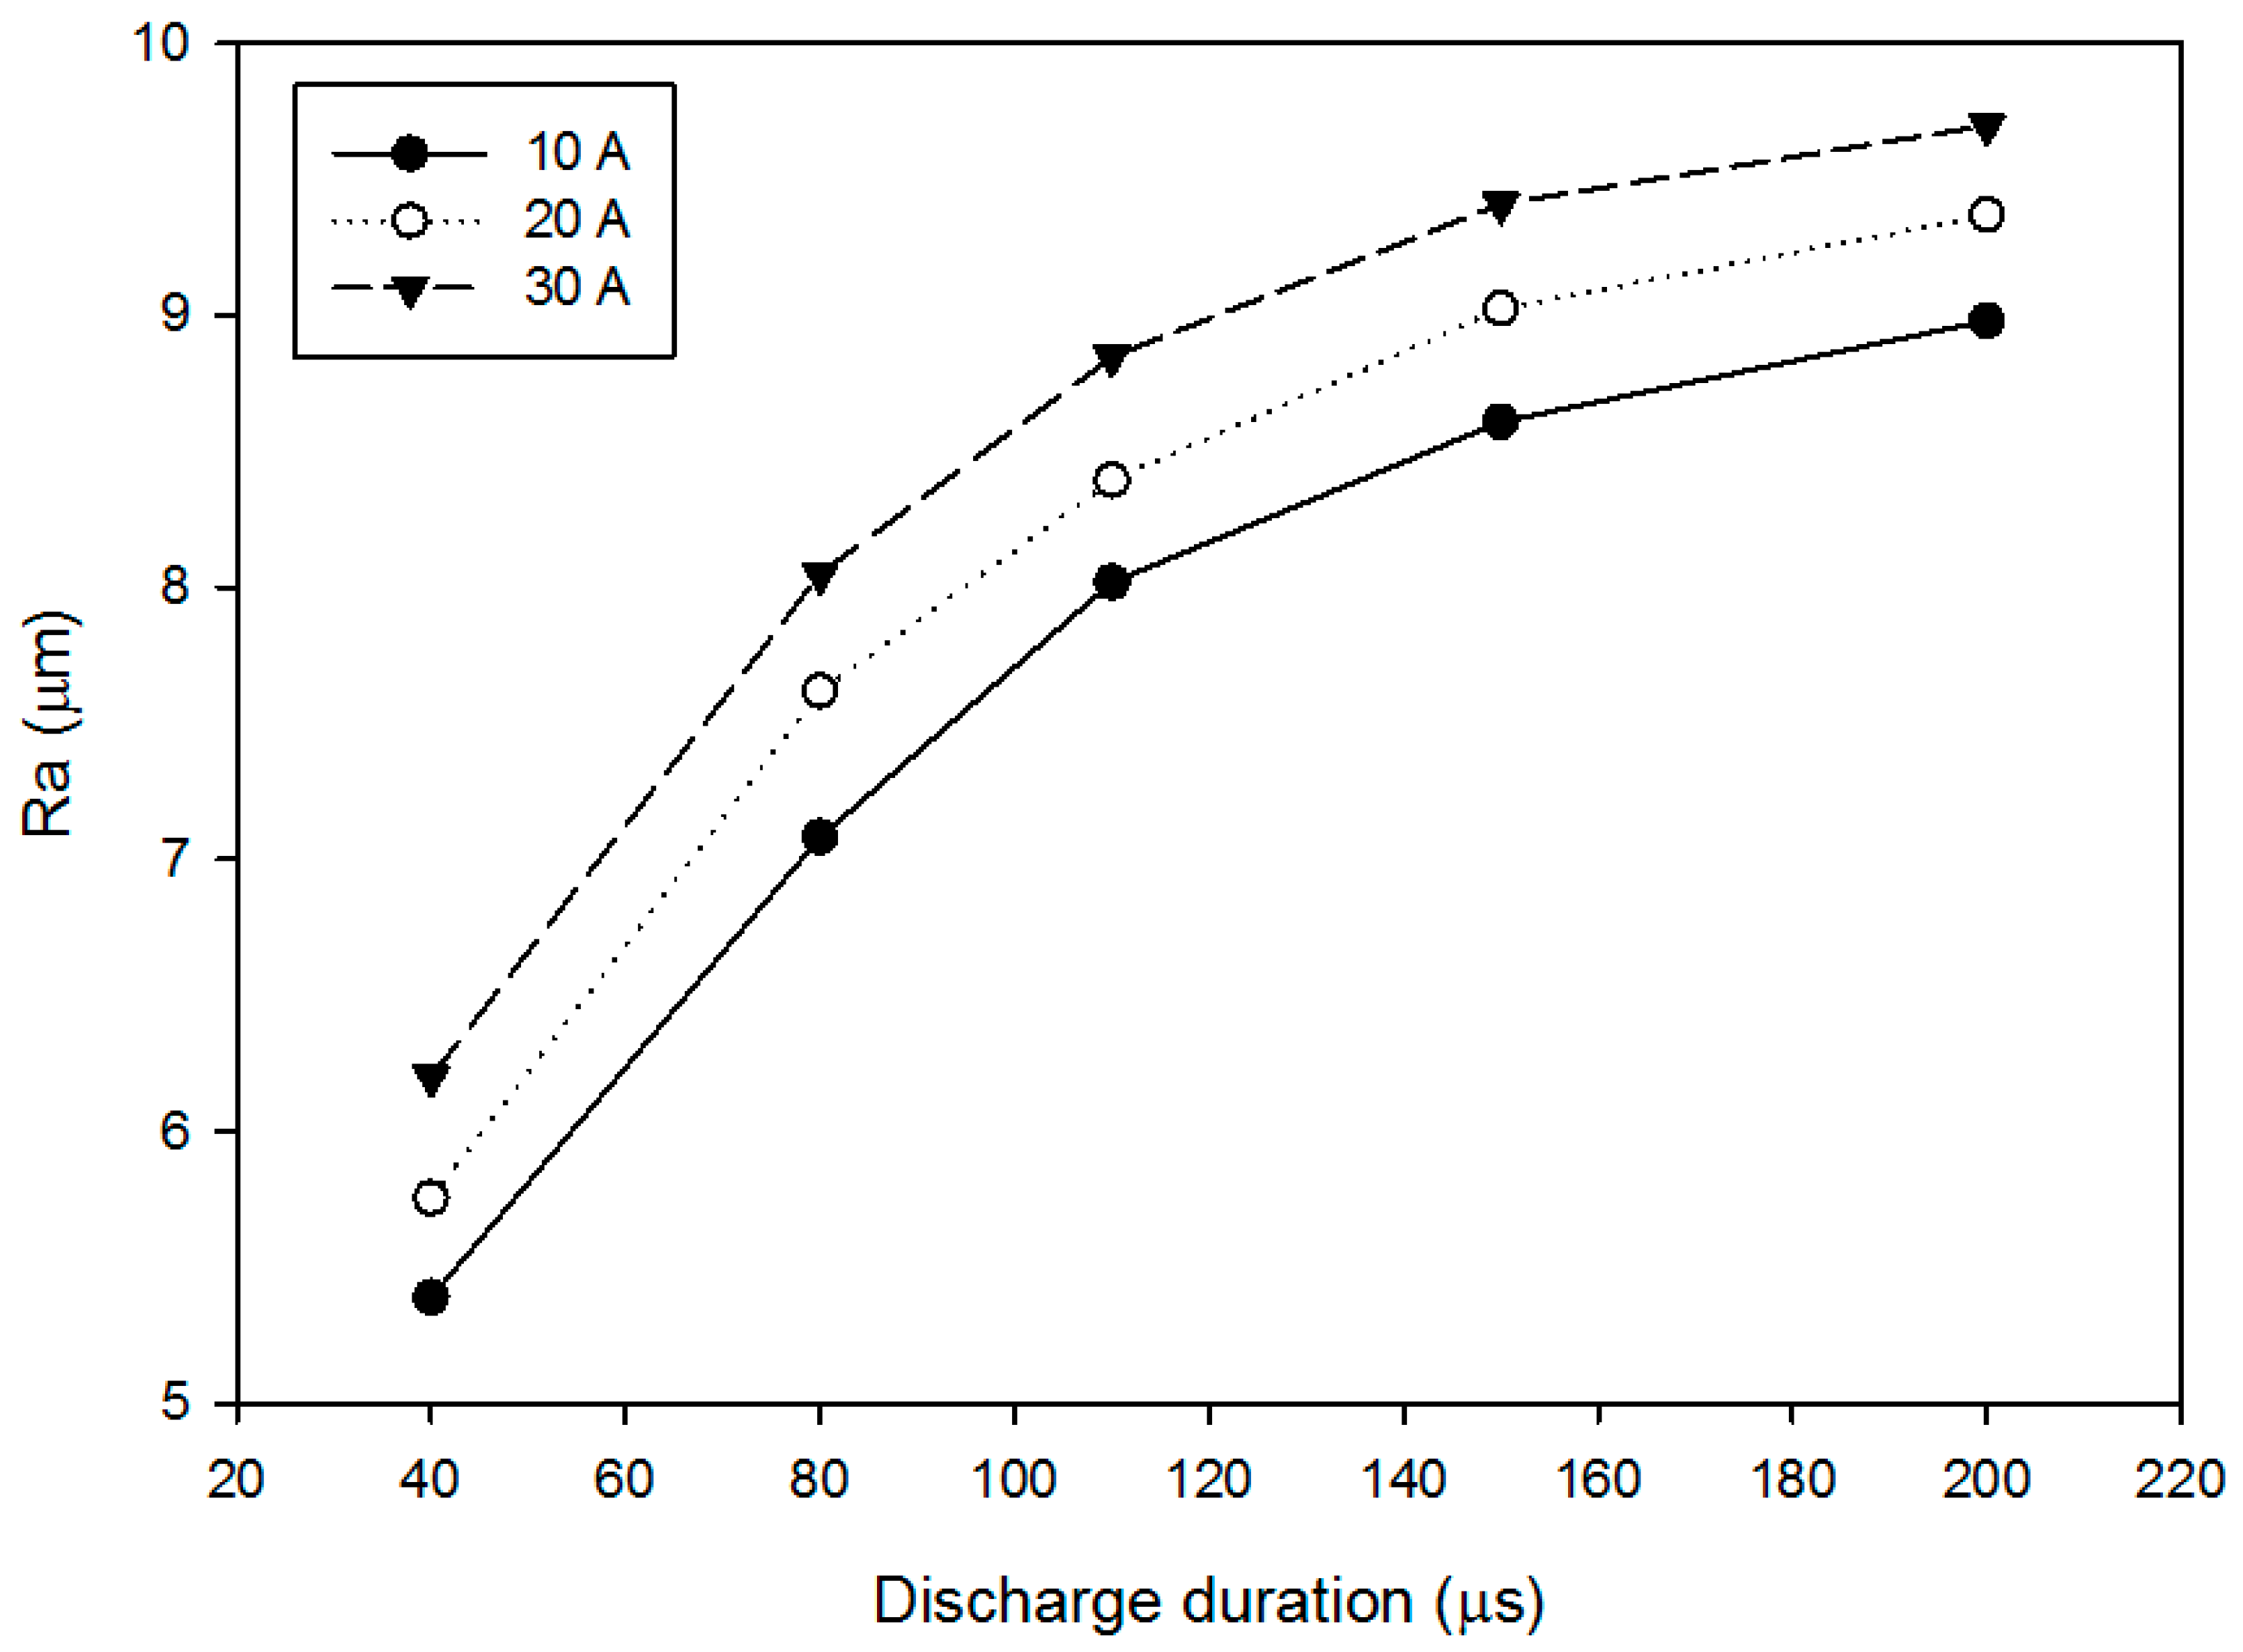
According to Figure 7, the surface roughness increased with the increase in both discharge time and discharge current. This can be explained with the increase in discharge time, where more energy was transferred to the workpiece, hence resulting in a bigger crater. In addition, due to the lower energy densities at a higher discharge time, the dimensions and volume of the crater grew slowly. As a result, the rate of increase in the surface roughness decreased. This behavior is in agreement with experimental work by Kiyak and Cakir [41] and Keskin et al. [42].
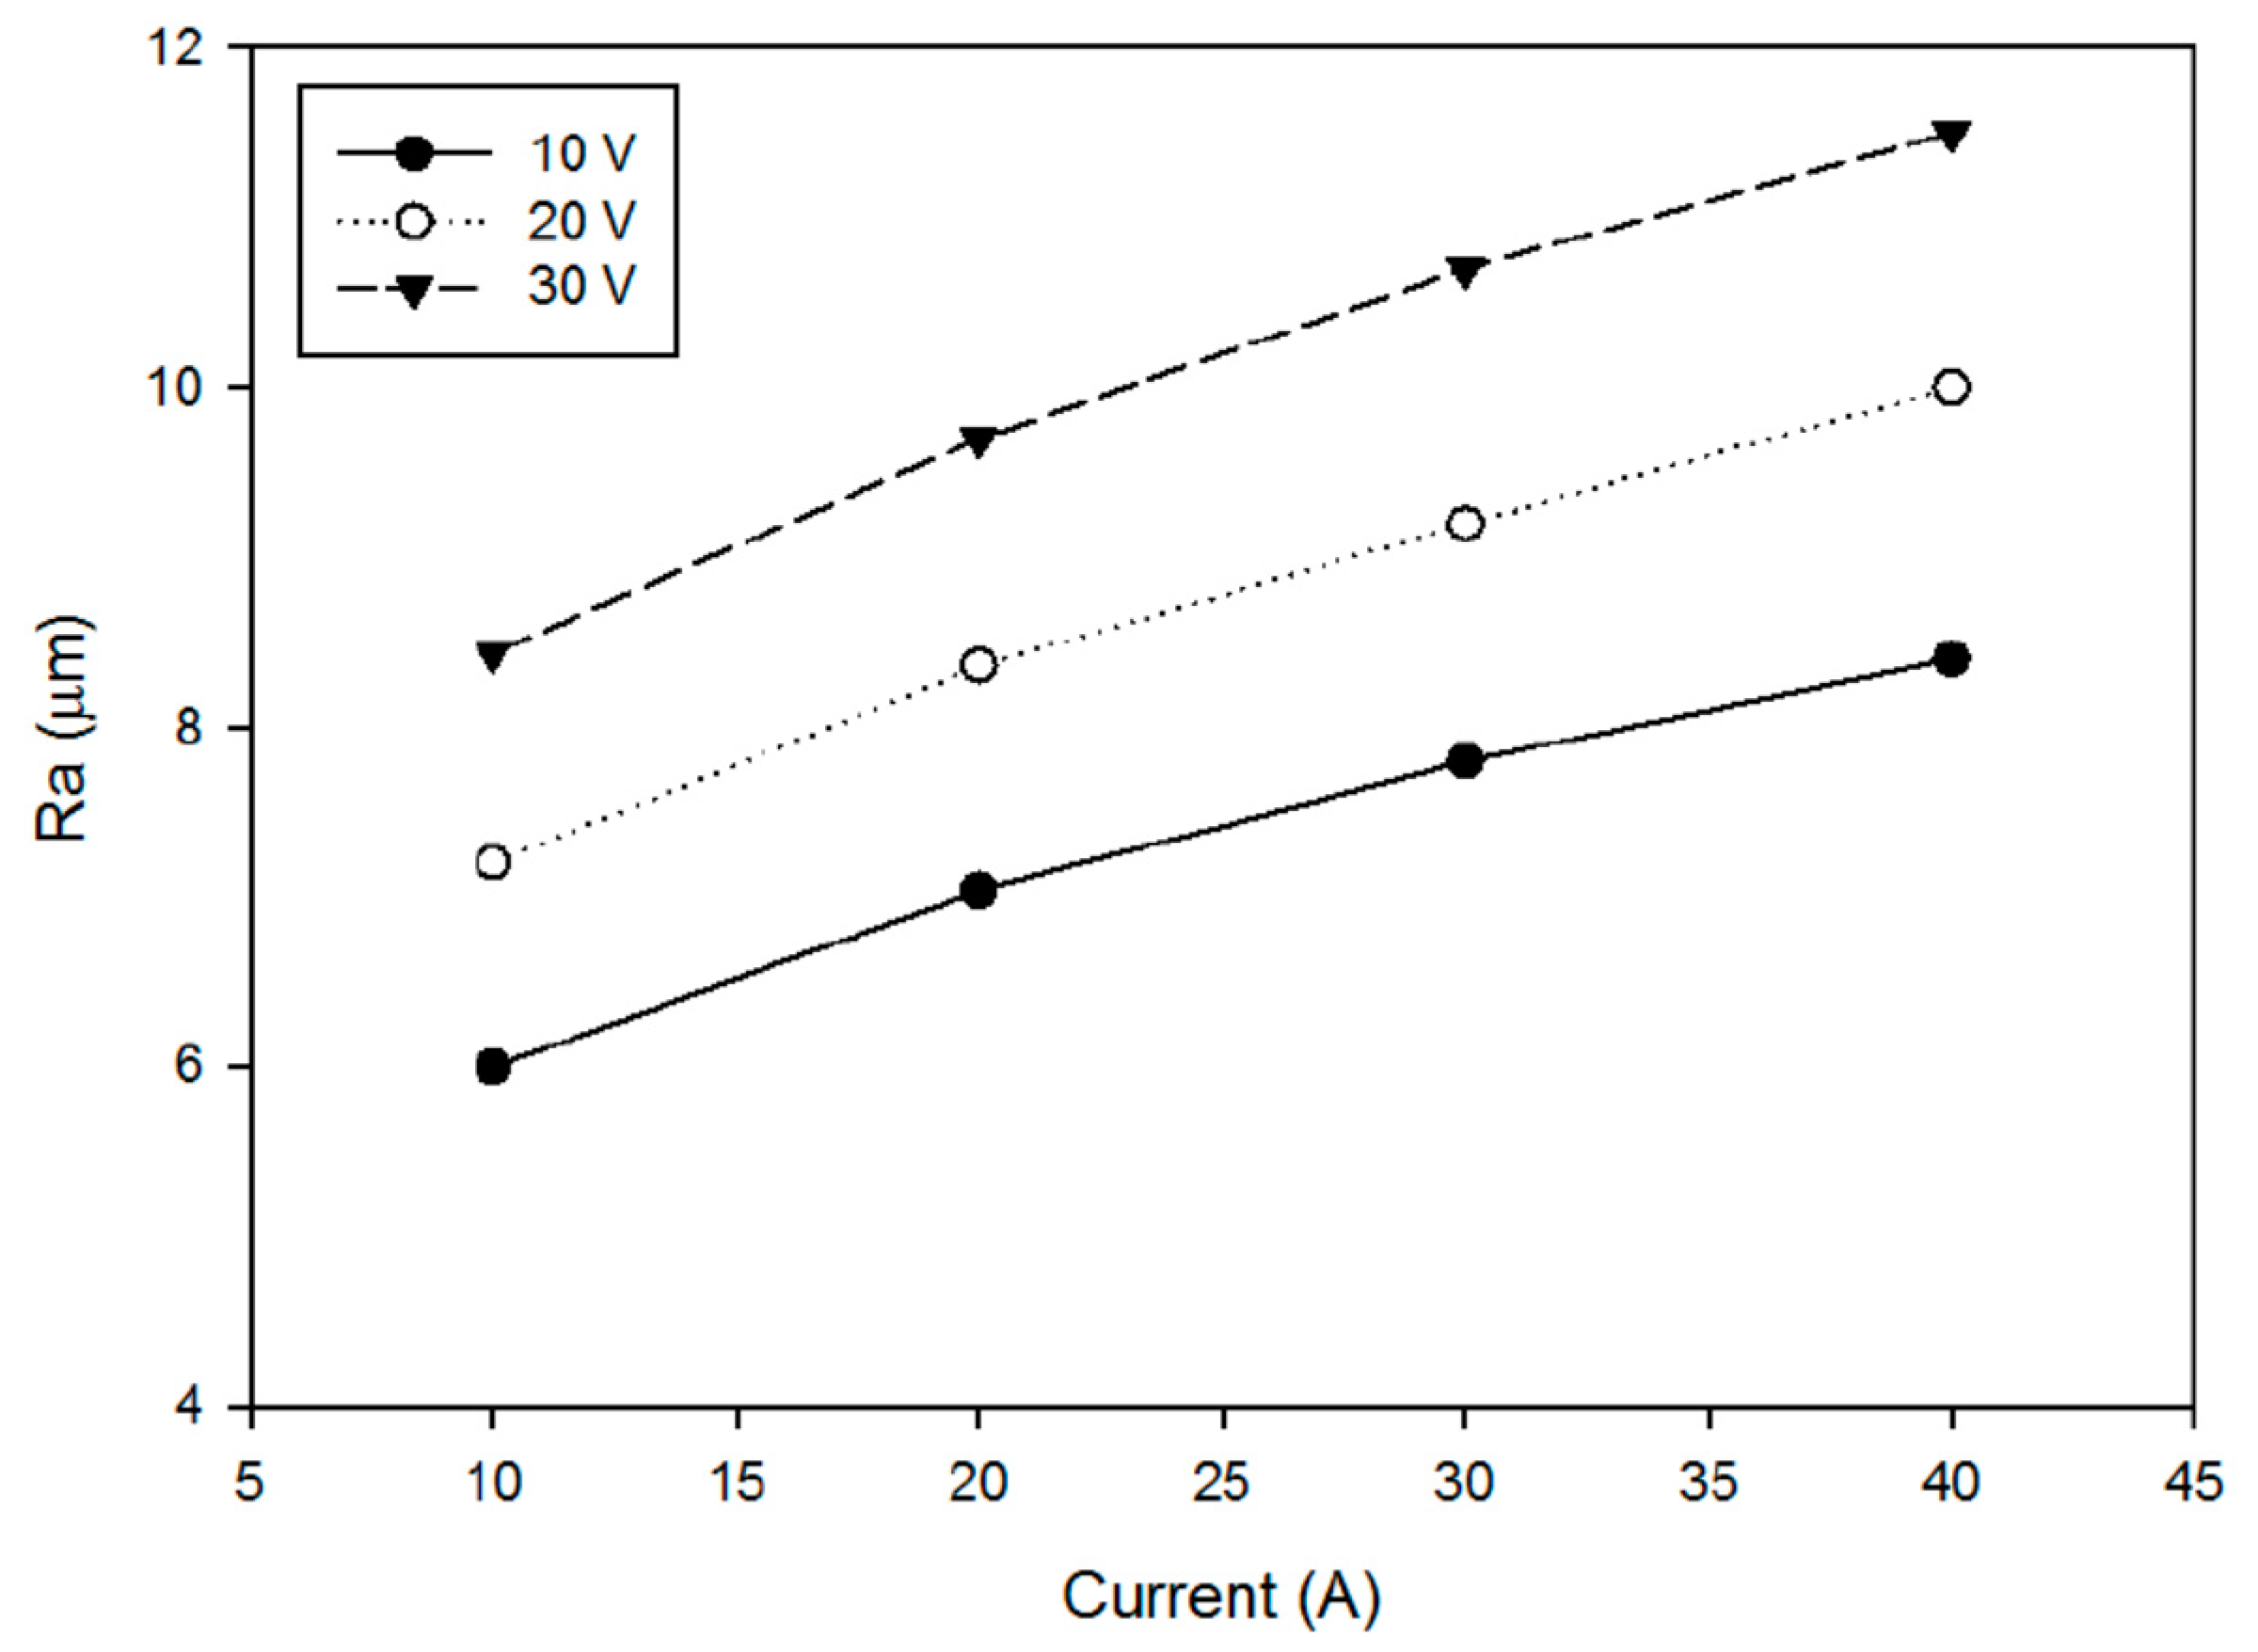
Figure 8 presents the effects of current on surface roughness for different discharge voltages. As explained earlier, an increase in either discharge voltage or current caused more energy transfer to the workpiece. Therefore, larger craters and consequently higher surface roughness occurred. A similar trend is reported by Kiyak and Cakir [41].

4. Model Validation

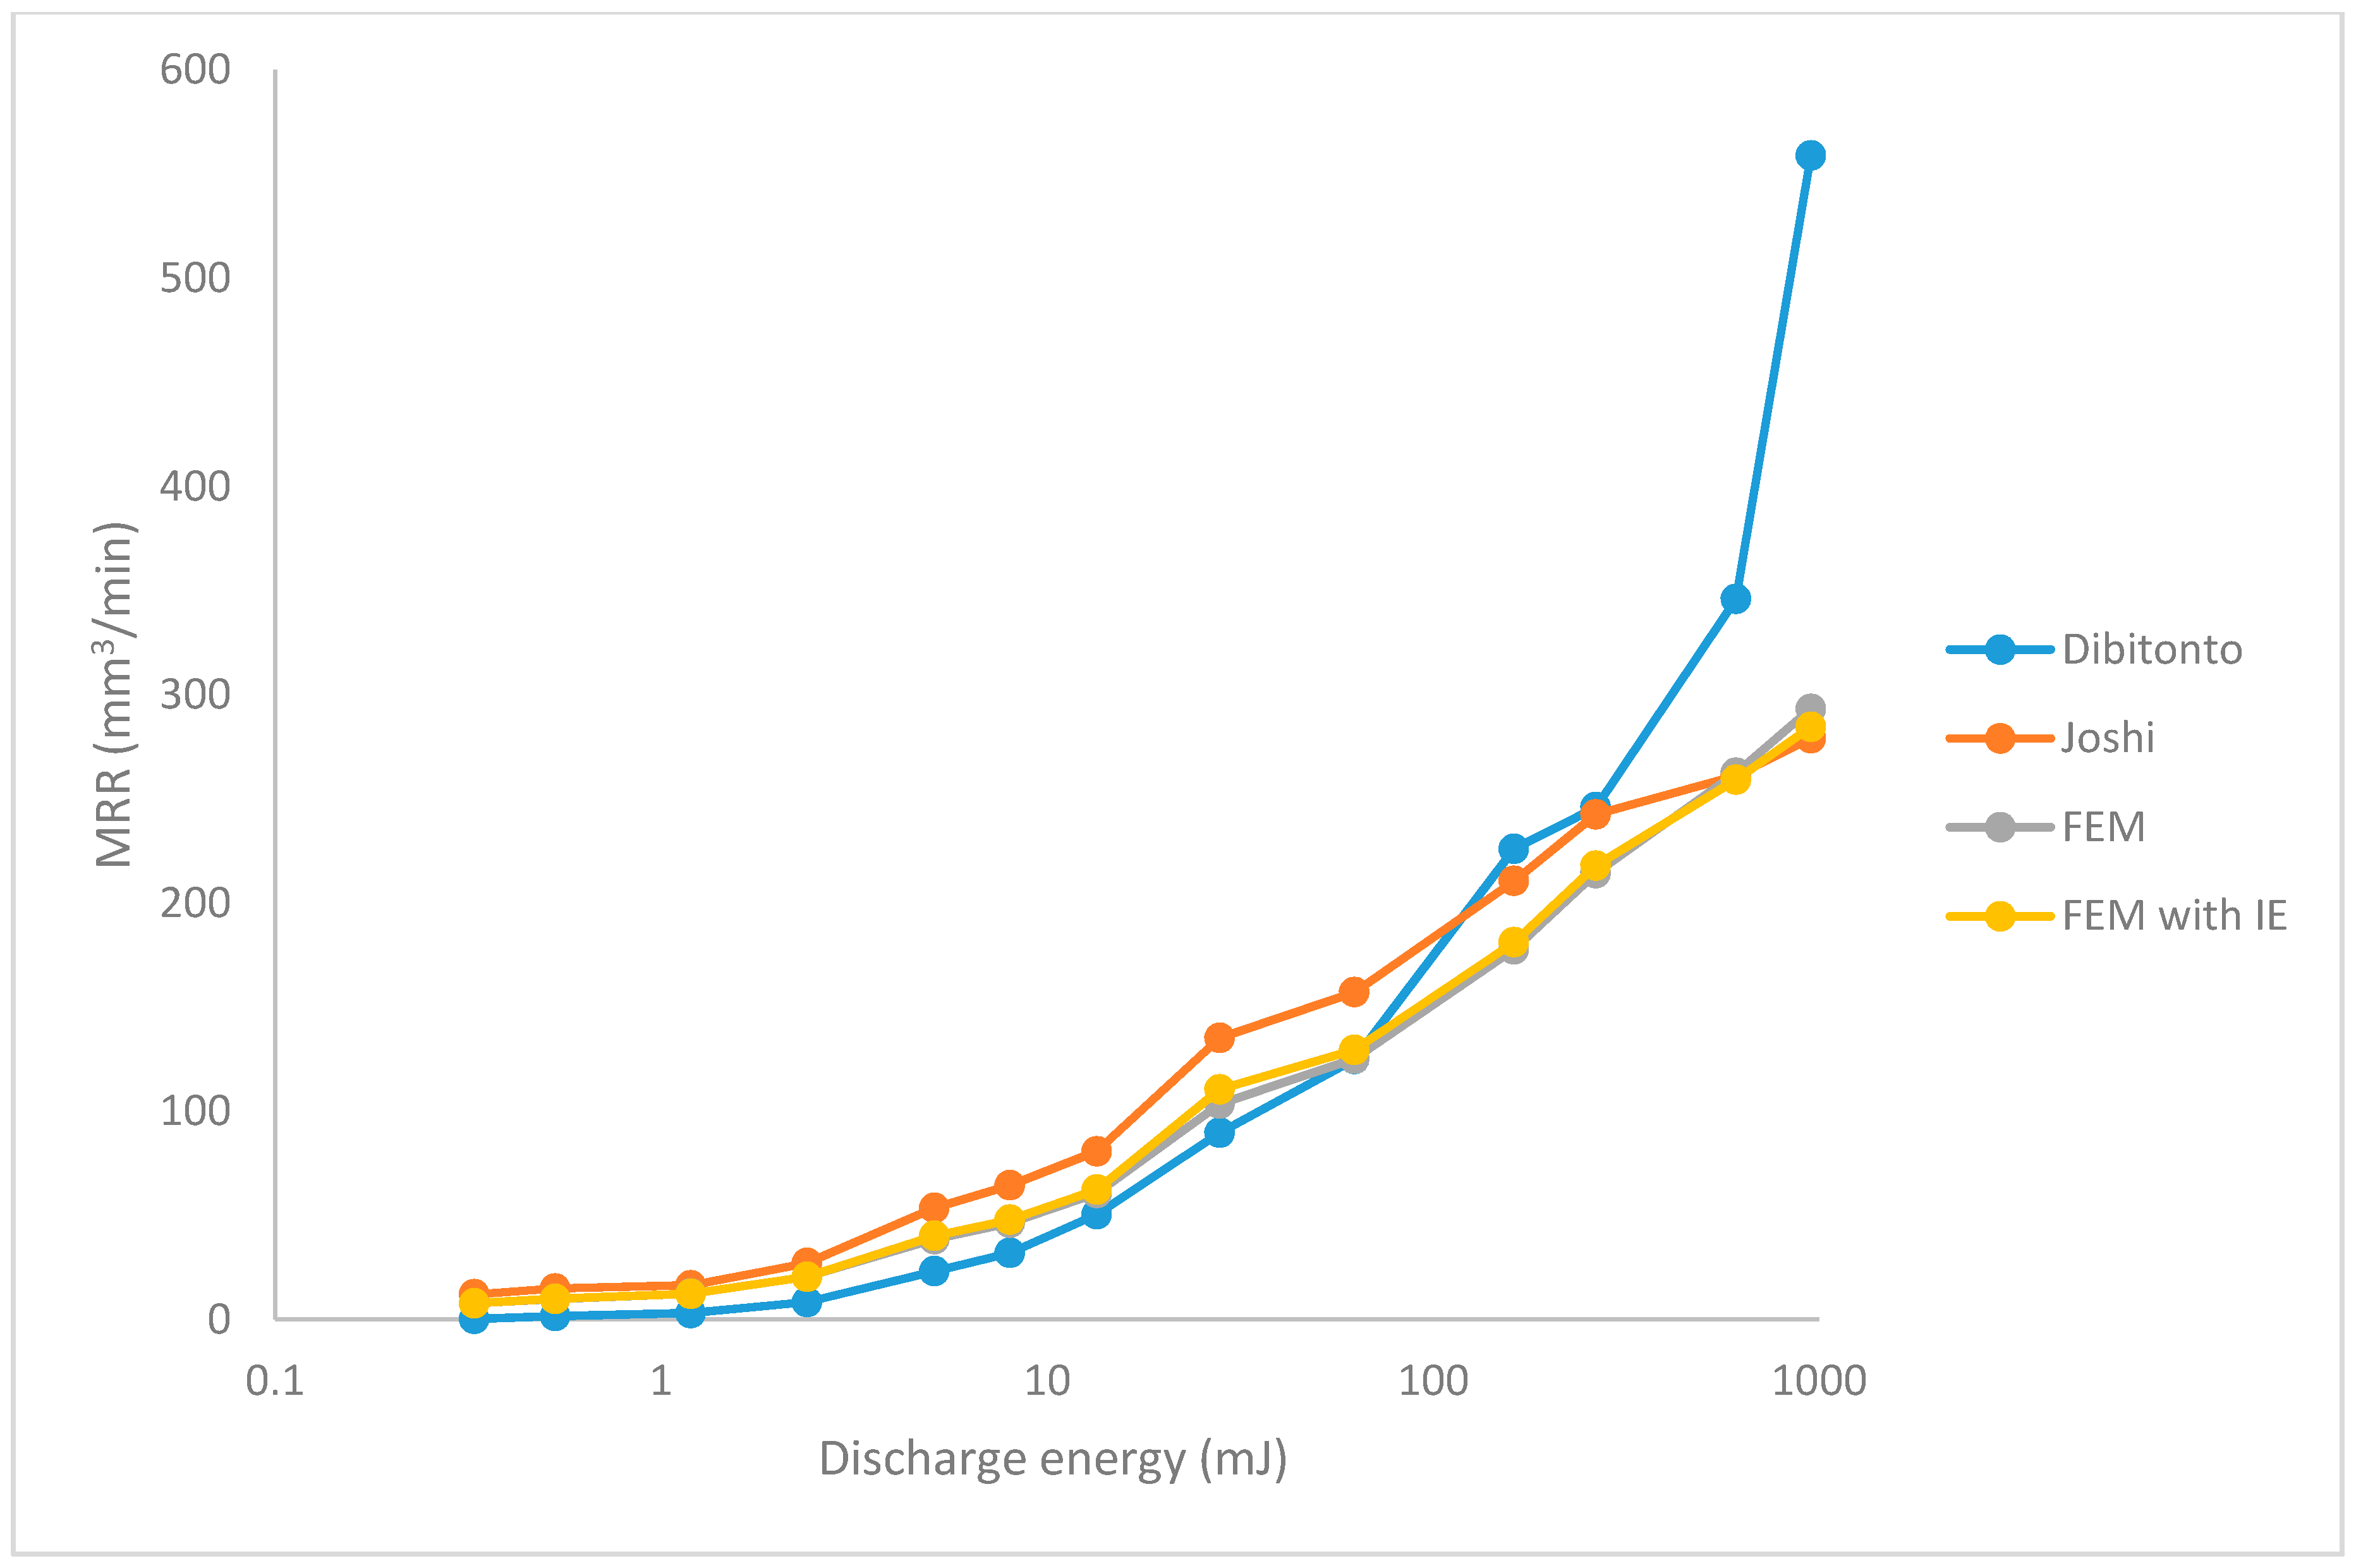
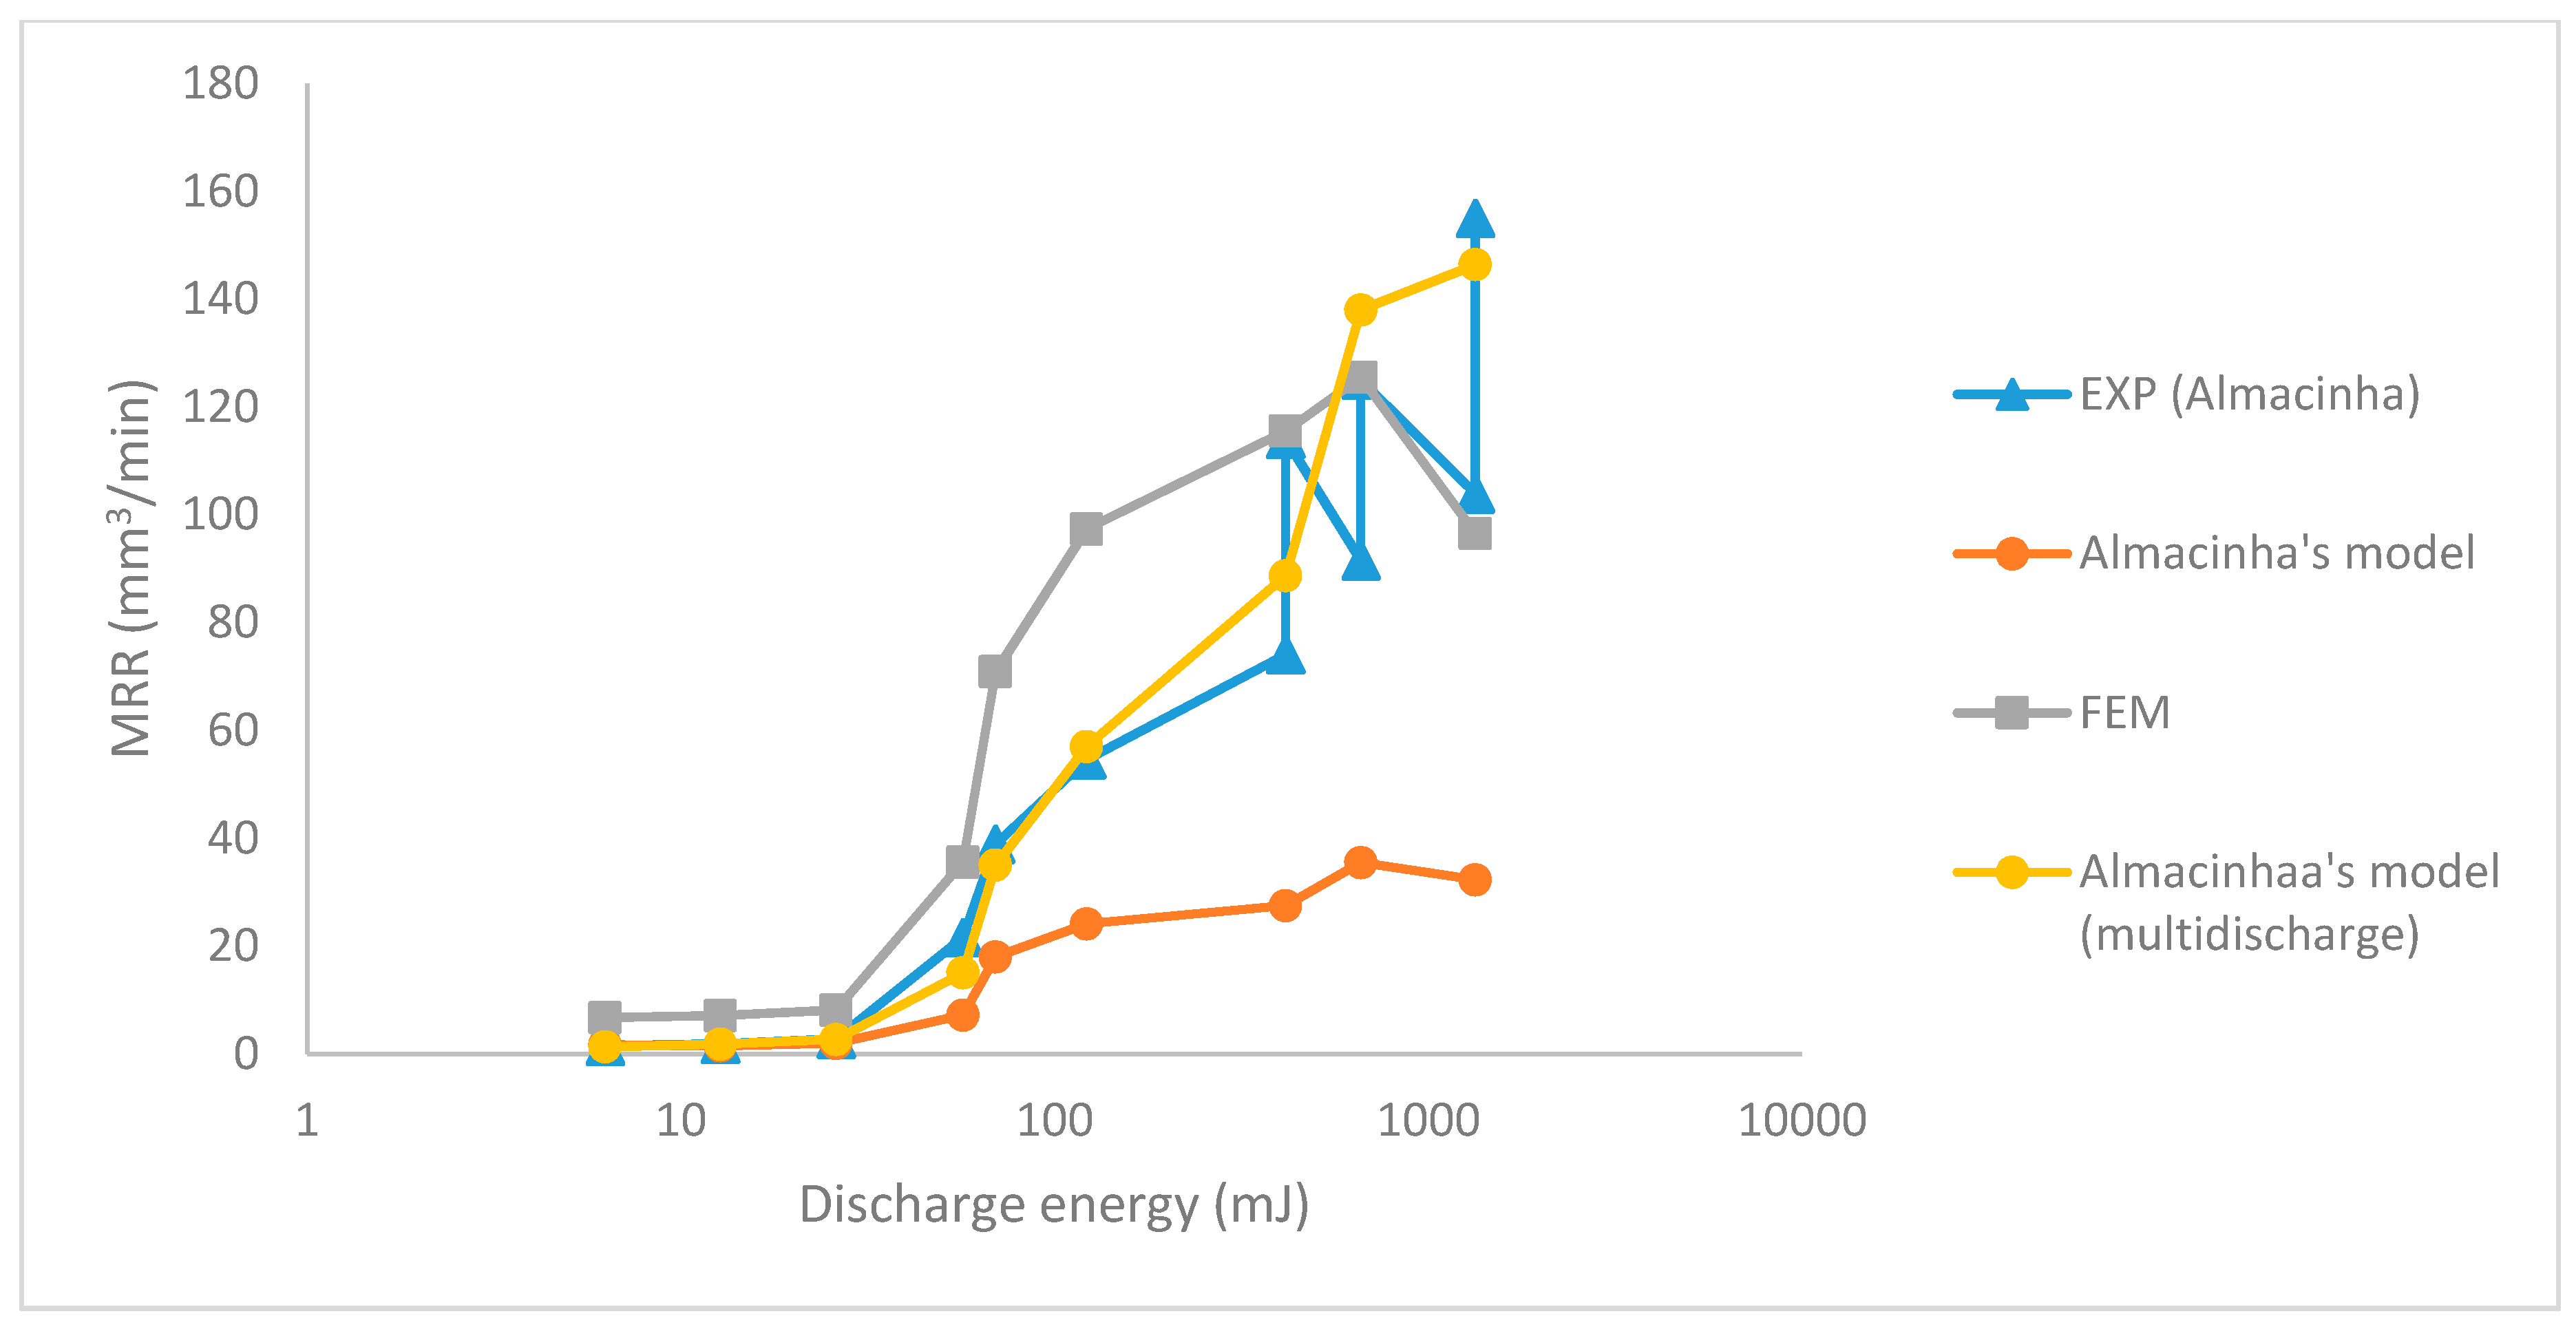
In order to validate the model, both MRR and surface roughness were compared against the previously published results. Figure 9 shows the material removal rate obtained from our model with and without considering instantaneous evaporation, as well as numerical analysis by Joshi [21] and experimental results reported by DiBitonto [7]. Table 1 provides detailed information about the experimental input parameters used for comparison. As it can be seen, there is good agreement between our model and experimental results, thereby validating our numerical scheme. Compared to the standard FEM model, the FEM model with instantaneous evaporation had 1.5% better agreement with the experimental values. Figure 10 shows a comparison of the model with numerical and experimental results from Almacihna et al. [22]. For discharge energies of 420, 660, and 1340 mJ, Almacinha provided two sets of data; lower values of MRR correspond to experiments without flushing while higher values were experiments when flushing was activated. For the first two points, the model shows very good agreement with the experiments when flushing was performed. This was due to the fact that in the model, no recast layer was considered and all molten material was removed, a condition that is more likely to happen when fluid flushing is active in the EDM process. The discrepancy at high discharge energies is possibly due to the invalidity of the heat input radius for energies higher than 670 mJ.
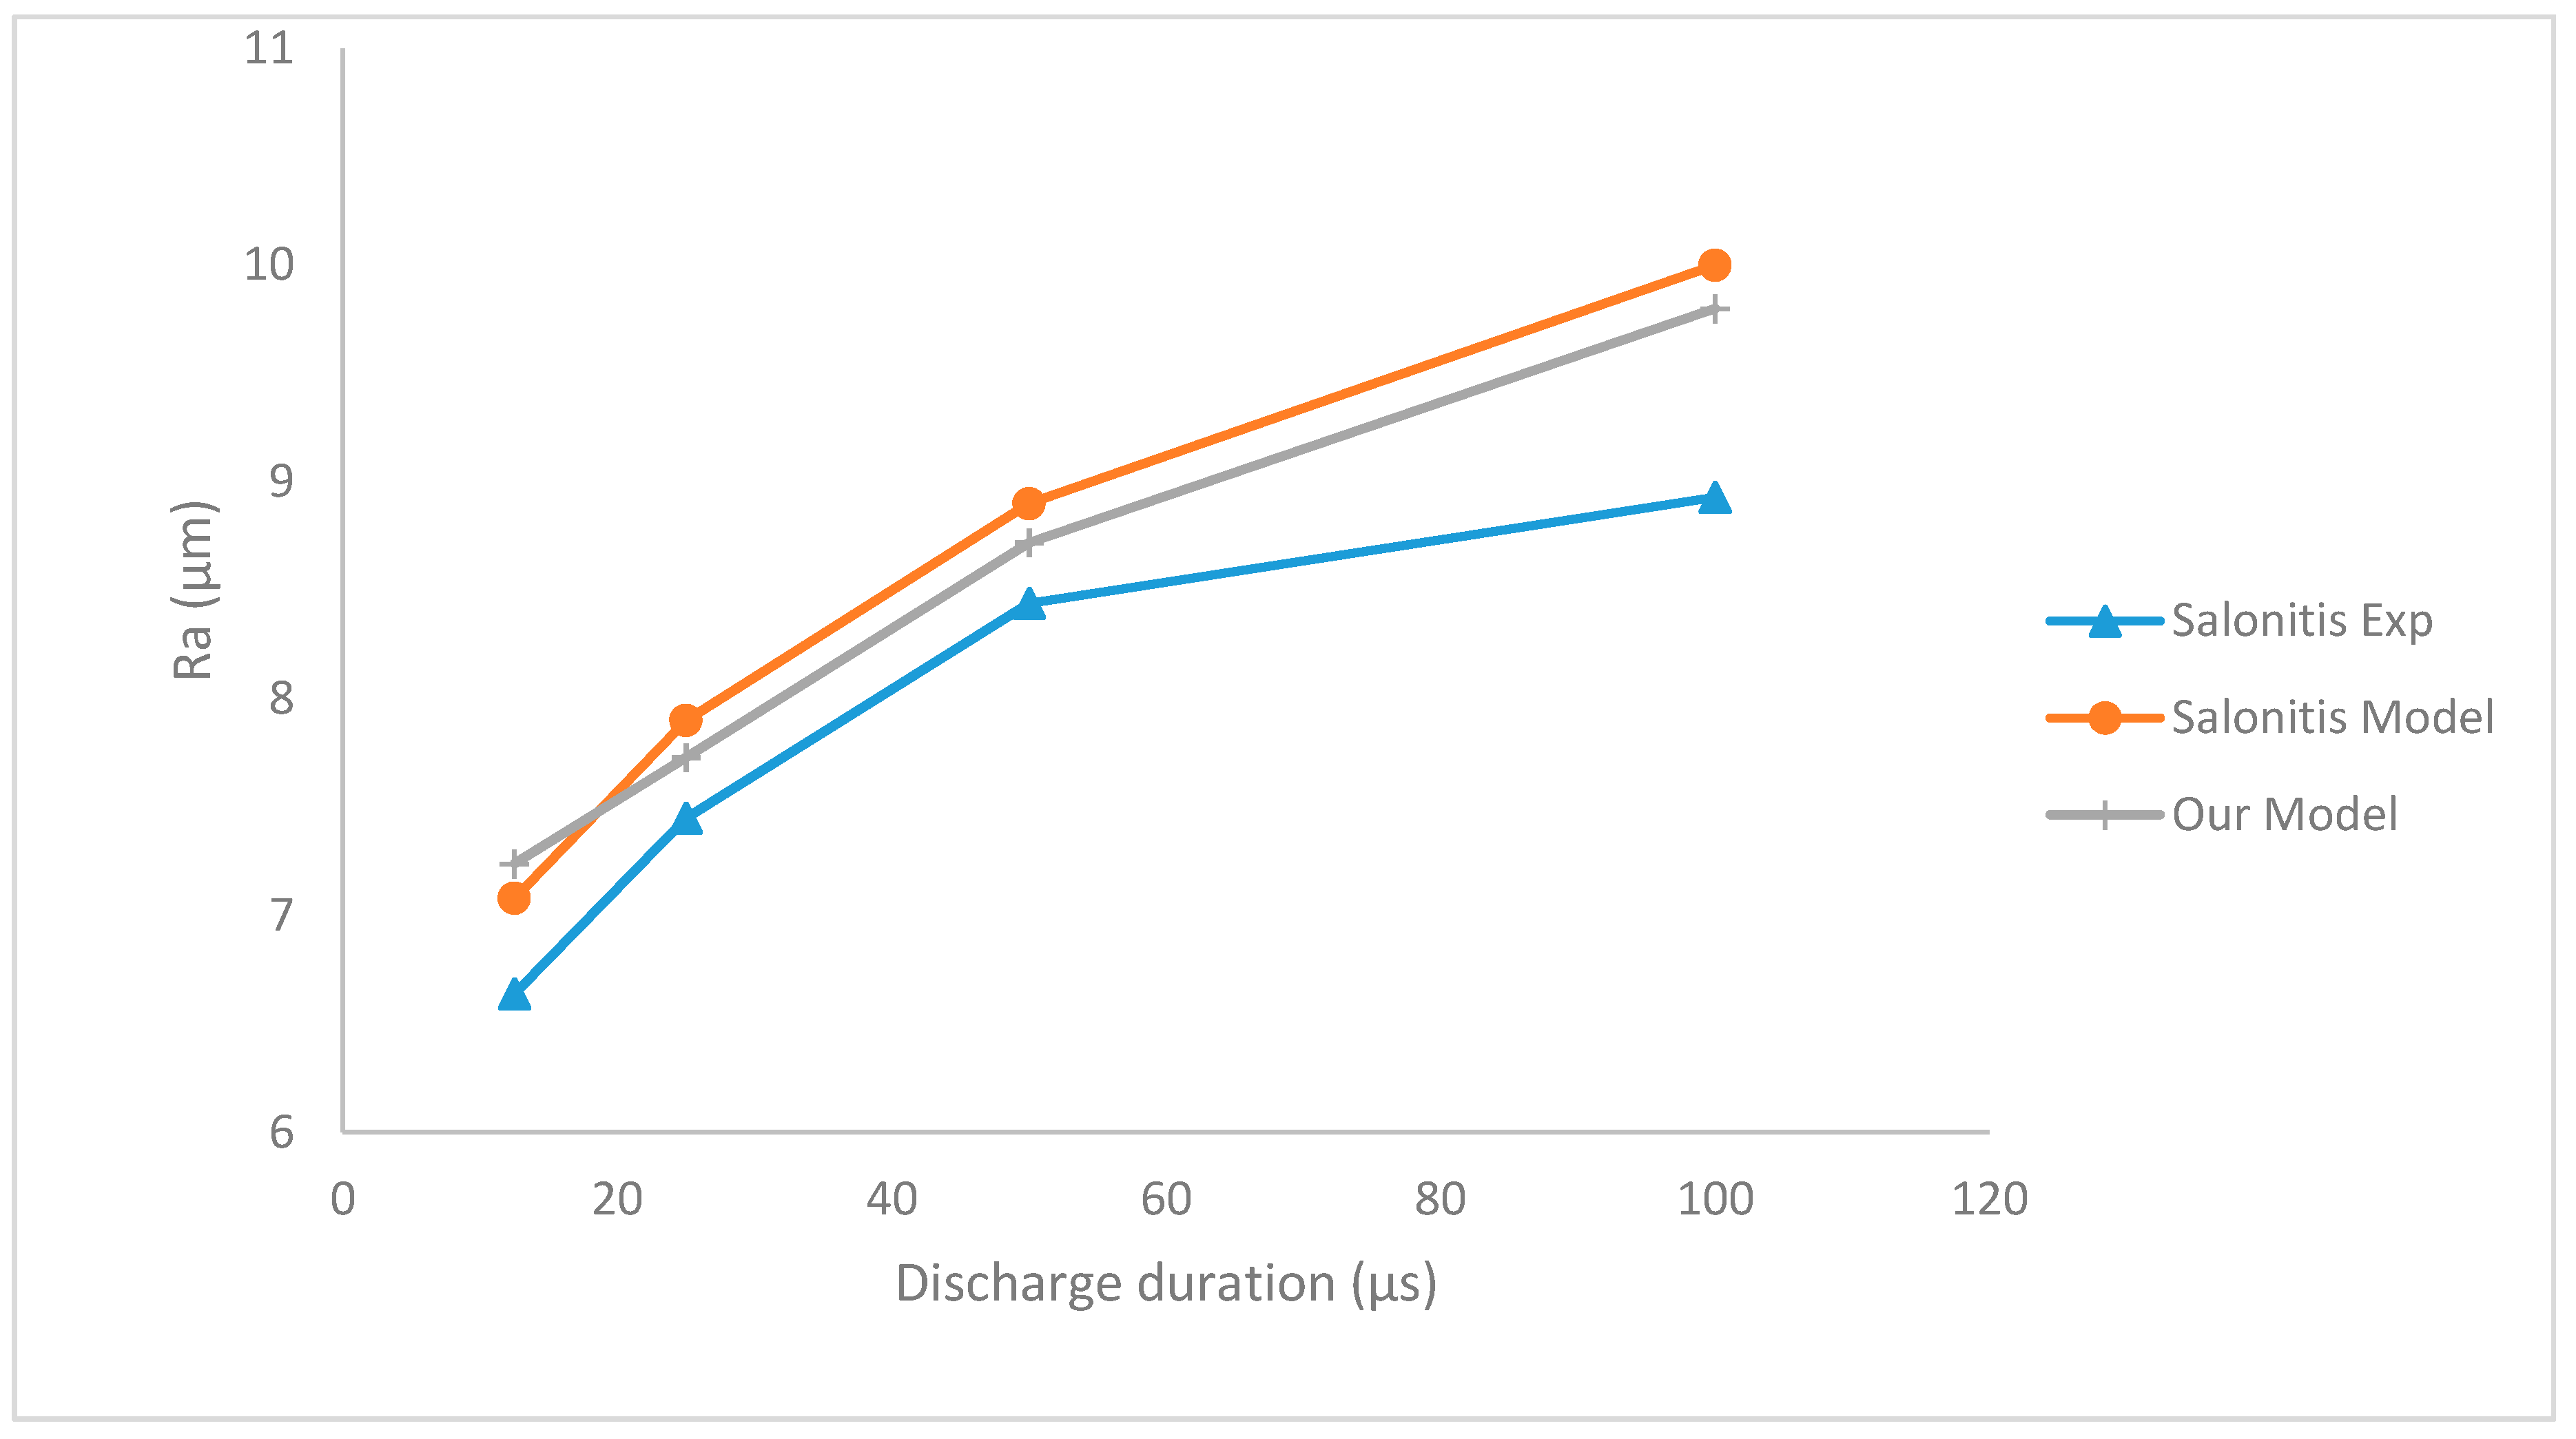
In Figure 11, the surface roughness from our model, and theoretical analysis of Salonitis [29] and experimental results are shown. Table 2 provides the detailed information about the experimental input parameters used for comparison. In Salonitis’s work, the surface roughness was calculated from the average heights of two overlapping craters. Parameters in their model were evaluated based on a crater generated by a single discharge. According to Figure 11, the surface roughness predicted by our model was closer to the experimental data than for Salonitis’ model. A possible explanation for the discrepancy between Salonitis and our model is that Salonitis’ model considered many simplifying assumptions such as uniform heat source. The deviation between our model and Salonitis model and experimental values were 6.4% and 7.5%, respectively. Another comparison of surface roughness obtained from the model with experimental values [22] are shown in Table 3. The model predicts the increasing trend of surface roughness with an increase in discharge energy. There is no exact relation between mean surface roughness (Ra) and ten-point mean roughness (Rz). According to Whitehouse [43] and DIN 47 [44], ten-point roughness (Rz) is between 3 to 10 times larger than mean surface roughness (Ra). Via consideration of the mentioned relation between Ra and Rz, numerical results (Ra) obtained from the model lie between these two bounds (i.e., 1/3 and 1/10 times of Rz), therefore validating our model.

5. Conclusions

Numerical models based on the heat conduction equation for the evaluation of crater geometry, MRR, and surface roughness of the EDM process were proposed. It can be concluded that more realistic results can be obtained by considering the effects of the residual heat generated from each spark and instantaneous evaporation. Additionally, the dependency of both MRR and surface roughness on process parameters were determined. Good agreement between our model and experimental data have been illustrated. Comparisons of models with and without instantaneous evaporation demonstrates that for a shorter discharge time and higher energies, evaporation plays a significant part in the removal of material. The model with IE had 1.5% better prediction performance regarding MRR. Also, the residual heat in each spark could not be ignored in the evaluation of the surface roughness. Therefore, authors recommend evaluating MRR and surface roughness via a more comprehensive 3D thermal model. In addition, if the effect of dielectric flow on surface roughness can be incorporated, better correlation with empirical data can be expected. In recent years, ceramics have gained more attention in industries. Despite this fact, theoretical modeling of EDM for ceramic materials is still scarce. Future work will also be focused on the numerical investigation of EDM for non-conductive ceramic materials.

Author Contributions

A.P. conceived the idea of this research; A.R. conducted the modeling work and wrote part of the paper under the supervision of C.M. and A.P.; D.T. assisted in editing the paper.

Funding

This research study was funded by Nazarbayev University under the project “Multi-scale Investigation of the Machining Behavior of Non-Conductive Ceramics Using Electro-Discharge Machining” (grant No. 090118FD5324). The APC was funded by 090118FD5324.

Acknowledgments

The authors would like to express their deepest gratitude to Pauline Mcloone for checking the English of this paper.

Conflicts of Interest

The authors declare no conflict of interest.

Abbreviations

cpspecific heat capacity (J kg−1 K−1)
cp,effeffective specific heat capacity (J kg−1 K−1)
Divolume of horizontal disks in crater (m3)
ddistant from the edge of crater (m)
Fcenergy fraction to workpiece
Idischarge current (A)
kthermal conductivity (W m−1 K−1)
MRRmaterial removal rate (mm3 min−1)
nnormal vector
qheat flux distribution (W m−2)
rradial radius (m)
Ramean surface roughness (m)
Rpplasma radius (m)
Rzten-point surface roughness (m)
ttime (s)
Ttemperature (K)
Tiinitial temperature (K)
tonpulse-on time (s)
toffpulse-off time (s)
Tdielectric temperature (K)
Vdischarge voltage (V)
Vcvolume of crater (m3)
xspatial coordinate (m)
yspatial coordinate (m)
αthermal diffusivity (m2 s−1)
ρdensity (kg m−3)
λlatent heat of melting (J kg−1)
2Laplace operator
Qmaxmaximum heat flux
σstandard deviation of distribution

References

  1. Shahri, H.R.F.; Mahdavinejad, R.; Ashjaee, M.; Abdullah, A. A comparative investigation on temperature distribution in electric discharge machining process through analytical, numerical and experimental methods. Int. J. Mach. Tools Manuf. 2017, 114, 35–53. [Google Scholar] [CrossRef]
  2. Jilani, S.T.; Pandey, P. Analysis and modelling of edm parameters. Precis. Eng. 1982, 4, 215–221. [Google Scholar] [CrossRef]
  3. Singh, A.; Ghosh, A. A thermo-electric model of material removal during electric discharge machining. Int. J. Mach. Tools Manuf. 1999, 39, 669–682. [Google Scholar] [CrossRef]
  4. Bilal, A.; Jahan, M.; Talamona, D.; Perveen, A. Electro-discharge machining of ceramics: A review. Micromachines 2019, 10, 10. [Google Scholar] [CrossRef] [PubMed]
  5. Sabyrov, N.; Jahan, M.; Bilal, A.; Perveen, A. Ultrasonic vibration assisted electro-discharge machining (edm)—An overview. Materials 2019, 12, 522. [Google Scholar] [CrossRef] [PubMed]
  6. Van Dijck, F.; Dutre, W. Heat conduction model for the calculation of the volume of molten metal in electric discharges. J. Phys. D Appl. Phys. 1974, 7, 899. [Google Scholar] [CrossRef]
  7. DiBitonto, D.D.; Eubank, P.T.; Patel, M.R.; Barrufet, M.A. Theoretical models of the electrical discharge machining process. I. A simple cathode erosion model. J. Appl. Phys. 1989, 66, 4095. [Google Scholar] [CrossRef]
  8. Patel, M.R.; Barrufet, M.A.; Eubank, P.T.; DiBitonto, D.D. Theoretical models of the electrical discharge machining process. II. The anode erosion model. J. Appl. Phys. 1989, 66, 4104. [Google Scholar] [CrossRef]
  9. Beck, J.V. Transient temperatures in a semi-infinite cylinder heated by a disk heat source. Int. J. Heat Mass Transf. 1981, 24, 1631–1640. [Google Scholar] [CrossRef]
  10. D’Urso, G.; Maccarini, G.; Ravasio, C. Influence of electrode material in micro-edm drilling of stainless steel and tungsten carbide. Int. J. Adv. Manuf. Technol. 2016, 85, 2013–2025. [Google Scholar] [CrossRef]
  11. D’Urso, G.; Ravasio, C. Material-technology index to evaluate micro-edm drilling process. J. Manuf. Process. 2017, 26, 13–21. [Google Scholar] [CrossRef]
  12. Tsai, Y.-Y.; Masuzawa, T. An index to evaluate the wear resistance of the electrode in micro-edm. J. Mater. Process. Technol. 2004, 149, 304–309. [Google Scholar] [CrossRef]
  13. Marafona, J.D.; Araujo, A. Influence of workpiece hardness on edm performance. Int. J. Mach. Tools Manuf. 2009, 49, 744–748. [Google Scholar] [CrossRef]
  14. Alshemary, A.; Pramanik, A.; Basak, A.; Littlefair, G. Accuracy of duplex stainless steel feature generated by electrical discharge machining (edm). Measurement 2018, 130, 137–144. [Google Scholar] [CrossRef]
  15. Mandal, A.; Dixit, A.R.; Chattopadhyaya, S.; Paramanik, A.; Hloch, S.; Królczyk, G. Improvement of surface integrity of nimonic C 263 super alloy produced by wedm through various post-processing techniques. Int. J. Adv. Manuf. Technol. 2017, 93, 433–443. [Google Scholar] [CrossRef]
  16. Prakash, C.; Singh, S.; Pruncu, C.I.; Mishra, V.; Królczyk, G.; Pimenov, D.Y.; Pramanik, A. Surface modification of ti-6al-4v alloy by electrical discharge coating process using partially sintered ti-nb electrode. Materials 2019, 12, 1006. [Google Scholar] [CrossRef] [PubMed]
  17. Mahardika, M.; Tsujimoto, T.; Mitsui, K. A new approach on the determination of ease of machining by edm processes. Int. J. Mach. Tools Manuf. 2008, 48, 746–760. [Google Scholar] [CrossRef]
  18. Izquierdo, B.; Sanchez, J.; Plaza, S.; Pombo, I.; Ortega, N. A numerical model of the edm process considering the effect of multiple discharges. Int. J. Mach. Tools Manuf. 2009, 49, 220–229. [Google Scholar] [CrossRef]
  19. Tlili, A.; Ghanem, F.; Salah, N.B. A contribution in edm simulation field. Int. J. Adv. Manuf. Technol. 2015, 79, 921–935. [Google Scholar] [CrossRef]
  20. Marafona, J.; Chousal, J. A finite element model of edm based on the joule effect. Int. J. Mach. Tools Manuf. 2006, 46, 595–602. [Google Scholar] [CrossRef]
  21. Shankar, P.; Jain, V.; Sundararajan, T. Analysis of spark profiles during edm process. Mach. Sci. Technol. 1997, 1, 195–217. [Google Scholar] [CrossRef]
  22. Almacinha, J.; Lopes, A.; Rosa, P.; Marafona, J. How hydrogen dielectric strength forces the work voltage in the electric discharge machining. Micromachines 2018, 9, 240. [Google Scholar] [CrossRef]
  23. Kansal, H.; Singh, S.; Kumar, P. Numerical simulation of powder mixed electric discharge machining (PMEDM) using finite element method. Math. Comput. Model. 2008, 47, 1217–1237. [Google Scholar] [CrossRef]
  24. Assarzadeh, S.; Ghoreishi, M. Electro-thermal-based finite element simulation and experimental validation of material removal in static gap single-spark die-sinking electro-discharge machining process. Proc. Inst. Mech. Eng. Part B J. Eng. Manuf. 2017, 231, 28–47. [Google Scholar] [CrossRef]
  25. Jithin, S.; Raut, A.; Bhandarkar, U.V.; Joshi, S.S. Fe modeling for single spark in edm considering plasma flushing efficiency. Procedia Manuf. 2018, 26, 617–628. [Google Scholar] [CrossRef]
  26. Shabgard, M.; Ahmadi, R.; Seyedzavvar, M.; Oliaei, S.N.B. Mathematical and numerical modeling of the effect of input-parameters on the flushing efficiency of plasma channel in edm process. Int. J. Mach. Tools Manuf. 2013, 65, 79–87. [Google Scholar] [CrossRef]
  27. Kiran, M.K.; Joshi, S.S. Modeling of surface roughness and the role of debris in micro-edm. J. Manuf. Sci. Eng. 2007, 129, 265–273. [Google Scholar] [CrossRef]
  28. Yeo, S.; Kurnia, W.; Tan, P. Critical assessment and numerical comparison of electro-thermal models in edm. J. Mater. Process. Technol. 2008, 203, 241–251. [Google Scholar] [CrossRef]
  29. Salonitis, K.; Stournaras, A.; Stavropoulos, P.; Chryssolouris, G. Thermal modeling of the material removal rate and surface roughness for die-sinking edm. Int. J. Adv. Manuf. Technol. 2009, 40, 316–323. [Google Scholar] [CrossRef]
  30. Bergman, T.L.; Incropera, F.P.; DeWitt, D.P.; Lavine, A.S. Fundamentals of Heat and Mass Transfer; John Wiley & Sons: Hoboken, NJ, USA, 2011. [Google Scholar]
  31. Beck, J.V. Large time solutions for temperatures in a semi-infinite body with a disk heat source. Int. J. Heat Mass Transf. 1981, 24, 155–164. [Google Scholar] [CrossRef]
  32. Jilani, S.T.; Pandey, P. An analysis of surface erosion in electrical discharge machining. Wear 1983, 84, 275–284. [Google Scholar] [CrossRef]
  33. Snoeys, R.; Van Dyck, F. Investigations of edm operations by means of thermomathematical models. Ann. CIRPI 1971, 20, 35. [Google Scholar]
  34. Descoeudres, A.; Hollenstein, C.; Wälder, G.; Perez, R. Time-resolved imaging and spatially-resolved spectroscopy of electrical discharge machining plasma. J. Phys. D Appl. Phys. 2005, 38, 4066. [Google Scholar] [CrossRef]
  35. Joshi, S.; Pande, S. Thermo-physical modeling of die-sinking edm process. J. Manuf. Process. 2010, 12, 45–56. [Google Scholar] [CrossRef]
  36. Murali, M.S.; Yeo, S.-H. Process simulation and residual stress estimation of micro-electrodischarge machining using finite element method. Jpn. J. Appl. Phys. 2005, 44, 5254. [Google Scholar] [CrossRef]
  37. Montgomery, D.C. Introduction to Statistical Quality Control; John Wiley & Sons: Hoboken, NJ, USA, 2007. [Google Scholar]
  38. Somashekhar, K.; Mathew, J.; Ramachandran, N. Electrothermal theory approach for numerical approximation of the μ-edm process. Int. J. Adv. Manuf. Technol. 2012, 61, 1241–1246. [Google Scholar] [CrossRef]
  39. Kalajahi, M.H.; Ahmadi, S.R.; Oliaei, S.N.B. Experimental and finite element analysis of edm process and investigation of material removal rate by response surface methodology. Int. J. Adv. Manuf. Technol. 2013, 69, 687–704. [Google Scholar] [CrossRef]
  40. Ikai, T.; Fujita, I.; Hashiguchi, K. Heat input radius for crater formation in the electric discharge machining. IEEJ Trans. Ind. Appl. 1992, 112, 943–949. [Google Scholar] [CrossRef]
  41. Kiyak, M.; Çakır, O. Examination of machining parameters on surface roughness in edm of tool steel. J. Mater. Process. Technol. 2007, 191, 141–144. [Google Scholar] [CrossRef]
  42. Keskin, Y.; Halkacı, H.S.; Kizil, M. An experimental study for determination of the effects of machining parameters on surface roughness in electrical discharge machining (edm). Int. J. Adv. Manuf. Technol. 2006, 28, 1118–1121. [Google Scholar] [CrossRef]
  43. Whitehouse, D.J. Handbook of Surface and Nanometrology; CRC Press: Boca Raton, FL, USA, 2010. [Google Scholar]
  44. Determination of Surface Roughness Values of the Parameters r[a], r[z], r[max] by Means of Electrical Contact (Stylus) Instruments; Terminology, Measuring Conditions; German Institute for Standardisation: Berlin, Germany, 1990.
Figure 1. Schematic of model.
Machines 07 00047 g001
Figure 2. Variation of the crater geometry with discharge duration for: (a) radius, and (b) depth; and crater simulation for a current of (c) 10 A, (d) 20 A, (e) 30 A, and (f) 40 A (ton = 100 μs, V = 30 V, and electrical conductivity σ = 1.45 × 10⁶ S/m).
Machines 07 00047 g002aMachines 07 00047 g002b
Figure 3. Variation of MRR with discharge time.
Machines 07 00047 g003
Figure 4. Effects of discharge current and voltage on MRR.
Machines 07 00047 g004
Figure 5. Temperature distribution after 4 discharges.
Machines 07 00047 g005
Figure 6. Change of depth of crater with implementation of consecutive discharges.
Machines 07 00047 g006
Figure 7. Effects of discharge time on surface roughness.
Machines 07 00047 g007
Figure 8. Effects of discharge current and voltage on surface roughness.
Machines 07 00047 g008
Figure 9. Comparison of MRR obtained from our numerical model with experimental values from Dibitonto [7] (discharge voltage 25 V).
Machines 07 00047 g009
Figure 10. Comparison of MRR obtained from our numerical model with experimental values from Almacinha [22] (discharge voltage 20 V).
Machines 07 00047 g010
Figure 11. Comparison of surface roughness obtained from a numerical model and experimental values from Salonitis [29].
Machines 07 00047 g011
Table 1. Performance parameters of MRR simulation.
Exp (Di)JoshiFEM
Current (A)2.34–682.34–682.34–68
Discharge voltage (V)151515
Discharge duration (μs)5.6–5605.6–5605.6–560
Work materialsteelsteelsteel
Table 2. Performance parameters of surface roughness simulation.
Exp (Salontis)FEM
Current (A)2, 4, 1212
Discharge duration (μs)3.2, 6.4, 12.8, 25, 50, 1003.2, 6.4, 12.8, 25, 50, 100
Discharge voltage (V)3030
Table 3. Comparison of surface roughness from our numerical model and experimental values from Almacinha [22] and the corresponding performance parameter.
Rz (μm)Rz (μm)Ra (μm)
Discharge Energy (mJ)Discharge Current (A)Time-On (μs)Time-Off (μs)Exp (Almacinha)Almacinha’s ModelFEM
6.275.656751611.94.19
12.758.5752402216.15.21
26101303202719.46.61
56.8815.81801003226.77.45
69.4819.3180243830.58.76
121.9225.4240324837.112.54
415.9237.1560425450.414.04
66044750566560.717.69
1336.451.413001007070.822.35