Abstract
Electromyography (EMG) has been widely used in rehabilitation and myoelectric prosthetic applications. However, a recent increment in the number of EMG features has led to a high dimensional feature vector. This in turn will degrade the classification performance and increase the complexity of the recognition system. In this paper, we have proposed two new feature selection methods based on a tree growth algorithm (TGA) for EMG signals classification. In the first approach, two transfer functions are implemented to convert the continuous TGA into a binary version. For the second approach, the swap, crossover, and mutation operators are introduced in a modified binary tree growth algorithm for enhancing the exploitation and exploration behaviors. In this study, short time Fourier transform (STFT) is employed to transform the EMG signals into time-frequency representation. The features are then extracted from the STFT coefficient and form a feature vector. Afterward, the proposed feature selection methods are applied to evaluate the best feature subset from a large available feature set. The experimental results show the superiority of MBTGA not only in terms of feature reduction, but also the classification performance.
1. Introduction
Since the 1960s, the research community has been applying surface electromyography (EMG) for rehabilitation and clinical applications [1]. EMG is good at recording the muscle electrical activity generated by the muscle skin, and it provides the signal information related to movement. The usage of EMG in myoelectric control allows trans-radial amputees and patients to recover their lost hand functionality [2]. However, EMG signals suffer from various noise and artifacts, thus leading to a low recognition rate. For example, crosstalk is generated by the non-propagating signal components due to the loss of intracellular action potential. It strengthens with the decrease of inter-electrode distance. Even though crosstalk can be minimized by increasing the inter-electrode distance, some of it still exists [3,4]. Additionally, the growth in the number of upper limb movements again increases the difficulty of EMG signals classification [5,6]. Consequently, several processing steps are required to obtain meaningful signal information.
According to the literature, many researchers have employed the time domain (TD) features for EMG signals classification [7,8,9]. This is mainly due to the fast processing speed and simplicity of TD since TD does not involve any transformation in the process of feature extraction. However, the signal presented in TD does not offer frequency or spectral information. For this reason, many studies have analyzed the EMG signal using time-frequency transformation, especially for those involving the classification and diagnosis [10,11,12]. Unlike TD, time-frequency distribution (TFD) allows the representation of time and frequency information simultaneously, which provides more accurate signal information. In past studies, TFD such as Short Time Fourier Transform (STFT), Empirical Mode Decomposition (EMD), and Wavelet Transform (WT) has been widely applied in biomedical signal processing [11,13,14,15]. Previous works showed that TFD usually offered satisfactory results for classification, recognition, and diagnosis. In this study, the features extracted from STFT have been used to characterize the EMG patterns. It has been found that these features are useful in EMG pattern recognition.
Generally, TFD transforms the EMG signal into a two-dimensional matrix for obtaining useful time and frequency information. Unfortunately, the features extracted from the EMG signal using TFD lead to a high dimensional feature vector [11,16]. Intuitively, a high dimensional feature vector not only increases the complexity, but also degrades the performance of classifiers. According to the literature, multiple combinations of EMG features have been proposed in the classification of EMG signals. Previous works indicated that a proper selection of EMG features was able to improve the classification performance [17,18,19]. However, the selection of optimal features required expert knowledge and expertise. In addition, feature selection is an NP-hard combinatorial problem, and the possible solutions (feature subsets) would be 2D, where D is the number of features. Accordingly, it is impractical to perform an exhaustive search to look for the best feature subset [20]. Therefore, pre-processing, such as feature projection and feature selection, can be used to solve the dimensionality problem [7,21,22].
Feature Projection is one of the popular ways to tackle the dimensionality problem. It converts the high dimensional features into a smaller number of new features. Examples of feature projection are principal component analysis (PCA), independent component analysis (ICA), fisher discriminate analysis (FDA), and common spatial pattern (CSP). In a past study, Subasi et al. [23] applied the ICA together with neural networks for muscle fatigue detection. Two years later, Zhang et al. [24] made use of PCA to reduce the dimensionality of the feature vector. The authors reported that a proper selection of principal components can lead to better classification results. Wang et al. [25] employed the FDA for dimensionality reduction in EMG signals classification. The authors indicated that the reduced feature subset can produce a high accuracy when a linear discriminate analysis (LDA) classifier is implemented. More studies of feature projection can be found in [9,14,26]. Indeed, feature projection can reduce the number of features, but the original feature information is lost. Moreover, the number of components (new features) need to be carefully selected since they have a great influence on the classification performance. Hence, feature projection might not be an effective approach for EMG pattern recognition.
Unlike feature projection, feature selection identifies the important features without changing the information content [27]. Feature selection aims to enhance the classification performance by reducing the number of irrelevant and redundant features. In general, feature selection can be categorized into filter and wrapper approaches. The wrapper approach utilizes the metaheuristic algorithm to optimize the classification performance by selecting the best combination of relevant features. On the other hand, the filter approach selects the relevant features based on the statistical, distance, and mutual information. Compared to the wrapper approach, the filter approach is independent of the learning algorithm and is less time consuming. However, the wrapper approach can often obtain better results [28]. Needless to say, wrapper-based feature selection has become one of the major interests in recent engineering applications. As for feature selection, Wan et al. [29] proposed two feature selection approaches based on modified binary coded ant colony optimization (MBACO). The authors introduced visibility density and pheromone density models for performance enhancement. Zhang et al. [30] came up with the idea of the implementation of a mutation operator into binary particle swarm optimization (BPSO) for feature selection. The authors indicated that mutation had the capability to explore untried areas, which can improve the diversity of BPSO. Moreover, Rejer [31] proposed the genetic algorithm with aggressive mutation (GAAM) for a brain computer interface. In comparison with other conventional methods, GAAM was found to be the optimal in feature selection. Previous studies indicated that optimization algorithms are able to offer a promising performance in feature selection.
Due to the increment of EMG channels and features, the dimension of features has been increased. In the literature, many features have been developed for myoelectric prosthetic control based on the EMG signals. However, far less solutions exist for the selection of features [32,33]. One of the reasons for this might be that the EMG signal is subject independent. In other words, different subjects have a higher chance of generating different kinds of EMG signals. This means that the optimal features vary from subject to subject, so are difficult to analyze. Moreover, the selection of the channel is another issue that needs to be considered in feature selection. Thus, this study aims to apply wrapper-based feature selection for evaluating the optimal combination of features and channels.
In this paper, two binary versions of a tree growth algorithm (TGA) called the binary tree growth algorithm (BTGA) and modified binary tree growth algorithm (MBTGA) are proposed to solve the feature selection problem in EMG signals classification. In the first approach, BTGA converts the continuous TGA into a binary version using two different transfer functions. On one side, the swap, crossover, and mutation operators are introduced in MBTGA for improving the performance of BTGA in feature selection. The proposed feature selection methods are tested using the EMG data acquired from ten healthy subjects who performed 40 classes of hand movements. Based on the experimental results, our method has a higher capability in feature selection, which leads to a competitive classification performance.
2. Standard Tree Growth Algorithm
The tree growth algorithm (TGA) is a recent nature inspired metaheuristic optimization algorithm proposed by Cheraghalipour and his colleagues in 2018 [34]. In the jungle, the population of trees can be divided into four groups. The first group, called the best tree group, will grow further with a lower growth rate. The second group is the competitive for light tree group. In this group, the tree is moved toward the position with the distance close to the two nearest trees. The third group, which is the remove or replace group, aims to remove the worst trees and plant new trees. The final group is called the reproduction group. In this group, the best trees are used to create new plants. The algorithm of TGA is described as follows:
In the first step, an initial population of trees is randomly generated. Then, the fitness of each tree is evaluated. The population of trees is sorted in ascending order according to the fitness value. Next, the best N1 trees are assigned to the first tree group. In this group, the new tree is generated as follows:
where Xi is the tree (solution) at i order in the population, θ is the tree reduction rate of power, t is the number of iterations, and r is a random number distributed between [0,1]. If the newly generated tree achieves a better fitness value, then the current tree will be replaced. Otherwise, the current tree is kept for the next generation.
In the next step, N2 trees are moved into the second group. For each tree, the two nearest trees (from first group and second group) are determined by calculating the Euclidean distance as follows:
where XN2 is the current tree and Xi denotes the ith tree in the population. Note that the distance becomes infinity when XN2 is the same as Xi, where N2 = i. Afterward, the current tree moves toward the nearest trees to compete for light. A linear combination of the two nearest trees is computed as follows:
where T1 is the first nearest tree, T2 is the second nearest tree, and λ is the parameter that is used to control the influence of the nearest tree. In the second group, the position of the tree is updated as:
where α denotes the angle distributed between 0 and 1.
In the third group, the N3 worst trees are removed and replaced with the new trees (new solutions). The N3 is calculated as:
where N is the population size, N1 is the number of trees in the first group, and N2 is the number of trees in the second group.
In the final group, new N4 trees are generated around the best trees (first tree group) using the mask operator. Note that the number of N4 should not exceed the total number of N1 and N2 [34]. After that, the newly generated N4 trees are added into the population. The merged population is sorted according to the fitness value. Then, the best N trees are selected as the new population for the next iteration. The algorithm is repeated until the terminated criterion is satisfied. Finally, the global best tree is selected as the best solution.
3. Materials and Methods
Figure 1 shows the flow diagram of the proposed EMG pattern recognition system. Firstly, STFT is used to transform the EMG signals into time-frequency representation (TFR). Secondly, the features are extracted from the STFT coefficient. Then, the proposed feature selection methods are applied to evaluate the most informative feature subset. Finally, the KNN algorithm is used to classify the selected features for the recognition of 40 hand movement types.
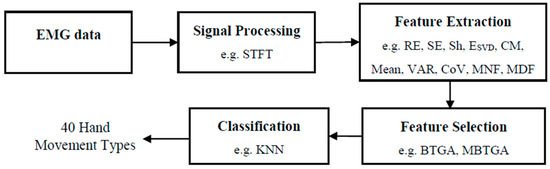
Figure 1.
Flowchart of proposed EMG pattern recognition system.
3.1. EMG Data
The EMG data is collected from the Non-Invasive Adaptive Hand Prosthetics (NinaPro) Database (https://www.idiap.ch/project/ninapro). The NinaPro database offers a large number of EMG data for upper limb movements. In this work, the EMG signals recorded from 40 hand movements types (Exercise B and C) from database 4 (DB4) are used [6]. DB4 contained the EMG signals acquired from 10 healthy subjects. In the experiment, subjects performed the hand movement for 5 s each, followed by a resting state of 3 s. Each hand movement was repeated six times. In addition, the EMG signals were sampled at 2 kHz and the Hampel filter was used to remove the 50 Hz power line interference [6]. Note that the resting states are removed before further processing is conducted.
3.2. STFT Based Feature Extraction
Short Time Fourier Transform (STFT) is the fundamental of the Time-Frequency Method, which is simple and easy to implement. Mathematically, STFT can be expressed as [35]:
where x(τ) is the EMG signal and w(τ − t) represents the Hanning window function. In this study, STFT with a window size of 256 ms (512 samples) is utilized. The number of Fourier points (nfft) is fixed at 512 samples. To extract the hidden information from the STFT coefficient, ten features depicted in Table 1 are extracted. These features are selected due to their promising performance in the literature [11,36,37]. In Table 1, S indicates the magnitude of STFT; P is the power spectrum; is the normalized singular value of the matrix of S; f is the frequency of the power spectrum; L is the total length of the time bin; M is the total length of the frequency bin; and σ and µ are the two-dimensional standard deviation and mean, respectively.

Table 1.
The time-frequency and statistical features extracted from STFT.
3.3. Proposed Feature Selection Approaches
To the best of our knowledge, TGA has not yet been applied for feature selection. Theoretically, TGA is comprised of many distinct characteristics that make it the favorable optimizer to solve engineering problems. As a bonus, TGA promotes the cooperation between four groups of trees to balance the exploration and exploitation. However, TGA is designed to solve the continuous optimization problem, but not for binary optimization, such as feature selection. To resolve the feature selection problem, a binary version of TGA is needed. In feature selection, bit ‘1’ means that the feature is selected, while bit ‘0’ represents the unselected feature. For example, given a solution with X = {0,1,0,1,1,0,1,0,0,0}. It shows that the second, fourth, fifth, and seventh features are selected.
In this work, two binary versions of TGA approaches are proposed for feature selection. The first approach implements the transfer function to convert the continuous TGA into a binary form. Consequently, a transfer function can be used to convert the non-binary position into the probability value, which allows the tree (solution) to move in the binary search space [38]. In the second approach, the operators in TGA are replaced by swap, crossover, and mutation, which provides the same role in heightening the exploration and exploitation behaviors. Similar to other wrapper-based feature selection methods, the proposed methods evaluate the relevant features based on the initial solutions. In the process of evaluation, the fitness of each solution is calculated. Iteratively, the solutions are evolved and the best feature subset (solution) is updated. Finally, the global best feature subset that offers the optimal fitness value is identified.
3.3.1. Binary Tree Growth Algorithm
According to the literature, the implementation of the transfer function is one of the efficient ways of converting the continuous optimizer into a binary version [39,40]. By applying the transfer function, the position of the tree is mapped to the probability value. Normally, a higher probability value indicates that the feature has a higher chance of being selected.
In this work, two transfer functions are used in BTGA for feature selection. The first transfer function is the sigmoid function and it can be defined as [38]:
where x is the dth dimension of the search space.
The second transfer function is the hyperbolic tangent function and it can be expressed as [41]:
where x is the dth dimension of the tree. The transfer functions convert the position into a probability value, which is between 0 to 1. Then, the position of tree is updated based on the probability value as follows:
where δ is a random number distributed between 0 and 1. As mentioned in TGA, a mask operation is implemented in the fourth tree group. For BTGA, the mask operation is described as shown in Figure 2.
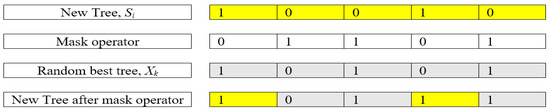
Figure 2.
An example of mask operation.
Figure 3 demonstrates the pseudocode of BTGA. Generally speaking, the procedure of BTGA is similar to TGA. Initially, an initial population of trees (solutions) is randomly generated. The fitness of each tree is calculated, and the trees are sorted in ascending order based on the obtained fitness values. Additionally, the global best tree is set. In the first group, the N1 new trees (trial trees) are generated as shown in Equation (1). Note that in the first and second groups, the new trees are converted into a binary form using Equation (8). The transfer function can be either Equations (6) or (7). If the new tree resulted in a better fitness value, then the current one will be replaced; otherwise, the current tree is kept for the next generation. For the second group, the two nearest trees for each tree are determined by applying Equation (2). Then, the position of N2 tree is updated as shown in Equations (3) and (4), respectively. In the third group, the N3 trees are removed and new trees are created. For the fourth group, the N4 new trees are generated by applying the mask operation around the best trees in the first group. After that, the newly generated N4 trees are added into the population. The merged population is ranked and the best N trees are kept for the next iteration. In each iteration, the global best tree is updated. The algorithm is repeated until the terminated criterion is satisfied. Finally, the global best tree is chosen as the optimal feature subset.
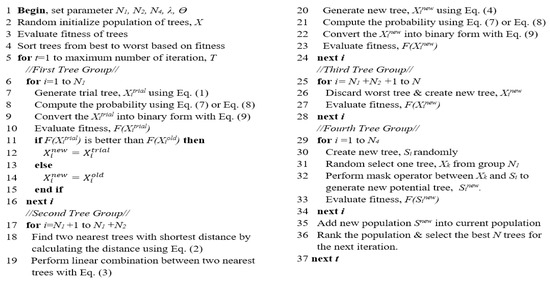
Figure 3.
Pseudocode of BTGA.
3.3.2. Modified Binary Tree Growth Algorithm
In the previous section, we have shown how the transfer functions can be used in BTGA for feature selection. However, from the experiment, we found that the transfer function forced the tree to move in the binary search space, thus leading to an ineffective solution. Therefore, several modifications have been proposed in the modified binary tree growth algorithm (MBTGA) for performance enhancement.
In the first tree group, BTGA applies the local search using Equation (1). However, Equation (1) does not work very well in binary form. More specifically, the local search is performed by the summation of the current tree itself. Figure 4 illustrates an example of a local search in BTGA. As can be seen, the bit ‘0’ will continue to stay as ‘0’ after the position update. This indicates that the unselected feature will not be selected in the first tree group. Obviously, this phenomenon causes BTGA to converge slowly and fall into the local optimum easily.
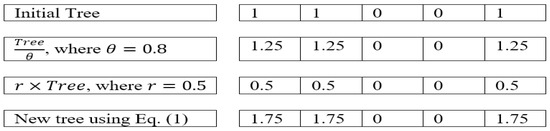
Figure 4.
Example of local search in BTGA.
To overcome the above limitation, a swap operator is proposed in MBTGA to replace Equation (1) with an efficient local search. Figure 5 shows the example of the swap operator. As can be seen, the swap operator performs a swap move by randomly changing a dimension of bit ‘0’ to ‘1’, and randomly changes another dimension of bit ‘1’ to bit ‘0’. This operation ensures a lower growth rate in the first tree group.
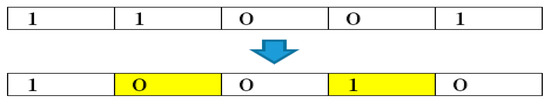
Figure 5.
An example of swap operator.
In the second tree group, the goodish trees cause light competition between the two nearest trees. Unlike BTGA, MBTGA does not apply the transfer function since the transfer function forces the position in the changing of the probability form. Hence, in order to obtain a linear relationship between the current tree and two nearest trees, a crossover operator is proposed. In MBTGA, the crossover is done between the current tree, the first nearest tree, and the second nearest tree. Mathematically, the crossover can be computed as shown in Equation (10).
where Xi is the ith tree in the population, T1 is the first nearest tree, T2 is the second nearest tree, d is the dimension of the search space, t is the number of iterations, and r1 is a random number drawn from a uniform distribution between 0 and 1. As can be seen from Equation (10), crossover tends to increase the possibility of trees moving toward the two nearest trees to compete for light. Furthermore, a mutation operator is employed to enhance the search ability of MBTGA as follows:
where Xid is the dth dimension of ith tree, MR is the mutation rate, and rand is the random number distributed between 0 and 1. Note that the mutation rate is linearly decreasing from 0.9 to 0, as shown in Equation (12).
where t is the number of iterations, r is the parameter that is used to control the mutation rate, and T is the maximum number of iterations. In this work, r is set at 0.9. Intuitively, mutation aims to balance the local and global searches based on the solution generated by the crossover operator. At the beginning of the iteration, a higher mutation rate allows more dimensions to be mutated, thus increasing the exploration in MBTGA. At the end of the iteration, a lower mutation rate guarantees exploitation, which performs a local search around the best solutions.
The pseudocode of MBTGA is shown in Figure 6. Firstly, the initial population of trees (solutions) is randomly generated. Then, the fitness of each tree is evaluated, and the trees are sorted in ascending order according to the fitness values. The global best tree is set. For each iteration, the mutation is computed as shown in Equation (12). In the next step, the N1 trees are assigned into the first group. In this group, the new trees (trial trees) are generated using the swap operator. After that, greedy selection is applied. If the newly generated tree obtains a better fitness value, then the current tree will be replaced. Otherwise, the current tree is kept for the next generation. Next, the N2 trees are allocated to the second group. For each tree, the two nearest trees are determined using Equation (2). Then, the crossover is computed between the current tree and two nearest trees for the competition for light. Additionally, a mutation operation is conducted based on the mutation rate. In the third tree group, the N3 trees are removed and new trees are planted. In the final tree group, new N4 trees are generated around the best solutions (first tree group) using the mask operator. The newly generated N4 trees are added into the current population. Afterward, the merged population is ranked, and the best N trees are selected as the new population for the next iteration. At the end of each iteration, the global best tree is updated. The algorithm is repeated until the terminated criterion is satisfied. Finally, the global best solution is selected as the best feature subset.
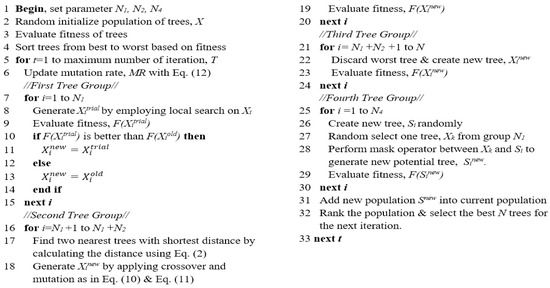
Figure 6.
Pseudocode of MBTGA.
The following observations outline how the proposed MBTGA theoretically has the capability to solve the feature selection problem against BTGA.
- MBTGA applies the swap operator to perform the local search, which overcomes the limitation of BTGA in the first group. This can ensure high exploitation in MBTGA.
- The use of crossover and mutation operators in MBTGA increases the global search ability, thus leading to high exploration.
- MBTGA has less parameters to adjust compared to BTGA. This again reduces the complexity of the algorithm.
3.3.3. Fitness Function
The proposed feature selection method aims to evaluate the best feature subset that achieves the optimal classification performance with the minimal number of features [42]. As for wrapper-based feature selection, a fitness function (objective function) is used to compute the fitness of each solution. In this framework, the fitness function that considers the classification performance and feature size is utilized, and it is defined as follows:
where ER is the classification error rate, |R| is the number of selected features, |S| is the total number of features, and β is the parameter that controls the importance of classification error and feature reduction. In this work, β is set at 0.99 since the classification performance is considered to be the most important [43].
In the process of fitness evaluation, a machine learning algorithm is implemented. Among the learning algorithm, k-nearest neighbor (KNN) is the most frequently used. This is mainly due to its speed and simplicity [44,45]. Hence, KNN is selected as the learning algorithm in this work. In the experiment, KNN with a k-value ranging from 1 to 10 is tested and the best k-value is found to be 1. Therefore, only KNN with k = 1 is applied in the rest of the paper.
3.4. Evaluation Criteria
For performance measurement, seven statistical parameters, namely classification accuracy, feature selection ratio, sensitivity, specificity, F-measure, geometric mean, and receiver operating characteristic curve, are calculated.
3.4.1. Classification Accuracy
Classification accuracy (CA) is defined as the accuracy of EMG signals classification for the recognition of 40 hand movement types [46]. In mathematics, CA can be represented as:
where K is the total number of hand movement types.
3.4.2. Feature Selection Ratio
The feature selection ratio (FSR) is the ratio of the number of selected features to the total number of features [43]. FSR can be defined as:
where |R| is the number of selected features and |S| is the total number of features in the original feature set.
3.4.3. Sensitivity and Specificity
Sensitivity (Se) and specificity (Sp) are two commonly used statistical parameters and they can be defined as [47,48]:
where TP is the true positive, TN is the true negative, FP is the false positive, and FN is the false negative.
3.4.4. F-Measure
F-measure is a statistical measure that describes the performance of the proposed method in the classification of EMG signals [33]. F-measure can be expressed as:
where TP is the true positive, FP is the false positive, and FN is the false negative.
3.4.5. Geometric Mean
Geometric mean (G-mean) is another statistical parameter that is good in performance measurement. Mathematically, G-mean can be calculated as [47]:
where Se is the sensitivity and Sp is the specificity.
3.4.6. ROC Analysis
The receiver operating characteristic curve (ROC) is the fundamental tool for classification system evaluation. In ROC analysis, AUC under the ROC curve is used to examine the performance of classifiers. A higher value of AUC indicates that the classifier has good characteristics [49]. Generally, ROC is designed to evaluate the performance of binary classifiers. For multiclass problems, the one versus all approach is applied.
4. Results and Discussions
Remarkably, ten features are extracted from each STFT coefficient. In total, 120 features (10 features × 12 channels) are collected from each hand movement from each subject. On one side, 240 instances (40 hand movement types × 6 repetitions) are acquired from each subject. In short, the size of the feature vector is 240 instances × 120 features.
To avoid different numerical contents in the feature vector, the Min-Max normalization is employed to normalize the features in the range between 0 and 1. Mathematically, Min-Max normalization can be expressed as [17]:
where fv represents the original features; and minj and maxj are the minimum and maximum values of features in dimension j, respectively.
In the present study, BTGA and MBTGA are proposed to solve the feature selection problem in the classification of EMG signals. For the ease of understanding, BTGA with sigmoid and hyperbolic tangent functions is represented as BTGA1 and BTGA2, respectively. To evaluate the effectiveness of the proposed method, MBTGA is compared with BTGA1, BTGA2, and binary differential evolution (BDE) [50]. The parameter settings of feature selection methods are described as follows: For both BTGA and MBTGA, the numbers of N1, N2, and N4 are chosen empirically as 10, 15, and 10, respectively. Note that BTGA has two additional parameters, θ and λ, that need to be adjusted. As recommended by the authors in [34], the values of θ and λ are chosen as 0.8 and 0.5, respectively. For BDE, the crossover rate, CR, is set at 1 [50]. To ensure a fair comparison, the population size and maximum number of iterations are fixed at 30 and 100, respectively.
The classification process is performed by using two-folds cross validation. In two-folds cross validation, the data set is partitioned into two equal parts (120 samples each). Each part takes turn to test, while the remaining part is used for the training set. The results are averaged for test folds. In order to obtain a significant statistical performance, each feature selection method is executed for 30 runs with different random seeds. The averaged results are used for performance comparison.
4.1. Classification Performance
Figure 7 presents the result of classification accuracy for individual subjects. It is observed that the classification performance has shown great improvement with feature selection. By applying MBTGA, subject 5, 7, 8, and 10 have shown an increment of above 5% in classification accuracy. The result obtained evidently proved the importance of feature selection in the data mining process. In Figure 7, the classification performance of BTGA2 was slightly better than BTGA1. These findings showed that the hyperbolic tangent function can usually achieve a better result, which is similar to the literature [39]. Inspecting the results, the classification performance of MBTGA was superior to BTGA1, BTGA2, and BDE. All in all, MBTGA is more capable of selecting the informative features. This is mainly due to the swap operation, which improves the local search ability of MBTGA in the process of evaluation.
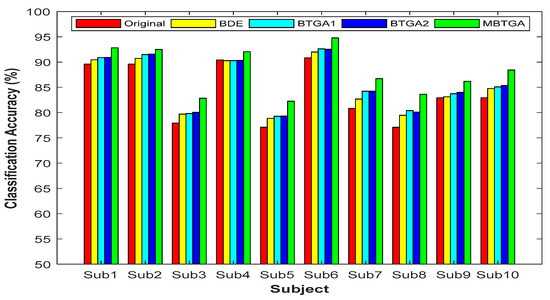
Figure 7.
Classification accuracy of proposed methods for individual subjects.
On average, across all subjects, MBTGA achieved the mean classification accuracy of 88.2%, which is the overall best in this work. In addition, MBTGA provided highly consistent results, with the smallest standard deviation of 4.59%. The results affirmed the effectiveness of crossover and mutation in enhancing the searching capability. Successively, MBTGA keeps tracking the solution globally in the beginning of the iteration, thus leading to high exploration. In the final iteration, MBTGA mutates the solution locally, which ensures high exploitation. The main reason why MBTGA outperforms other algorithms is that it has a good balance between exploration and exploitation.
4.2. Feature Selection Ratio
Figure 8 shows the result of the feature selection ratio (FSR) for individual subjects. Generally, a lower FSR means that less features are selected by the algorithm. By contrast, a higher FSR indicates that less features have been eliminated. Based on the result obtained, less than 50% of features were more than enough for accurate EMG signals classification. This implies that not all the features (original feature set) are relevant, and some of them might be redundant and irrelevant features. For BTGA2, nine out of ten subjects achieved a smaller FSR compared to MBTGA. The result showed that BTGA2 required less features while maintaining a high classification performance. Even though BTGA2 does not contribute to the optimal classification performance, however, it is good in feature reduction.
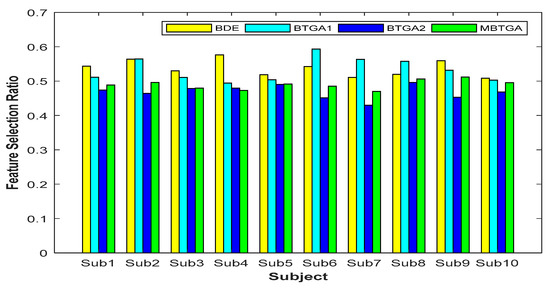
Figure 8.
Feature selection ratio of proposed methods for individual subjects.
4.3. Convergent Analysis
Figure 9 illustrates the convergent curve of proposed methods for individual subjects. It is worth noting that the average fitness is the average of fitness values obtained from 30 runs. From Figure 9, BDE, BTGA1, and BTGA2 offered fast convergent rates, but without acceleration. It is realized that BDE, BTGA1, and BTGA2 have premature convergents and were easily trapped in the local optimum. As can be observed, the implementation of the transfer function in BTGA1 and BTGA2 did not benefit the algorithm in feature selection. On the other side, it is seen that MBTGA has a very good diversity. MBTGA applies the swap operator, which ensures an efficient local search in the first group. Additionally, the crossover and mutation further improve the convergent. This explains why MBTGA outperforms BTGA1 and BTGA2 in feature selection. Moreover, MBTGA has the lowest average fitness value in this work. The experimental results confirmed the effectiveness of swap, crossover, and mutation operators in balancing the exploration and exploitation.
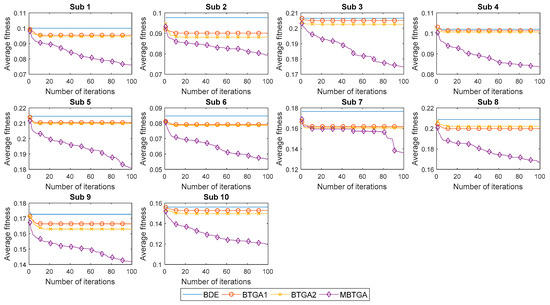
Figure 9.
Convergent curve of proposed methods for individual subjects.
4.4. Performance Measurement
Table 2 and Table 3 outline the results of sensitivity, specificity, F-measure, and G-mean. As can be seen, the original only has a mean sensitivity, specificity, F-measure, and G-mean of 0.8392, 0.9959, 0.8340, and 0.9024, respectively, which were the lowest values in the current work. Therefore, it can be inferred that by employing feature selection, the performance of the recognition system has been improved. Inspecting the results, MBTGA obtained the highest property among four methods. In comparison with BDE, BTGA1, and BTGA2, MBTGA achieved the highest mean value of sensitivity (0.8821), specificity (0.9970), F-measure (0.8787), and G-mean (0.9300). As expected, MBTGA provides a consistent increase of all performances. It turns out that MBTGA is the best feature selection method in this work.
Table 2.
Results of sensitivity and specificity of proposed methods.
Table 3.
Results of F-measure and G-mean of proposed methods.
4.5. ROC Analysis
Table 4 illustrates the detailed results of AUC for proposed methods. This table shows that the performance of MBTGA was advantageous compared to other competitors. By applying MBTGA, ten out of ten subjects yielded the highest AUC value. The result obtained endorsed MBTGA as having a consistently better classification accuracy and more stable performances.
Table 4.
Results of AUC of proposed methods.
4.6. Class-Wise Classification Performance
In the final part of the experiment, the class-wise accuracies (classification accuracy for each hand movement type) across 10 subjects are averaged to investigate the effectiveness of the proposed methods for the recognition capability of different classes. Figure 10 illustrates the overall confusion matrix of four feature selection methods across 10 subjects. The x-axis and y-axis represent the types of hand movement (from class 1 to class 40). By applying feature selection, the majority of the class has shown an improvement in classification performance. Especially for the 29th hand movement type, an increment of 16.76% in the classification accuracy is found when MBTGA is utilized. This shows that the recognition of hand movement can be enhanced if the feature selection method is applied. From Figure 10, MBTGA provided better class-wise classification results compared to BDE, BTGA1, and BTGA2. By applying MBTGA, 17 out of 40 hand movement types (accuracy higher than 90%) have been successfully recognized. Certainly, MBTGA offers a more accurate recognition of 40 hand movement types.
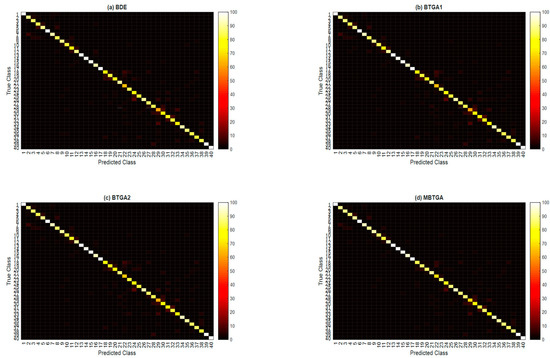
Figure 10.
Overall confusion matrix of four feature selection methods across 10 subjects. (a) BDE; (b) BTGA1; (c) BTGA2; (d) MBTGA.
Furthermore, a t-test is conducted to reveal the differences in the performance of MBTGA with other competitors. In the t-test, if the p-value is less than 0.05, the null hypothesis is rejected. Otherwise, the null hypothesis is accepted, which indicates that the performances of two methods are similar. In terms of classification accuracy, sensitivity, specificity, F-measure, G-mean, and AUC, there is a significant difference for MBTGA versus Original (p < 0.05), MBTGA versus BDE (p < 0.05), MBTGA versus BTGA1 (p < 0.05), and MBTGA versus BTGA2 (p < 0.05) across 10 subjects. The results showed that the performance of MBTGA was significantly better than other algorithms.
As a matter of fact, the selection of the optimal combination of features is an NP-hard problem, where the possible solution increases exponentially with the number of features. In addition, the best EMG feature subset is subject independent, which is different for each subject. Without proper feature selection, the performance of recognition is relatively poor. In the present work, we apply the MBTGA to improve the performance of EMG signals classification by evaluating the most informative feature subset. The proposed approach automatically selects the optimal features and produces the best possible combination of features and channels. It has to be mentioned that the proposed method can be implemented without prior knowledge. The users can extract several potential features from the EMG data, and the best feature subset will be evaluated by the algorithm. Once the best feature subset is identified, the feature extraction process will be executed for the selected features. This in turn will reduce the complexity of the recognition system. Based on the results obtained, the proposed method not only optimizes the classification performance, but also minimizes the number of features. By employing the feature selection, the classification performance has been improved while keeping a minimal number of features. According to this finding, MBTGA contributed a better performance compared to other methods. The experimental result validated the potential and capability of MBTGA in feature selection. In short, MBTGA has a high capability in selecting the optimal features, as well as the best feature in each channel. To this end, it can be inferred that MBTGA is useful in clinical and rehabilitation applications.
There are several limitations in this work. First, only time-frequency and statistical features extracted from STFT are used in the experiment. Other popular time-frequency methods such as WT and EMD can be considered for feature extraction. Second, the parameter settings of MBTGA are fixed in this work. For other applications, the users are recommended to test the parameters in order to achieve the optimal result. Third, only KNN has been implemented for fitness evaluation. Popular classifiers such as the support vector machine (SVM) and linear discriminate analysis (LDA) can be used as learning algorithms in the fitness evaluation, but with an extra computation cost.
5. Conclusions
In this paper, two efficient feature selection methods, namely the Binary Tree Growth Algorithm (BTGA) and Modified Binary Tree Growth Algorithm (MBTGA), are proposed to solve the feature selection problem for EMG signals classification. The proposed methods aim to evaluate the best feature subset that contributes the optimal classification result. Generally, BTGA is a binary optimization algorithm based on classical TGA. It uses the transfer function that allows the solution to move in the binary search space. On the other side, MBTGA is a modification of BTGA, which inherits the advantages of BTGA in feature selection. The main contribution in exploration and exploitation capabilities of MBTGA is that it utilizes the swap, crossover, and mutation operators in the searching process. Additionally, MBTGA has very few parameters to fine tune compared to BTGA. The experimental results revealed the exploration capabilities of MBTGA provided by the crossover and adaptive mutation. Through the convergent analysis, MBTGA was balanced between exploration and exploitation, thus leading to a high quality resolution. For instance, MBTGA also showed competitive results in term of sensitivity, specificity, F-measure, G-mean, and AUC values. Based on the obtained statistical results, MBTGA is proven to be the most effective and stable technique in this work. Considering the classification performance, feature size, and consistency, we conclude that MBTGA is a valuable feature selection tool for EMG signals classification. For future research, MBTGA can be applied to solve other binary optimization tasks, such as gene selection, the knapsack problem, the traveling salesman problem, cloud computing, and can optimize the connection weight in neural networks. Other popular strategies, such as chaotic map and opposition-based learning, can be implemented in MBTGA for performance enhancement.
Author Contributions
Conceptualization, J.T.; Formal analysis, J.T.; Funding acquisition, A.R.A. and N.M.A.; Investigation, J.T. and A.R.A.; Methodology, J.T. and A.R.A.; Software, J.T.; Supervision, A.R.A.; Validation, J.T., A.R.A. and N.M.S.; Writing—original draft, J.T.; Writing—review & editing, J.T., A.R.A., N.M.S., and N.M.A.
Funding
This research and the APC were funded by Minister of Higher Education Malaysia (MOHE) under grant number FRGS/1/2017/TK04/FKE-CeRIA/F00334.
Acknowledgments
The authors would like to thank the Minister of Higher Education Malaysia under grant number FRGS/1/2017/TK04/FKE-CeRIA/F00334 for supporting this research.
Conflicts of Interest
The authors declare no conflict of interest.
References
- Atzori, M.; Gijsberts, A.; Kuzborskij, I.; Elsig, S.; Hager, A.G.M.; Deriaz, O.; Castellini, C.; Müller, H.; Caputo, B. Characterization of a Benchmark Database for Myoelectric Movement Classification. IEEE Trans. Neural Syst. Rehabil. Eng. 2015, 23, 73–83. [Google Scholar] [CrossRef] [PubMed]
- Atzori, M.; Gijsberts, A.; Castellini, C.; Caputo, B.; Hager, A.G.M.; Elsig, S.; Giatsidis, G.; Bassetto, F.; Müller, H. Electromyography data for non-invasive naturally-controlled robotic hand prostheses. Sci. Data 2014, 23, 140053. [Google Scholar] [CrossRef]
- Chowdhury, R.H.; Reaz, M.B.; Ali, M.A.B.M.; Bakar, A.A.; Chellappan, K.; Chang, T.G. Surface electromyography signal processing and classification techniques. Sensors 2013, 13, 12431–12466. [Google Scholar] [CrossRef] [PubMed]
- Vieira, T.; Muceli, S.; Farina, D.; Botter, A. Large inter-electrode distances lead to more representative bipolar EMGs, not necessarily affected by crosstalk. Gait Posture 2016, 49, S28–S29. [Google Scholar] [CrossRef]
- Gijsberts, A.; Atzori, M.; Castellini, C.; Muller, H.; Caputo, B. Movement Error Rate for Evaluation of Machine Learning Methods for sEMG-Based Hand Movement Classification. IEEE Trans. Neural Syst. Rehabil. Eng. 2014, 22, 735–744. [Google Scholar] [CrossRef]
- Pizzolato, S.; Tagliapietra, L.; Cognolato, M.; Reggiani, M.; Müller, H.; Atzori, M. Comparison of six electromyography acquisition setups on hand movement classification tasks. PLoS ONE 2017, 12, e0186132. [Google Scholar] [CrossRef]
- Al-Angari, H.M.; Kanitz, G.; Tarantino, S.; Cipriani, C. Distance and mutual information methods for EMG feature and channel subset selection for classification of hand movements. Biomed. Signal Process. Control 2016, 27, 24–31. [Google Scholar] [CrossRef]
- Khushaba, R.N.; Takruri, M.; Miro, J.V.; Kodagoda, S. Towards limb position invariant myoelectric pattern recognition using time-dependent spectral features. Neural Netw. 2014, 55, 42–58. [Google Scholar] [CrossRef]
- Waris, A.; Niazi, I.K.; Jamil, M.; Englehart, K.; Jensen, W.; Kamavuako, E.N. Multiday Evaluation of Techniques for EMG Based Classification of Hand Motions. IEEE J. Biomed. Health Inform. 2018, 1. [Google Scholar] [CrossRef] [PubMed]
- Englehart, K.; Hudgins, B.; Parker, P.A.; Stevenson, M. Classification of the myoelectric signal using time-frequency based representations. Med. Eng. Phys. 1999, 21, 431–438. [Google Scholar] [CrossRef]
- Karthick, P.A.; Ghosh, D.M.; Ramakrishnan, S. Surface electromyography based muscle fatigue detection using high-resolution time-frequency methods and machine learning algorithms. Comput. Methods Programs Biomed. 2018, 154, 45–56. [Google Scholar] [CrossRef] [PubMed]
- Tapia, C.; Daud, O.; Ruiz-del-Solar, J. EMG Signal Filtering Based on Independent Component Analysis and Empirical Mode Decomposition for Estimation of Motor Activation Patterns. J. Med. Biol. Eng. 2017, 37, 140–155. [Google Scholar] [CrossRef]
- Naik, G.R.; Selvan, S.E.; Nguyen, H.T. Single-Channel EMG Classification with Ensemble-Empirical-Mode-Decomposition-Based ICA for Diagnosing Neuromuscular Disorders. IEEE Trans. Neural Syst. Rehabil. Eng. 2016, 24, 734–743. [Google Scholar] [CrossRef] [PubMed]
- Tsai, A.C.; Luh, J.J.; Lin, T.T. A novel STFT-ranking feature of multi-channel EMG for motion pattern recognition. Expert Syst. Appl. 2015, 42, 3327–3341. [Google Scholar] [CrossRef]
- Doulah, A.S.U.; Fattah, S.A.; Zhu, W.P.; Ahmad, M.O. Wavelet Domain Feature Extraction Scheme Based on Dominant Motor Unit Action Potential of EMG Signal for Neuromuscular Disease Classification. IEEE Trans. Biomed. Circuits Syst. 2014, 8, 155–164. [Google Scholar] [CrossRef] [PubMed]
- Phinyomark, A.; Nuidod, A.; Phukpattaranont, P.; Limsakul, C. Feature Extraction and Reduction of Wavelet Transform Coefficients for EMG Pattern Classification. Elektron. Elektrotech. 2012, 122, 27–32. [Google Scholar] [CrossRef]
- Phinyomark, A.; Phukpattaranont, P.; Limsakul, C. Feature reduction and selection for EMG signal classification. Expert Syst. Appl. 2012, 39, 7420–7431. [Google Scholar] [CrossRef]
- Phinyomark, A.; Khushaba, R.N.; Scheme, E. Feature Extraction and Selection for Myoelectric Control Based on Wearable EMG Sensors. Sensors 2018, 18, 1615. [Google Scholar] [CrossRef]
- Gu, Y.; Yang, D.; Huang, Q.; Yang, W.; Liu, H. Robust EMG pattern recognition in the presence of confounding factors: Features, classifiers and adaptive learning. Expert Syst. Appl. 2018, 96, 208–217. [Google Scholar] [CrossRef]
- Hancer, E.; Xue, B.; Zhang, M.; Karaboga, D.; Akay, B. Pareto front feature selection based on artificial bee colony optimization. Inf. Sci. 2018, 422, 462–479. [Google Scholar] [CrossRef]
- Geethanjali, P. Comparative study of PCA in classification of multichannel EMG signals. Australas. Phys. Eng. Sci. Med. 2015, 38, 331–343. [Google Scholar] [CrossRef] [PubMed]
- Kakoty, N.M.; Hazarika, S.M.; Gan, J.Q. EMG Feature Set Selection Through Linear Relationship for Grasp Recognition. J. Med. Biol. Eng. 2016, 36, 883–890. [Google Scholar] [CrossRef]
- Subasi, A.; Kiymik, M.K. Muscle fatigue detection in EMG using time–frequency methods, ICA and neural networks. J. Med. Syst. 2010, 34, 777–785. [Google Scholar] [CrossRef] [PubMed]
- Zhang, X.; Zhou, P. High-density myoelectric pattern recognition toward improved stroke rehabilitation. IEEE Trans. Biomed. Eng. 2012, 59, 1649–1657. [Google Scholar] [CrossRef]
- Wang, N.; Lao, K.; Zhang, X. Design and myoelectric control of an anthropomorphic prosthetic hand. J. Bionic Eng. 2017, 14, 47–59. [Google Scholar] [CrossRef]
- Riillo, F.; Quitadamo, L.R.; Cavrini, F.; Gruppioni, E.; Pinto, C.A.; Pastò, N.C.; Sbernini, L.; Albero, L.; Saggio, G. Optimization of EMG-based hand gesture recognition: Supervised vs. unsupervised data preprocessing on healthy subjects and transradial amputees. Biomed. Signal Process. Control 2014, 14, 117–125. [Google Scholar] [CrossRef]
- Mohammadi, F.G.; Abadeh, M.S. Image steganalysis using a bee colony based feature selection algorithm. Eng. Appl. Artif. Intell. 2014, 31, 35–43. [Google Scholar] [CrossRef]
- Xue, B.; Zhang, M.; Browne, W.N. Particle swarm optimisation for feature selection in classification: Novel initialisation and updating mechanisms. Appl. Soft Comput. 2014, 18, 261–276. [Google Scholar] [CrossRef]
- Wan, Y.; Wang, M.; Ye, Z.; Lai, X. A feature selection method based on modified binary coded ant colony optimization algorithm. Appl. Soft Comput. 2016, 49, 248–258. [Google Scholar] [CrossRef]
- Zhang, Y.; Wang, S.; Phillips, P.; Ji, G. Binary PSO with mutation operator for feature selection using decision tree applied to spam detection. Knowl.-Based Syst. 2014, 64, 22–31. [Google Scholar] [CrossRef]
- Rejer, I. Genetic algorithm with aggressive mutation for feature selection in BCI feature space. Pattern Anal. Appl. 2015, 18, 485–492. [Google Scholar] [CrossRef]
- Hariharan, M.; Fook, C.Y.; Sindhu, R.; Ilias, B.; Yaacob, S. A comparative study of wavelet families for classification of wrist motions. Comput. Electr. Eng. 2012, 38, 1798–1807. [Google Scholar] [CrossRef]
- Subasi, A. Classification of EMG signals using PSO optimized SVM for diagnosis of neuromuscular disorders. Comput. Biol. Med. 2013, 43, 576–586. [Google Scholar] [CrossRef] [PubMed]
- Cheraghalipour, A.; Hajiaghaei-Keshteli, M.; Paydar, M.M. Tree Growth Algorithm (TGA): A novel approach for solving optimization problems. Eng. Appl. Artif. Intell. 2018, 72, 393–414. [Google Scholar] [CrossRef]
- Tsai, A.C.; Hsieh, T.H.; Luh, J.J.; Lin, T.T. A comparison of upper-limb motion pattern recognition using EMG signals during dynamic and isometric muscle contractions. Biomed. Signal Process. Control 2014, 11, 17–26. [Google Scholar] [CrossRef]
- Gonzalez-Izal, M.; Malanda, A.; Navarro-Amezqueta, I.; Gorostiaga, E.M.; Mallor, F.; Ibanez, J.; Izquierdo, M. EMG spectral indices and muscle power fatigue during dynamic contractions. J. Electromyogr. Kinesiol. 2010, 20, 233–240. [Google Scholar] [CrossRef] [PubMed]
- Karthick, P.A.; Ramakrishnan, S. Surface electromyography based muscle fatigue progression analysis using modified B distribution time–frequency features. Biomed. Signal Process. Control 2016, 26, 42–51. [Google Scholar] [CrossRef]
- Kennedy, J.; Eberhart, R.C. A discrete binary version of the particle swarm algorithm. In Proceedings of the IEEE International Conference on Systems, Man, and Cybernetics, Computational Cybernetics and Simulation, Orlando, FL, USA, 11–15 October 1997. [Google Scholar]
- Mafarja, M.; Eleyan, D.; Abdullah, S.; Mirjalili, S. S-Shaped vs. V-Shaped Transfer Functions for Ant Lion Optimization Algorithm in Feature Selection Problem. In Proceedings of the International Conference on Future Networks and Distributed Systems, Cambridge, UK, 19–20 July 2017; ACM: New York, NY, USA, 2017. [Google Scholar]
- Mirjalili, S.; Lewis, A. S-shaped versus V-shaped transfer functions for binary Particle Swarm Optimization. Swarm Evol. Comput. 2013, 9, 1–14. [Google Scholar] [CrossRef]
- Chandrasekaran, K.; Simon, S.P.; Padhy, N.P. Binary real coded firefly algorithm for solving unit commitment problem. Inf. Sci. 2013, 249, 67–84. [Google Scholar] [CrossRef]
- Emary, E.; Zawbaa, H.M.; Hassanien, A.E. Binary grey wolf optimization approaches for feature selection. Neurocomputing 2016, 172, 371–381. [Google Scholar] [CrossRef]
- Tawhid, M.A.; Dsouza, K.B. Hybrid Binary Bat Enhanced Particle Swarm Optimization Algorithm for solving feature selection problems. Appl. Comput. Inform. 2018, in press. [Google Scholar] [CrossRef]
- Chuang, L.Y.; Chang, H.W.; Tu, C.J.; Yang, C.H. Improved binary PSO for feature selection using gene expression data. Comput. Biol. Chem. 2008, 32, 29–38. [Google Scholar] [CrossRef]
- Chuang, L.Y.; Yang, C.H.; Li, J.C. Chaotic maps based on binary particle swarm optimization for feature selection. Appl. Soft Comput. 2011, 11, 239–248. [Google Scholar] [CrossRef]
- Tkach, D.; Huang, H.; Kuiken, T.A. Study of stability of time-domain features for electromyographic pattern recognition. J. NeuroEng. Rehabil. 2010, 7, 21. [Google Scholar] [CrossRef] [PubMed]
- Li, Q.; Chen, H.; Huang, H.; Zhao, X.; Cai, Z.; Tong, C.; Liu, W.; Tian, X. An Enhanced Grey Wolf Optimization Based Feature Selection Wrapped Kernel Extreme Learning Machine for Medical Diagnosis. Comput. Math. Methods Med. 2017, 2017, 9512741. [Google Scholar] [CrossRef]
- Purushothaman, G.; Vikas, R. Identification of a feature selection based pattern recognition scheme for finger movement recognition from multichannel EMG signals. Australas. Phys. Eng. Sci. Med. 2018, 41, 549–559. [Google Scholar] [CrossRef]
- Wang, M.; Chen, H.; Yang, B.; Zhao, X.; Hu, L.; Cai, Z.; Huang, H.; Tong, C. Toward an optimal kernel extreme learning machine using a chaotic moth-flame optimization strategy with applications in medical diagnoses. Neurocomputing 2017, 267, 69–84. [Google Scholar] [CrossRef]
- Zorarpacı, E.; Özel, S.A. A hybrid approach of differential evolution and artificial bee colony for feature selection. Expert Syst. Appl. 2016, 62, 91–103. [Google Scholar] [CrossRef]


© 2018 by the authors. Licensee MDPI, Basel, Switzerland. This article is an open access article distributed under the terms and conditions of the Creative Commons Attribution (CC BY) license (http://creativecommons.org/licenses/by/4.0/).