1. Introduction
There has been a sustained technological development in the global community of makers of low-cost self-
replicating
rapid (RepRap) prototypers, which started with polymer 3-D printers that could fabricate approximately half of their components [
1,
2,
3]. Today these RepRap platforms have evolved to machines capable of manufacturing using subtractive [
4,
5] as well as additive methods in a wide variety of polymers [
5,
6,
7], composites [
8], ceramics [
9], and metals [
10,
11,
12,
13,
14,
15]. Of perhaps the most widespread interest in industry is the potential for a low-cost metal 3-D printer capable of printing both steel [
10] and aluminum parts [
11]. These open source metal 3-D printers can be fabricated for as little as $1200 [
10] using a conventional metal inert gas (MIG) welder and controlled with open-source Arduino electronic boards [
16], which effectively cuts the costs of metal 3-D printing by two orders of magnitude and make the technology far more accessible for a wide range of applications, perhaps even those in the developing world [
17,
18,
19]. The low-cost consumer-grade MIG welders used for RepRap 3-D metal printing contain minimal controls. To provide process optimization of these RepRap 3-D printers requires a low-cost sensor and data logger system to measure current and voltage of the gas metal arc welders (GMAW) and previous work has developed an open source method for real-time measurement of welder voltage or current at the expense of adding another Arduino microcontroller to the system [
20]. This data is critical for both gaining a fundamental understanding of the material processing technique in order to begin to optimize deposition predictively, but also in process monitoring is important for enabling feedback control and error detection.
In this study this extra cost is overcome as a new design is provided where the measurement of the current and voltage is done by attaching a measuring circuit to two analog inputs of the Arduino that is used to control the 3-D printer. The Franklin firmware, detailed extensively in Wijnen
et al. [
21] continuously sends the data that it reads from those pins to the host computer, which converts the raw ADC readings into voltage and current, and allows storing them on the file system. The web interface that is used to control the printer allows downloading those stored readings to the user’s computer. To test this custom current and voltage monitoring device this study reports on its use on an upgraded all metal RepRap during the printing of aluminum alloy mechanical test specimens [
22]. Common aluminum weld alloys include ER1100, ER4043, ER4047, and ER5356 (
Table 1). ER4943 is a new welding alloy that was designed to eliminate the need for chemical dilution required for traditional weld alloys in order to obtain a quality weld [
23]. Since ER4943 does not require chemical dilution, it may serve as an ideal 3-D printing alloy. Voltage and current were monitored during the printing of ER1100, ER4043, ER4943, ER4047, and ER5356. The voltage and current data were analyzed to provide monitoring on a per alloy basis and also layer-by-layer for 3-D printing metal process and property optimization.
Table 1.
Aluminum Weld Alloys and their Major Alloying Elements [
23,
24].
Table 1.
Aluminum Weld Alloys and their Major Alloying Elements [23,24].
| Alloy | Main Alloying Element |
|---|
| ER1100 | None; ≥99% Aluminum |
| ER4043 | 4.5%–6% Silicon |
| ER4943 | 5%–6% Silicon + 0.1%–0.5% Magnesium |
| ER4047 | 11%–13% Silicon |
| ER5356 | 4.5%–5.5% Magnesium |
2. Experimental Section
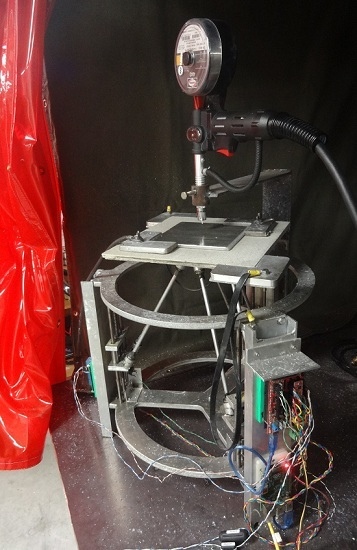
A low-cost, open-source, metal 3-D printer and an open-source software tool chain were used to print all test specimens. This metal 3-D printer utilized GMAW technology to weld aluminum parts 3-dimensionally. A Miller Spoolmate 100 weld gun supplied the feedstock material which was melted by a Millermatic 190 GMAW. The 3-D printer design described by Anzalone,
et al., [
10] and Haselhuhn,
et al. [
11] was further refined to the new machine design (
Figure 1). It was originally inspired by a Rostock self-replicating rapid prototyper, but was modified such that the weld gun print head remained stationary while the print substrate build plate moved on a 3-axis stage [
25]. Both the last version [
11] and this all-metal device have 304 mm long, 8 mm diameter guide rods on a 340 mm diameter circle. Following the Open Source Hardware Associations definition of open hardware [
26], the bill of materials and the open source blue prints for the magnetic bearing-based 3-D printer are available in the Open Science Framework [
27]. As can be seen in
Figure 1, the open-source controller and relay board are mounted to a leg with polymer RepRap 3-D printed parts that electrically isolate the electronics from the frame to minimize the potential of damaging electronics should the frame become electrified during GMAW printing.
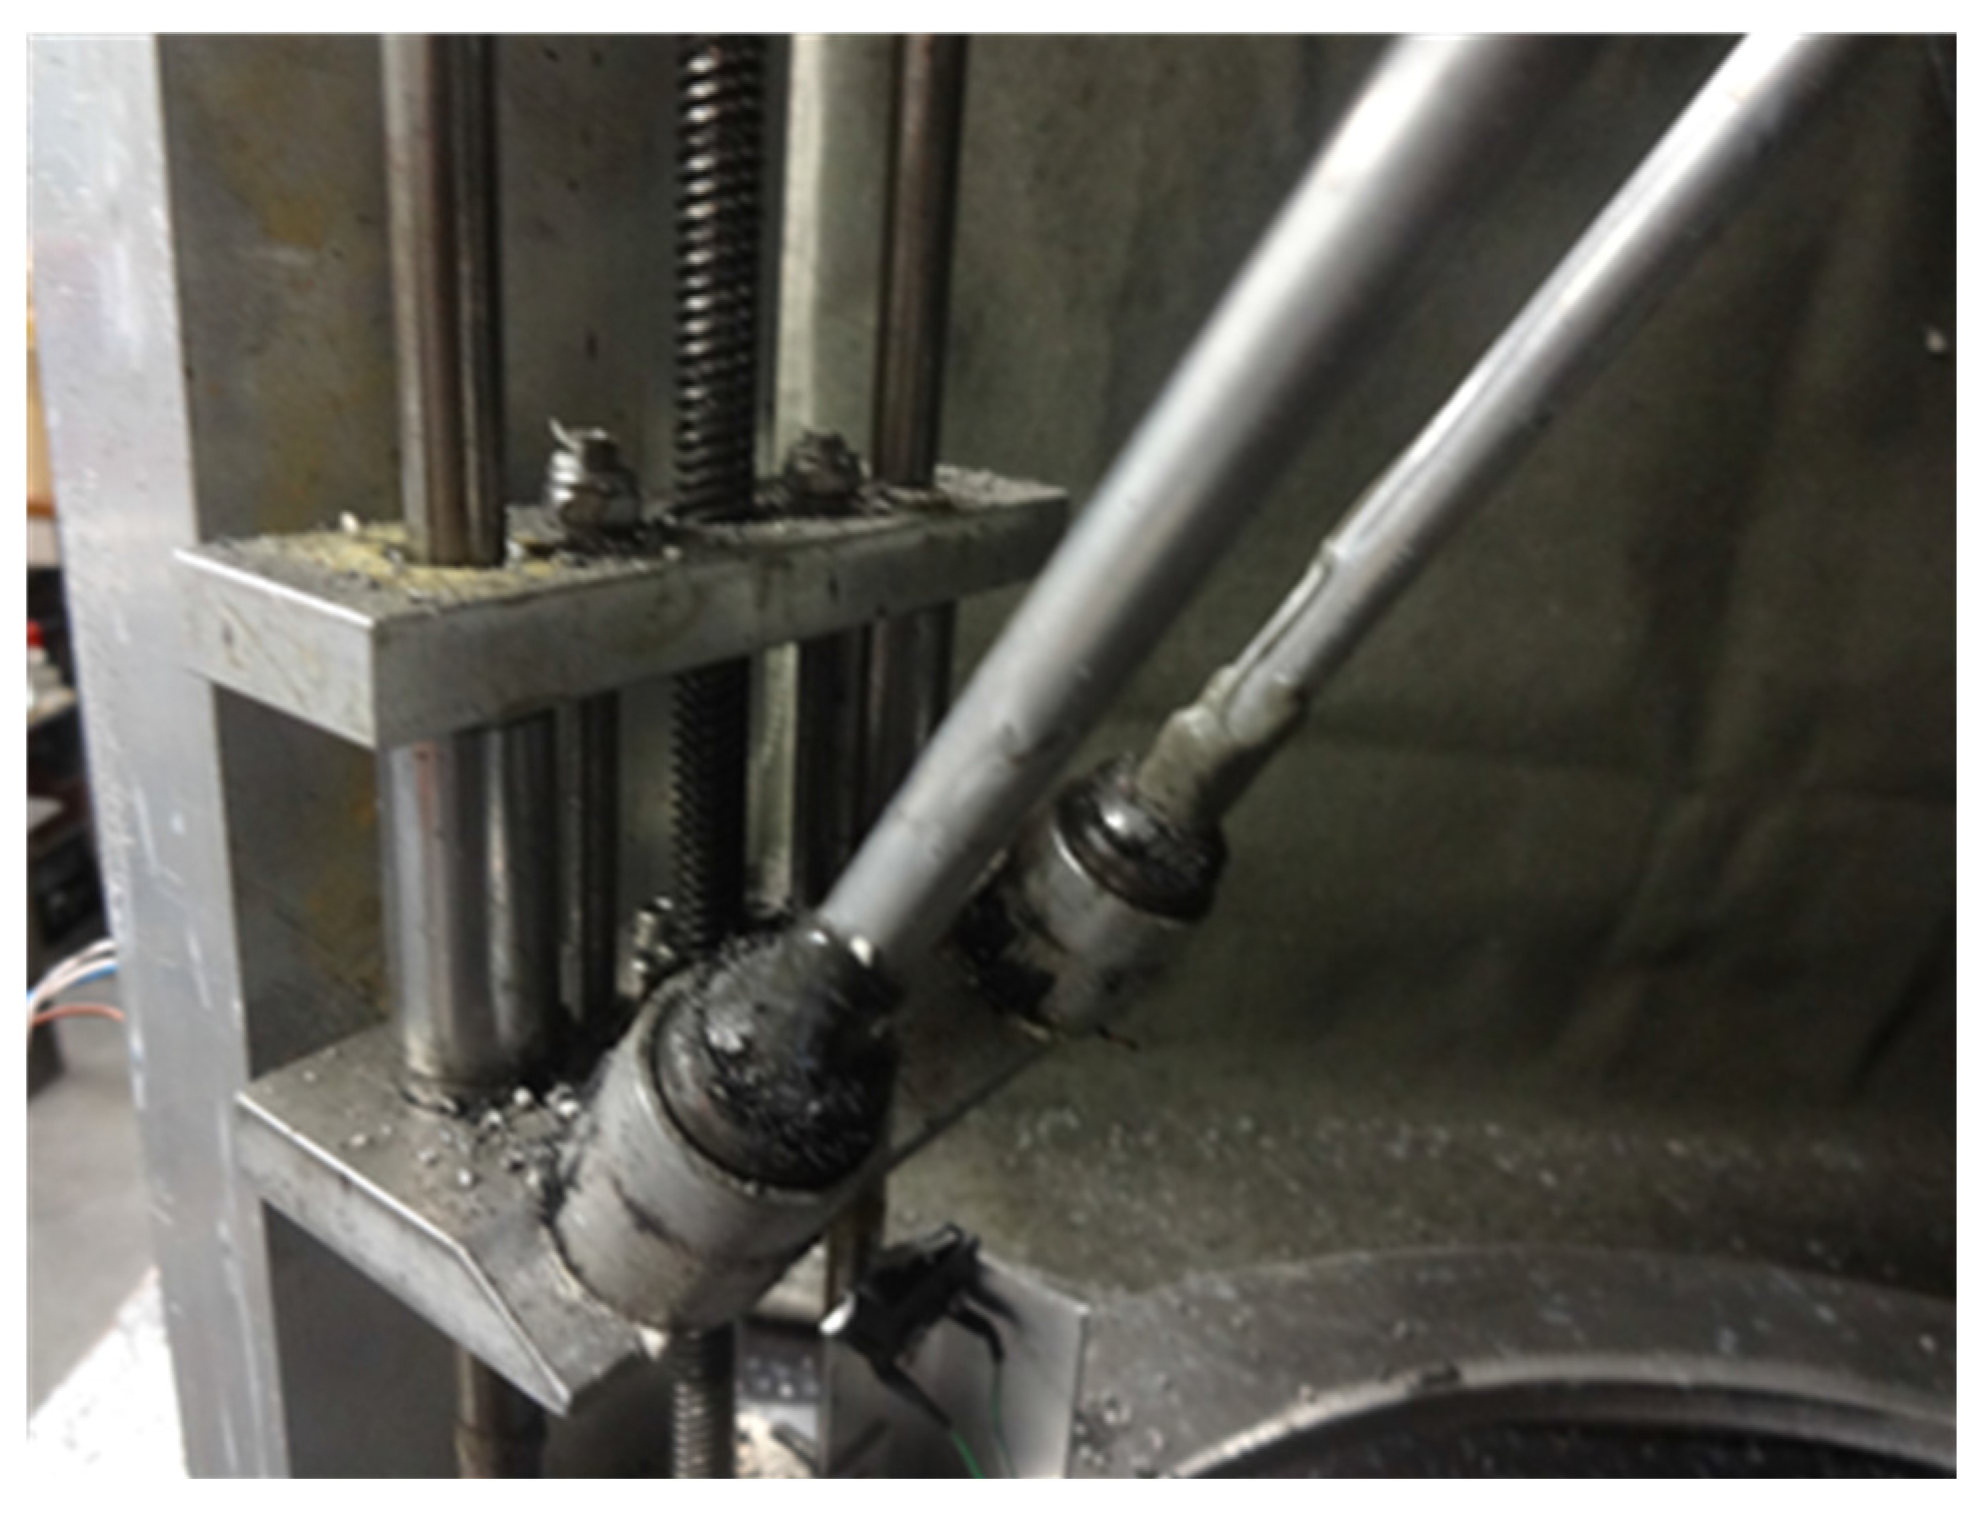
This original design has been further developed with the replacement of mechanical rotary bearings with magnetic bearings to allow for an increased range of motion, smoother motion, and a larger build volume (
Figure 2). The range of motion in the x–y plane is approximately 26 cm in each direction, 10 cm more than the previous version of the robot with conventional tie rod ends. Motion in the z-direction is roughly equivalent between the two machines at 76 mm. The modification also reduced backlash, but highlighted other potential deficiencies in the design. The most notable of which is temporarily moving away from true RepRap potential until the low-cost metal printing precision is improved. Thus, this device should be viewed as a research 3-D printer, which in the future can be converted back to a true RepRap.
Each magnetic ball joint consists of a 19.05 mm (3/4'') G25 chrome plated steel ball bearing, a 19.05 mm (3/4'') diameter × 12.7 mm (1/2'') thick high-strength neodymium ring magnet with countersinks accommodating #8 or #10 screws, and a 19.05 mm (3/4'') inner diameter metal sleeve epoxied to the outside diameter of the magnet. The joint is effected by the spherical ball bearing seating in the inner diameter of the ring magnet, where it is held in place by magnetic force. The 19.05 mm (3/4'') id sleeve acts to provide additional support in the magnet’s radial direction, reducing the potential for disengagement as the end effector approaches the end of the printable radius when the tie rods approach a horizontal orientation. A close-up of one of the carriages is shown in
Figure 2, which also shows the magnetic ball joints with sleeves. Earlier work found that in the absence of these sleeves, joints were prone to disengage under high acceleration or as the end effector approached the outer end of the printable radius, resulting in the entire end effector/substrate assembly falling off the machine.
As can be seen in
Figure 1, there are 12 ball joints, one at each end of the six tie rods that connect the end effector to the carriages. The six guide rods (precision-ground 8 mm diameter A2 tool steel.) are grouped in pairs with each pair on 6 cm centers using a single axis. The all-aluminum frame consists of a pair of circular ends cut from 10.16 mm (0.4'') thick plate (alloy 1100). The upper plate allows the tie rods to pass through it to hold the substrate. Vertical support legs are provided by three pieces of 25.4 mm × 76.2 mm (1'' × 3'') rectangular aluminum tubing 400 mm long (6063 T52 aluminum), which prevent the three stepper motors from becoming a path to ground should the frame become electrified during welding.
Figure 1.
Photograph of magnetic ball joint metal RepRap 3-D printer used in this study. A Miller Spoolmate 100 weld gun supplied the feedstock material which was melted by a Millermatic 190 gas metal arc welders (GMAW) (not shown). In the photograph the open source Raspbery Pi and Arduino based electronics are visible on the right support column.
Figure 2.
Detail of carriage assembly and magnetic ball joint with sleeves on the open source metal RepRap 3-D printer. The lead screw from the stepper motor driving that carriage is also visible in the center of the image.
Figure 2.
Detail of carriage assembly and magnetic ball joint with sleeves on the open source metal RepRap 3-D printer. The lead screw from the stepper motor driving that carriage is also visible in the center of the image.
Motion is provided by three stepper motors with integrated lead screw shafts. Lead screws are four-start and have an 8 mm pitch. The stepper motors are 200 step bi-polar driven with 1/16 microstepping. The combination of lead screw and motor yields movement precision in the z-direction (vertical) of 2.5 microns. Movement precision in the x–y plane is 4.6 micron in the center of the bed, and varies with the location of the end effector. Linear bearings (LM8UU) ride on the guide rods and are clamped into a pair of 0.400'' aluminum housings using bolts, forming carriages to which tie rods are connected. Tie rods are constructed from 5/16'' rigid aluminum tubing. The end effector is triangular and incorporates means for attaching a platform upon which insulation is mounted as seen in
Figure 1. The welding gun support is a welded “L” made with 9.525 mm × 76.2 mm (3/8'' × 3'') mild steel. The gun nozzle is held in place directly over the axial center of the robot by a piece of 25.4 mm (1'') mild steel pipe having a set screw in one side to secure the nozzle. The support can be moved vertically to set the location of the gun relative to the substrate.
2.1. Electronics
The IV measurement board from [
20] is connected to a power supply. It has three wires which in the previous version were connected to an Arduino: the ground, and two analog signals. In the new version, they need to be connected to the RAMPS board that is operating the printer. The ground must again be shared with a ground pin on the RAMPS, and the analog signals must be connected to any available analog inputs, such as A3 and A4. Those three pins are all located on the AUX1 header [
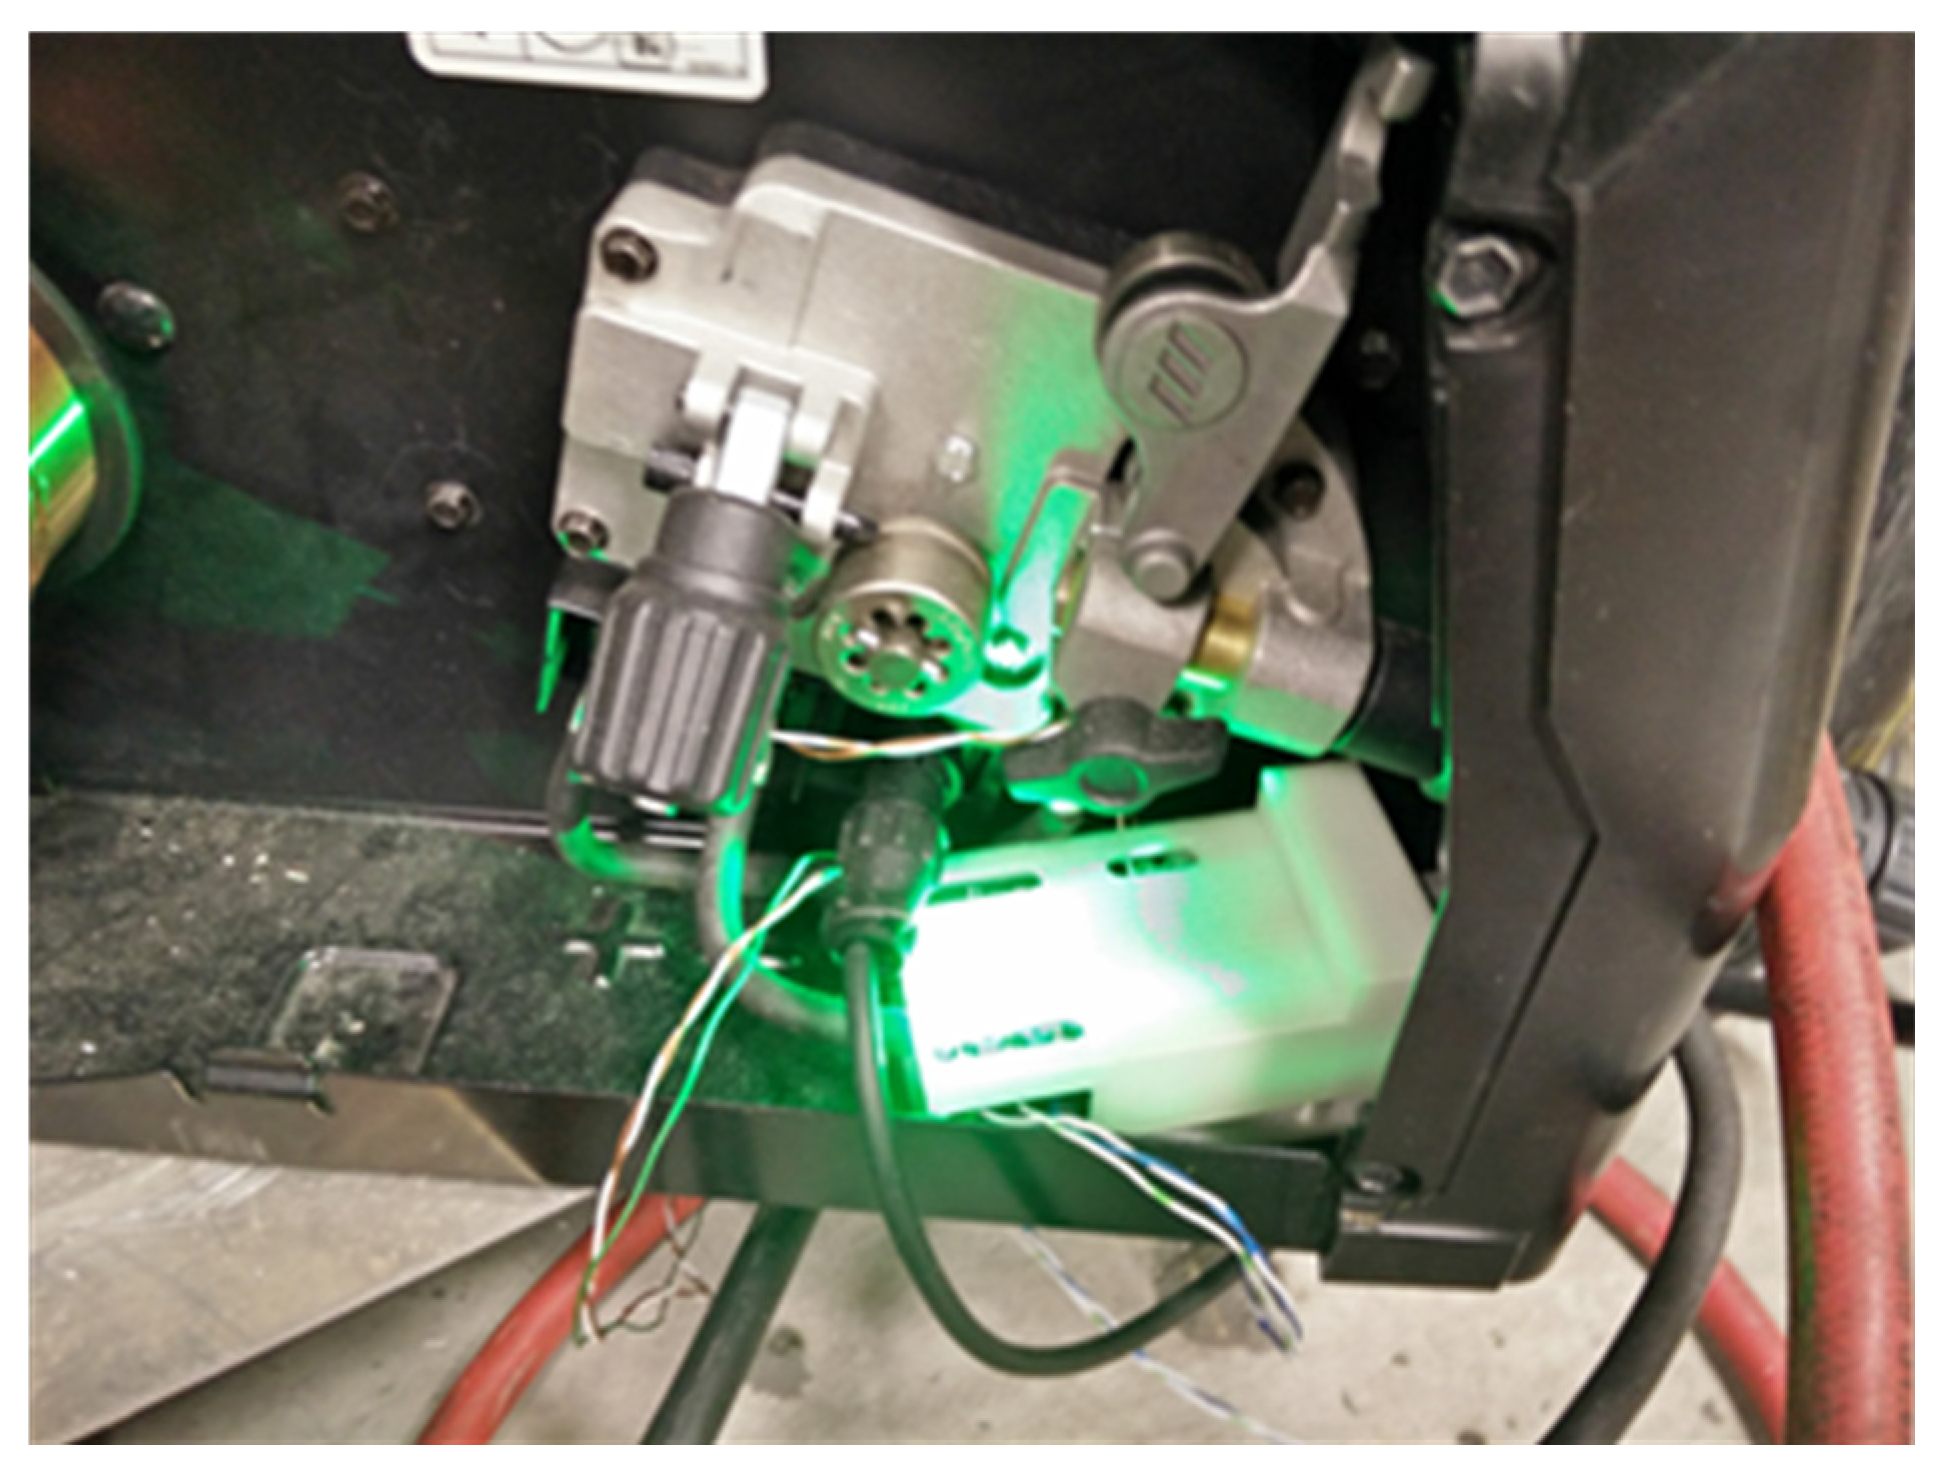
28]. For protection it is housed in a 3-D printed polymer case [
27] as shown in
Figure 3.
Figure 3.
Installed current and voltage measurement circuit in the Millermatic 190 gas metal arc welder with 3-D printed cover (white).
Figure 3.
Installed current and voltage measurement circuit in the Millermatic 190 gas metal arc welder with 3-D printed cover (white).
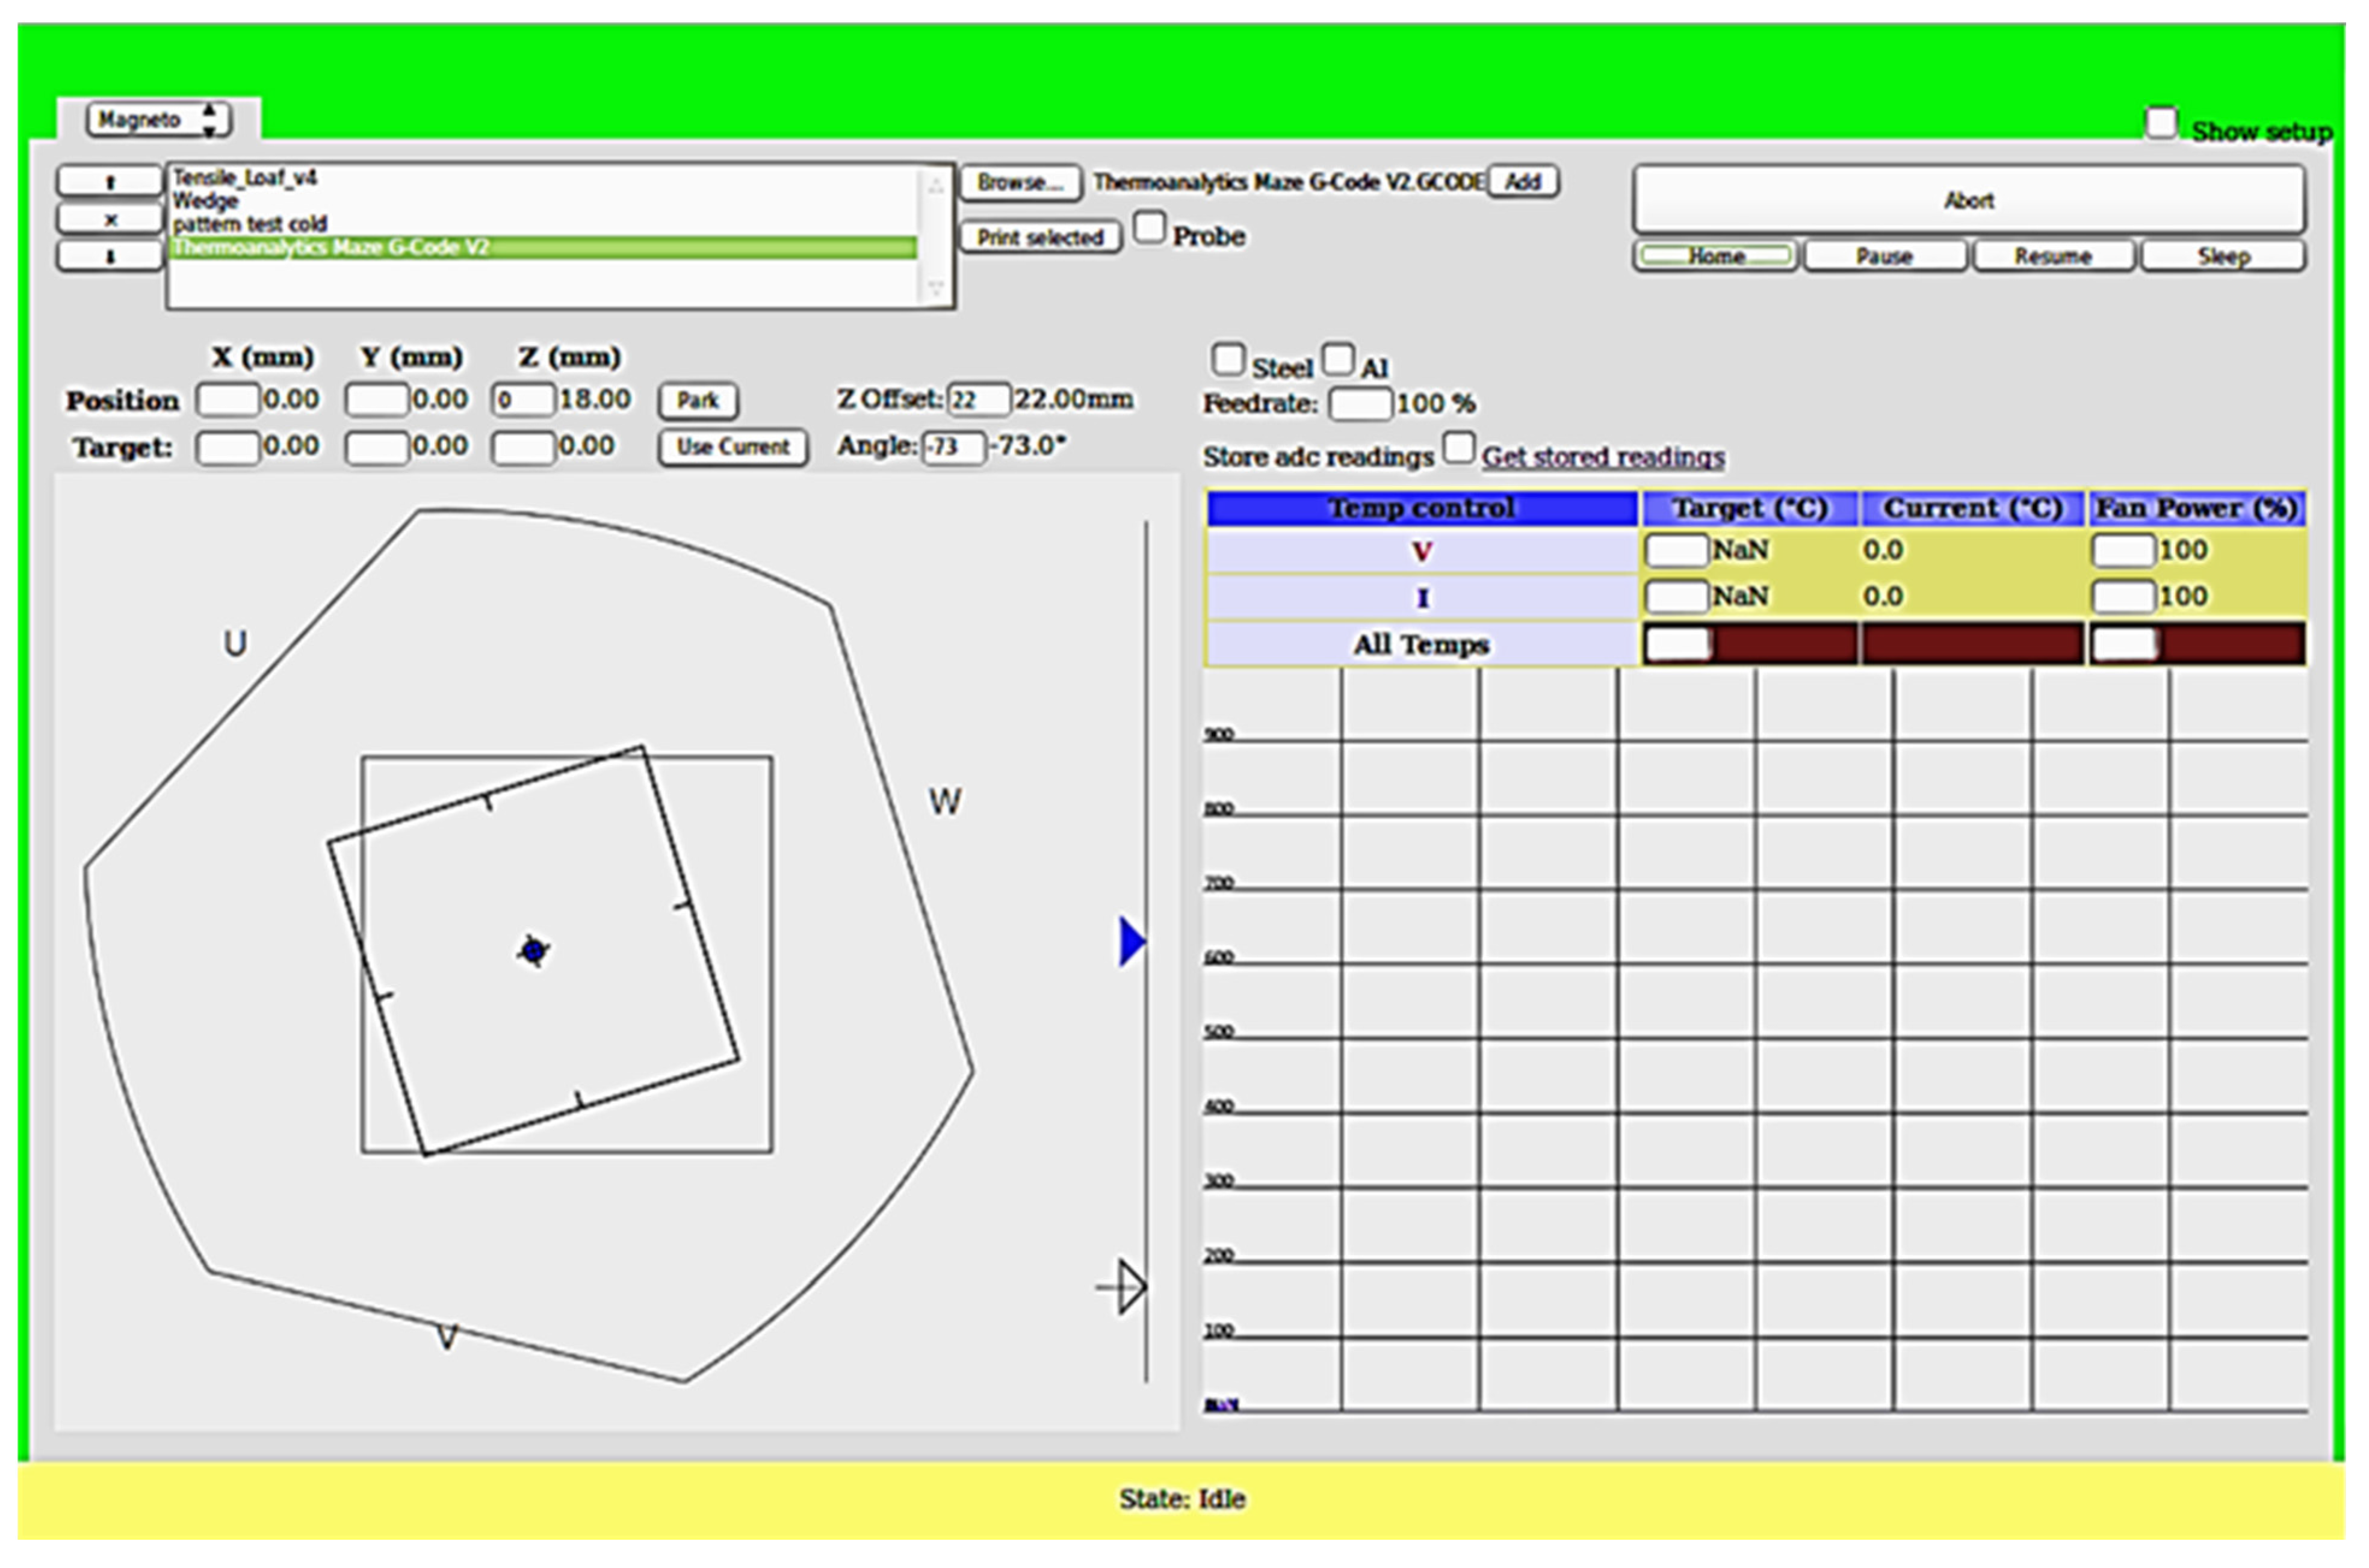
In Franklin’s interface (
Figure 4) all analog inputs are handled as if they are temperature controls. Therefore, two new temperature controls must be added, and their pins must be set to correspond to the analog pins receiving the IV measurements. Franklin can use temperature controls to either use a thermistor or a linear relation between the ADC reading and the reported value. β is a property of the thermistor and β needs to be set to NaN (which is not a valid value for a thermistor), so a linear relation,
, is used for its signal. Setting
to 1 and
to 0 will output the analog reading in a range from 0 to 1024. To make the output display voltage and current, a different value for
will be required, and possibly for
as well. For the electronics that were used, the formulas for the conversion from output voltage to measured values are as follows.
where
and
are the values at the welder, in ampere and volt respectively, and
and
are the values at the Arduino, both in volt.
needs to be set to the slope on the ADC reading. Using the fact that the maximum value for the values at the Arduino is 5V and the maximum ADC value is 1024, this means for
Figure 4.
Screenshot of the interface for the open source Franklin software.
Figure 4.
Screenshot of the interface for the open source Franklin software.
The firmware continuously sends the data that it reads from those pins to the host computer, which converts the raw ADC readings into voltage and current using the given values for and , and allows storing them on the file system. The web interface that is used to control the printer allows downloading those stored readings to the individual user’s computer.
Using the Arduino of the printer comes at the cost of sampling speed: the controller has other tasks that take time, and the serial connection is also used for other traffic. A dedicated controller for the readings, as was used in the previous version, can provide more readings per second. The measurements presented here did not require the extra speed, so this was sacrificed for the benefit of reduced hardware complexity and cost.
2.2. Algorithm
From the recorded data file, the timestamp in the first column is in a negative millisecond format which is not intuitive. To convert the negative millisecond (
) to the positive second (
) can be done using Equation (5) where
Nis the number of lines in the input data file.
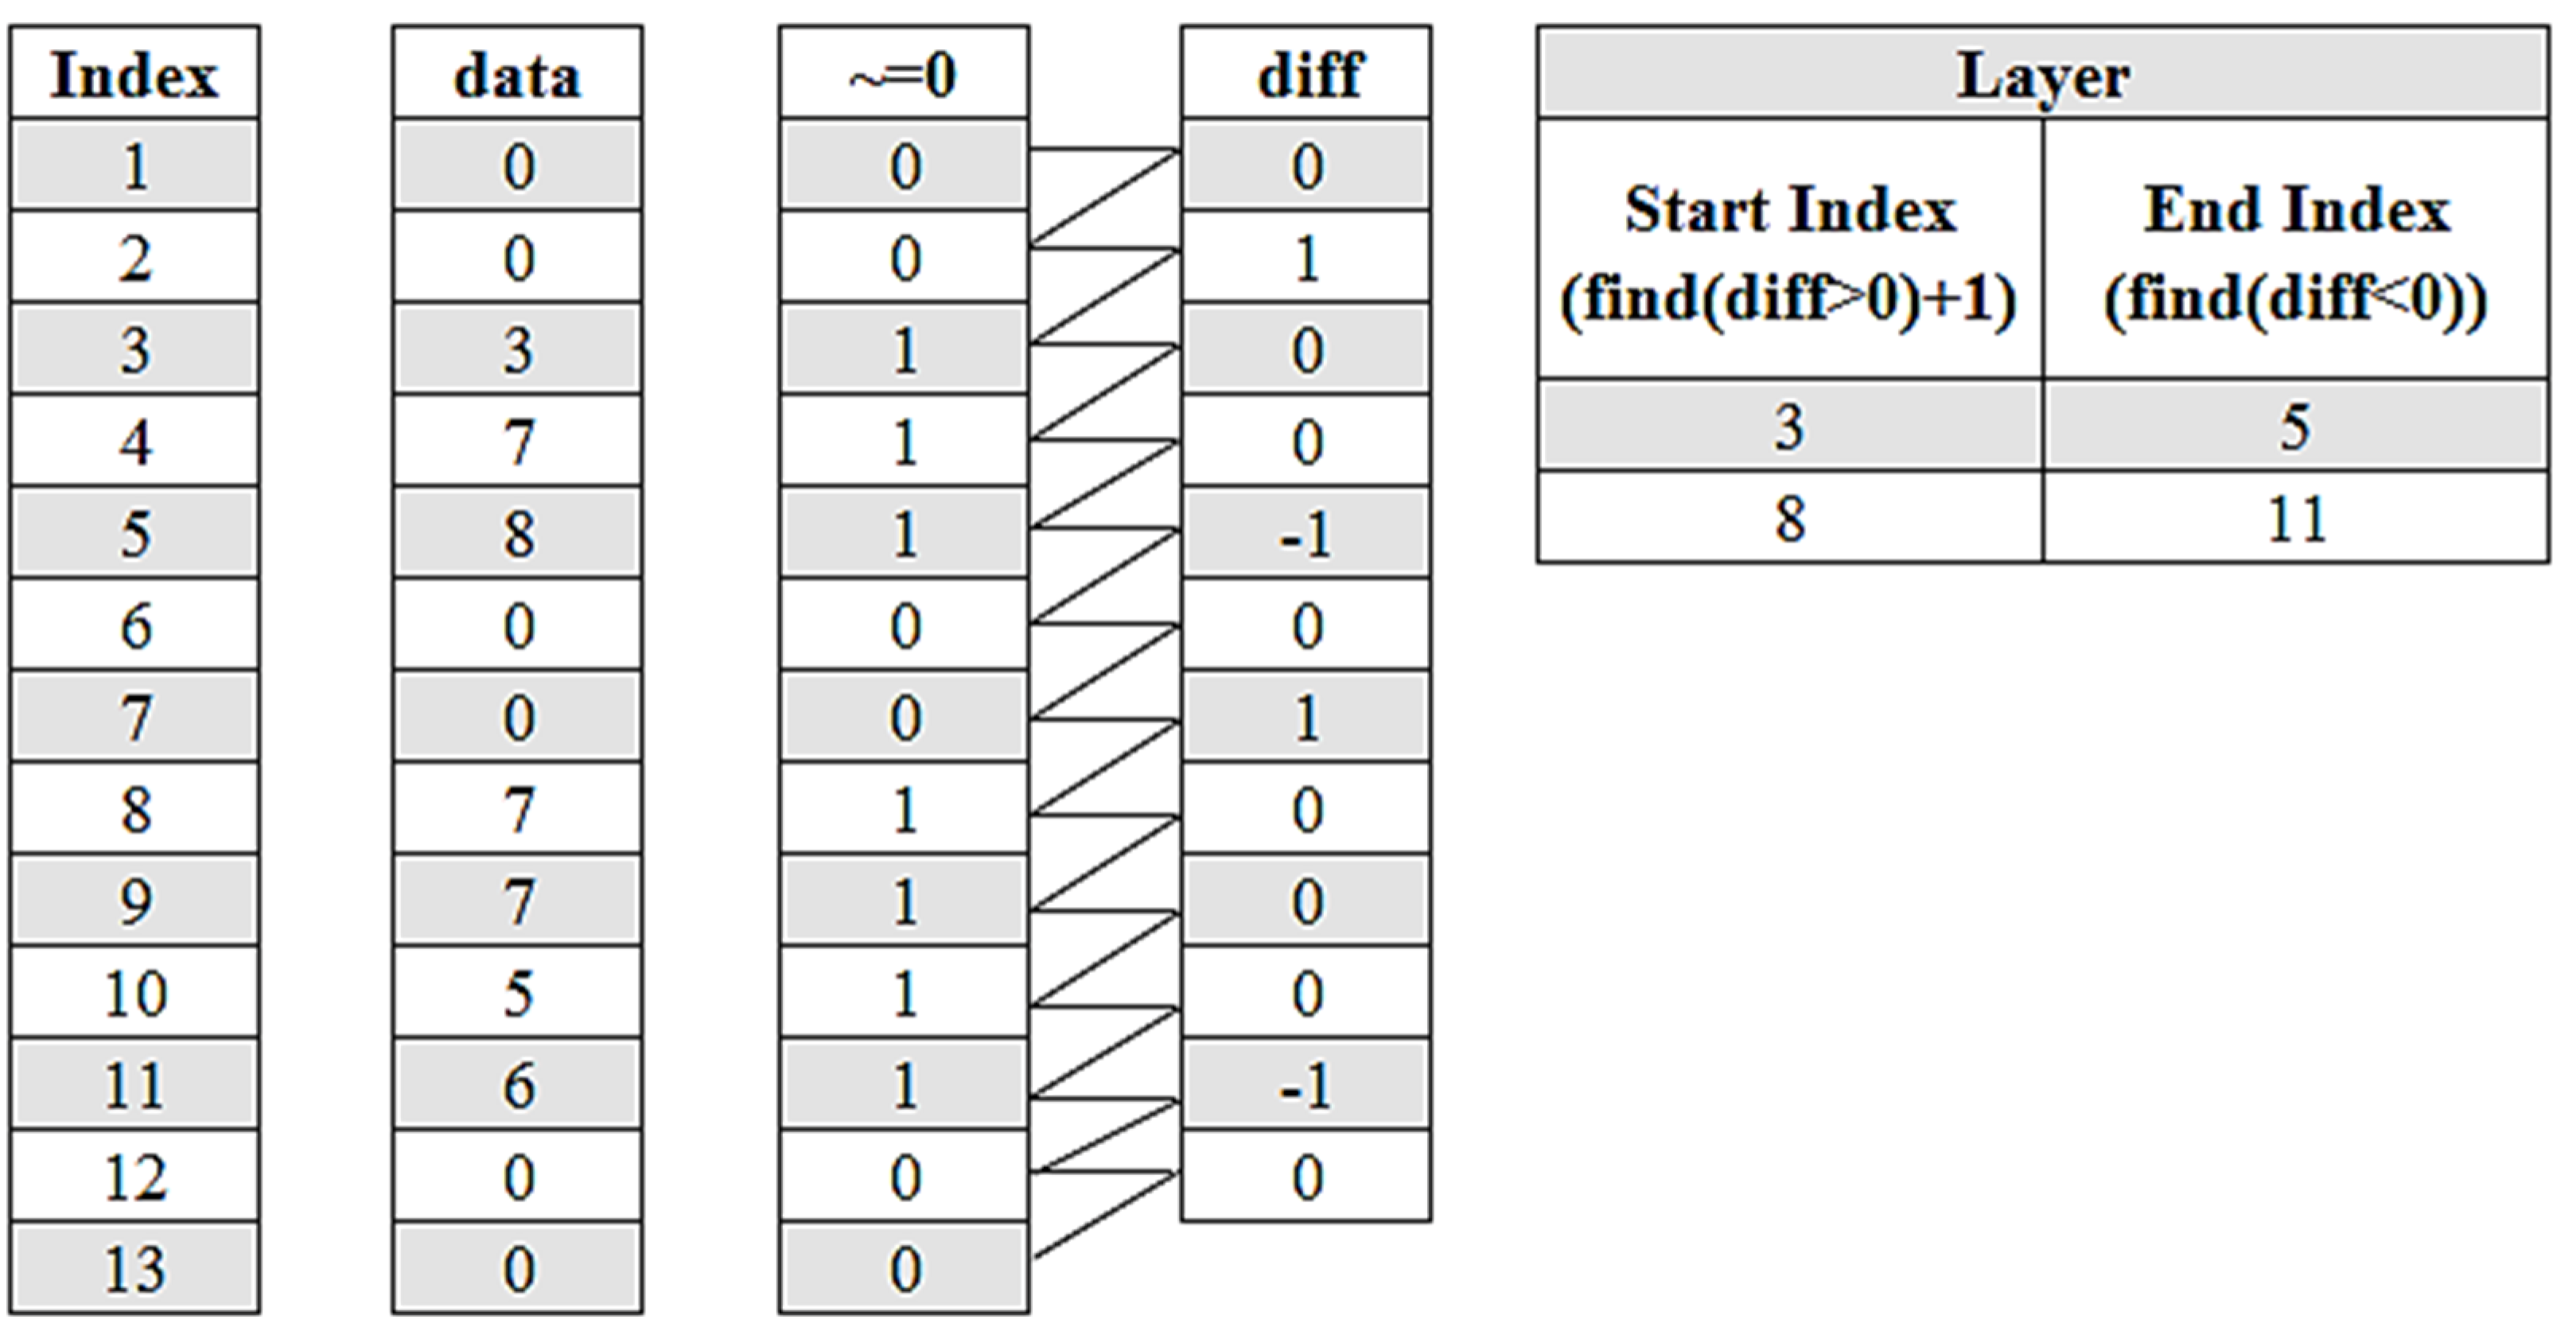
There can be two types of noise in the data: (1) zero-noise and (2) non-zero-noise. Zero-noise is the zero values that occur during the layer that need to be replaced with a very small value so the layer algorithm do not misinterpret them as the layer separation points (In this experiment, 10
−7 is used). Non-zero-noise is non-zero values that occur between the layers that need to be replaced by 0. After that data is separated into layers of non-zero data by the following concept (
Figure 5). First, the logical operator “not equal” (~=) is used to find non-zero data. Then the “diff” function is used to find the difference between the current cell and the previous cell in each row of the result from the previous step. Finally, the start index and the end index of each layer are found using “find” function which find the positive value for the start index and the negative value for the end index.
Figure 5.
Layers Algorithm.
Figure 5.
Layers Algorithm.
The two standard error (
) of each layer is calculated in Equations (6)–(8) where
is the data, μ is the mean or the average of the data layer length
, and
is the standard deviation.
The average voltage and current for each layer were calculated on a per alloy basis.
2.3. Printing of Test Specimens
Standard 0.035 inch (0.89 mm) diameter ER1100 and ER4047 wire (AlcoTec, Traverse City, MI, USA) in addition to ER4043, ER4943, and ER5356 wire (Hobart) were used as feedstock material to print test blocks on clean and degreased ASTM A36 low carbon steel print substrates. The print test blocks were each 108 mm × 31.75 mm × 25.4 mm whereas the print substrates were 127 mm × 127 mm × 6.35 mm in size. Low carbon steel was utilized as a print substrate because this was shown in previous work to encourage a weak interface between printed part and print substrate, thus allowing printed parts to be removed with minimal energy [
11,
12]. Print settings and print path were the same for all alloys (
Table 2,
Figure 6). Five blocks per alloy were printed (
Figure 7). Voltage and current data were collected for all specimens during each print cycle.
Table 2.
Print Settings Utilized for Test Specimens.
Table 2.
Print Settings Utilized for Test Specimens.
| Parameter | Value |
|---|
| Welder Setting (unitless) | 1 |
| Wire Feed Rate (mm/s) | 124.6 |
| Print Speed (mm/s) | 10 |
| Wire Stick-Out (mm) | 10 |
| Shield Gas Flow Rate (L/s) | 0.24 |
| G-Code Layer Height (mm) | 2.5 |
| G-Code Lateral Bead Spacing (mm) | 3.3 |
| Pause After Each Layer (s) | 60 |
| Number of Print Layers | 15 |
Figure 6.
Alternating print paths viewed in the direction of the z-axis.
Figure 6.
Alternating print paths viewed in the direction of the z-axis.
Figure 7.
Example top surface of a 4943 printed specimen viewed in the direction of the z-axis.
Figure 7.
Example top surface of a 4943 printed specimen viewed in the direction of the z-axis.
3. Results and Discussion
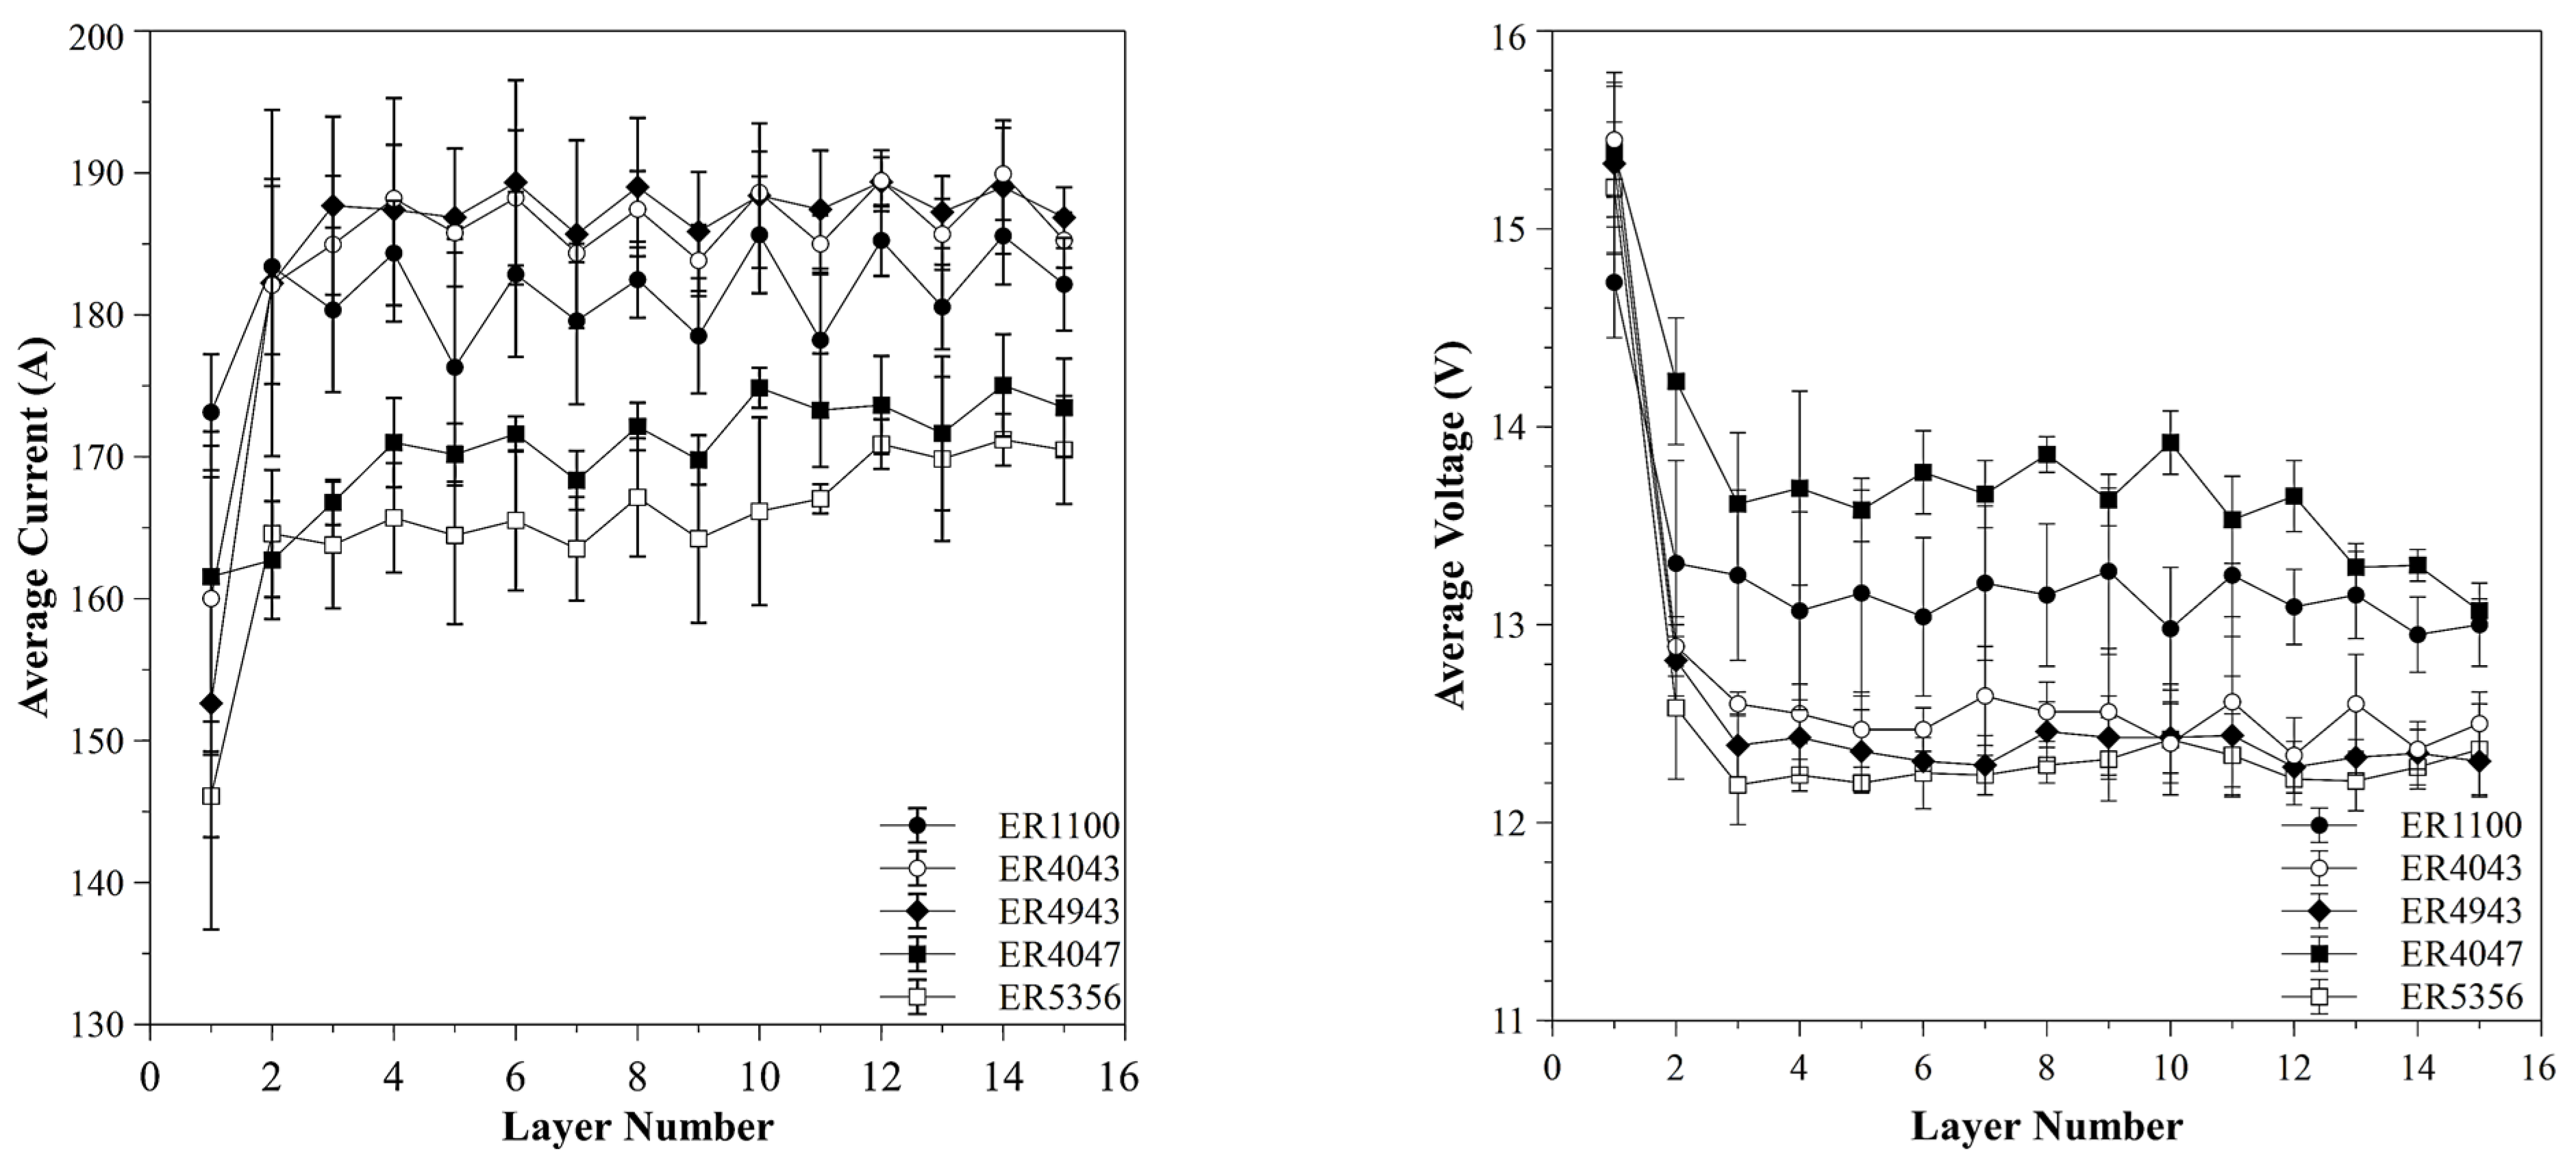
The currents, averaged from more than 200,000 data points, of ER1100, ER4043 and ER4943 specimens were statistically equivalent and greater in value than that of ER4047 and ER5356 (
Figure 8). By contrast, ER4047 exhibited the largest voltage on average, followed by ER1100 and finally with ER4043, ER4943 and ER5356 exhibiting statistically equivalent voltages.
Figure 8.
Average current (left) and average voltage (right) of all five aluminum alloys. Error bars represent ±2 standard error (≈95% confidence).
Figure 8.
Average current (left) and average voltage (right) of all five aluminum alloys. Error bars represent ±2 standard error (≈95% confidence).
On a per-layer basis, there is a significant difference on average between the first layer and subsequent print layers. The first print layer typically exhibited significantly lower current and higher voltage compared with other print layers (
Figure 9). Odd layers appeared to exhibit lower current and voltage, compared with even layers although this trend was not statistically significant; this may be due to differences in print paths (
Figure 6). More scatter in the current and voltage data, and thus more error, was observed for initial layers as opposed to the final layers. This is because the initial weld is purposely poor to allow for substrate release [
10,
11].
Figure 9.
Average current (left) and voltage (right) of all five alloys on a per-layer basis. Error bars represent ±2 standard error.
Figure 9.
Average current (left) and voltage (right) of all five alloys on a per-layer basis. Error bars represent ±2 standard error.
On a per-alloy basis, the differences may be explained by the electrical resistivity of each alloy (
Table 3). The commercially pure aluminum alloy, ER1100, had the smallest electrical resistivity and it exhibited the highest voltages and currents. The three 4000 series aluminum alloys, 4043, 4943, and 4047, all had very similar electrical resistivities and the current-voltages they exhibited were all statistically equivalent and between those of 1100 and 5356. The 5356 aluminum-magnesium alloy had the largest electrical resistivity and also exhibited the smallest currents and voltages. As electrical resistivity decreases, electrical conductivity increases and more current can be supplied at a given voltage. Since the welder control strategy is unknown, patterns in voltage variation cannot be fully explained.
Table 3.
Electrical Resistivity of Common Aluminum Weld Alloys.
Table 3.
Electrical Resistivity of Common Aluminum Weld Alloys.
| Alloy | Electrical Resistivity (× 10−6 Ω·cm) |
|---|
| 1100 | 2.99 |
| 4043 | 4.16 |
| 4943 | 4.21 |
| 4047 | 4.31 |
| 5356 | 5.98 |
A difference in electrical resistivity may be insufficient to fully explain the differences in weld currents and voltages between the five alloys studied. Specifically, the large difference in 5356 values compared with the other four alloys does not follow the same scaled difference in electrical resistivity. During welding it was observed that there was more spatter of the 5356 alloy than of the other printed alloys. A contributing factor to the spatter may have been wire and arc travel. The wire was sufficiently stiff such that, even after traveling through the weld gun, the wire continued to curve in the direction it was spooled. At sample edges, the curved wire compounded with arc travel to produce more spatter and shorts in the arc. These electrical shorts were recorded as zero values by the measurement device which would lower an average of the data.
The current and voltage of the first layer were different than subsequent layers due to differences in substrate and print materials. The first weld layer attempted to weld the aluminum print material to the low carbon steel substrate whereas all subsequent layers directly welded aluminum to aluminum. Due to differences in the steel and aluminum melting temperatures, there was insufficient arc energy to melt the steel. This resulted in lack of penetration of aluminum into the steel substrate and lack of fusion to the surface of the steel (which in beneficial in substrate release). When aluminum was printed on aluminum, there was sufficient energy to melt the aluminum to provide weld penetration and fusion.
A byproduct of printing aluminum on a steel substrate is a first layer with significant topographical variation [
10]. As subsequent layers are printed, the distance between the first layer and the weld gun changes. As distance increases, the arc length also increases, and this increases the voltage [
29]. Longer arcs are less focused and can result in more spatter of metal [
29]. This erratic behavior of the arc thus translates to more scatter in the data. As more layers are printed, the topography of the sample becomes more uniform, stabilizing the arc length and behavior.
Both the specific results for the alloys presented here as well as the open-source integration scheme provided under open hardware licenses here are applicable to other similar projects such as wire + arc additive manufacturing (WAAM) for aluminum [
30,
31].

