Article

Modeling and Selection of Rational Parameters for Sensors Installation Assemblies on Coal Charging Car Hoppers

1
Department of Design and Construction, Oles Honchar Dnipro National University, 49045 Dnipro, Ukraine
2
Department of Technological Equipment & Control Systems, Iron and Steel Institute of Z.I. Nekrasov, National Academy of Sciences of Ukraine, 49107 Dnipro, Ukraine
3
Department of Industrial Mechanical Engineering, Dnipro Metallurgical Institute, Ukrainian State University of Science and Technologies, 49005 Dnipro, Ukraine
4
Faculty of Geoengineering, Mining and Geology, Wroclaw University of Science and Technology, 50-421 Wroclaw, Poland
*
Author to whom correspondence should be addressed.
Machines 2026, 14(7), 757; https://doi.org/10.3390/machines14070757 (registering DOI)
Submission received: 7 June 2026 / Revised: 30 June 2026 / Accepted: 2 July 2026 / Published: 6 July 2026

Abstract

This study presents a comprehensive analysis of the modeling and optimization of sensor installation nodes for weight measurement in the hoppers of a charging car utilized in coke production. The research highlights the critical role of precise load monitoring in preventing technological disruptions, minimizing equipment degradation, and optimizing energy consumption. Conventional sensor technologies, including capacitive, ultrasonic, and laser-based systems, are evaluated, with weight sensors mounted on hopper supports identified as the most robust solution for real-time mass determination under industrial conditions characterized by high dust levels, temperature fluctuations, and mechanical vibrations. A finite element analysis (FEA) was conducted to assess the structural behavior of sensor installation nodes under three distinct loading scenarios, corresponding to different operational conditions of the charging car. The four-point support structure of the hopper experienced the highest loads and non-uniformities. A stress–strain analysis of the sensor mounting assembly, performed using the Ansys software package, confirmed that both the sensor and its support structure maintain a sufficient safety margin (version 2024 R1, Ansys Inc., Canonsburg, PA, USA, the academic license provided to Wrocław University of Science and Technology). The findings validate the structural integrity and operational reliability of the proposed sensor configuration, contributing to the advancement of automated monitoring and control systems in coke production.

1. Introduction

Cokemaking traditionally remains one of the most critical, technologically complex, and energy-intensive stages within the integrated structure of the metallurgical cycle in the iron and steel industry. The physicochemical characteristics and structural uniformity of the finished metallurgical coke directly and decisively influence the technical and economic performance, stability of the thermal balance, and the cumulative carbon footprint of blast furnace ironmaking, which is paramount under today’s stringent environmental regulations and global industrial decarbonization initiatives [1,2]. The modern stage of metallurgical complex development demands the implementation of strict precision control systems across the entire technological chain of multi-component coal blend preparation and its subsequent high-temperature carbonization. This is essential for stabilizing and guaranteeing the target indicators of structural strength and chemical resistance of the coke monolith, including such fundamental parameters as the structural order, microstructure, and the evolution of mineral matter during thermal degradation [3].
It should be emphasized that the foundation for the future quality of the finished product and the accident-free operation of the equipment is laid long before the actual onset of pyrogenetic transformations inside the oven chambers. The entire initial complex of operations encompasses stages such as the collection of commercial coal grades, their meticulous batching, crushing, creation of a well-balanced coal blend, its systematic transportation, precise portioned charging into the oven chambers, lid sealing management, and the uninterrupted maintenance of complex gas evacuation and stand-pipe systems [4]. Efficient dynamic alignment of the entire park of coke oven machinery—including quenching cars, pushers, and charging cars—is a primary factor for sustaining a continuous production rhythm, maintaining the design productivity of coke oven batteries, and radically reducing fugitive emissions and hazardous outputs into the environment [5].
Among the aforementioned primary technological operations, the process of discrete coal blend charging into the coke oven stands out as a key factor governing both the internal thermal balance of the process and the spatial structural uniformity of the entire formed coal charge. The physical, mechanical, rheological, structural, and densification characteristics of these fine-fraction carbonaceous materials, which include coking plastic masses, anthracites, and coke breeze, completely govern their behavior during gravitational transport, pouring, and localized dynamic storage within the accumulation hoppers [6]. Any uncontrolled variability, distribution asymmetry, or deviation of the actual mass or volume of the charged coal blend from the regulated setpoints directly causes localized thermal shocks and prolonged disruption of the thermal equilibrium of the heating flues. In conditions where precise control of heat fluxes in the heating vertical flues is strictly mandatory for stabilizing the carbonization front and reducing specific energy consumption, such deviations are unacceptable [7,8]. Consequently, the operational and precise automatic determination of the coal mass fed into each individual chamber transforms from a purely logistical or accounting task into a fundamental control constraint for digital automation and the modern management of a cokemaking enterprise [9].
To reliably monitor and operationally control these complex charging parameters, the global engineering community has developed and implemented a variety of industrial solutions and extensive instrumentation networks over many decades [10]. In classic gravity top-charging configurations via charging holes, as well as in modern high-efficiency systems featuring preliminary mechanical pre-compaction of the blend (stamp charging), various indirect volumetric or level-measurement principles have been extensively investigated and deployed. Specifically, for non-contact tracking of the current material profile inside accumulation hoppers or large silos, capacitive, ultrasonic, radar, or laser-based level sensors have been utilized [11,12].
However, long-term industrial experience has demonstrated that the extremely harsh environments of a metallurgical plant—characterized by total dust contamination of the air medium, cyclic temperature fluctuations across a wide range, the presence of aggressive, chemically active vapors and gases, as well as constant intense broadband mechanical vibrations and shock loads during machinery movement—sharply limit the operational reliability, durability, and accuracy of non-contact optical, radar, or acoustic devices, causing a significant drift of the measured signal.
As a result, direct mass measurement via specialized load cells (resistance strain gauges) integrated directly into the structural supporting elements and suspension nodes of the charging car framework has proven to be the most robust, noise-immune, and verified solution for real-time mass determination. At the same time, optimizing the spatial configuration, geometric parameters, and local placement schemes of load cells mounted on the charging car chassis or directly beneath the heavy hopper support brackets remains a complex and urgent scientific and engineering challenge. This is due to the necessity of ensuring high measurement precision under complex conditions of non-stationary dynamic and transient loads during the movement and braking phases of the car [13]. Similar challenges related to the mathematical modeling of dynamic loads in rolling components under transient operational phases have been extensively studied in heavy-haul railway transport applications [14].
It must also be taken into account that internal fluctuations in the bulk density of the coal blend, caused by technological moisture variations or localized mechanical compaction and stamping, lead to a significant redistribution and asymmetry of static and dynamic lateral loads exerted on the hopper shell walls and its discharge gate mechanisms [15,16]. If the local integration and installation nodes of these load cells are designed without considering these factors, significant elastic deformations of adjacent structural elements, the emergence of uncontrolled parasitic transverse forces and bending moments, as well as uneven localized thermal expansion of massive steelworks, begin to severely distort the sensor’s useful signal. This inevitably leads to the accumulation of systematic errors within automated cyclic batching systems.
Despite the colossal volume of fundamental literature dedicated to the general analytical theory of pressure and flow of granular bodies in vertical silos (e.g., the classic theories of Janssen, Koenen, etc.) and traditional general-purpose weighing technologies, there is currently a distinct lack of comprehensive scientific and applied research focusing on the structural optimization, parametric analysis, and three-dimensional numerical modeling of localized interaction and installation nodes for load cells specifically on mobile metallurgical charging machines. While modern computational frameworks and modeling advances are actively introduced to evaluate stress states and mechanics in heavy railway vehicles and core infrastructure [17], their direct translation to mobile metallurgical equipment remains heavily constrained.
In the vast majority of existing publications and sector-specific calculation methodologies, large charging car hoppers are treated simplistically—as isolated, absolutely rigid, non-deformable bodies, which completely negates the impact of complex spatial elastic deformation interactions between the flexible hopper shell, the rigid support brackets of the frame, and the elastic body of the sensor itself under real-world cyclic filling and emptying scenarios [7]. This issue becomes particularly acute when using real polydisperse media with highly specific physical and mechanical characteristics, such as high-density grade A anthracite or complex multi-component wet coking coal blends [6].
Industrial operation of charging cars involves significant dynamic uncertainties, non-stationary structural vibrations, and cyclic shock loads. Similar problems of dynamic disturbances management, compensation of phase deviations, and mitigation of unwanted mechanical vibrations are widely studied in advanced suspension systems and inertial damping applications [18]. However, for heavy-duty metallurgical machinery with rigid frameworks and variable hopper mass, specific strain-gauge mounting configurations require dedicated parametric modeling.
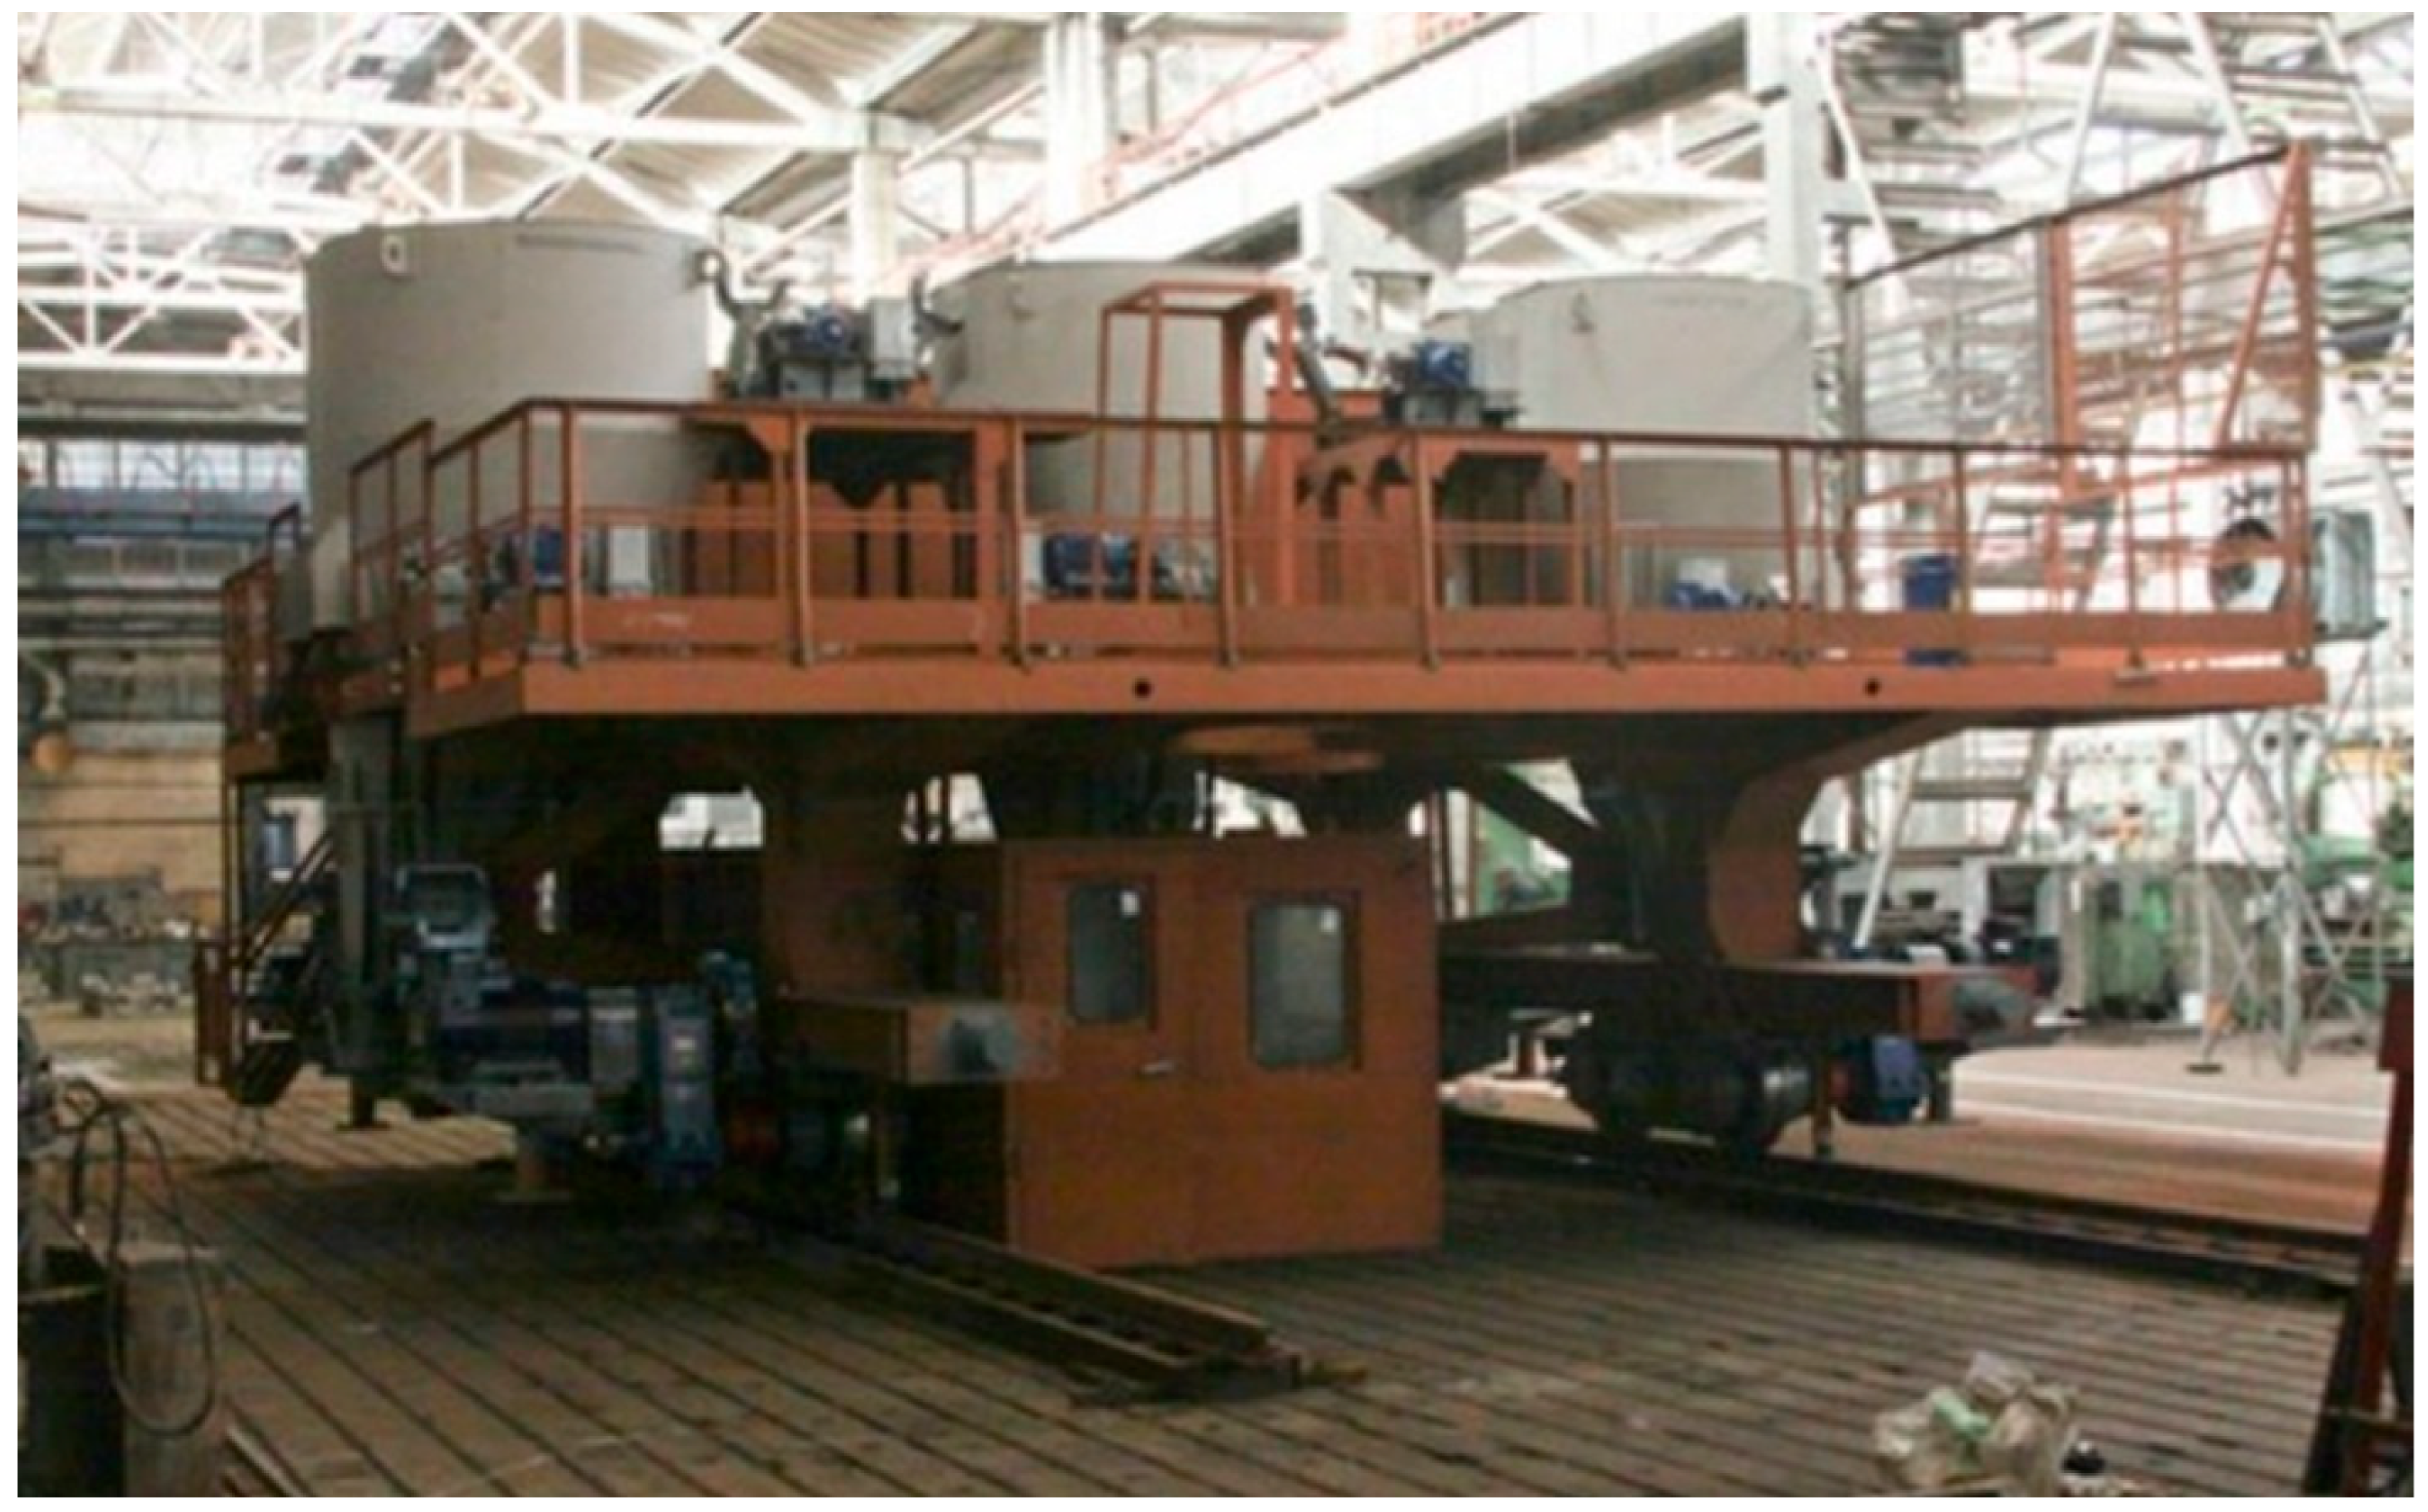
To visually conceptualize the structural scale, massive proportions, and overall arrangement of the heavy industrial machine, Figure 1 illustrates a general view of the investigated coal-charging car.
While this macro-level view shows the spatial allocation of the main coal hoppers and their integration with the primary chassis framework, the detailed cross-sections and specific mounting locations of the force-measuring load cells are hidden within the lower support brackets. Under actual operating conditions, the hopper assemblies are subjected to intensive vibrations, thermal deformations, and mechanical displacements. These phenomena simultaneously induce vertical and horizontal forces, as well as parasitic torques related to the charging car’s transient motion and the operation of the bunker opening mechanisms. The structural orientation of the load cells relative to these multidirectional displacements determines whether inertial forces translate into critical measurement errors or induce hazardous lateral loads, bending moments, and angular misalignments. Therefore, the primary engineering criterion is to position the sensor in such a manner that dynamic disturbances do not introduce false force vectors along its principal sensitive axis.
When designing and installing measurement sensors on heavy structural units like coal charging hoppers, managing local elastic deformations is critical, as structural compliance directly affects measurement accuracy and component longevity. A methodological parallel can be found in the analysis of high-pressure hydraulic components [19], where numerical models and experimental tests were used to evaluate how structural deformations under operational loads impact system behavior. Similarly, for sensor installation assemblies on charging cars, determining the rational geometric parameters through finite element analysis allows minimizing detrimental deformations at the sensor-structure interface, thereby ensuring stable readings and preventing fatigue failure under cyclic loading.
To address the identified scientific and technical research gap, this study presents a comprehensive parametric analysis, mathematical modeling, and optimization of the geometric and structural parameters of force-measuring sensor installation nodes operated on metallurgical charging cars based on the configuration detailed in Figure 1. The primary objective of this study is a detailed numerical evaluation of the stress–strain state and structural-deformational behavior of the sensor support assemblies using the Finite Element Method (FEM). This approach enables the justification of a rational three-point support scheme and a longitudinal orientation of the sensors to enhance the accuracy and reliability of automated weight control under harsh industrial conditions.
The subsequent structure of this paper is organized to systematically reveal the key stages of the performed research. In Section 2, the detailed design of the charging car under study, the spatial layout of the hopper supports, the configuration of the weighing sensors, and the primary boundary load cases are described. In Section 3, the dynamic forces arising during the operation of the bunker opening mechanism are determined and their direct impact on the support assemblies is evaluated. In Section 4, the engineering simplification and establishment of the calculation models for the sensor mounting assemblies for both the central and outer hoppers are outlined. Section 5 presents the analytical results of mathematical modeling and an in-depth analysis of load distribution on the supports under various sensor orientation options and machine operating modes. Section 3.3 provides a rigorous analysis of the stress–strain state (SSS) of the localized sensor mounting assemblies using finite element analysis (FEA/FEM). Finally, the Conclusions summarize the main research findings and provide practical engineering recommendations for implementing a rational support scheme and sensor orientation to improve weight control efficiency in coking production.

2. Materials and Methods

2.1. Structural Design of the Charging Car and Operational Loading Scenarios

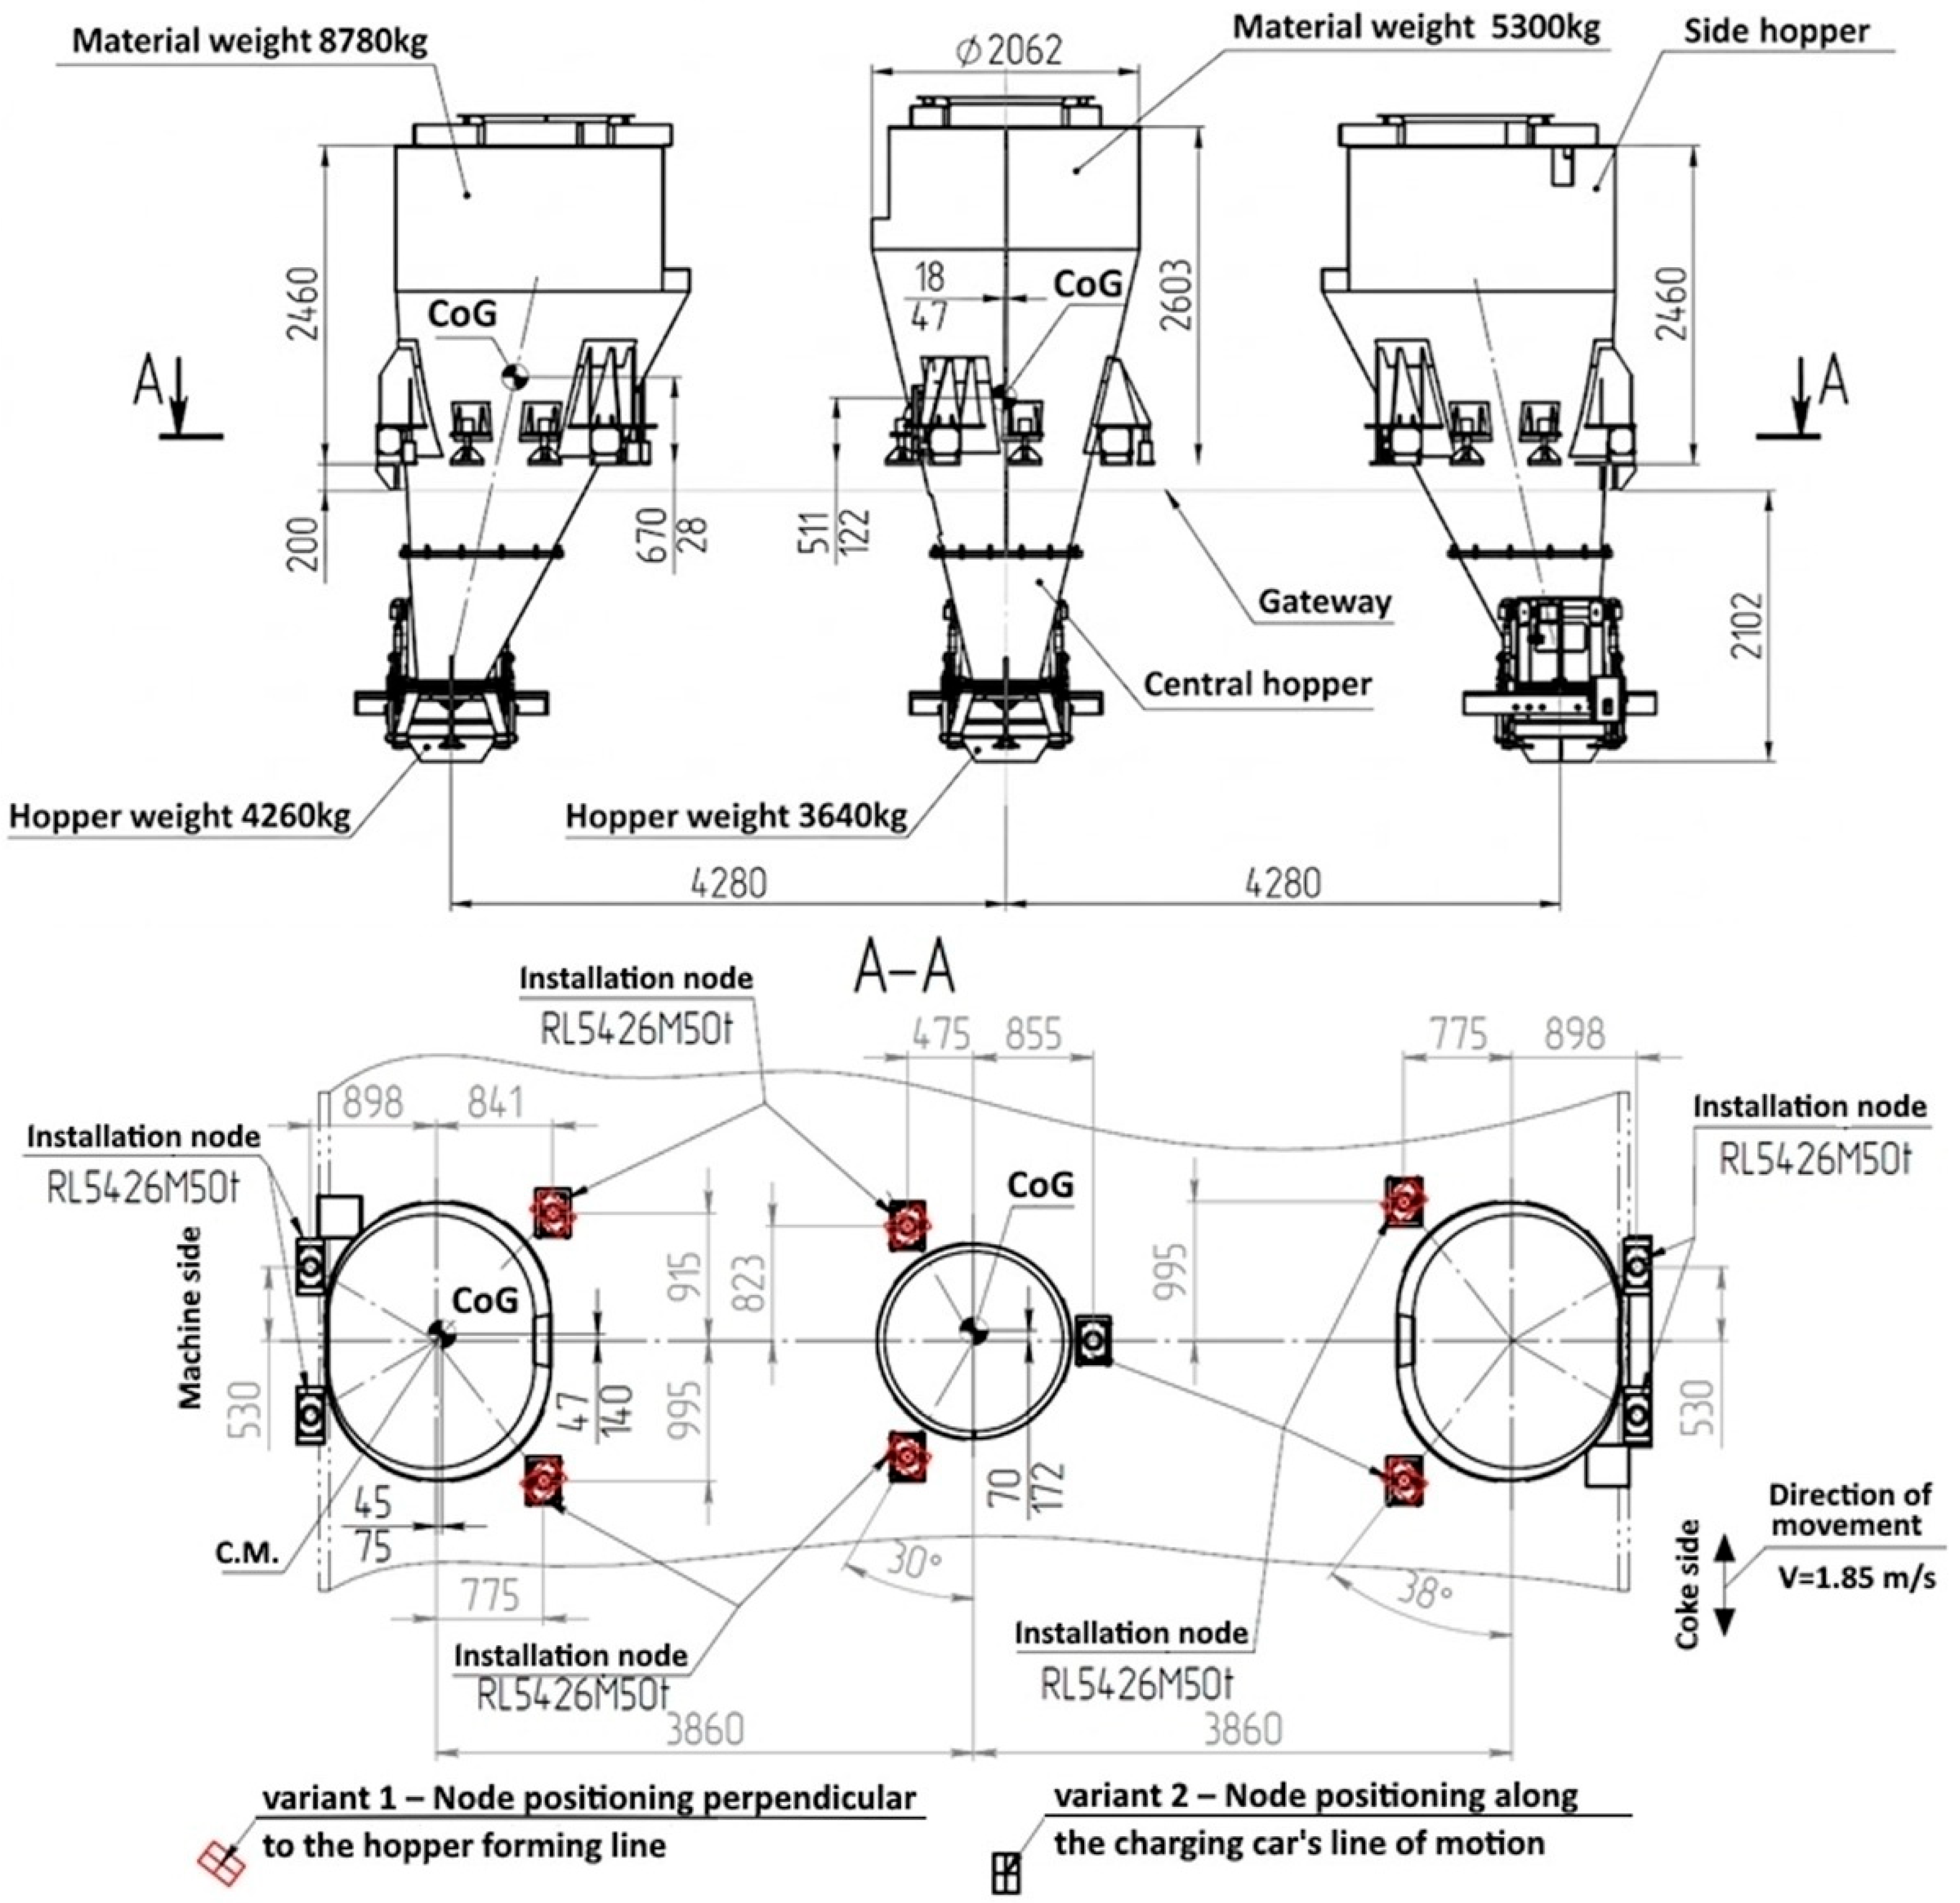
After loading, the charging machine can operate dynamically, moving forward and backward along the designated track outline. The maximum operational velocity of the charging car is established at 1.85 m/s. Figure 2 presents the schematic layout of the weight sensors’ spatial distribution and highlights the investigated design options for the angular orientation of the sensor installation nodes.
As shown in Figure 2, the sensor installation nodes are color-coded to denote distinct angular orientations: Variant 1 (marked in red) represents node positioning perpendicular to the hopper shell profile, while Variant 2 (marked in black) signifies orientation along the charging car’s line of motion.
Based on the established operational conditions derived from extensive studies of charging car behavior under actual service loads, the following three representative calculation cases for the structural loading of the hopper supports have been formulated for numerical verification:
  • The hoppers of the charging machine are fully loaded, and the vehicle initiates forward travel, uniformly accelerating to maximum operational speed. In this boundary case, the maximum inertial force vector is governed by a linear acceleration of 1.85 m/s2.
  • The hoppers are fully loaded, and the machine initiates motion in the opposite direction (backward travel), accelerating uniformly. The peak inertial effects for this case are likewise governed by an acceleration magnitude of 1.85 m/s2.
  • The hoppers remain fully loaded and at static rest while the bottom bunker gate opening mechanism begins its operational cycle.
It should be noted that while the first two loading cases utilize an identical acceleration magnitude of 1.85 m/s2, they fundamentally differ in the directional vectors of the resulting inertial forces acting upon the steel structures. Because the hoppers exhibit geometric symmetry relative to the transverse axis perpendicular to the direction of travel, the induced dynamic forces acting on the corresponding support pairs are identical in absolute magnitude but strictly opposite in sign. This directional reversal is highly critical for evaluating the performance of the load cell installation nodes under alternating shear stress. Furthermore, the deceleration and stopping phases during both forward and backward travel are kinematically treated within these same cases, as the uniform retardation loads are mathematically equivalent to the acceleration phases but imply a reversal of the inertial force vectors. The material mass parameters illustrated in the schematic setup—specifically 8780 kg for each of the outer hoppers and 5300 kg for the central hopper—strictly represent the nominal maximum capacities under full volumetric loading with high-density grade A anthracite.
The figure illustrates the center of gravity coordinates for two states: without material (empty hopper) and with material (loaded hopper). The positions of the RL5426M50t load cells are indicated in the figure. These sensors are mounted at specific nodes to measure the hopper’s weight.

2.2. Kinematic and Load Analysis of the Gate Opening Mechanism

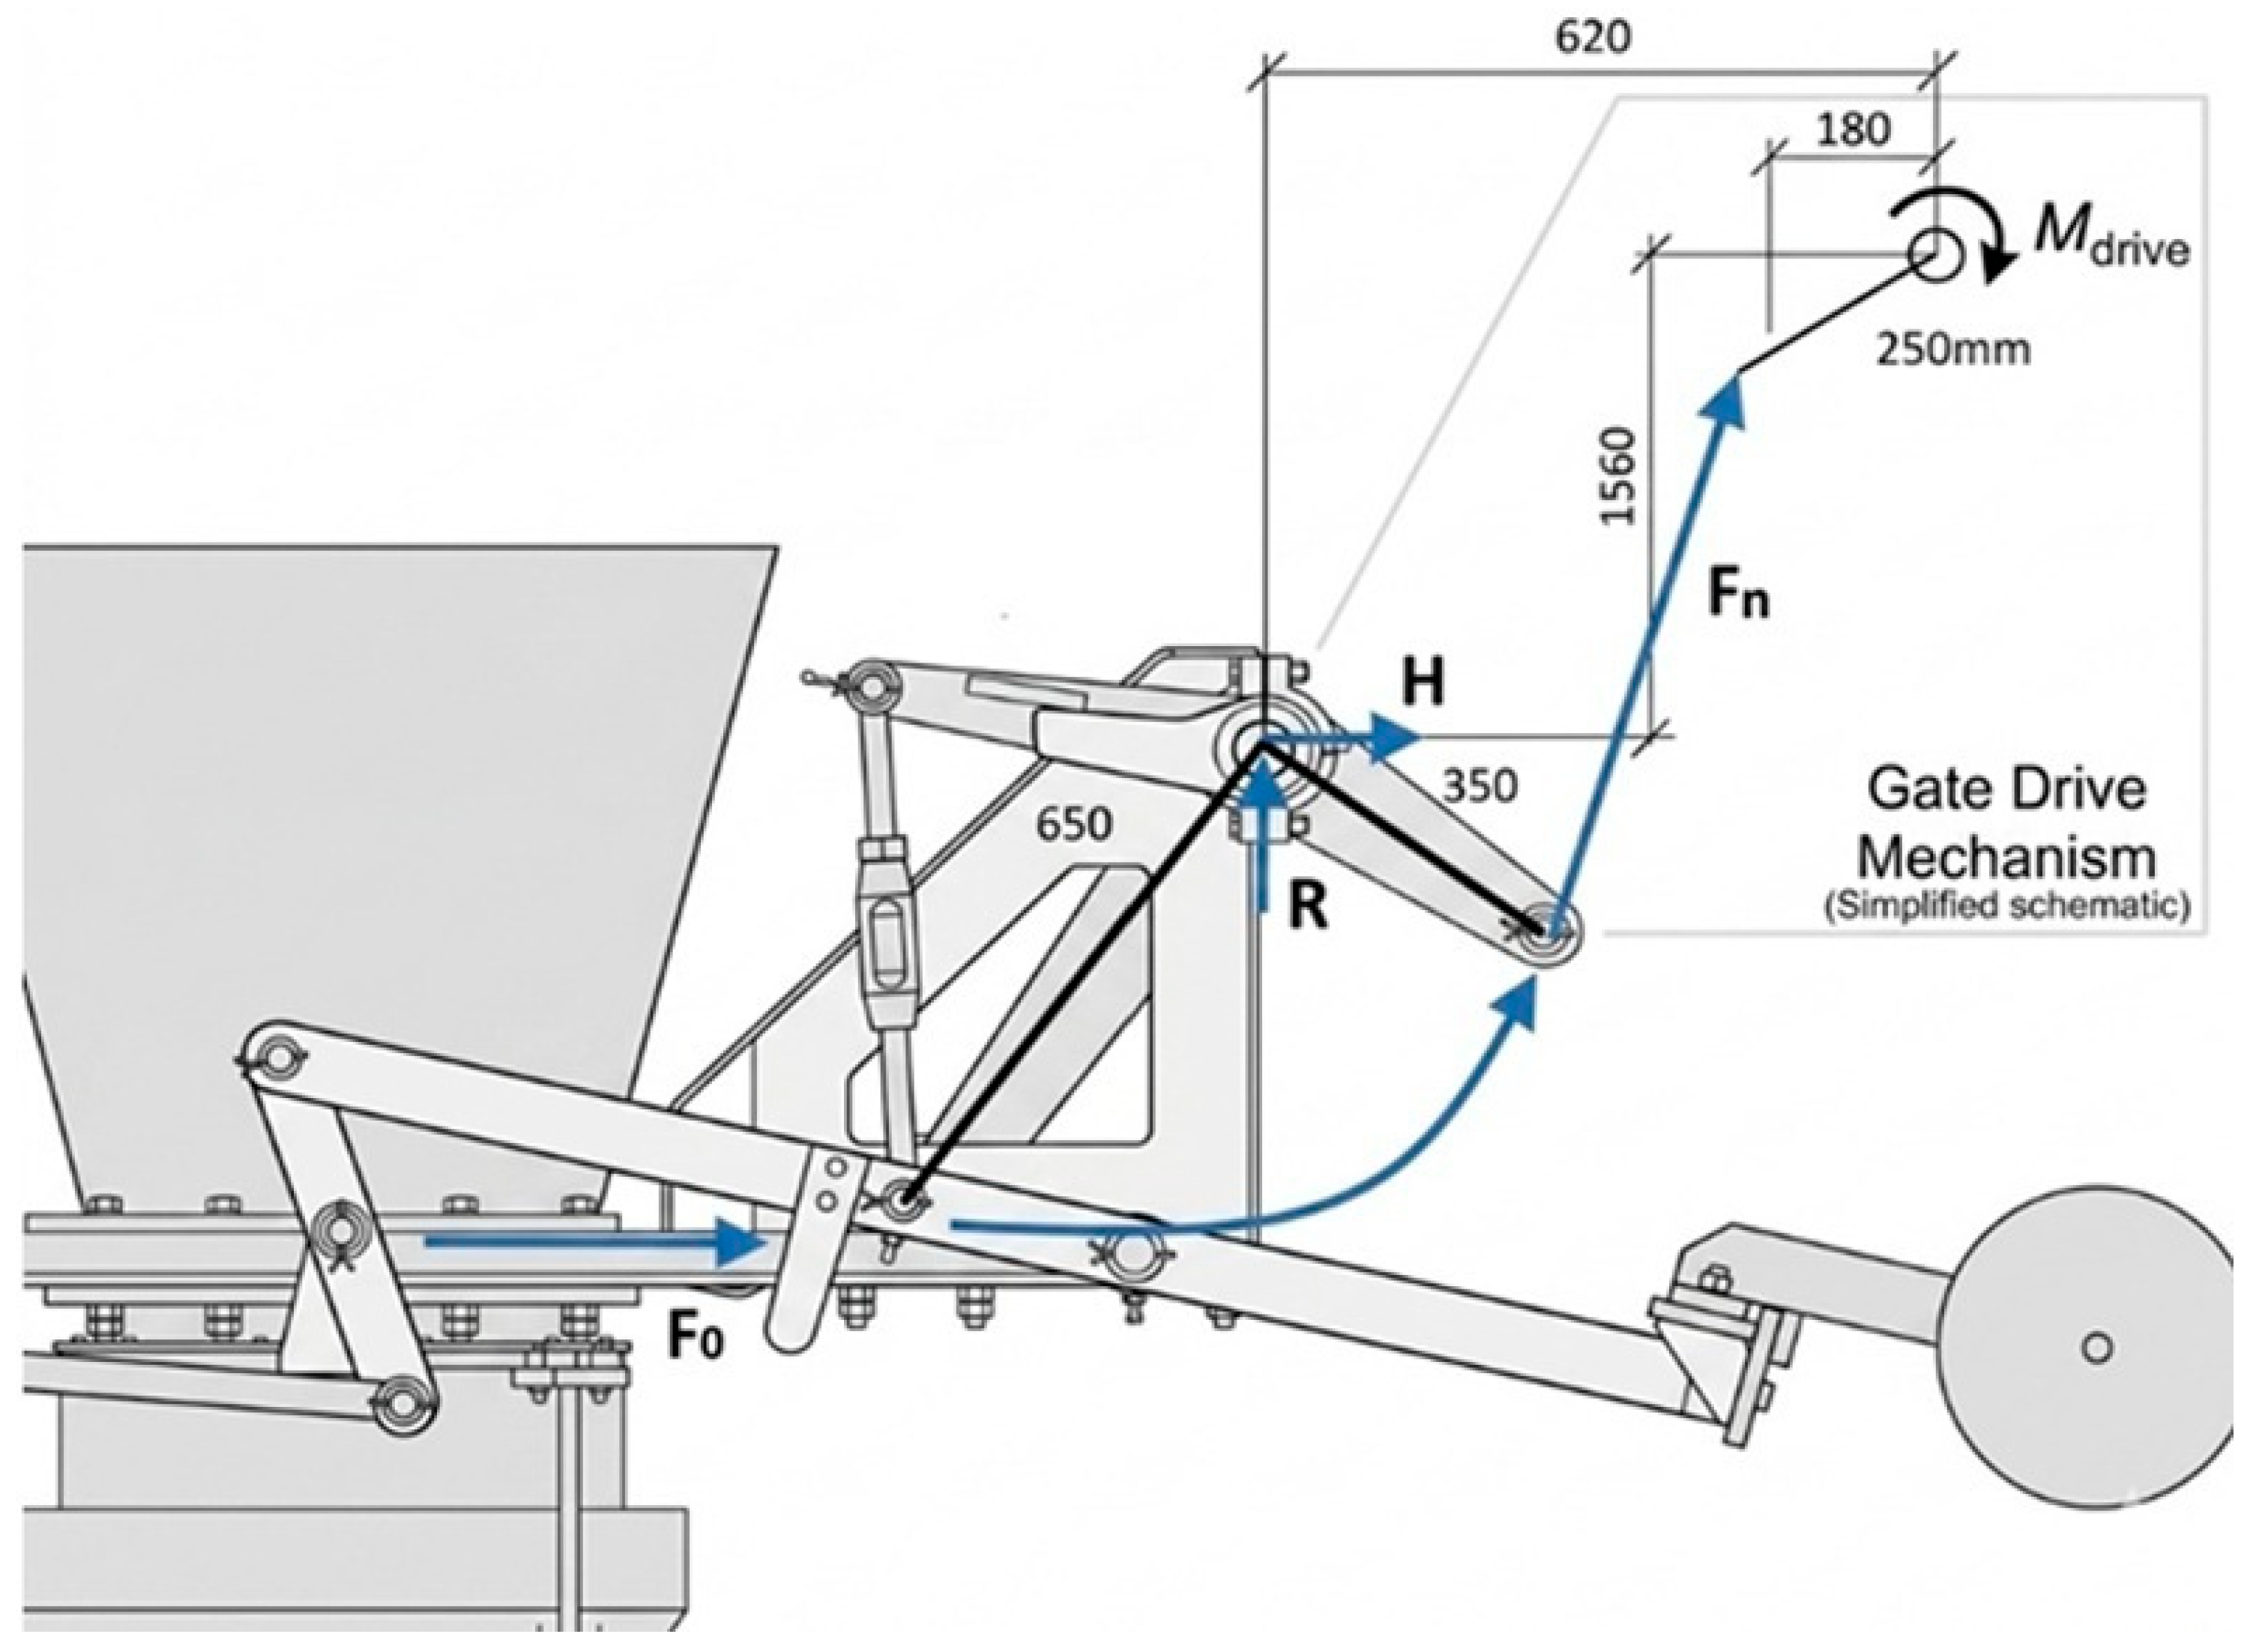
The hopper gate opening mechanism is actuated by an electric drive unit, which transmits torque to the lever system via a shaft. The kinematics of the mechanism, illustrated in Figure 3, converts the rotary motion of the drive into the required opening force (Fn) applied to the hopper gate.
To open the hopper opening mechanism, a force F0 in the horizontal direction greater than the friction force between the charge and the flap must be applied.
The outlet area of the hoppers is 0.213 m2, with a loading height of h = 4.7 m for the central hopper and h = 4.5 m for the outer hoppers. The bulk density of the coal blend, ρbulk, is assumed to be 800 kg/m3. The coal blend exerts a uniform pressure, p, on the hopper opening mechanism area, equal to 3760 kg/m2 (36,885 Pa = 0.036885 MPa) for the central hopper and 3600 kg/m2 (35,316 Pa = 0.035316 MPa) for the outer hoppers. With a friction coefficient of 0.5, the friction force, Ffr, is 3761 N for the central hopper and 3928 N for the outer hoppers. These force values are equal to F0 for each respective hopper.
The hopper opening mechanism is equipped with an MTKF 111-6 electric motor (3.5 kW, 865 rpm). The mechanism can operate normally due to the technical characteristics of this motor.
The magnitude of the force acting on the rope of the hopper opening mechanism is determined from the equilibrium Equation (1)—the sum of all moments relative to the center of the mechanism lever rotation is zero:
M = 0 = F 0 × 650 × cos 30 ° F n × 350 × s i n 70.4 ° = 0 ; Y = 0 = R + F n × s i n 70.4 ° = 0 ; X = 0 = H F 0 + F n × c o s 70.4 ° = 0 ;
Equilibrium conditions determine the force values required to open the hoppers, Fn, as well as their projections, R and H, exerted by the mechanism on the hoppers. For the central hopper, the force required to actuate the mechanism is Fn = 6706.1 N, with projections R = 6317.5 N and H = 1678.4 N. Correspondingly, for the outer hopper, the force required is Fn = 6420.9 N, with projections R = 6048.9 N and H = 1607.0 N.

2.3. Simplification of Calculation Models and Boundary Conditions

In this study, a single standardized type of sensor unit (“Scale Sensor Model RL5426M50t”, Sensor manufacturer: Rice Lake Weighing Systems, Rice Lake, WI, USA, Technical Specifications.) is utilized for all support assemblies. To ensure maximum structural reliability and efficiency, the evaluation is intentionally constrained to the worst load cases identified during the initial kinematic analysis.
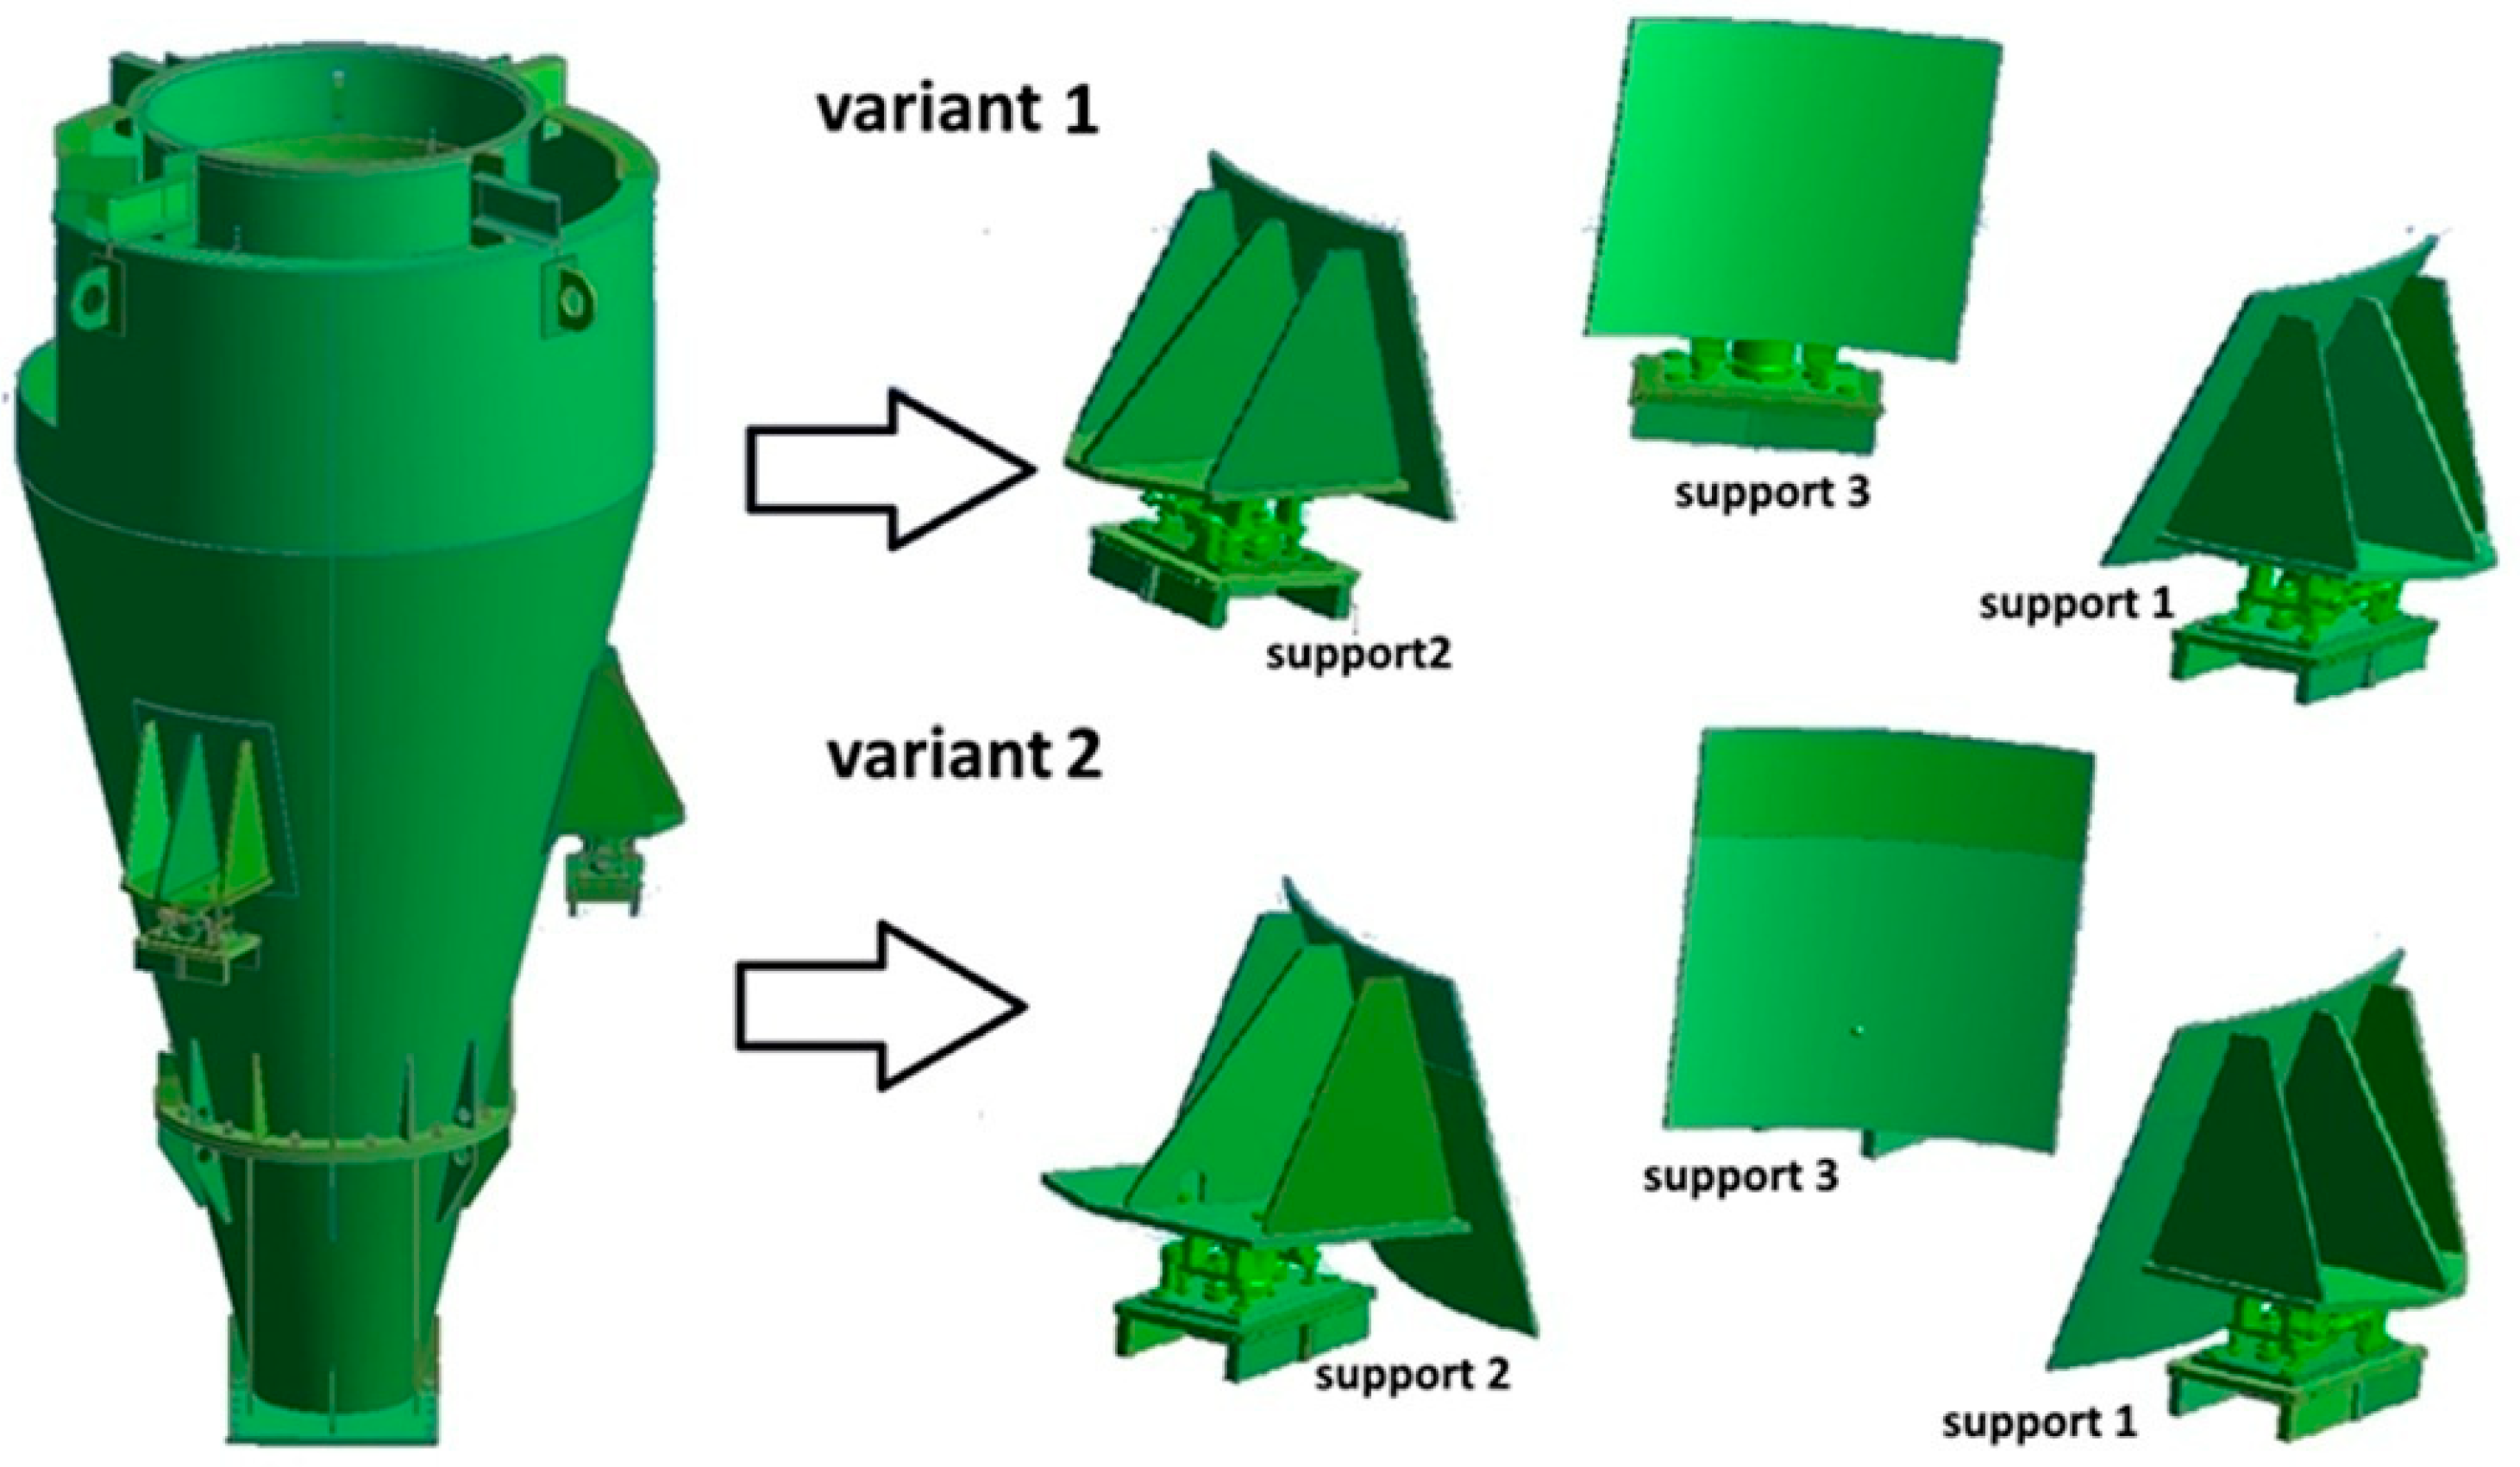
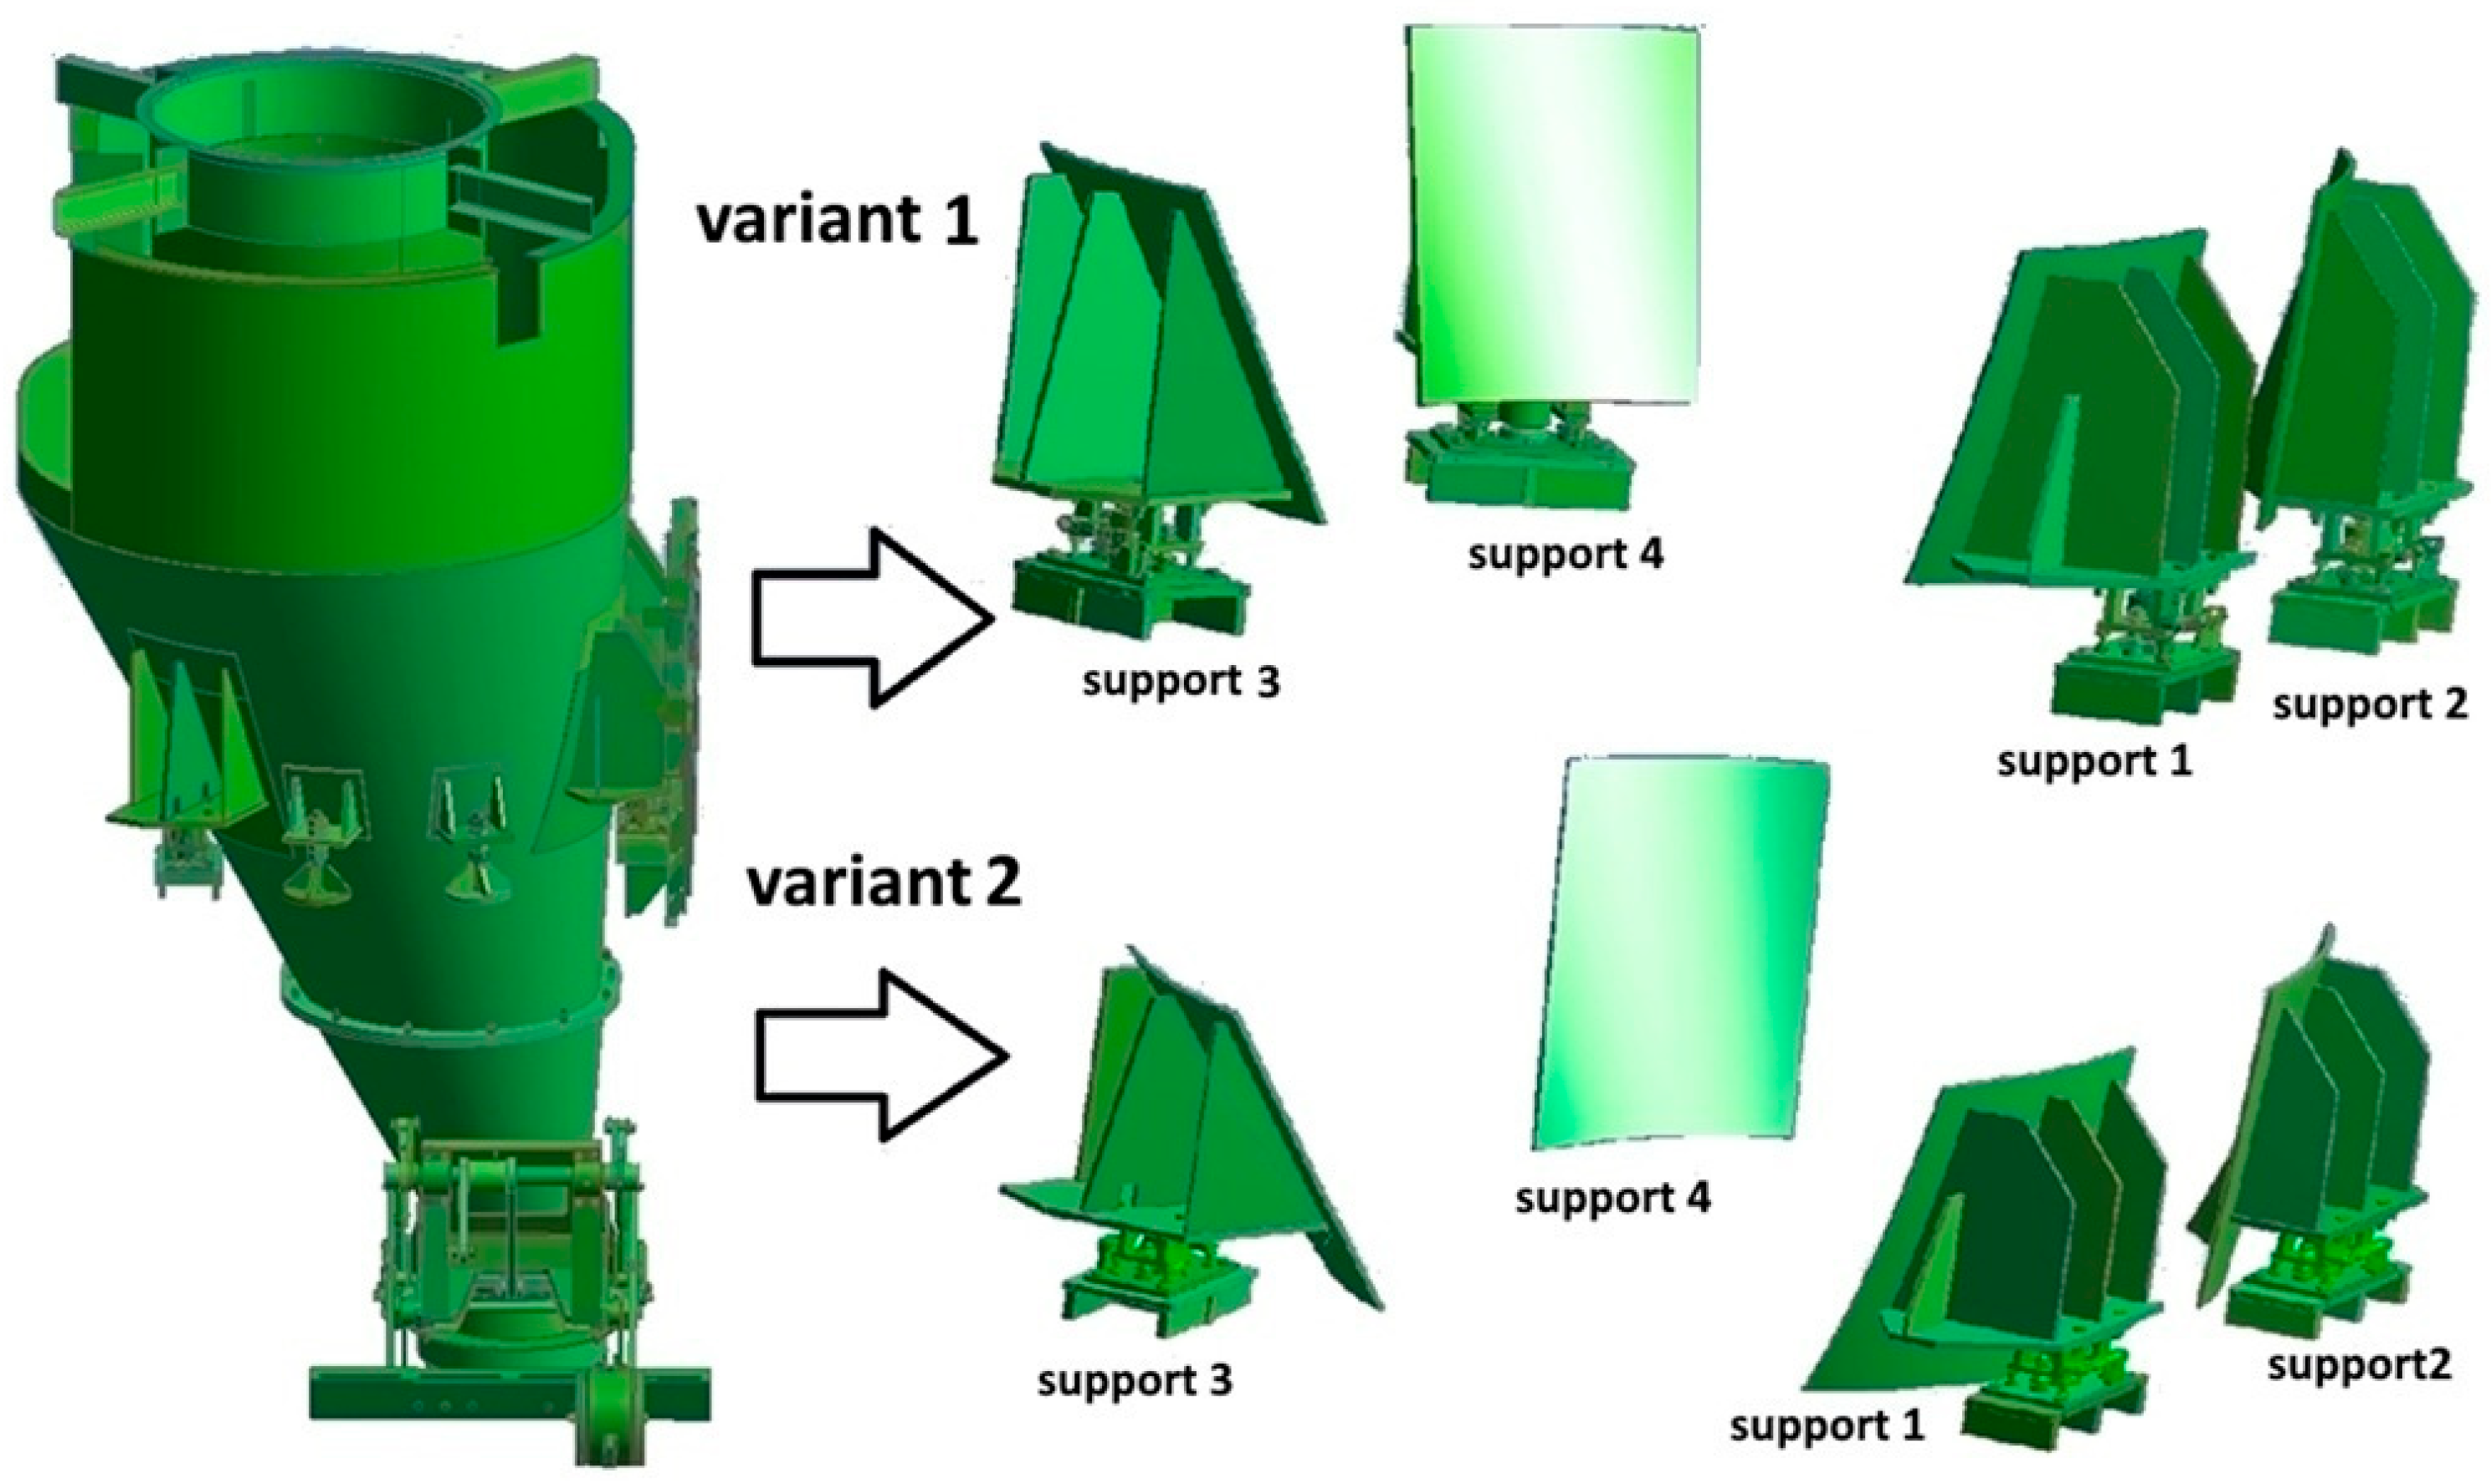
To evaluate the performance of the unit for the location of the weight sensor in the coal hoppers on the charging machine, a step-by-step simplification of the construction model of each hopper is performed. From the whole structure, the support nodes of the bunkers with the installation nodes and sensors stand out (in supports 1–3 and 1–4). Figure 4 and Figure 5 show this simplification for the middle and side bunkers. Variant 1 corresponds to a perpendicular sensor orientation relative to the hopper’s travel direction.
These selected structures are subject to the forces of weight and inertial forces applied at the center of gravity of each hopper for the calculation cases 1 and 2.
The following calculation scheme was used to determine the resultant forces and moments of a loaded hopper moving with acceleration. The entire mass of the structure, including the load, is represented as a lumped mass located at the actual center of gravity of the system.
The force of gravity and the inertia force, which is directed opposite to the acceleration vector, are applied to the center of gravity. The hopper supports are connected via a fixed hinge to the structure incorporating the weight sensor. The bottom base of this assembly’s structure is fixed. The calculated forces in the hinge are assumed to be the forces acting on the sensor. The resulting lateral loads are absorbed by a special design of the mounting assembly, which relieves the weight sensor from shear stress.
Instead of the entire charging machine structure, only the hopper support structures are considered. Therefore, at the first stage, the greatest load that acts on the sensor installation unit is determined. To do this, in each calculation case, the built-in units are replaced by fixed hinged connections (Joint-Fixed), and for each calculation case, the forces arising between the surfaces fixing the built-in unit are determined.
Of all the forces in the connections, the largest are selected and for this loading option, an assessment of the strength of the sensor installation unit is subsequently performed.

3. Results

3.1. Mathematical Modeling of Load Distribution on Supports

To evaluate the stress-strain state of the sensor installation assemblies, the finite element analysis (FEA) was carried out in ANSYS Mechanical (version 2024 R1, Ansys Inc., Canonsburg, PA, USA) using the academic license provided by Wrocław University of Science and Technology.
To determine the greatest loads acting on the sensor assembly unit, calculations were made for the side and middle hoppers. The calculations were carried out for the previously accepted three calculation cases with two orientations of the guides—along the movement of the charging machine and in the perpendicular direction.
In all these calculation cases, the weight of the hopper and the inertial load are presented in the form of a concentrated mass located in the center of gravity and acting on the surface of the bunker adjacent to the support. The calculations use support material AISI 321 (yield strength 215 MPa, tensile strength 545 MPa). AISI 321 grade is a high-alloy heat-resistant steel that is not produced by one specific plant, but is produced by many global and Ukrainian metallurgical plants.
A physically non-linear material model of AISI 321, described by the Multilinear Isotropic Hardening model, was used for the calculation.
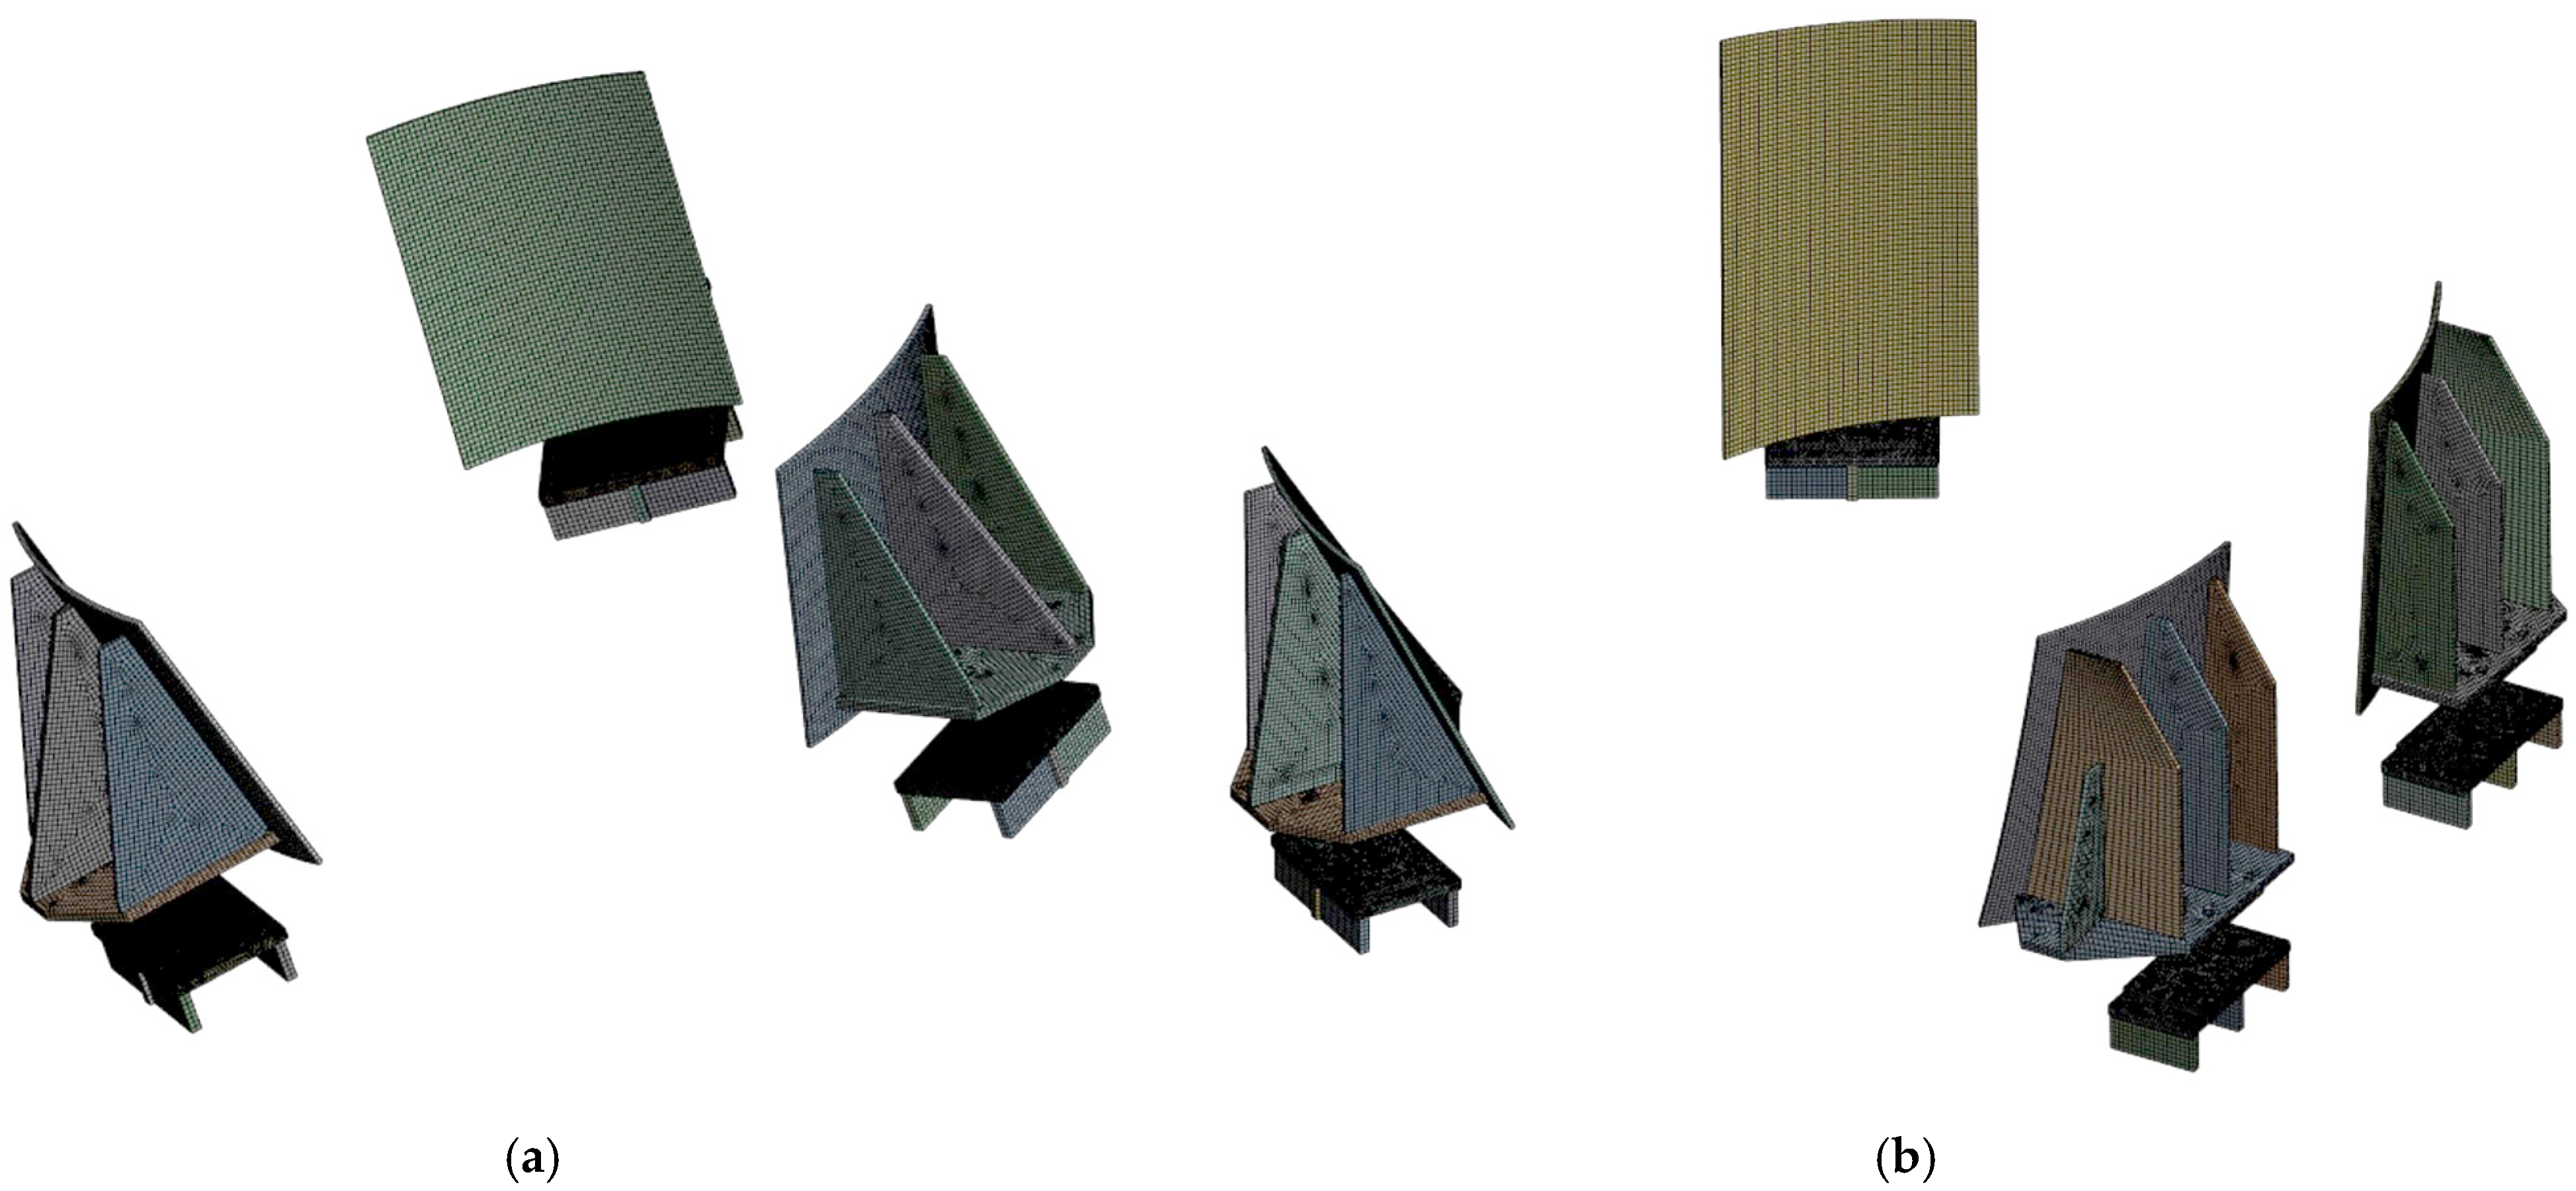
Structural discretization and finite element mesh generation for the developed model for determining forces and moments are illustrated in Figure 6.
To guarantee high numerical consistency and mathematical stability of the solution, the selection of the element size and higher-order element types followed the validated methodological approaches for the numerical analysis and experimental strain-gauge validation of complex mechanical components [20]. This approach ensures proper convergence, minimizing the risk of numerical singularities in the localized stress concentration zones.
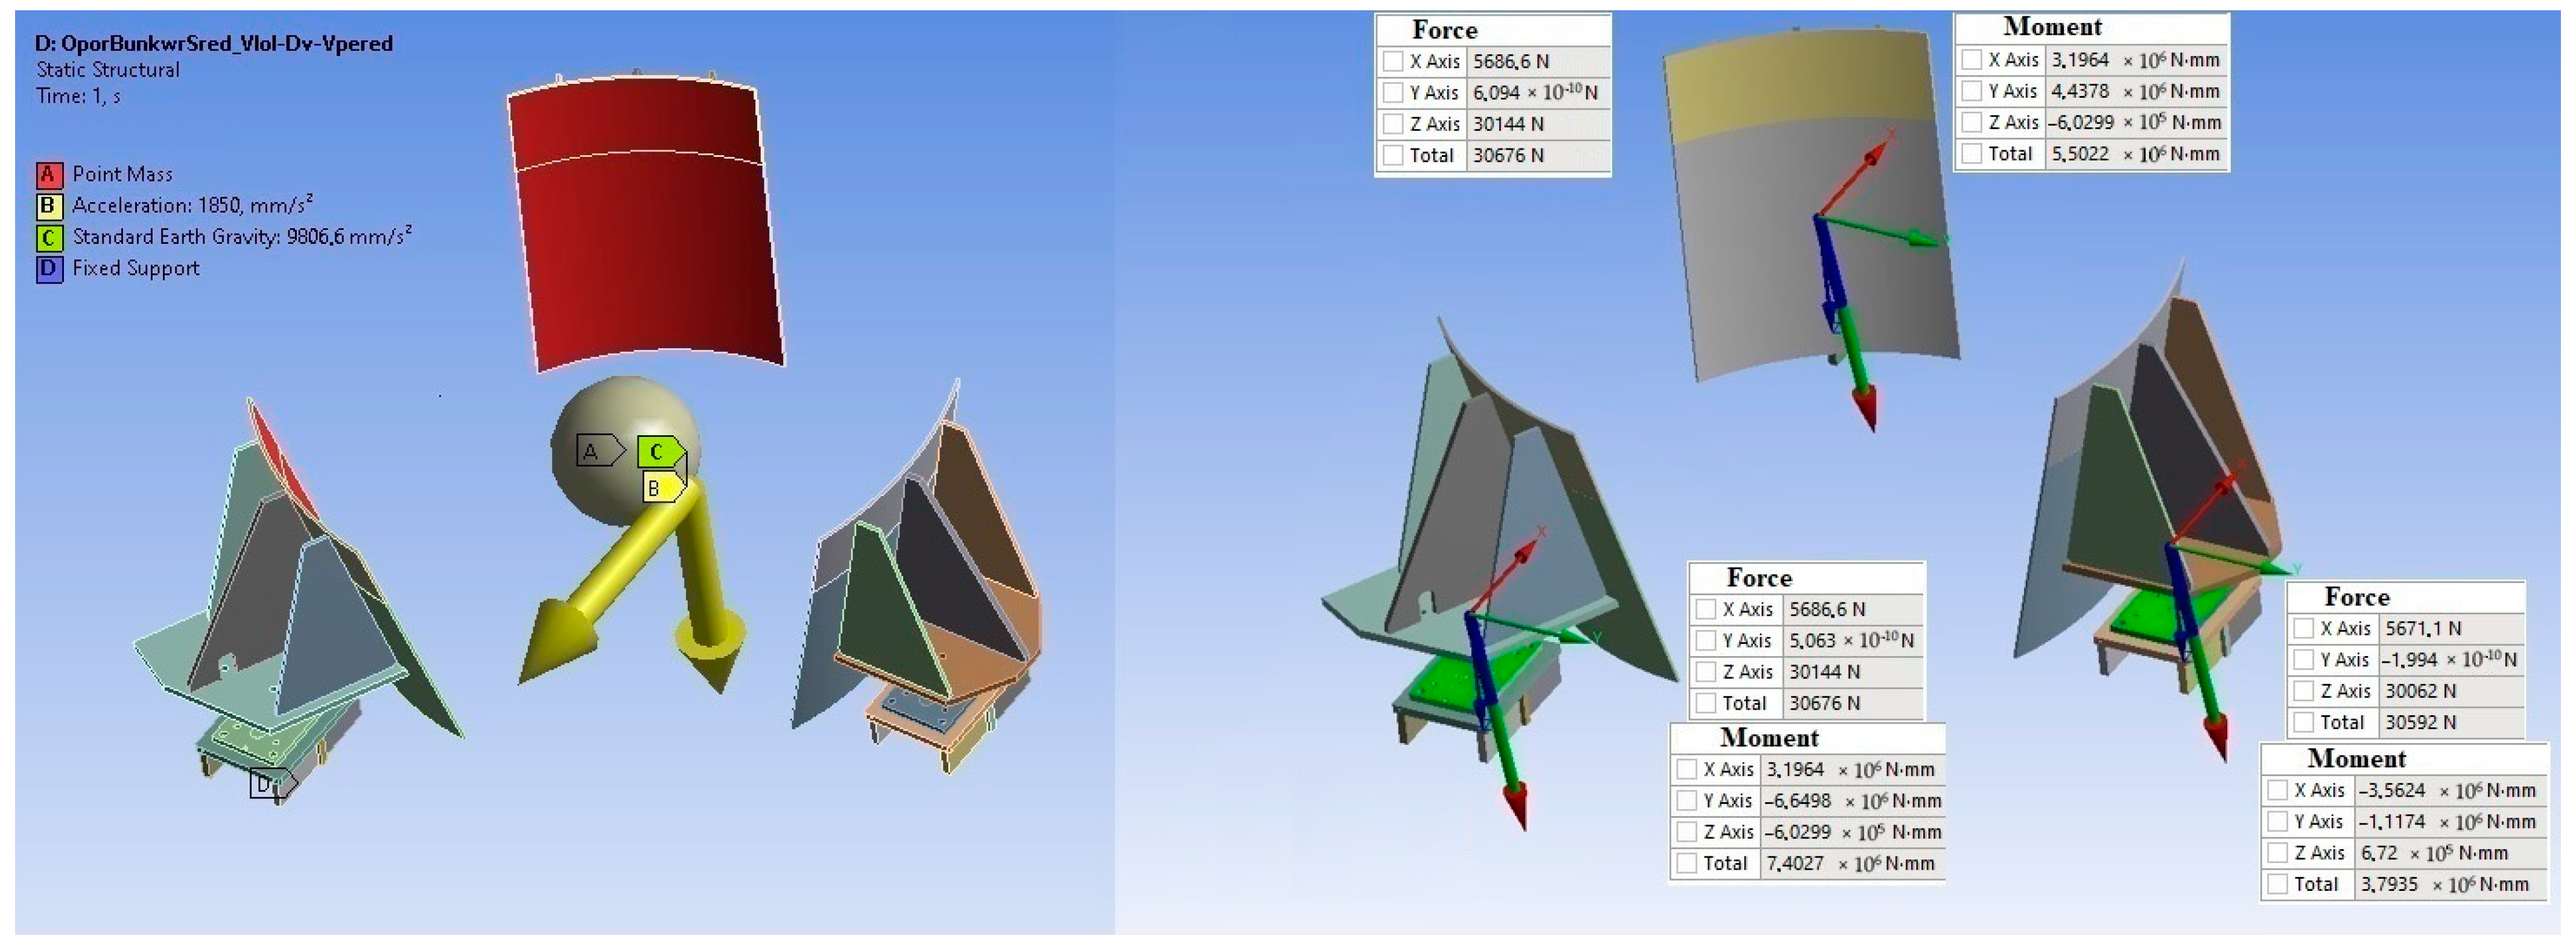
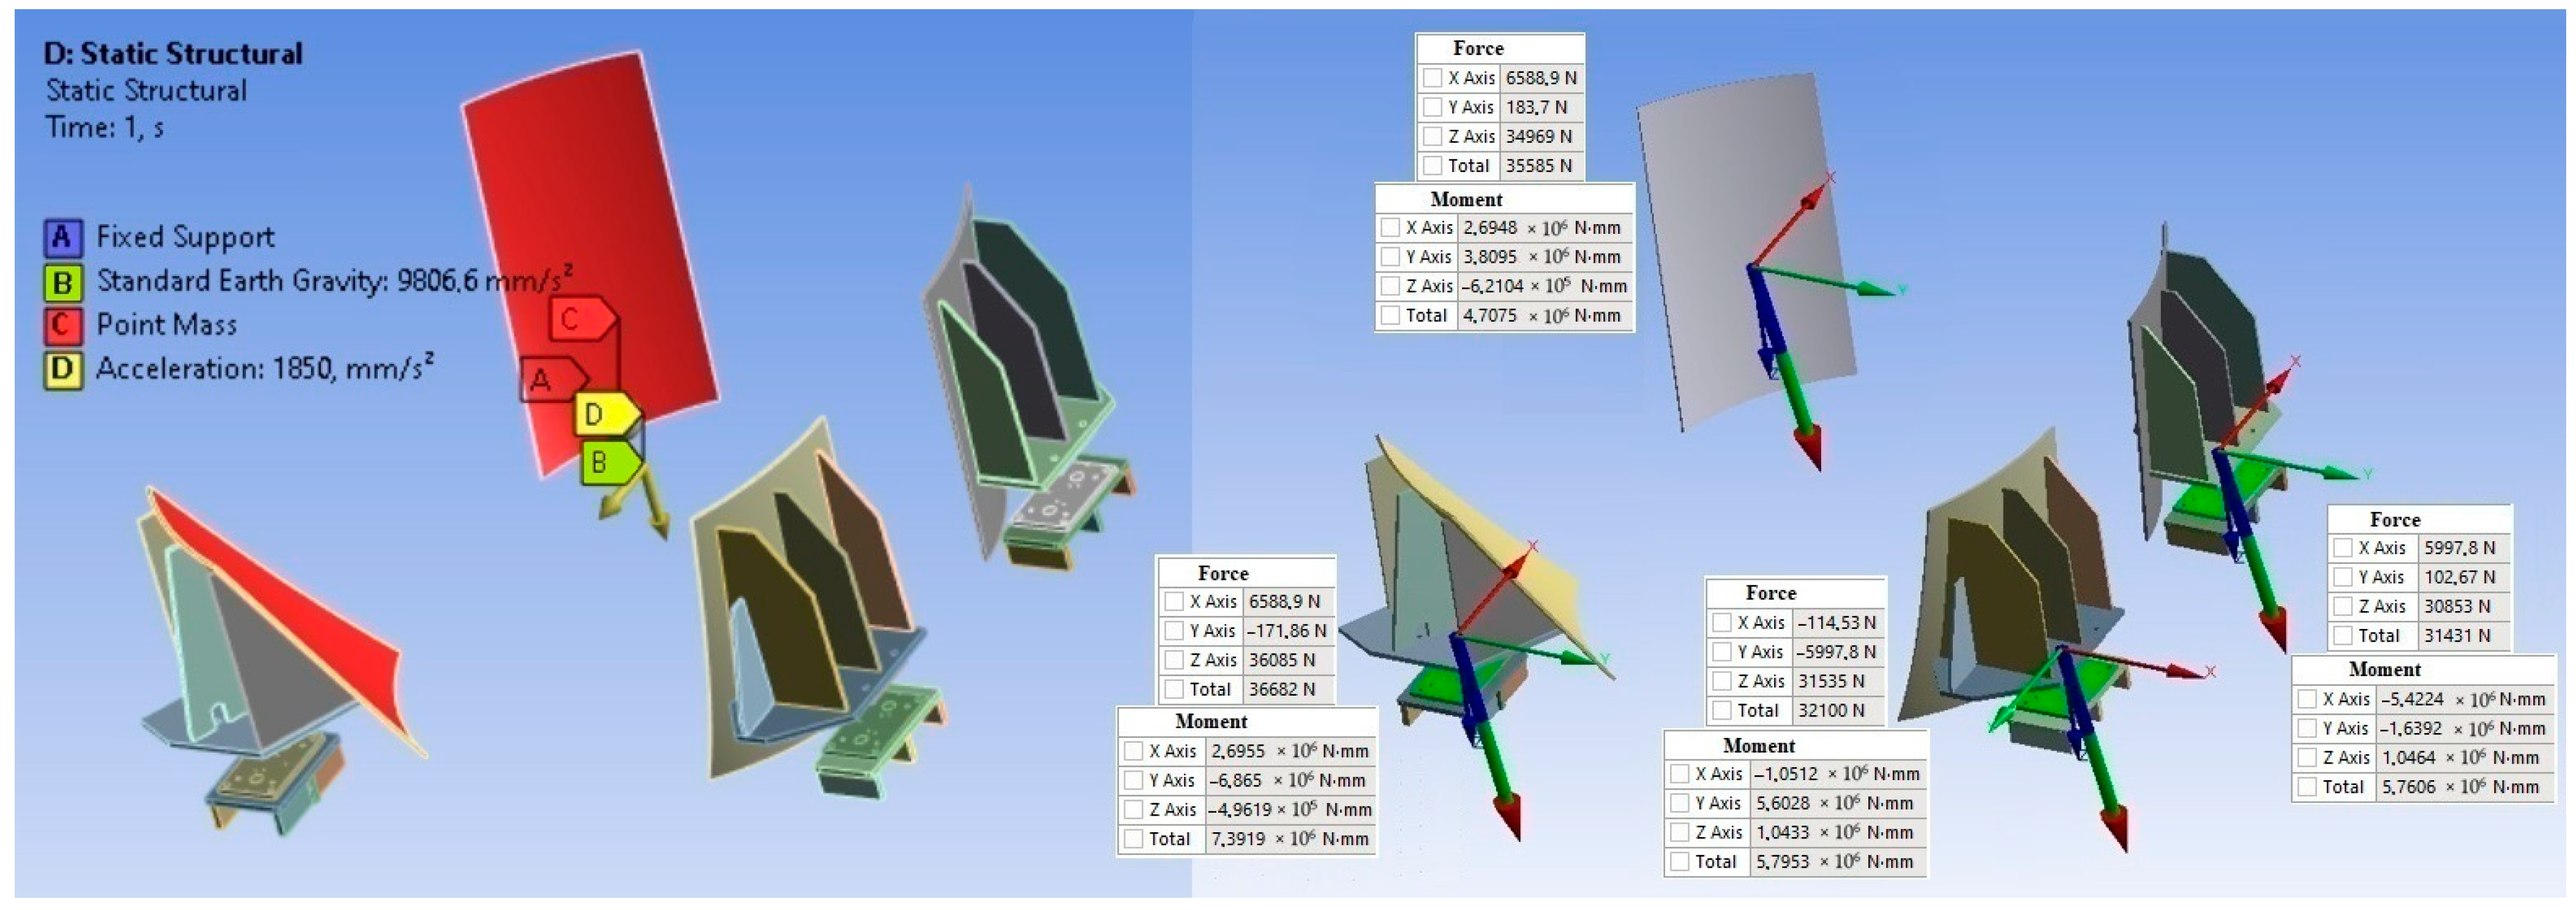
The calculation schemes and the corresponding force vectors acting on the structural supports of the central and outer hoppers under the first calculation case, representing the forward acceleration phase of the fully loaded charging machine, are comprehensively illustrated in Figure 7 and Figure 8, respectively.
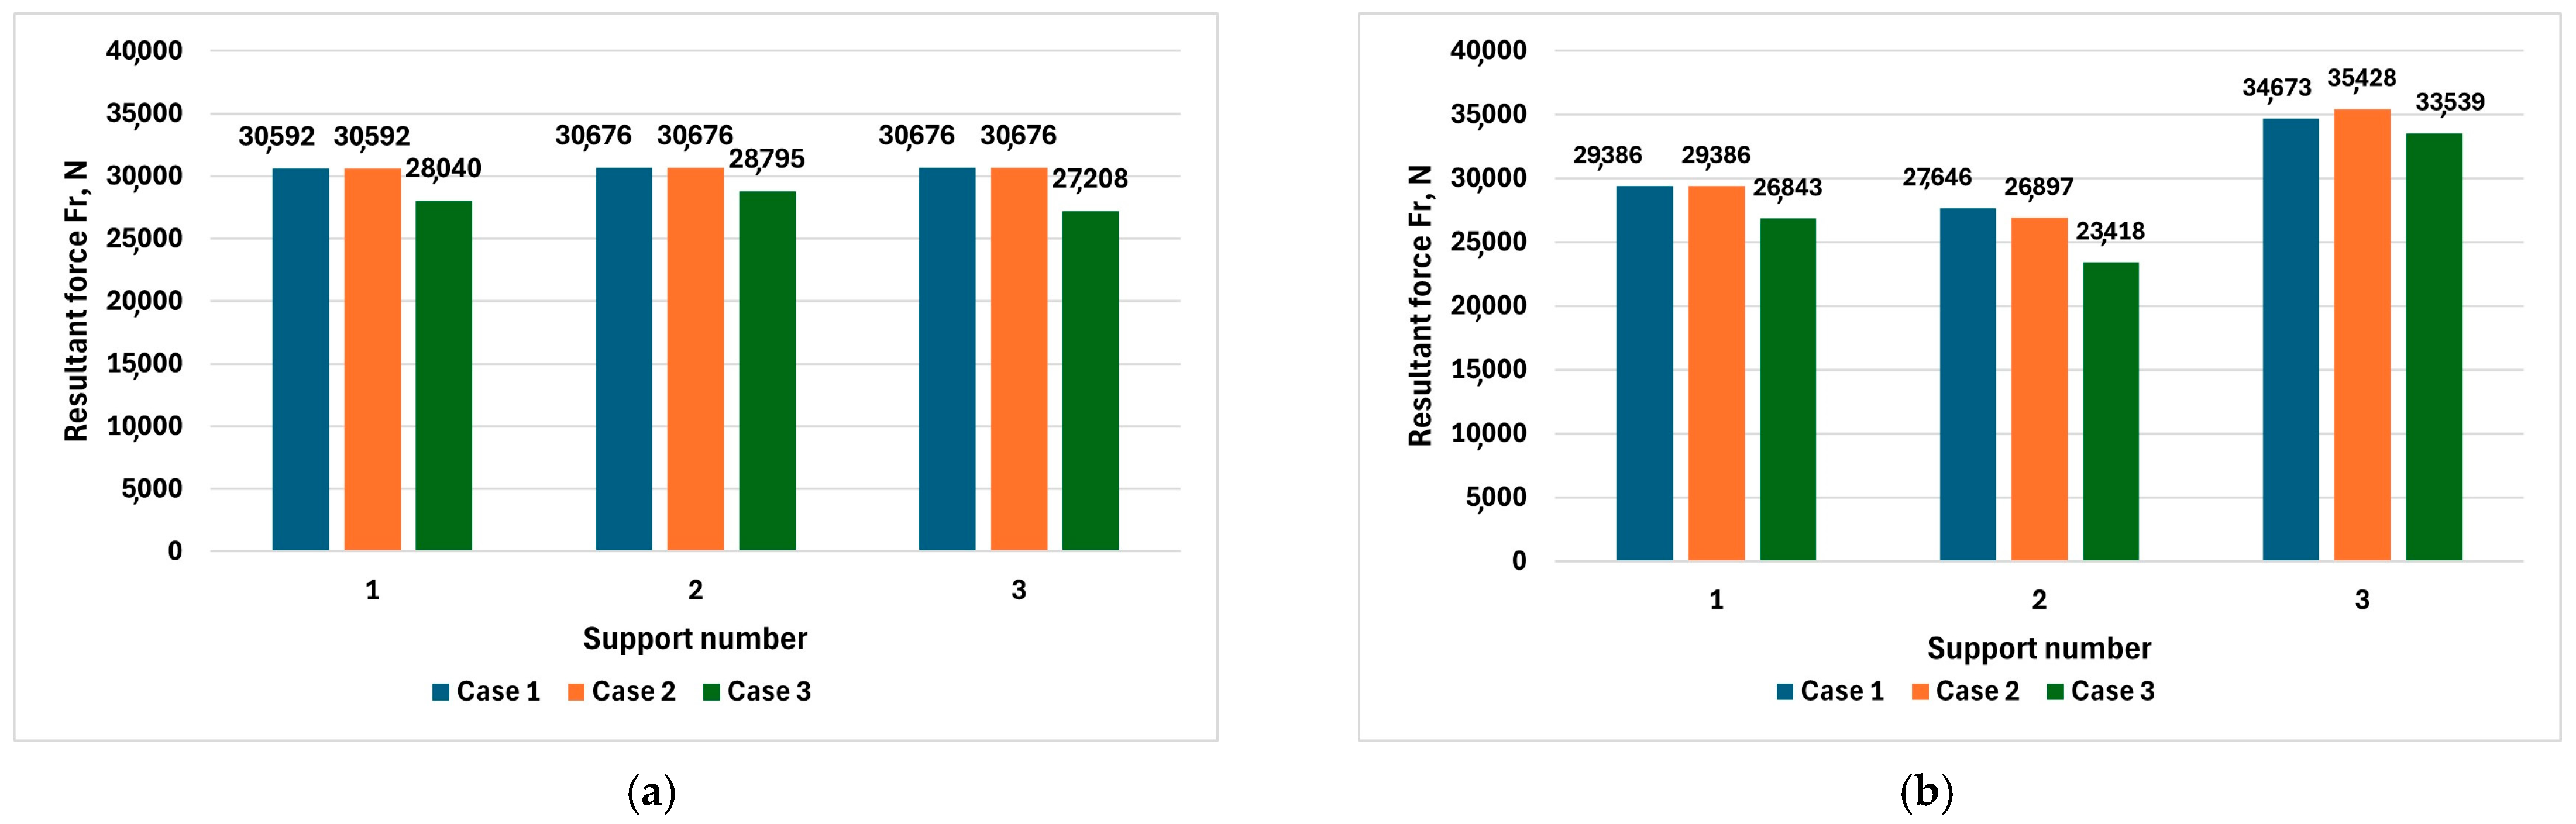
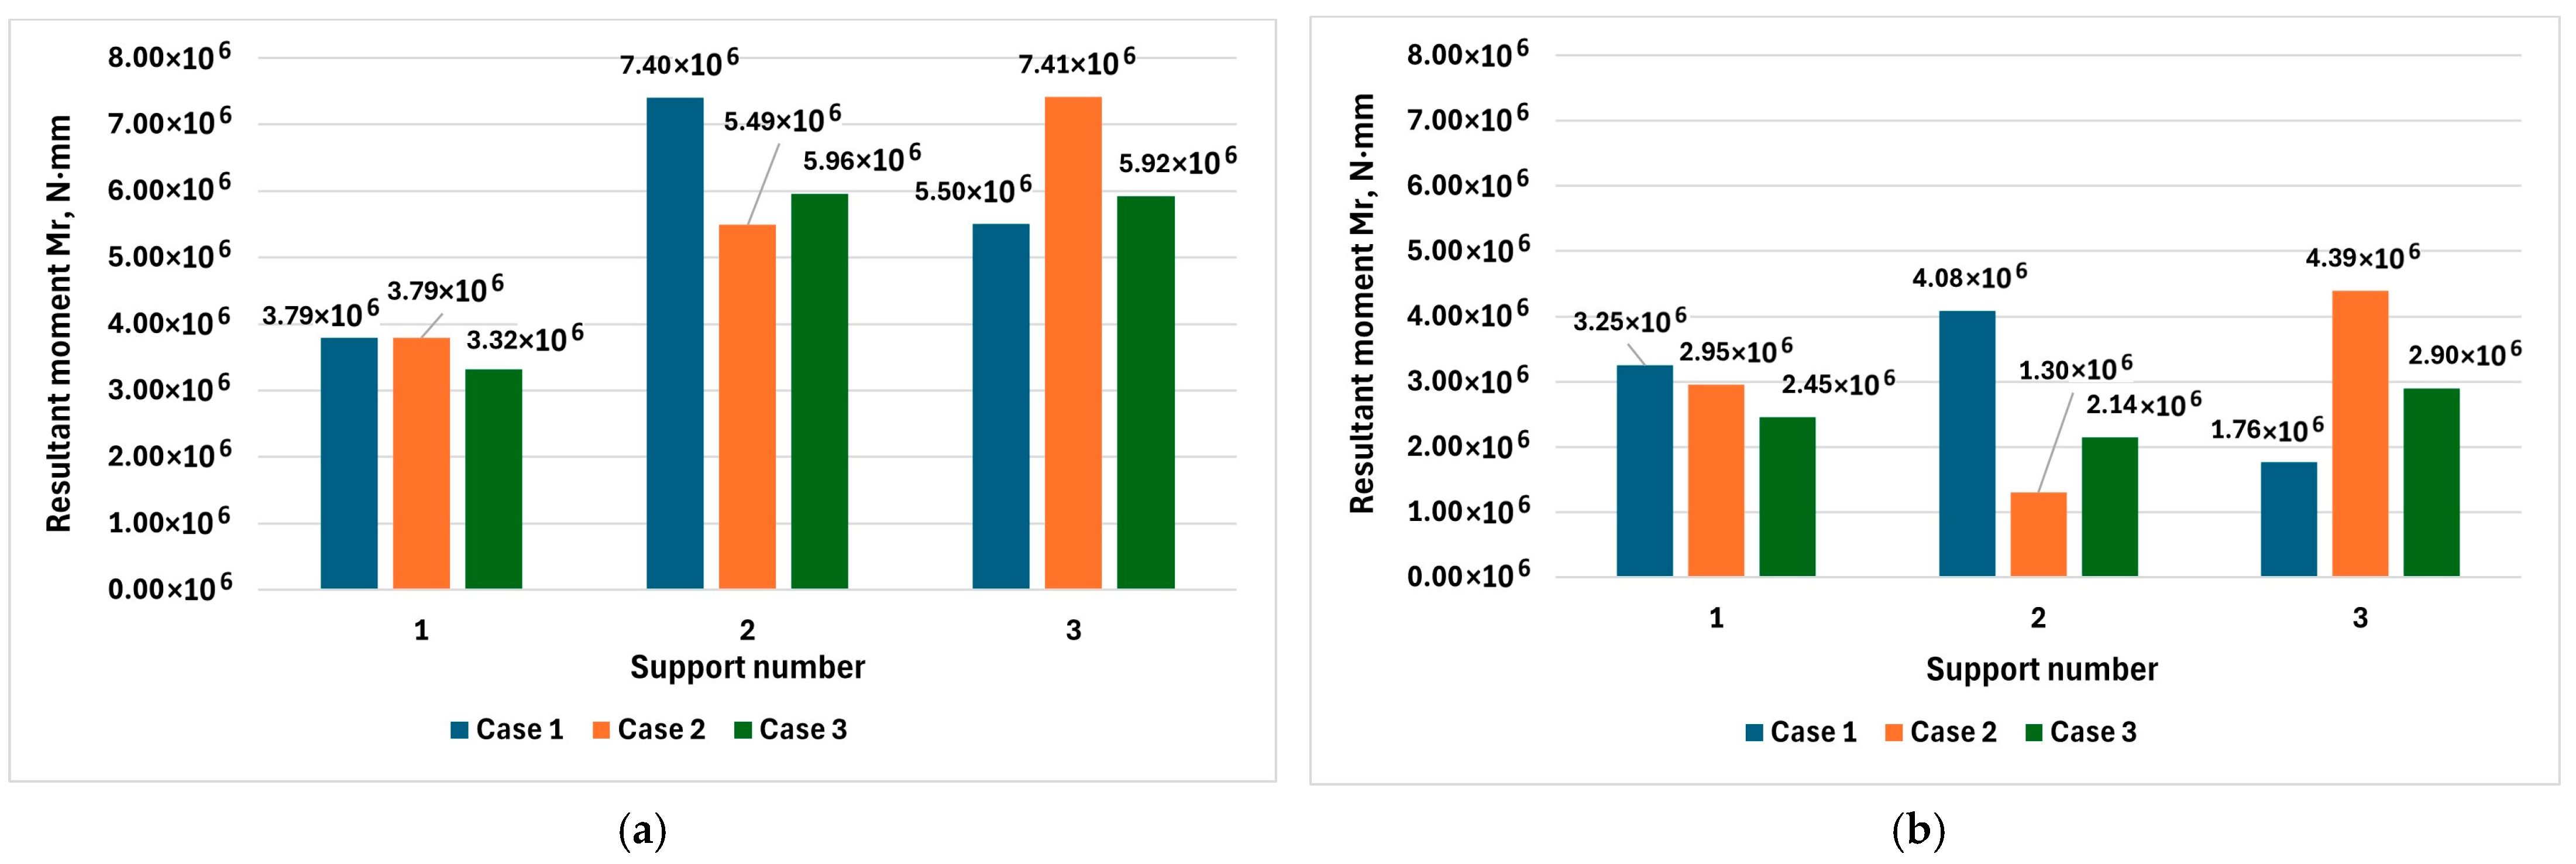
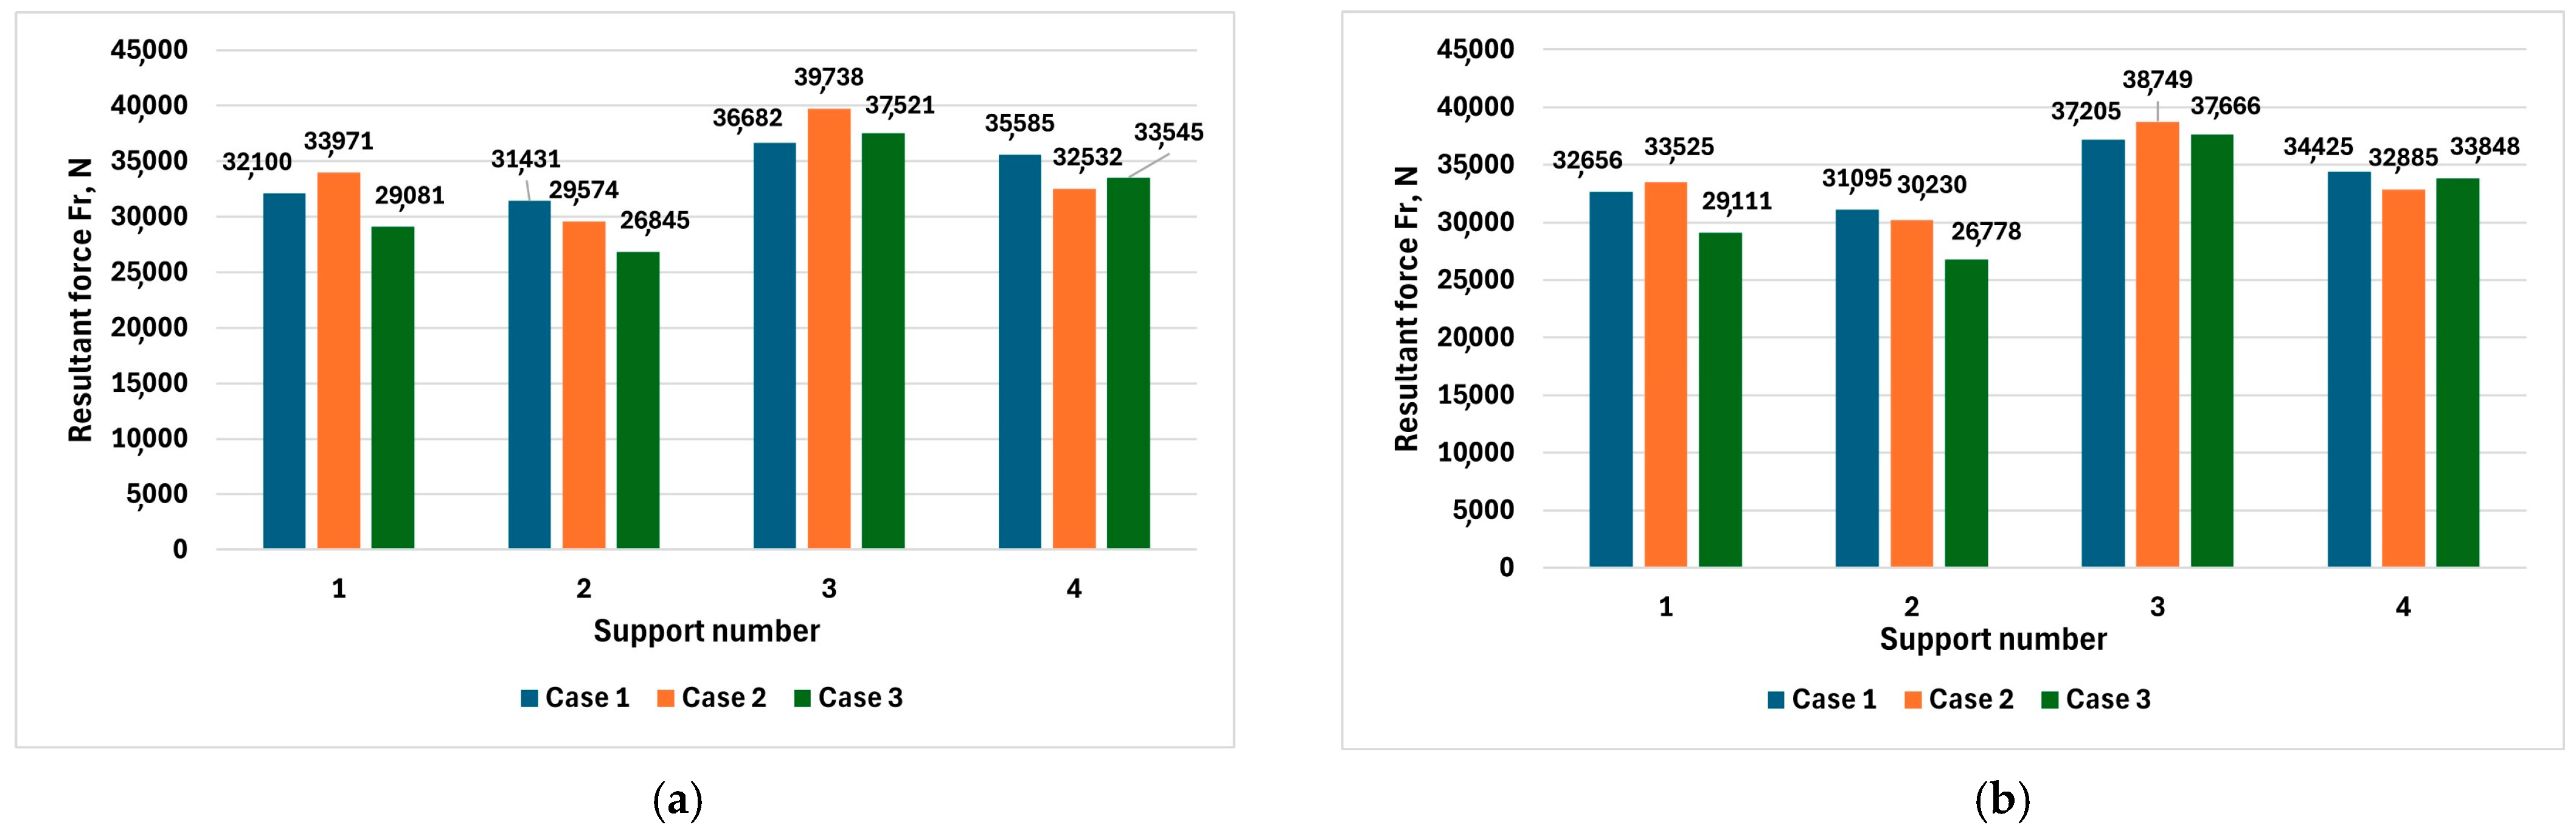
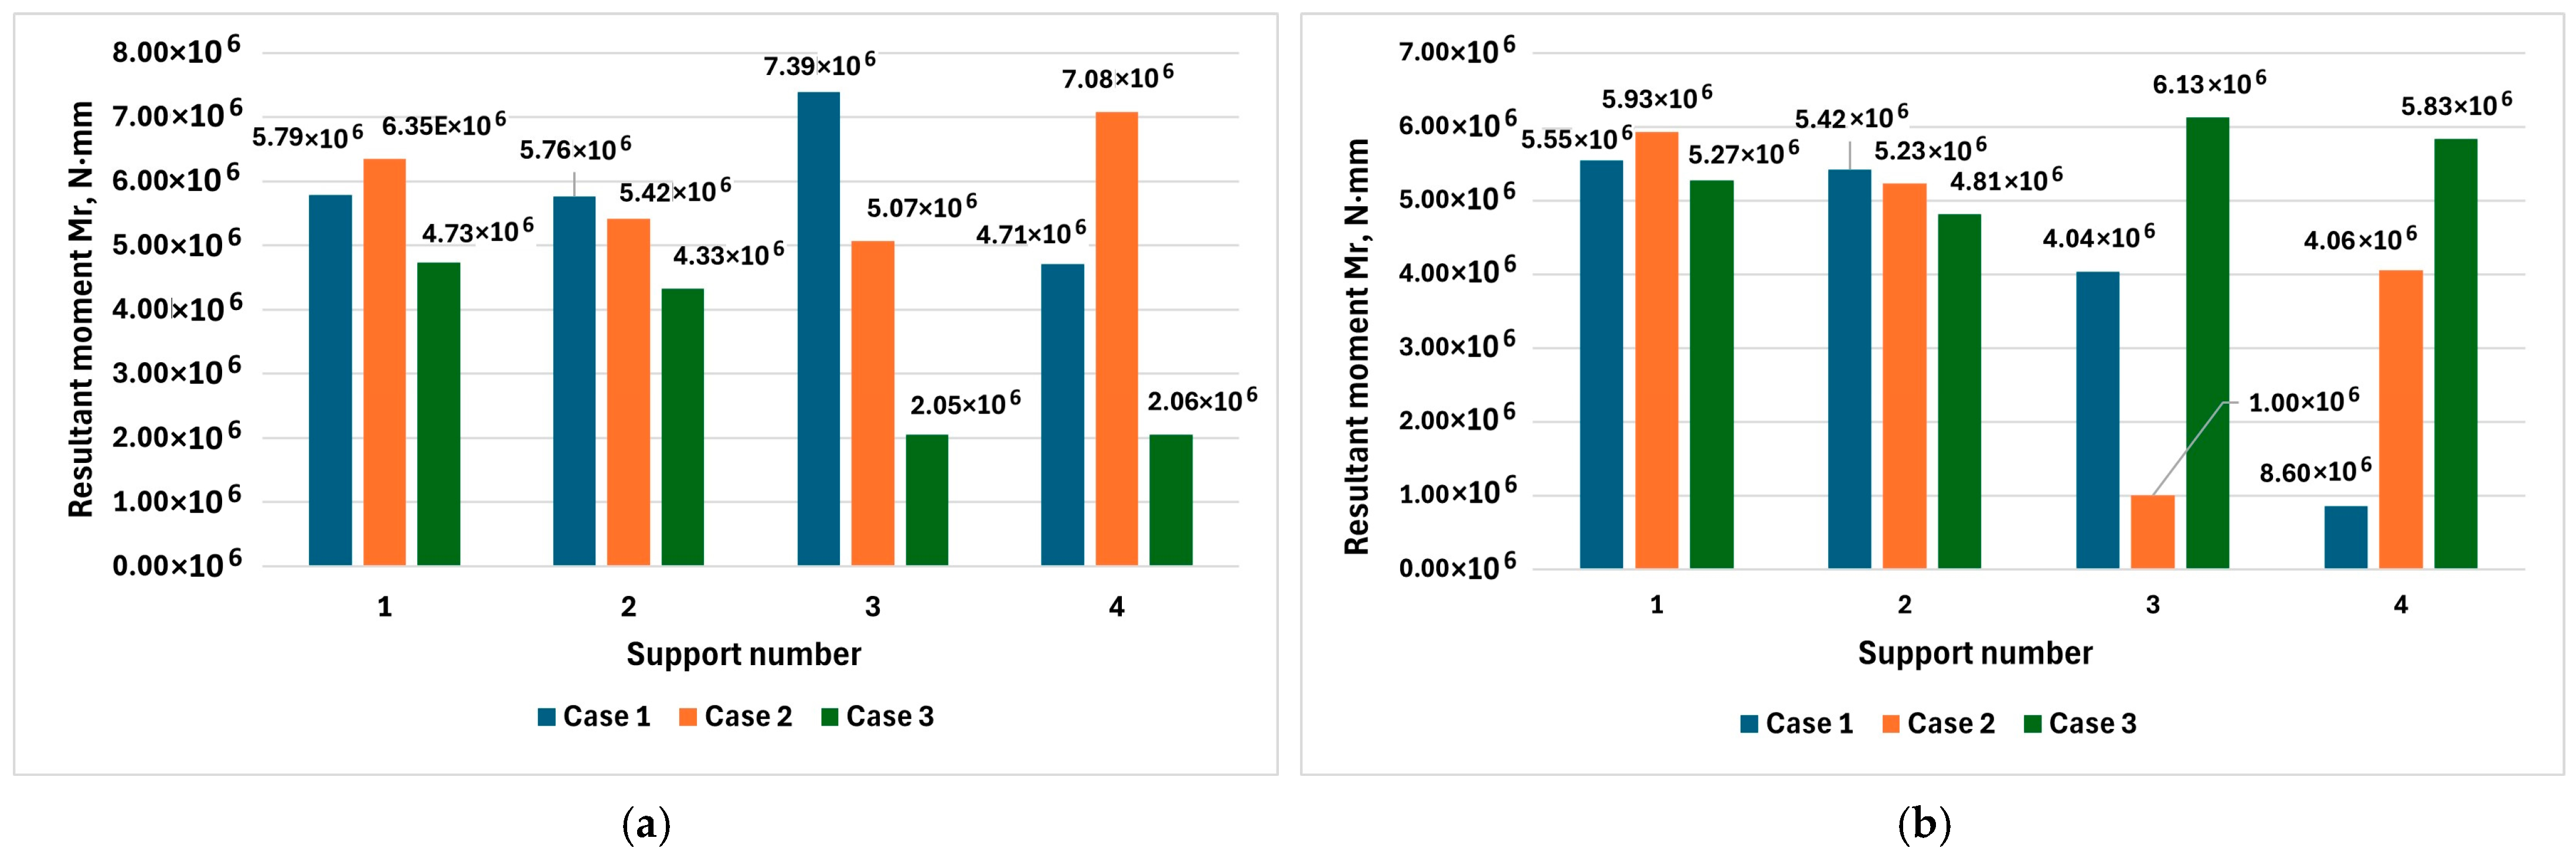
The numerical simulation results regarding the spatial force interactions within the structural supports of the coal-charging car’s hoppers are summarized in Table 1 and Table 2. Comprehensive comparative graphs demonstrating the distribution of the resultant forces (Fr) and resultant moments (Mr) across individual support points under three specified technological loading cases are visualized in Figure 9 and Figure 10 for the central hopper and Figure 11 and Figure 12 for the side hoppers.
Analysis of the data in Table 1 yields key insights into the structural behavior of the central hopper, which utilizes a three-point support configuration. The peak structural loading conditions occur during transient transport phases involving uniform acceleration and deceleration (the 1st and 2nd calculation cases), driven by a linear inertial vector of 1.85 m/s2 (1850 mm/s2). Under these dynamic conditions, the absolute resultant support forces (Fr) reach up to 30,676.0 N for the longitudinal orientation and peak within the range of 34,673.0–35,428.0 N for the perpendicular orientation. Conversely, the stationary gate-opening phase, represented by the 3rd calculation case, exhibits a milder loading profile with forces dropping to a range of 23,418.0–33,539.0 N.
The impact of sensor orientation on the force distribution across the central hopper supports is highly significant. When the installation nodes are aligned longitudinally along the charging car’s direction of travel, an exceptionally uniform distribution of resultant forces is achieved. For both the 1st and 2nd calculation cases, the loads on all three supports are practically identical, showing only a marginal fluctuation from 30,592.0 N to 30,676.0 N. However, when switching to the perpendicular orientation relative to the hopper forming line, this symmetry is heavily disrupted, as seen in Figure 9b. Due to lateral asymmetric constraints, Support 3 experiences a severe overload, reaching 34,673.0 N in the 1st case and 35,428.0 N in the 2nd case, while the load on Support 2 drops down to 26,897.0 N.
Furthermore, the resultant moment values acting on the central hopper structural nodes are highly sensitive to the mounting method, as illustrated in Figure 10. For the longitudinal scheme, the parasitic bending moments are stably bounded between 3.78 × 10⁶ N⋅mm and 7.40 × 10⁶ N⋅mm across all cases. In contrast, the perpendicular orientation leads to an abrupt local moment surge up to 4.39 × 10⁶ N⋅mm at critical support points, which increases the localized stress gradient within the attachment flange and is undesirable for measurement stability.
The side hoppers, which are designed with a four-point support layout, carry a significantly larger mass of high-density material (8780 kg compared to 5300 kg for the central hopper), and their behavior differs substantially. The calculated results presented in Table 2 clearly indicate a pronounced non-uniformity in the load distribution across the four support points in all analyzed cases. This structural behavior is most distinct in the static 3rd calculation case shown in Figure 11, where the actuation of the bottom bunker discharge gate mechanism induces a highly uneven localized pressure profile. For instance, in the longitudinal variant of Case 3, the resultant force at Support 3 jumps to 37,521.0 N, whereas Support 2 carries only 26,845.0 N. This behavior proves that a statically indeterminate four-support setup cannot guarantee stable or uniform structural contact under industrial operating conditions.
When comparing the orientation performance for the side hoppers, the minimum peak values of the resultant force vectors (Fr) are achieved when the sensor installation nodes are oriented perpendicularly to the machine line of motion, as shown in Table 2 and Figure 11b. For Case 1, the peak force on Support 3 is reduced to 37,205.0 N in the perpendicular variant compared to 36,682.0 N in the longitudinal variant, but the main advantage of this setup lies in the dramatic reduction in parasitic bending moments. As illustrated in Figure 12, the perpendicular layout provides a significant mechanical advantage in mitigating structural torque.
During forward travel acceleration in the 1st case, the moment acting on Support 4 drops down sharply to an exceptionally low value of 0.86 × 10⁶ N⋅mm under the perpendicular orientation, while it reaches a hazardous 4.71 × 10⁶ N⋅mm in the longitudinal configuration. This indicates that the perpendicular orientation minimizes structural twisting effects for the side hoppers under peak longitudinal inertial forces.
Based on the comprehensive analysis of Table 1 and Table 2 and Figure 9, Figure 10, Figure 11 and Figure 12, several summary recommendations can be formulated for the design of the weight measurement system. For the central hopper, a three-support scheme combined with a longitudinal sensor orientation is the optimal choice, as it guarantees a nearly perfectly symmetrical load balance across all structural supports and eliminates localized overload spikes under dynamic train movement. For the side hoppers, the four-support layout inevitably exhibits severe uneven load distribution due to geometric constraints. To improve automated weight tracking precision and prevent systematic cyclic errors caused by parasitic bending moments, it is highly recommended to re-engineer the side hoppers into a three-support configuration with optimized sensor orientation, similar to the verified central hopper design.

3.2. Vector Deviation Analysis Relative to the Sensor Axis

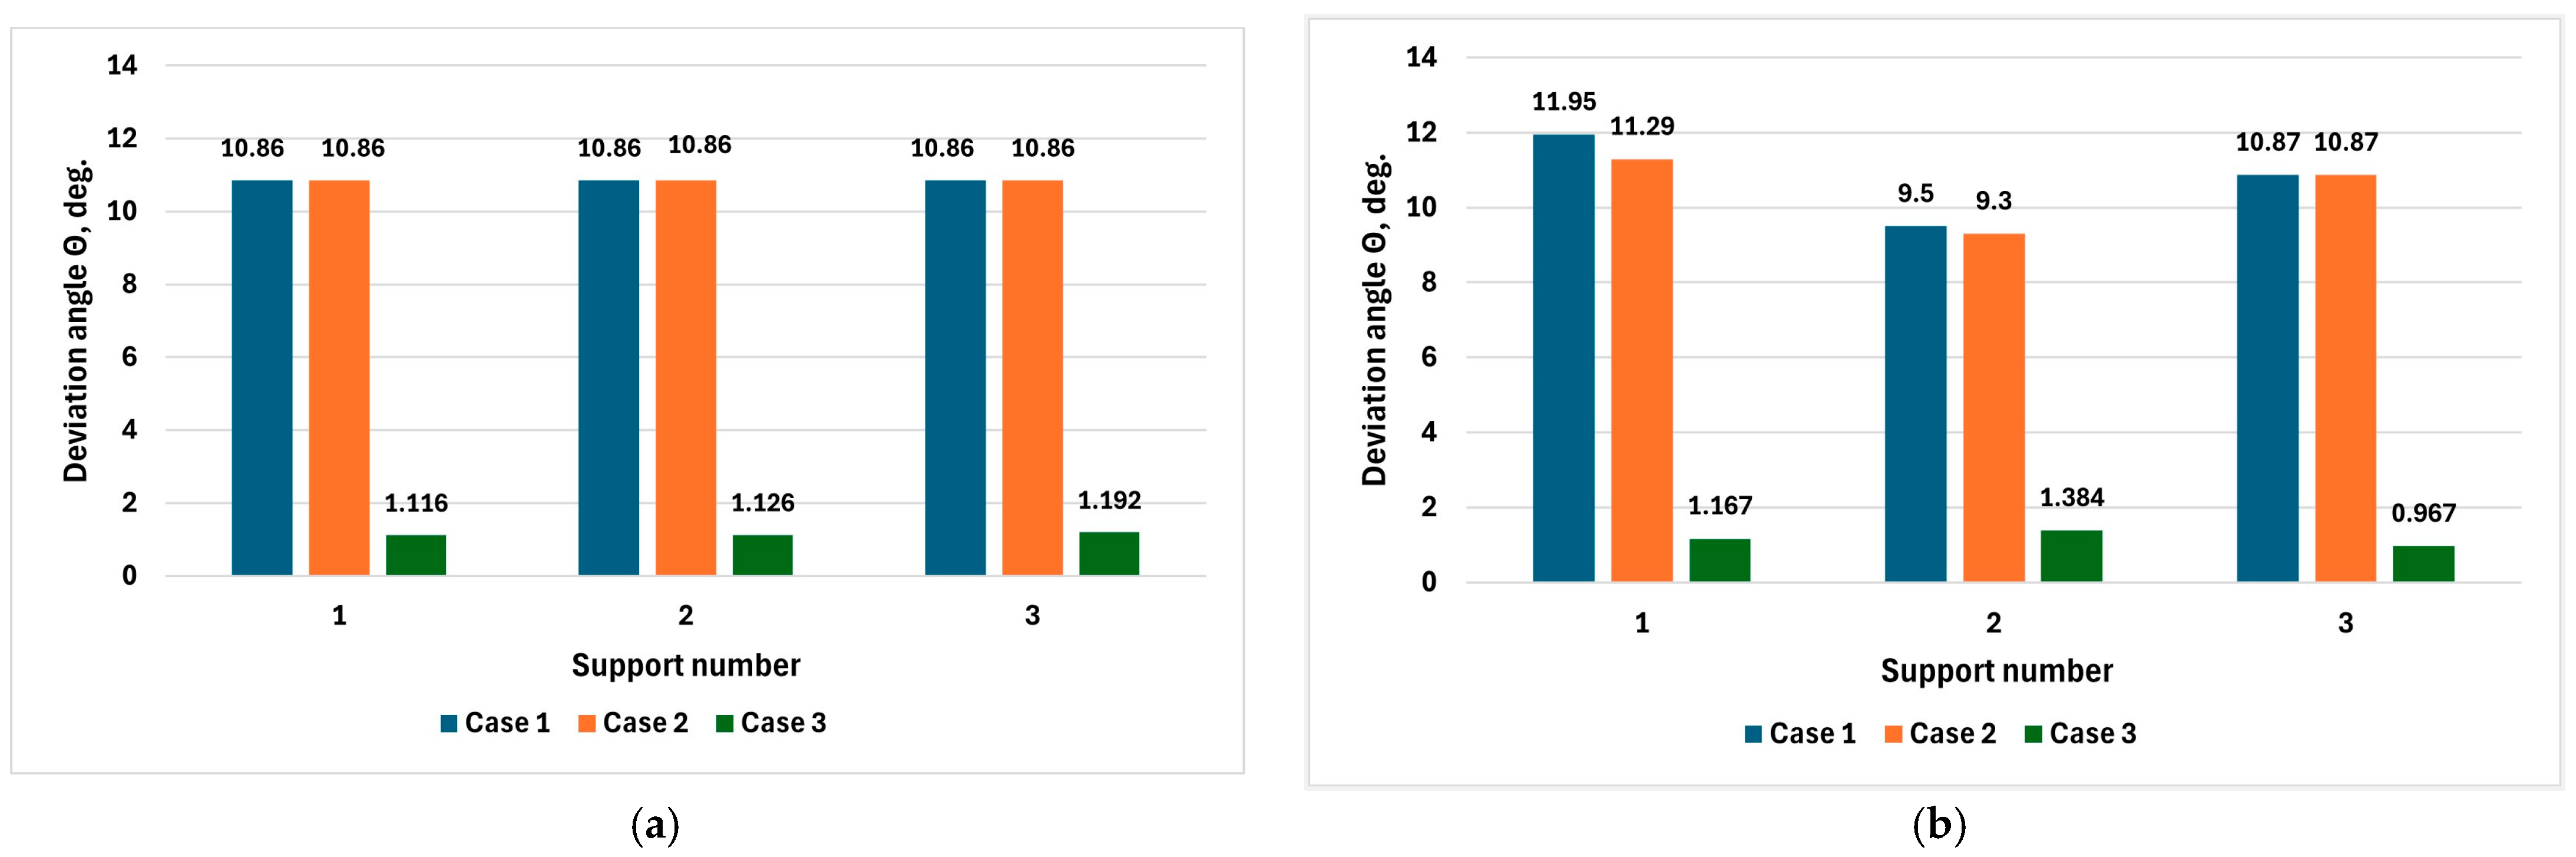
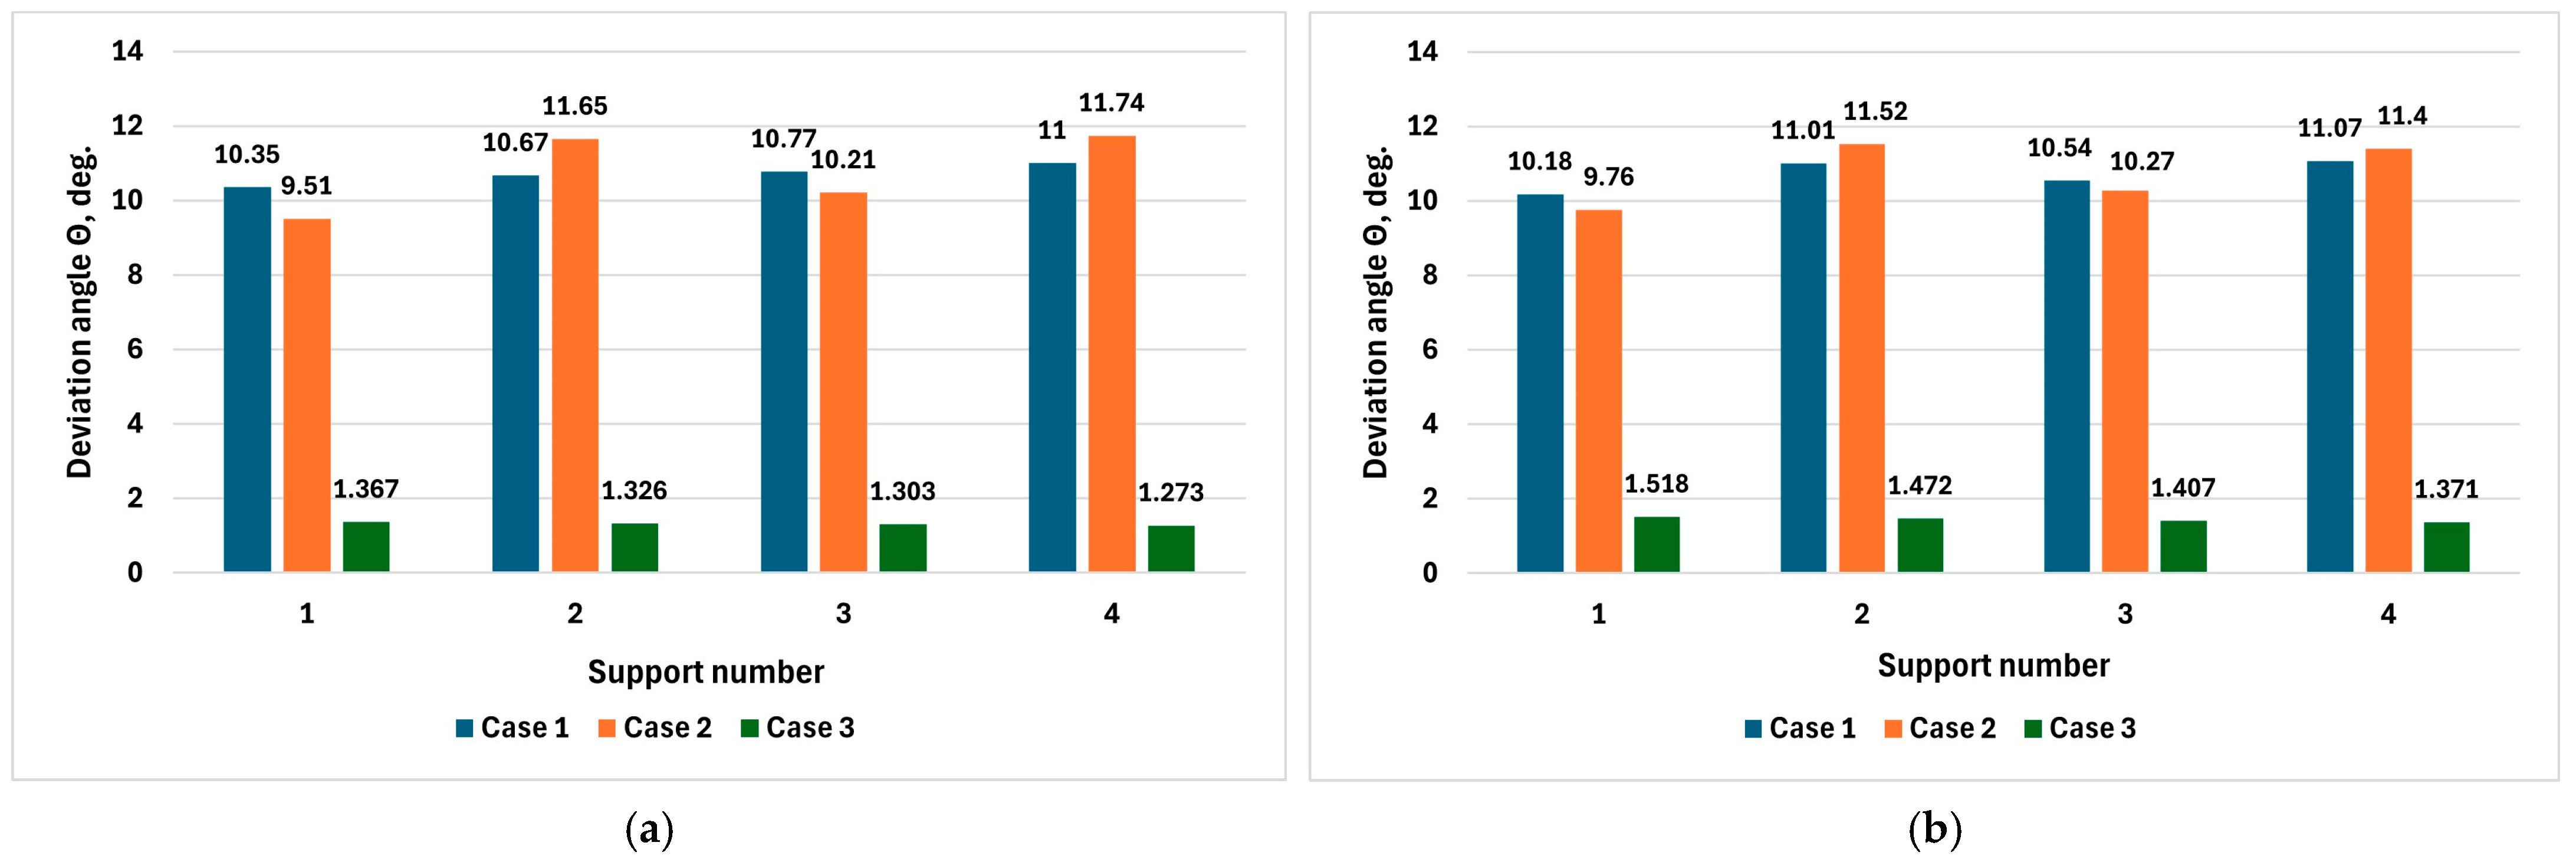
The evaluation of how the hopper’s complex spatial displacements and operational modes affect the tracking precision of the weight sensors is mathematically quantified through the deviation angle (Θ) of the resultant force vector relative to the principal vertical measurement axis of the load cell. The calculated angular values presented in Table 3 and Table 4 indicate that during the transient transport regimes characterized by the 1st and 2nd calculation cases, the deviation angles reach their maximum values, fluctuating between 9.30° and 11.95°.
This significant angular misalignment, which is comprehensively mapped for both the central hopper (Figure 13) and the side hopper (Figure 14), is directly attributed to the emergence of intensive horizontal inertial forces generated during the machine’s acceleration and braking cycles. Under these conditions, the longitudinal orientation of the sensors provides a more stable and uniform angular response across all supports compared to the perpendicular alternative. During the stationary 3rd calculation case, the absence of global inertial forces causes the deviation angle to drop sharply to a minimal range of 0.96° to 1.51°, indicating that the opening mechanism’s operational forces exert a negligible distorting impact on the directional accuracy of the sensor’s sensitive axis.

3.3. Finite Element Stress–Strain and Strength Analysis

To verify the structural integrity and reliability of the sensors under maximum reference loads, a comprehensive finite element analysis (FEA) of the stress–strain state of their mounting assembly was performed. It was established that the force acting on the sensor’s mounting assembly does not exceed 40,000 N for a four-support fixation of the outer hopper. At the same time, the maximum load value on the support with the greatest angle of deflection of the resultant force from the vertical (under the widest range of force deviations across the four supports) corresponds to the most unfavorable effect of the external load on the structural strength.
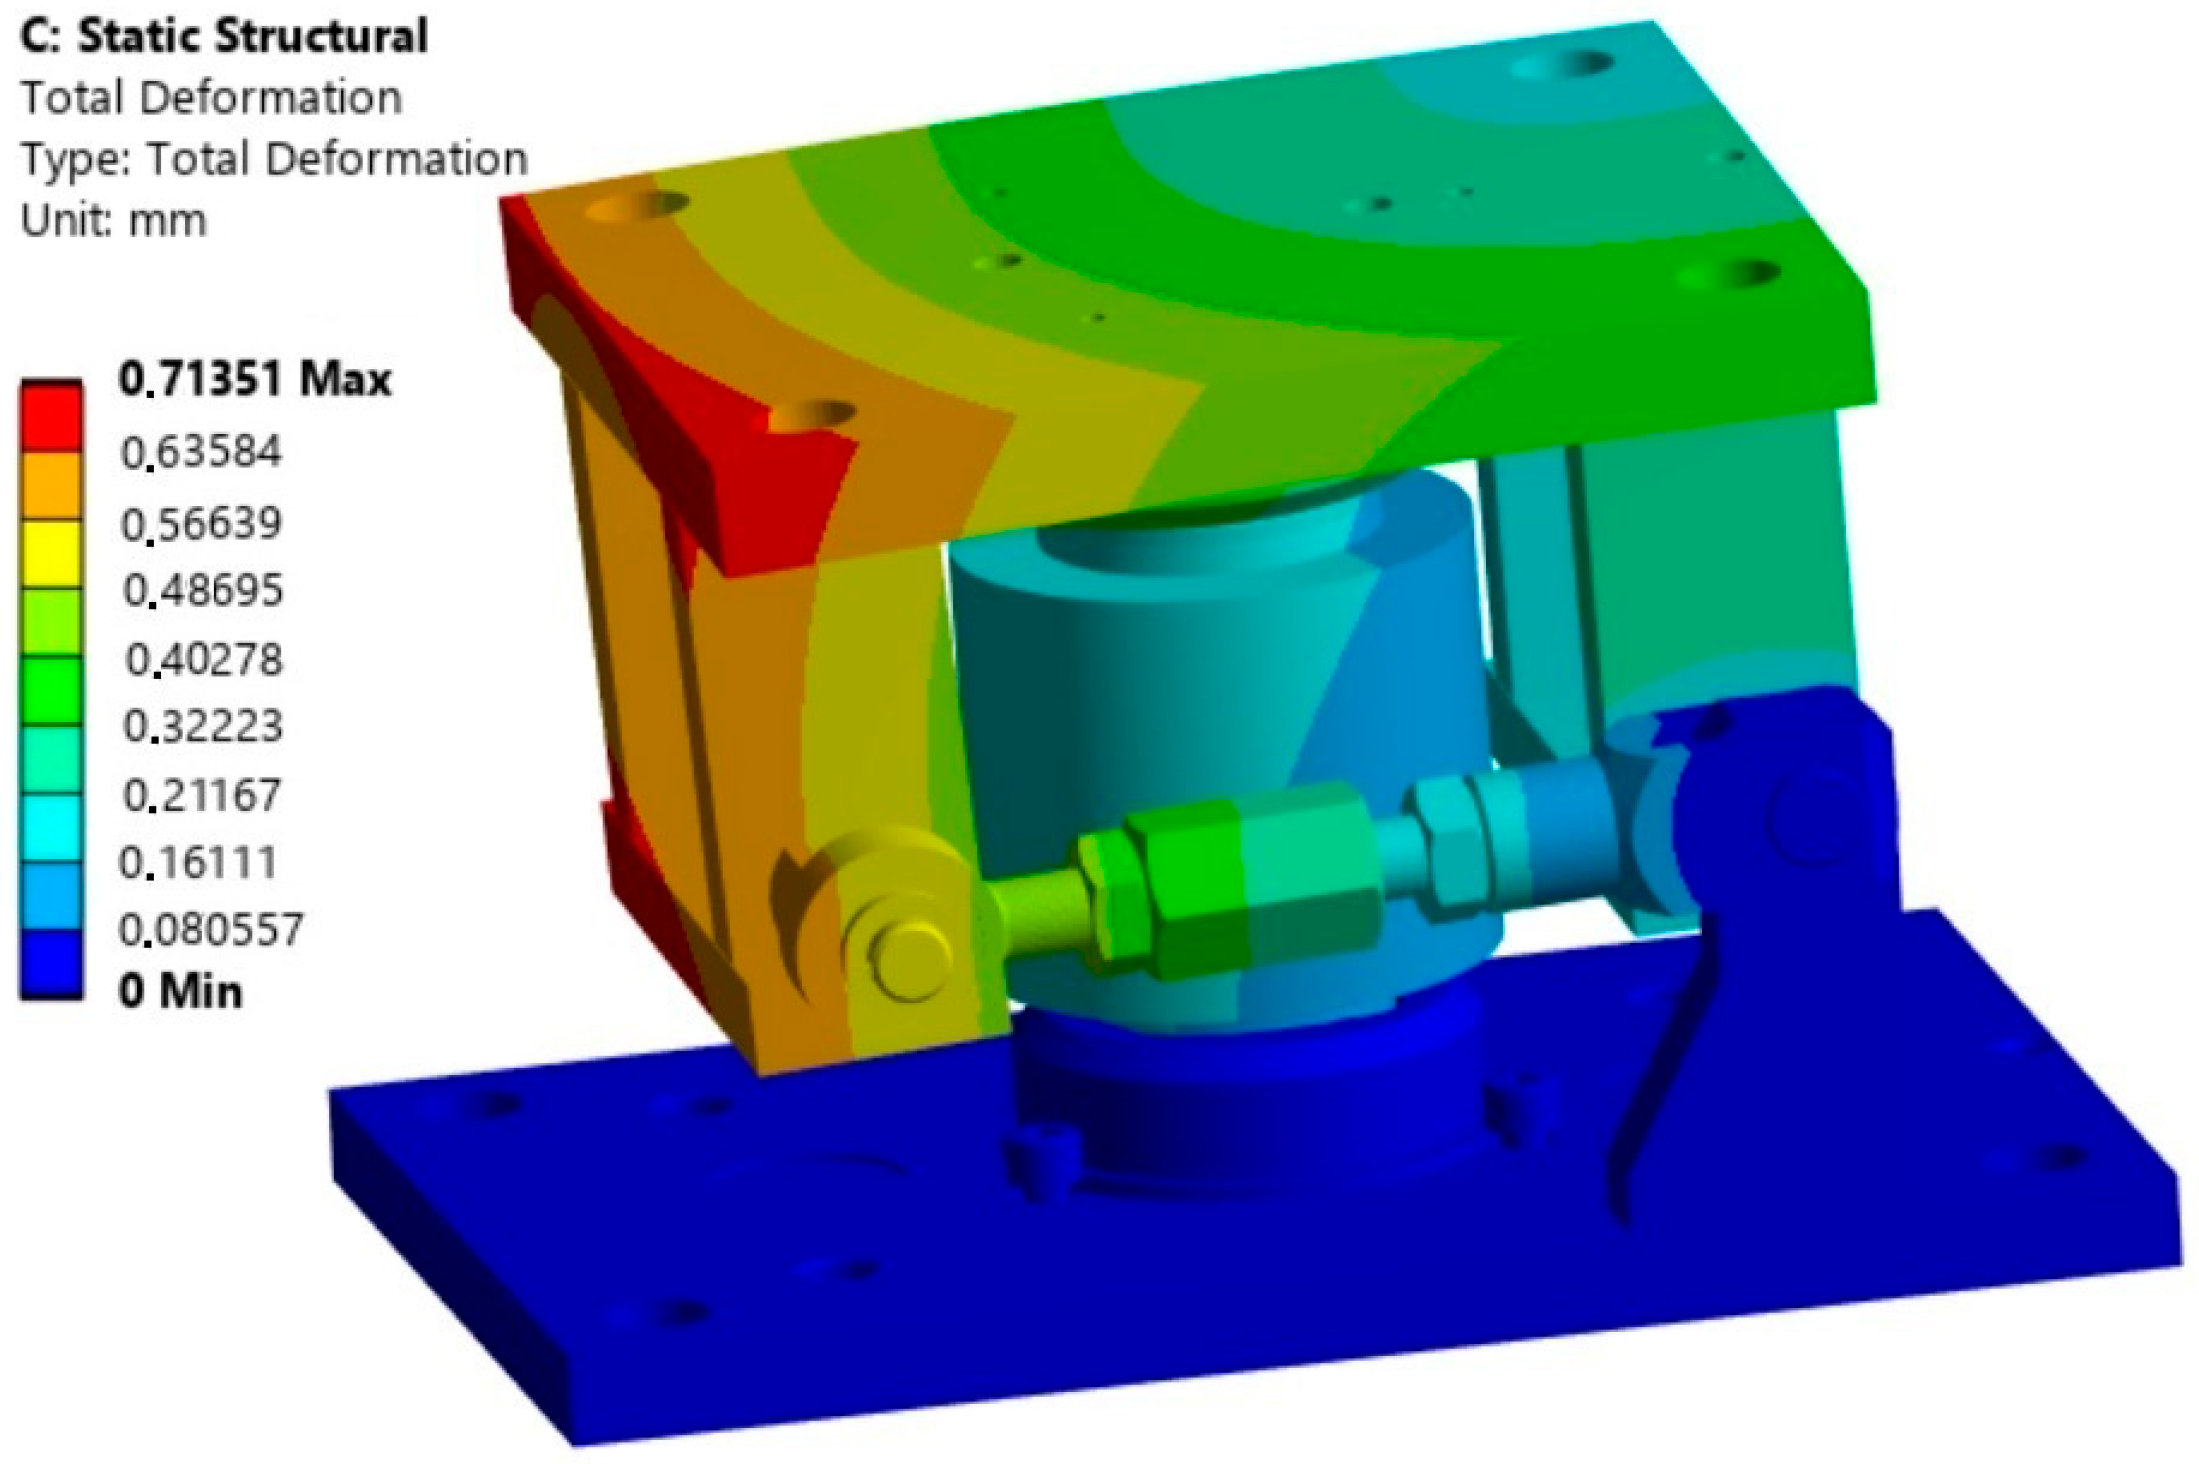
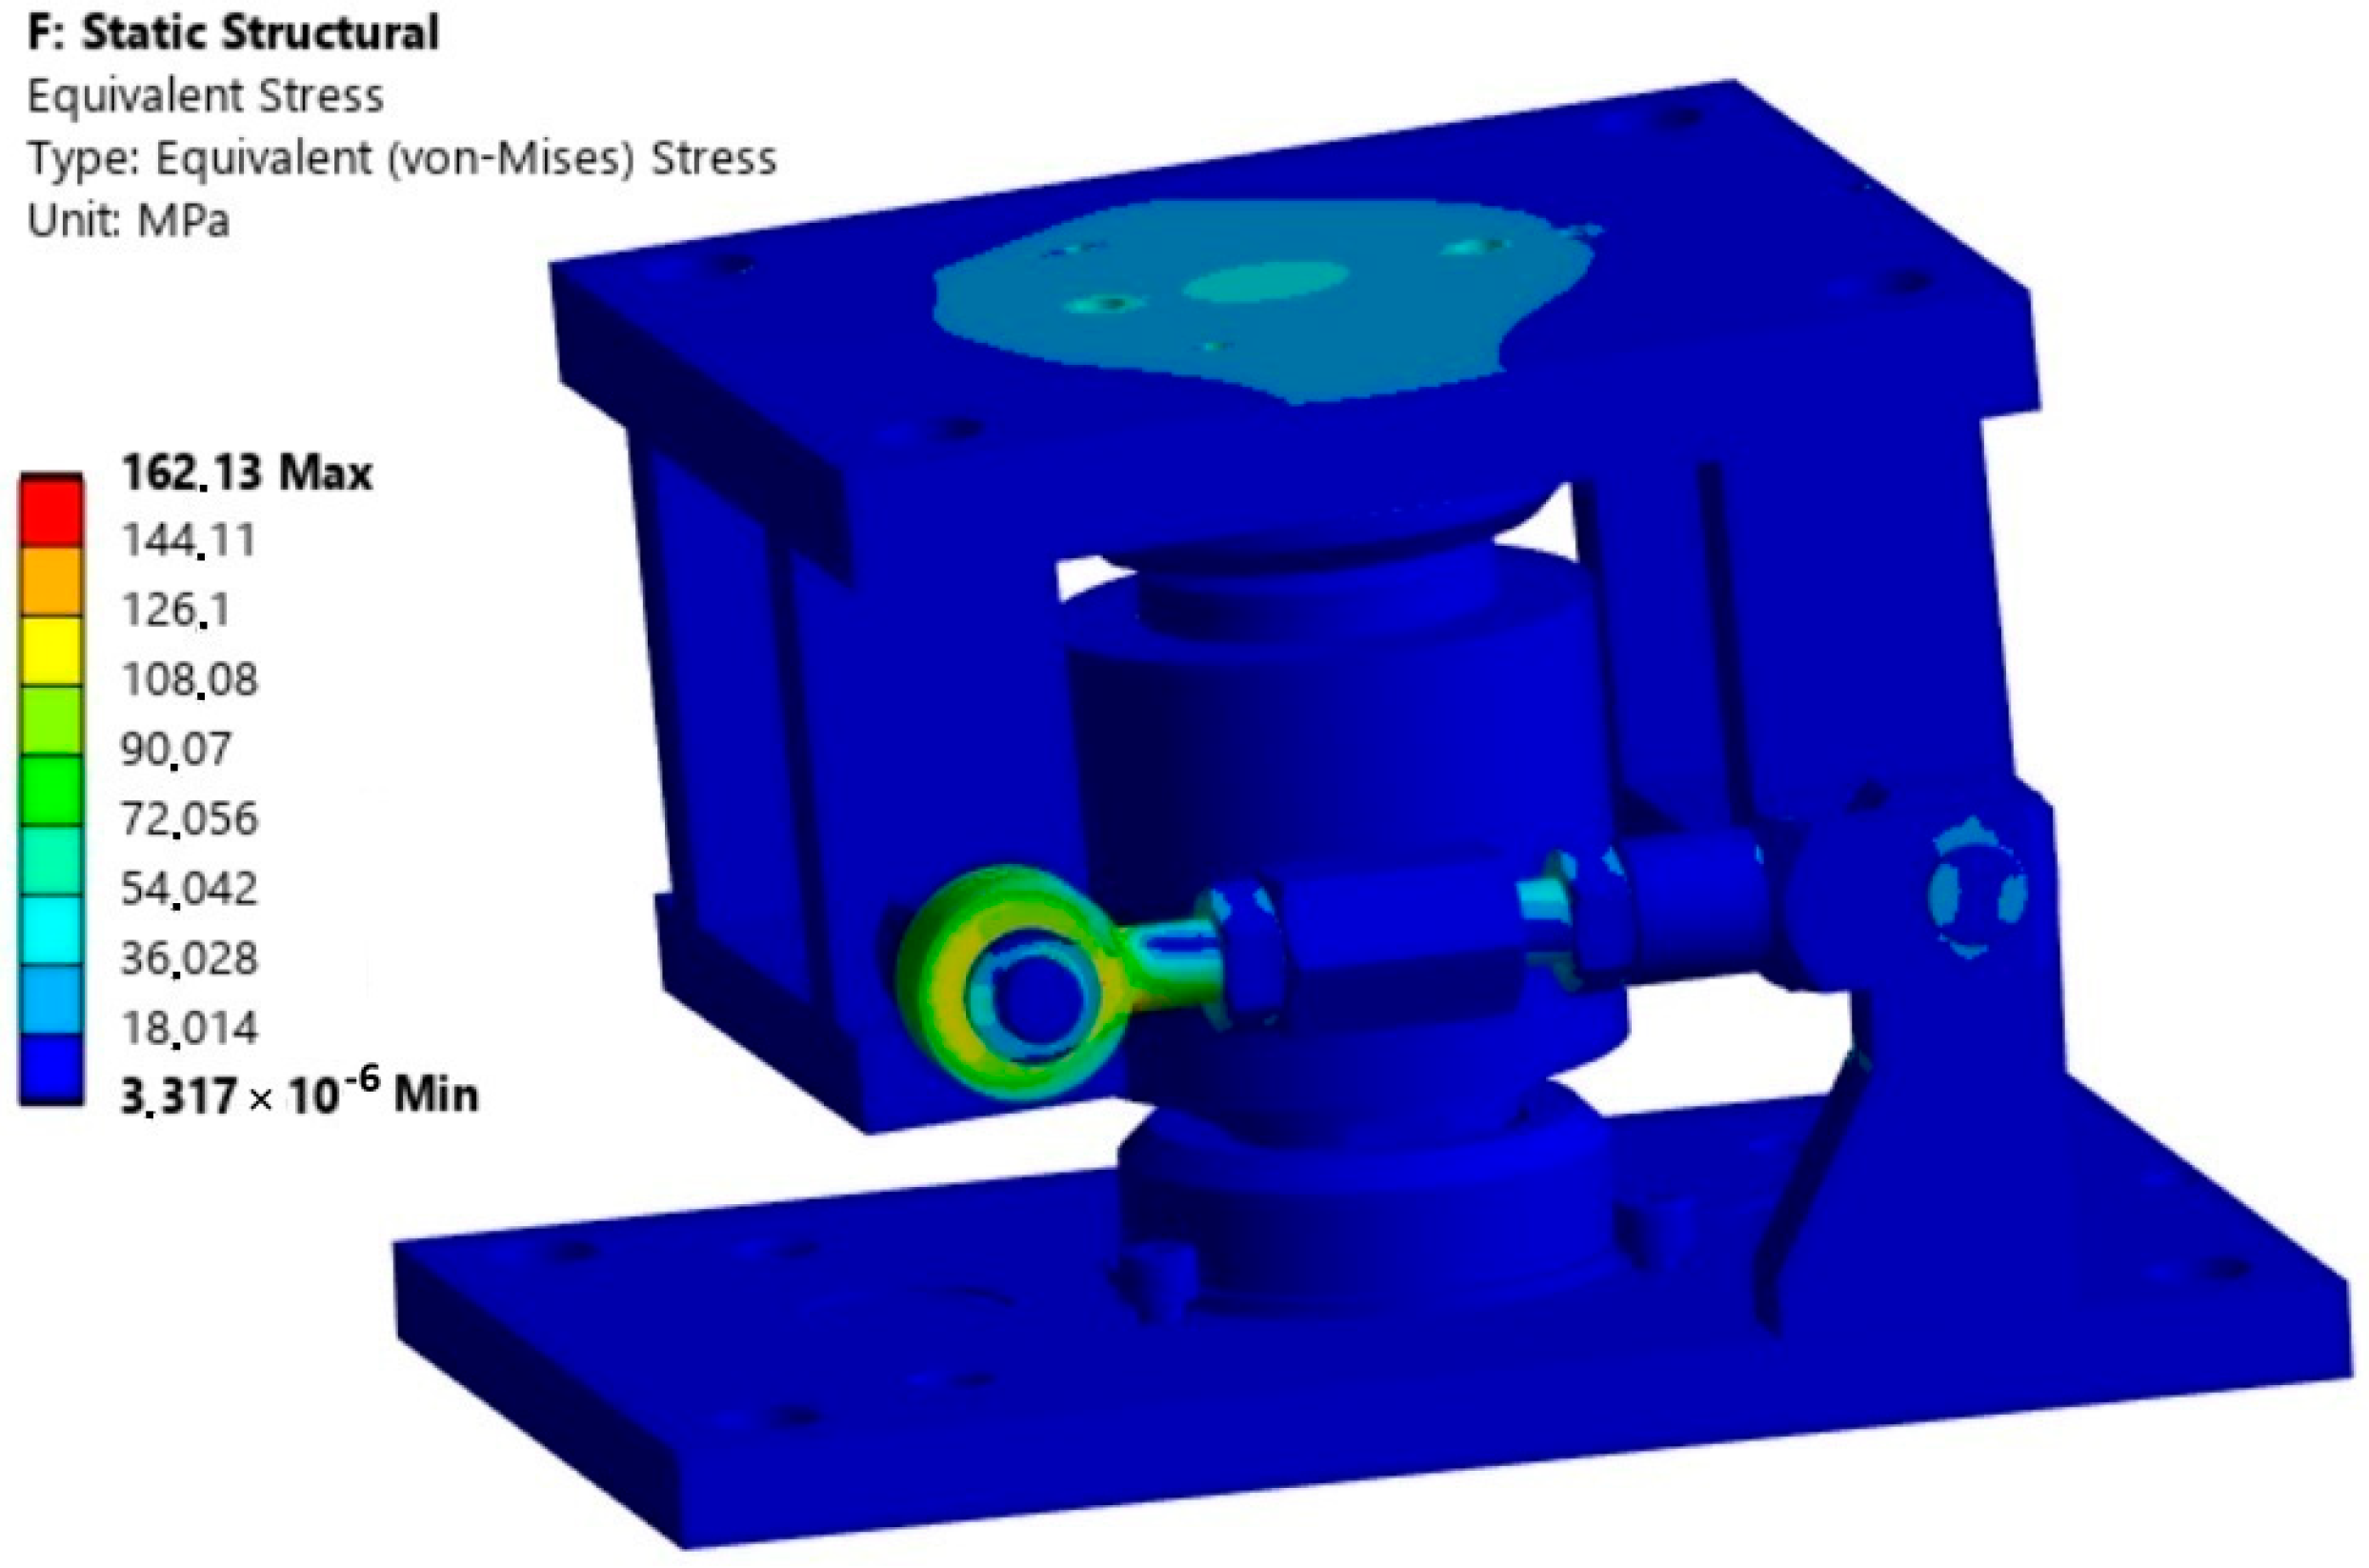
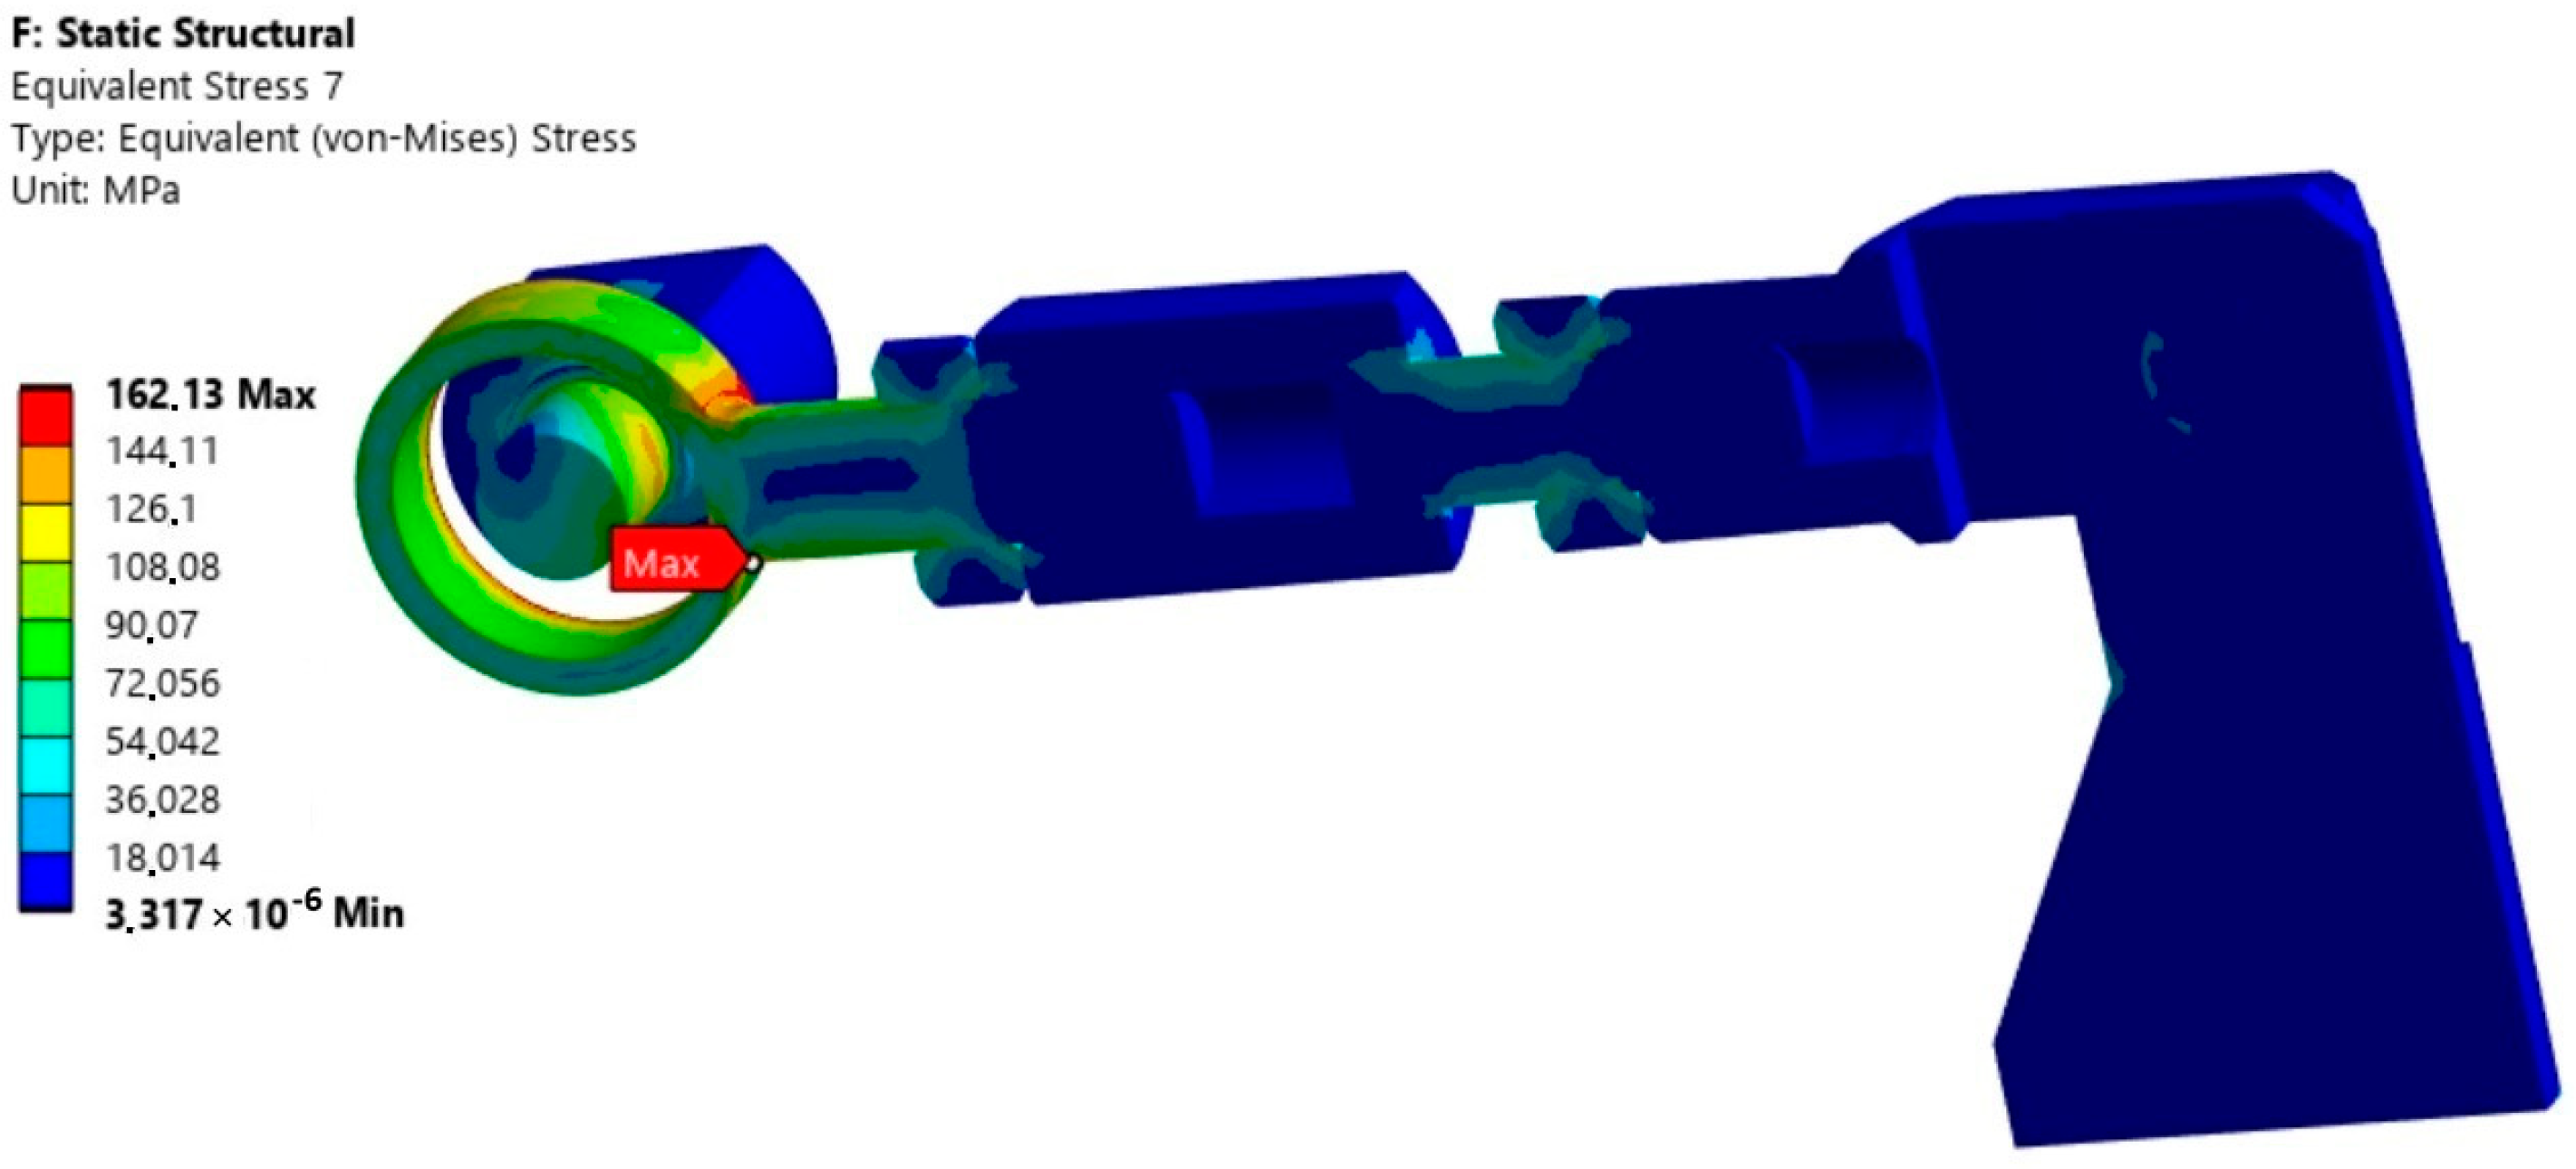
The numerical simulation results, presented in Figure 15, Figure 16 and Figure 17, provide a detailed visualization of the spatial distribution of von Mises equivalent stresses (σeq) and localized elastic strains across the structural elements of the mounting brackets and the lever mechanism. The study demonstrated that the assembly’s geometric configuration and the sensor’s measuring-axis orientation play a crucial role in eliminating dangerous stress concentration zones that could cause fatigue cracking under cyclic industrial operation.
The maximum von Mises equivalent stress reached 162 MPa and was recorded in the hinge zone of the sensor attachment mechanism. Since this value remains within the tensile yield strength of the material (215 MPa), the design ensures an adequate safety margin. Concurrently, the stress distribution analysis indicates that high load levels also occur in the contact zone between the sensor and the mounting structure, confirming that this area is vulnerable during operation.
Given that actual operational loads are less than 50% of the maximum design capacity of the sensor, the selected configuration guarantees the long-term durability of the assembly without the risk of mechanical failure.
It should be noted that the critical design criterion for this component is fatigue life. The fatigue life analysis was performed in accordance with EN 13445-3 (Clause 18) [21]. The safety factor evaluation was carried out for the following parameters: stress concentration factor of 1.42; amplitude stress of 85.2 MPa; mean stress of 28.4 MPa; coal dust environment; and a fatigue strength factor of 0.62. The endurance limit of the component, accounting for the environmental reduction factor, is 130.2 MPa, given a base fatigue limit of 210 MPa. The calculated Gerber fatigue safety factor is 1.52, which exceeds the minimum allowable standard range of 1.3–1.5. Thus, the assembly is expected to withstand the design base of 107 cycles without premature failure. However, under coke dust conditions, the endurance limit decreases to 105.0 MPa due to the environment-induced reduction factor, causing the fatigue safety factor to drop below the critical threshold to 1.23. In this scenario, it is advisable to increase the fillet radius from 5 mm to 8 mm to reduce the peak amplitude stress, and to technologically increase the hardness of the austenitic steel through fillet polishing followed by nitriding.

4. Discussion

The computational and analytical results highlight the distinct mechanical responses of the hopper support nodes under different loading conditions, demonstrating that the structural allocation and orientation of the weighing sensors are paramount to minimizing signal distortion. For the central (middle) hopper, a longitudinal orientation of the sensor’s measuring axis aligns effectively with the primary symmetric displacement field, minimizing cross-sensitivity errors. Conversely, the outer (lateral) hoppers are inherently prone to asymmetric stress states and structural twisting caused by transient operational factors, including acceleration, deceleration, and the asymmetrical actions of the gate opening mechanisms. For these outer units, positioning the sensor’s measuring axis perpendicular to the hopper shell profile acts as a critical mechanical filter. This specific geometric constraint isolates the sensor from parasitic transverse forces (Fr) and bending moments (Mr), thereby preserving the integrity of the useful weight signal under dynamic industrial conditions.
The high-fidelity finite element analysis (FEA) performed in Ansys provides a clear visualization of the spatial distribution of von Mises equivalent stresses (σeq) and localized elastic deformations across the mounting brackets and lever linkages. The numerical models reveal that the peak equivalent stress reaches 162 MPa, which is tightly localized within the hinge zone of the sensor attachment mechanism. This sharp localization underscores the role of the structural joints as primary stress concentrators. Concurrently, the contact zones between the elastic sensor body and the rigid mounting plates exhibit high levels of localized elastic strain. This structural behavior implies that while the bulk components remain structurally safe, the contact interfaces are vulnerable to micro-displacements and micro-wear during cyclic plant operations, necessitating strict torque specifications during assembly and the use of calibrated, hardened shims.
Under the continuous and harsh lifecycle of a metallurgical coking plant, the charging car framework is exposed to high-cycle mechanical vibrations from the raw blend gates, track misalignments, and cyclic thermal radiation from open coke oven tops. Such operational environments typically foster the initiation of fatigue cracking in heavy steelworks. The study demonstrates that modifying the geometric configuration of the node and enforcing the optimal sensor axis orientation fundamentally alters the local principal stress trajectories. By redirecting the severe force vectors away from structural welds and sharp geometric transitions, the proposed design successfully eliminates hazardous stress concentration zones. Consequently, the operational durability of the mounting assembly is structurally guaranteed, mitigating the risks of sudden mechanical failures and ensuring long-term batching stability.
Crucially, the maximum recorded equivalent stress of 162 MPa remains well below the material’s conservative tensile yield strength of 215 MPa. This structural compliance confirms an adequate factor of safety under peak design conditions. Furthermore, under typical plant operations, the actual operational loads are shown to be less than 50% of the maximum calculated load capacity, ensuring an enhanced safety margin. Unlike conventional sector-specific methodologies that oversimplify the analytical model by treating the massive hopper shells as entirely rigid, unyielding bodies, the integrated approach presented herein successfully accounts for the complex spatial elasticity interaction between the flexible hopper walls, frame supports, and the load cell. This methodology bridges the gap between empirical granular flow theories and heavy industrial vehicle mechanics.


5. Conclusions

This study successfully addressed the critical engineering task of modeling, evaluating, and optimizing the structural parameters of force-measuring sensor installation assemblies on a coke oven charging car. The main findings and practical outcomes are summarized as follows:
Finite element modeling (FEA) confirmed that the maximum force acting on a single mounting node does not exceed 40,000 N under the most unfavorable loading scenario of the four-support outer hopper fixation. The peak von Mises equivalent stress within the assembly is 162 MPa, localized at the hinge mechanism, which complies with the material’s yield strength of 215 MPa and proves that the design maintains a reliable structural safety margin.
It is shown that the spatial orientation of the sensor’s sensitive axis plays a decisive role in eliminating measurement errors. Implementing a longitudinal orientation for the central hopper and a perpendicular orientation relative to the hopper shell profile for the outer hoppers isolates the measuring elements from destructive parasitic bending moments and lateral forces, ensuring the operational precision of the real-time automated batching system.
To overcome the static indeterminacy of the current four-point fixation and eliminate the severe non-uniformity of load distribution among the brackets, it is highly recommended to transition the outer hopper support structures to a rational three-point support scheme during future machinery modernizations. This structural adjustment will completely isolate the weighing system from spatial twisting and elastic misalignments of the charging car frame.

Author Contributions

Conceptualization: V.L., K.B. and P.K.; methodology: V.L., K.B. and P.K.; software: V.L. and S.V.; validation: V.L., K.B., P.K., S.V., O.K. and Y.S.; formal analysis: V.L., K.B. and P.K.; investigation: V.L., K.B., P.K., S.V. and O.K.; resources: Y.S., V.L. and K.B.; data curation: K.B., V.L. and O.K.; writing—original draft preparation: V.L. and K.B.; writing—review and editing: P.K. and K.B.; visualization: V.L., K.B. and S.V.; supervision: P.K. and Y.S.; project administration: K.B. and V.L. All authors have read and agreed to the published version of the manuscript.

Funding

This research received no external funding.

Data Availability Statement

The data presented in this study are available within the article.

Conflicts of Interest

The authors declare that they have no known competing financial interests or personal relationships that could have appeared to influence the work reported in this paper.

References

  1. Ahmed, H. New Trends in the Application of Carbon-Bearing Materials in Blast Furnace Iron-Making. Minerals 2018, 8, 561. [Google Scholar] [CrossRef]
  2. Zhou, D.; Cheng, S.; Wang, Y.; Jiang, X. Production and Development of Large Blast Furnaces from 2011 to 2014 in China. ISIJ Int. 2015, 55, 2519. [Google Scholar] [CrossRef]
  3. Li, K.; Khanna, R.; Zhang, J.; Liu, Z.; Sahajwalla, V.; Yang, T.; Deven, K. The evolution of structural order, microstructure and mineral matter of metallurgical coke in a blast furnace: A review. Fuel 2014, 133, 194–215. [Google Scholar] [CrossRef]
  4. Kosyrczyk, L.; Stelmach, S.; Gaska, K.; Generowicz, A.; Iwaszczuk, N.; Kardaś, D. Optimization of Thermal Parameters of the Coke Oven Battery by Modified Methodology of Temperature Measurement in Heating Flues as the Management Tool in the Cokemaking Industry. Energies 2021, 14, 904. [Google Scholar] [CrossRef]
  5. Konno, Y.; Murkami, F.; Watanabe, I.; Sakaida, M.; Nakagawa, Y.; Matsunaga, M. Development of coke oven Machine Automation Technology. Nippon Steel Oita Jpn. Tech. Rep. 1996, 69, 53–59. [Google Scholar]
  6. Khudyakov, A.Y.; Vaschenko, S.V.; Baiul, K.V.; Semenov, Y.S. Experimental Verification of New Compaction Equations for Fine Materials of the Mining and Metallurgical Complex. Part 1. Basic Compaction Equation. Refract. Ind. Ceram. 2021, 62, 20–29. [Google Scholar] [CrossRef]
  7. Karst, J.-L.; Petit, E.; Gaillet, J.-P. Optimization of coke oven charging by use of a mathematical model. Metall. Res. Technol. 2004, 101, 447–452. [Google Scholar] [CrossRef]
  8. Sciazko, M.; Mertas, B.; Kosyrczyk, L.; Sobolewski, A. A Predictive Model for Coal Coking Based on Product Yield and Energy Balance. Energies 2020, 13, 4953. [Google Scholar] [CrossRef]
  9. Rudyka, V.I.; Kravchenko, S.A.; Solovjov, M.A.; Malyna, V.P. Innovations in World Cokemaking Technologies: A Report on the ESTAD 2019 Steel Conference. Coke Chem. 2020, 63, 283–293. [Google Scholar] [CrossRef]
  10. Zhang, Z.; Zhang, S. A New Coking Coal Charging Method for 6 m Top-Charged Coke Oven: System Design and Experiment. Appl. Sci. 2021, 11, 33. [Google Scholar]
  11. Bartoszek, S.; Stankiewicz, K.; Kost, G.; Ćwikła, G.; Dyczko, A. Research on Ultrasonic Transducers to Accurately Determine Distances in a Coal Mine Conditions. Energies 2021, 14, 2532. [Google Scholar] [CrossRef]
  12. Pal, A.; Kalyan, U.P.; Harika, C.; Vasuki, B. Capacitive Sensor for Level Measurement in Hopper/Silos—Experimental Evaluation. In Proceedings of the 2nd International Conference on Intelligent Computing, Instrumentation and Control Technologies (ICICICT), Kannur, India, 5–6 July 2019; Volume 1, pp. 202–205. [Google Scholar]
  13. Joundale, S.B.; Sutar, D.; Sadanandan, S. Development of battery machine automation using optimised auto schedule for coke ovens. In Proceedings of the International Conference on Computing Methodologies and Communication (ICCMC), Erode, India, 18–19 July 2017; pp. 194–199. [Google Scholar]
  14. Myamlin, S.; Lunys, O.; Neduzha, L.; Kyryl’chuk, O. Mathematical modeling of dynamic loading of cassette bearings for freight cars. In Proceedings of the 21st International Scientific Conference Transport Means, Juodkrante, Lithuania, 20–22 September 2017; pp. 973–976. [Google Scholar]
  15. Bai, J.; Yang, C.; Zhao, Z.; Zhong, X.; Zhang, Y.; Xu, Y.; Xi, B.; Liu, H. Effect of bulk density of coking coal on swelling pressure. J. Environ. Sci. 2013, 25, 205. [Google Scholar] [CrossRef]
  16. Rejdak, M.; Wasielewski, R. Mechanical compaction of coking coals for carbonization in stamp-charging coke ovens. Physicochem. Probl. Miner. Process. 2015, 51, 151. [Google Scholar]
  17. Kalivoda, J.; Neduzha, L. Running Dynamics of Rail Vehicles. Energies 2022, 15, 5843. [Google Scholar] [CrossRef]
  18. Yang, Y.; Liu, C.; Chen, L.; Zhang, X. Phase deviation of semi-active suspension control and its compensation with inertial suspension. Acta Mech. Sin. 2024, 40, 523367. [Google Scholar] [CrossRef]
  19. Stosiak, M.; Lubecki, M.; Karpenko, M. Numerical and Experimental Analysis of Composite Hydraulic Cylinder Components. Actuators 2026, 15, 61. [Google Scholar] [CrossRef]
  20. Lubecki, M.; Stosiak, M.; Karpenko, M.; Urbanowicz, K.; Deptuła, A.; Cieślicki, R. Design and FEM Analysis of Plastic Parts of a Tie-Rod Composite Hydraulic Cylinder. Mechanika 2023, 29, 358–362. [Google Scholar] [CrossRef]
  21. CEN/TC 54; EN 13445-3:2014/prA3:2015; “Clause 18: Detailed Assessment of Fatigue Life” “Annex NB: Cycle Counting and Determination of Equivalent Stress Range” “Annex NC: Fatigue Assessment of Partial Penetration Welds” “Annex ND: Table of Stress Concentration Factors Kt”. European Committee for Standardization: Brussels, Belgium, 2015.
Figure 1. A general view of the coal-charging car.
Machines 14 00757 g001
Figure 2. Schematic of the location of weight sensors on the charging machine and options for the orientation of sensor installation nodes; CoG—center of gravity.
Machines 14 00757 g002
Figure 3. Kinematic scheme of the hopper gate opening mechanism.
Machines 14 00757 g003
Figure 4. Scheme of options for installing supports for the central hopper: variant 1—node positioning perpendicular to the hopper shell profile; variant 2—node positioning along the charging car’s line of motion.
Machines 14 00757 g004
Figure 5. Scheme of options for installing supports for both side hoppers: variant 1—node positioning perpendicular to the hopper shell profile; variant 2—node positioning along the charging car’s line of motion.
Machines 14 00757 g005
Figure 6. Finite element mesh generation for the developed model for determining forces and moments: (a) The central hopper: 751,435 nodes, 341,177 elements; average Element Quality: 0.85015; SOLID186 finite element type used; (b) The side hopper: 544,148 nodes, 139,256 elements; average Element Quality: 0.83511; SOLID186 finite element type used.
Machines 14 00757 g006
Figure 7. Loads acting on the central hopper supports for the 1st calculation case variant 2.
Machines 14 00757 g007
Figure 8. Loads acting on the side hopper supports for the 1st calculation case variant 2.
Machines 14 00757 g008
Figure 9. Distribution of the resultant support forces (Fr) across the central hopper supports for the analyzed calculation cases: (a) The sensor’s location is along the movement of the charging car; (b) The sensor’s location is perpendicular to the hopper shell profile.
Machines 14 00757 g009
Figure 10. Resultant moment (Mr) values at the central hopper support nodes for the investigated calculation cases: (a) The sensor’s location is along the movement of the charging car; (b) The sensor’s location is perpendicular to the hopper shell profile.
Machines 14 00757 g010
Figure 11. Distribution of the resultant support forces (Fr) across the side hopper supports for the analyzed calculation cases: (a) The sensor’s location is along the movement of the charging car; (b) Node positioning perpendicular to the hopper shell profile.
Machines 14 00757 g011
Figure 12. Resultant moment (Mr) values at the side hopper support nodes for the investigated calculation cases: (a) The sensor’s location is along the movement of the charging car; (b) Node positioning perpendicular to the hopper shell profile.
Machines 14 00757 g012
Figure 13. Deviation angle (Θ1) of the resultant force vector relative to the sensor measurement axis for the central hopper: (a) The sensor’s location is along the movement of the charging car; (b) The sensor’s location is perpendicular to the hopper shell profile.
Machines 14 00757 g013
Figure 14. Deviation angle (Θ1) of the resultant force vector relative to the sensor measurement axis for the side hopper: (a) The sensor’s location is along the movement of the charging car; (b) The sensor’s location is perpendicular to the hopper shell profile.
Machines 14 00757 g014
Figure 15. Distribution of deformations in the sensor installation node.
Machines 14 00757 g015
Figure 16. Distribution of equivalent Mises stresses in the sensor installation node.
Machines 14 00757 g016
Figure 17. Distribution of equivalent von Mises stress in the lever mechanism of the sensor installation unit.
Machines 14 00757 g017
Table 1. Loads acting on the central hopper supports.
Calculation Case and the Orientation of Sensor Installation NodesResultant Support Loads
Support 1Support 2Support 3
The sensor’s location is along the movement of the charging car
1—calculation caseFr.1 = 30,592.00 N
Mr.1 = 3.79 × 10⁶ N⋅mm
Fr.2 = 30,676.00 N
Mr.2 = 7.40 × 10⁶ N⋅mm
Fr.3 = 30,676.00 N
Mr.3 = 5.50 × 10⁶ N⋅mm
2—calculation caseFr.1 = 30,592.00 N
Mr.1 = 3.79 × 10⁶ N⋅mm
Fr.2 = 30,676.00 N
Mr.2 = 5.49 × 10⁶ N⋅mm
Fr.3 = 30,676 N
Mr.3 = 7.41 × 10⁶ N⋅mm
3—calculation caseFr.1 = 28,040.00 N
Mr.1 = 3.317 × 10⁶ N⋅mm
Fr.2 = 28,795.00 N
Mr.2 = 5.957 × 10⁶ N⋅mm
Fr.3 = 27,208 N
Mr.3 = 5.920 × 10⁶ N⋅mm
The sensor’s location is perpendicular to the hopper shell profile
1—calculation caseFr.1 = 29,386.00 N
Mr.1 = 3.25 × 10⁶ N⋅mm
Fr.2 = 27,646.00 N
Mr.2 = 4.08 × 10⁶ N⋅mm
Fr.3 = 34,673.00 N
Mr.3 = 1.76 × 10⁶ N⋅mm
2—calculation caseFr.1 = 29,386.0 N
Mr.1 = 2.95 × 10⁶ N⋅mm
Fr.2 = 26,897.0 N
Mr.2 = 1.30 × 10⁶ N⋅mm
Fr.3 = 35,428.0 N
Mr.3 = 4.39 × 10⁶ N⋅mm
3—calculation caseFr.1 = 26,843.0 N
Mr.1 = 2.452 × 10⁶ N⋅mm
Fr.2 = 23,418.0 N
Mr.2 = 2.143 × 10⁶ N⋅mm
Fr.3 = 33,539.0 N
Mr.3 = 2.899 × 10⁶ N⋅mm
Table 2. Loads acting on the side hopper supports.
Calculation Case and the Orientation of Sensor Installation NodesResultant Support Loads
Support 1Support 2Support 3Support 4
The sensor’s location is along the movement of the charging car
1—calculation caseFr.1 = 32,100.00 N
Mr.1 = 5.79 × 10⁶ N⋅mm
Fr.2 = 31,431.00 N
Mr.2 = 5.76 × 10⁶ N⋅mm
Fr.3 = 36,682.00 N Mr.3 = 7.39 × 10⁶ N⋅mmFr.4 = 35,585.00 N
Mr.4 = 4.71 × 10⁶ N⋅mm
2—calculation caseFr.1 = 33,971.00 N
Mr.1 = 6.35 × 10⁶ N⋅mm
Fr.2 = 29,574.00 N
Mr.2 = 5.42 × 10⁶ N⋅mm
Fr.3 = 39,738.00 N
Mr.3 = 5.07 × 10⁶ N⋅mm
Fr.4 = 32,532.00 N
Mr.4 = 7.08 × 10⁶ N⋅mm
3—calculation caseFr.1 = 29,081.00 N
Mr.1 = 4.729 × 10⁶ N⋅mm
Fr.2 = 26,845.00 N
Mr.2 = 4.327 × 10⁶ N⋅mm
Fr.3 = 37,521.00 N
Mr.3 = 2.051 × 10⁶ N⋅mm
Fr.4 = 33,545.00 N
Mr.4 = 2.058 × 10⁶ N⋅mm
The sensor’s location is perpendicular to the hopper shell profile
1—calculation caseFr.1 = 32,656.00 N
Mr.1 = 5.55 × 10⁶ N⋅mm
Fr.2 = 31,095.00 N
Mr.2 = 5.42 × 10⁶ N⋅mm
Fr.3 = 37,205.00 N
Mr.3 = 4.04 × 10⁶ N⋅mm
Fr.4 = 34,425.0 N
Mr.4 = 0.86 × 10⁶ N⋅mm
2—calculation caseFr.1 = 33,525.00 N
Mr.1 = 5.93 × 10⁶ N⋅mm
Fr.2 = 30,230.00 N
Mr.2 = 5.23 × 10⁶ N⋅mm
Fr.3 = 38,749.00 N
Mr.3 = 1.00 × 10⁶ N⋅mm
Fr.4 = 32,885.00 N
Mr.4 = 4.06 × 10⁶ N⋅mm
3—calculation caseFr.1 = 29,111.00 N
Mr.1 = 5.272 × 10⁶ N⋅mm
Fr.2 = 26,778.00 N
Mr.2 = 4.814 × 10⁶ N⋅mm
Fr.3 = 37,666.00 N
Mr.3 = 6.128 × 10⁶ N⋅mm
Fr.4 = 33,848.00 N
Mr.4 = 5.834 × 10⁶ N⋅mm
Table 3. The value of the resultant force deviation angle relative to the measurement axis of the sensor on the central hopper support.
Calculation Case and the Orientation of Sensor Installation NodesThe Value of the Resultant Force Deviation Angle Relative to the Sensor Measurement Axis
Support 1Support 2Support 3
The sensor’s location is along the movement of the charging car
1—calculation caseΘ1 = 10.860°Θ2 = 10.860°Θ3 = 10.86°
2—calculation caseΘ1 = 10.860°Θ2 = 10.860°Θ3 = 10.86°
3—calculation caseΘ1 = 1.116°Θ2 = 1.126°Θ3 = 1.192°
The sensor’s location is perpendicular to the hopper shell profile
1—calculation caseΘ1 = 11.950°Θ2 = 9.500°Θ3 = 10.87°
2—calculation caseΘ1 = 11.290°Θ2 = 9.300°Θ3 = 10.87°
3—calculation caseΘ1 = 1.167°Θ2 = 1.384°Θ3 = 0.967°
Table 4. The value of the resultant force deviation angle relative to the measurement axis of the sensor on the side hopper support.
Calculation Case and the Orientation of Sensor Installation NodesThe Value of the Resultant Force Deviation Angle Relative to the Sensor Measurement Axis
Support 1Support 2Support 3Support 4
The sensor’s location is along the movement of the charging car
1—calculation caseΘ1 = 10.35°Θ2 = 10.67°Θ3 = 10.77°Θ4 = 11.00°
2—calculation caseΘ1 = 9.51°Θ2 = 11.65°Θ3 = 10.21°Θ4 = 11.74°
3—calculation caseΘ1 = 1.37°Θ2 = 1.33°Θ3 = 1.30°Θ4 = 1.27°
The sensor’s location is perpendicular to the hopper shell profile
1—calculation caseΘ1 = 10.18°Θ2 = 11.01°Θ3 = 10.54°Θ4 = 11.07°
2—calculation caseΘ1 = 9.76°Θ2 = 11.52°Θ3 = 10.27°Θ4 = 11.40°
3—calculation caseΘ1 = 1.52°Θ2 = 1.47°Θ3 = 1.40°Θ4 = 1.37°
Disclaimer/Publisher’s Note: The statements, opinions and data contained in all publications are solely those of the individual author(s) and contributor(s) and not of MDPI and/or the editor(s). MDPI and/or the editor(s) disclaim responsibility for any injury to people or property resulting from any ideas, methods, instructions or products referred to in the content.