1. Introduction
Steel bars are widely used in manufacturing and construction industries. In their production, the Tempcore process plays a critical role by rapidly quenching the bar’s outer surface as it exits the final rolling mill, forming a martensitic layer followed by a self-tempering stage [
1,
2,
3]. However, conventional Tempcore coolers often fail to meet the quenching requirements for large steel bars. Incorporating corrugated tubes into the Tempcore cooling system can markedly improve cooling efficiency without necessitating modifications to the water supply infrastructure [
4,
5,
6]. The strength and ductility of steel bars primarily originate from the martensitic microstructure formed on the surface during quenching. Therefore, designing corrugated tube structures to improve cooling efficiency is particularly important in the steel bar production process.
The structure of the corrugated tubes significantly affects the internal flow dynamics and heat transfer performance of the Tempcore cooling system. Wu et al. [
7] performed numerical simulations study to analyze the flow and heat transfer characteristics of sinusoidal corrugated walls within internal cooling channels. At high Reynolds numbers, the sinusoidal corrugation improved heat transfer efficiency, reduced flow resistance, and yielded a more uniform temperature distribution. Balakin et al. [
8] proposed a generalized model to predict the heat transfer coefficient during the onset of nucleate boiling. By accounting for surface roughness effects, the study theoretically derived an expression for the heat transfer coefficient. Hassanzadeh et al. [
9] reported that a parallel corrugated-channel heat exchanger attained optimal heat transfer performance at a 40° inclination angle. This conclusion was based on a comprehensive parametric study across different Reynolds numbers. Hærvig et al. [
10] studied the influence of flow fields on heat transfer in 28 geometrically distinct sinusoidal and helical corrugated tubes. The study concluded that excessive corrugation height caused performance degradation and presented dimensionless correlations for heat transfer, pressure drop, and overall thermal performance. Wang et al. [
11] performed a numerical analysis of heat transfer and pressure drop characteristics in helical corrugated tubes across a Reynolds number range of 10,020–40,060. A multi-objective optimization approach was used to determine the optimal geometric parameters that balance heat transfer enhancement with flow resistance. Han et al. [
12] conducted a numerical investigation of asymmetric corrugated channels, comparing the average and local surface performance parameters of symmetric and asymmetric configurations across a range of Reynolds numbers. Positioning the large valley radius of the corrugation on the inlet side resulted in a 12.7% improvement in the overall performance evaluation criterion (PEC). Wu et al. [
13] investigated the mechanical and heat transfer characteristics of conical corrugated tubes formed by cold rolling smooth tubes. The study showed that these tubes develop stress under axial tensile loads and have heat transfer coefficients 15%, 17%, and 115% higher than those of helical grooved, converging–diverging, and smooth tubes, respectively. Azam et al. [
14] used an inverse method based on infrared thermography data to determine local convective heat transfer coefficients in turbulent flow within tubes with six corrugated surface profiles. The single helical design was the most effective, while hybrid designs exhibited intersecting helical contours. Cruz et al. [
15] numerically investigated the effects of corrugation geometry on pressure drop and convective heat transfer in tubes with varying helical pitches. Tubes with the smallest pitch spacing showed superior performance, making them the preferred choice across transitional and turbulent flow regimes.
Several researchers have conducted extensive studies on heat transfer in steel bars and their resulting metallographic structures within the Tempcore process. Hosny et al. [
16] proposed a method to predict the internal microstructure and overall mechanical properties of steel bars after the Tempcore process. Khalifa et al. [
17] developed a mathematical model to simulate the steel rolling process, consisting of three sequential components. The thermal model predicts the temperature distribution of the steel bar during the quenching and self-tempering stages. Sankar et al. [
18] employed response surface methodology to develop a nonlinear predictive model for the heat transfer coefficient of steel bars during the rolling process, considering three key control parameters. Gu et al. [
19] conducted numerical simulations of subcooled boiling flow by extending the RPI wall boiling model to ultra-high-pressure conditions of up to 15 MPa. Yang et al. [
20] simulated the temperature fields during online quenching and air cooling of 45# steel and 42CrMo steel bars. The critical cooling rates for quenching were calculated, followed by determination of the maximum hardening depths and corresponding quenching times for bars of different diameters. Choi et al. [
21] employed the finite volume method and continuous cooling transformation diagrams to predict the microstructure and area fraction of quenched martensite in rebars produced by the Tempcore process. The hardness of tempered martensite was successfully estimated using the tempering temperature, achieving a correlation coefficient (R) of 98%. Han et al. [
22] applied machine learning to adsorption heat transformation, enabling accurate prediction of adsorption thermodynamics and optimization of cascaded chillers, which yielded MOF-based systems with coefficients of performance above 1.6.
In summary, existing research on heat transfer enhancement using corrugated tubes mainly focuses on spiral or conical designs, primarily applied in heat exchangers or in enhanced heat transfer for small-diameter tubes. However, complex manufacturing processes and installation constraints limit their application in the Tempcore process. Furthermore, the heat transfer process in the Tempcore system involves complex water boiling phenomena, posing significant challenges for accurately modeling thermal and fluid flow behavior in large steel bars. Wavy or structured tubes have been applied in industrial heat exchange, and some patents also pertain to steel cooling systems. However, these designs mainly target small-diameter rods and require substantial modifications to the water supply system.
This article proposes a cylindrical corrugated tube specifically used for the Tempcore cooling process of large diameter steels. In the Tempcore process, the cylindrical corrugated tube combines a simple structure with effective turbulence enhancement. Unlike helical designs, it maintains a straight channel, facilitating installation on existing production systems without modifying the water supply infrastructure. To enhance the accuracy of simulating cooling behavior in the Tempcore system, the RPI (Rensselaer Polytechnic Institute) boiling model was employed in the numerical simulations. The heat transfer performance of the proposed tube was assessed using the resulting heat transfer coefficients and vapor volume fractions. The designed tube was subsequently installed in the Tempcore cooler to validate both the numerical results and the cooling performance of the cylindrical corrugated structure. This study provides theoretical guidance for applying cylindrical corrugated tubes in the Tempcore process for large steel bars.
2. Development of a Three-Dimensional Model for Bar Cooling
The steel bar rolling process, which includes an online heat treatment stage, is widely used in the production of high-quality steel bars or rebars. After reheating, steel billets pass through multiple rolling stands, where their cross-sectional dimensions are gradually reduced to achieve the desired size and shape.
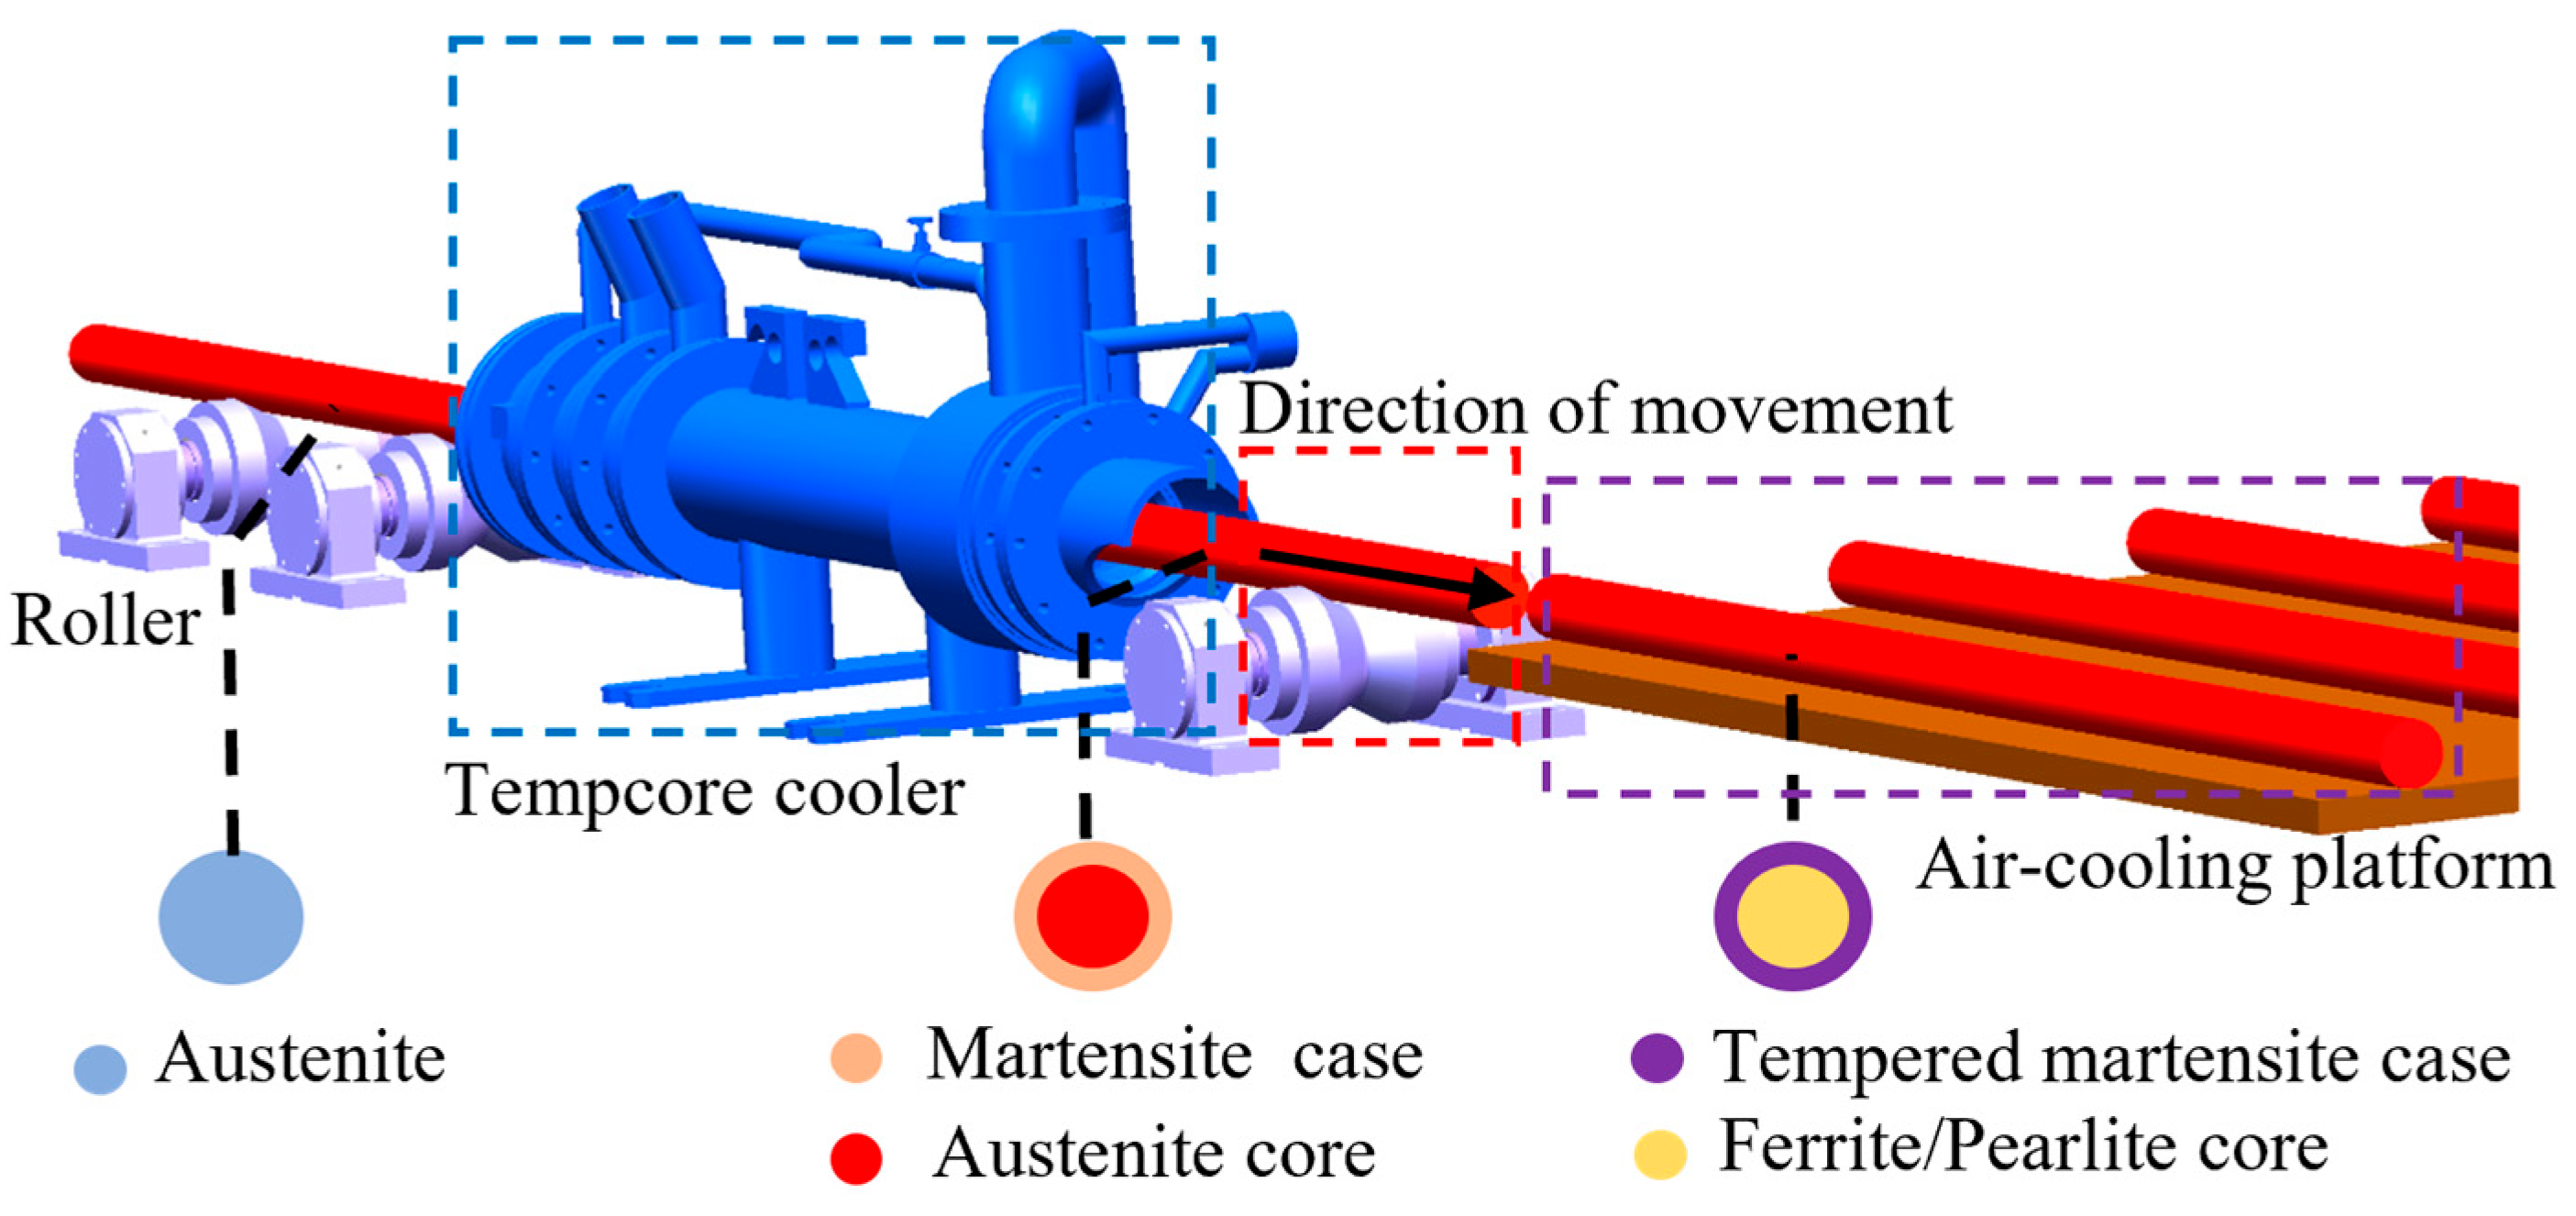
Stage 1—Quenching: As shown in the blue box in
Figure 1, a Tempcore cooler with high cooling efficiency is installed at the exit of the final roller to perform quenching. The principle is to utilize high-velocity water flow through the corrugated tube to induce turbulence, thereby disrupting the vapor film on the surface of the steel bar. The surface of the steel bar undergoes quenching to form a hard and brittle martensitic phase, which extends to a certain depth, while the core remains in the austenitic state. By adjusting process parameters, the region beneath the martensitic layer can partially or fully transform into bainite [
23].
Stage 2—Self-Tempering: As shown in the red box in
Figure 1, a temperature gradient develops across the steel bar cross-section after entering the air-cooling environment. Heat conducts from the core toward the quenched surface layer until thermal equilibrium is reached. For the bar material in this study, martensitic self-tempering begins at 613 K [
24]. The core remains austenitic to maintain sufficient ductility while ensuring high yield strength. The duration of this thermal equilibration stage depends on the bar diameter and the cooling conditions applied during the initial stage.
Stage 3—Air Cooling: As shown in the purple box in
Figure 1, during cooling on the cooling bed, the austenitic core transforms into ductile ferrite and pearlite due to the relatively slow cooling rate [
25]. This microstructural evolution is influenced by alloy composition, bar diameter, quenching inlet temperature, cooling duration, and cooling efficiency. The final microstructure comprises a strong, tough martensitic surface layer, an intermediate bainitic layer, and a core of ductile ferrite and pearlite. This distinct phase arrangement ensures a balanced combination of strength and ductility in the steel bar.
2.1. Establishment of the Three-Dimensional Model of the Tempcore Cooler
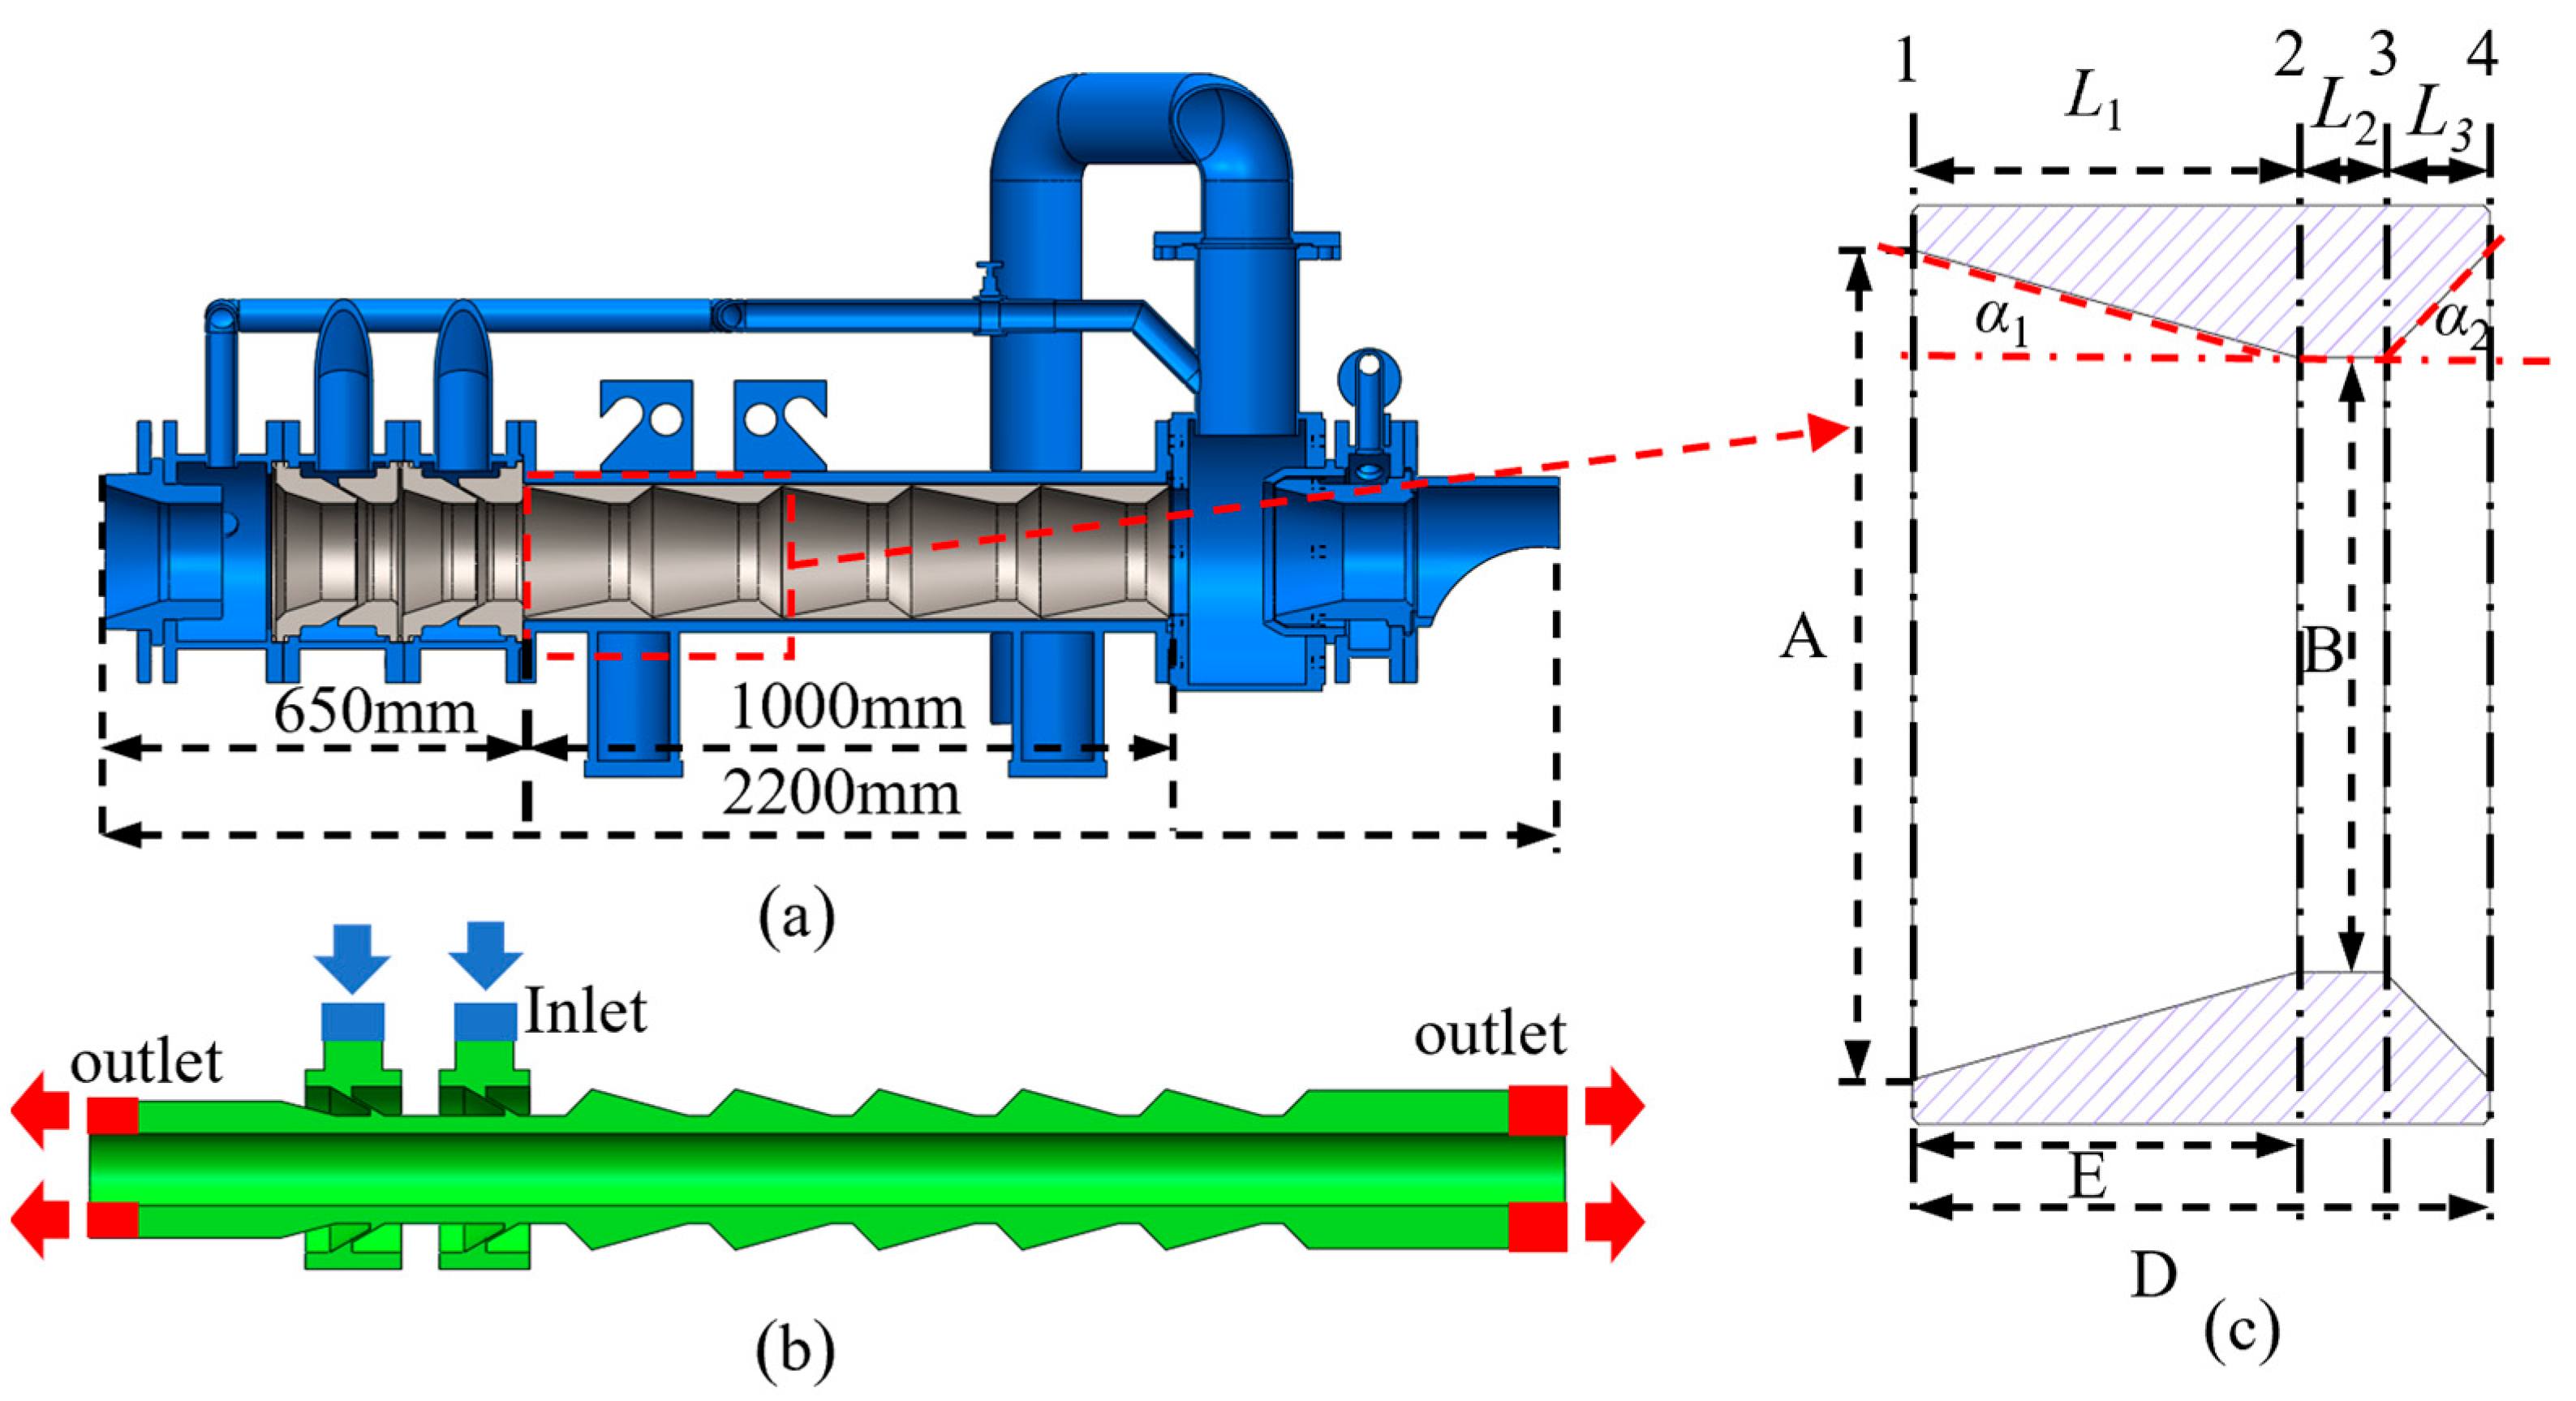
Figure 2 shows the Tempcore cooler used in the steel bar heat treatment process, along with a simplified fluid domain model based on its structure. Cooling water enters the corrugated channel through the inlet and exits at both ends, enabling efficient heat transfer to the steel bar. The right side shows the key dimensional parameters of the corrugated tube, including the maximum inner diameter
A, minimum inner diameter
B, taper length
E (
L1), and pitch
D. The contraction sections of the corrugated tube are designated as
L1 and
L2, whereas the expansion section is denoted as
L3. This study investigates the effects of individual corrugated tube parameter variations on heat transfer efficiency.
2.1.1. Analysis of Expansion and Contraction Angles in Corrugated Tubes
Let
A0 denote the cross-sectional area of the steel bar. At position 1, the total cross-sectional area of the water inlet is
A1, and the flow velocity of the water is
V1. The diameter of the tube cross-section is
R1. Taking the first inlet of the corrugated tube as the origin (zero coordinate), the radius of the circular cross-section at an arbitrary position
x along the tube is
Rx = R1 − tan
α1x, and the corresponding cross-sectional area at this position is
Ax = π
R2x, as illustrated in
Figure 2.
The average velocity at any cross-section within segment
L1 is calculated based on
Q = AV as follows [
26]:
If the steel bar passes through the cross-section, the average velocity at any position within segment
L1 is
From end face 2 to end face 3, the diameter of the cooling tube in segment
L2 remains constant at
R2. Based on the
Figure 2,
R2 =
R1 −
L1tan
α1 can be determined as follows:
The average velocity at any position inside the tube is given by
If the steel bar passes through the interface, the average velocity at any position within segment
L2 is
From end face 3, the tube gradually expands. According to
Figure 2, the radius of the circular cross-section at any longitudinal position x is
Rx =
R2 + tanα
1(
x −
L1 −
L2), and the corresponding cross-sectional area is
Ax = π
R2x. Thus, the average velocity at any position within segment is
If the steel bar passes through the cross-section, the average velocity at any position within segment
L3 is
The local Reynolds numbers in segments
L1 and
L2 are expressed as follows [
27,
28]:
Local Nusselt number:
The contraction angle
α1 defines the tube’s geometric contraction, affecting the velocity field and, consequently, the local Reynolds and Nusselt numbers. As the contraction angle increases, the flow passage narrows, resulting in higher local velocity. According to the modified Nusselt number correlation [
14], the heat transfer coefficient increases correspondingly. A similar relationship applies between the expansion angle
α2 and heat transfer efficiency.
2.1.2. Development of the Cooling Model for Steel Bars
Figure 3 presents the finite element model of the cooling device created in GAMBIT. Owing to the device’s large size and the complex flow field near the steel surface, the model was partitioned into multiple regions to ensure computational accuracy. Mesh refinement was applied around the steel bar and its surface, with structured grids used predominantly for the bar. A four-level grid was established for grid sensitivity analysis. The temperature at the monitoring point converged from 463 K with the coarsest grid to 439 K with the finest grid, with only a 1 K difference between the two finest levels, as shown in
Table 1. By achieving grid independence, the mesh was maintained within the optimal range while ensuring computational accuracy, resulting in a total of 2.72 million grid points.
The meshed model was imported into FLUENT for computation. The inlet was specified as a mass flow inlet with a total mass flow rate of 37 kg/s, and the outlet was set to atmospheric pressure. The initial temperature of the steel bar was 1073 K, while the cooling water was maintained at 300 K. The cooling process lasted 2.8 s. A steel bar with a diameter of Φ100 mm was used. The continuity and velocity convergence residuals were set to 1 × 10⁻⁶, indicating the desired level of solution convergence. The k–ε turbulence model was employed throughout the simulation. For the solution procedure, the Phase-Coupled SIMPLE algorithm was adopted to accurately predict the temperature evolution of the steel bar under convective heat transfer between the bar and the fluid. By controlling individual parameters, this study analyzes the effects of corrugated tube variations on flow characteristics, heat transfer coefficients, and the steel bar temperature field, providing a theoretical basis for the structural design of the corrugated tube.
2.2. Theoretical Analysis of Heat Conduction in the Cooling Process of Steel Bar
A CFD model was developed using ANSYS Fluent 2023 R1 to simulate the heat transfer process of steel bar within the Tempcore cooler. The model assumes an infinitely long steel bar passing through the Tempcore cooler. Considering that the axial temperature gradient is usually much smaller than the radial gradient, the axial heat flux is far less than the radial heat flux, so axial heat transfer can be neglected in the model [
17]. The following assumptions were adopted: negligible axial conduction, a stationary steel bar within the device, steady-state cooling conditions, uniform initial temperature, radial axisymmetry, and a uniform circular cross-section. The steady temperature field
T(
x) during the Tempcore process is governed by the following energy equation:
The equation, T0 represents the initial temperature, and qW denotes the total heat flux contributed by convection, quenching, and evaporation.
During the cooling of high-temperature steel bars, vigorous boiling occurs when the cooling water contacts the bar surface, as the surface temperature greatly exceeds the water saturation temperature. The energy from the bar surface raises the temperature of the cooling water, while part of the energy is directly transferred to the steam phase through phase change. Since the RPI model in ANSYS Fluent’s multiphase flow module accounts for these heat transfer mechanisms, this study employs the standard RPI multiphase flow model [
29].
The RPI model separates wall boiling heat transfer into three parallel thermal resistance pathways, with the total heat flux expressed as follows:
qQ represents the simulated cycle-averaged transient energy transfer. The refilling of liquid near the wall after bubble departure is related to the heat flux.
qQ is expressed as follows:
qE is expressed as follows:
The equation, qC convective heat flux [W·m−2]; qQ quenching heat flux [W·m−2]; qE evaporative heat flux [W·m−2]; hC heat transfer coefficient [W·m−2·°C−1]; TW wall temperature [°C]; Tl liquid temperature [°C]; Ab bubble nucleation site coverage area on the heated wall [m2]; kl thermal conductivity of liquid [W·m−1·°C−1]; thermal diffusivity [m2·s−1]; T cycle period [s]; Vd bubble volume based on departure diameter [m3]; Nw active nucleation site density [m−2]; ρv vapor density [kg·m−3]; hfv latent heat of vaporization [J·kg−1]; f bubble departure frequency [s−1]; k thermal conductivity [W·m−1·°C−1].
3. Analysis of Simulation Results
Based on theoretical analysis of the corrugated tube’s expansion and contraction angles, the structural parameters were determined, and the effects of individual factors on heat transfer efficiency were investigated. Increasing the contraction angle enhances flow velocity, which raises the Reynolds and Nusselt numbers and strengthens heat transfer. However, excessively large angles promote vortex formation and recirculation zones. The optimal contraction angle typically ranges from 15° to 20° [
30], balancing heat transfer enhancement with pressure drop. Considering engineering manufacturing and application requirements, the minimum inner diameter
B must balance manufacturability and flow characteristics, being neither too large nor too small. According to boundary layer theory [
31], an excessively large
B weakens the fluid acceleration effect, limiting improvements in heat transfer efficiency. Conversely, a too-small
B promotes strong recirculation in the expansion section. Based on a contraction angle of 15°–20° and theoretical calculations, the minimum inner diameter
A is determined to be Φ183–Φ273 mm. Considering boundary layer theory and industrial feasibility, the minimum inner diameter
B is set to Φ120–Φ160 mm. Taking into account device space and physical constraints, parameter
D is specified as 186–276 mm. Based on the positions of the large troughs on the inflow and outflow sides [
12], as well as industrial feasibility, parameter
E is set to 52–132 mm. The preliminary values of parameters
A,
B,
D, and
E are summarized in
Table 2.
3.1. Analysis of the Effect of Maximum Inner Diameter (A) on the Cooling Efficiency of Steel Bars
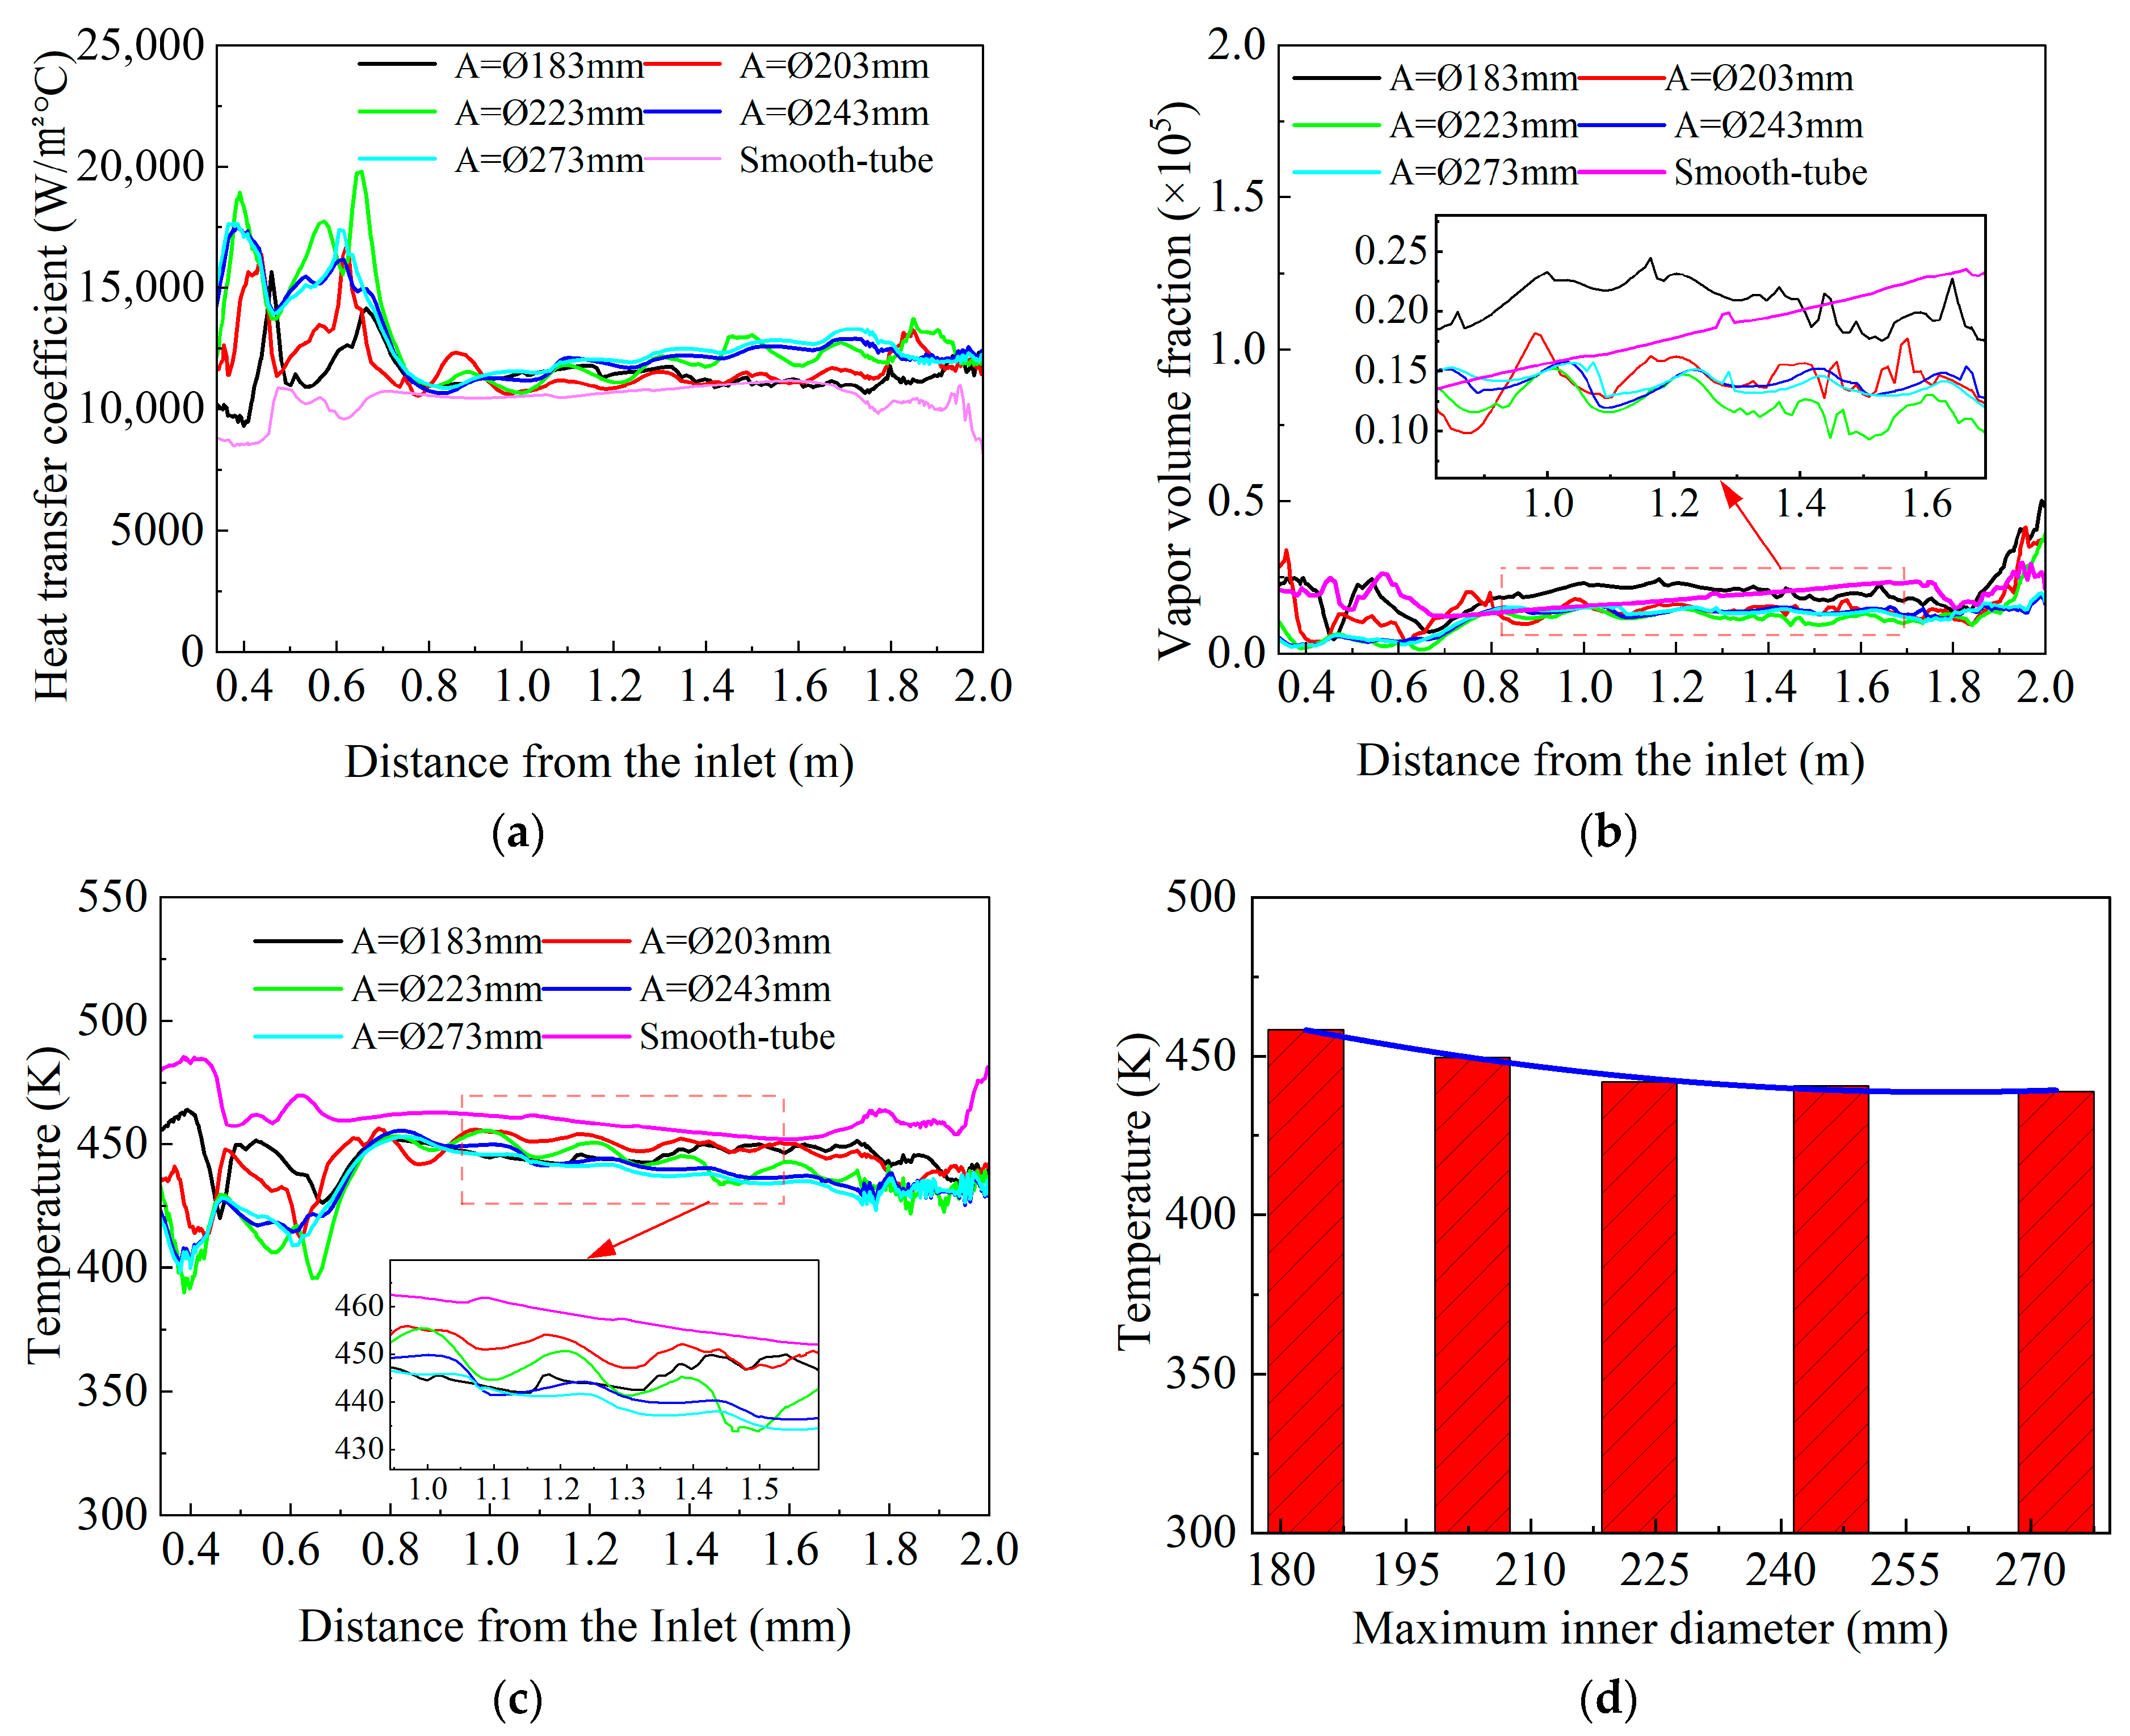
Figure 4 illustrates the variation in heat transfer coefficient, vapor volume fraction, and temperature with the maximum inner diameter
A of the corrugated tube. The heat transfer coefficient increases with a larger
A, whereas the water vapor volume fraction and temperature decrease. In the inlet section (0.3–0.6 m), impingement of cooling water from the annular gap onto the steel surface produces higher heat transfer coefficients and vapor volume fractions, along with relatively lower temperatures. Within the corrugated section (0.6–1.6 m), the corrugation enhances turbulence, resulting in pronounced fluctuations in both heat transfer coefficient and vapor volume fraction. In the outlet section (1.6–2.0 m), near the exit, the heat transfer coefficient decreases and then stabilizes. Overall, the cooling performance improves with increasing maximum inner diameter
A, and eventually reaches a plateau. Compared with smooth tubes at the same flow rate, the designed corrugated tubes increased heat transfer performance by 13%, 19%, 48%, 55%, and 61% for A = 183 mm, 203 mm, 233 mm, 246 mm, and 273 mm, respectively. Using the Nusselt number of a smooth tube as the reference for normalization, the results show that the normalized Nusselt numbers of the corrugated tubes exceed 1, reaching a maximum of 1.68. This enhancement primarily results from the change in the corrugated tube angle induced by the maximum inner diameter
A, which intensifies turbulence.
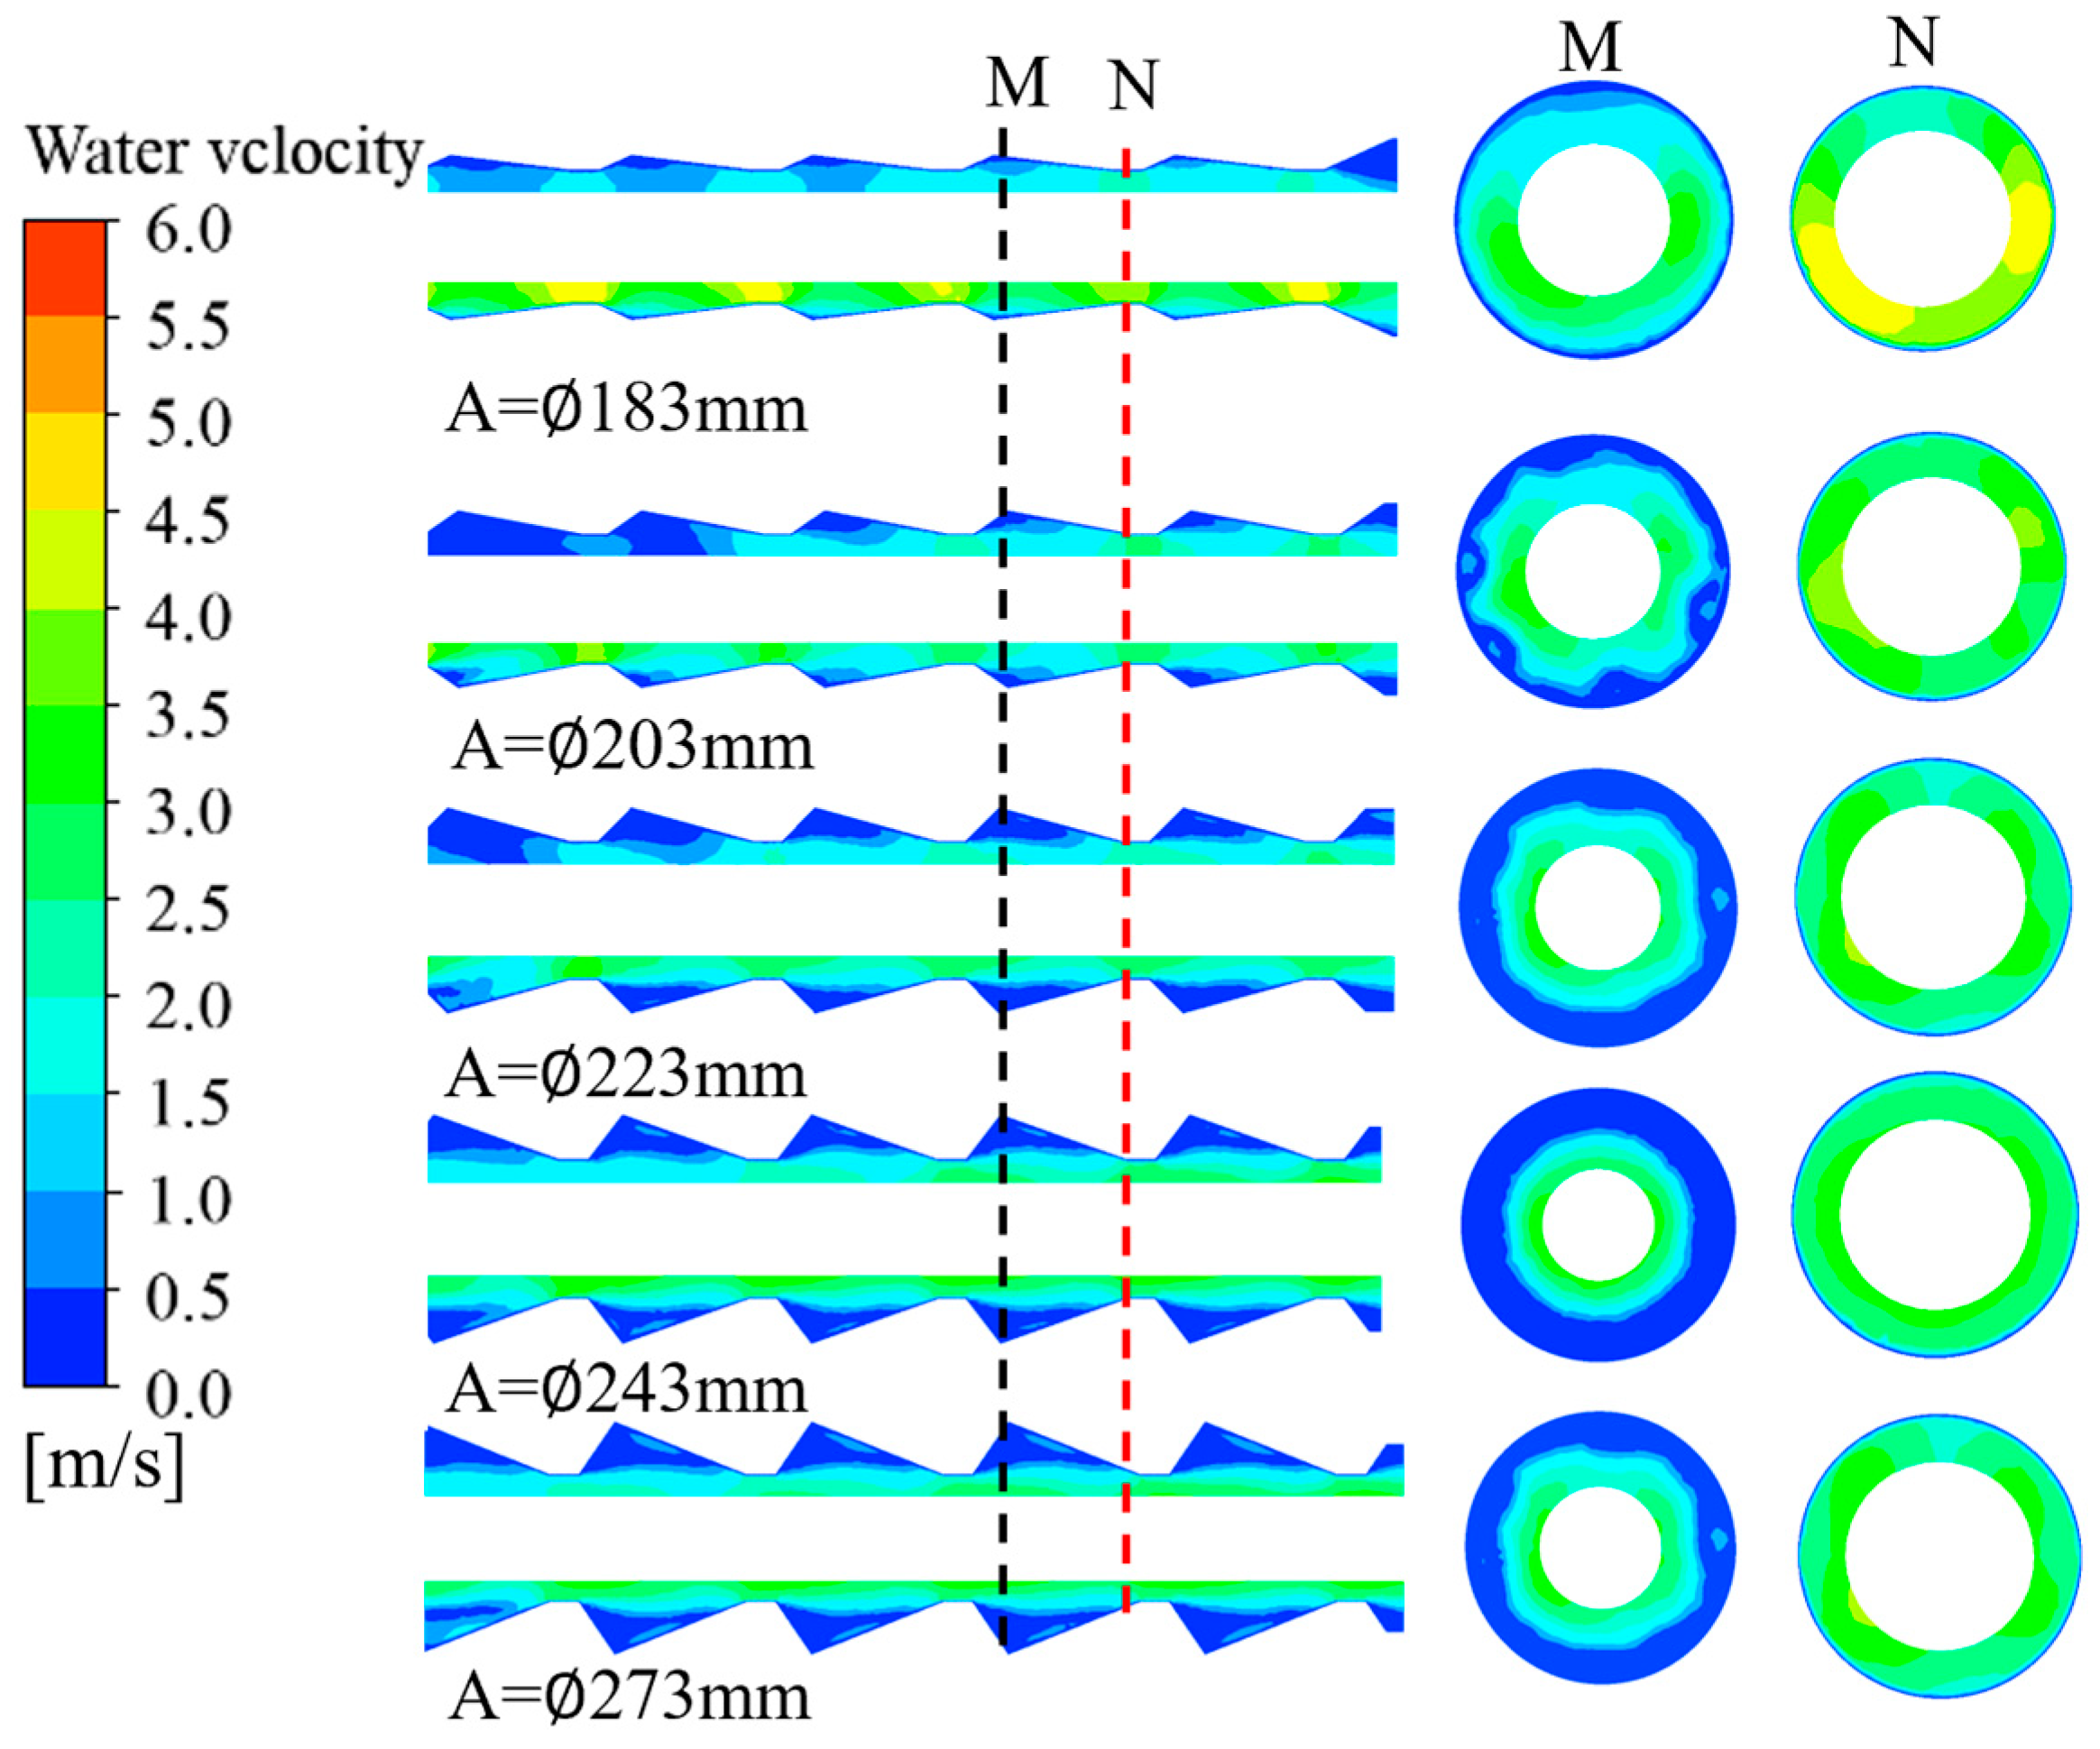
Figure 5 presents the axial velocity contours of cooling water for different maximum inner diameters (
A). Subfigure M shows the velocity contours in the contraction section. As
A increases, the velocity contours display a lobed pattern, indicating stronger disruption of the vapor film on the steel bar surface. Subfigure N shows the velocity contours in the expansion section, where the overall axial velocity decreases. When the inner diameter is too small, the contraction angle decreases, reducing the shear velocity of the cooling water. Under these conditions, a continuous vapor film tends to form on the steel bar surface. At small inner diameters, the limited amplitude of the corrugations generates insufficient disturbances to break the vapor film. Since the vapor film has very low thermal conductivity, it acts as an insulating layer, preventing the cooling water from adequately contacting the bar surface. Although the flow velocity is high, heat transfer at the wall is dominated by the insulating effect of the vapor film, resulting in low heat transfer efficiency.
As the inner diameter increases, the contraction angle also increases, leading to higher shear velocity of the cooling water and greater corrugation amplitude. This promotes stronger transverse disturbances that disrupt the previously stable vapor film, initiating a cyclic vapor–water renewal process. Although the axial velocity may slightly decrease, the disruption of the vapor film on the steel bar surface enhances cooling, as convective heat transfer replaces film heat transfer, significantly increasing the overall heat transfer coefficient.
3.2. Analysis of the Effect of Minimum Inner Diameter (B) on the Cooling Efficiency of Steel Bars
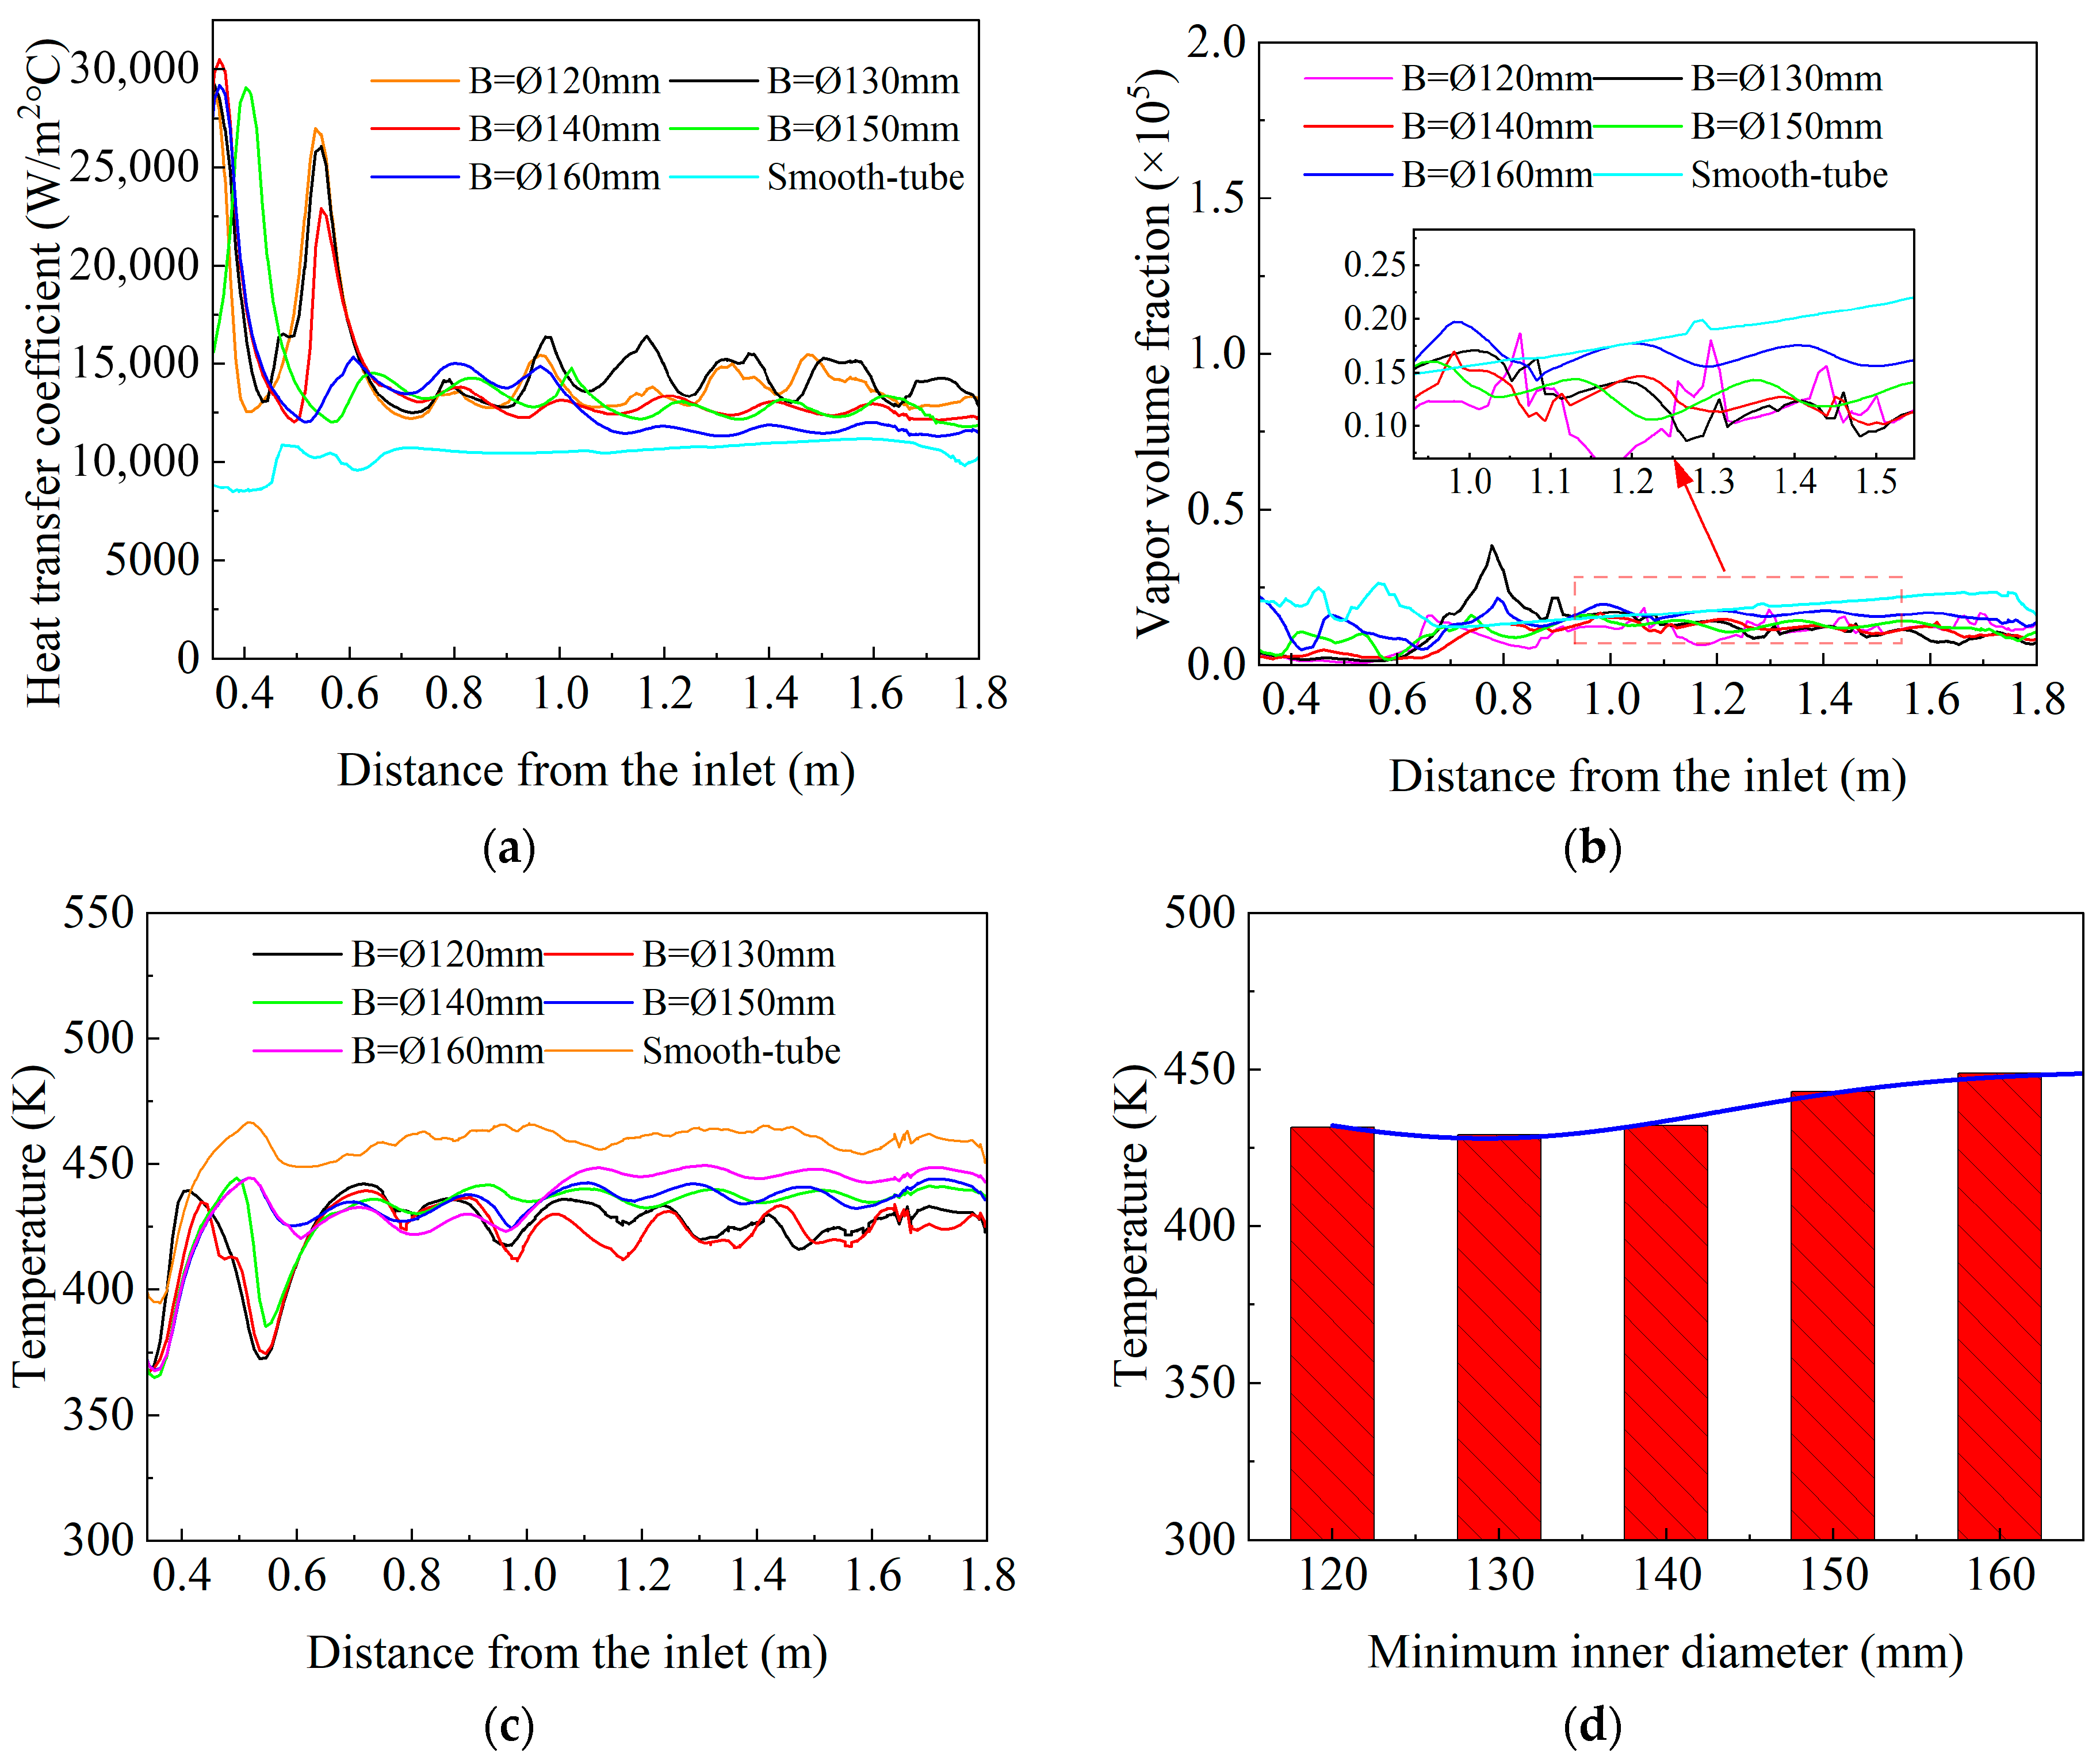
Figure 6 presents the trends of heat transfer coefficient, vapor volume fraction, and temperature with varying minimum inner diameter (
B) of the corrugated tube. The heat transfer coefficient and temperature initially increase and then decrease as
B increases, whereas the water vapor volume fraction continuously rises with increasing
B. When the minimum inner diameter is Φ130 mm, the heat transfer coefficient reaches its maximum, and the water vapor volume fraction remains relatively low, resulting in the optimal overall heat transfer performance. Compared to smooth tubes at the same flow rate, the designed corrugated tube improved heat exchange performance by 63%, 54%, 19%, and 35% for B = 130 mm, 140 mm, 150 mm, and 160 mm, respectively, whereas for B = 120 mm, the Nusselt number decreased by 15%. Using the Nusselt number of a smooth tube as a reference for normalization, the results indicate that the normalized Nusselt numbers of the corrugated tube under the studied conditions are all greater than 1, reaching a maximum of 1.63. This enhancement primarily arises from changes in the thermal boundary layer induced by the minimum inner diameter
B, which increase heat transfer efficiency.
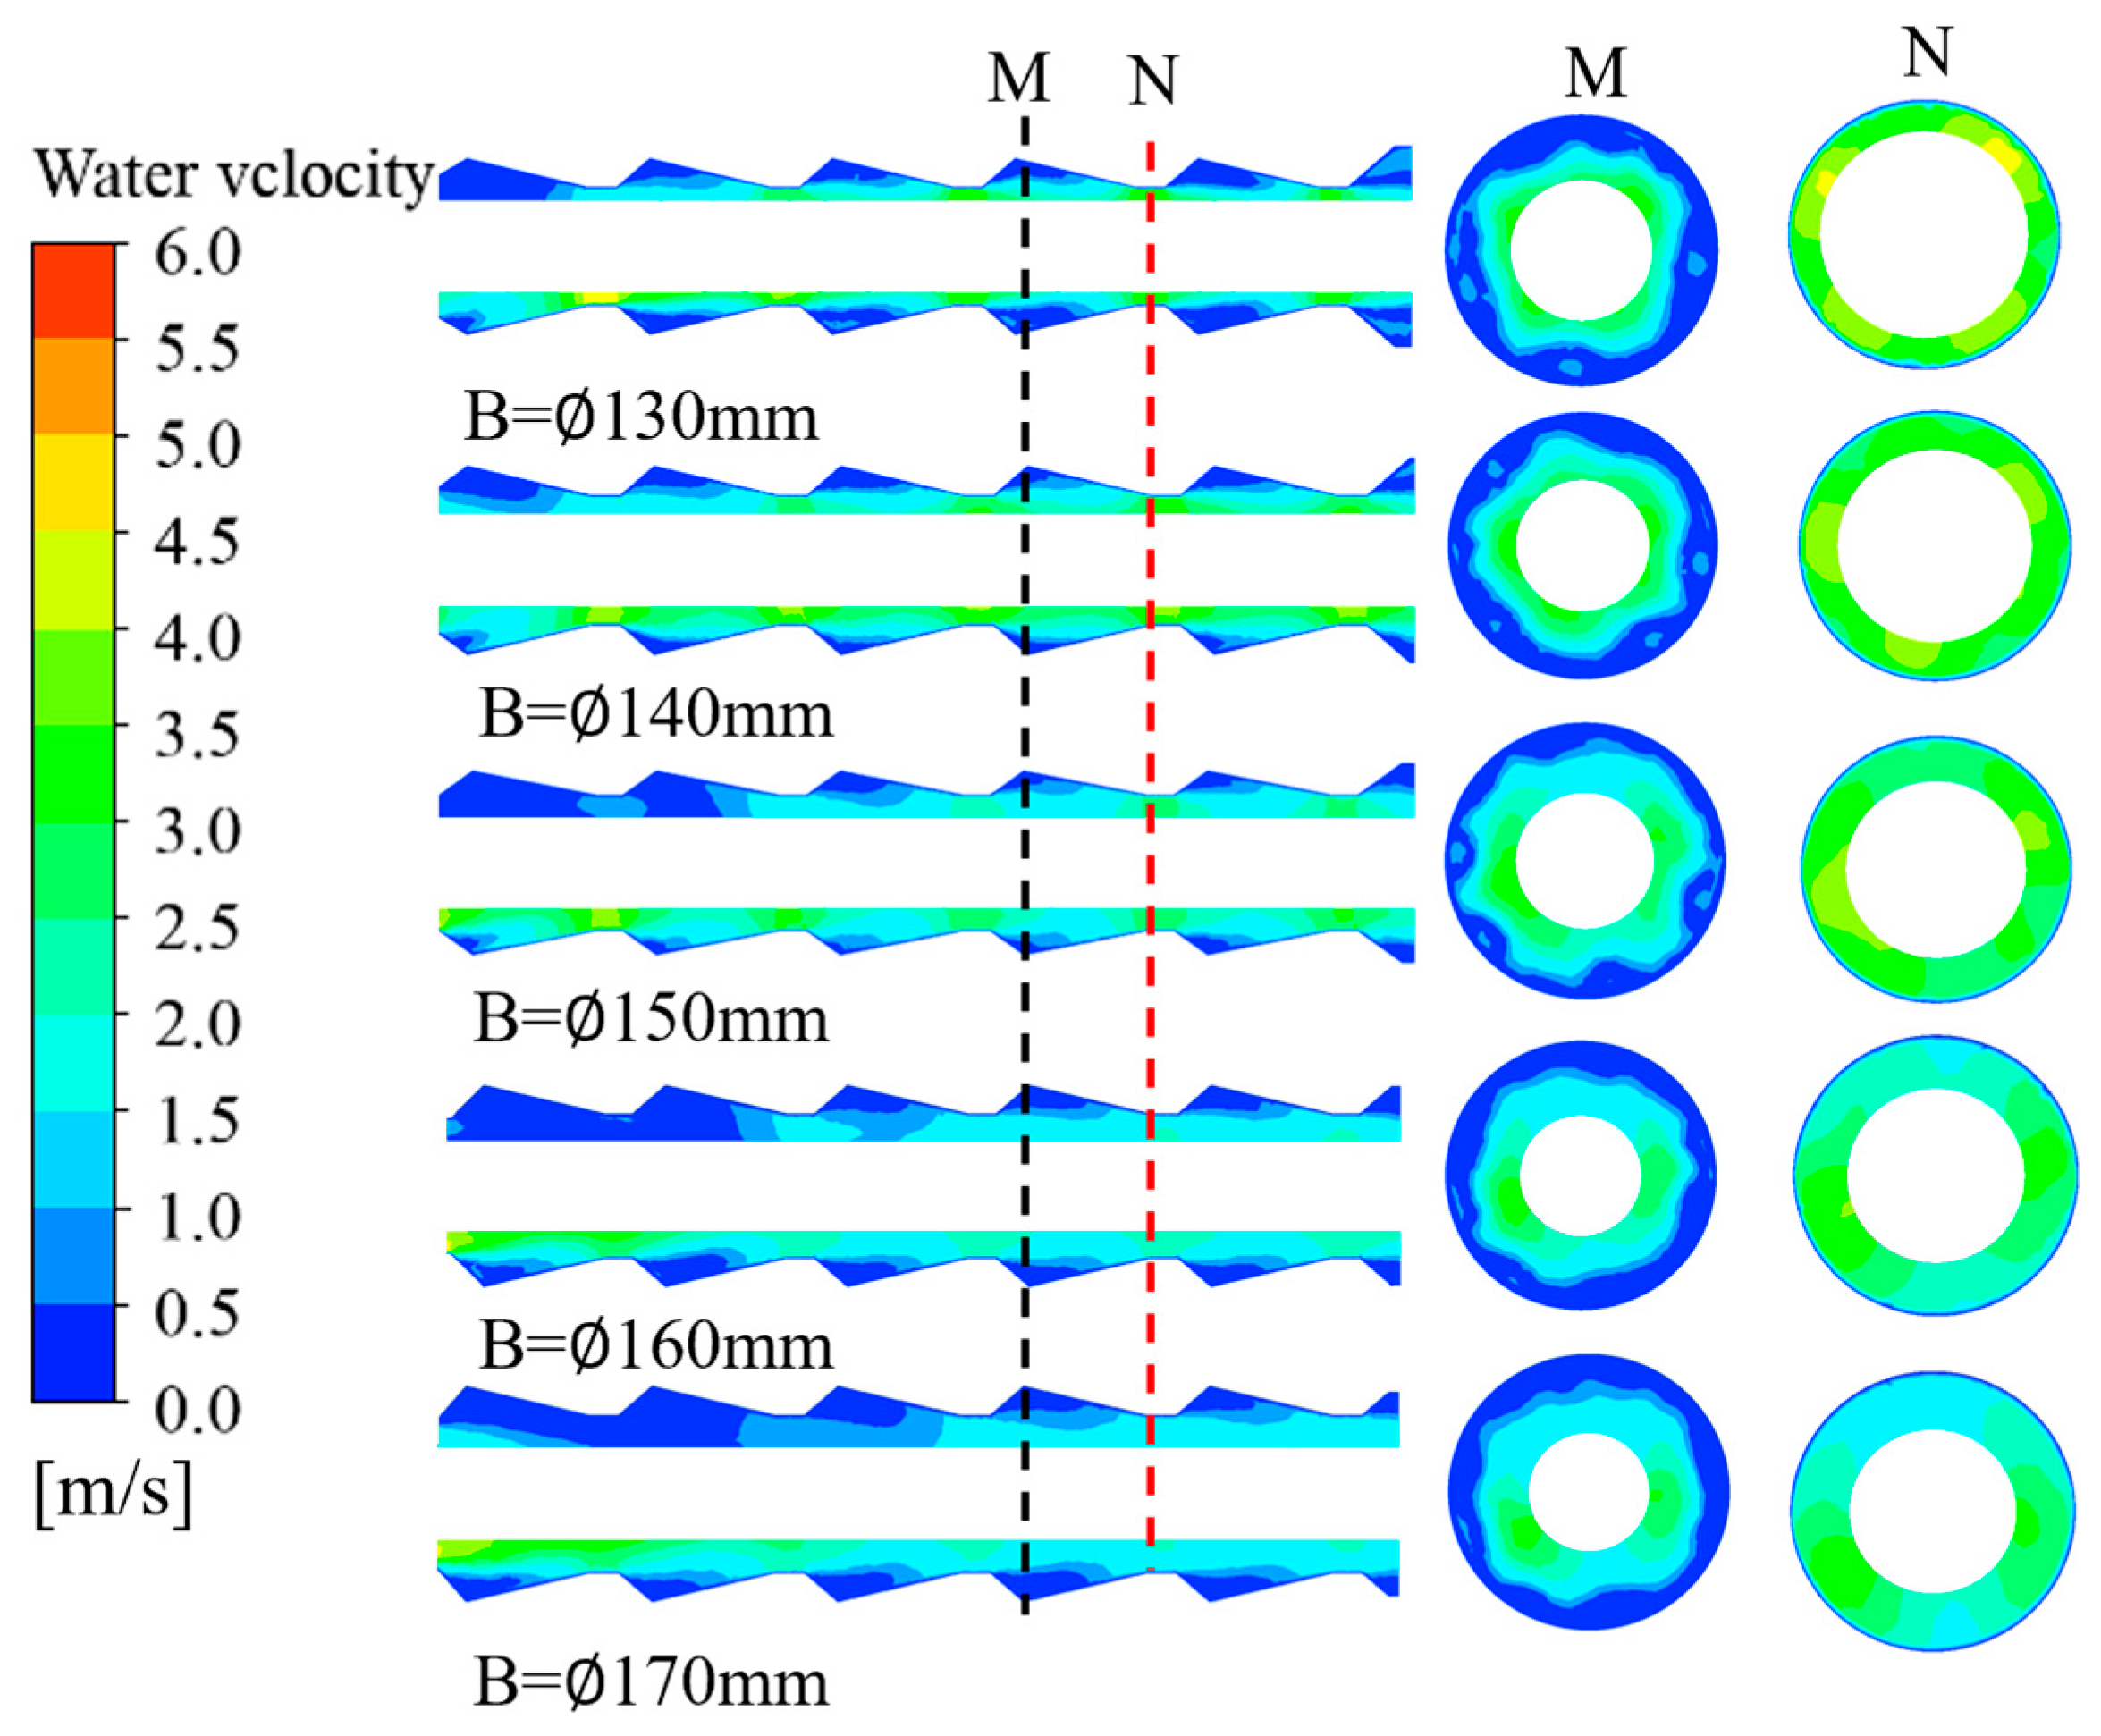
Figure 7 presents axial velocity contour plots of the cooling water for different minimum inner diameters (
B). As
B increases, the axial velocity of the cooling water decreases. When the contraction and expansion angles remain constant and the minimum inner diameter is ∅120 mm, the pressure drop across the bellows is severe, reaching 5.2 kPa. Strong backflow or vortex regions form in the expansion section, increasing flow resistance and reducing heat transfer efficiency. When the minimum inner diameter is Φ130 mm, the pressure drop across the corrugated tube decreases to 3.2 kPa, the local contraction of the tubeline remains pronounced, and the fluid velocity in the contraction section is relatively high. On the circumferential cross-sections at positions M and N, pronounced turbulence and transverse disturbances occur. The cooling water reaches maximum shear velocity, significantly disrupting the vapor film and markedly increasing the heat transfer coefficient. As
B increases, the velocity in the contraction section decreases, leading to a lower Reynolds number, weaker turbulence, and consequently reduced heat transfer.
3.3. Analysis of the Effect of Taper Length (E) on the Cooling Efficiency of Steel Bars
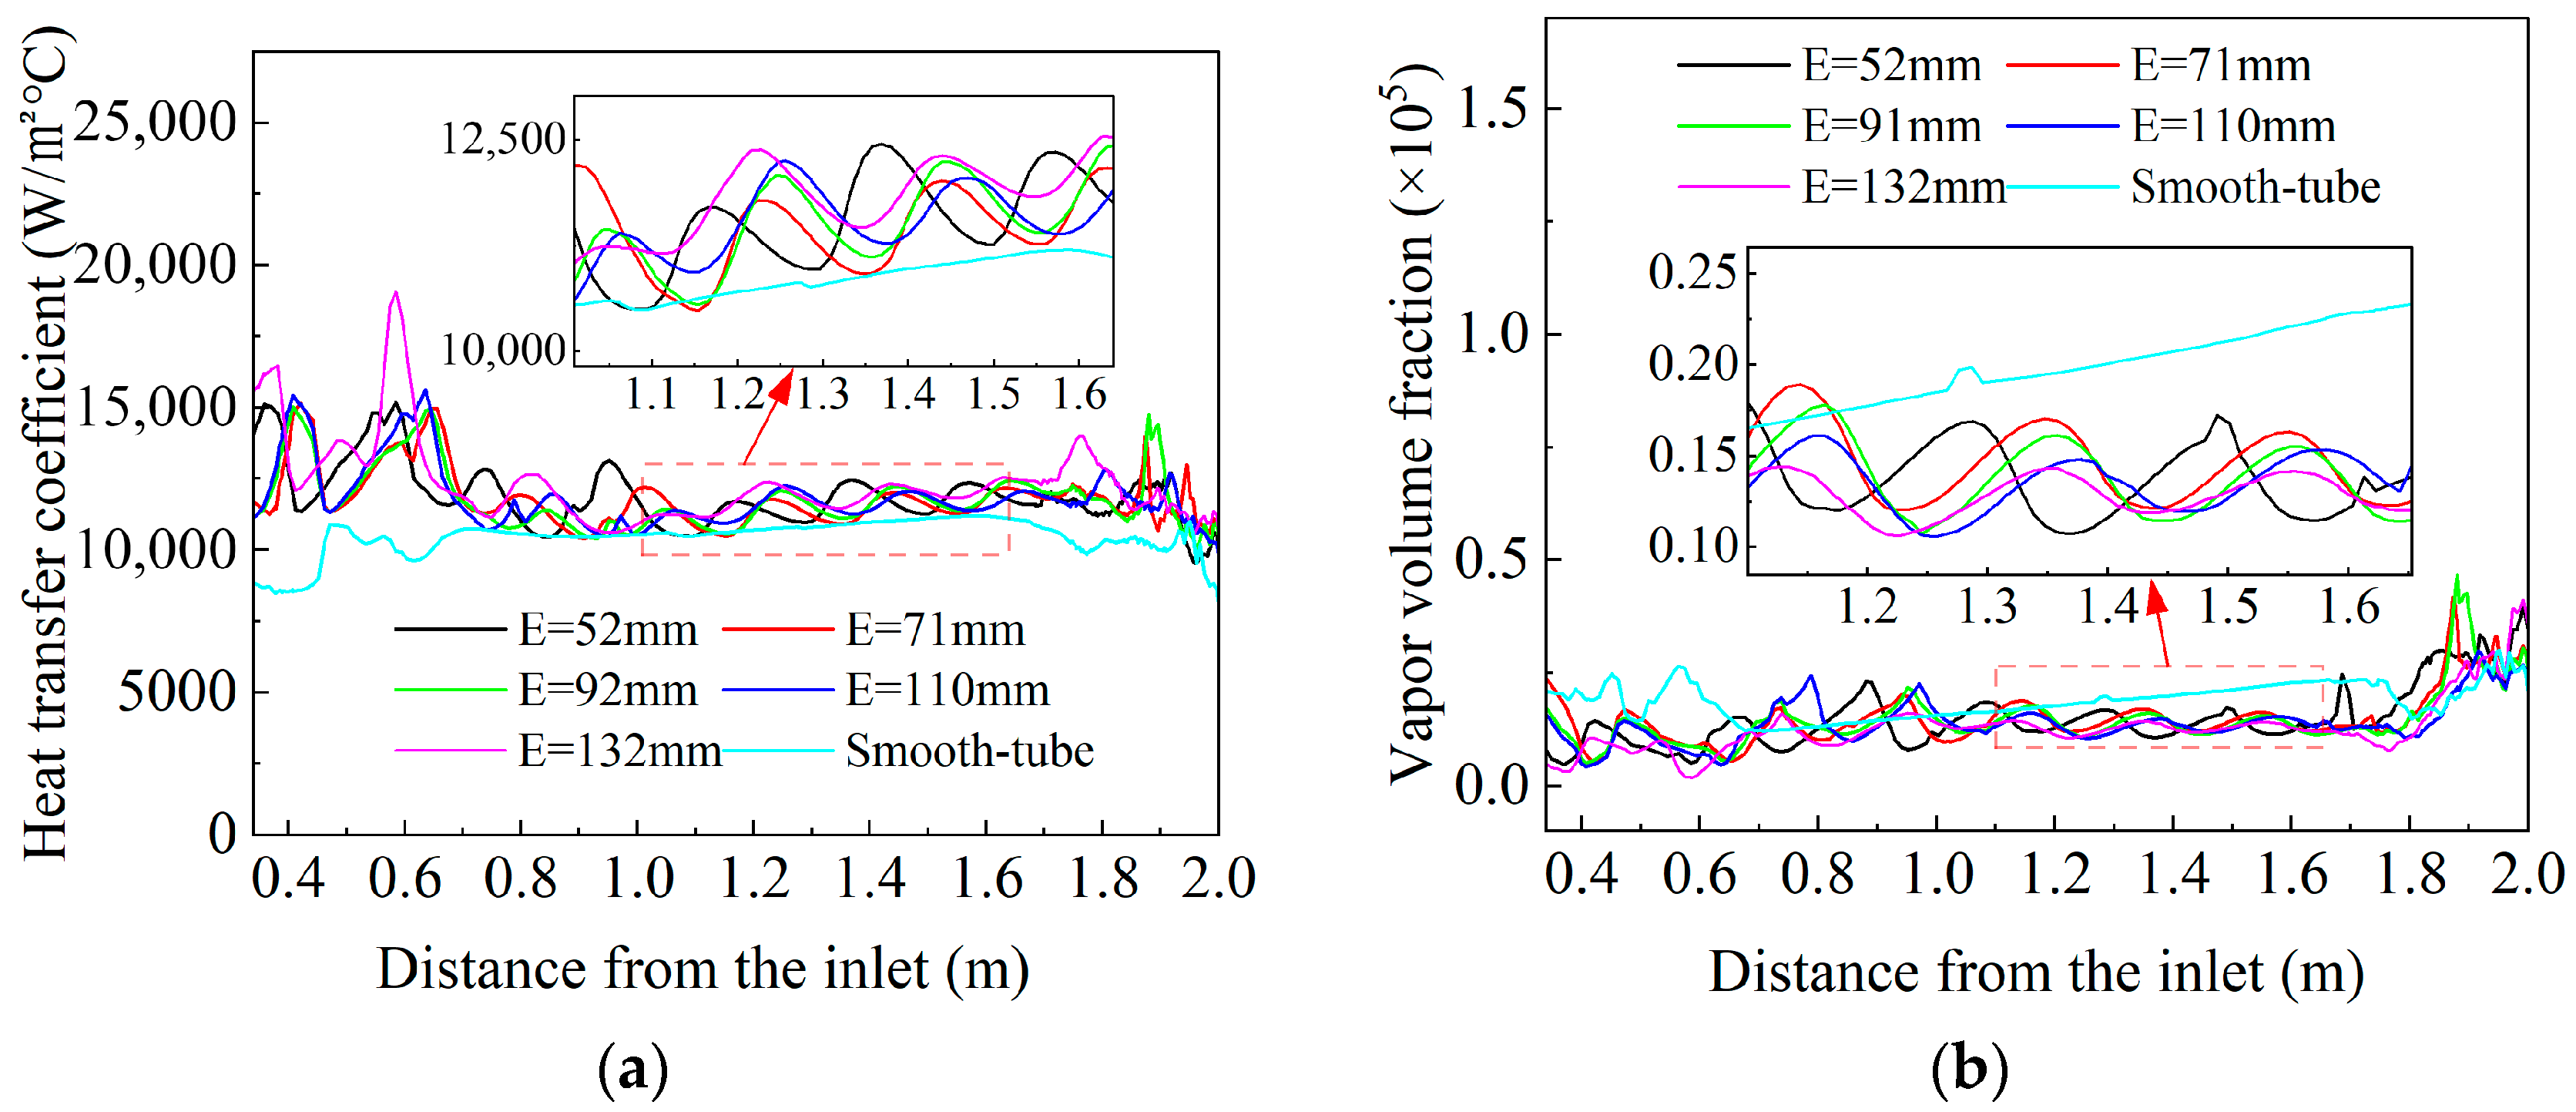
Figure 8 illustrates the trends of the heat transfer coefficient, vapor volume fraction, and temperature with varying taper length (
E) of the corrugated tube. The heat transfer coefficient, water vapor volume fraction, and temperature all exhibit periodic fluctuations with similar amplitudes as the taper length increases, with temperature variations being relatively minor. At 1400 mm from the inlet, the intense turbulence generated by the inlet annular gap exerts a negligible effect on the flow field within the corrugated tube. The maximum temperature variation of the steel bar is approximately 2 K, showing that the taper length has a limited impact on the cooling performance of the corrugated tube. Compared to the basic smooth tube, the designed corrugated tube exhibits enhanced heat exchange performance at the same flow rate, with E = 52 mm, 71 mm, 92 mm, 110 mm, and 132 mm yielding improvements of 58%, 33%, 15%, 12%, and 52%, respectively. The normalized Nusselt number, using the smooth tube as a reference, indicates values greater than 1, reaching a maximum of 1.58. This enhancement primarily results from the large trough of the corrugated tube created by the cone length
E, positioned at either the inflow or outflow section.
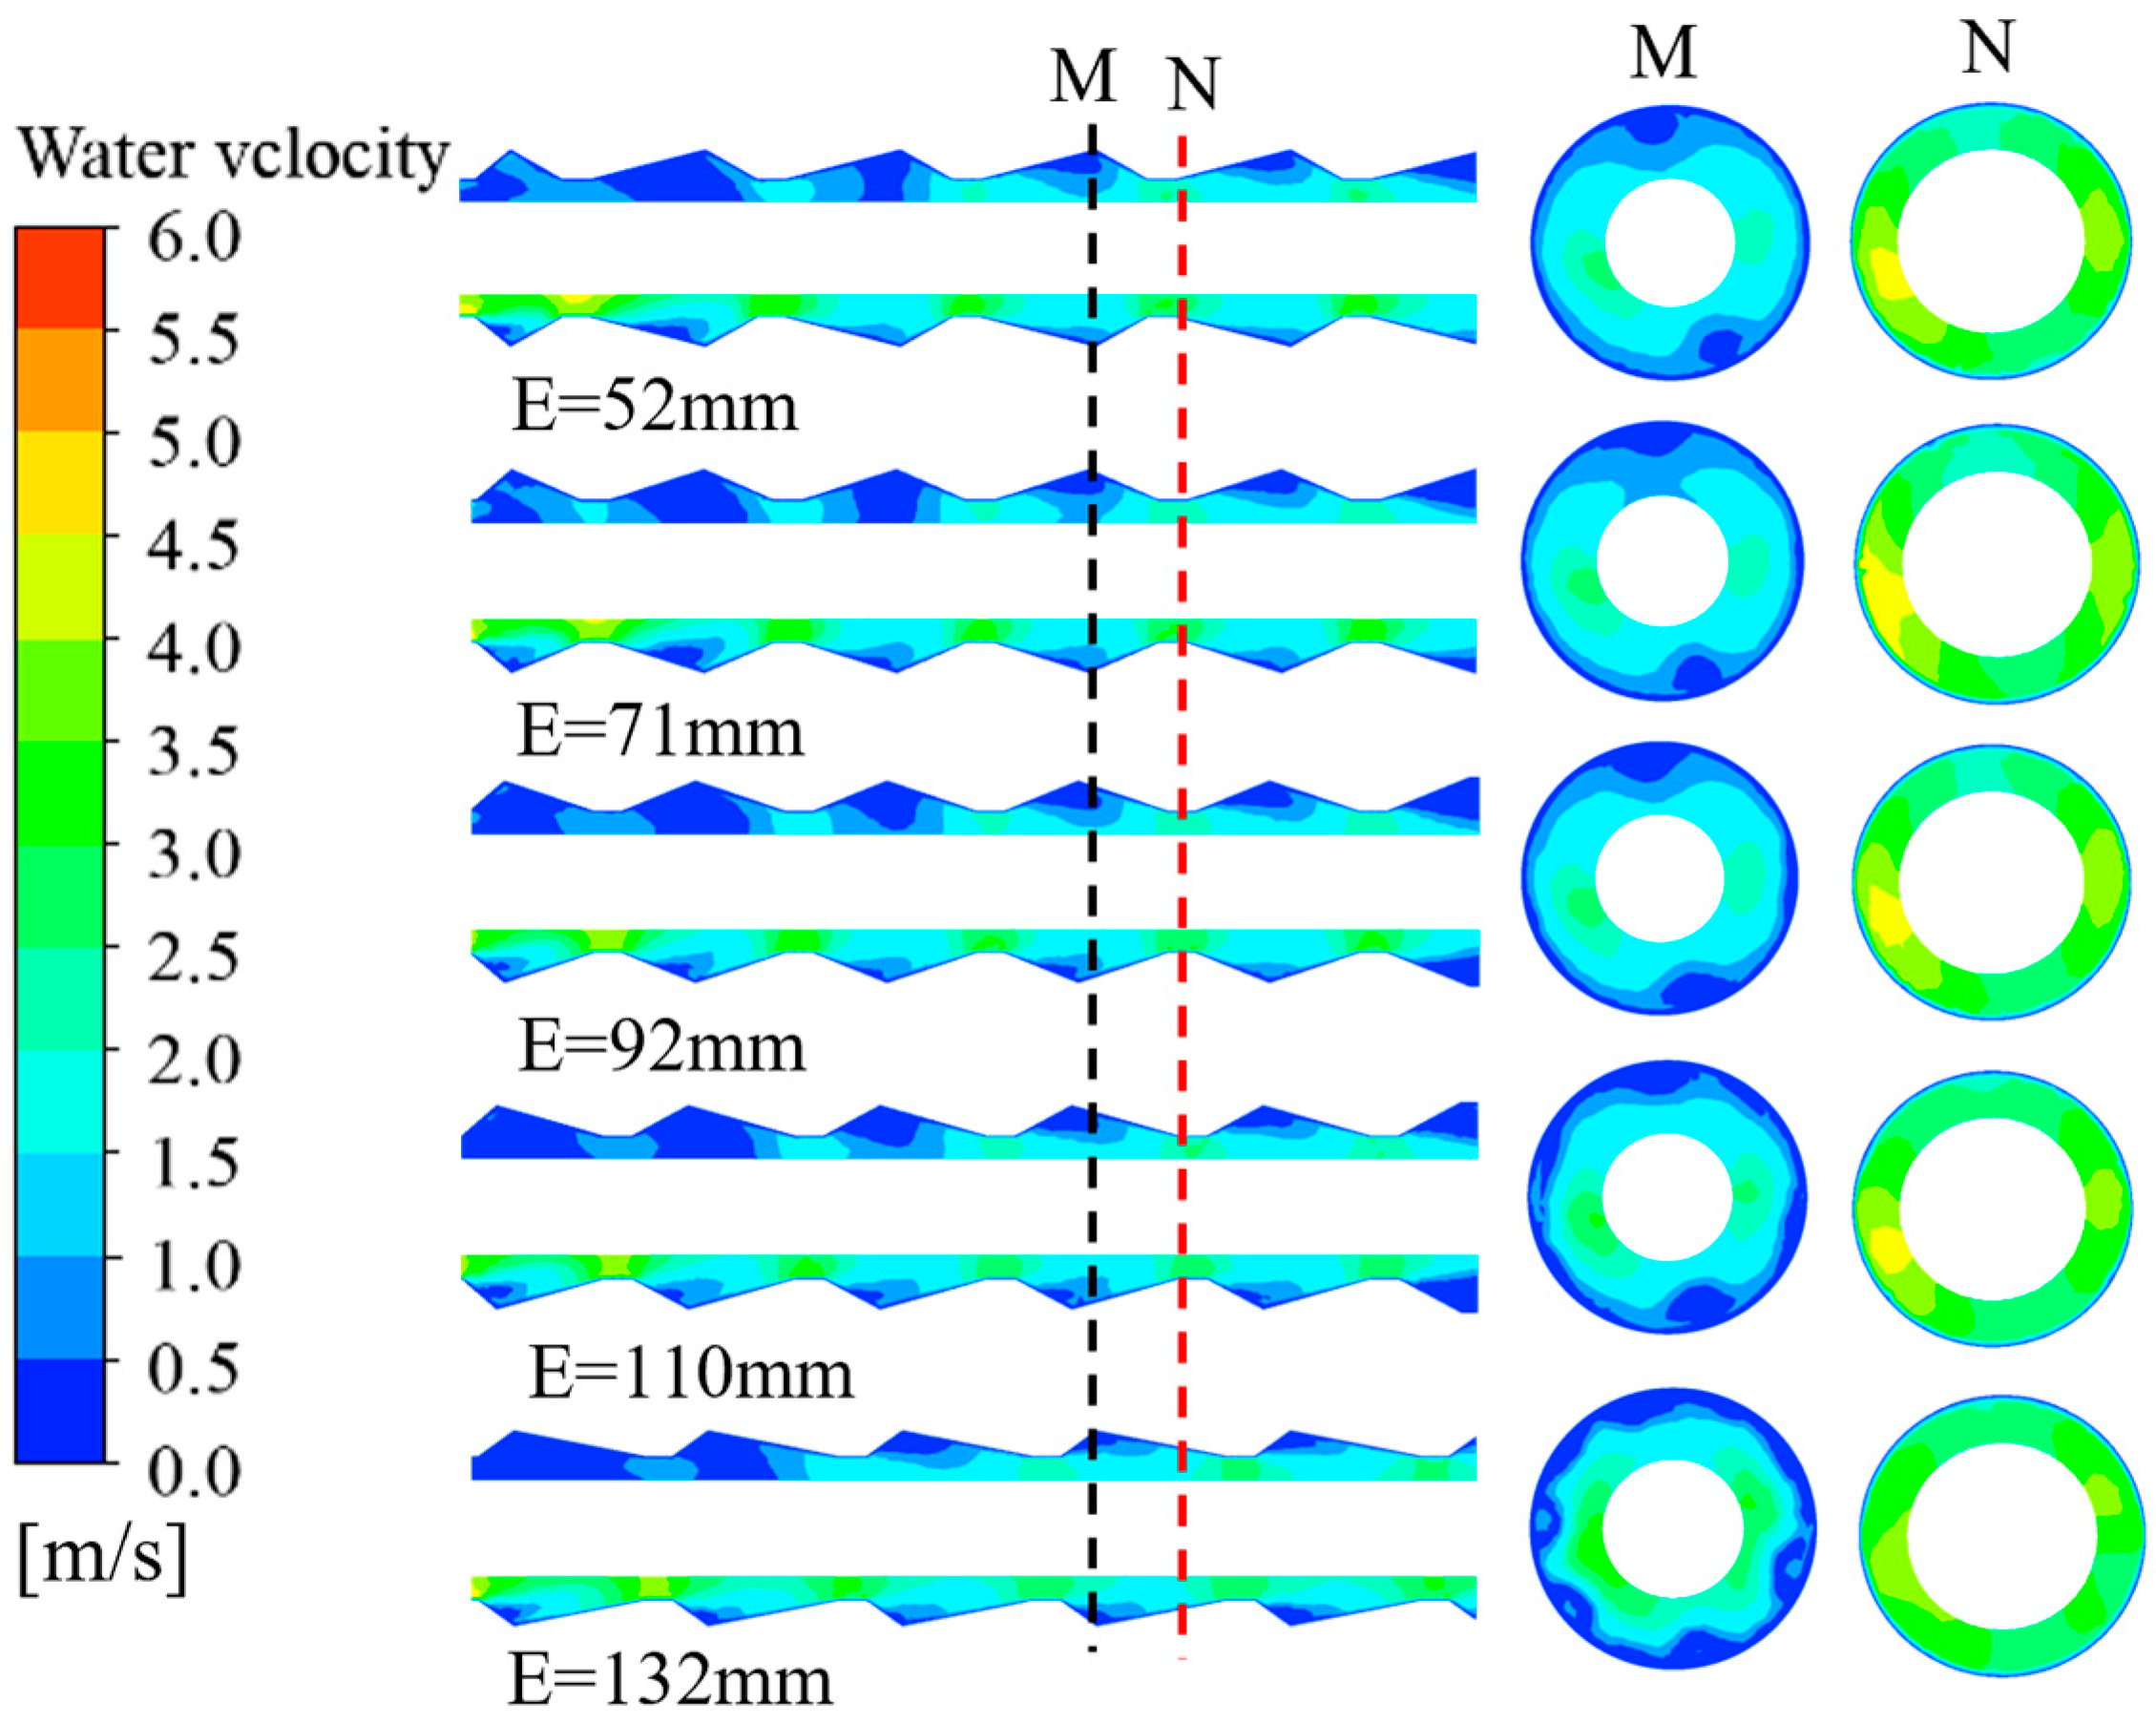
Figure 9 shows the axial velocity contour plots of cooling water for different taper lengths (
E). As
E varies, the contraction and expansion angles change simultaneously. Specifically, for E = 52 mm, 71 mm, 90 mm, 110 mm, and 150 mm, the corresponding (contraction angle, expansion angle) pairs are (32°, 15°), (24°, 18°), (19°, 22.5°), (16°, 28.5°), and (12°, 60°), respectively. For E = 52 mm and E = 110 mm, the large wave troughs are located on the inflow side, and the cooling water exhibits nearly equal velocities at cross-sections M and N. The corresponding Nusselt numbers are 58% and 52%, differing by 6%, and the expansion and contraction angles are approximately interchangeable. For E = 71 mm and E = 92 mm, the large wave valleys are positioned on the downflow side, with similar cooling water velocities and a Nusselt number difference of 3%. This enhancement mainly arises from the big trough of the corrugated tube introduced by the cone length
E, located at the inflow or outflow measurement.
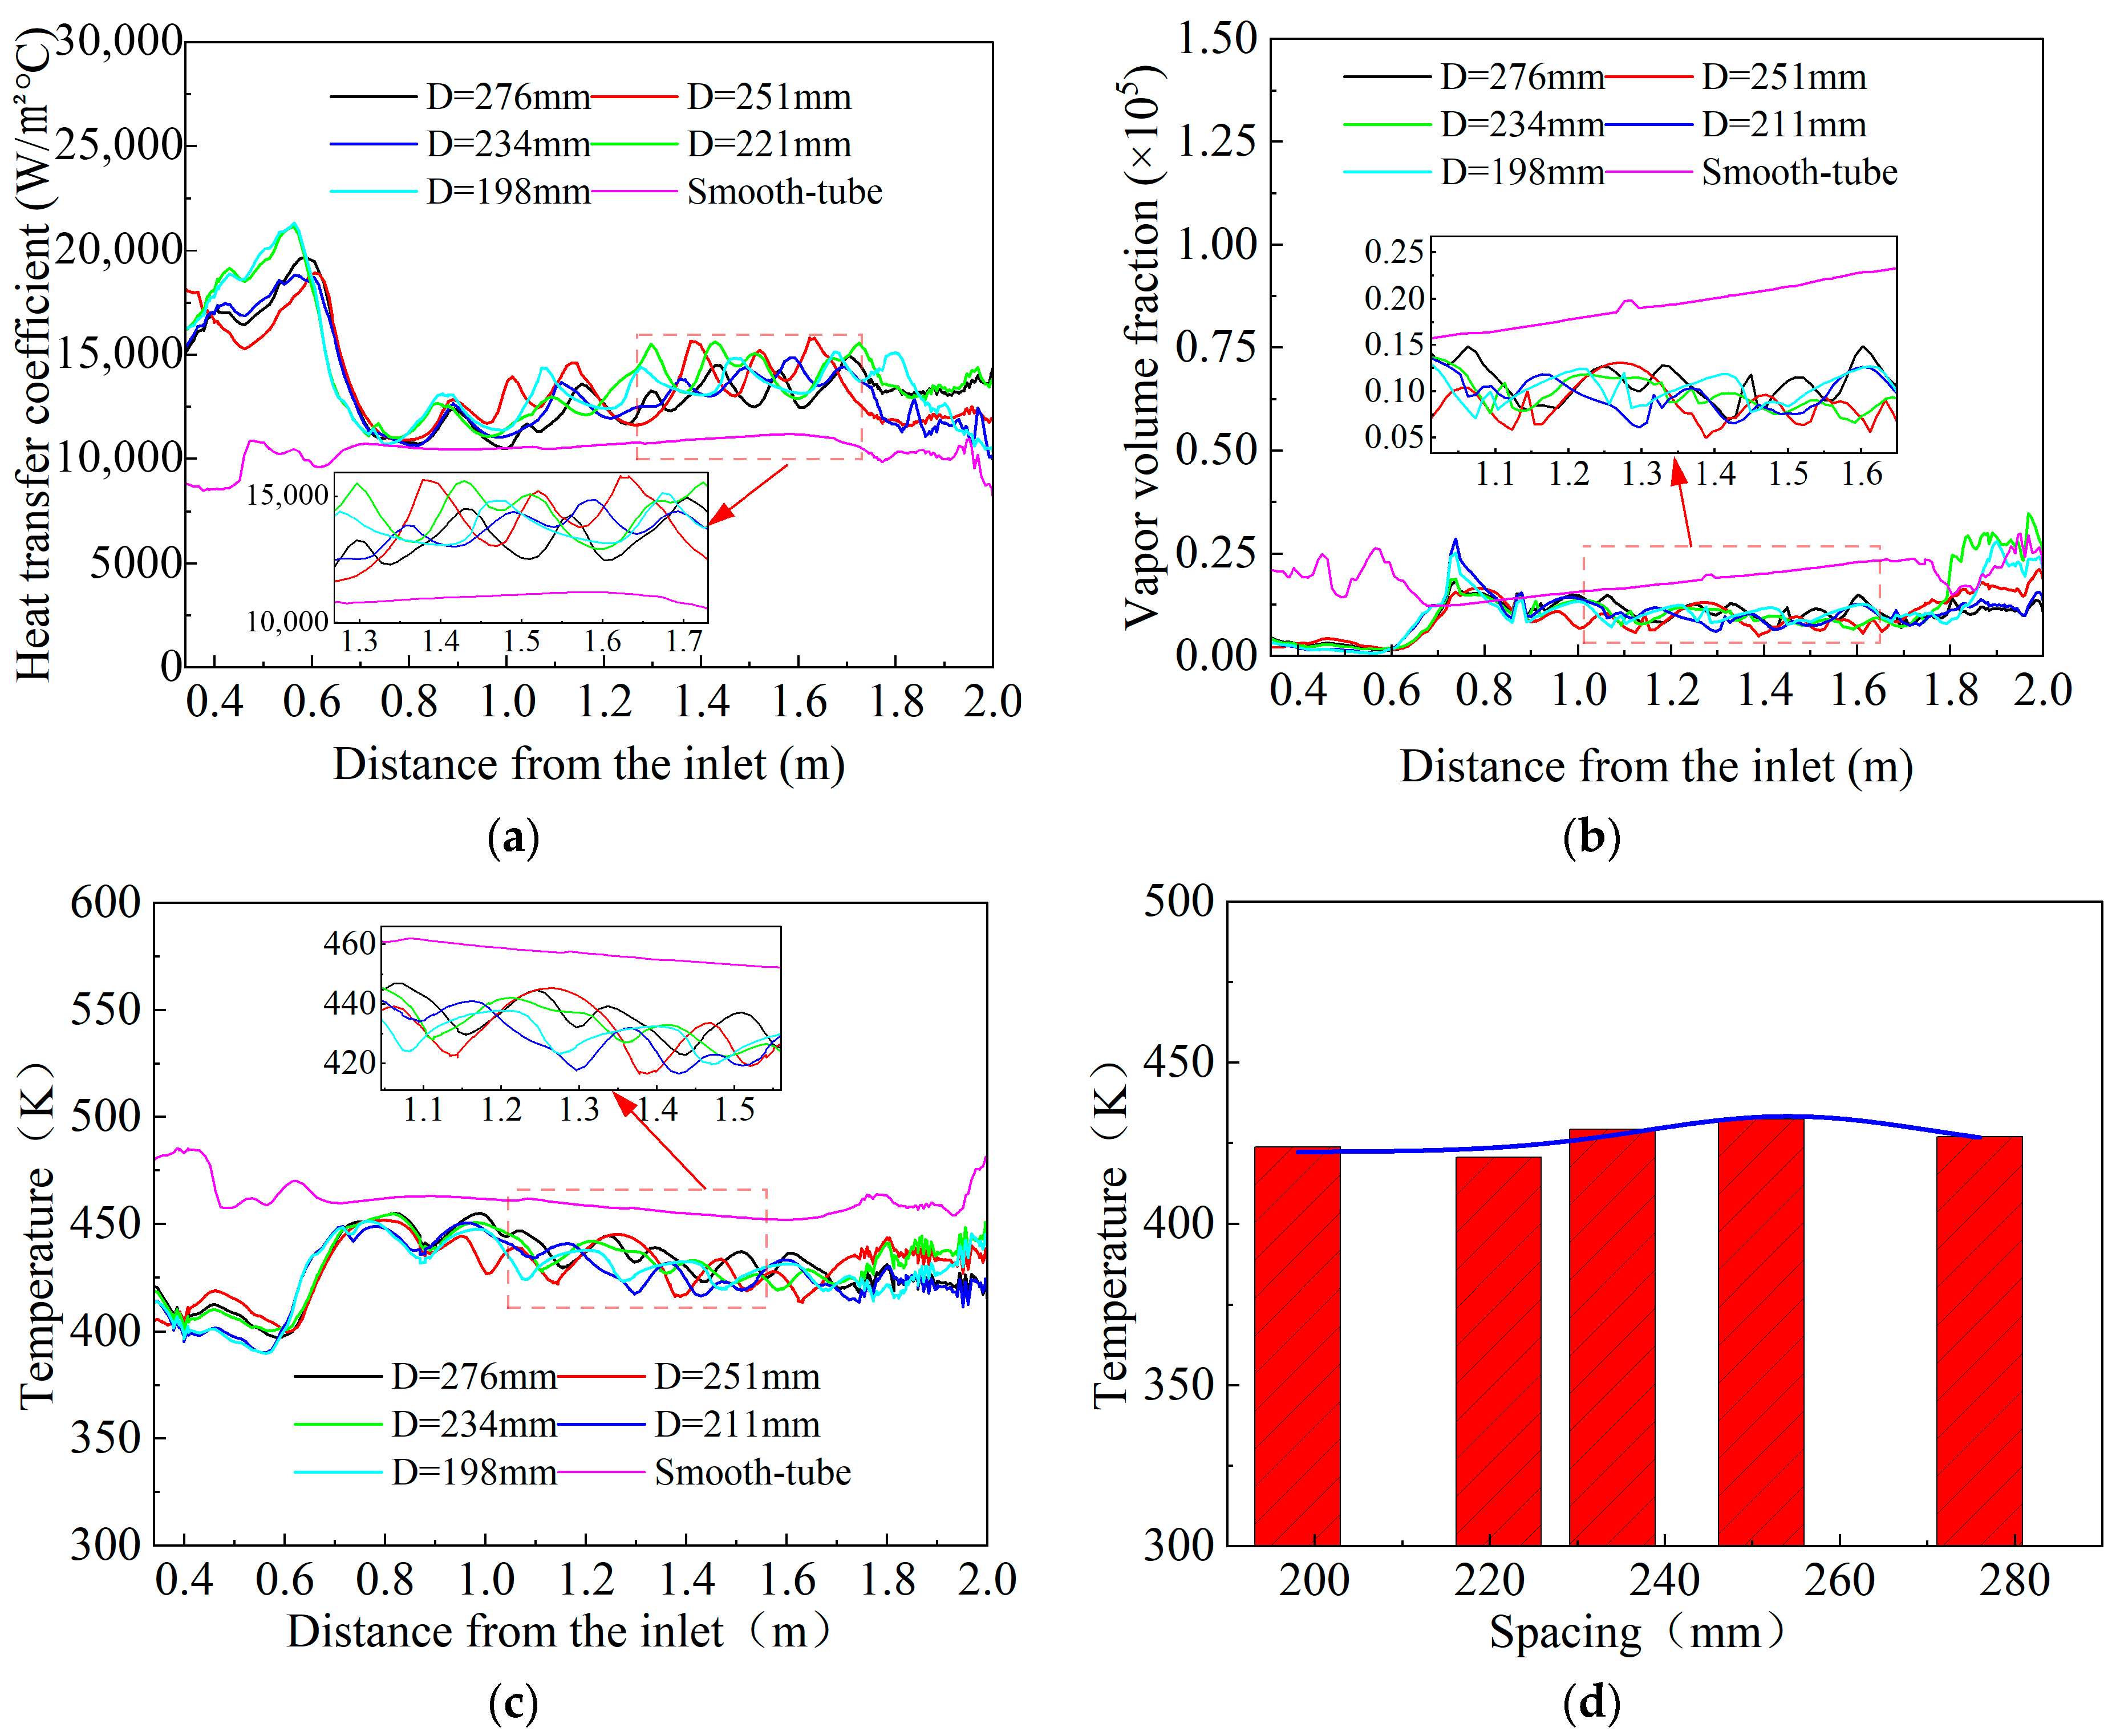
3.4. Analysis of the Effect of S Pacing (D) on the Cooling Efficiency of Steel Bars
Figure 10 illustrates the trends of the heat transfer coefficient, vapor volume fraction, and temperature with varying corrugated tube spacing. Between 0.6 m and 1.6 m from the inlet, the heat transfer coefficient exhibits wavy fluctuations due to the corrugations, generally increasing first and then decreasing as the pitch decreases. Intense turbulence generated at the inlet annular gap around 1400 mm has minimal impact on the flow field within the corrugated tube. As a result, the flow disturbance from the inlet region has little effect on the corrugated tube flow, and the water vapor volume fraction remains relatively stable throughout. Compared to the basic smooth tube at the same flow rate, the designed corrugated tube increases the Nusselt number by 16%, 53%, 50%, and 11% for D = 251 mm, 234 mm, 211 mm, and 198 mm, respectively. For D = 276 mm, the Nusselt number decreases by 8%, mainly due to the excessive distance between the large wave troughs, which weakens turbulence enhancement. Using the Nusselt number of the smooth tube as a benchmark, the normalized Nusselt number of the corrugated tube under the study conditions exceeds 1 in four cases, reaching a maximum of 1.8. This improvement is primarily attributed to the variation in turbulence frequency induced by the spacing
D.
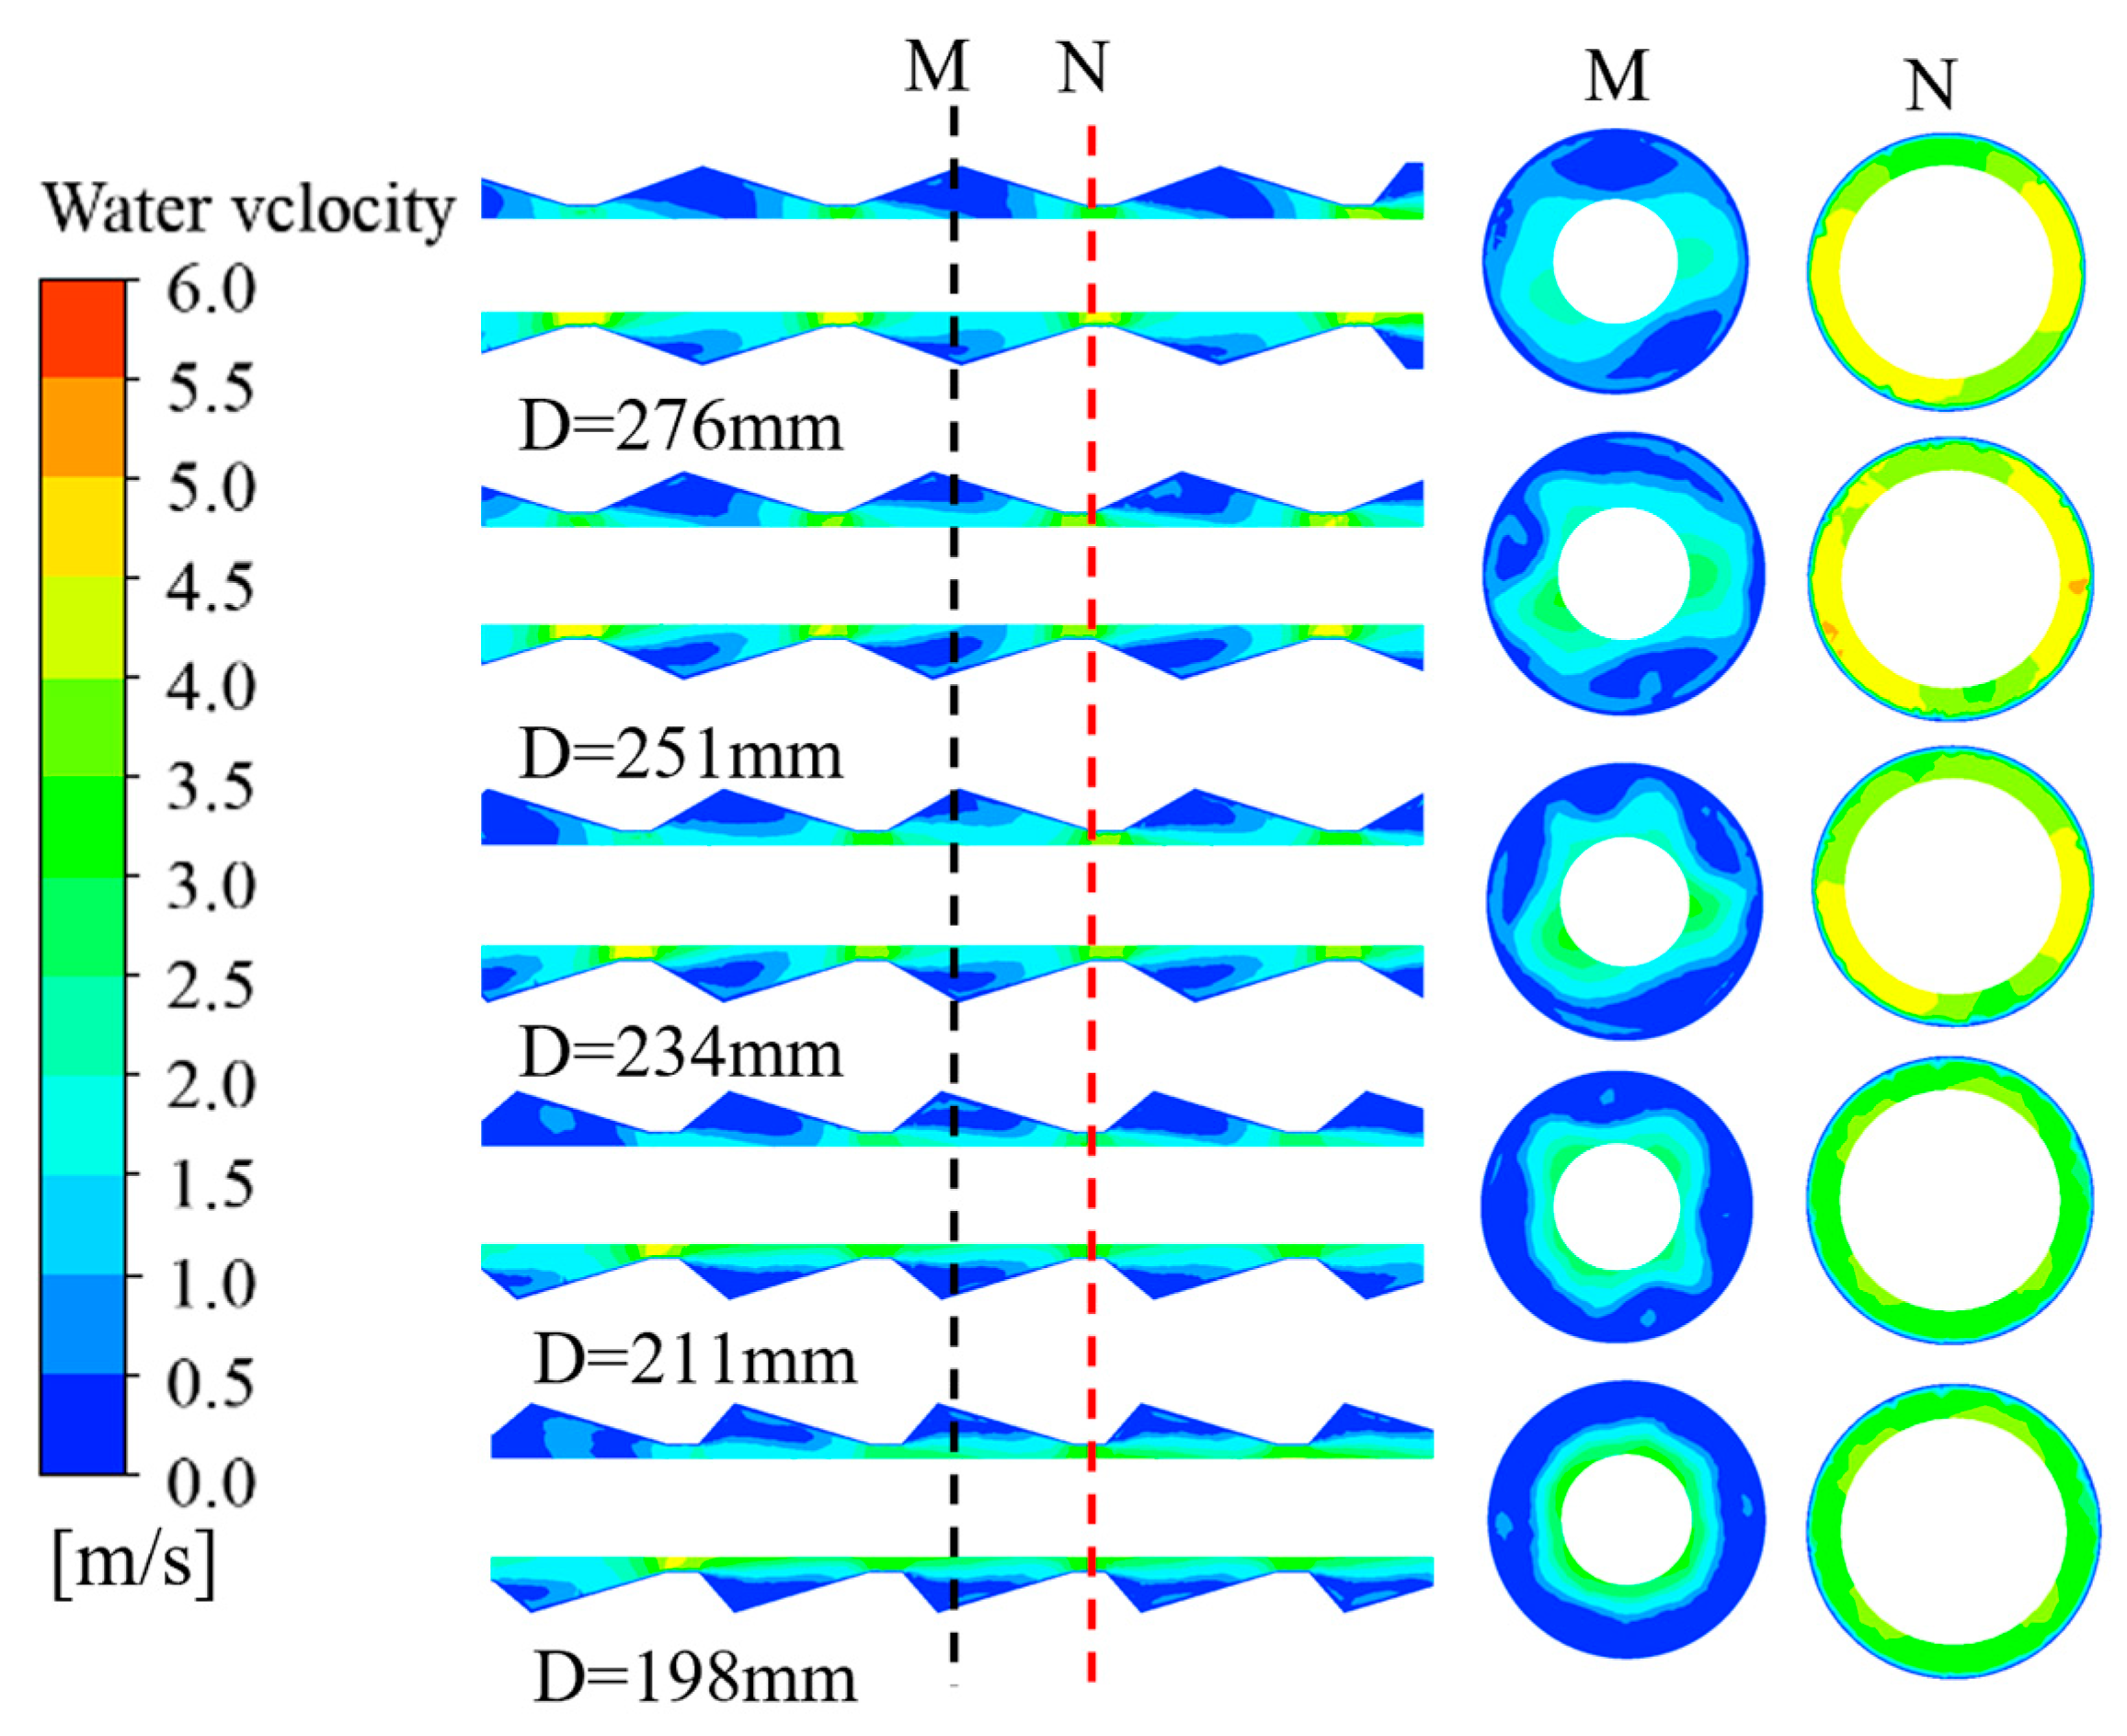
Figure 11 shows velocity contour plots of cooling water flow fields for different spacings (
D). At position M, the velocity contours display a lobed pattern, indicating higher shear velocity and stronger disruption of the vapor film on the steel bar surface. For D = 276 mm and D = 251 mm, although the cooling water velocity is relatively high in the contraction section, it remains low near the junction between the expansion and contraction sections. In the second corrugation structure, the velocity gradually increases, resulting in weaker disruption of the vapor film on the steel bar surface.
3.5. Analysis of Orthogonal Simulation Results
Based on the study of the maximum inner diameter (
A), minimum inner diameter (B), taper length (
E), and spacing (
D) of the corrugated tube, the selected values for maximum inner diameter A are Φ203 mm, Φ233 mm, and Φ273 mm; for minimum inner diameter B, Φ130 mm, Φ150 mm, and Φ160 mm. Since the taper length has minimal impact on temperature when other variables remain constant,
E is set as 0.6 times
D [
29]. The spacing
D values chosen are 198 mm, 211 mm, and 234 mm. Based on the influence analysis of individual parameters, an orthogonal simulation design was conducted to investigate the combined effects of multiple corrugated tube structural parameters on the heat transfer performance of a steel bar with a diameter of 100 mm. This approach identified the optimal parameters set for maximum heat transfer efficiency. The orthogonal simulation design is summarized in
Table 3.
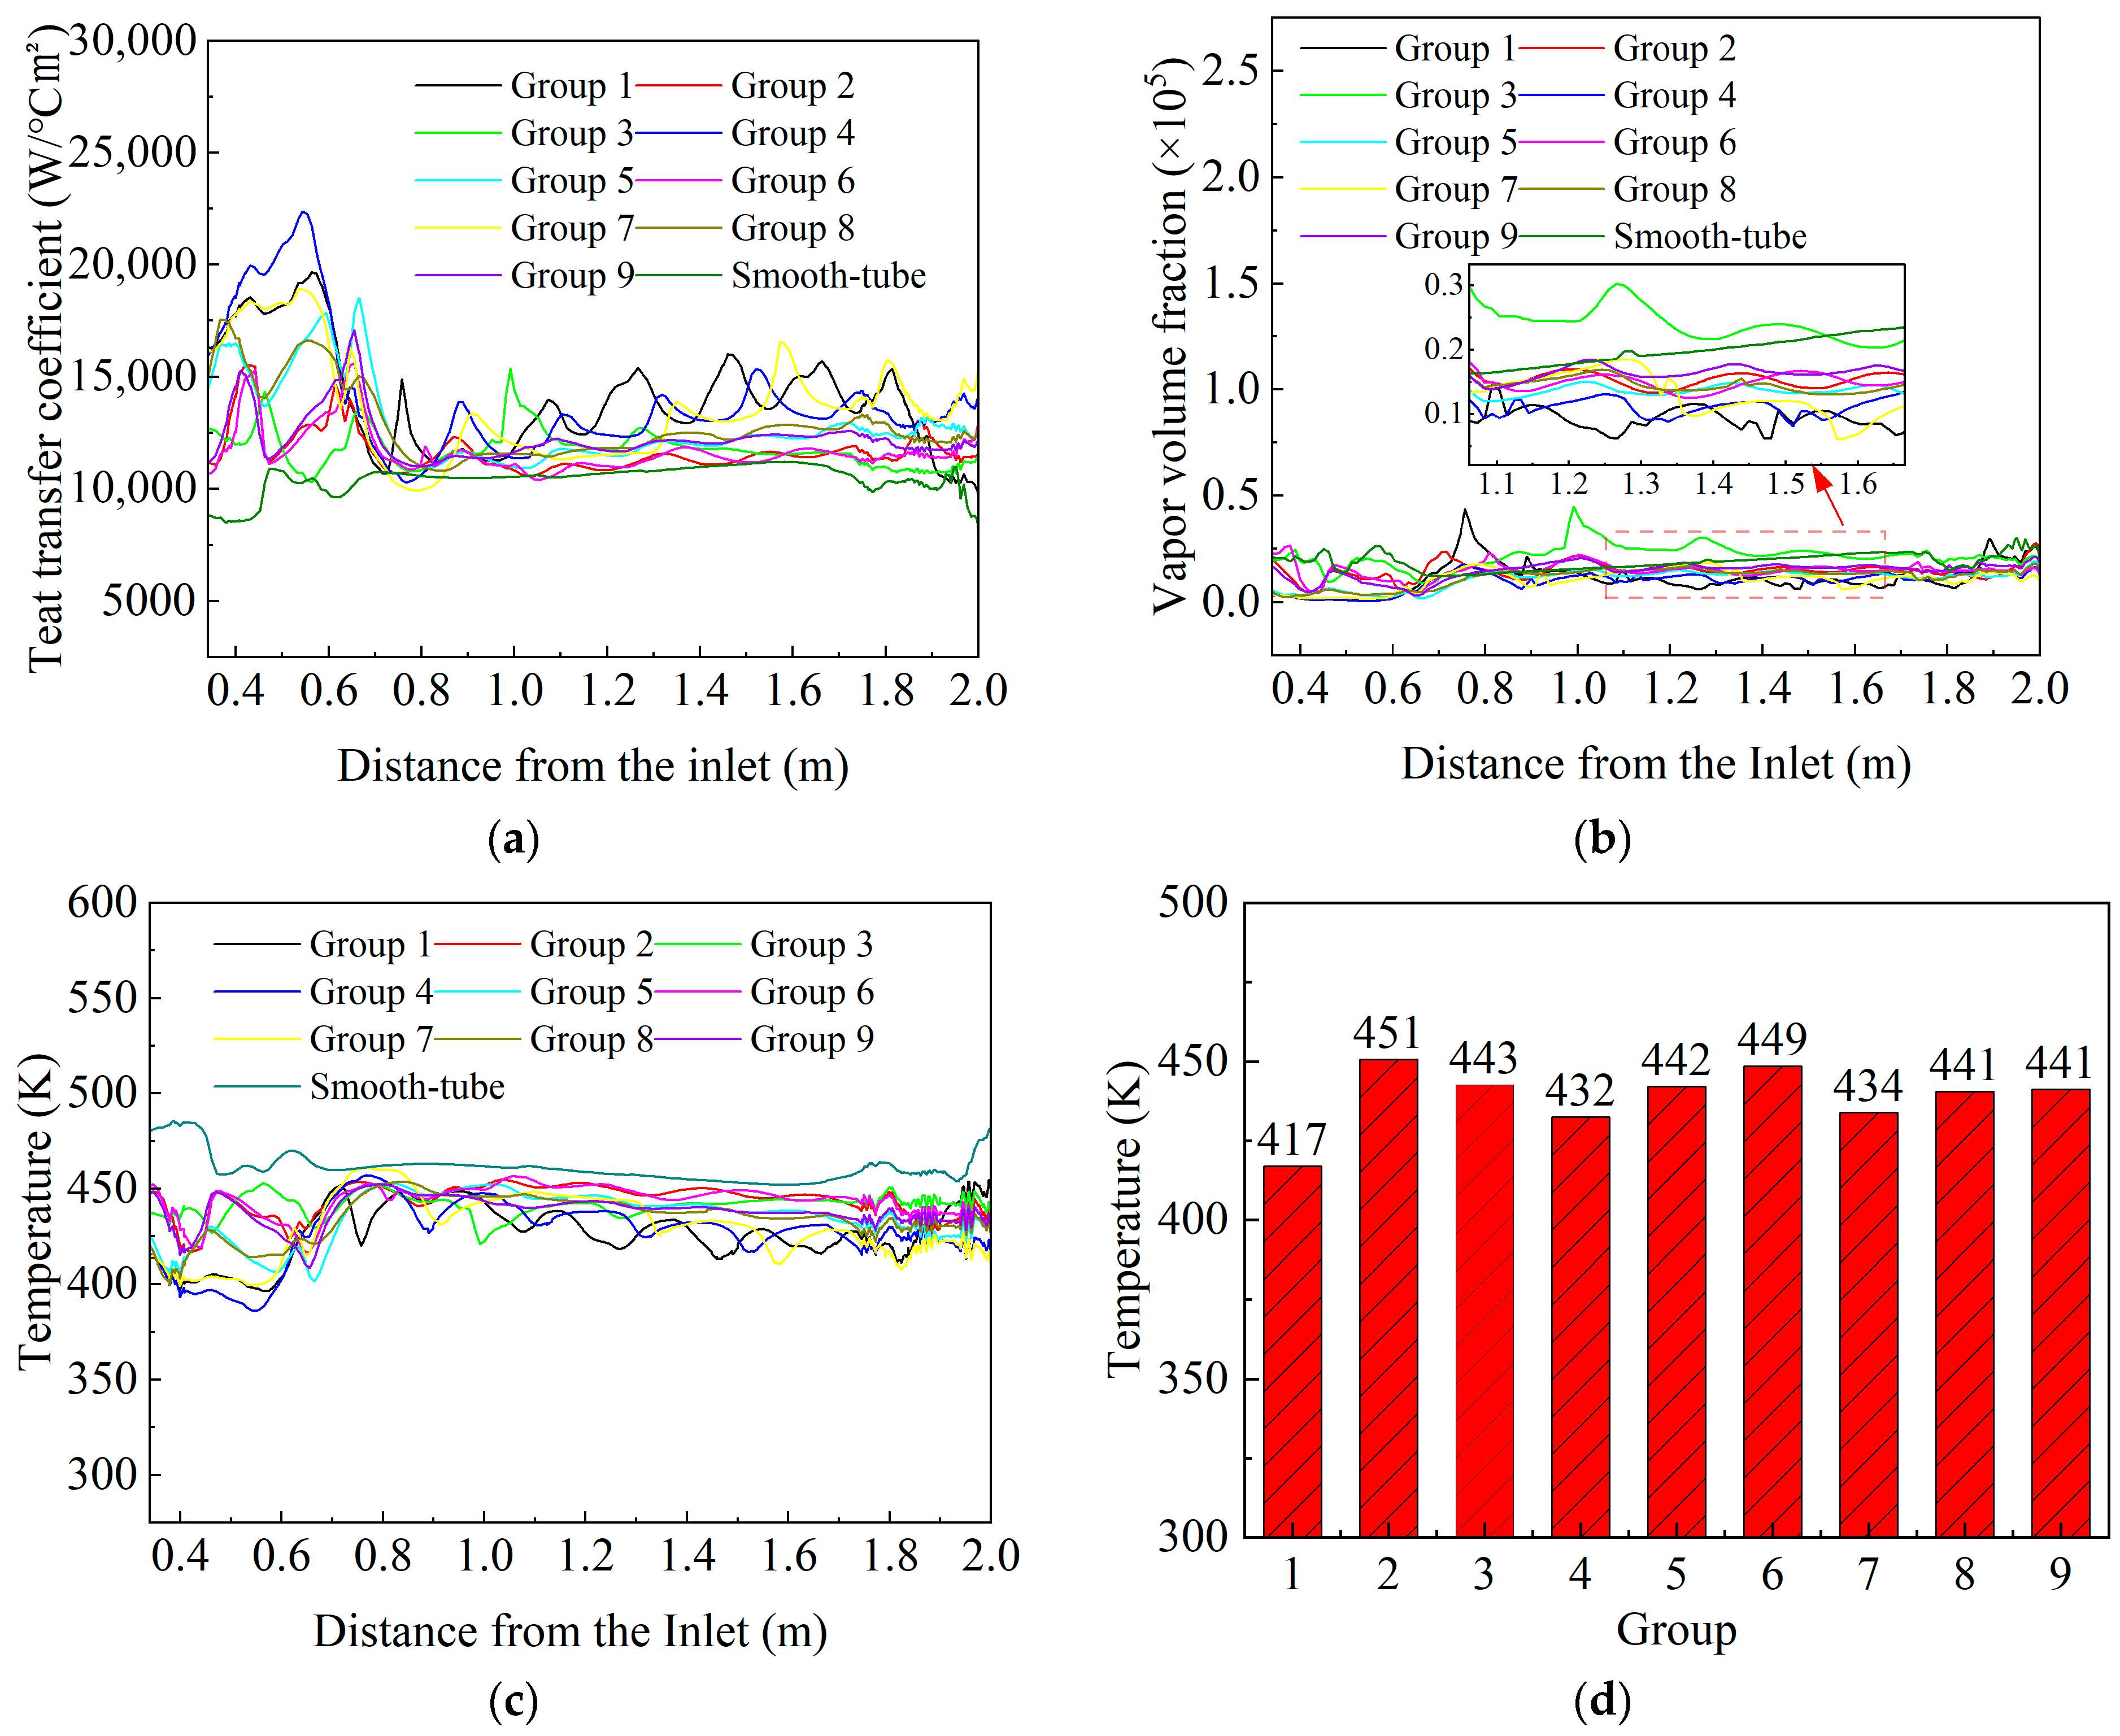
Figure 12 shows the variation trends of heat transfer coefficient, vapor volume fraction, and temperature under nine different corrugated tube parameter sets. When the minimum inner diameter
B is ∅130 mm, the average surface temperature of the rod material decreases by 20 K compared with
B values of ∅150 mm and ∅160 mm. The minimum inner diameter
B has the greatest influence on the cooling efficiency of the rod material. In the designed orthogonal simulation, three factors and their corresponding level combinations were considered, resulting in a total of nine simulation sets. Comparing the heat transfer performance of different combinations reveals that the first set of solutions performs best, improving heat transfer by approximately 65% compared with the benchmark smooth tube. It also surpasses the results of the other simulation groups. This indicates that the combination more effectively enhances turbulence and promotes convective heat transfer, making it the optimal structural parameter set in this study. The best parameters for the cooling efficiency of a bar with a diameter of Φ100 mm are A = Φ203 mm, B = Φ130 mm, and D = 198 mm.
4. Experimental Validation
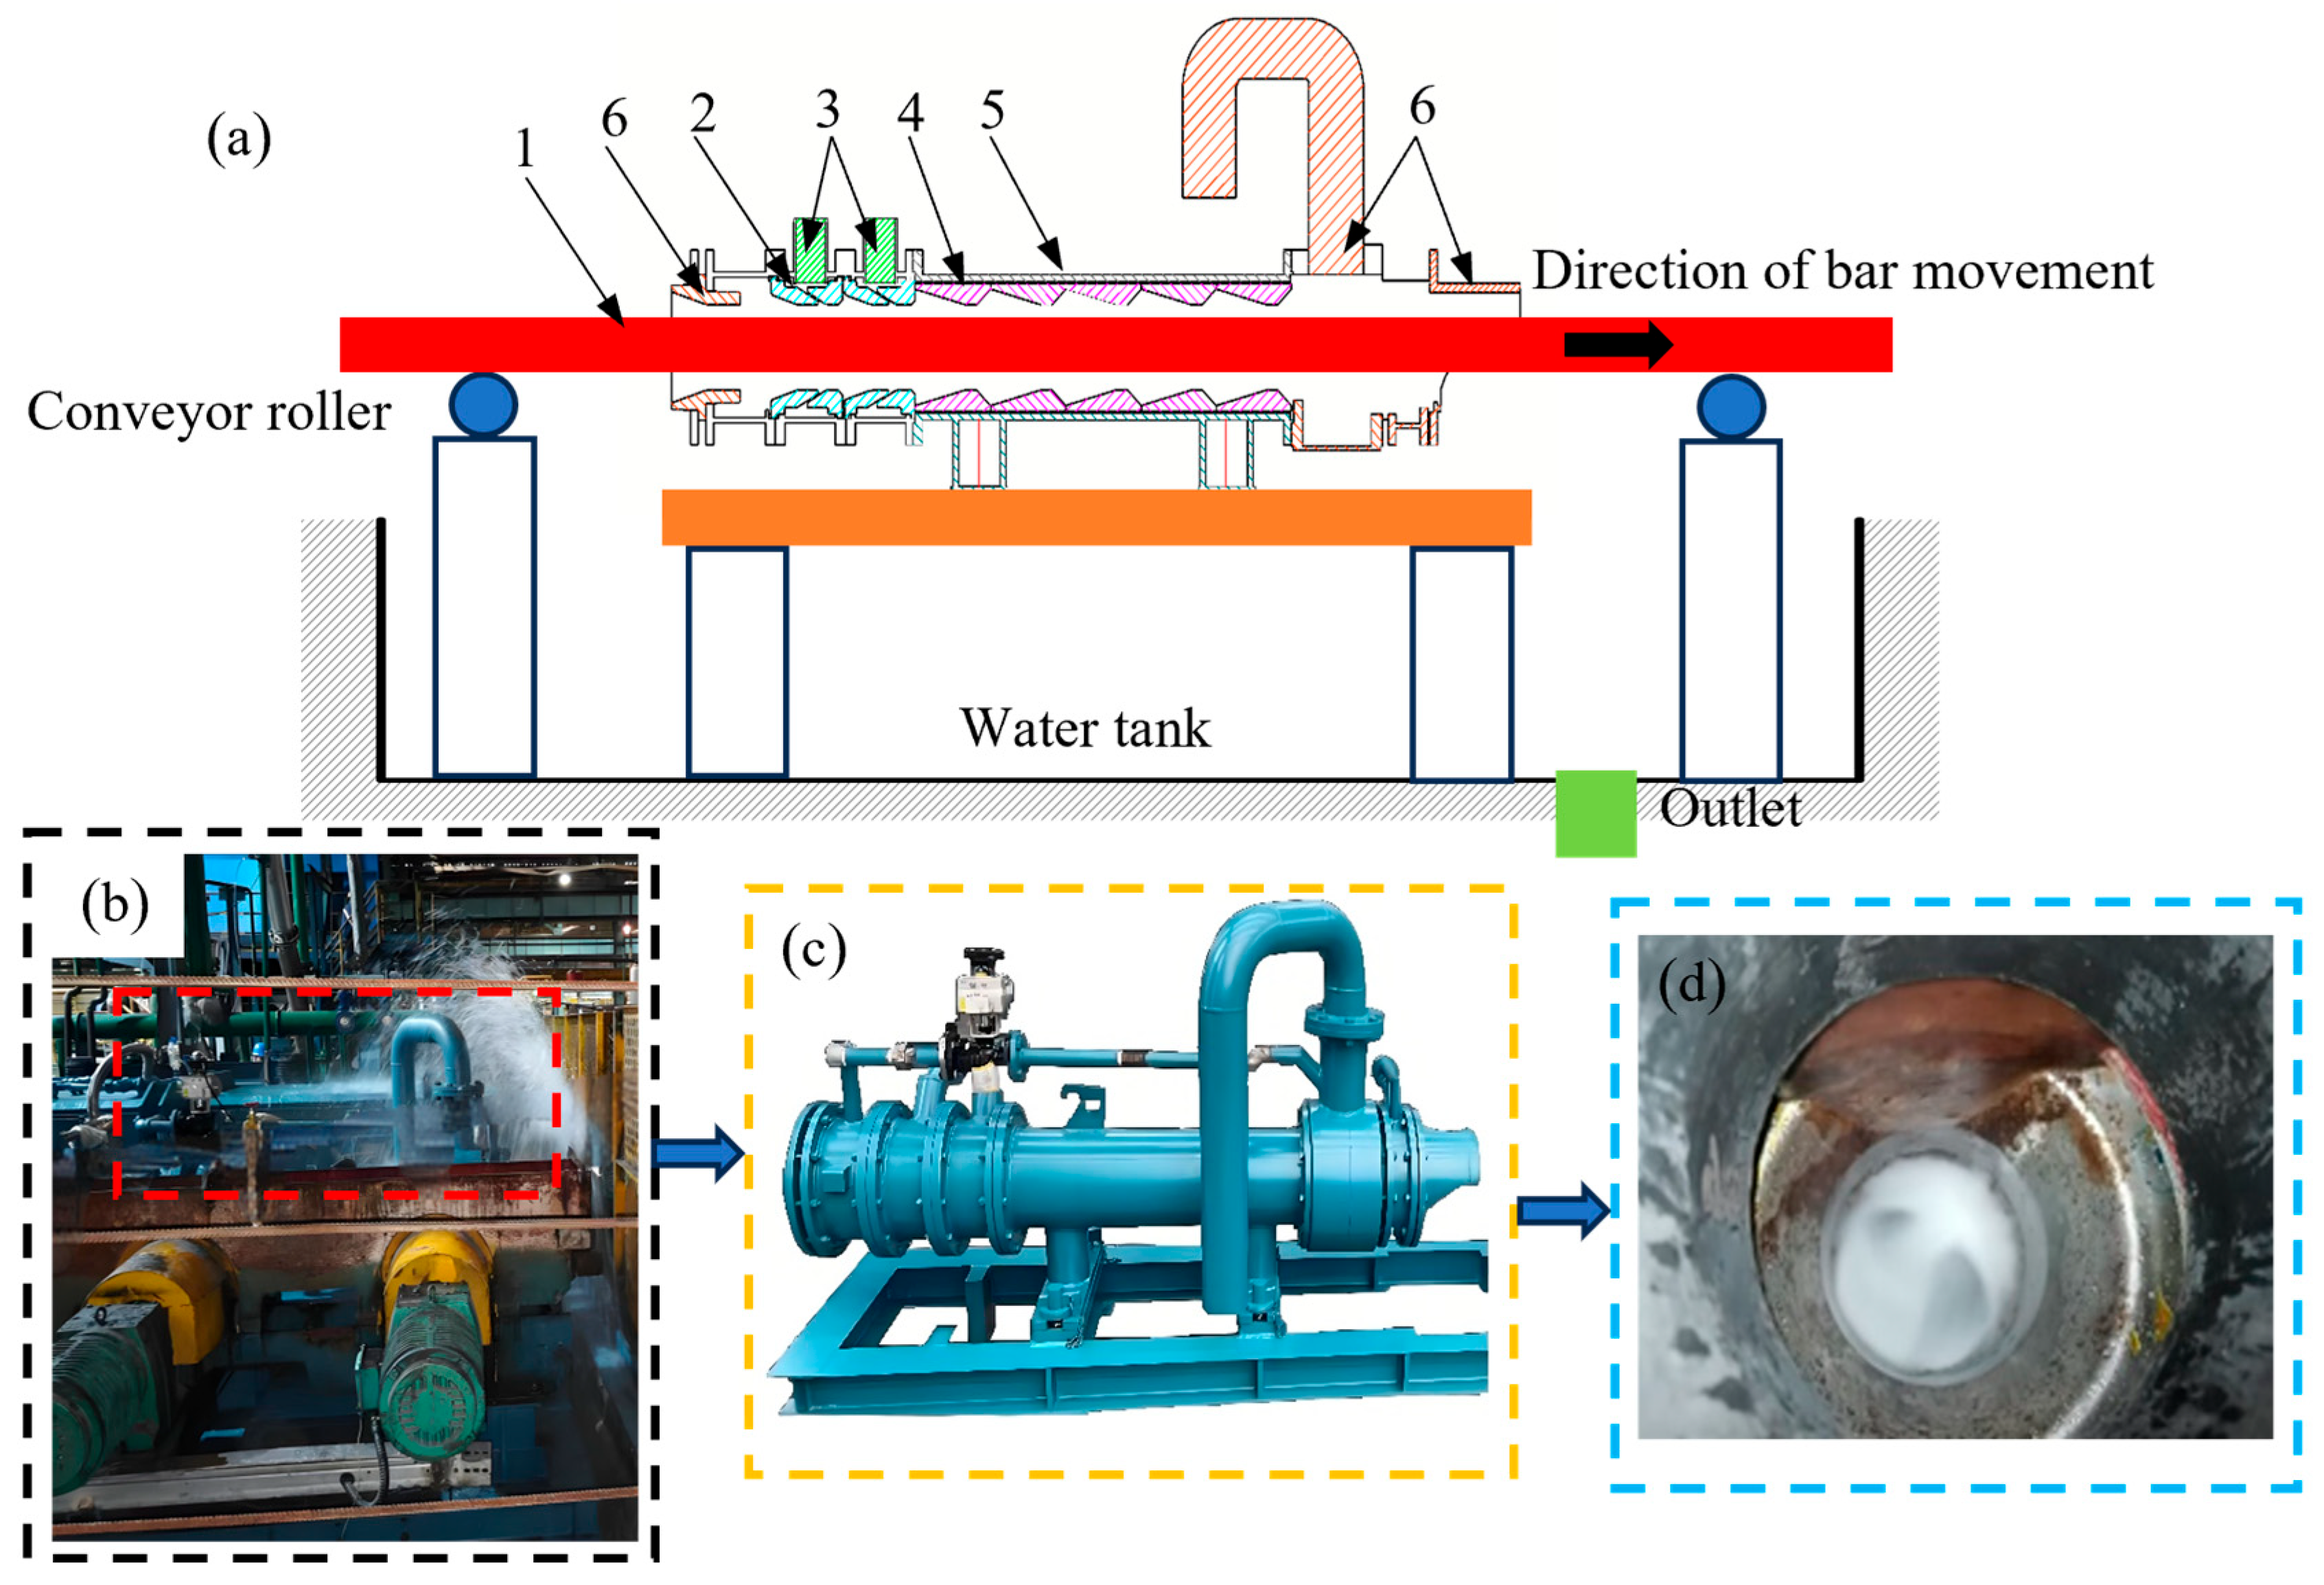
Based on the simulation analysis, five corrugated tube units were assembled and installed in a Tempcore cooler. Steel bars with a diameter of Φ100 mm were produced using the Tempcore process to validate the accuracy of the simulation results and the rationality of the corrugated tube structural design. The specific parameters of the corrugated tubes were A = Φ203 mm, B = Φ130 mm, E = 132 mm, and D = 198 mm, as shown in
Figure 13.
The experimental platform consists of a Tempcore cooler, as shown in
Figure 13, including the following components: 1—steel bar, 2—inlet water port, 3—inlet guide vane, 4—intermediate tube, 5—corrugated tube, and 6—outlet. The experimental procedure primarily involves supplying cooling water through the inlet water port, where it is sprayed onto the steel bar surface via an annular gap. The cooling water then accelerates the steel bar’s cooling through the corrugated tube. After natural air cooling on the cooling bed, the tempered martensite content of the cooled steel bar is measured and compared with the martensite content predicted by simulation.
The local temperature of the steel bar is determined from the heat transfer coefficient. The resulting temperature distribution along the steel bar is then used to estimate the volume fraction of tempered martensite (
VM). To validate the accuracy of the simulation model developed in this study, the martensite regions predicted by the thermal model are compared with the experimental results.
The 100 mm steel bars used in this study contain 0.43% carbon and 0.65% manganese, with the calculated martensite start temperature Ms of 613 K.
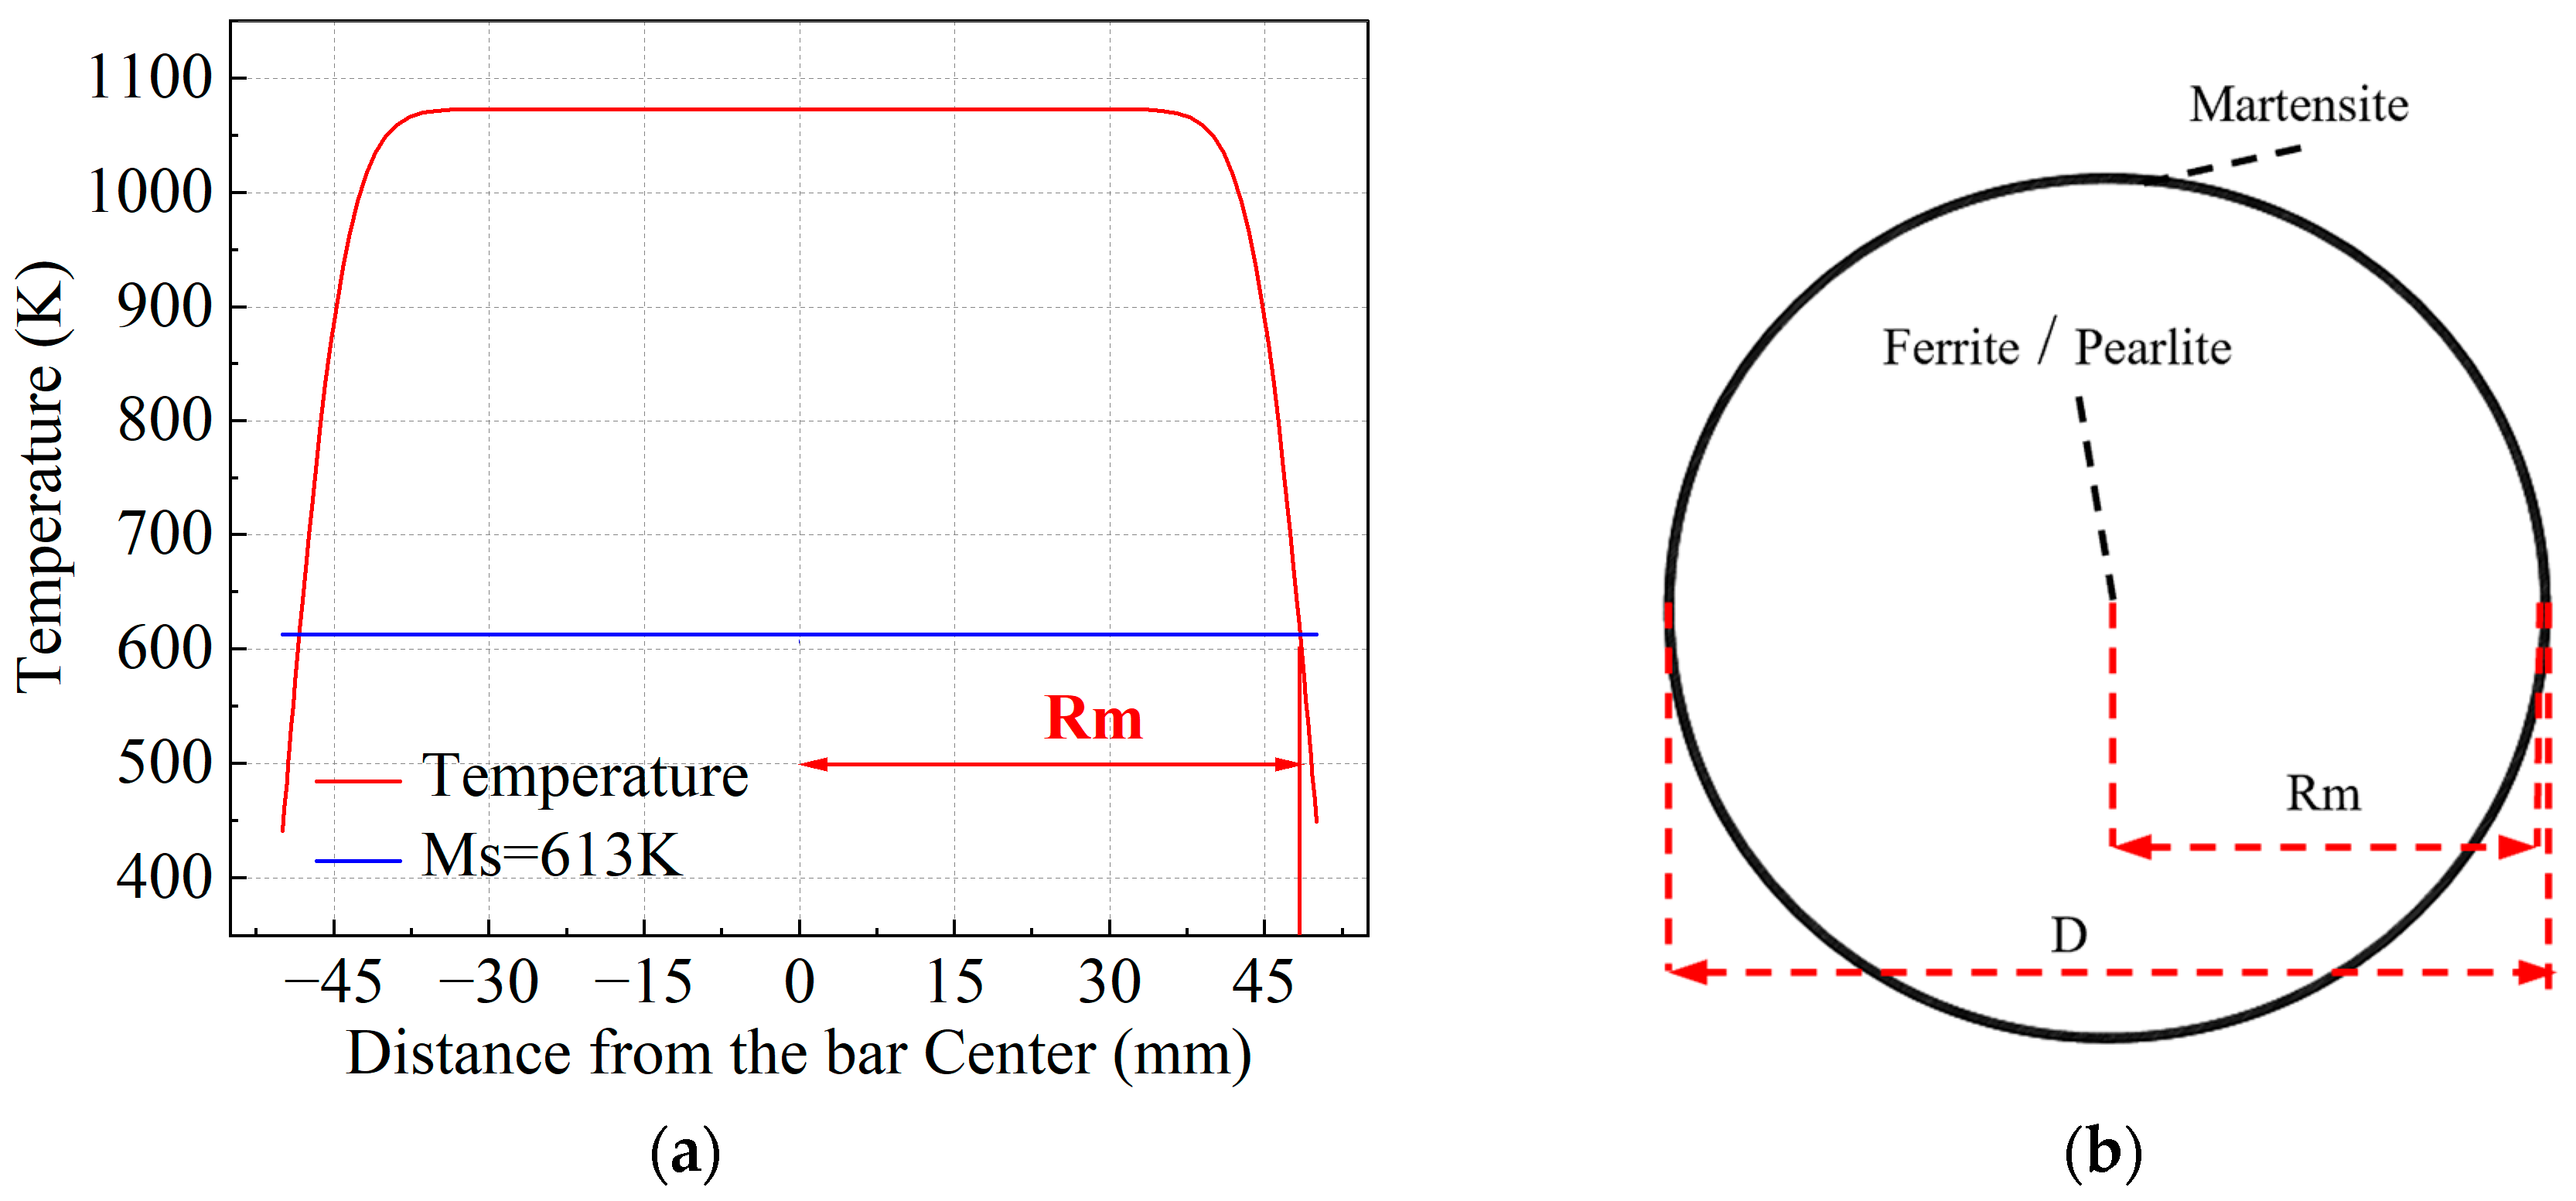
The volume fraction of tempered martensite (
VM) was predicted using the following equation based on the temperature distribution of the steel bar:
D: Steel bar diameter (mm); VM: Volume fraction of martensite; RM: Distance from the martensite boundary to the bar center.
RM is defined as the boundary point where the temperature drops to the martensite start temperature of 613 K.
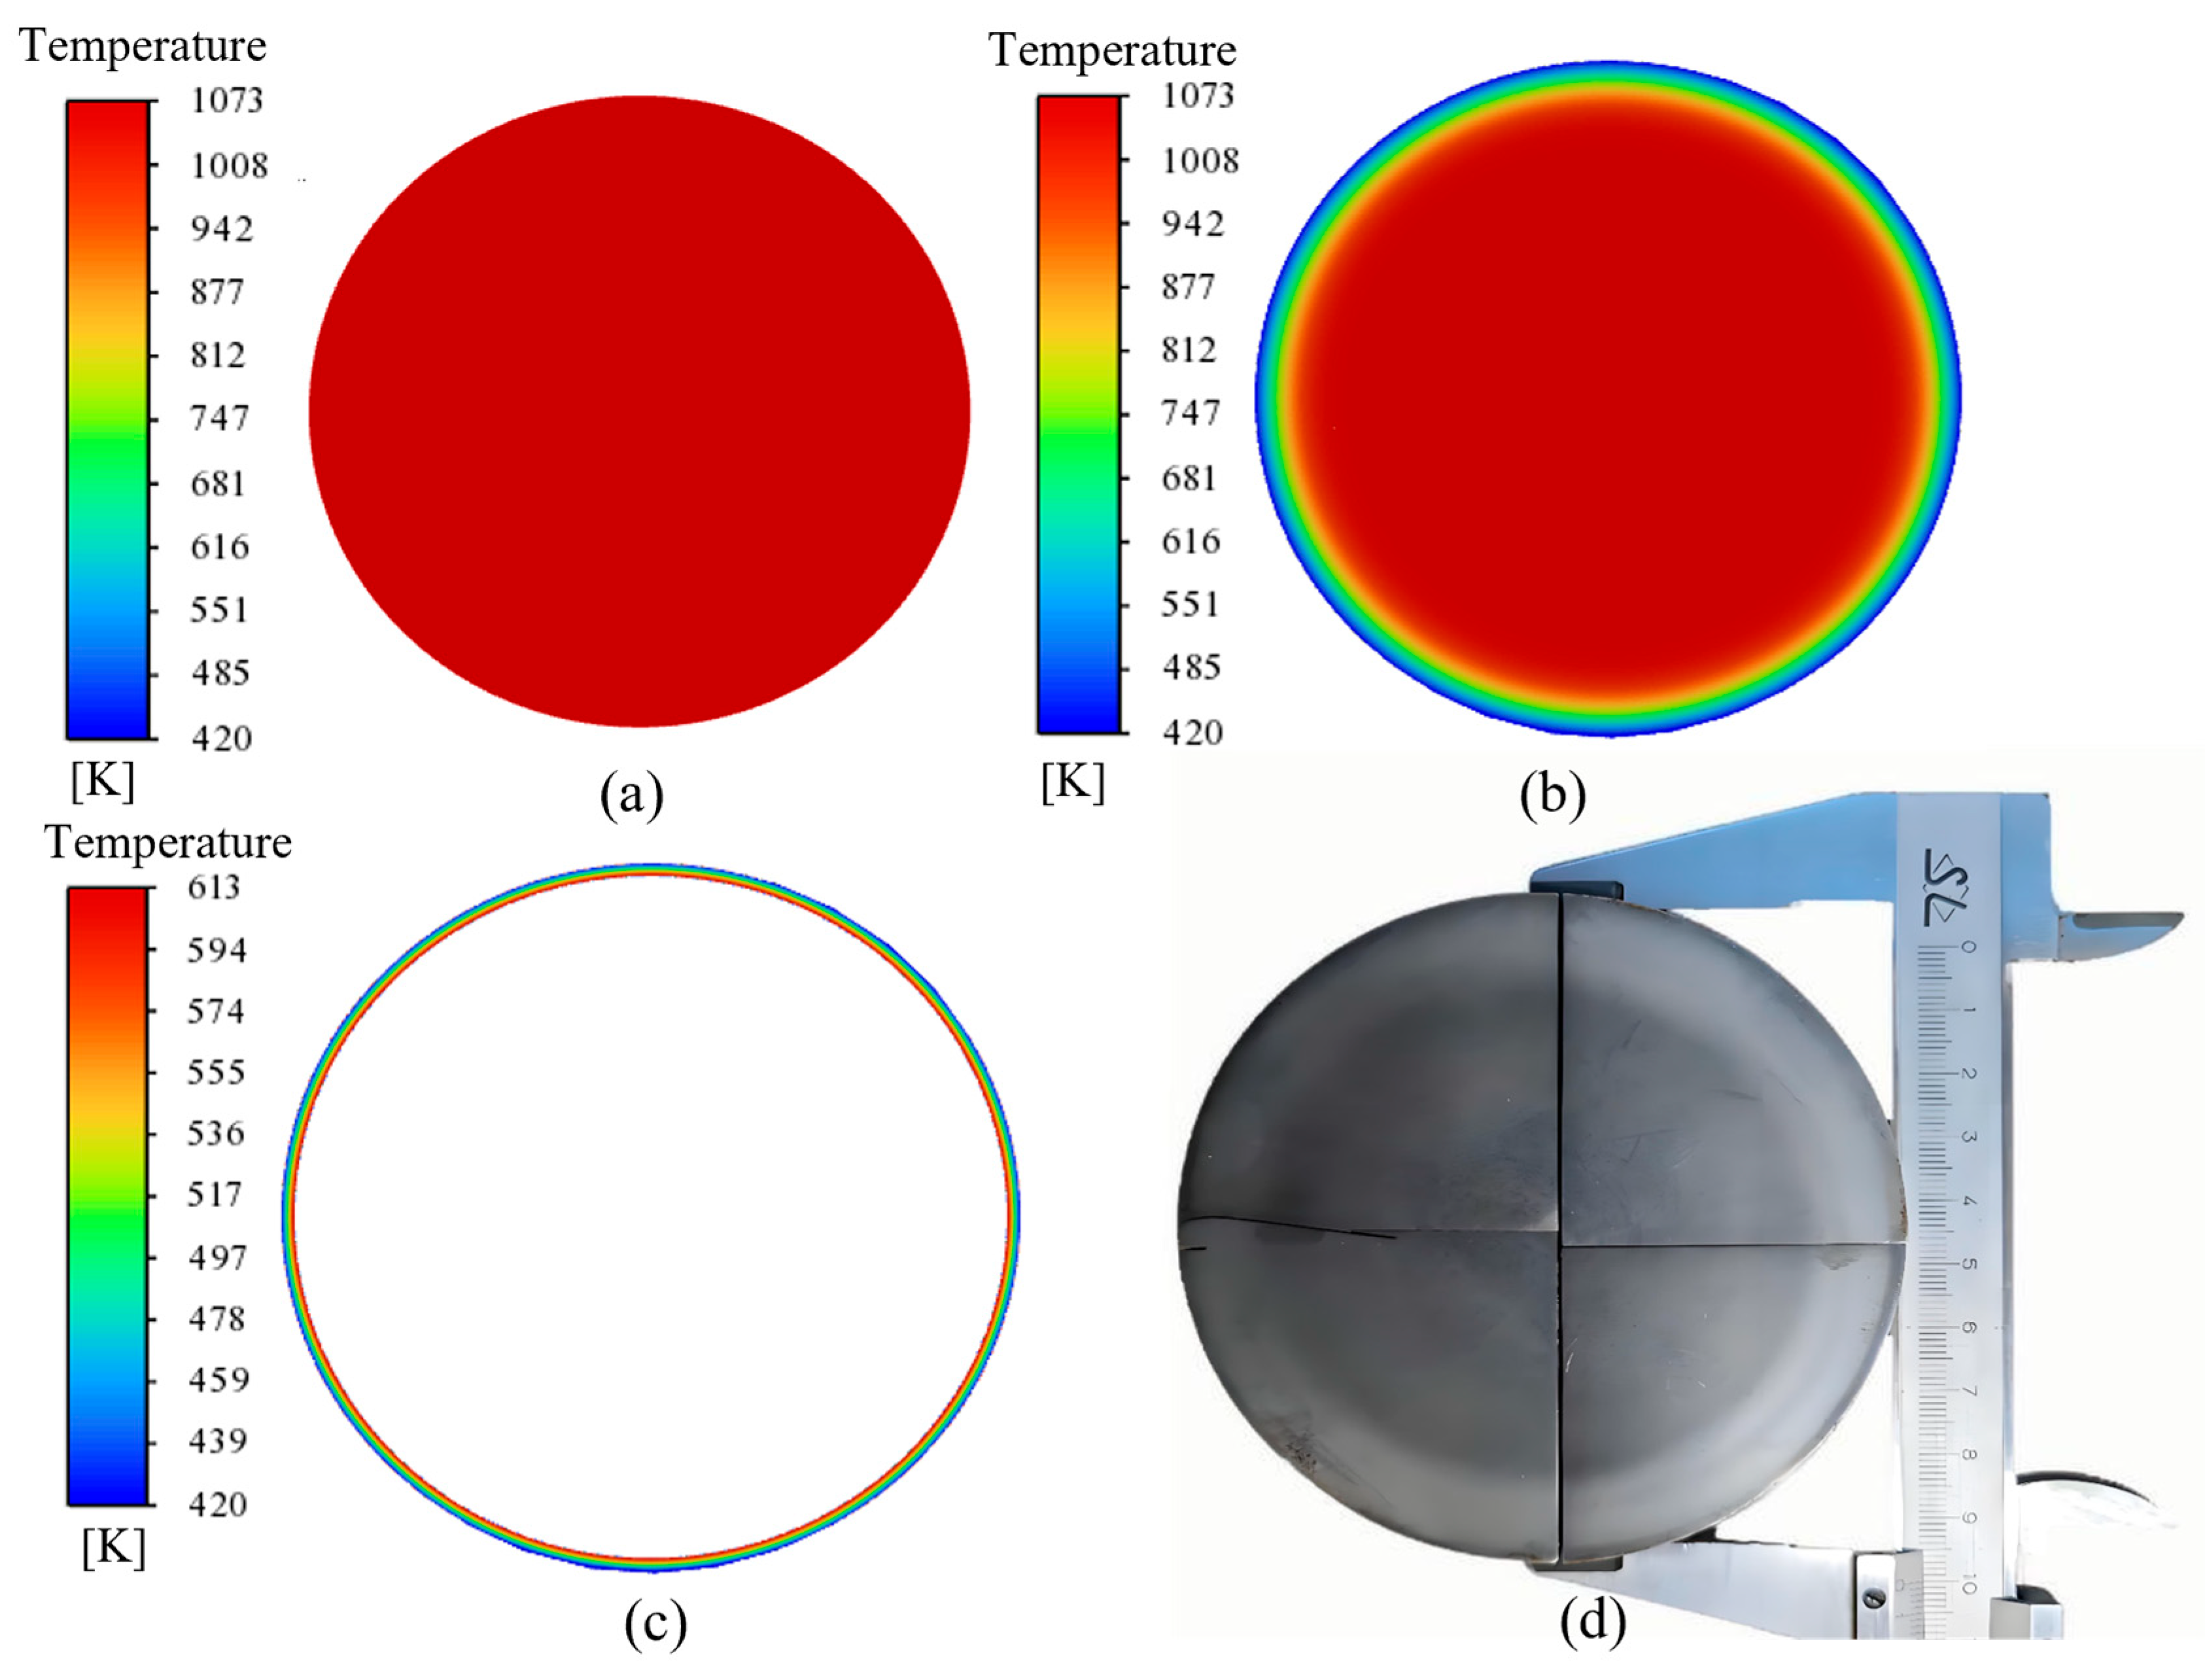
Figure 14 illustrates the continuous temperature distribution after rapid cooling of the steel bar, which is used to validate the determination of Rm by the thermal model.
Figure 15 shows the interface temperature changes of the steel bar from the start to the completion of rapid cooling within the Tempcore cooler, along with the predicted tempered martensite layer used to validate the simulation. In the simulation, the distance from the point where the steel bar temperature reaches 613 K to the bar edge is 2.0 mm. The thickness of the tempered martensite layer after cooling is 1.66 mm. The predicted martensite boundary radius (
RM) from simulation and experiment are 48.0 mm and 48.4 mm, respectively.
The volume fractions of tempered martensite (VM) obtained from the simulation and experiment are 7.8% and 6.3%, respectively, confirming the accuracy of the simulation results. This discrepancy primarily arises from variations in martensite thickness due to uncertainties in sample preparation and measurement. Secondly, the model involves several assumptions, including the neglect of axial heat conduction, the accuracy of the CFD mesh, and the use of the RPI boiling model.
Figure 16 presents the tempered martensite boundary microstructure obtained from the post-rolling heat-core tempering and cooling experiment of the steel bar. A distinct tempered martensite boundary layer is observed on the outer surface of the bar section. The experiment also identifies typical microstructural features, including tempered martensite (Region Ⅰ), bainite (Region Ⅱ), and a mixed ferrite–pearlite microstructure (Region Ⅲ).
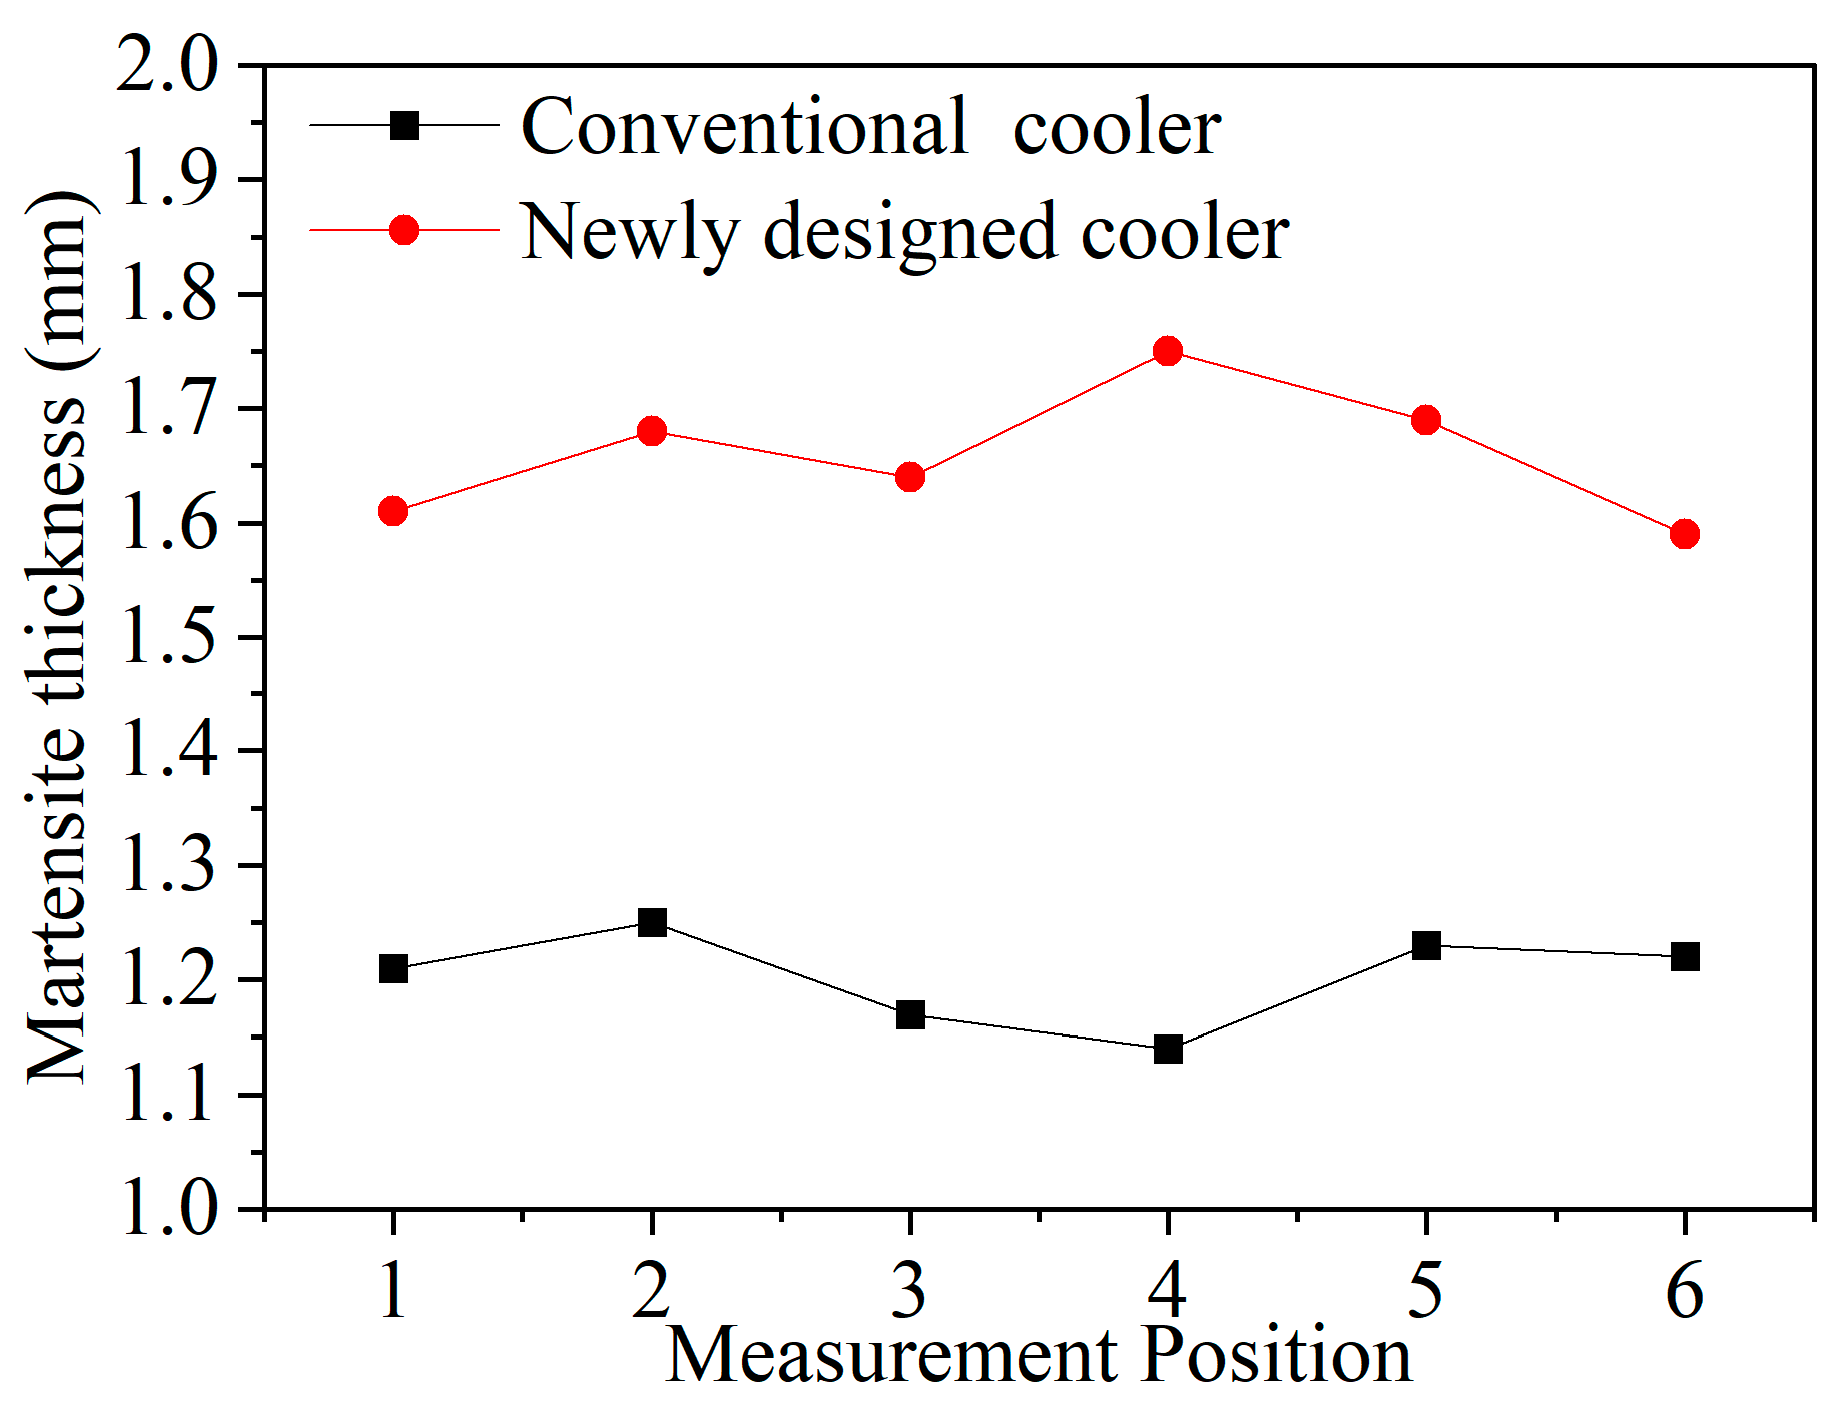
Figure 17 presents the martensite thickness measured at 60° intervals, with average values calculated. The mean thicknesses for the traditional cooler and the newly designed cooler are 1.20 mm and 1.66 mm, respectively. The deviation in martensite thickness is primarily due to local errors during metallographic sample preparation, which affect the accuracy of microscopic observation, as well as environmental influences after cooling.
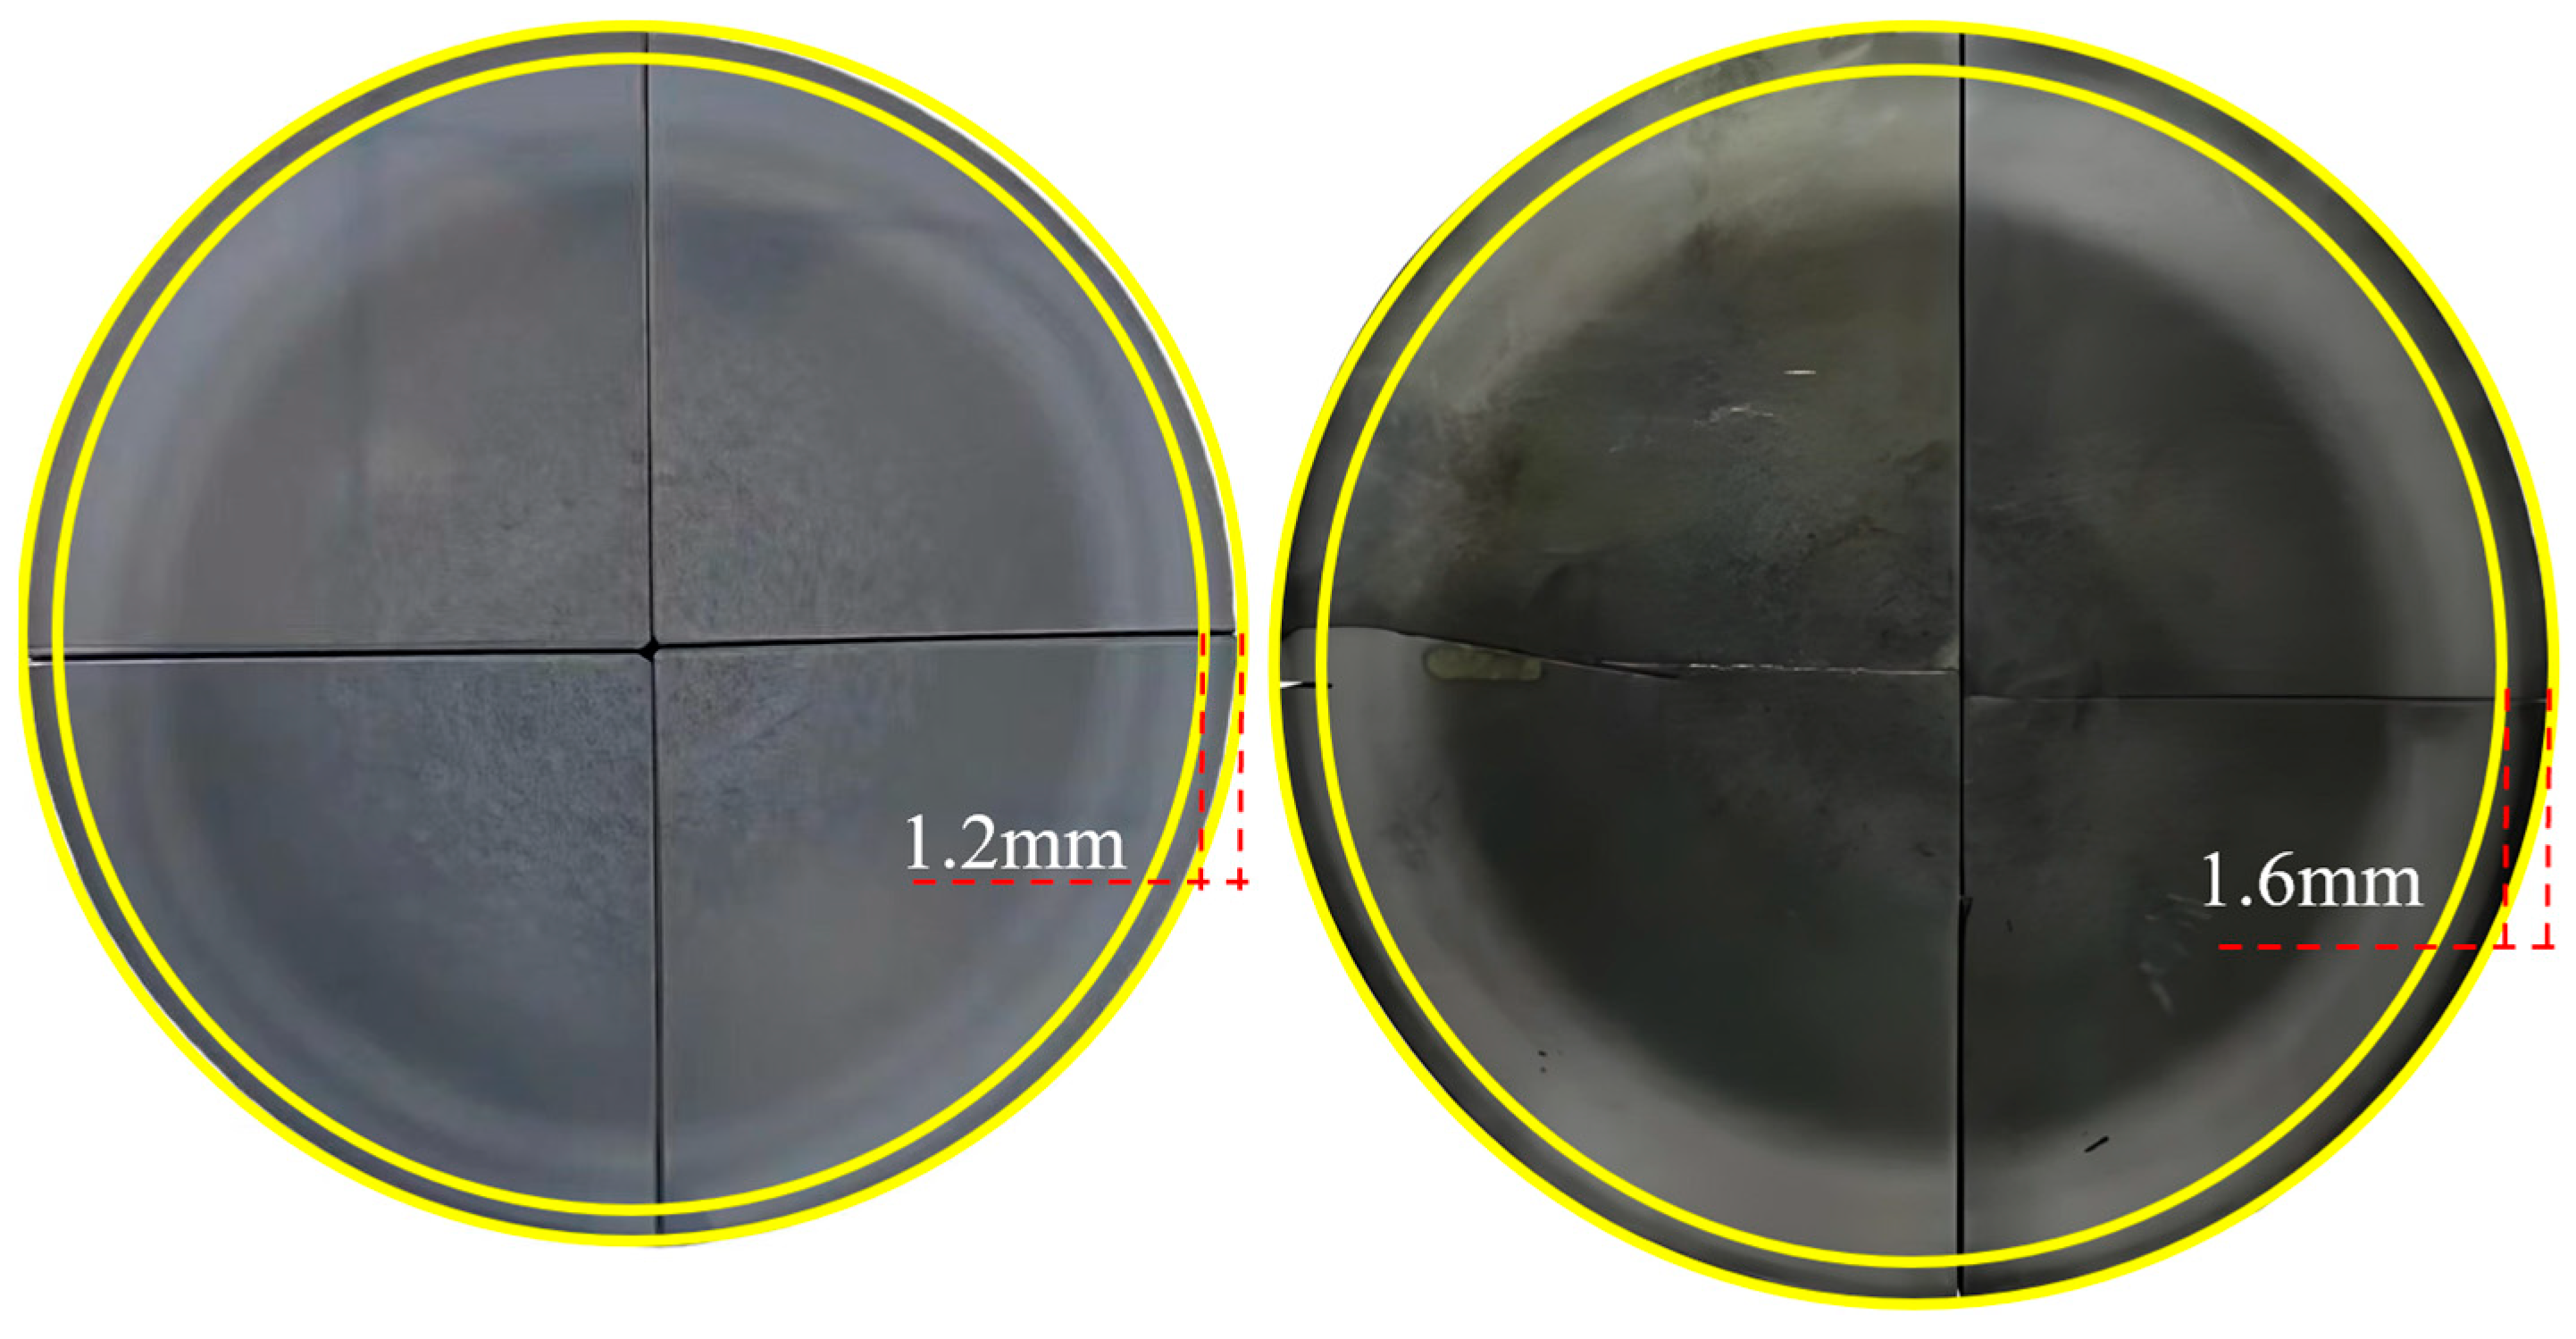
Figure 18 compares the martensite thickness of steel bars cooled by the conventional and the newly designed Tempcore cooler. The tempered martensite thickness achieved with the new cooler is 1.66 mm, compared with 1.20 mm for the conventional design. With corrugated tube parameters of A = Φ203 mm, B = Φ130 mm, E = 132 mm, and D = 198 mm, the new structure delivers a 38% improvement in cooling performance.
5. Conclusions
This study investigated the effects of corrugated tube structural parameters on the heat transfer characteristics of steel bars in a Tempcore cooler for large steel bars. The finite volume method was employed to analyze the influence of individual corrugated tube parameters on heat transfer behavior. An orthogonal simulation study was conducted to determine the optimal combination of corrugated tube structural parameters for enhanced heat transfer performance, followed by a cooling experiment on steel bars. The main conclusions are as follows:
(1) Based on the principle of mass conservation, the effects of the corrugated tube’s expansion and contraction angles on the Reynolds number were analyzed. Larger angles increase the Reynolds number, thereby enhancing the Nusselt number and improving overall heat transfer performance.
(2) In the simulation of corrugated tube structural parameters, increasing the maximum inner diameter A initially improves heat transfer efficiency before reaching a stable level, with a maximum enhancement of 61%. Increasing the taper length (E) yields a maximum improvement of 58% in the bar’s thermal performance. For the minimum inner diameter B and spacing D, both show an initial increase followed by a decline in heat transfer efficiency, with maximum enhancements of 63% and 53%, respectively.
(3) The optimal bellows structure parameters were deermined through orthogonal simulation: A = Φ203 mm, B = Φ130 mm, E = 132 mm, and D = 198, resulting in a 65% improvement in heat transfer performance. Among these parameters, the minimum inner diameter was identified as a critical factor influencing the heat transfer efficiency of the steel bar.
(4) Experimental results show that the thickness of the tempered martensite layer on the steel bar surface after Tempcore cooling agrees closely with the predictions of the finite element simulation, which validates the accuracy of the numerical model. The martensite volume fraction shows a 38% increase. This confirms the feasibility of using the designed cylindrical corrugated tube to enhance the accelerated cooling of large steel bars in the Tempcore process.
Although this study shows that corrugated tubes can improve cooling performance without increasing the load on the water supply system, several challenges remain for large-scale industrial applications: repeated thermal cycles combined with high-speed water scouring in the Tempcore process, which raise the risk of fatigue damage and corrosion. Future work will focus on transient cooling, structural durability, and the feasibility of scaling up the design for industrial production.
