Article

Study on the Influence of Different Dropper Models in Pantograph–Catenary System on Dropper Load Simulation

1
China Academy of Railway Sciences Co., Ltd., Beijing 100081, China
2
Faculty of Transportation Engineering, Kunming University of Science and Technology, Kunming 650500, China
3
Department of Mechanical Engineering, University of Maryland, Baltimore County, Baltimore, MD 21250, USA
*
Author to whom correspondence should be addressed.
Machines 2025, 13(9), 874; https://doi.org/10.3390/machines13090874
Submission received: 14 August 2025 / Revised: 9 September 2025 / Accepted: 17 September 2025 / Published: 19 September 2025
(This article belongs to the Section Machine Design and Theory)

Abstract

The dropper load directly influences the fatigue mechanism of the high-speed catenary system. A proper dropper model for a pantograph–catenary system can be used to accurately and efficiently investigate this phenomenon. In this work, the influence of different dropper models in pantograph–catenary systems on dropper load simulations is investigated. Based on the Euler beam element, a finite element model-based pantograph–catenary system is formulated, and beam, rod, and spring dropper models are considered in this model. After the validation of the present model, the influence of different dropper models on dropper loads and pantograph–catenary interaction dynamics is studied. The calculation efficiency of different dropper models is also analyzed. Based on the investigation results, different dropper models can accurately simulate the pantograph–catenary interaction dynamics, but the spring model is not as accurate as the beam and rod models for dropper loads, and the calculation time of the beam model is much longer than that of other models. Therefore, the use of a rod dropper model in a pantograph–catenary system is suggested for dropper dynamic analysis.

1. Introduction

The catenary system plays an important role in the high-speed railway system, and it continuously provides electrical power to the high-speed train through the pantograph. In the catenary structure, the dropper connects the contact and messenger wires and lifts the contact wire in the designed shape, which makes it the most important component in the whole pantograph–catenary system [1]. Under the influence of pantograph–catenary interactions, the dropper suffers dynamic loads, and long-term dynamic loads can cause dropper failure (such as dropper fracture) [2,3,4]. The failed dropper heavily influences the stiffness of the local catenary structure and worsens the dynamic characteristics of the pantograph–catenary interaction, which further influences the current collection quality of the high-speed train. Because dropper failure has been found in many high-speed railway lines, to avoid dropper failure and maintain the current collection quality, it is necessary to investigate the dynamic loads of the dropper in a high-speed catenary system.
Many scholars have studied dropper dynamic loads from different perspectives. Liu et al. [2] investigated the failure mechanism of droppers and optimized the structure of the droppers. Liu et al. [3] investigated the fatigue failure laws of droppers under impact loading. In their studies, the load of the dropper was obtained based on the catenary vibration, and the dropper crimping process was then simulated based on the dropper loads. Lee et al. [5] measured the dynamic loads of dropper structures in high-speed railway systems to investigate the fatigue of dropper structures. Pan et al. [6] developed a pantograph–catenary interaction model to investigate the dynamic loads of a dropper, where one dropper is modeled by beam elements and the other droppers are modeled as bi-linear spring elements. A comparison of the droppers at different locations under different vehicle velocities is also performed. Cho [7] developed a pantograph–catenary interaction model with a nonlinear dropper model, and the dynamic responses of the dropper were analyzed after the validation of the whole pantograph–catenary interaction model. Cho et al. [8] further investigated the influence of pre-sag on pantograph–catenary interaction dynamics, where the dropper loads at different locations are considered. Song et al. [9] developed a nonlinear finite element method (FEM)-based pantograph–catenary interaction model to investigate the galloping behavior of a catenary system, where the nonlinear dynamic responses of the dropper are considered.
It can be seen from the above investigation results that the dropper dynamic loads should be investigated based on a pantograph–catenary interaction model with proper dropper models, and three traditional dropper models have been developed for different purposes, including bi-linear spring elements [10,11,12], rod elements [13], beam elements [14,15,16,17], or even absolute nodal coordinate formulation (ANCF) elements [18,19,20,21,22]. Based on these studies, bi-linear spring elements are used for general pantograph–catenary interaction dynamic analysis, and beam and rod element models are used for dropper dynamic behavior studies, such as crimping process investigations. Note that most of the above pantograph–catenary interaction models are developed by FEM, and they have been proven to be accurate and efficient in pantograph–catenary interaction dynamic analysis based on the validation of EN50318:2018 standard [23,24]. However, while dropper loads are the basis of dropper fatigue investigations, the way to better model the dropper and investigate the dropper's dynamic characteristics has not been fully discussed so far. To better simulate the dropper dynamic responses in the pantograph–catenary interaction system and investigate its dynamics, it is necessary to find a proper dropper model in the pantograph–catenary interaction model from these three dropper models.
In this work, the influence of different dropper models in pantograph–catenary models on dropper dynamic loads is investigated. Based on the existing pantograph–catenary interaction model [24], the Euler beam element [25] is used to formulate an FEM-based pantograph–catenary interaction model, where the bilinear spring element model, rod element model, and beam element model are considered to model the dropper. After the formulation of the present model, the actual high-speed railway catenary dropper dynamic loads are measured to validate the present model, and the dropper dynamic loads and pantograph–catenary interaction dynamics with respect to different dropper models are calculated and compared. The calculation times of the whole model with respect to different dropper models are also compared. The proper dropper model in the FEM-based pantograph–catenary model is finally suggested, which can ensure the accuracy and efficiency of the existing pantograph–catenary model in the investigation of dropper dynamics. The remainder of this paper is organized as follows. The FEM-based pantograph–catenary interaction model and different dropper models are formulated in Section 2, and the dynamic dropper load measurement process is described in Section 3. The dropper dynamic loads with respect to different dropper models are compared and analyzed in Section 4. The conclusion is given in Section 5.

2. FEM-Based Pantograph–Catenary Interaction Model with Different Dropper Models

To investigate the influence of different dropper models on dropper dynamic investigation, an accurate pantograph–catenary interaction model is needed. In this section, based on an existing pantograph–catenary interaction model [13], an FEM-based pantograph–catenary interaction model with different dropper models is formulated, as shown in Figure 1. Details of the formulation process are shown below. The displacement and rotation of the catenary system are assumed to be small.

2.1. Modeling of the FEM-Based Catenary Model

2.1.1. Modeling of the Contact and Messenger Wire, Catenary Suspension, and Registration Arm

The FEM-based catenary model is formulated first based on an existing pantograph–catenary interaction model [13], and the Euler beam element [20] is used to model the messenger and contact wire in the FEM-based catenary model. A 20-span long catenary is considered in the present model.
In the Euler beam element, the velocity vector of an arbitrary point P can be expressed as
v P = u ˙ C + Ψ ˙ × t 0
where u C = u C v C w C T , Ψ = ϕ φ θ T , and t 0 = 0 y z T . uC, vC, and wC are the displacements of the beam cross-section central point with P located, and ϕ , φ, and θ are the rotational angles of the vector t around the three axes of the beam cross-section. y and z are the material coordinates of P. Based on Equation (1), the kinetic energy of the beam element is
T = 1 2 Ω ρ v P 2 d Ω = 1 2 Ω ρ u ˙ C T u ˙ C 2 u ˙ C T t ˜ 0 Ψ ˙ Ψ ˙ T t ˜ 0 t ˜ 0 Ψ ˙ d Ω
Based on the Euler–Bernoulli beam theory [23], the strain energy of the beam element can be expressed as
U = 1 2 Ω σ x x ε x x + σ x y ε x y + σ x z ε x z d Ω = 1 2 Ω E ε + κ y y + κ z z 2 + G κ x z 2 + G κ x y 2 d Ω
where ε = u , κ x = ϕ , κ y = θ , and κ z = φ . E is the Young’s modulus of the beam element, and G is the shear modulus of the beam element.
In Equations (2) and (3), based on finite element theory, there are:
u C x , t = N x q t ,   Ψ x , t = Θ x q t
where N and Θ are shape function matrices of the Euler beam element, and their expressions can be found in [26]. q is the generalized coordinate vector of the beam element, and its expression is
q = u I v I w I ϕ I φ I θ I u J v J w J ϕ J φ J θ J T
where I and J are the nodes of the beam element on different sides. Based on the FEM theory [27], in Equation (2), there are:
u ˙ C = d N q d t = N q ˙ ,   Ψ ˙ = d Θ q d t = Θ q ˙
Substituting Equation (6) in Equation (2) yields
T = 1 2 Ω ρ N q ˙ T N q ˙ d Ω 1 2 Ω ρ 2 N q ˙ T t ˜ 0 Θ q ˙ 1 2 Ω ρ Θ q ˙ T t ˜ 0 t ˜ 0 Θ q ˙
Based on the Lagrange equation and considering Equations (3) and (7), the dynamic equations of the Euler beam element can be obtained as
M q ¨ + K q = Q
where
M = ρ Ω N T N N T t ˜ Θ + Θ T t ˜ N Θ T t ˜ t ˜ Θ d Ω
K = i = 1 4 Q k i
In Equation (10), there are
Q k 1 = E A 0 l N 1 T N 1 d x E A z 0 l N 1 T Θ 3 d x + E A y 0 l N 1 T Θ 2 d x
Q k 2 = E A z 0 l Θ 3 T N 1 d x + E I z 0 l Θ 3 T Θ 3 d x E I y z 0 l Θ 3 T Θ 2 d x
Q k 3 = E A y 0 l Θ 2 T N 1 d x E I y z 0 l Θ 2 T Θ 3 d x + E I y 0 l Θ 2 T Θ 2 d x
Q 4 = G I p 0 l Θ 1 T Θ 1 d x q
where Ay and Az are the static moments of the cross-section about the y- and z-axes, respectively; Iy and Iz are the second moments of the cross-section about the y- and z-axes, respectively; and Iyz is the polar moment of inertia of the cross-section. Q is the generalized force vector caused by the relative motion between the moving beam element and the static beam material, the external force, and the connected beam elements. The derivation process of Q can be found in [26].
Based on Equation (8), the contact and messenger wire can be modeled, and their dynamic equations are
M C q ¨ C + C C q ˙ C + K C q C = Q C
M M q ¨ M + C M q ˙ M + K M q M = Q M
where q C and q M are the generalized coordinate vectors of the contact and messenger wire models, respectively, which include all the generalized coordinates of the beam elements. M C , C C , K C , M M , C M , and K M are obtained by assembling beam elements. Based on [27], the boundary condition of the contact and messenger wire in the catenary model can be considered simply supported, which is also the boundary condition of the whole catenary system.
The catenary suspension and registration arm are then modeled. Based on [19], the catenary suspension is modeled as a bi-linear spring element, and the registration arm is modeled as a lumped mass. The registration arm model is attached to the nodes at the location of the registration arm.

2.1.2. Modeling of the Dropper

To study the influence of different dropper models on dropper dynamic loads, the dropper should be carefully modeled in the FEM-based pantograph–catenary model. Based on the existing pantograph–catenary model, the beam element, rod element, and bi-linear spring element are considered, and their corresponding model processes are described below. Note that the twisted wire model is difficult to include in the catenary model due to the large number of DOFs and low calculation efficiency; thus, it is not considered in the present work.
The beam element model is modeled first. To simplify the whole catenary model, each dropper is modeled by one beam element. Based on the Euler beam element theory [26], the dynamic equation of the beam element-based dropper can be expressed as
M D q ¨ D + K D q D = Q D
where M D and K D are the mass and stiffness matrices of the dropper modeled by the beam element, respectively. Q D is the generalized force vector caused by the connected beam elements, and q D is the generalized coordinate vector. The expressions of M D and K D can be found in [10,26]. The dropper model is then assembled with the contact and messenger wire model, and Q D is neutralized for adjacent elements at the contact and messenger wire. The node of the dropper model is combined with the node at the contact and messenger wire at the location of the dropper.
The rod element model is then modeled, where only the axial force is considered. The dropper is also modeled by one rod element. Based on the rod element theory [26], the dynamic equation of the rod element-based dropper can be expressed as
M D q ¨ D + K D q D = Q D
where M D and K D are the mass and stiffness matrices of the dropper modeled by the rod element, respectively. Q D is the generalized force vector caused by the connected beam elements, and q D is the generalized coordinate vector. The expressions of M D and K D can be found in [26]. The dropper model is also assembled with the contact and messenger wire model.
Finally, the bi-linear spring element model is modeled. Based on [13], the stiffness of this bi-linear spring element is decided by
K i d = k i d ,   d c i d m i 0 0 ,   d c i d m i < 0
where kid is the stiffness of the ith dropper, d c i is the vertical displacement of the contact wire at the dropper location, and d m i is the vertical displacement of the messenger wire at the dropper location. Based on Equation (20), the dropper dynamic force can be calculated as F i d = K i d d c i d m i . In the spring model, the stiffness of the dropper is mainly decided by the Young’s modulus of the dropper material, the cross-sectional area of the dropper, and the static length of the dropper.

2.2. Modeling of the Pantograph and Pantograph–Catenary Interaction

The pantograph system and its interaction with the catenary are subsequently represented. Following the modeling approach referenced in [24], the pantograph is considered as a symmetric multi-body structure consisting of three discrete masses. These masses are interconnected via spring components. The governing dynamics of the pantograph can be described by the following equation
M P q ¨ P + C P q ˙ P + K P q P = Q P
where M P , C P , and K P denotes the mass, damping, and stiffness matrices of the pantograph, respectively. Q P represents the generalized forces resulting from the pantograph–catenary contact interaction, gravitational effects, the uplift force, and aerodynamic influences. A comprehensive derivation of the pantograph’s dynamic equation is provided in reference [24].
The pantograph–catenary interaction is caused by pantograph–catenary contact, and the pantograph–catenary contact force is calculated by
F C = k n d r ,   d r 0 0 ,   d r < 0
where d r is the gap between the contact wire and contact strip of the pantograph at the contact point of the pantograph–catenary system, and k n = 50,000 N/m [13]

2.3. The FEM-Based Pantograph–Catenary Interaction Model

After the modeling of the contact and messenger wire, catenary suspension, registration arm, different dropper models, pantograph, and pantograph–catenary interaction, the pantograph–catenary interaction system can be finally modeled as
M C A M P q ¨ C A q ¨ P + C C A C P q ˙ C A q ˙ P + K C A K P q C A q P = Q C A Q P
where M C A , C C A , and K C A are the mass, damping, and stiffness matrices of the whole catenary model, which are obtained by assembling Equations (15)–(18). The static shape of the catenary is obtained by the design parameters of the catenary and shape finding, and the corresponding generalized coordinate vectors are considered as the initial condition of Equation (22). The commercial software MATLAB R2025a is used to achieve Equation (22), and it is solved by the MATLAB function ode15s. Note that different dropper models have different dynamic equations, and they should be solved separately.

3. Validation

After the formulation of the FEM-based pantograph–catenary interaction model with different dropper models, it is further validated to ensure its accuracy. Note that the present pantograph–catenary interaction model is similar to that in [13] with the rod beam dropper model that has been validated through the EN50318:2018 standard in [13]. In addition, while the dropper dynamic loads are considered in the present work, the EN50318:2018 standard does not validate the dropper loads. Therefore, the EN50318:2018 standard is not considered, and the dropper models are validated by measurement data. Details of the validation process are shown below.
The measurement data of the dropper dynamic loads are used to validate the present models. The dropper load measurement system, which consists of cameras (MOKOSE UC70), camera support, a data acquisition card (DAC) (NI USB-6211), and a control and data processing system, was developed to measure the dropper loads, as shown in Figure 2. The cameras can obtain the image of the target dropper every 0.1 s, and the DAC receives the image data and translates it to the control and data processing system, which is installed on a computer. The control and data processing system is developed based on the image recognition algorithm [28], and the dropper loads can be calculated based on the displacement of the dropper at the dropper ends. The measurement accuracy of the present system can reach 0.2 mm, which results in a high-accuracy dropper dynamic load measurement. In 2022, the present system was used in the Guangzhou–Shenzhen high-speed railway system at the Guangzhou–Humen section to measure the dropper dynamic loads, and the results are used here for validation purposes. In the present measurement process, five identical cameras are used, and each camera measures one dropper at the same time. The five droppers are located in the same span, and every span has the same dropper locations and parameters.
The present FEM-based pantograph–catenary interaction model with different dropper models is also formulated based on the Guangzhou–Shenzhen high-speed railway system. Based on the condition of the above-mentioned measurement data, the train operation speed is considered to be 350 km/h. The length of the catenary system is 900 m, and 1910 Euler beam elements are used to model the contact and messenger wire. The parameters of the pantograph–catenary interaction system at the Guangzhou–Shenzhen high-speed railway system can be found in [29,30]. The FEM model of the 20-span catenary is shown in Figure 3. The stiffness and damping of the spring model are calculated based on the cross-sectional area and material parameters of each dropper, and the beam and rod model is formulated directly based on the parameters of the dropper. The middle dropper in the third span is chosen for validation.
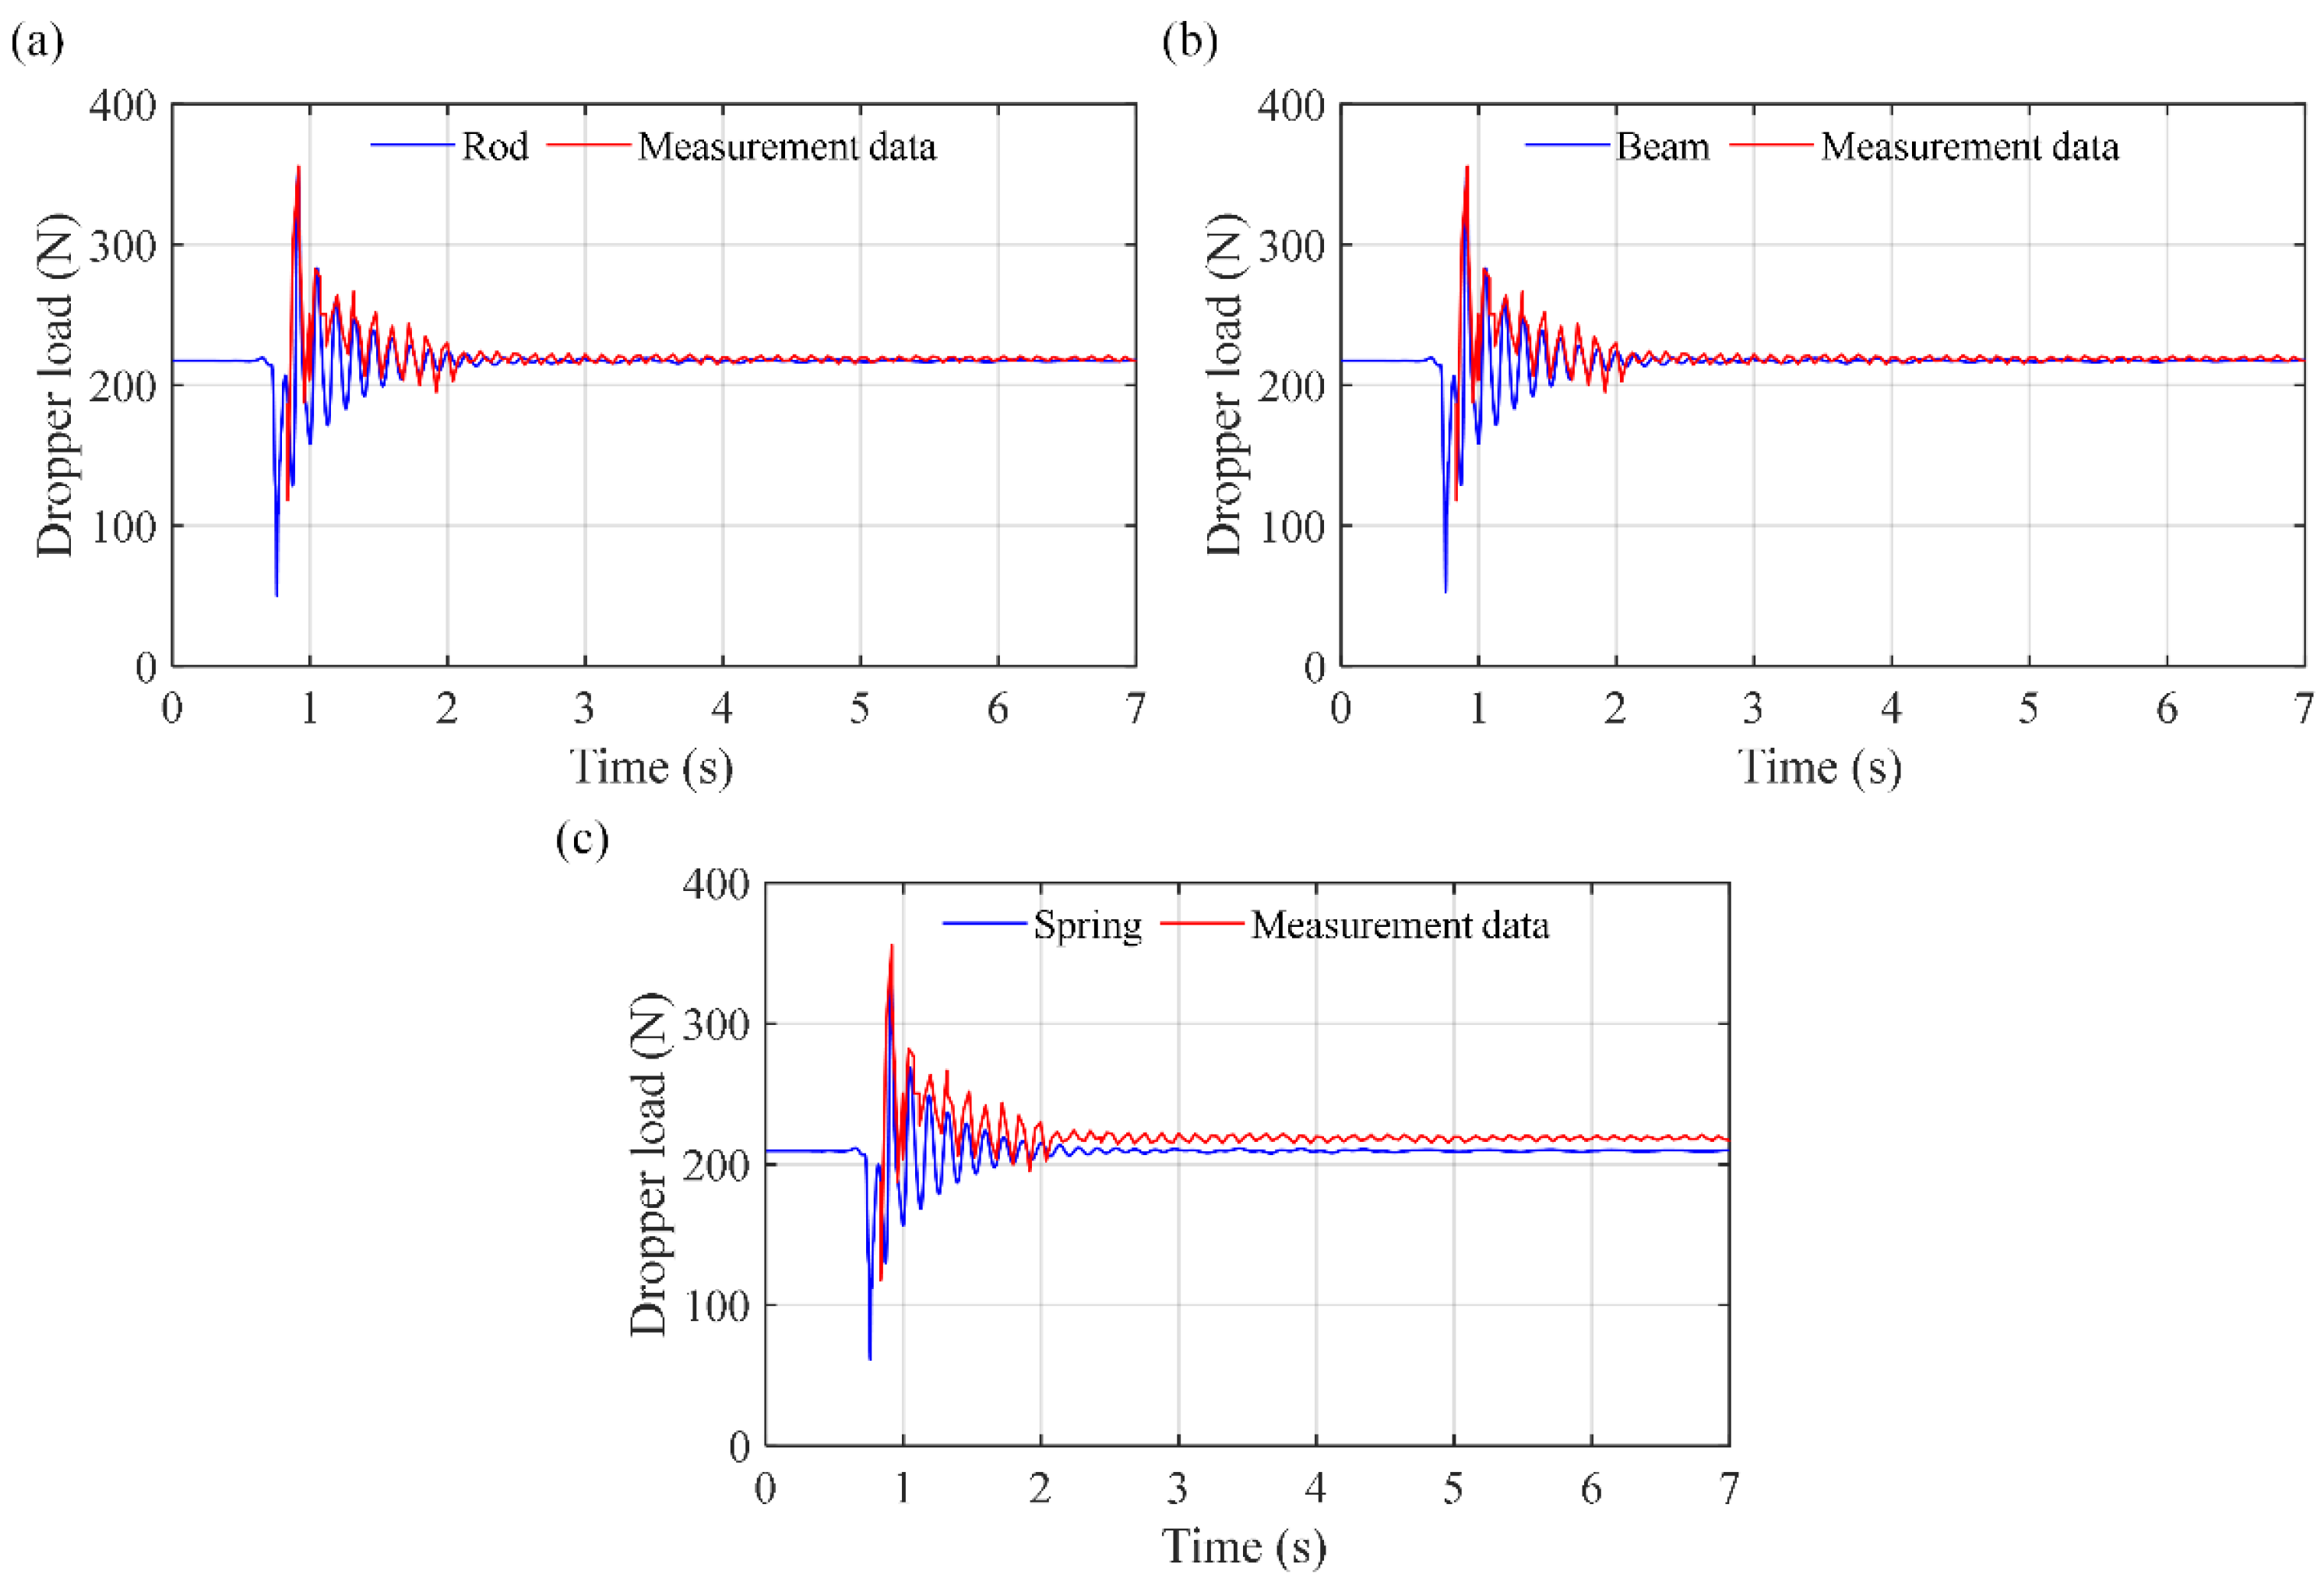
Based on the present FEM-based pantograph–catenary interaction model, the time histories of the dropper load with respect to different dropper models are shown in Figure 4, where the simulation results are compared with those from the measurement data. The mean and maximum dropper loads from the simulation results and measurement data are also shown in Figure 5 for validation purposes. It can be seen from Figure 4 and Figure 5 that the results from the measurement data are similar to those from the simulation results with respect to the beam and rod dropper models, but they show some differences in the bilinear spring model. When considering the beam and rod model, the time history results from the simulation results are close to those of the measurement data, and the relative difference in the mean and maximum dropper loads between these two results is no more than 3.6%. But when considering the bilinear spring model, the time history results from the simulation results show a clear difference from the measurement data, and the relative difference in the mean and maximum dropper loads between these two results reaches 9.2%. Therefore, the bilinear spring element model is not as accurate as the beam and rod element model when analyzing the dropper dynamics.
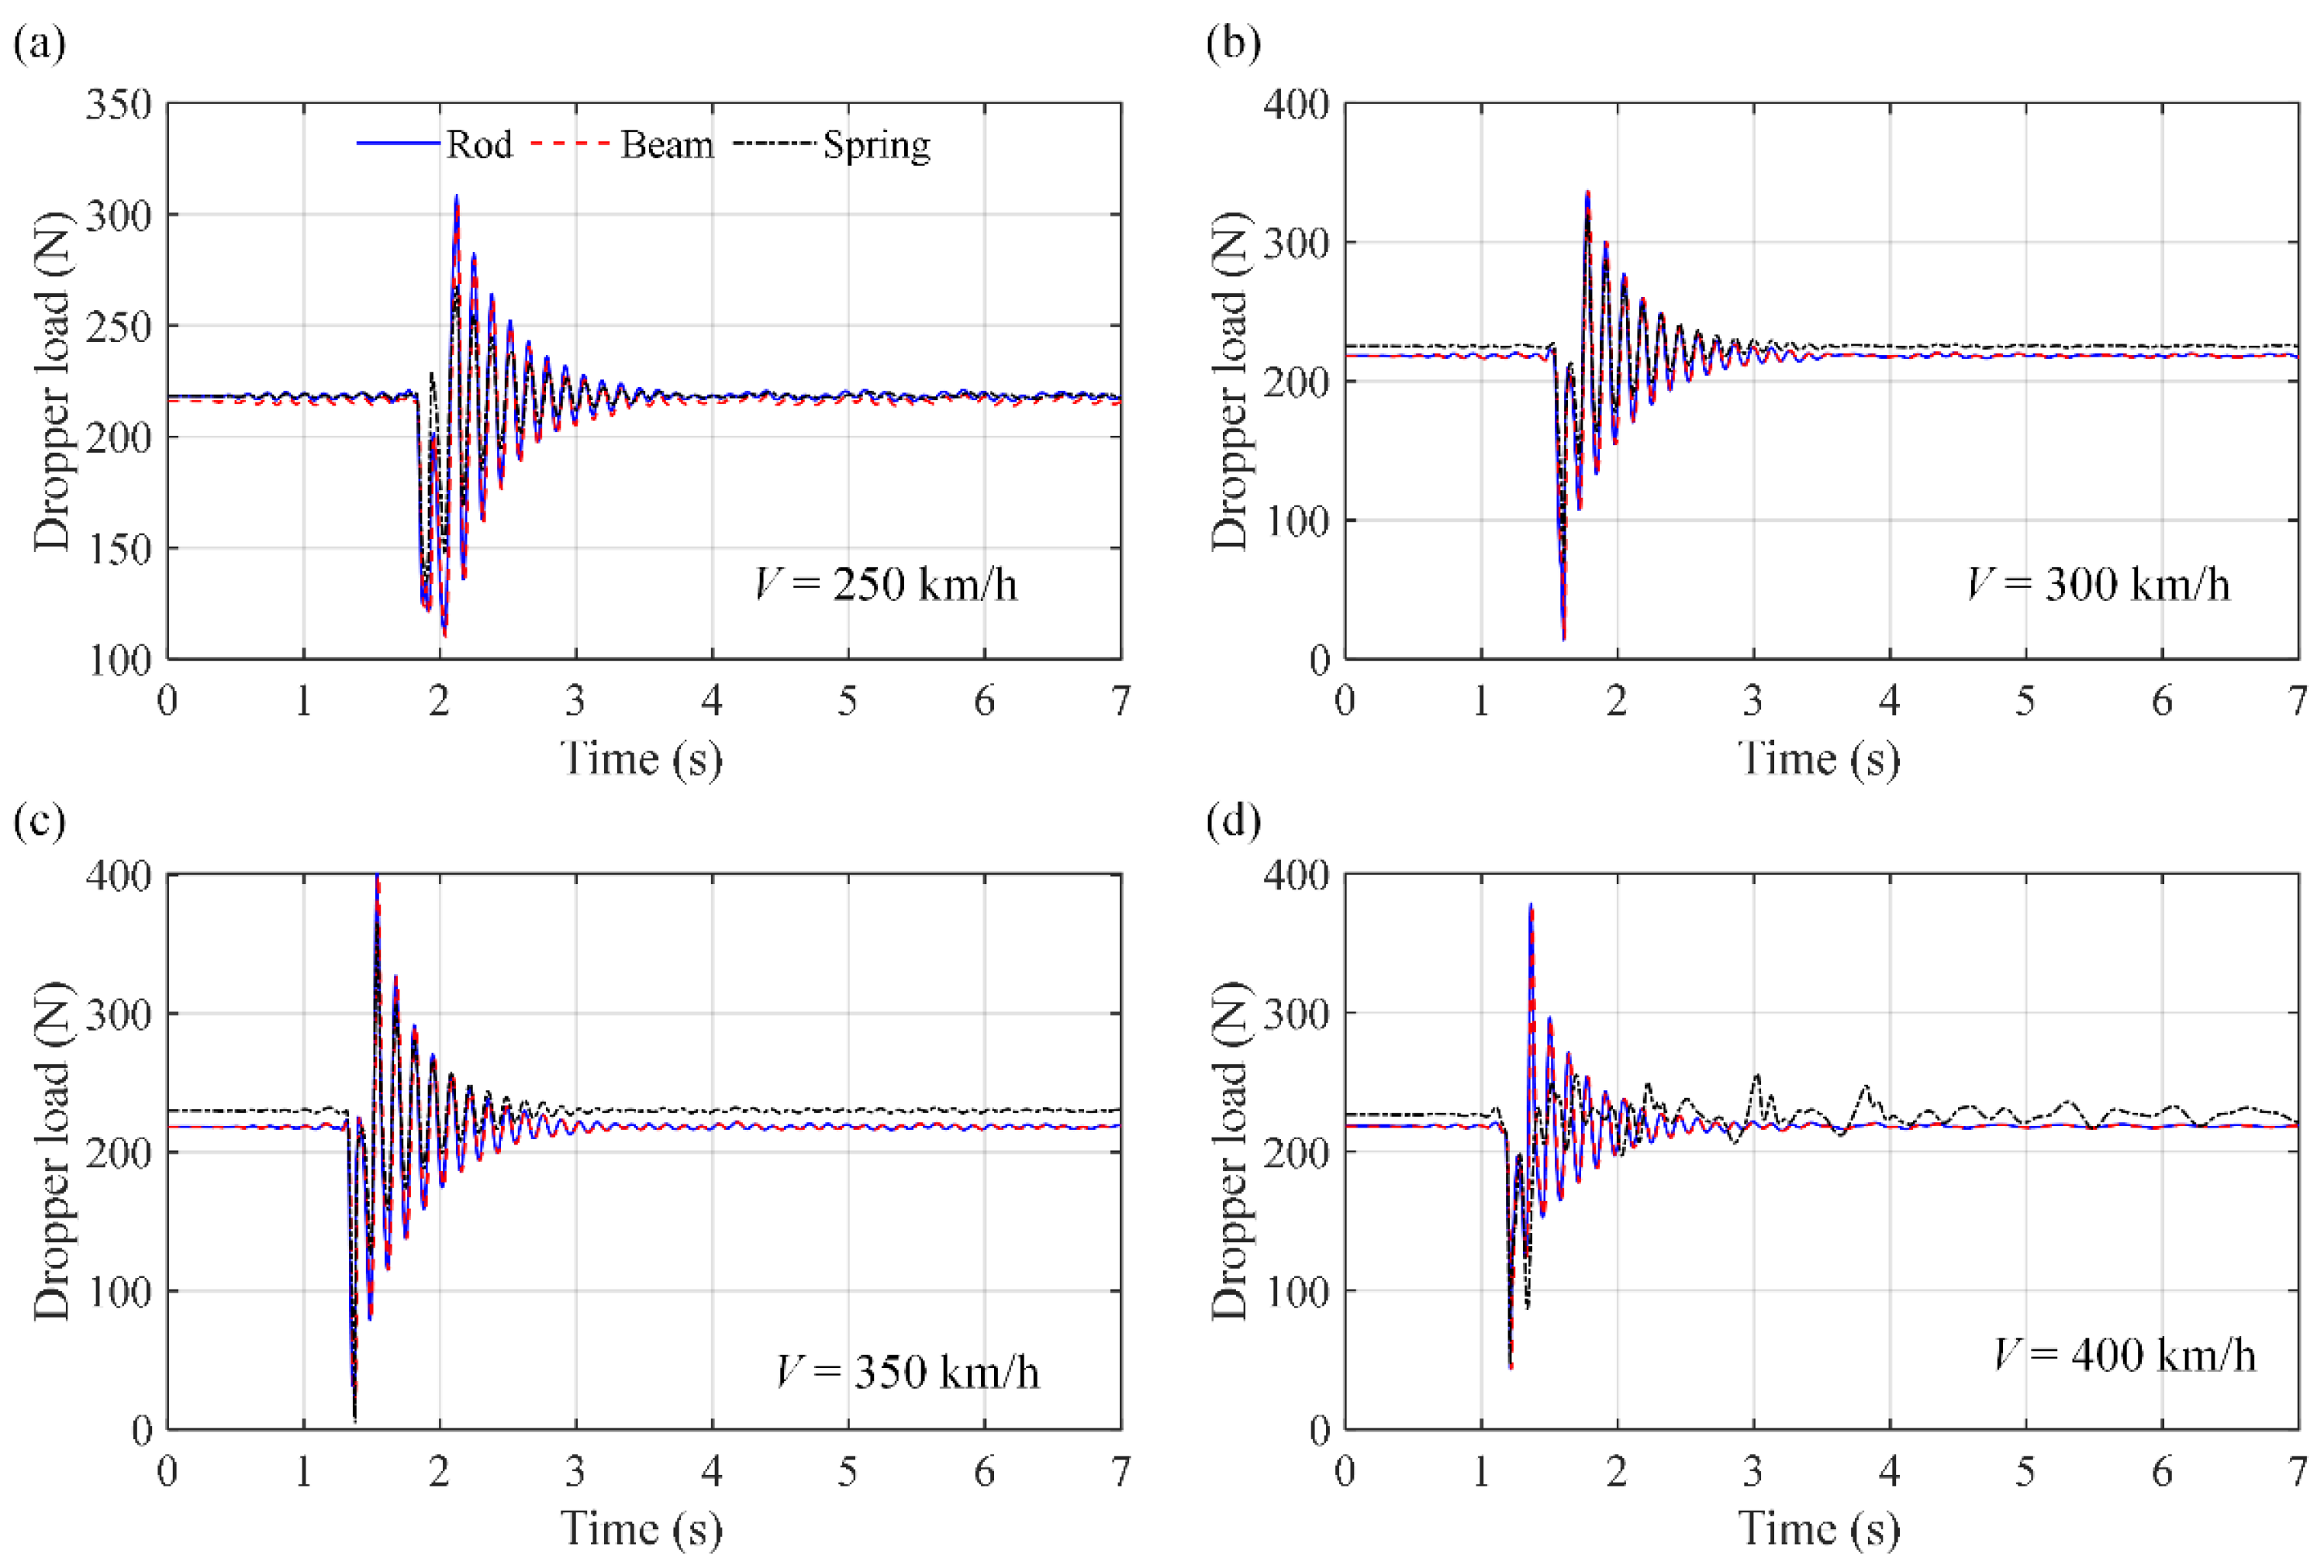
While different dropper models have different accuracies in calculating the dropper dynamic loads, their influence on the whole pantograph–catenary interaction dynamics may be limited. To further validate the present model and investigate the difference between the dropper models in pantograph–catenary interaction dynamic analysis, based on the above-mentioned Guangzhou–Shenzhen high-speed railway case, the pantograph–catenary contact force with respect to different vehicle velocities and dropper models is calculated and compared. Time histories of the pantograph–catenary contact forces with respect to different vehicle velocities and dropper models are shown in Figure 6, where four vehicle velocities, 250 km/h, 300 km/h, 350 km/h, and 400 km/h, are chosen. It can be seen from Figure 6 that while the bilinear spring model is not as accurate as those of the beam and rod elements in dropper load analysis, it has little influence on the calculation of the pantograph–catenary interaction dynamics. The results from the bilinear spring, beam, and rod element dropper models at different vehicle velocities are in good agreement with each other, and their maximum relative difference is no more than 1.5%. In addition, since the pantograph–catenary contact force with respect to different dropper modes is in good agreement with each other, the accuracy of the present pantograph–catenary interaction model can be further validated. The reason why the dropper model has little influence on pantograph–catenary interaction is that the parameters of the catenary with respect to different dropper models are the same, like the length, stiffness, and nonlinearity of the dropper.

4. Study on the Influence of Different Dropper Models on Dropper Dynamic Loads

4.1. Influence of Different Dropper Models on Dropper Dynamic Loads at Different Droppers

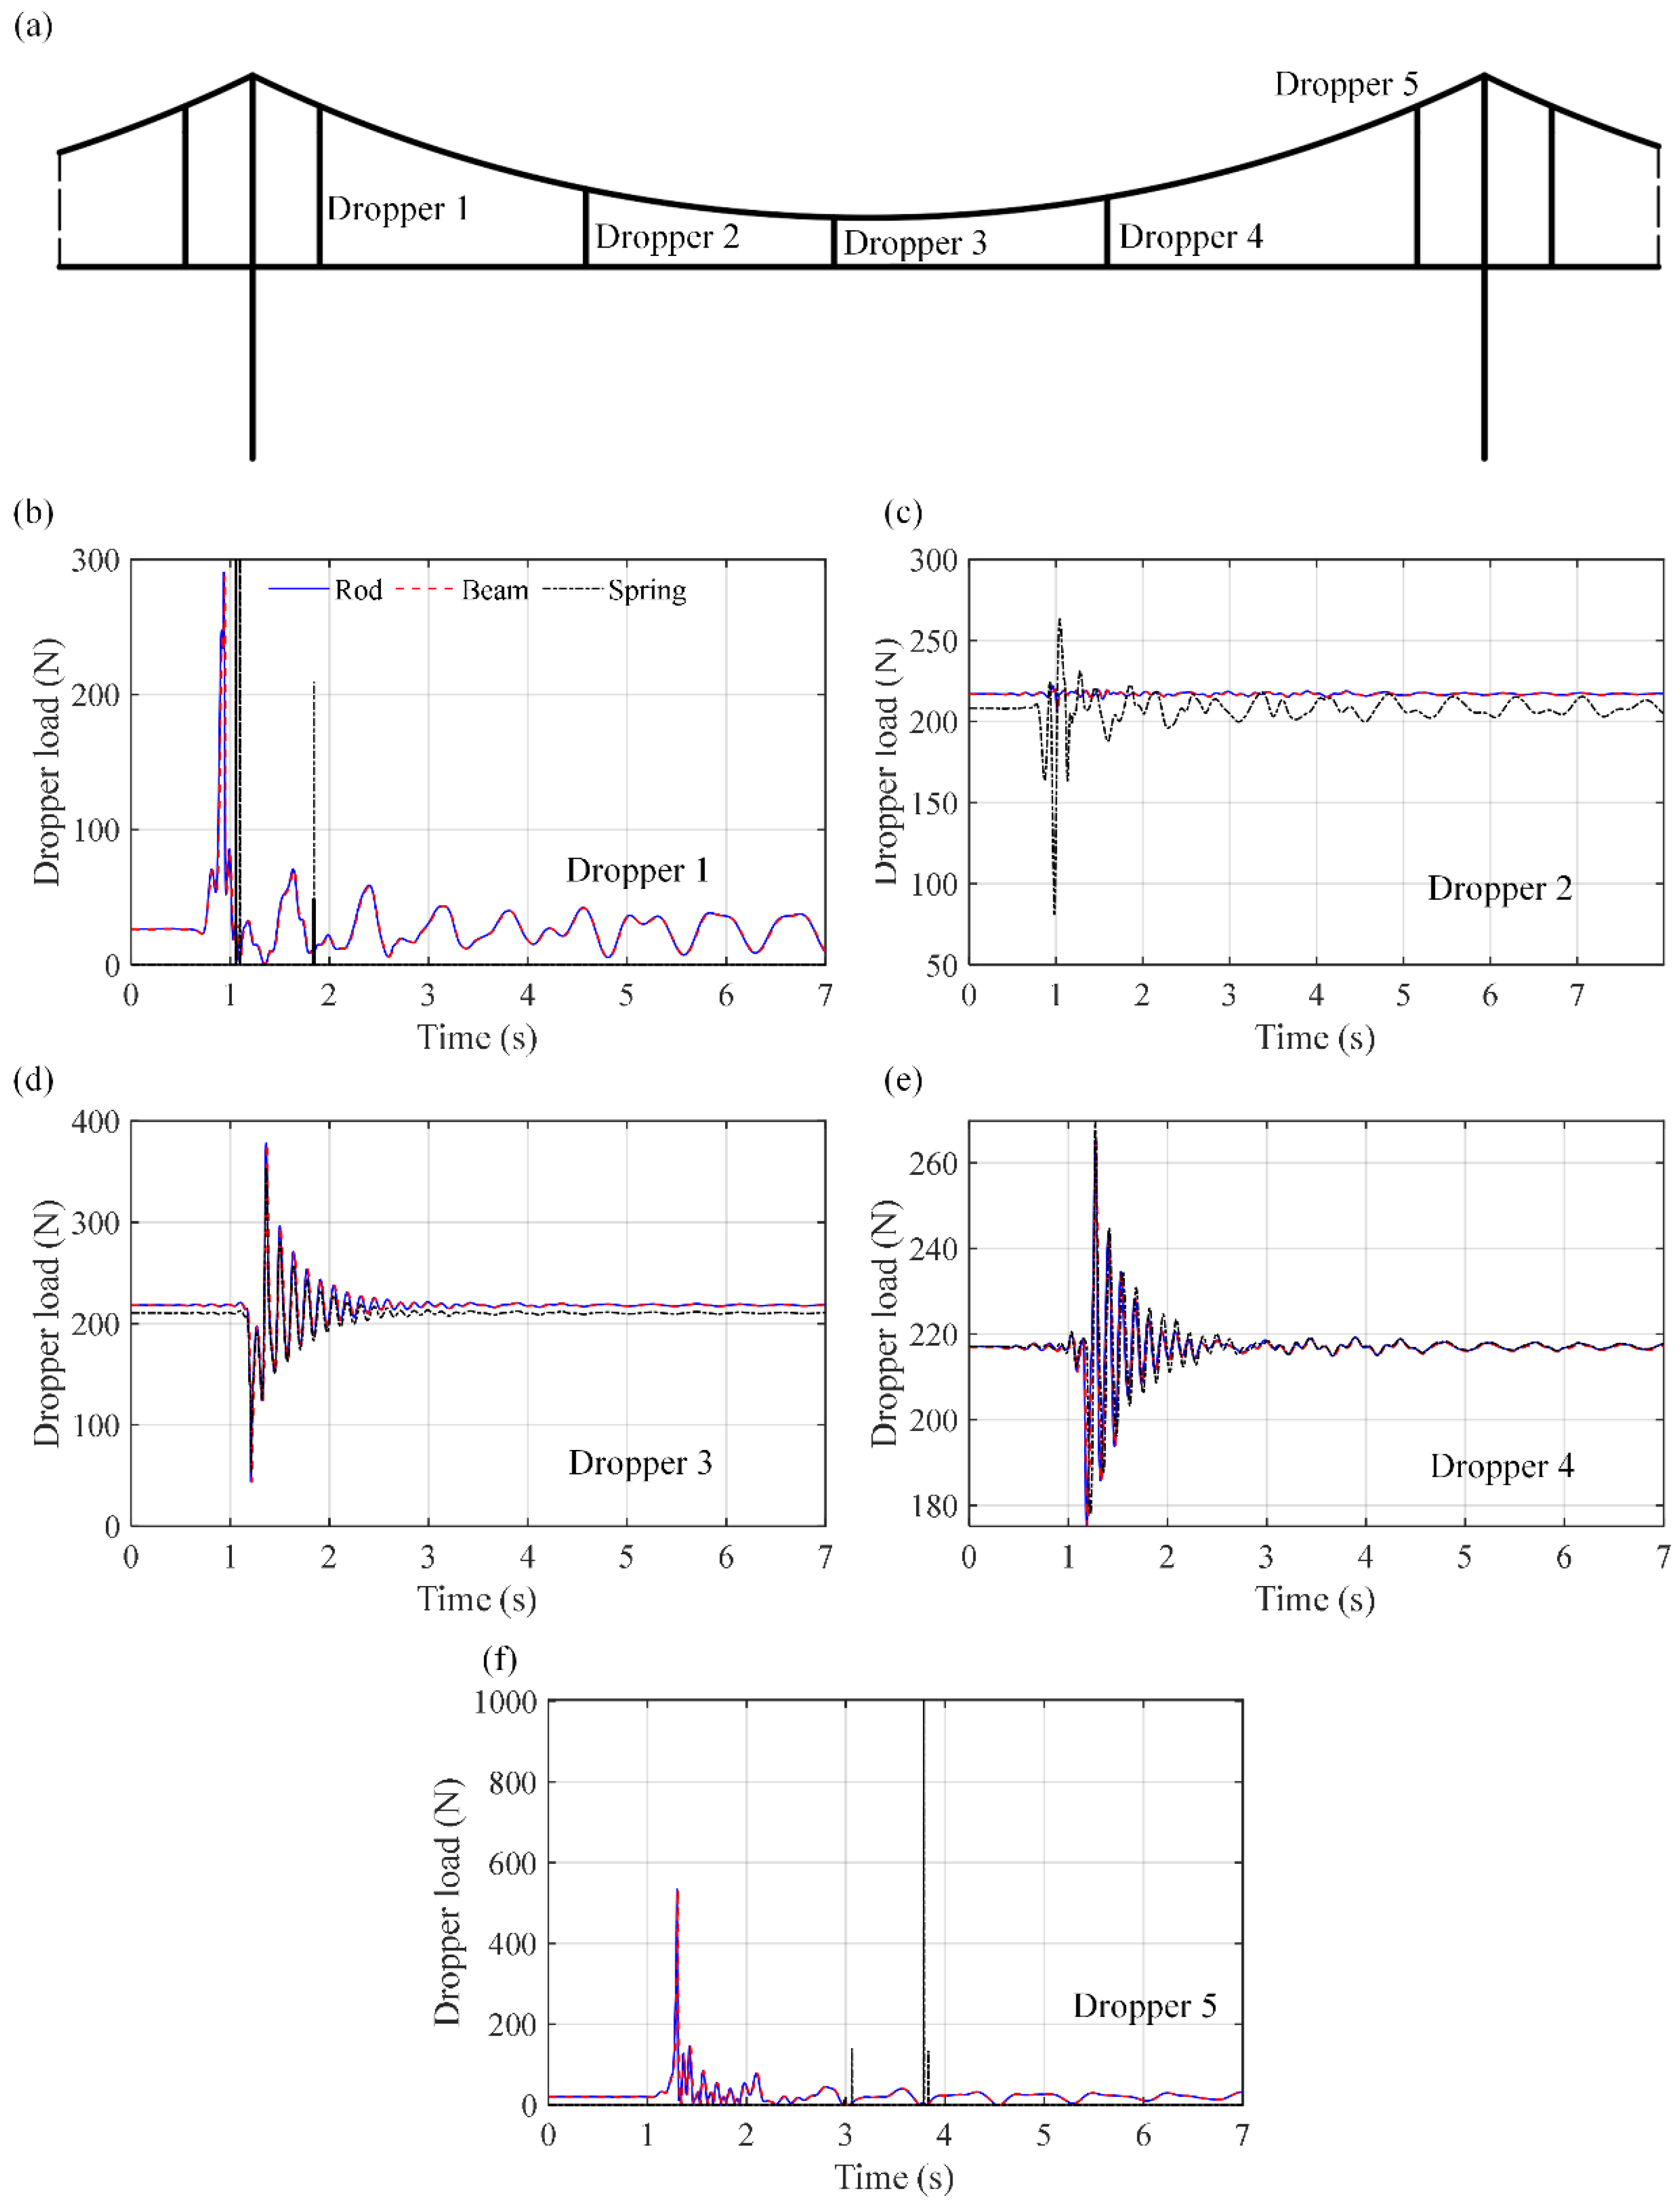
It can be seen from the above results that the dropper dynamic loads from the beam and rod models are in good agreement with each other, and the results from the spring model show a difference between the other two models and the measurement data. However, there are many droppers in each span of the catenary, and different droppers have different dynamic loads. The beam, rod, and bilinear spring models can also have different dropper load results for different droppers. Therefore, the influence of different dropper models on dropper dynamic loads at different droppers should be investigated to determine the most suitable dropper models.
Based on the above Guangzhou–Shenzhen high-speed railway system, the five droppers in the third span, starting from left, are chosen, and their dynamic loads with respect to different dropper models are calculated. The dropper location is shown in Figure 7a, and the time histories of the dropper loads at these droppers with respect to different dropper models are shown in Figure 7b–f. The vehicle velocity is chosen as 350 km/h. It can be seen from Figure 7 that the results from the spring, rod, and beam models are similar to each other for droppers 3 and 5, but they show a great difference in droppers 1, 2, and 5. When considering droppers 1 and 5, the results from the bilinear spring elements are totally different from those of the beam and rod elements, and they fail to present the dynamic characteristics of the dropper. This is because the nonlinearity of the dropper system is concentrated near the end of each span, and the spring model cannot represent this nonlinearity.

4.2. Influence of the Stiffness and Operation Speed on the Dropper Models’ Accuracy

As shown above, the beam and rod model can accurately simulate the dynamic loads of the dropper, and the bilinear spring model is not as accurate as these two models. However, in the bilinear spring model, the stiffness kid is a key parameter and can heavily influence the dynamic characteristics of the model. In addition, the vehicle operation velocity may also influence the dynamic responses of different dropper models at different droppers. To better understand the dynamic characteristics of these dropper models, it is necessary to further investigate the influence of stiffness and vehicle velocity on the accuracy of dropper models.
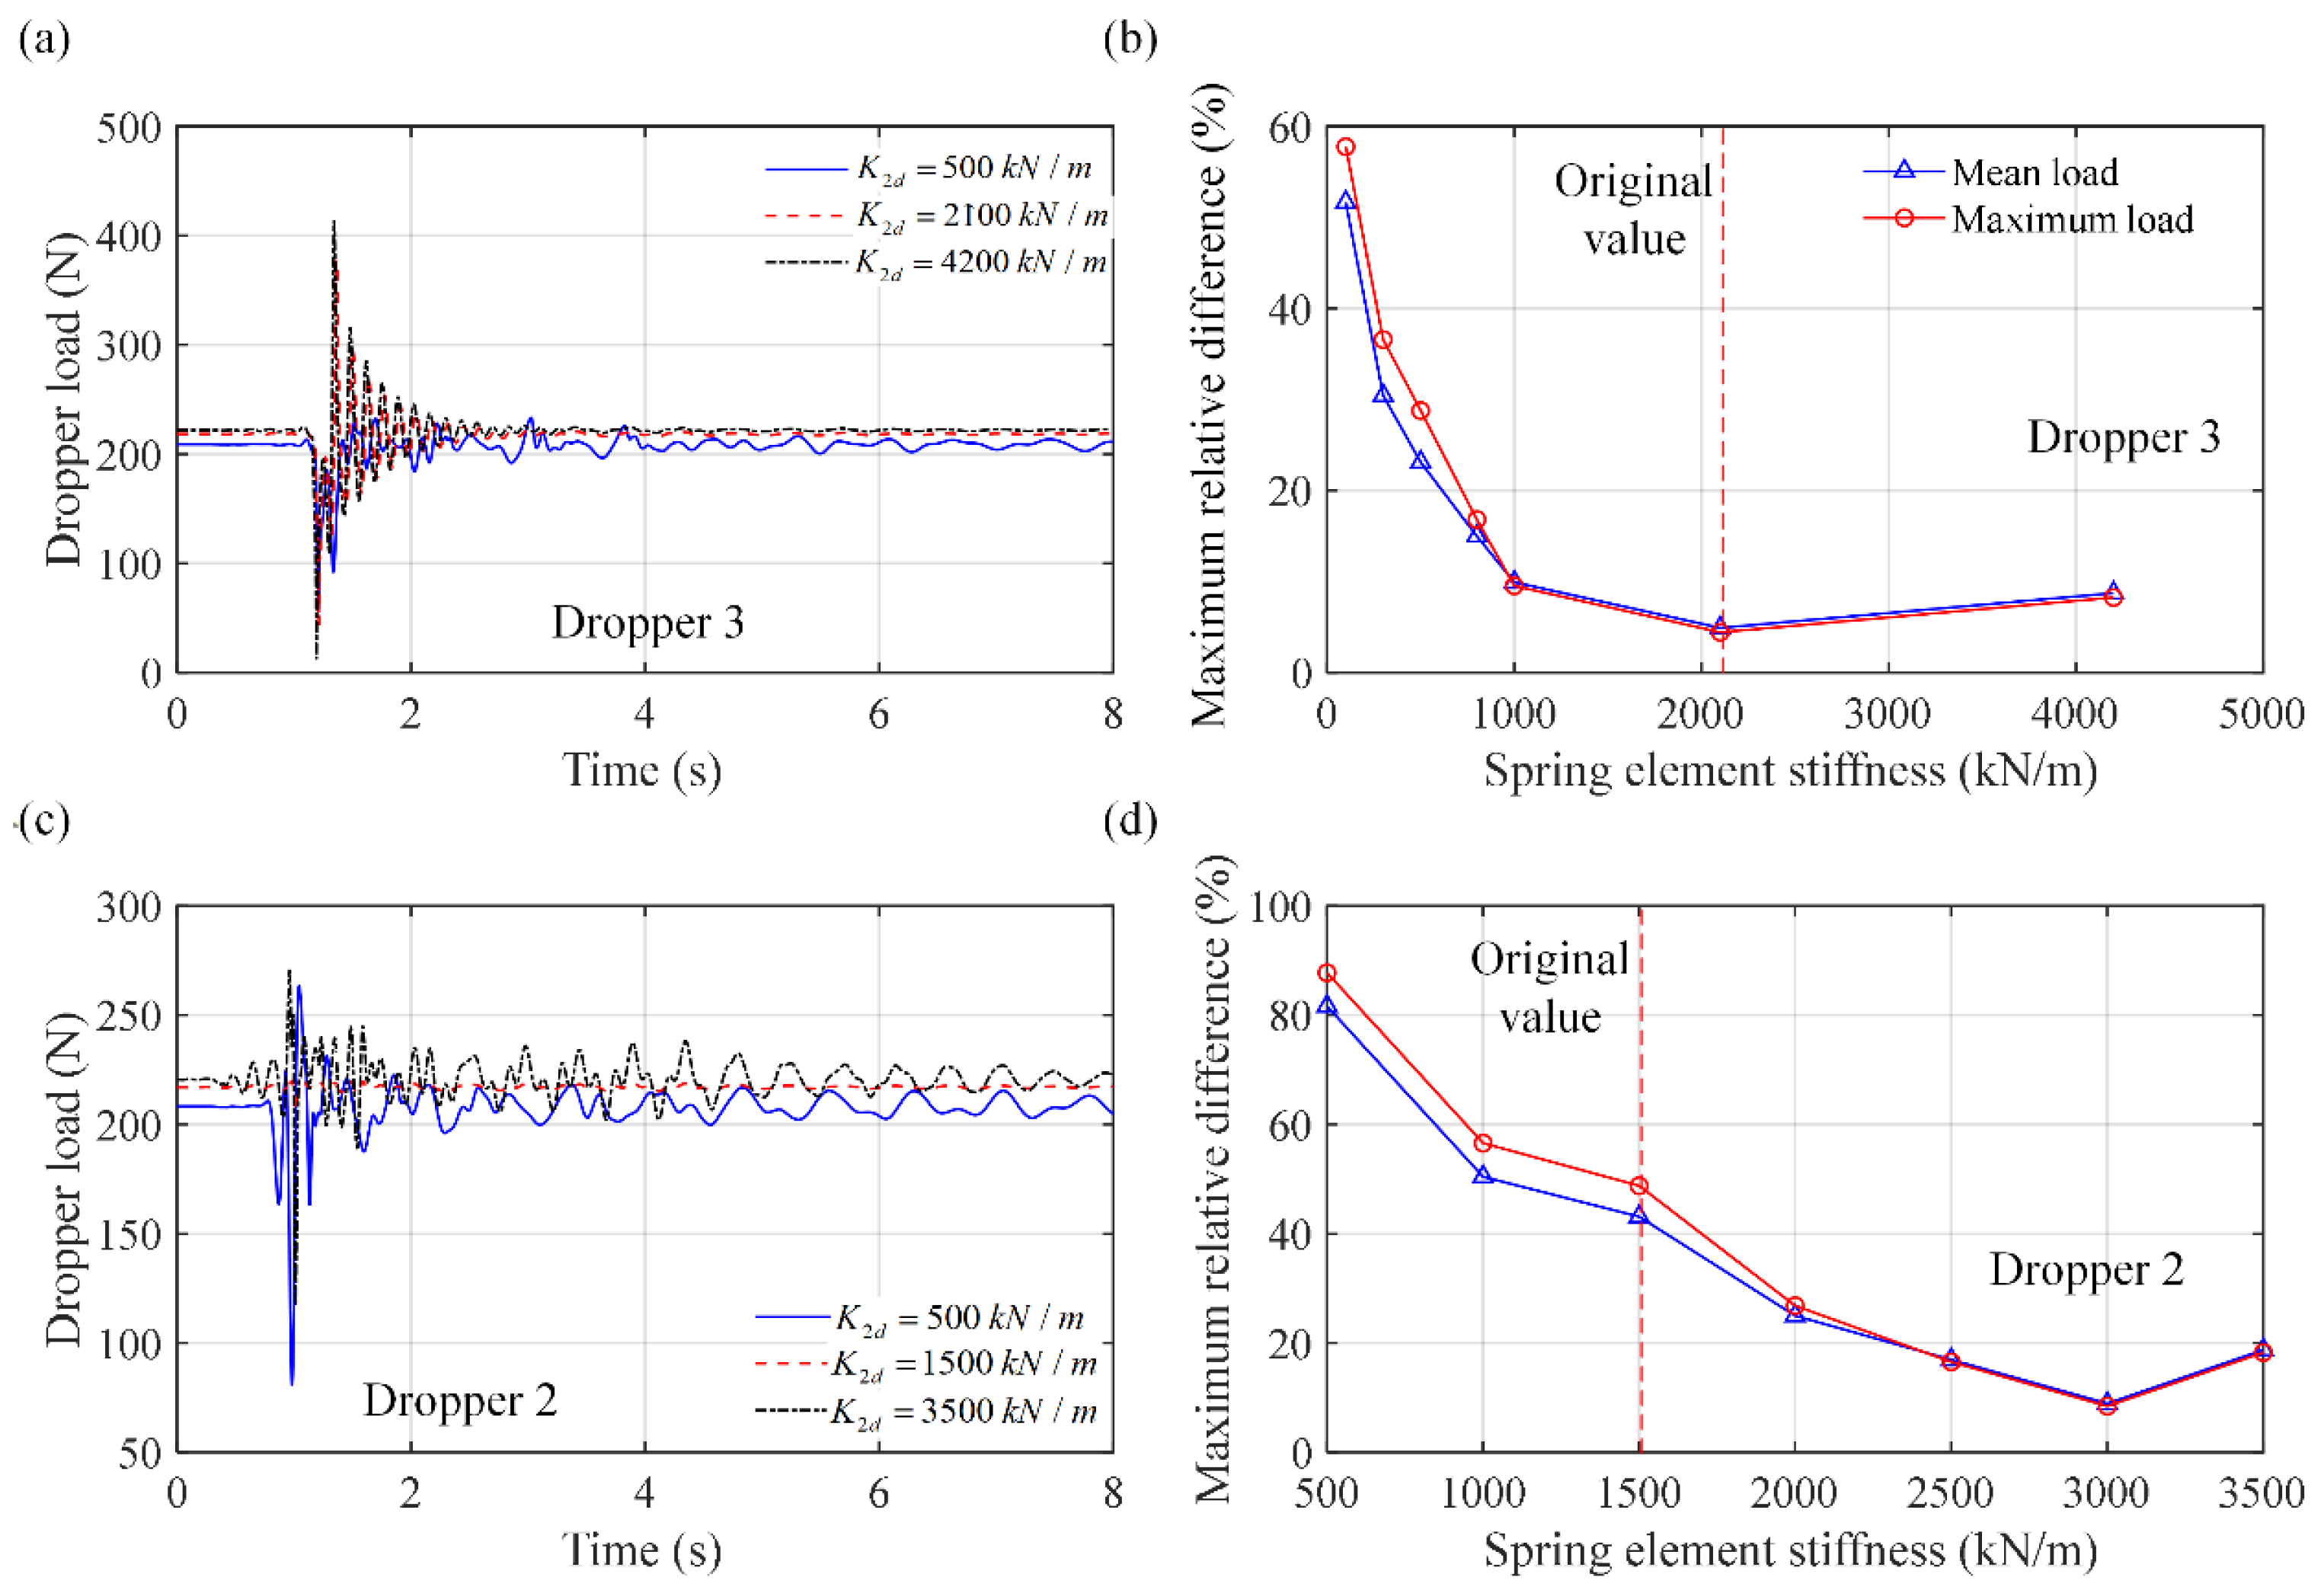
The influence of the stiffness on the accuracy of the bilinear spring model is investigated first. Droppers 2 and 3 in the above case are further chosen here, and their dropper dynamic loads under different stiffnesses kid are calculated and compared with those from the rod model. The time histories of the dropper loads and their maximum relative differences compared to those from the rod model with respect to different kid are shown in Figure 8. It can be seen from Figure 8 that the stiffness of the spring dropper model greatly influences its calculation accuracy on dropper dynamic loads, and the appropriate value is hard to decide for different droppers. In dropper 3, the results of the dropper load have comparatively small changes with the change in kid. In addition, the original value (obtained from the parameters of the dropper structure) of kid = 2100 kN/m can actually obtain the accurate results, where the maximum relative difference between the results from the spring and rod model is 4.78%. When kid leaves this value and changes within 1000 kN/m, the relative difference remains smaller than 10%. However, when considering dropper 2, the dropper dynamic loads obviously change with the change in the kid, and the original value can not obtain accurate results. When kid = 1500 kN/m, the maximum relative difference reaches 45%, and it decreases to 7.2% when kid = 3000 kN/m, but this value is far different from the original value. Because the value of the kid is hard to decide, and it even needs to be different from the original value at different droppers. It is not suggested to use the bilinear spring model to investigate the dynamic characteristics of the dropper.
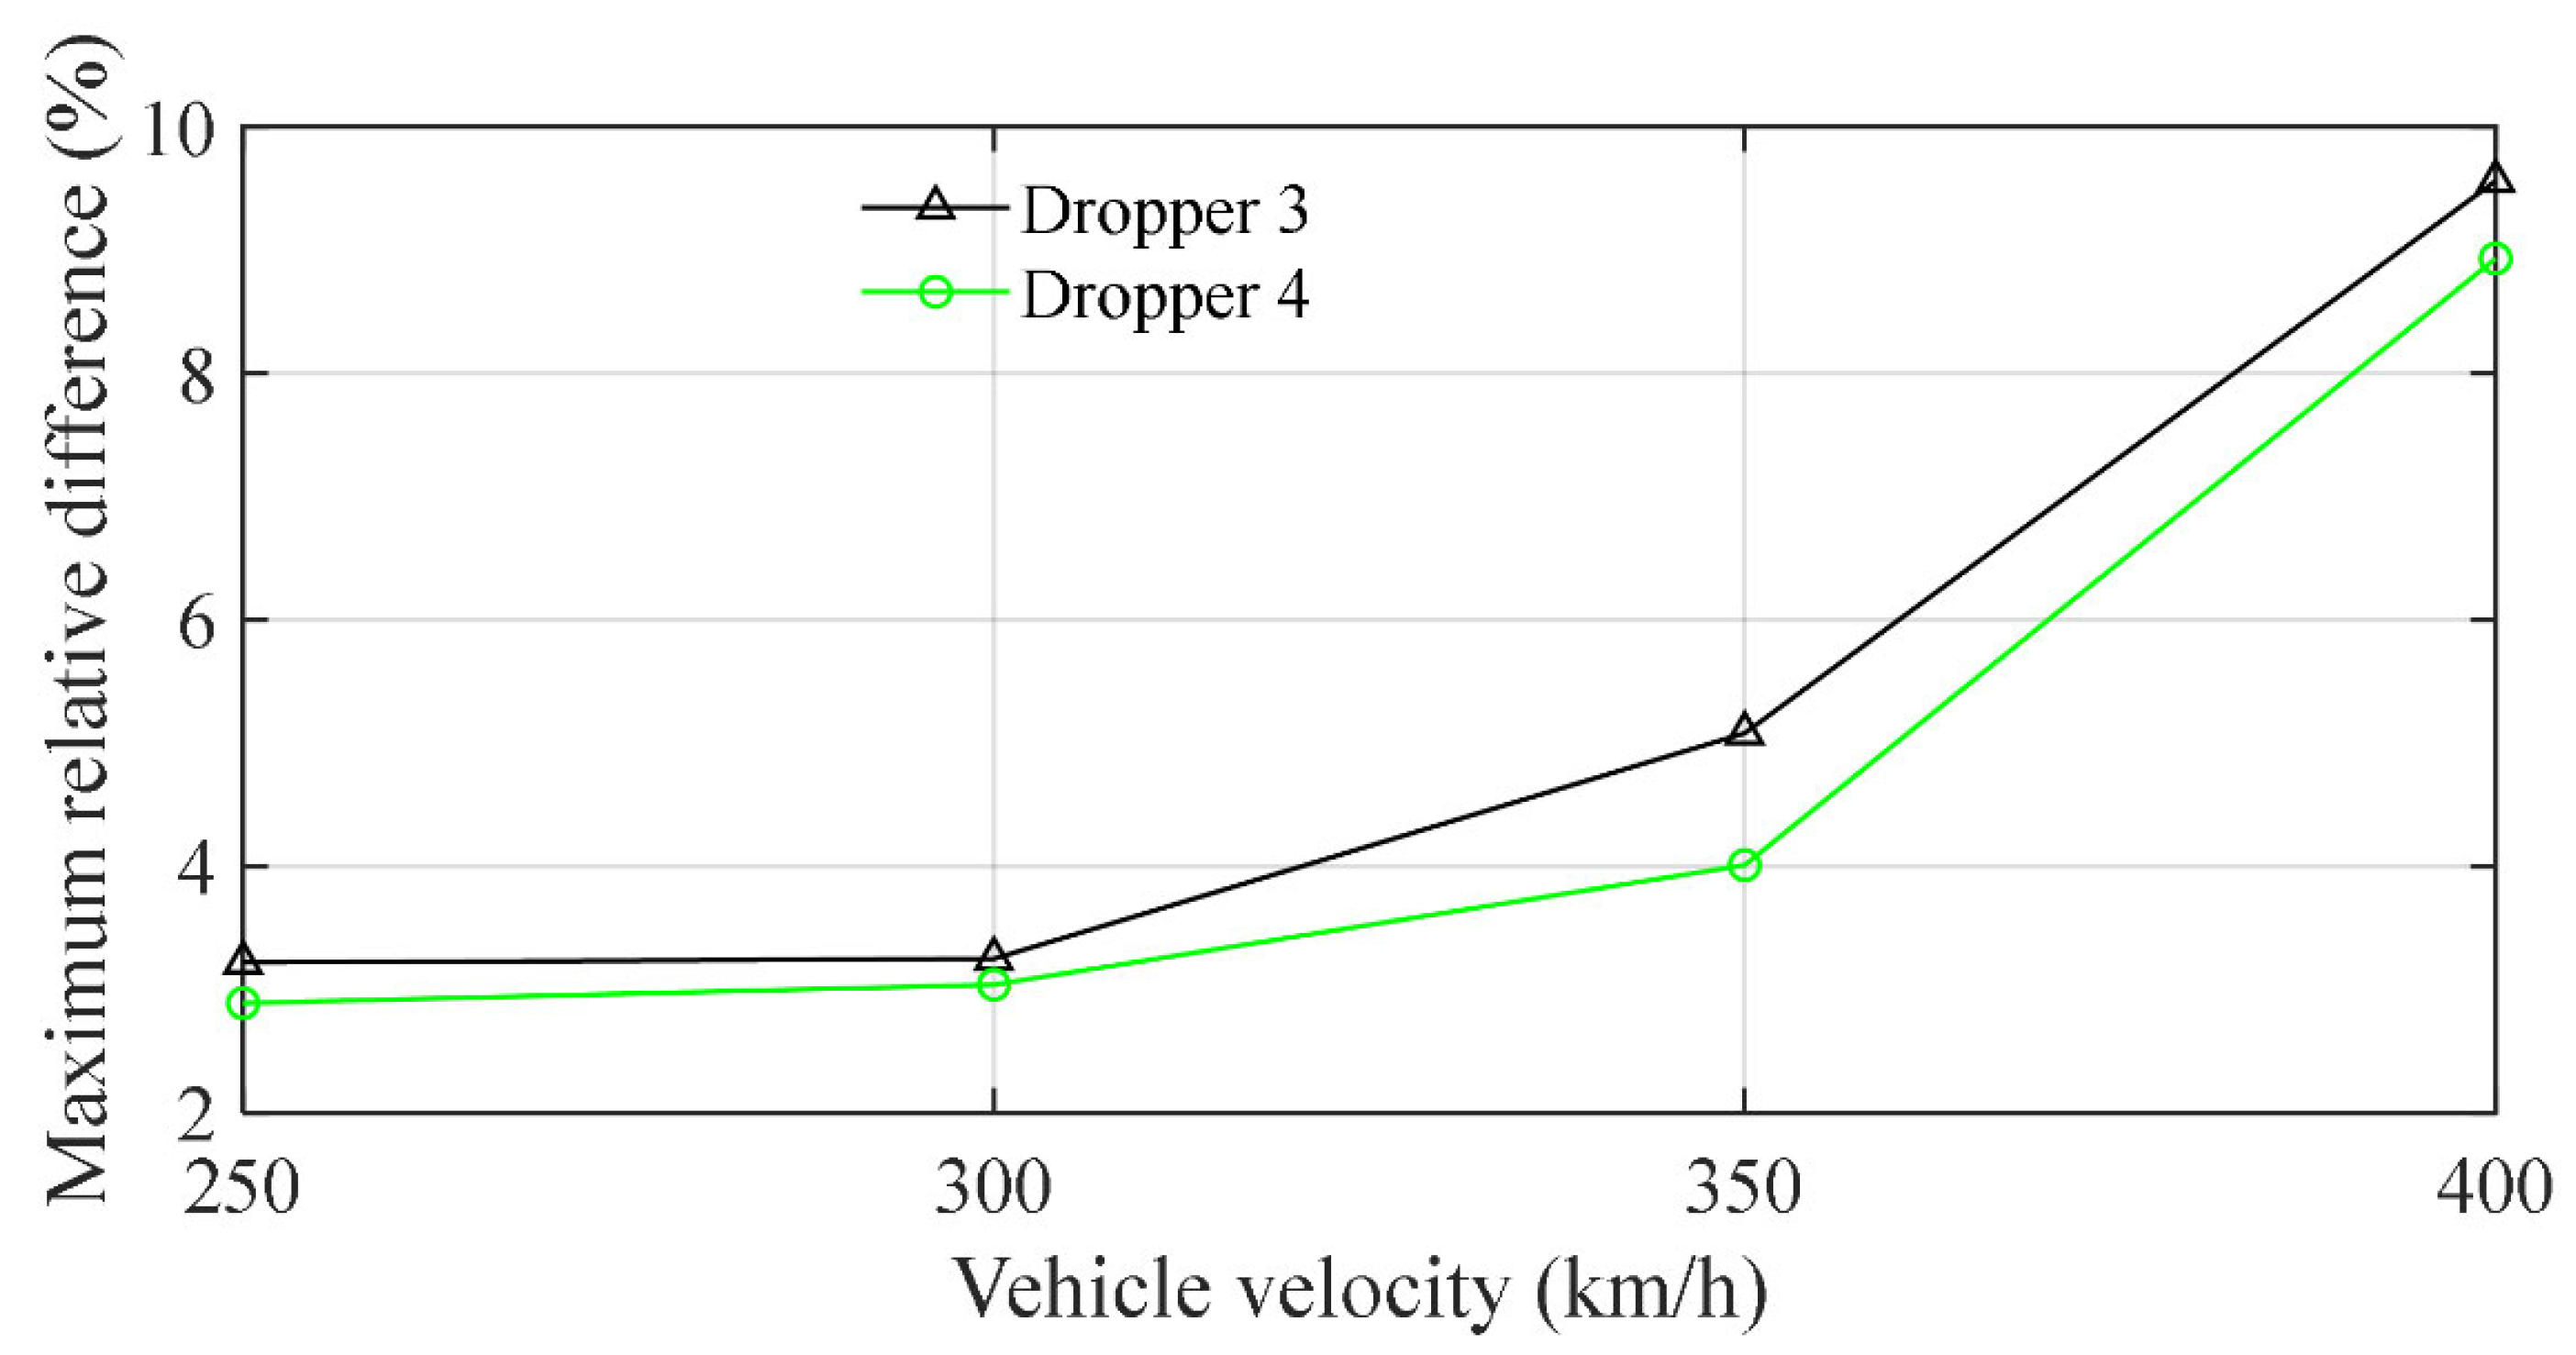
The influence of vehicle velocity on different dropper models’ accuracy is further studied. Four vehicle velocities of 250, 300, 350, and 400 km/h are chosen, and their corresponding dropper loads under different dropper models for droppers 3 and 4 are calculated. The time histories of the dropper loads under the different vehicle velocities in the different dropper models at dropper 3 and dropper 4 are shown in Figure 9 and Figure 10, respectively. The maximum relative differences between the results from the spring and rod models at the different vehicle velocities and droppers are shown in Figure 11. Figure 9 and Figure 10 further show that the vehicle velocity has a small influence on the beam and rod model accuracy, but it can further influence the accuracy of the spring model. When the vehicle velocity increases from 250 km/h to 400 km/h, the results from the rod and beam models are in good agreement with each other, and their maximum relative difference remains smaller than 2.1% for droppers 3 and 4. But the maximum relative difference between the results from the spring and rod model increases from 3.2% to 9.7%, and the results from the spring model even become unstable at dropper 3 when V = 400 km/h. Therefore, to obtain accurate dropper dynamic loads, the rod and beam dropper models are needed.

4.3. Influence of Dropper Models on Calculation Efficiency

It can be seen from the above investigation results that the beam and rod element dropper model can be used to accurately investigate the dynamic loads of the dropper in a pantograph–catenary interaction system. However, the calculation efficiency is also an important case in the simulation process, especially when considering the large-scale pantograph–catenary model and multi-condition simulation (like variable speed and tension). Therefore, the calculation efficiency of different droppers is further investigated.
Based on the above Guangzhou–Shenzhen high-speed railway case, the beam and rod element dropper models are further considered in the present FEM-based pantograph–catenary interaction case. The train runs along the catenary in 8 s with a constant velocity of 350 km/h, based on the present pantograph–catenary interaction model, and the CPU time of the whole simulation process with respect to different dropper models is recorded and compared with each other. The corresponding CPU times are shown in Table 1. Table 1 shows that the CPU times of the pantograph–catenary interaction model with the rod model are shorter than those of the beam model at different vehicle speeds. When V = 250 km/h, the CPU times of the present pantograph–catenary interaction model with the rod and beam model are 1434 s and 2533 s, respectively, and they become 1467 s and 2724 s when V = 400 km/h. Based on these results, the rod dropper model can result in a more efficient pantograph–catenary interaction model, and its calculation accuracy is maintained. To accurately and efficiently simulate the dropper dynamic loads without additional work, it is suggested to use a rod model in the FEM-based pantograph–catenary interaction system.

5. Conclusions

In the pantograph–catenary interaction system, different dropper models are developed for different kinds of investigations. However, which one is more suitable for the dropper dynamic load analysis has not been studied so far. In this work, the influence of different dropper models in the pantograph–catenary interaction system on dropper load simulation is analyzed to choose an accurate and efficient dropper model. Based on the existing pantograph–catenary interaction model and Euler beam element, a FEM-based pantograph–catenary interaction system is formulated, and rod, beam, and bi-linear spring element models are considered to model the dropper. After the validation of the models, the influence of different dropper models on the dropper dynamic loads and pantograph–catenary interaction dynamics is analyzed, and the influence of the stiffness and vehicle velocity on the dropper models’ accuracy is investigated. Finally, the influence of dropper models on the pantograph–catenary system calculation efficiency is studied.
Based on the investigation results, the following conclusions can be drawn:
  • The bilinear spring model can only be used for generalized pantograph–catenary interaction dynamic analysis. While the pantograph–catenary interaction model with the bilinear spring dropper model can obtain accurate pantograph–catenary contact force results, the dropper dynamic loads from the bilinear spring model are different from those from the measurement data, and their maximum relative difference can reach 8.7%. When considering different droppers in one span, this maximum relative difference can even reach 45% compared to the rod element model. In addition, the original stiffness of the bilinear spring model can also result in inaccurate results. Therefore, the bilinear spring model can not be used for dropper dynamic analysis.
  • Both the beam and rod dropper models can accurately simulate the dropper loads in the present FEM-based pantograph–catenary system for different droppers, and their maximum relative difference compared to the measurement data is no more than 3.6% in different models. But the calculation efficiency of the pantograph–catenary system with the rod element model is higher than that of the beam element model, where its CPU time is only half that of the beam element model. Therefore, to accurately and efficiently present the dropper dynamic loads of the catenary system under pantograph–catenary interactions, it is suggested to use the rod model in the pantograph–catenary system.

Author Contributions

Conceptualization, L.P. and L.C.; methodology, L.P.; software, Y.X.; validation, Y.X., B.D. and X.G.; formal analysis, X.G.; investigation, L.P.; resources, L.P.; data curation, B.D.; writing—original draft preparation, L.P.; writing—review and editing, W.Z.; visualization, W.Z.; supervision, W.Z.; project administration, W.Z.; funding acquisition, L.P. All authors have read and agreed to the published version of the manuscript.

Funding

This work is supported by the National Natural Science Foundation of China (grant number 12302048), China Railway Group (grant number K2024B003), and China Academy of Railway Sciences (grant number 2024YJ163).

Data Availability Statement

The data will be provided upon request.

Conflicts of Interest

Authors Like Pan, Liming Chen, Bo Dong and Xiaoli Guo were employed by the company China Academy of Railway Sciences Co., Ltd. The remaining authors declare that the research was conducted in the absence of any commercial or financial relationships that could be construed as a potential conflict of interest.

References

  1. Qin, Y.; Xiao, S.; Lu, L.; Yang, B.; Zhu, T.; Yang, G. Fatigue failure of integral droppers of high-speed railway catenary under impact load. Eng. Fail. Anal. 2022, 134, 106086. [Google Scholar] [CrossRef]
  2. Liu, G.; Ding, N.; Zhou, J.; Xu, N.; Guo, W. Fracture failure of dropper wires in the Power Supply System of a subway line. J. Fail. Anal. Prev. 2021, 21, 370–375. [Google Scholar] [CrossRef]
  3. Liu, L.; Ding, N.; Xu, N.; Guo, W.; Shi, J.; Li, N.; Zhang, L.; Meng, B.; Zairi, F. Failure analysis and optimization of a suspended structure in the power supply system of the subway. Eng. Fail. Anal. 2020, 115, 104619. [Google Scholar] [CrossRef]
  4. Liu, X.-Y.; Peng, J.-F.; Tan, D.-Q.; Xu, Z.-B.; Liu, J.-H.; Mo, J.-L.; Zhu, M.-H. Failure analysis and optimization of integral droppers used in high speed railway catenary system. Eng. Fail. Anal. 2018, 91, 496–506. [Google Scholar] [CrossRef]
  5. Lee, G.-c.; Lee, T.-h.; Lee, J.-w. Mechanical loads of dropper for high speed electric railway. J. Korean Soc. Railw. 2011, 14, 222–227. [Google Scholar] [CrossRef]
  6. Pan, L.; Chen, L.; Zhang, H.; Xing, T.; Yang, C.; Dong, G. Study on numerical simulation method and dynamic force of dropper of a catenary system. Adv. Mech. Eng. 2023, 15, 16878132221143027. [Google Scholar] [CrossRef]
  7. Cho, Y.H. Numerical simulation of the dynamic responses of railway overhead contact lines to a moving pantograph, considering a nonlinear dropper. J. Sound Vib. 2008, 315, 433–454. [Google Scholar] [CrossRef]
  8. Cho, Y.H.; Lee, K.; Park, Y.; Kang, B.; Kim, K.-n. Influence of contact wire pre-sag on the dynamics of pantograph–railway catenary. Int. J. Mech. Sci. 2010, 52, 1471–1490. [Google Scholar] [CrossRef]
  9. Song, Y.; Antunes, P.; Pombo, J.; Liu, Z. A methodology to study high-speed pantograph-catenary interaction with realistic contact wire irregularities. Mech. Mach. Theory 2020, 152, 103940. [Google Scholar] [CrossRef]
  10. Zhang, W.; Mei, G.; Zeng, J. A study of pantograph/catenary system dynamics with influence of presag and irregularity of contact wire. Veh. Syst. Dyn. 2002, 37, 593–604. [Google Scholar] [CrossRef]
  11. Pombo, J.; Ambrósio, J.; Pereira, M.; Rauter, F.; Collina, A.; Facchinetti, A. Influence of the aerodynamic forces on the pantograph–catenary system for high-speed trains. Veh. Syst. Dyn. 2009, 47, 1327–1347. [Google Scholar] [CrossRef]
  12. Bucca, G.; Collina, A. A procedure for the wear prediction of collector strip and contact wire in pantograph–catenary system. Wear 2009, 266, 46–59. [Google Scholar] [CrossRef]
  13. Liu, Z.; Jönsson, P.-A.; Stichel, S.; Rønnquist, A. Implications of the operation of multiple pantographs on the soft catenary systems in Sweden. Proc. Inst. Mech. Eng. Part F J. Rail Rapid Transit. 2016, 230, 971–983. [Google Scholar] [CrossRef]
  14. Song, Y.; Wang, Z.; Liu, Z.; Wang, R. A spatial coupling model to study dynamic performance of pantograph-catenary with vehicle-track excitation. Mech. Syst. Signal Process. 2021, 151, 107336. [Google Scholar] [CrossRef]
  15. Antunes, P.; Ambrósio, J.; Pombo, J.; Facchinetti, A. A new methodology to study the pantograph–catenary dynamics in curved railway tracks. Veh. Syst. Dyn. 2020, 58, 425–452. [Google Scholar] [CrossRef]
  16. Nåvik, P.; Rønnquist, A.; Stichel, S. Variation in predicting pantograph–catenary interaction contact forces, numerical simulations and field measurements. Veh. Syst. Dyn. 2017, 55, 1265–1282. [Google Scholar] [CrossRef]
  17. Song, Y.; Rønnquist, A.; Jiang, T.; Nåvik, P. Identification of short-wavelength contact wire irregularities in electrified railway pantograph–catenary system. Mech. Mach. Theory 2021, 162, 104338. [Google Scholar] [CrossRef]
  18. Song, Y.; Wang, H.; Frøseth, G.; Nåvik, P.; Liu, Z.; Rønnquist, A. Surrogate modelling of railway pantograph-catenary interaction using deep long-short-term-memory neural networks. Mech. Mach. Theory 2023, 187, 105386. [Google Scholar] [CrossRef]
  19. Chu, W.; Wang, H.; Song, Y.; Liu, Z. FENet: A Physics-Informed Dynamics Prediction Model of Pantograph-Catenary Systems in Electric Railway. IET Intell. Transp. Syst. 2025, 19, e70059. [Google Scholar] [CrossRef]
  20. Song, Y.; Ouyang, H.; Liu, Z.; Mei, G.; Wang, H.; Lu, X. Active control of contact force for high-speed railway pantograph-catenary based on multi-body pantograph model. Mech. Mach. Theory 2017, 115, 35–59. [Google Scholar] [CrossRef]
  21. Wang, X.; Song, Y.; Lu, B.; Wang, H.; Liu, Z. Assessment of current collection performance of rail pantograph-catenary considering long suspension bridges. IEEE Trans. Instrum. Meas. 2025, 74, 7500714. [Google Scholar] [CrossRef]
  22. Peng, C.; Yang, C.; Xue, J.; Gong, Y.; Zhang, W. An adaptive variable-length cable element method for form-finding analysis of railway catenaries in an absolute nodal coordinate formulation. Eur. J. Mech.-A/Solids 2022, 93, 104545. [Google Scholar] [CrossRef]
  23. Facchinetti, A.; Gasparetto, L.; Bruni, S. Real-time catenary models for the hardware-in-the-loop simulation of the pantograph–catenary interaction. Veh. Syst. Dyn. 2013, 51, 499–516. [Google Scholar] [CrossRef]
  24. Xu, Y.; Liu, Z.; Stichel, S.; Zhu, W.; Lei, J.; Yao, Y. A comparative study on the influence of typical track failures on high-speed pantograph-catenary interaction dynamics. Veh. Syst. Dyn. 2024, 62, 2883–2911. [Google Scholar] [CrossRef]
  25. Xu, Y.; Zhu, W.; Fan, W.; Yang, C.; Zhang, W. A new three-dimensional moving Timoshenko beam element for moving load problem analysis. J. Vib. Acoust. 2020, 142, 031001. [Google Scholar] [CrossRef]
  26. Larson, M.G.; Bengzon, F. The Finite Element Method: Theory, Implementation, and Applications; Springer Science & Business Media: Berlin/Heidelberg, Germany, 2013; Volume 10. [Google Scholar]
  27. Yang, C.; Xu, Y.; Zhu, W.; Fan, W.; Zhang, W.; Mei, G. A three-dimensional modal theory-based Timoshenko finite length beam model for train-track dynamic analysis. J. Sound Vib. 2020, 479, 115363. [Google Scholar] [CrossRef]
  28. Tan, P.; Li, X.; Wu, Z.; Ding, J.; Ma, J.; Chen, Y.; Fang, Y.; Ning, Y. Multialgorithm fusion image processing for high speed railway dropper failure–defect detection. IEEE Trans. Syst. Man Cybern. Syst. 2019, 51, 4466–4478. [Google Scholar] [CrossRef]
  29. Yao, Y.; Yang, Z.; Wang, J.; Zhang, W. Analysis of contact force and uplift of pantograph–catenary system in overlap section based on numerical simulations and experimental tests. Veh. Syst. Dyn. 2023, 61, 2492–2515. [Google Scholar] [CrossRef]
  30. Yao, Y.; Zou, D.; Zhou, N.; Mei, G.; Wang, J.; Zhang, W. A study on the mechanism of vehicle body vibration affecting the dynamic interaction in the pantograph–catenary system. Veh. Syst. Dyn. 2021, 59, 1335–1354. [Google Scholar] [CrossRef]
Figure 1. Schematic of the FEM-based pantograph–catenary interaction model.
Machines 13 00874 g001
Figure 2. The dropper dynamic force measurement system: (a) schematic of the system, (b) image recognition system, and (c) data processing system.
Machines 13 00874 g002
Figure 3. The FEM model of the Guangzhou–Shenzhen high-speed railway 20 spans catenary.
Machines 13 00874 g003
Figure 4. Time histories of the dropper loads with respect to different dropper models: (a) rod model; (b) beam model, and (c) spring model.
Machines 13 00874 g004
Figure 5. Statistical results of the dropper loads, the percentage means the relative difference: (a) mean dropper loads and (b) maximum dropper loads.
Machines 13 00874 g005
Figure 6. Time histories of the pantograph–catenary contact forces with respect to different vehicle velocities and dropper models: (a) V = 250 km/h; (b) V = 300 km/h; (c) V = 350 km/h, and (d) V = 400 km/h.
Machines 13 00874 g006
Figure 7. Time histories of the dropper models with respect to different dropper models: (a) the dropper location; (b) dropper 1; (c) dropper 2; (d) dropper 3; (e) dropper 4; (f) dropper 5.
Machines 13 00874 g007
Figure 8. Time histories and maximum relative difference in the dropper loads under different spring model stiffnesses kid for different droppers: (a) time histories of the dropper loads at dropper 3; (b) maximum relative difference compared to the rod model results at dropper 3; (c) time histories of the dropper loads at dropper 2; (d) maximum relative difference compared to the rod model results at dropper 2.
Machines 13 00874 g008
Figure 9. Time histories of the dropper loads at different vehicle velocities at dropper 3: (a) V = 250 km/h; (b) V = 300 km/h; (c) V = 350 km/h, and (d) V = 400 km/h.
Machines 13 00874 g009
Figure 10. Time histories of the dropper loads at different vehicle velocities at dropper 4: (a) V = 250 km/h; (b) V = 300 km/h; (c) V = 350 km/h, and (d) V = 400 km/h.
Machines 13 00874 g010
Figure 11. Maximum relative difference between the spring and rod models at different vehicle velocities.
Machines 13 00874 g011
Table 1. CPU times of the FEM-based pantograph–catenary interaction model with different dropper models at different vehicle velocities.
Dropper Models
RodBeam
Model CPU time (s)V = 250 km/h14342533
V = 300 km/h14522538
V = 350 km/h14442545
V = 400 km/h14672724
Disclaimer/Publisher’s Note: The statements, opinions and data contained in all publications are solely those of the individual author(s) and contributor(s) and not of MDPI and/or the editor(s). MDPI and/or the editor(s) disclaim responsibility for any injury to people or property resulting from any ideas, methods, instructions or products referred to in the content.