Article

Humidity Influence on Aero-Engine Control Plan Inflection Point and Performance

Aviation Engineering School, Air Force Engineering University, Xi’an 710038, China
*
Author to whom correspondence should be addressed.
Machines 2025, 13(9), 860; https://doi.org/10.3390/machines13090860
Submission received: 7 August 2025 / Revised: 8 September 2025 / Accepted: 14 September 2025 / Published: 16 September 2025
(This article belongs to the Section Machine Design and Theory)

Abstract

To investigate the influence of ambient humidity on the aero-engine control plan, a twin-spool mixed-exhaust turbofan aero-engine is used as the research object. After establishing a numerical calculation model of the aero-engine using the component method and incorporating the humidity correction factor into the model, the mechanism of the influence of ambient humidity on the aero-engine’s control plan inflection point and performance is investigated. Furthermore, this paper examines the degradation factors of the performance parameters of each aero-engine component in the model, as well as the impact of the coupling effect of ambient humidity and the degradation of the performance parameters of each component on the aero-engine’s performance. The results show that the control plan inflection point shifts rightward when ambient humidity rises, increasing thrust output beyond the displacement point throughout ground tests, take-off, and cruising conditions. On the other hand, when deterioration and humidity work together, the original inflection point location is typically maintained, and very slight thrust variations occur. However, the growth rate of specific fuel consumption is far higher than when humidity effects are used alone. These results provide important information for enhancing the performance of aviation engines in different humidity and component degradation scenarios.

1. Introduction

Aero-engines serve as the power source for aircraft, providing the necessary propulsion. Engine performance directly influences overall aircraft capabilities. However, during operation, engine performance inevitably degrades due to environmental variations and cumulative operating time, impacting both propulsion efficiency and flight characteristics. Given China’s vast territory, regional environmental differences—such as atmospheric temperature and humidity—significantly affect engine behavior. Typical operating environments include deserts, coastal zones, plateaus, and inland regions, each exerting distinct influences on engine performance. In desert regions, frequent sandstorms lead to dust ingestion, decreasing compressor efficiency. Coastal environments expose engines to salt-laden air from ocean evaporation, forming corrosive salt spray conditions that elevate corrected exhaust gas temperature and accelerate performance degradation. High-altitude environments, characterized by reduced air density, impair air intake and combustion efficiency, resulting in thrust loss. These varied conditions necessitate rapid and accurate assessment of aircraft mission capability based on engine performance characteristics.
To evaluate engine behavior under such diverse environmental conditions, numerical methods for aero-engine performance modeling are employed to determine key performance parameters. Bird et al. [1] proposed a correction method based on absolute humidity, showing that air moisture alters gas turbine performance via condensation effects and changes in working fluid properties. Apostolidis et al. [2] demonstrated that ambient humidity significantly impacts turbofan performance, with absolute humidity fluctuations introducing exhaust gas temperature margin (EGTM) deviations that hinder engine health monitoring. Gardiner et al. [3] developed practical correction factors to improve humidity-adjusted performance analysis. Naeem et al. [4] utilized computer simulations to predict fuel consumption and engine life across varying mission profiles, facilitating optimized maintenance and operational planning. Rhee [5] found that elevated humidity modifies transonic compressor flow via non-equilibrium condensation, shifting shockwaves backward and increasing both suction surface pressure and total loss coefficients. Yamamoto et al. [6] further showed that humidity, combined with aerosol properties, alters condensation–deposition dynamics in transonic compressors, limiting gas turbine output. Yu et al. [7] emphasized the importance of balancing model simplification with physical accuracy in nonlinear control of aero-engines, proposing approximate models with robust identification capabilities. Chen et al. [8] developed real-time aero-engine models to enhance the adaptability and reliability of control systems. Martínez et al. [9] investigated the effect of excess air on gas turbine performance, developing a comprehensive equation for turbine inlet temperature calculation that accounts for both pressure ratio and humidity, while demonstrating that dry air conditions yield higher calculated values than actual wet air operation. Li et al. [10] reported progress toward digital twin lifecycle management of main shaft bearings, emphasizing intelligent precision manufacturing and predictive maintenance. Wang et al. [11] introduced a dual-dimensional evaluation framework that integrates coupled and active performance through networked dynamic modeling, offering new avenues for fault diagnosis and digital engineering. Wang et al. [12] performed turboshaft engine sand ingestion experiments, demonstrating that prolonged sand exposure shifts the engine’s operating line upward, increases exhaust temperatures, and reduces output power.
Since the 1970s, NASA’s Lewis Research Center has developed computational tools such as GENENG, GENENG II, and DYNGEN for performance modeling [13]. Numerous studies have since addressed the influence of humidity. Kurzke introduced a method for scaling engine component characteristics using reference point-based corrections [14]. Li et al. developed a modified least squares method for simplifying off-design performance prediction [15] and an adaptive thermodynamic algorithm based on particle swarm optimization for gas turbines [16]. Pang proposed a chain-derivation method that computes exact aero-engine derivatives directly during component modeling, cutting computation time by 54–55% versus finite-difference approaches in both steady and transient states [17]. Lin et al. demonstrated that increased intake temperature and humidity reduce diesel engine power while exacerbating fuel consumption and pollutant emissions—particularly under high-temperature, high-humidity conditions [18]. Nikolaidis established a comprehensive model predicting engine performance degradation due to rainwater ingestion, identifying coupled mechanisms such as water film formation in compressors and combustor deterioration [19]. Castiglione et al. [20] presented two linearized models (Small Perturbation and System Identification) for direct fuel control in degraded engines, with Small Perturbation showing better accuracy for control applications. Zhang et al. [21] established an aeroengine component-level model that accounted for component performance degradation. Their results demonstrated that performance degradation would cause the control plan inflection point to shift leftward.
Critical parts like turbine blades and high-pressure compressors are exposed to extended high-load situations during aero-engine operation, which makes performance loss from wear and tribology especially noticeable. Utilizing cutting-edge tribological optimization technologies, including surface enhancement methods or composite materials, can greatly lower mechanical losses and increase component service life. According to a study by Milojević et al. [22] on cast iron-reinforced aluminum alloy cylinders, the impact of sliding speed and contact pressure on material wear can be successfully reduced by the thoughtful design of contact surface characteristics. This study offers important new information for the tribological design of lightweight aero-engine parts.
Prior studies have demonstrated that ambient humidity can impact aero-engine component performance. Additionally, the aero-engine’s component performance will deteriorate with increased use over time. The leftward control plan inflection point will affect the engine’s performance. Additionally, the vast majority of academics nowadays have researched several engine performance calculation techniques. The studies mentioned above show that the majority of the literature does not examine the factors that connect humidity and component performance degradation, nor does it examine the impact of ambient humidity on the aero-engine’s control plan inflection point and performance. Notably, an investigation of ambient humidity’s impact on multivariate composite control plans for aero-engines is crucial for determining the engine’s ultimate performance. It also offers a theoretical foundation for calculating the rate at which component performance deteriorates in the external environment.
This paper uses a twin-spool mixed-exhaust turbofan as the research object in order to achieve a more accurate performance evaluation. The model of the engine is established using the component method, and the environmental humidity correction factor is introduced into the model. The main objective of this study is to systematically investigate the impact of environmental humidity on the control plan inflection point of the aero-engine and its performance during ground tests, take-off, and cruising conditions. Furthermore, this study examines how component performance degradation and ambient humidity interact to affect aero-engine performance. The performance data gathered for this paper’s aero-engine components and overall performance are relative values.

2. Numerical Model

2.1. Humidity

Aero-engines are typically modeled using ideal dry air as the working fluid. However, in actual operation, the ingested air often contains water vapor, resulting in humid air conditions. Across different geographic regions—from warm, humid southern climates to cold, dry northern zones—the properties of intake air, including the gas constant (R), specific heat at constant pressure (Cp), and adiabatic index (k), vary significantly due to environmental changes. These variations exert a non-negligible influence on engine performance.
Among environmental variables, humidity—quantified as relative or absolute humidity—characterizes the water vapor content in the atmosphere [1]. At a given ambient temperature and pressure, air can hold only a limited amount of water vapor. In engineering practice, relative humidity and humidity ratio are commonly used representations. While relative humidity is easier to measure, the humidity ratio is more suitable for thermodynamic calculations. Unless otherwise specified, the term humidity in this study refers to the humidity ratio, denoted by d.

2.2. Component-Level Model

The C programming language was used to create the component-level numerical model of the aero-engine that was reported in this work.
Aero-engines comprise multiple components, each with distinct functional characteristics and computational models. These components sequentially execute specific thermodynamic processes along the working fluid path, making them amenable to abstraction as mathematical submodels. Despite the complexity of overall fluid dynamics, the thermodynamic behavior of individual components tends to be relatively stable and predictable. This approach—calculating total engine performance based on detailed simulation of component-level behavior—is known as component-level modeling [23]. In this study, a component-level model is developed for a small-bypass-ratio, twin-spool, mixed-flow turbofan engine equipped with an afterburner. This paper takes the AL-31F twin-spool, mixed-flow turbofan engine as the research object. Under the given conditions of the characteristics of each component of the aero-engine and the system control laws, following the component sequence of the aero-engine, from the inlet to the nozzle, the gas flow process and thermodynamic process equations for each component are established one by one. Between components, physical balance conditions such as flow continuity, pressure balance, and power balance must be satisfied; i.e., these three balance conditions determine the stability and balance of the engine’s operation.
The structure of the AL-31F component-level model in this paper is shown in Figure 1. The AL-31F engine’s design-point relative thrust and specific fuel consumption (sfc) are 0.77256 daN and 81.52 kg/(daN·s), respectively.
In modeling terminology, the thermodynamic state at each component interface is described by cross-section parameters. To distinguish between these, a cross-section numbering system is employed (as illustrated in Figure 1). For example, cross-section 2B refers to the high-pressure compressor inlet, while cross-section 3 denotes both the high-pressure compressor outlet and the combustor inlet. The convention “cross-section parameter + station number” is used to identify conditions at a specific interface—for instance, T 5 * is the turbine outlet temperature at cross-section 5.
The balance equations for the turbofan engine studied herein are shown in Equations (1)–(6) [24].
e 1 = N L T × η L T N L C N L C ,
e 2 = N H T × η H T N H C N H C ,
e 3 = W H T c o r W H T c a l W H T c a l ,
e 4 = W L T c o r W L T c a l W L T c a l ,
e 5 = P 55 s P 25 s P 25 s ,
e 6 = P 7 σ 7 P 8 P 8 ,
In the equations, W H T c o r , W L T c o r , W H T c a l , W L T c a l represent the flow functions calculated based on turbine and compressor characteristics; N H T , N L T , N H C , N L C denote the work output of high/low-pressure turbines and the work input to high/low-pressure compressors; P 55 s , P 25 s indicate the static pressures at the outer and inner bypass exits; P 7 , P 8 represent the total pressures at the nozzle inlet and throat; η L T , η H T , σ 7 signify the low-pressure rotor mechanical efficiency, high-pressure rotor mechanical efficiency, and nozzle total pressure recovery coefficient respectively. The relative residual, denoted by the letters e 1 ~ e 6 , shows the discrepancy between the calculated and actual values.
Fan pressure ratio function Z C L , high-pressure rotor speed n H , high-pressure compressor pressure ratio function Z C H , turbine inlet gas temperature T 4 * , high-pressure turbine flow function W T H , and low-pressure turbine flow function W T L are among the parameters that are given initial values. The system of nonlinear equations is then solved iteratively using a Newton–Raphson approach until a combination of values is obtained that minimizes all errors near zero, thereby identifying the engine equilibrium point.
The maximum thrust control plan of this twin-spool turbofan engine implements segmented regulation based on variations in inlet total temperature T 1 * [23]. The parameters in the series of functions describing engine operation are not mutually independent. For the off-design performance of a twin-spool mixed-flow turbofan engine, six independent variables are typically selected among all unknown variables [20], with the specific selection varying according to different control laws. The engine balance equation solution problem consequently becomes the following: determining the solution of the nonlinear equation system composed of error equations under given control laws.

2.3. Model Validation

In order to validate the reliability and accuracy of the above component-level model calculations, the model-calculated thrust data are compared with the ground test data of the development aero-engine provided by the manufacturer at different altitudes and Mach numbers [25].
The speed–altitude characteristics of the aero-engine are shown in Figure 2, from which it can be seen that at an altitude of h = 2 km and Ma = 1.3, the relative error between the calculated data and the test data is 5.2% at most, which meets the requirements of engineering calculations. The calculation results of the model are basically consistent with the test data, indicating that this model can be used to calculate the aero-engine performance data.

2.4. Control Plan Inflection Point Temperature

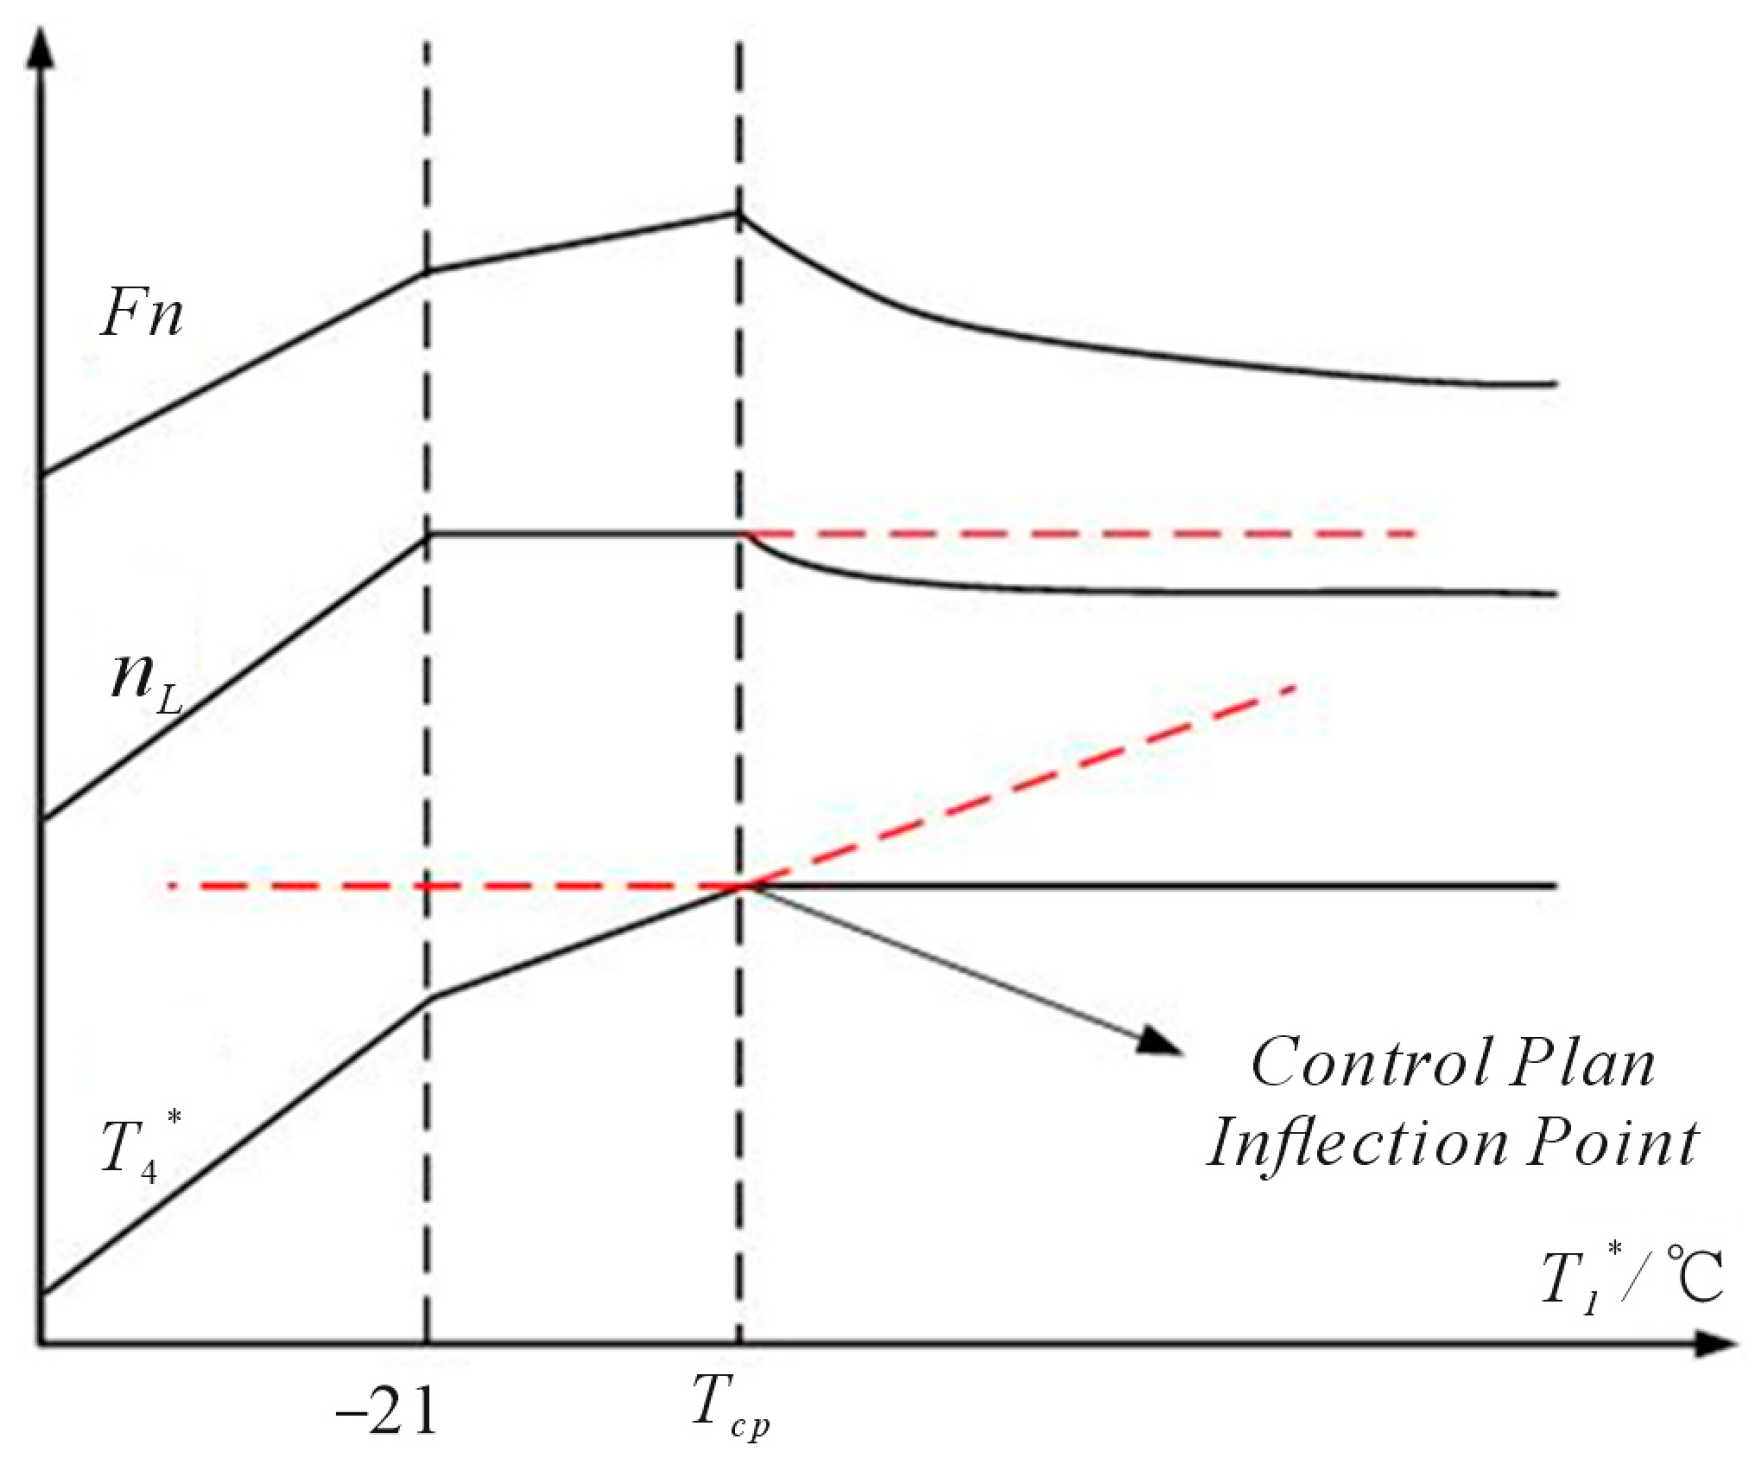
The following defines an aero-engine’s control plan inflection point temperature: the point at which the engine transitions from the primary control plan ( n L channel) to the temperature-limiting control plan ( T 4 * channel) is known as the control plan inflection point [21]. This point’s aero-engine T 1 * is known as the control plan inflection point temperature.
The connection between the control plan and the inflection point temperature is depicted in Figure 3. The design-condition control plan inflection point temperature (288.15 K) is represented by T c p , the turbine inlet gas temperature by T 4 * , thrust by F, the low-pressure rotor physical speed by n L , and the aero-engine inlet total temperature by T 1 * .
The primary control plan ( n L channel) is carried out when T 1 * T c p , as the figure illustrates. F keeps increasing as T 1 * rises. The temperature-limiting control plan ( T 4 * channel) is triggered when T 1 * > T c p . As T 1 * increases further, F exhibits a decreasing pattern, and n L falls.

3. Ambient Humidity Correction Model

Component performance data are generally obtained using dry air under standard conditions. During off-design simulations, similarity theory is applied to extrapolate component characteristics to current operating states. However, the presence of humidity alters gas thermodynamic properties, necessitating corrections to these extrapolated parameters. Prior research indicates that humidity most strongly affects the performance of compressors and turbines. Accordingly, this study focuses on modeling their behavior under humid conditions.
For compressors and turbines operating in both dry and humid environments—assuming identical geometry and neglecting gravitational effects—Reynolds number scaling occurs naturally [26]. According to similarity theory, operating similarity is achieved when axial and circumferential Mach number at the inlet are preserved. This leads to correction formulas, where subscripts d and mix denote dry and humid air, respectively.
Rotary speed correction
( N T T ) d ( N T T ) m i x = R d R m i x k d k m i x ( k m i x + 1 k d + 1 ) ,
Flow correction
( W T T P T ) d ( W T T P T ) m i x = R m i x R d ( 2 k d + 1 ) k d + 1 2 ( k d 1 ) ( k m i x + 1 2 ) k m i x + 1 2 ( k m i x 1 ) ,

Numerical Model for Humidity Correction

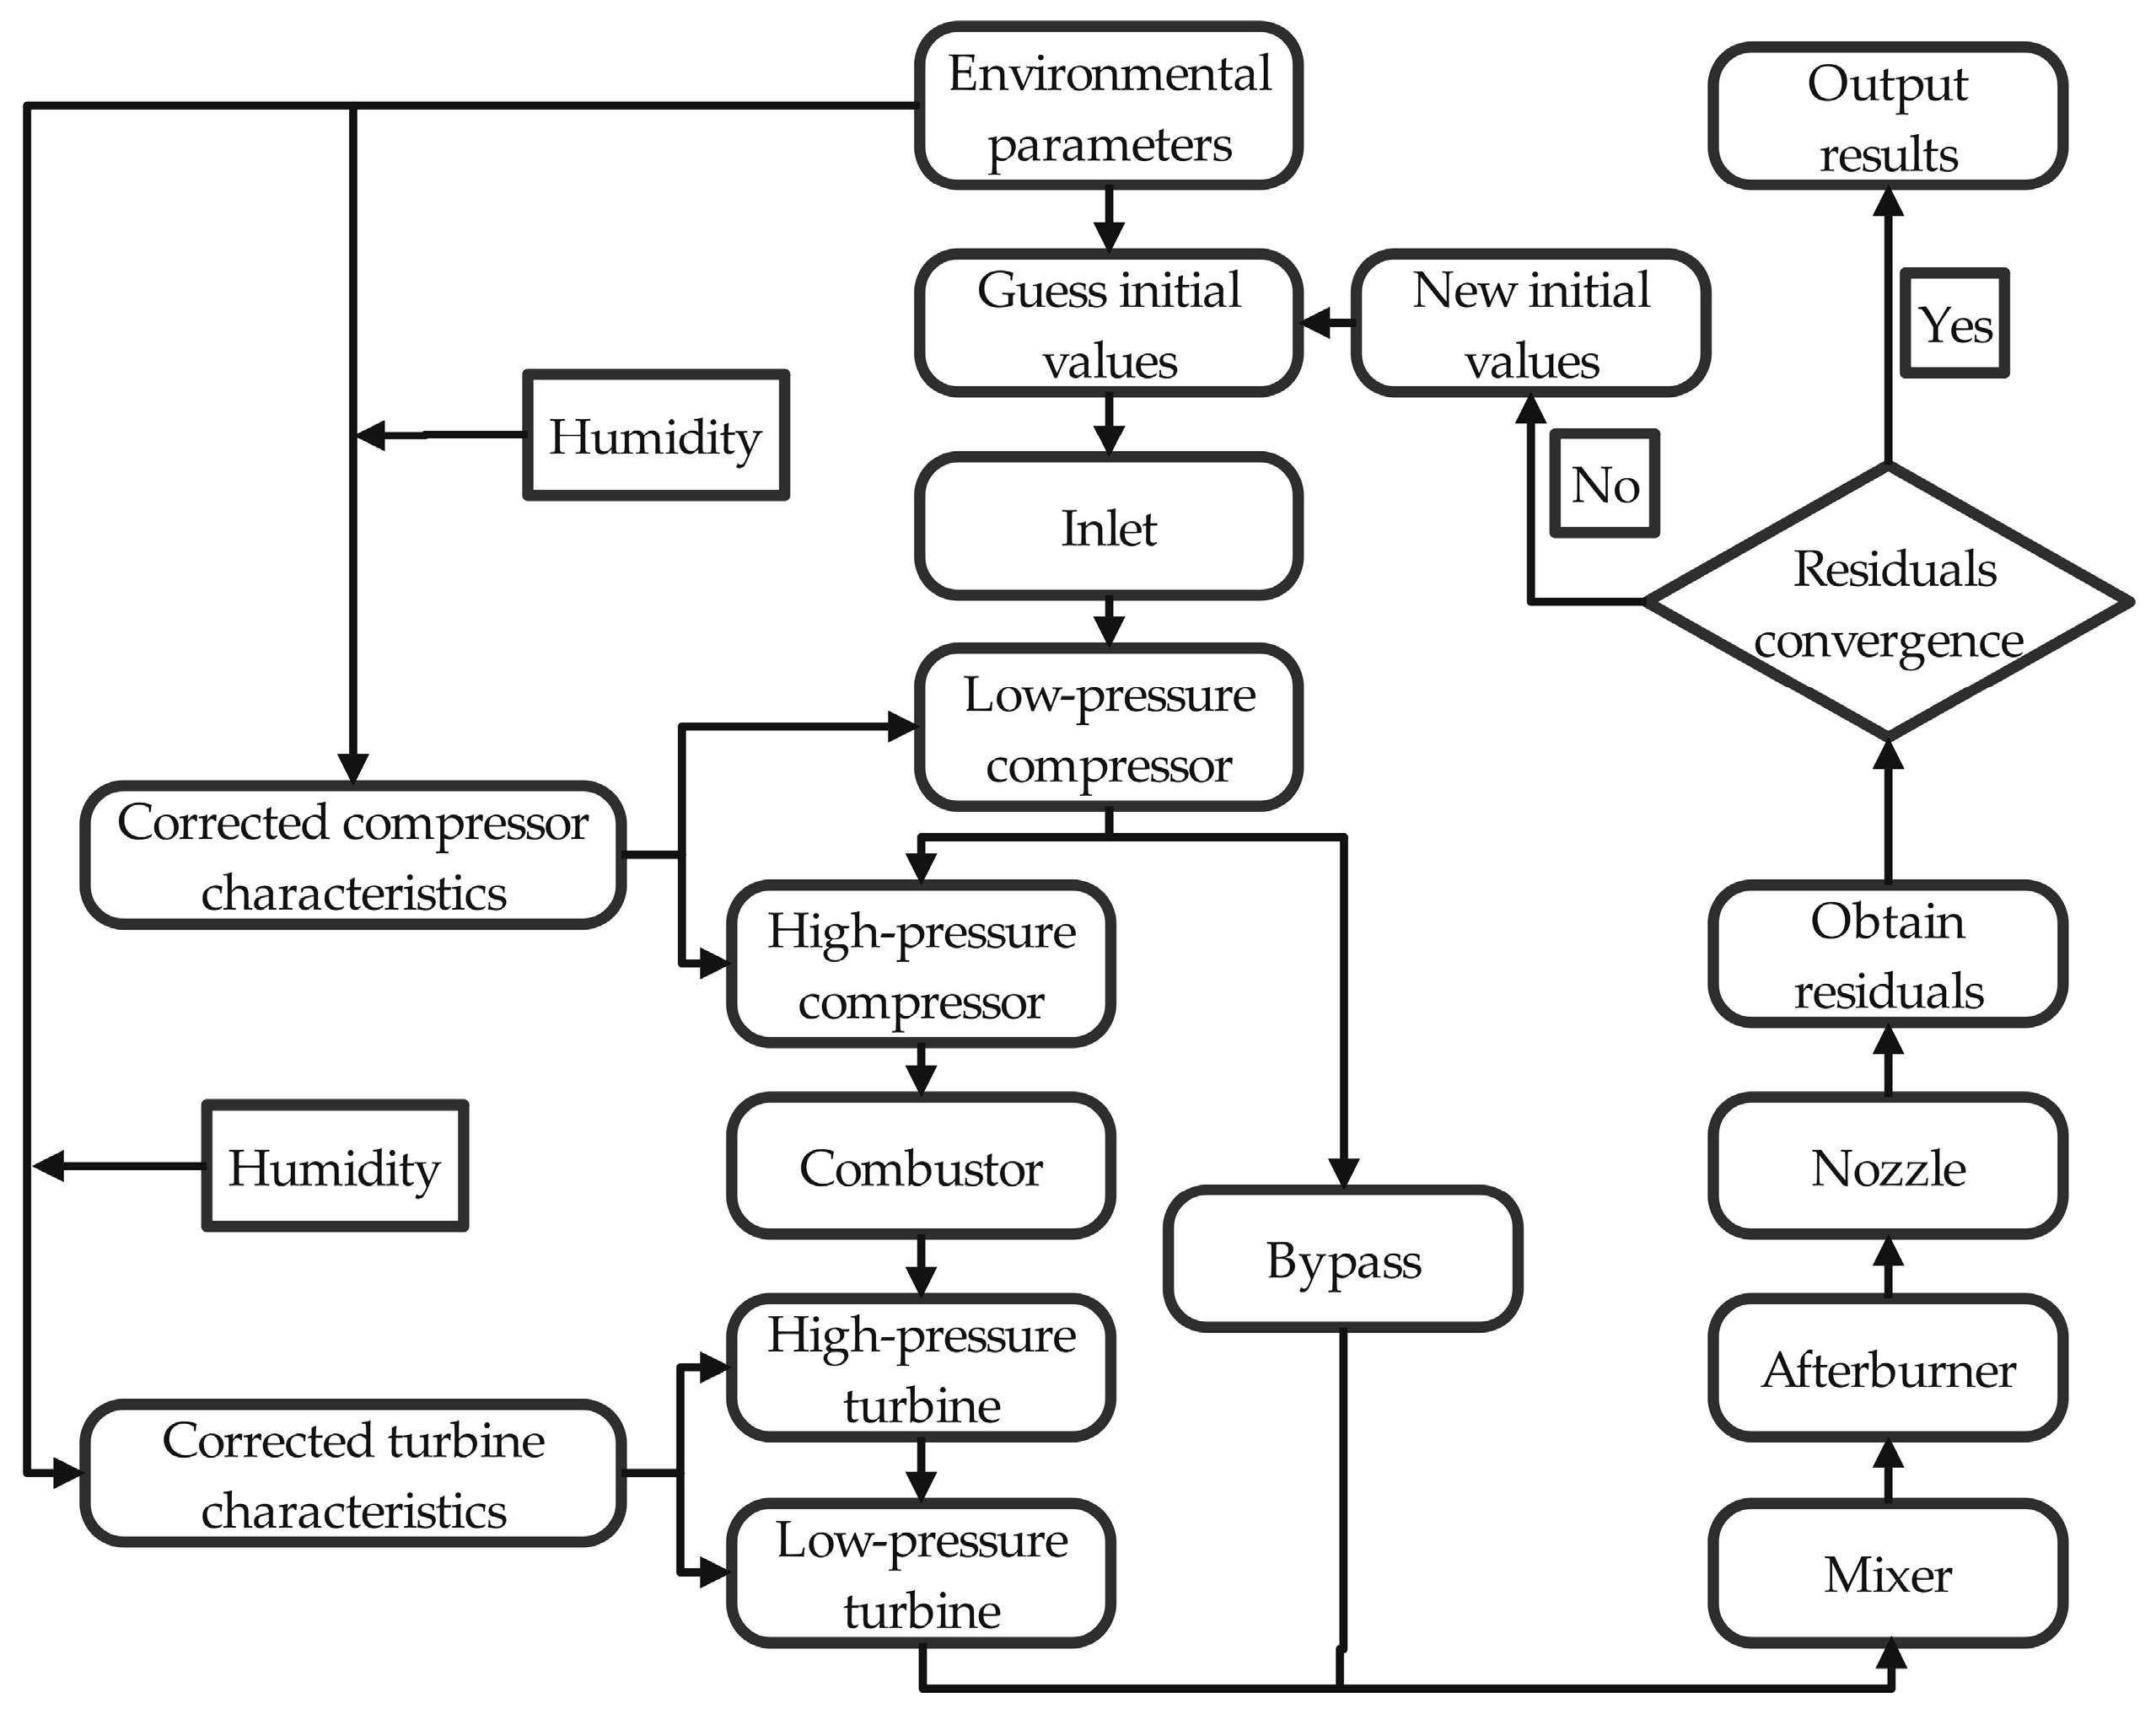
By incorporating humidity correction into the component-level models, a comprehensive engine simulation framework with humidity adaptability is developed [20]. This enables performance prediction under varying humidity conditions. The modeling workflow is illustrated in Figure 4.

4. Results of Analysis

4.1. Influence of Ambient Humidity on Engine Control Plan

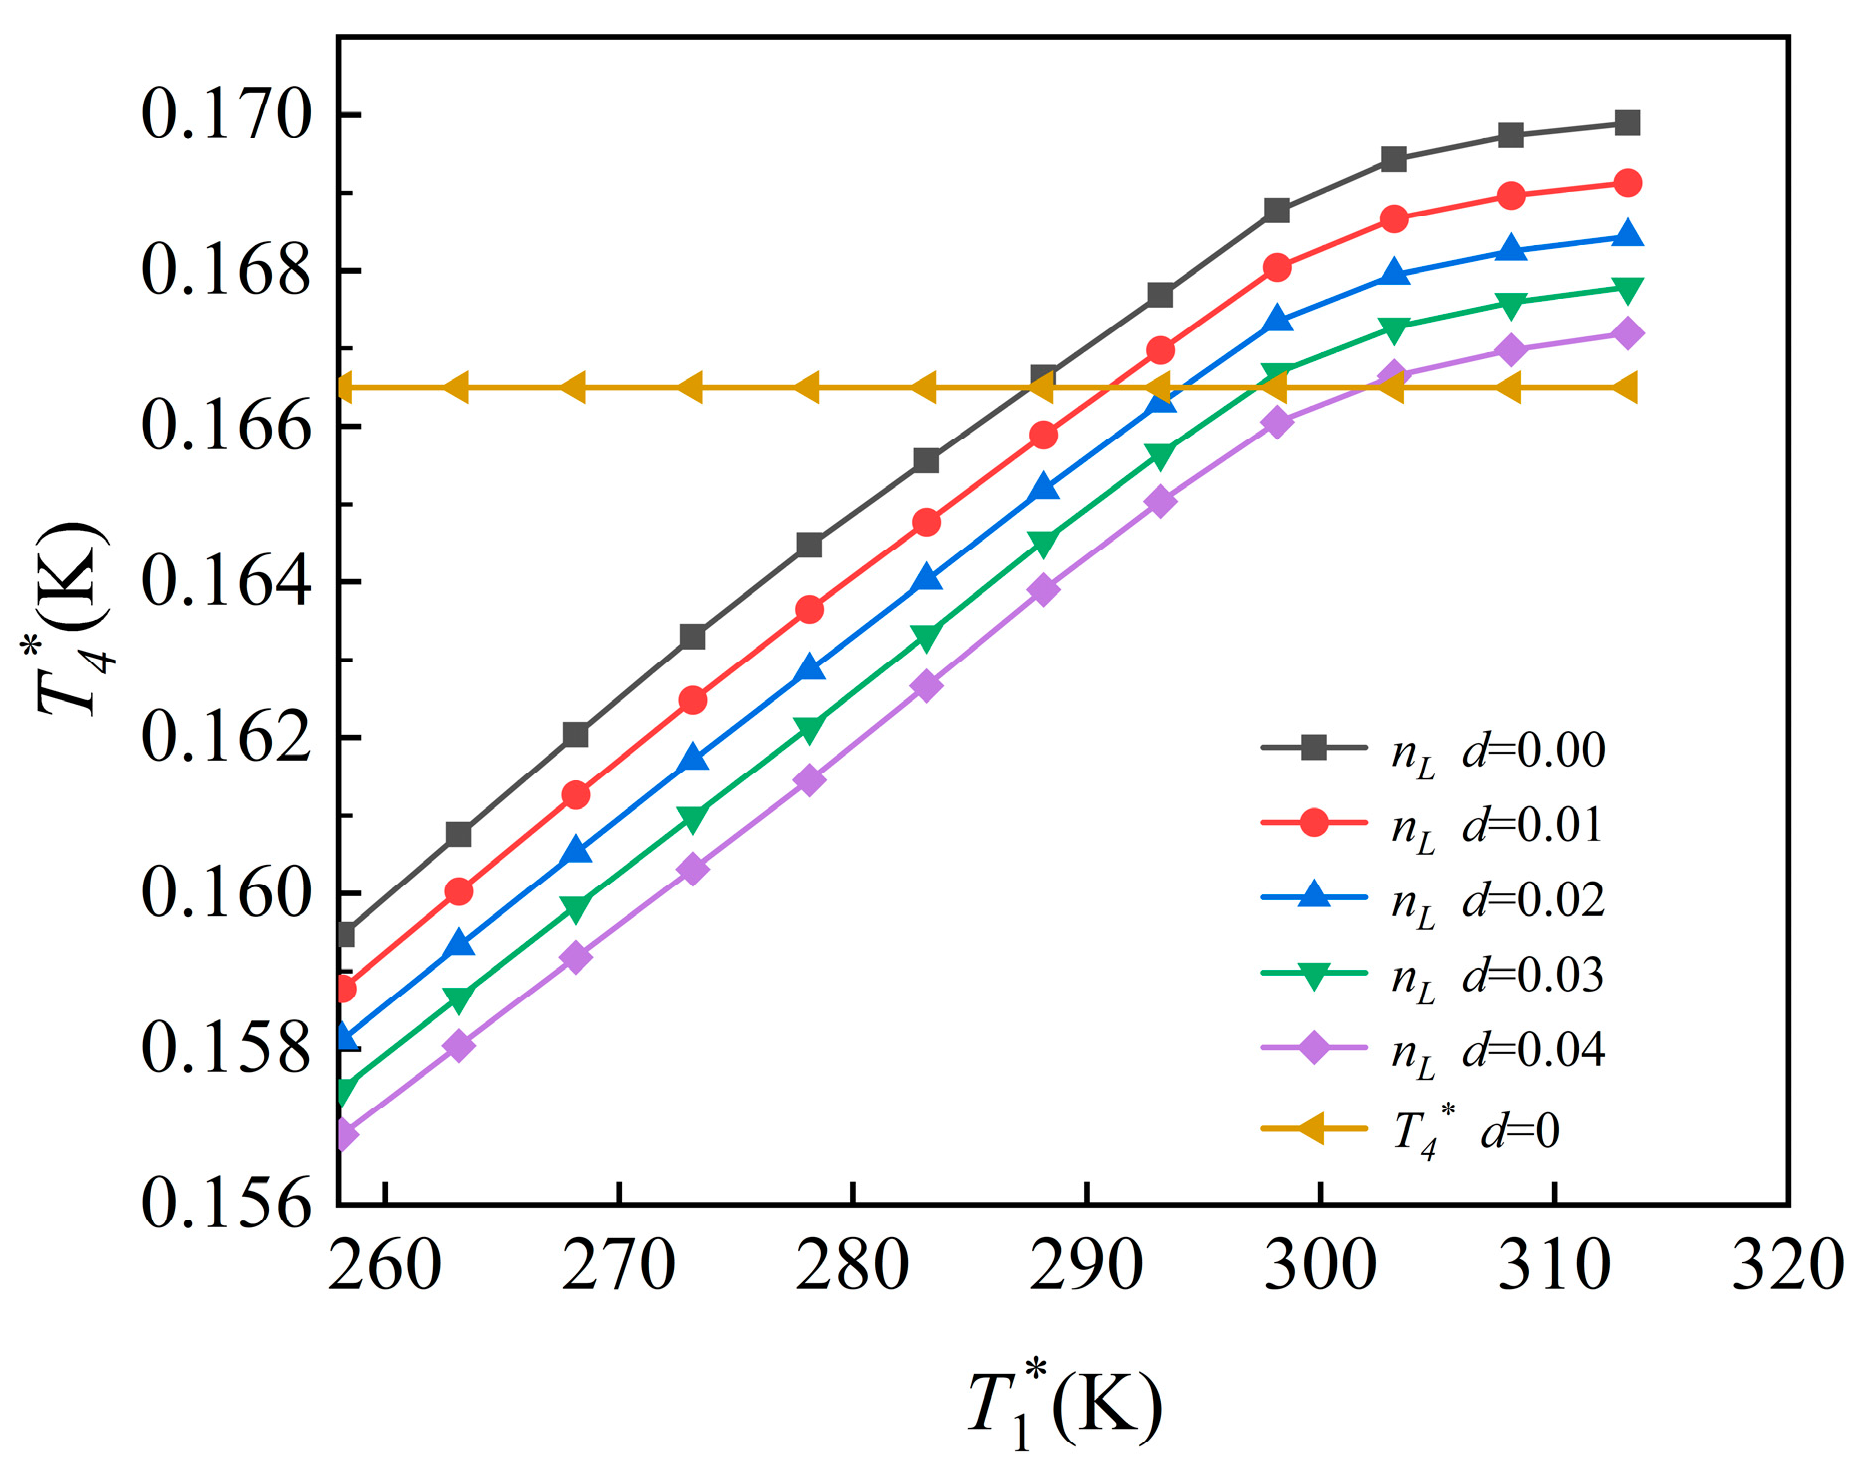
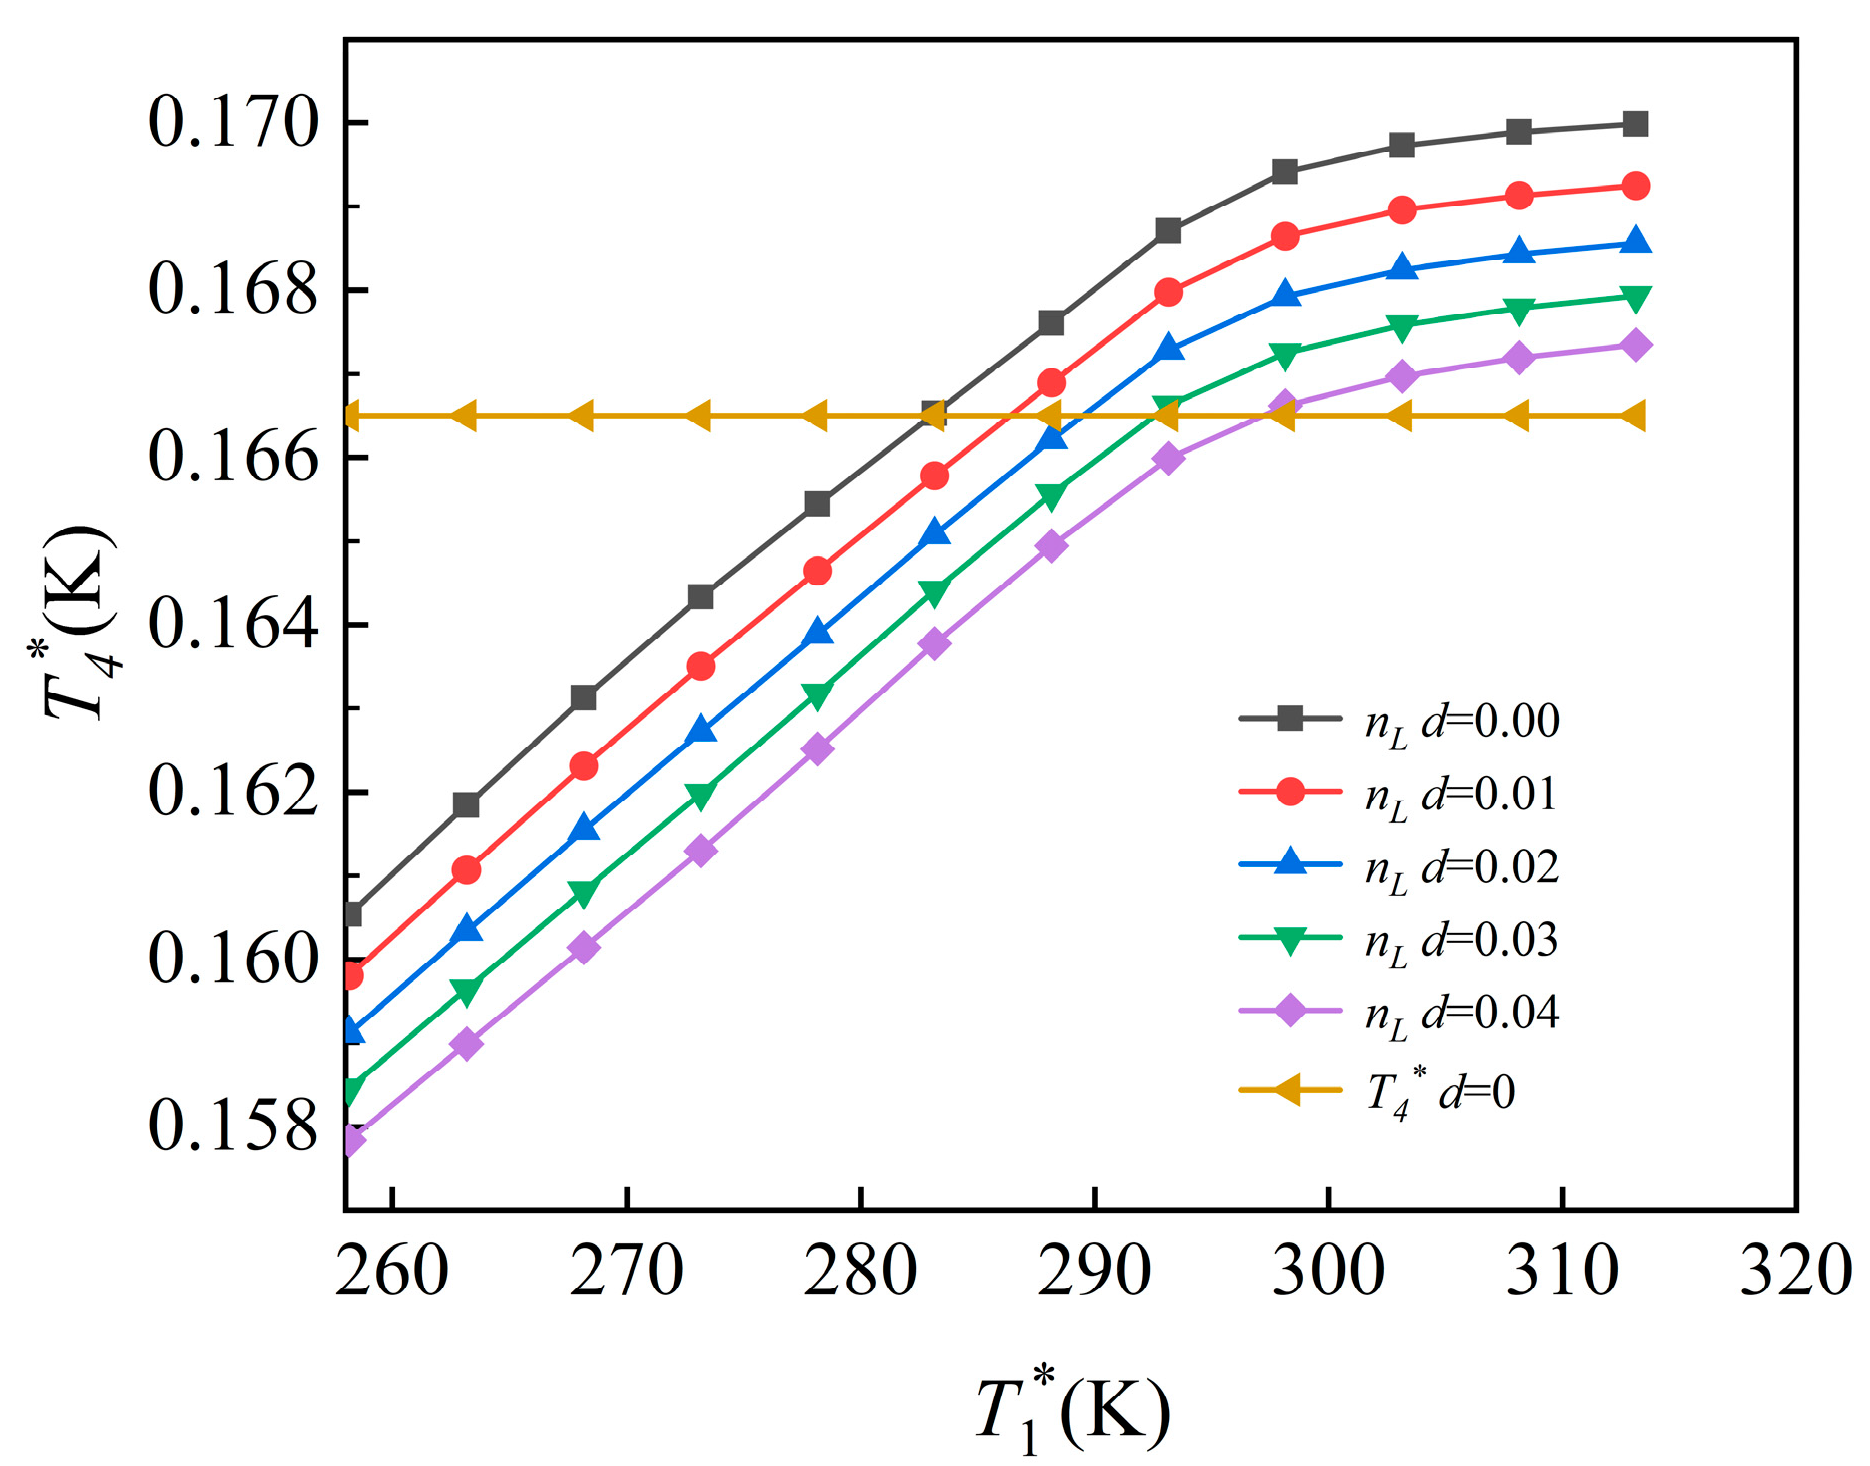
Simulation results reveal that the engine control plan shifts with increasing humidity. Over prolonged operation, the maximum regime regulation is delayed, evidenced by a rightward shift of the control plan inflection point. Under control strategies based on either low-pressure rotor physical speed n L or turbine inlet gas temperature T 4 * single-variable control plan, the variations in turbine inlet gas temperature are shown in Figure 5. According to engine matching principles, the turbine pressure drop ratio π T remains constant during T 4 * control, producing a linear exhaust gas temperature trend across ambient temperatures. Moreover, ambient humidity does not influence exhaust gas temperature under control. Therefore, Figure 5 shows only the exhaust gas temperature curve at the humidity ratio d = 0 during T 4 * , as it equally represents the control behavior at all humidity variations during T 4 * control.
Figure 5 depicts T 4 * as a function of ambient temperature and humidity at sea level (h = 0 km, Ma = 0). The control plan inflection point is where the curve and the straight line cross. The control plan inflection point shifts rightward as humidity rises, as seen in the figure. At d = 0, the control plan inflection point occurs at 288.15 K. When humidity increases to 0.01, the n L control plan delays by 3.38 K until T 4 * reaches its limit, causing the control plan inflection point to shift rightward and transition to T 4 * regulation; at d = 0.04, the delay extends to 14.28 K. In the original control plan, the transition from n L to T 4 * control occurs precisely at the inflection point. The constant T 4 * line shown for d = 0 does not represent actual operation below the inflection temperature. Similarly, for the low-pressure rotor speed when the inlet temperature exceeds the inflection point temperature, the upper portion of the curve above the straight line does not represent the actual control plan due to aerodynamic relationships because the constant T 4 * control plan is implemented thereafter. Neither the straight line representing T 4 * control nor the segment before its intersection with the humidity-adjusted n L control curve reflects a real control plan.
Figure 6 presents T 4 * variations similar results at h = 0 km and Ma = 0.2. The inflection point temperature at d = 0 is 283.03 K. Humidity levels of 0.01 and 0.04 delay the n L control transition by 3.35 K and 14.17 K, respectively, until T 4 * reaches its limit., indicating a substantial shift in the regulation transitions to T 4 * control.
Figure 7 displays the T 4 * variations at h = 5 km and Ma = 0.8. The baseline inflection temperature at d = 0 is 255.31 K. Increasing humidity to 0.01 results in a 3.14 K delay the n L control plan until T 4 * reaches its limit, while a humidity level of 0.04 shifts the control transition point rightward by 13.31 K, transitioning to T 4 * regulated control, again indicating significant regulation delay under humid conditions.
A comparative analysis of the three operating conditions reveals that the control plan inflection point temperature decreases with increasing Mach number and altitude relative to the baseline (Ma = 0, h = 0 km), accompanied by variations in the initial turbine inlet gas temperature. At h = 0 km and Ma = 0.2, the inflection point temperature decreases by an average of 5.18 K, while at h = 5 km and Ma = 0.8, the reduction reaches 33.31 K.

4.2. Influence of Control Plan Inflection Point Variations on Aero-Engine Performance

This section examines the effects of control plan inflection point shifts on engine performance under three representative conditions: ground testing, takeoff roll, and in-flight operation.

4.2.1. Performance Analysis Under Ground Test Conditions

Engine thrust and sfc characteristics are evaluated using corrected component performance parameters. Figure 8 illustrates how variations in the control plan inflection point affect engine thrust at different inlet gas temperatures under static conditions (h = 0 km, Ma = 0). Performance simulations show that increasing ambient humidity raises the control plan inflection point temperature while reducing thrust at the inflection point. Specifically, as humidity increases from 0 to 0.04 in 0.01 increments, the inflection point temperature shifts rightward by 3.38 K at d = 0.01 and 14.28 K at d = 0.04, with an associated average thrust reduction of 1.63%.
As inlet gas temperature increases from 258.15 K to 313.15 K, the engine initially controls fuel supply to maintain n L until T 4 * reaches a limit, at which point the control parameter shifts from n L to T 4 * . Rising inlet temperatures reduce the corrected low-pressure rotor speed and pressure ratio, leading to decreased thrust. The thrust-temperature curve exhibits a slope discontinuity that defines the control plan inflection point.
Under n L control before the d = 0 inflection point temperature, thrust decreases with humidity at an average rate of 0.56%. Conversely, under T 4 * control, after the inflection point shifts (d = 0.04), thrust increases with humidity at an average rate of 0.53%. As shown in Figure 9, the humidity-induced delay in the control plan inflection point remains constant n L until reaching the shifted inflection point, after which n L decreases more gradually. This delayed speed reduction maintains higher rotor speeds, explaining the observed thrust increase with humidity under inflection point shifted conditions.
Figure 10 shows that sfc initially increases, then decreases after the control plan inflection point, and subsequently rises again. At d = 0.04, sfc exhibits a monotonic increase. For a constant engine inlet temperature, sfc increases with ambient humidity, consistent with a rightward shift in the control plan inflection point. When humidity increases in 0.01 increments, the inflection point temperature rises by 3.11 K to 4.64 K, with an average sfc increase of 0.62%.

4.2.2. Performance Analysis Under Take-Off Condition

Engine thrust variation with Mach number and humidity at h = 0 km and 308.15 K ambient temperature is presented in Figure 11.
Increasing humidity delays the control plan inflection point, while rising Mach number increases inlet total temperature but reduces corrected low-pressure rotor speed, resulting in net thrust reduction. Table 1 shows that, at constant Mach number, thrust increase rates decline with rising humidity, indicating diminishing marginal gains.
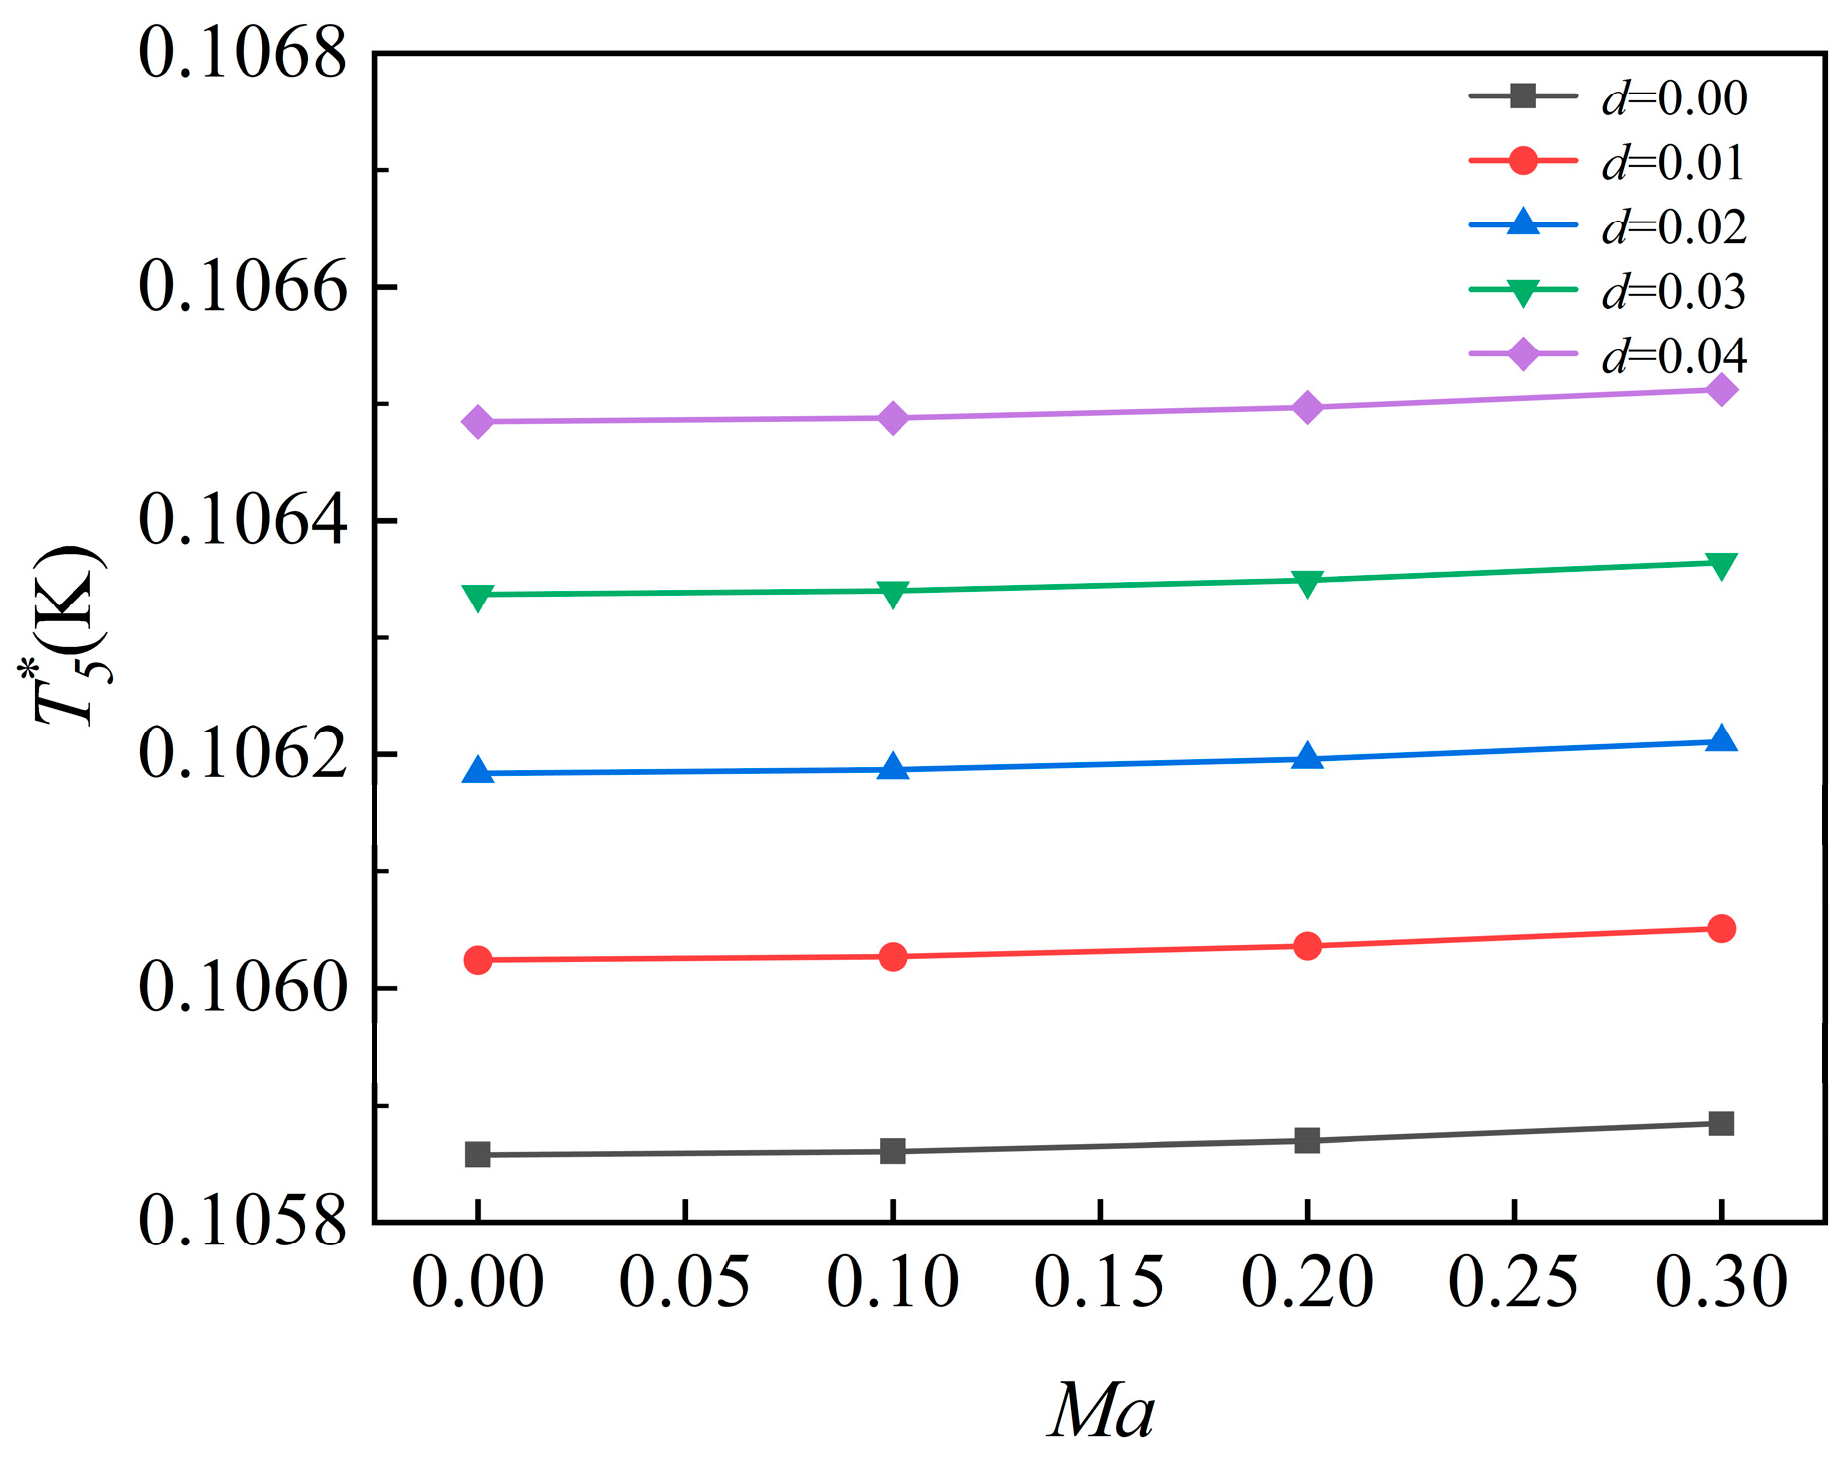
Figure 12 shows that exhaust gas temperature increases slightly with Mach number and more gradually with humidity. At Ma = 0, temperature increase rates are 0.15% at d = 0.01 and 0.14% at d = 0.04. At Ma = 0.3, these rates are 0.16% and 0.14%, respectively—indicating stable temperature growth across humidity levels.

4.2.3. Performance Analysis Under Cruising Condition

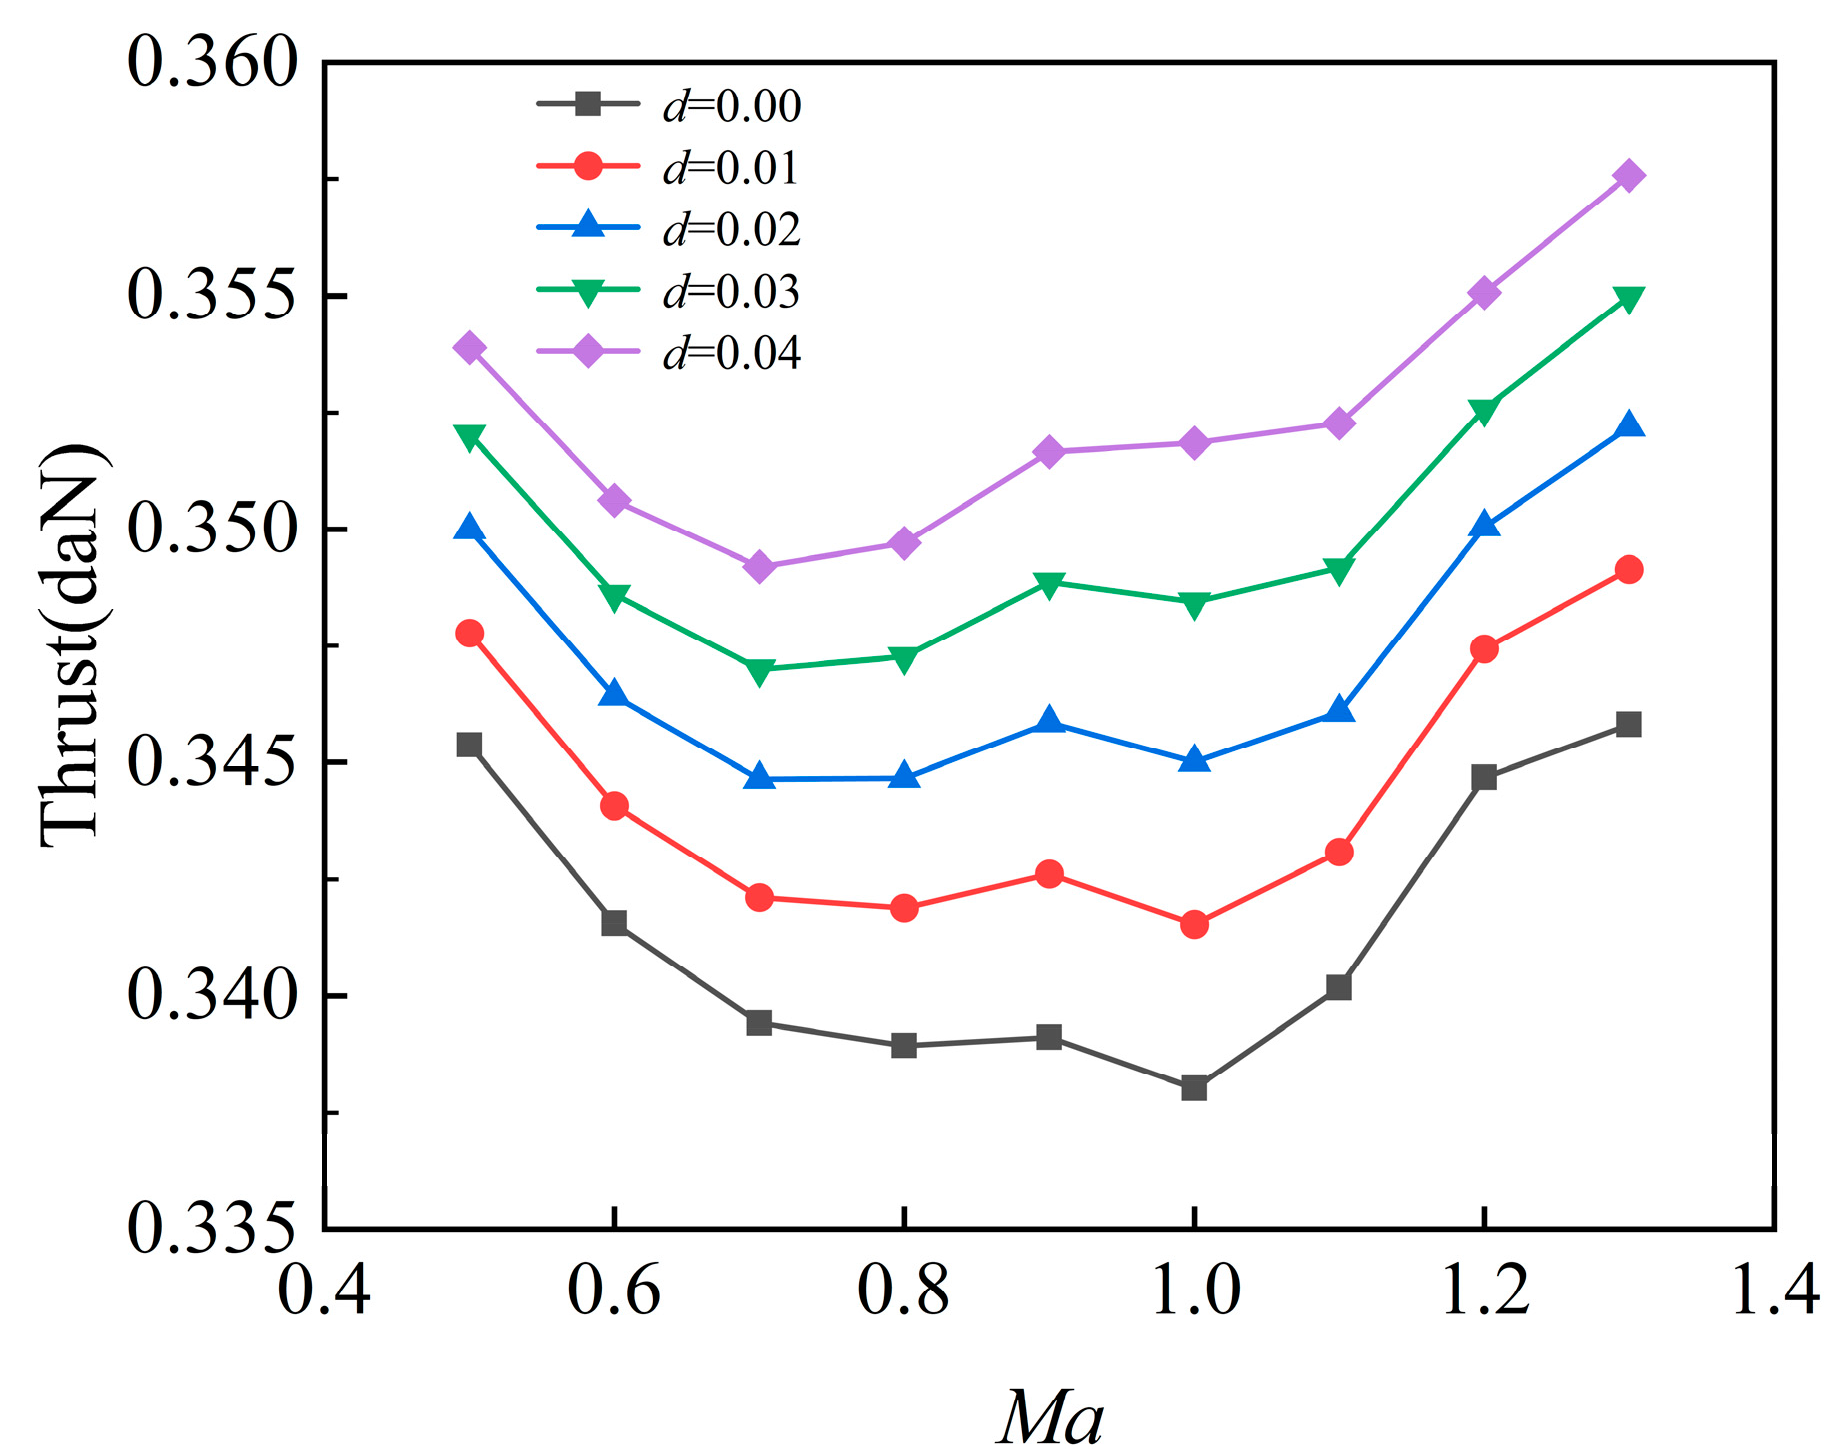
Figure 13 presents thrust variation with Mach number after humidity-induced control plan inflection point shifting at h = 5 km and 293.15 K ambient temperature. Thrust initially decreases, then increases with Mach number under elevated humidity, the delayed control of the inflection point T 4 * . As shown in Figure 12, for Ma < 1.0, exhaust gas temperature increases slightly while corrected rotor speed decreases, reducing thrust. For Ma > 1.0, greater turbine temperature increases result in thrust growth.
Figure 13 also confirms that thrust generally increases with humidity. Table 2 indicates that at a constant Mach number, the relative thrust increase rate diminishes with humidity, again reflecting reduced marginal gains. Between Ma = 0.9–1.0, only 0.04 humidity produces a net thrust increase, while other levels result in progressively smaller reductions. Between Ma = 1.0–1.1, lower humidity yields greater relative thrust increases. At Ma = 1.1, humidity levels of 0.01–0.02 yield modest thrust increase rates of 0.86–0.87%, while 0.03–0.04 generate larger increases.
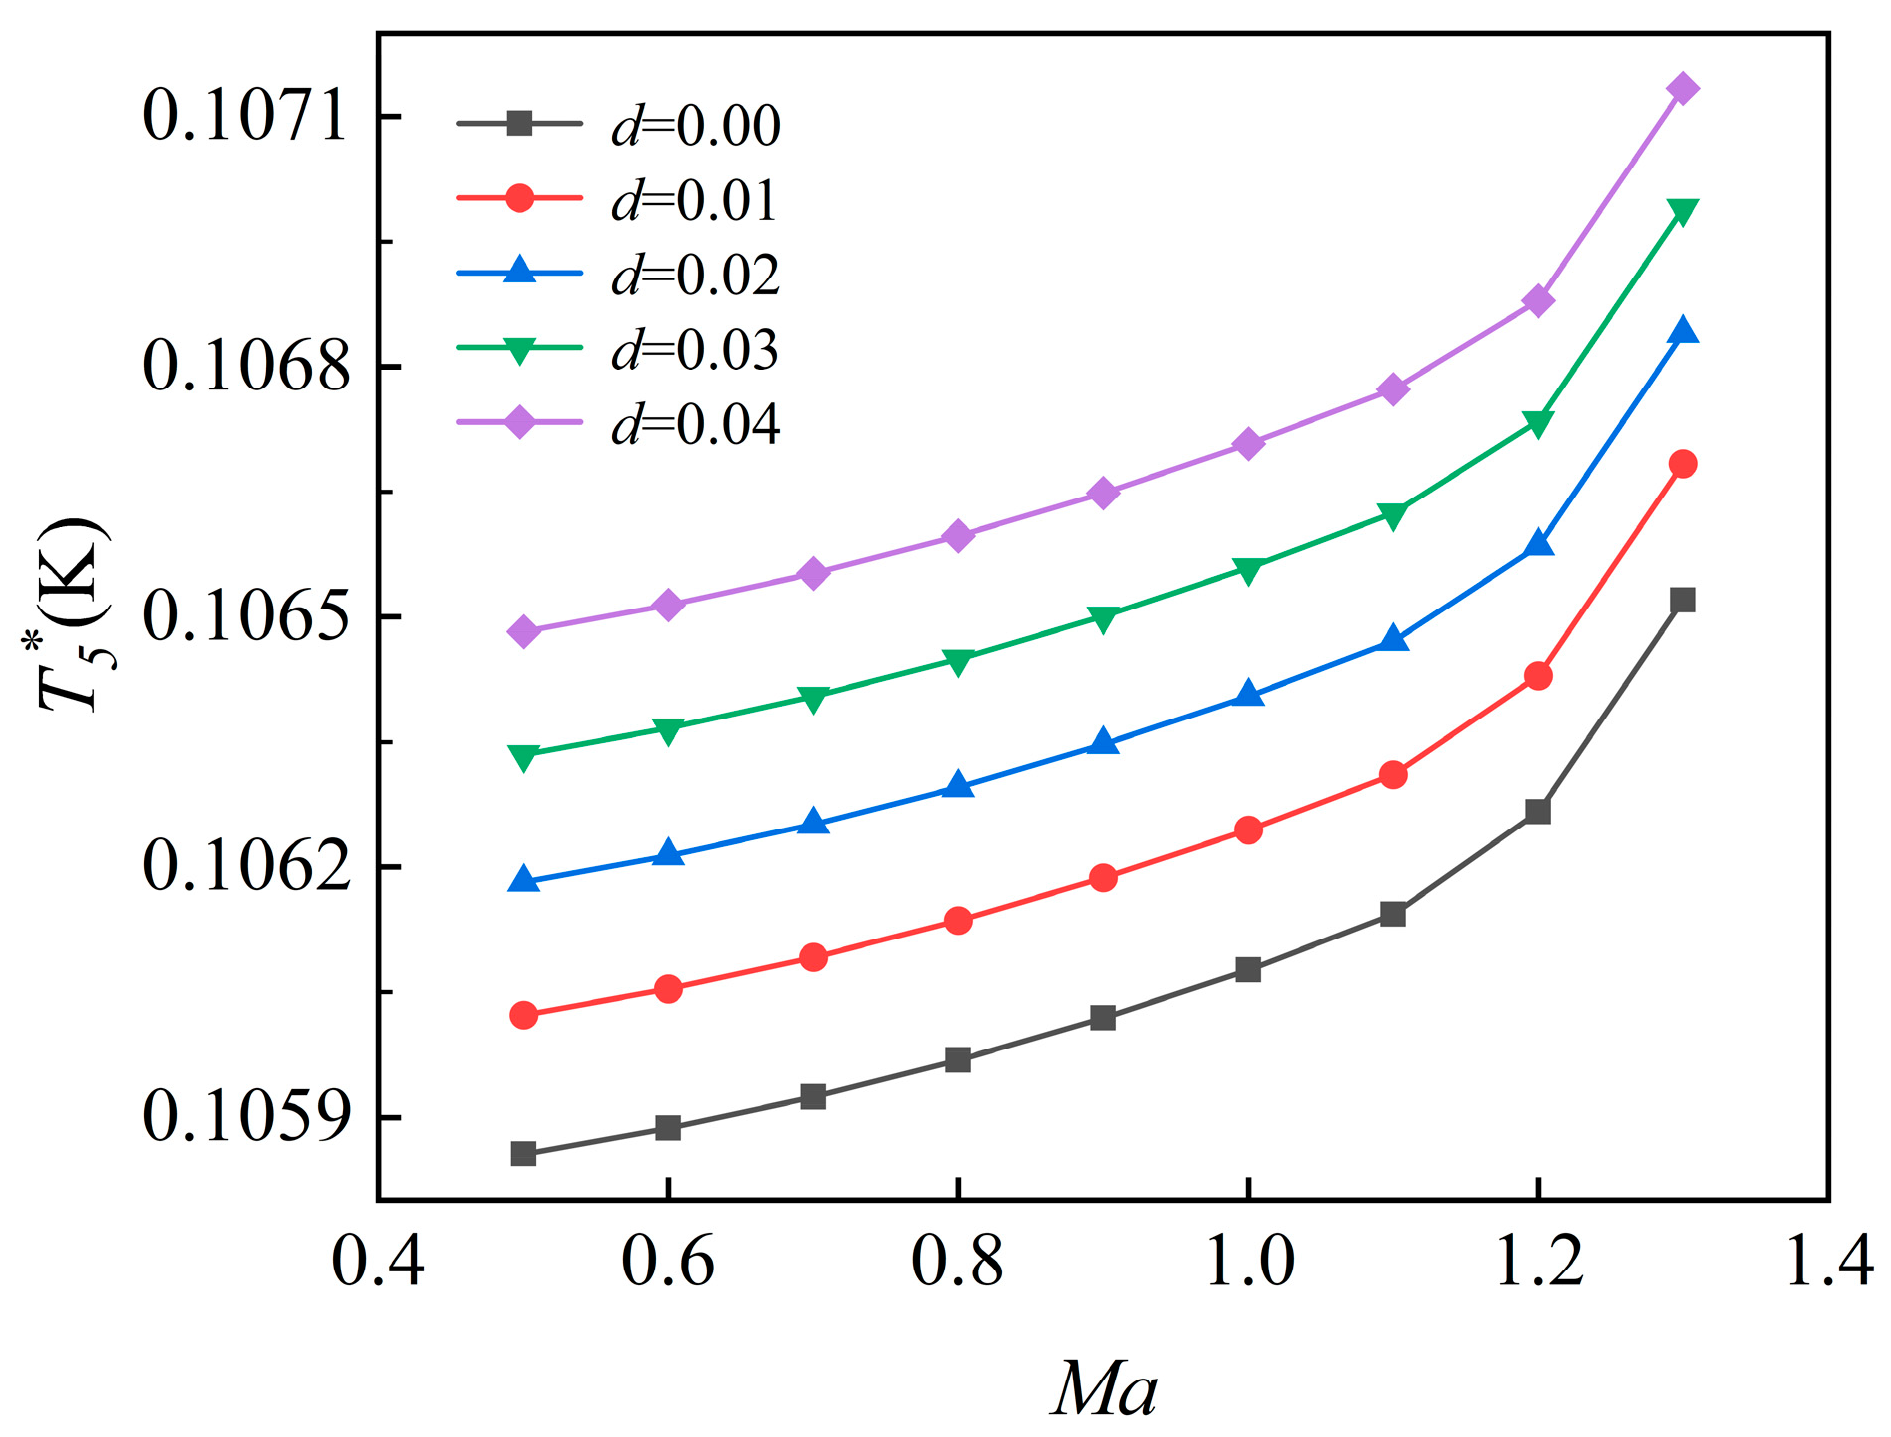
Figure 14 shows that exhaust gas temperature increases with both Mach number and humidity. Between Ma = 0.5–1.1, temperature rises moderately, followed by an accelerated increase from Ma = 1.1–1.3. Humidity-induced temperature rise rates remain nearly constant across Mach numbers: 0.15% at d = 0.01 and 0.14% at d = 0.04 for Ma = 0.5; 0.15% at d = 0.01 and 0.13% at d = 0.04 for Ma = 1.3. The exhaust gas temperature increase rate remains essentially constant.
This section highlights the impact of rightward shifts in the control plan inflection point on engine performance across ground test, takeoff roll, and in-flight conditions. During ground testing, thrust increases post-inflection at an average rate of 0.53% with rising humidity. In takeoff roll conditions, the thrust gain rate diminishes with higher humidity, showing stronger increases at lower humidity levels. In-flight conditions mirror takeoff roll trends.

4.3. Coupled Effects of Humidity and Component Performance Degradation on Aero-Engine Performance

In field operations, cumulative degradation from extended runtime and local environmental humidity (e.g., Chengdu’s typical humidity ratio of 0.015) jointly influence engine behavior. Deteriorating component efficiency and ambient humidity together contribute to progressive performance degradation.
Section Numerical Model for Humidity Correction demonstrated that increased humidity shifts the engine control plan inflection point rightward, whereas component degradation shifts it leftward [21]. When both factors are present, their opposing effects may offset each other, resulting in an apparently unchanged inflection point during field performance evaluations. This superficial stability can misleadingly suggest unaltered engine performance despite actual degradation. Accurate field assessments therefore require numerical simulations that account for both environmental humidity and component degradation. Such integrated modeling enables reliable performance prediction during transitions between high- and low-humidity regions, ensuring accurate evaluations of operational readiness.
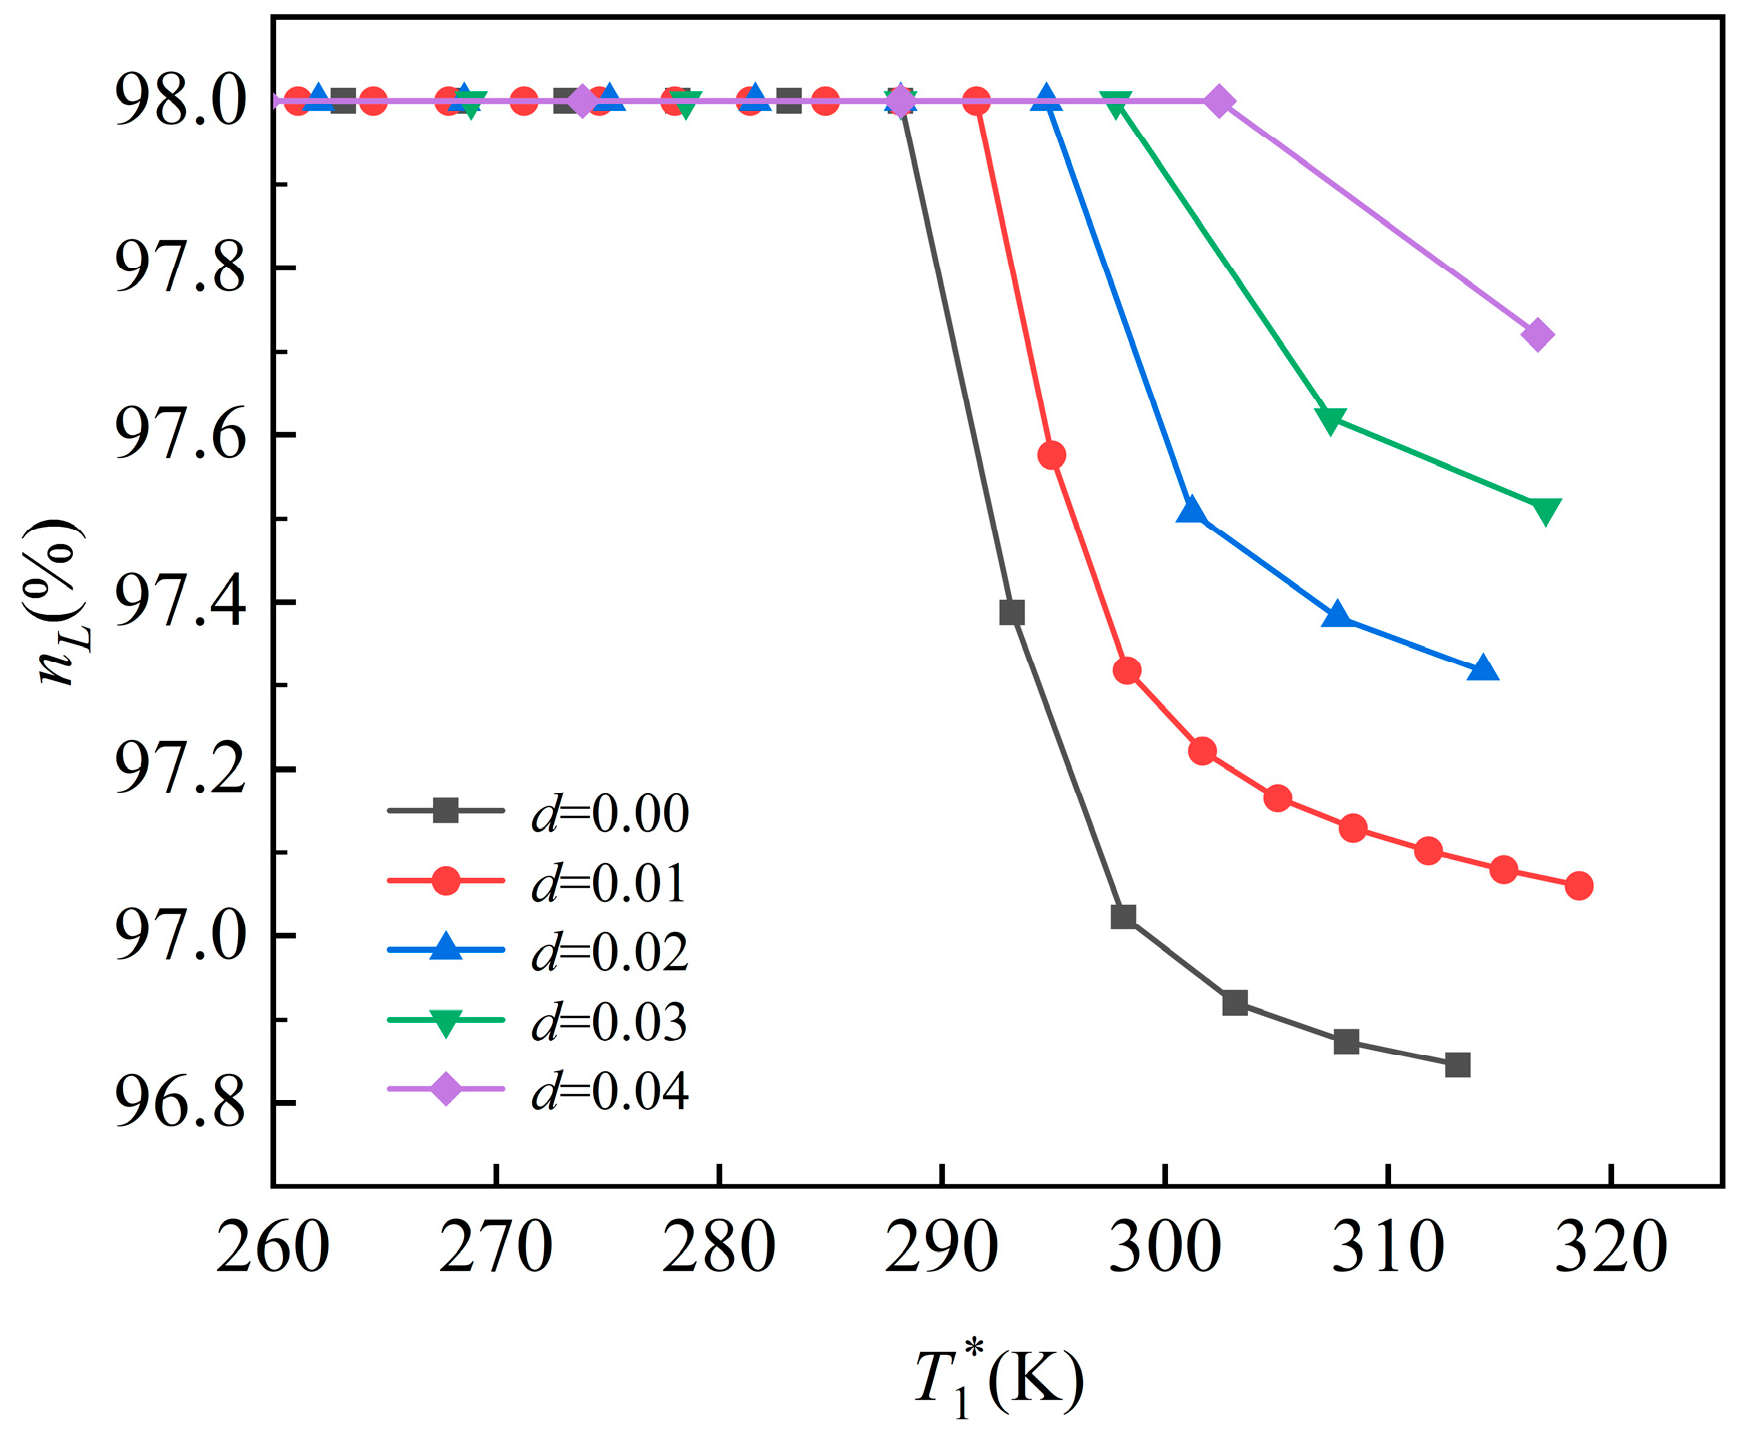
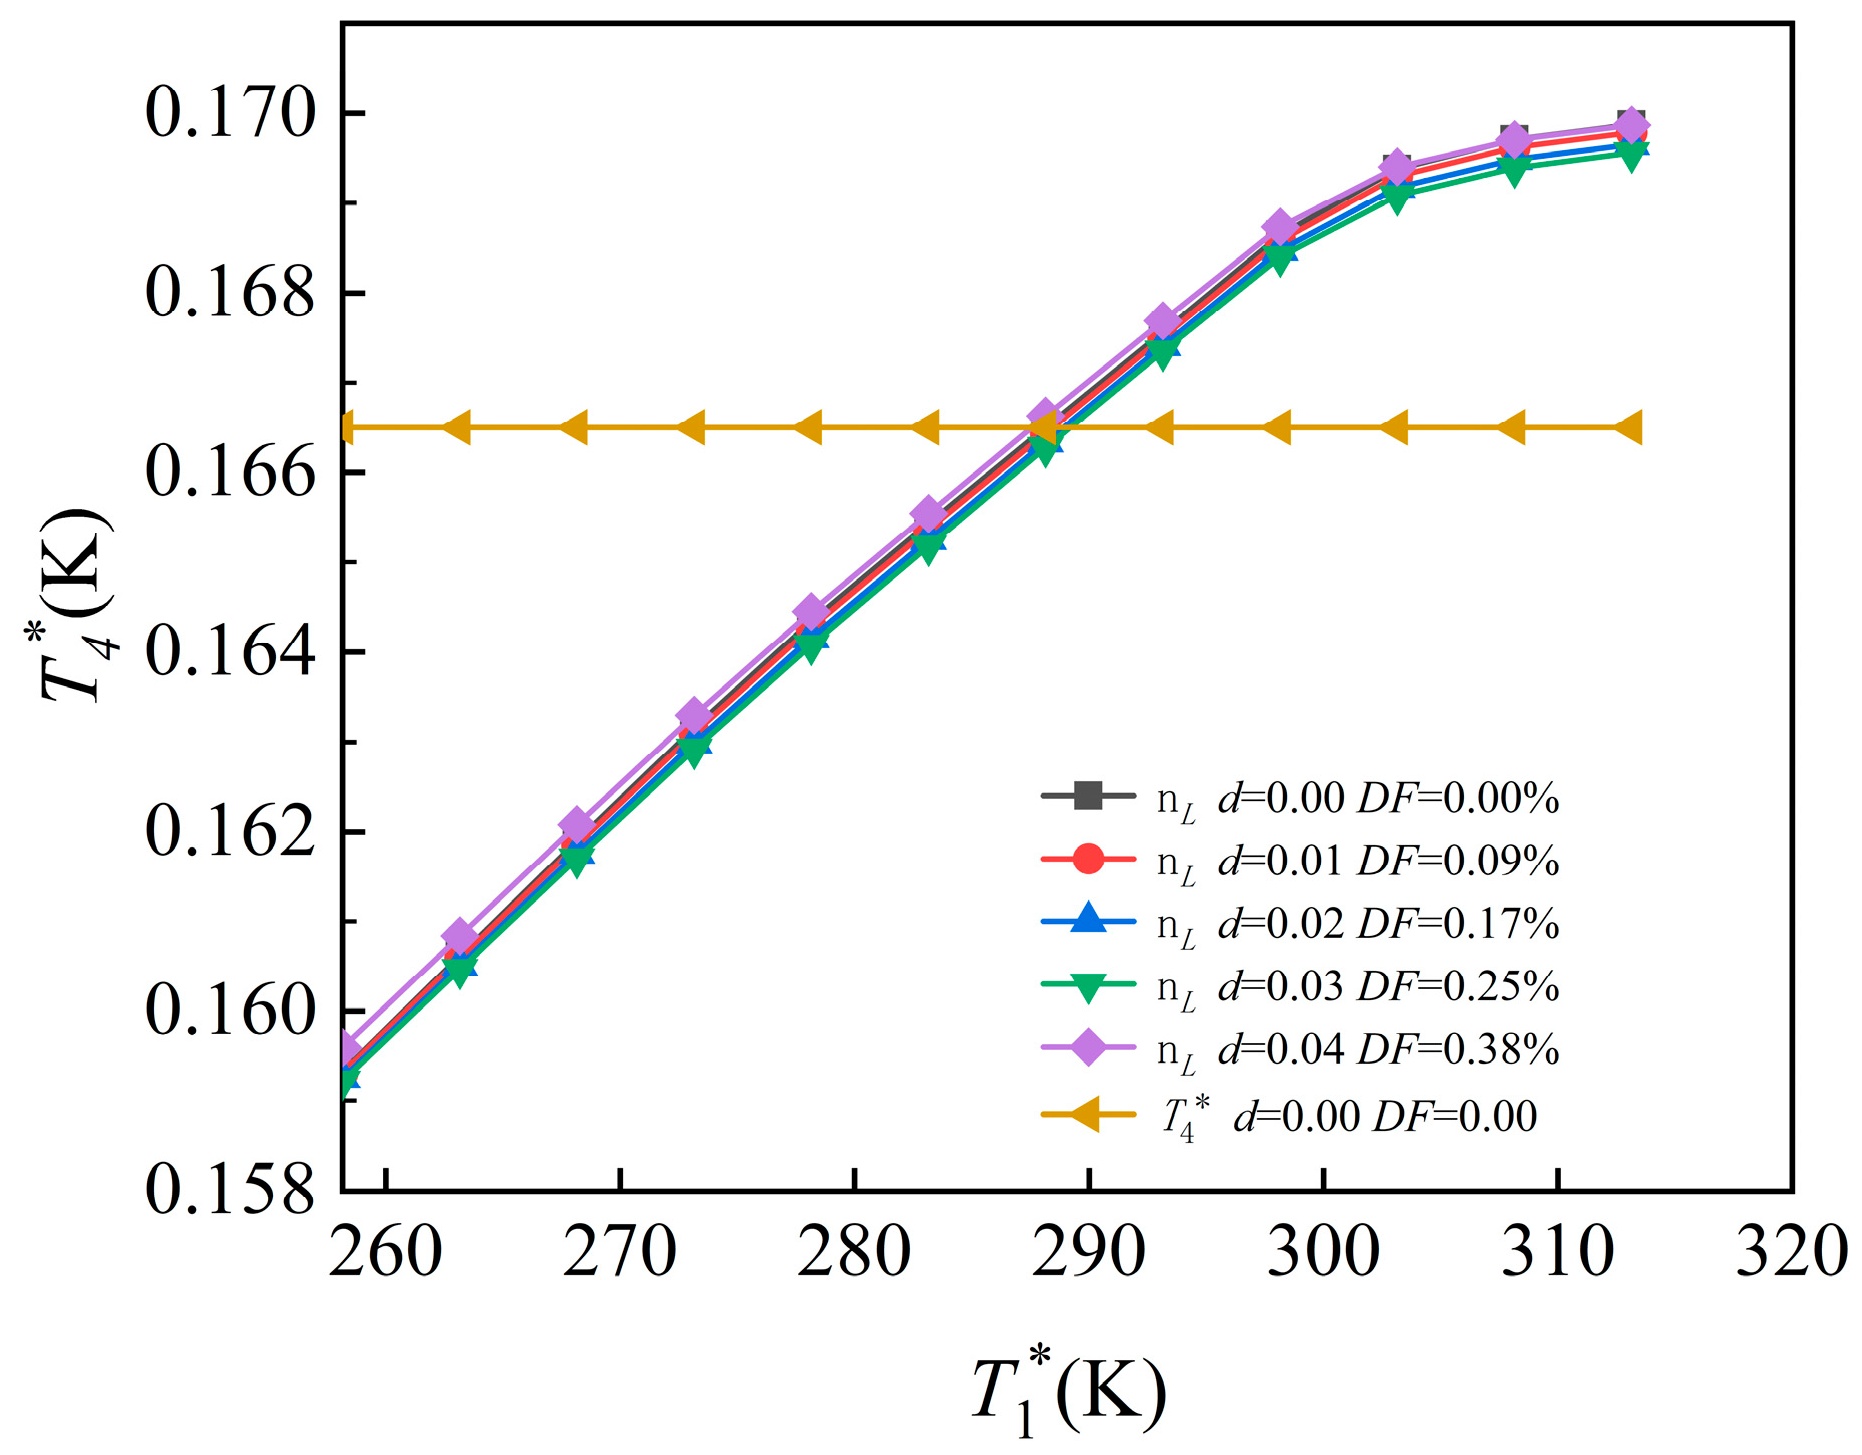
When the engine degradation factor (DF) [27] is defined and humidity is incorporated, their combined influence can preserve the control plan inflection point. As shown in Figure 15, simulations confirm that the inflection point remains stable at approximately 288.15 K.
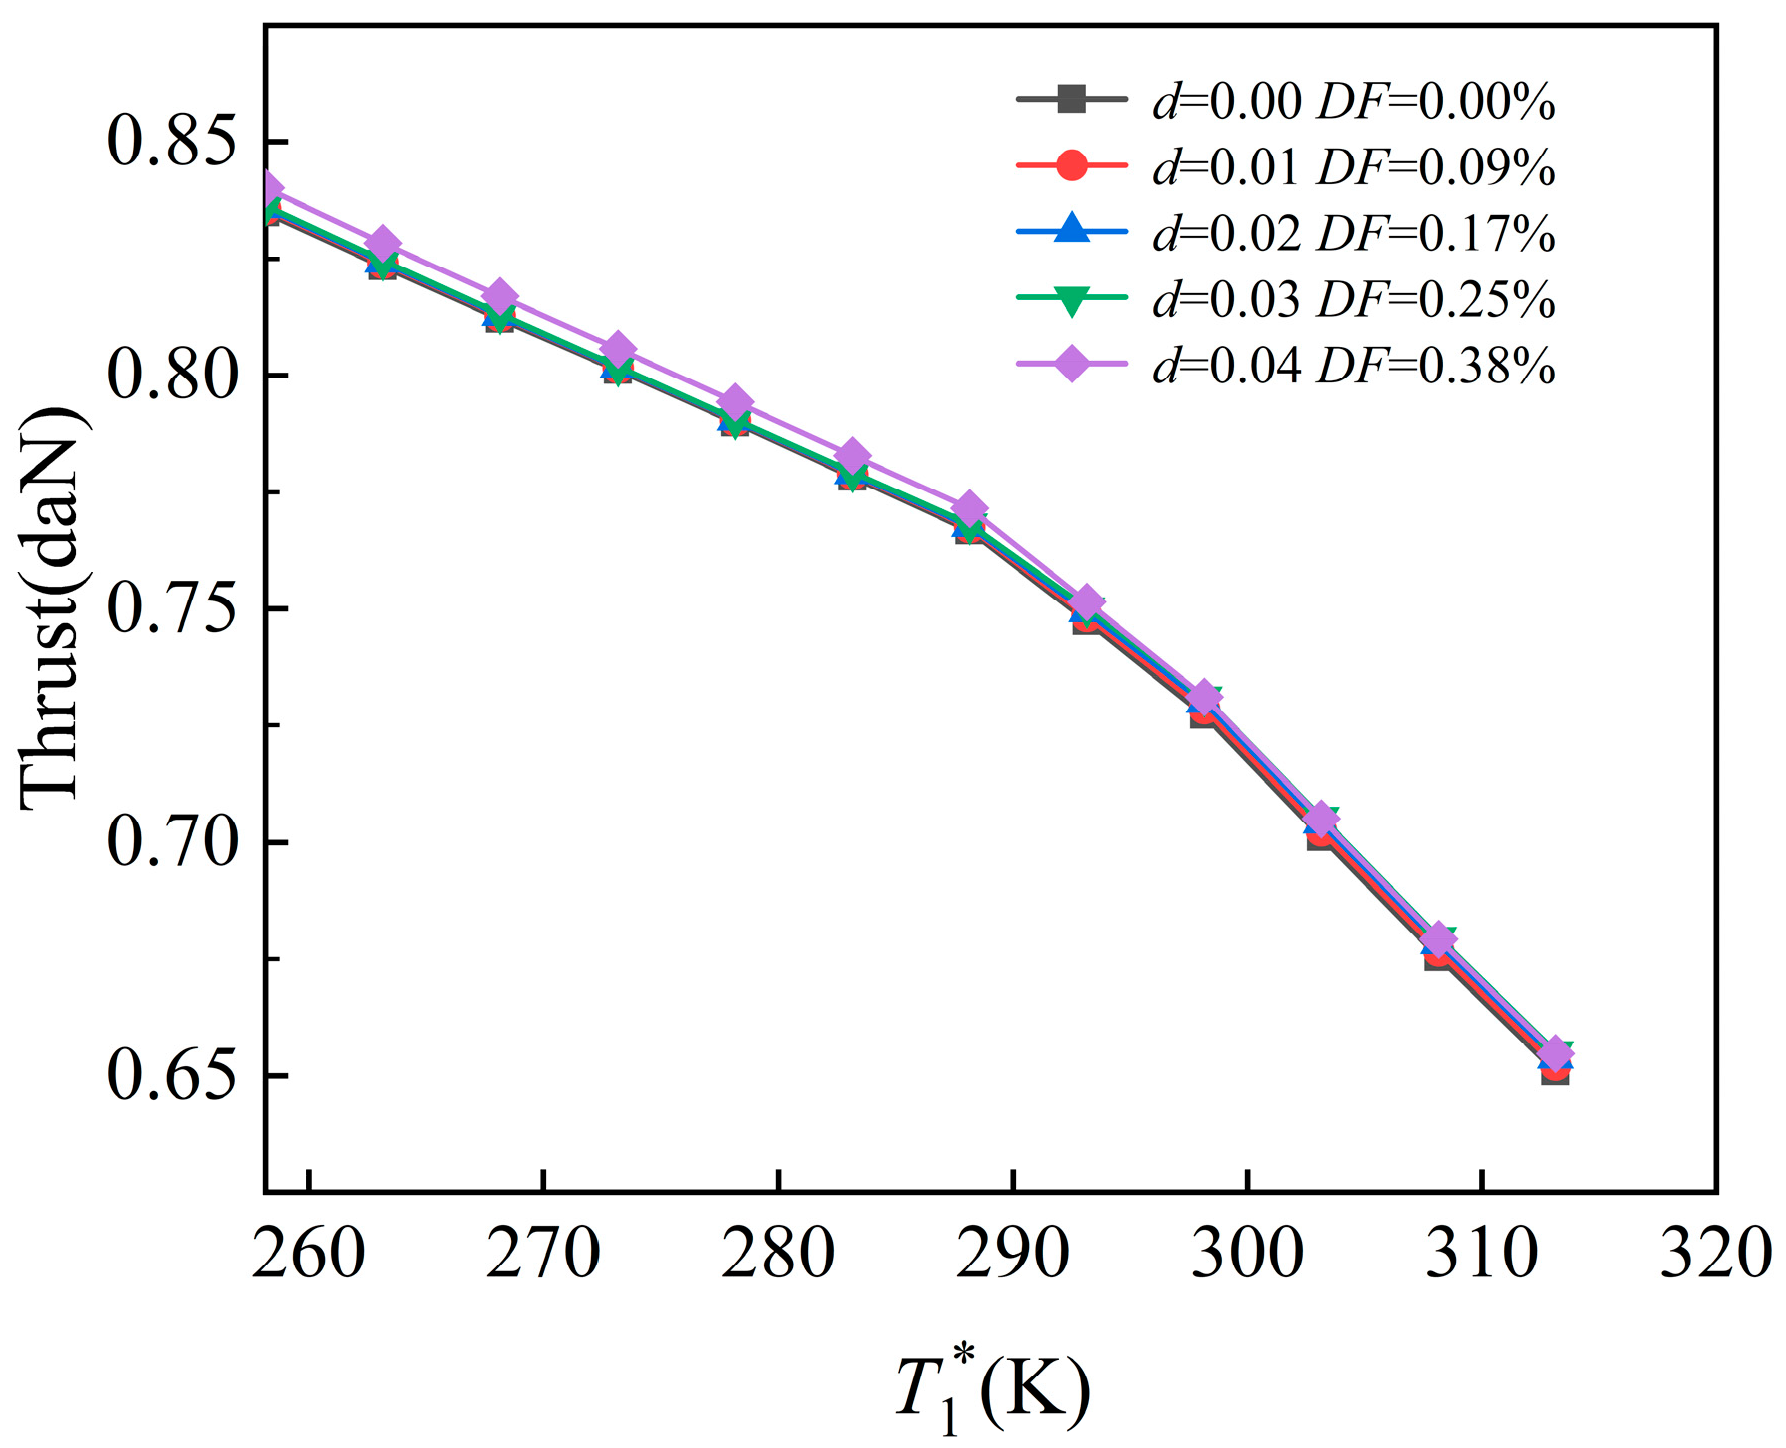
Table 3 and Table 4 presents the relative thrust increase rates and values under these coupled conditions, revealing that thrust gains are greater when humidity and degradation are lower. However, the overall magnitude of change is small. For instance, with a humidity of 0.04 and a component degradation of 0.38%, the relative thrust becomes negative when the temperature exceeds 298.15 K. Thus, even when degradation and humidity are jointly considered and the inflection point remains effectively unchanged, thrust variation relative to a baseline case (no degradation and zero humidity) remains minimal, as illustrated in Figure 16.
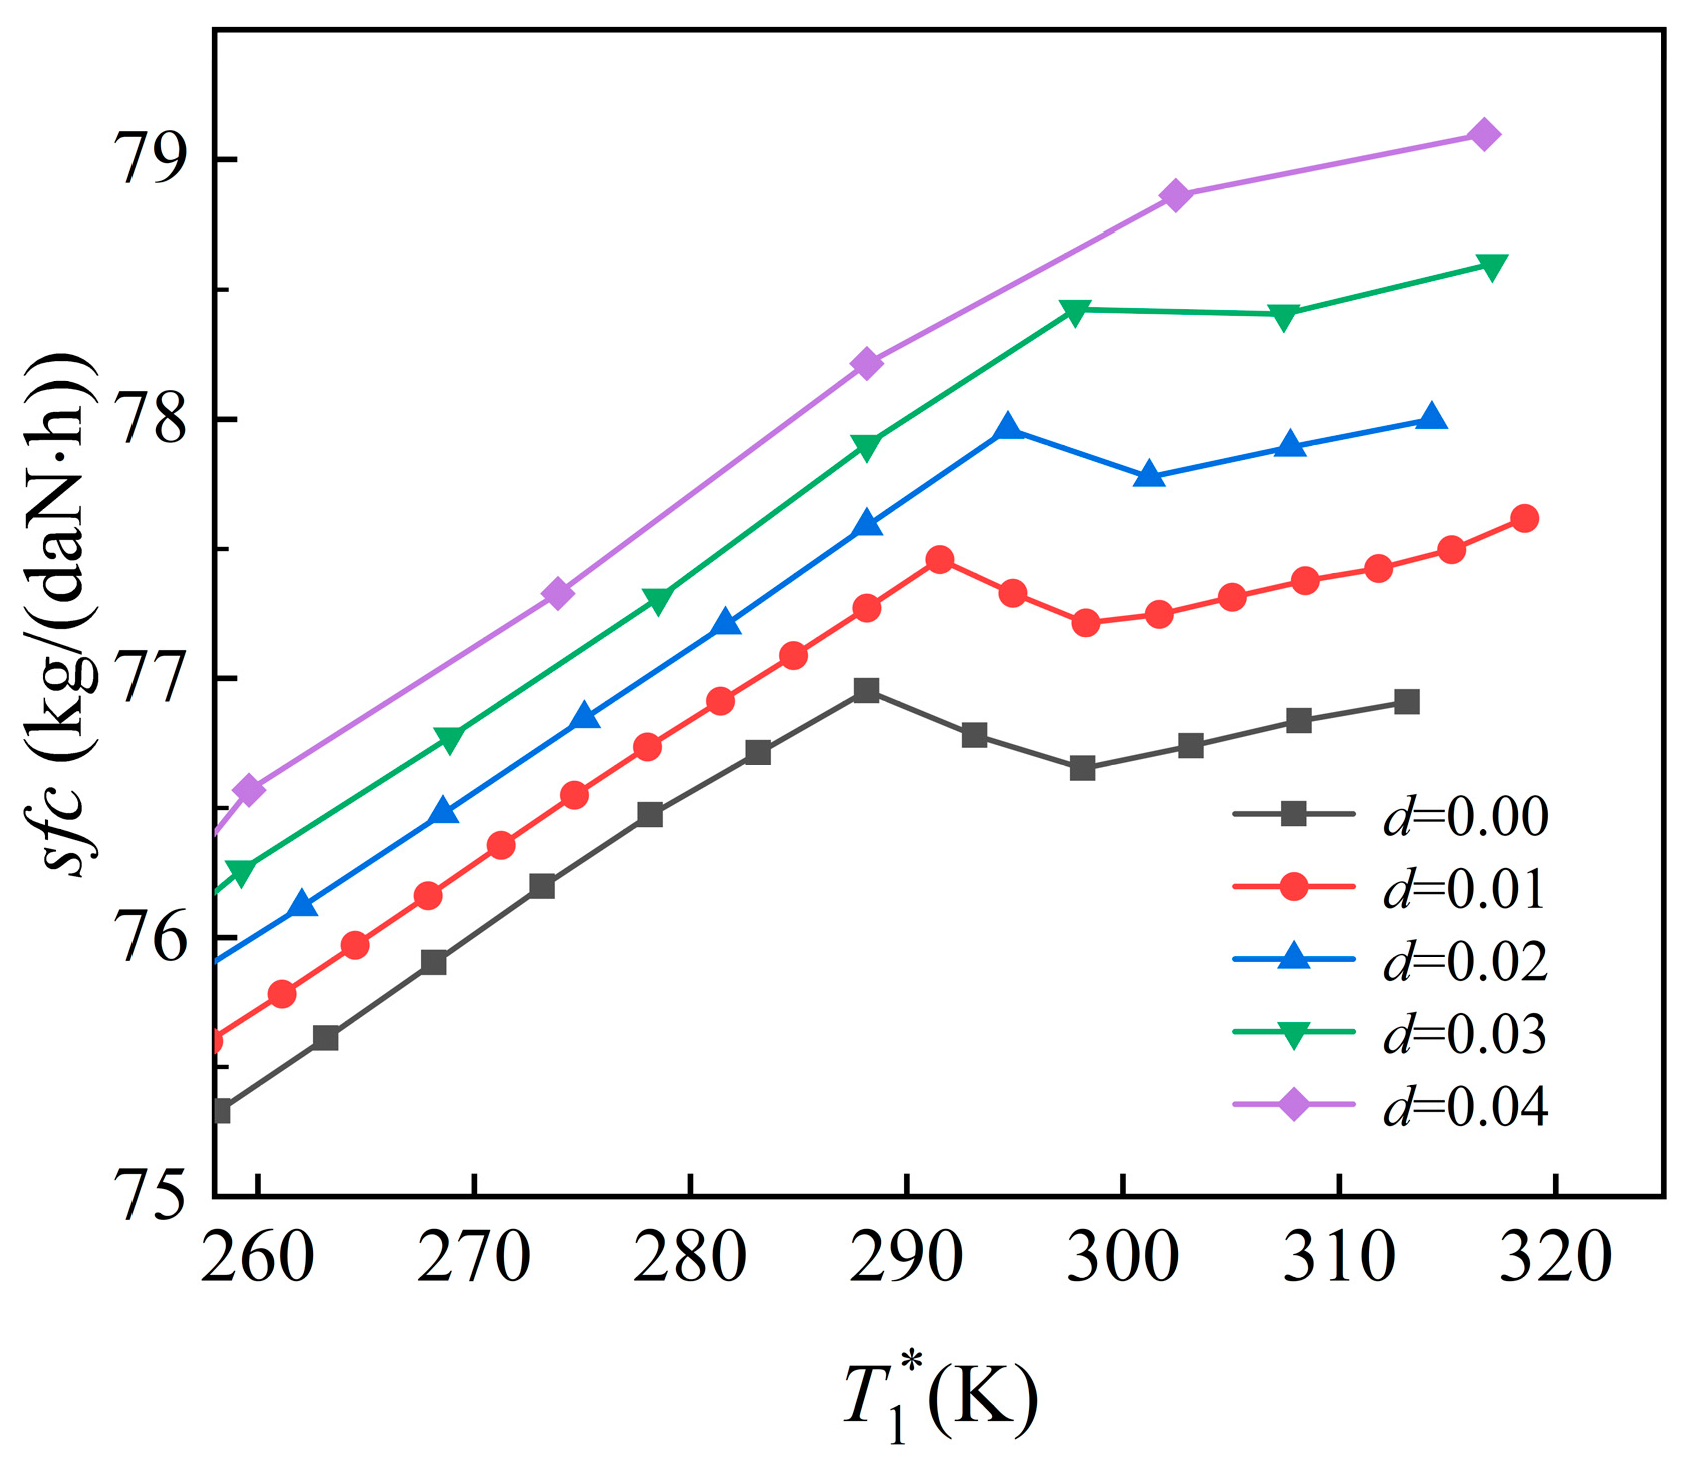
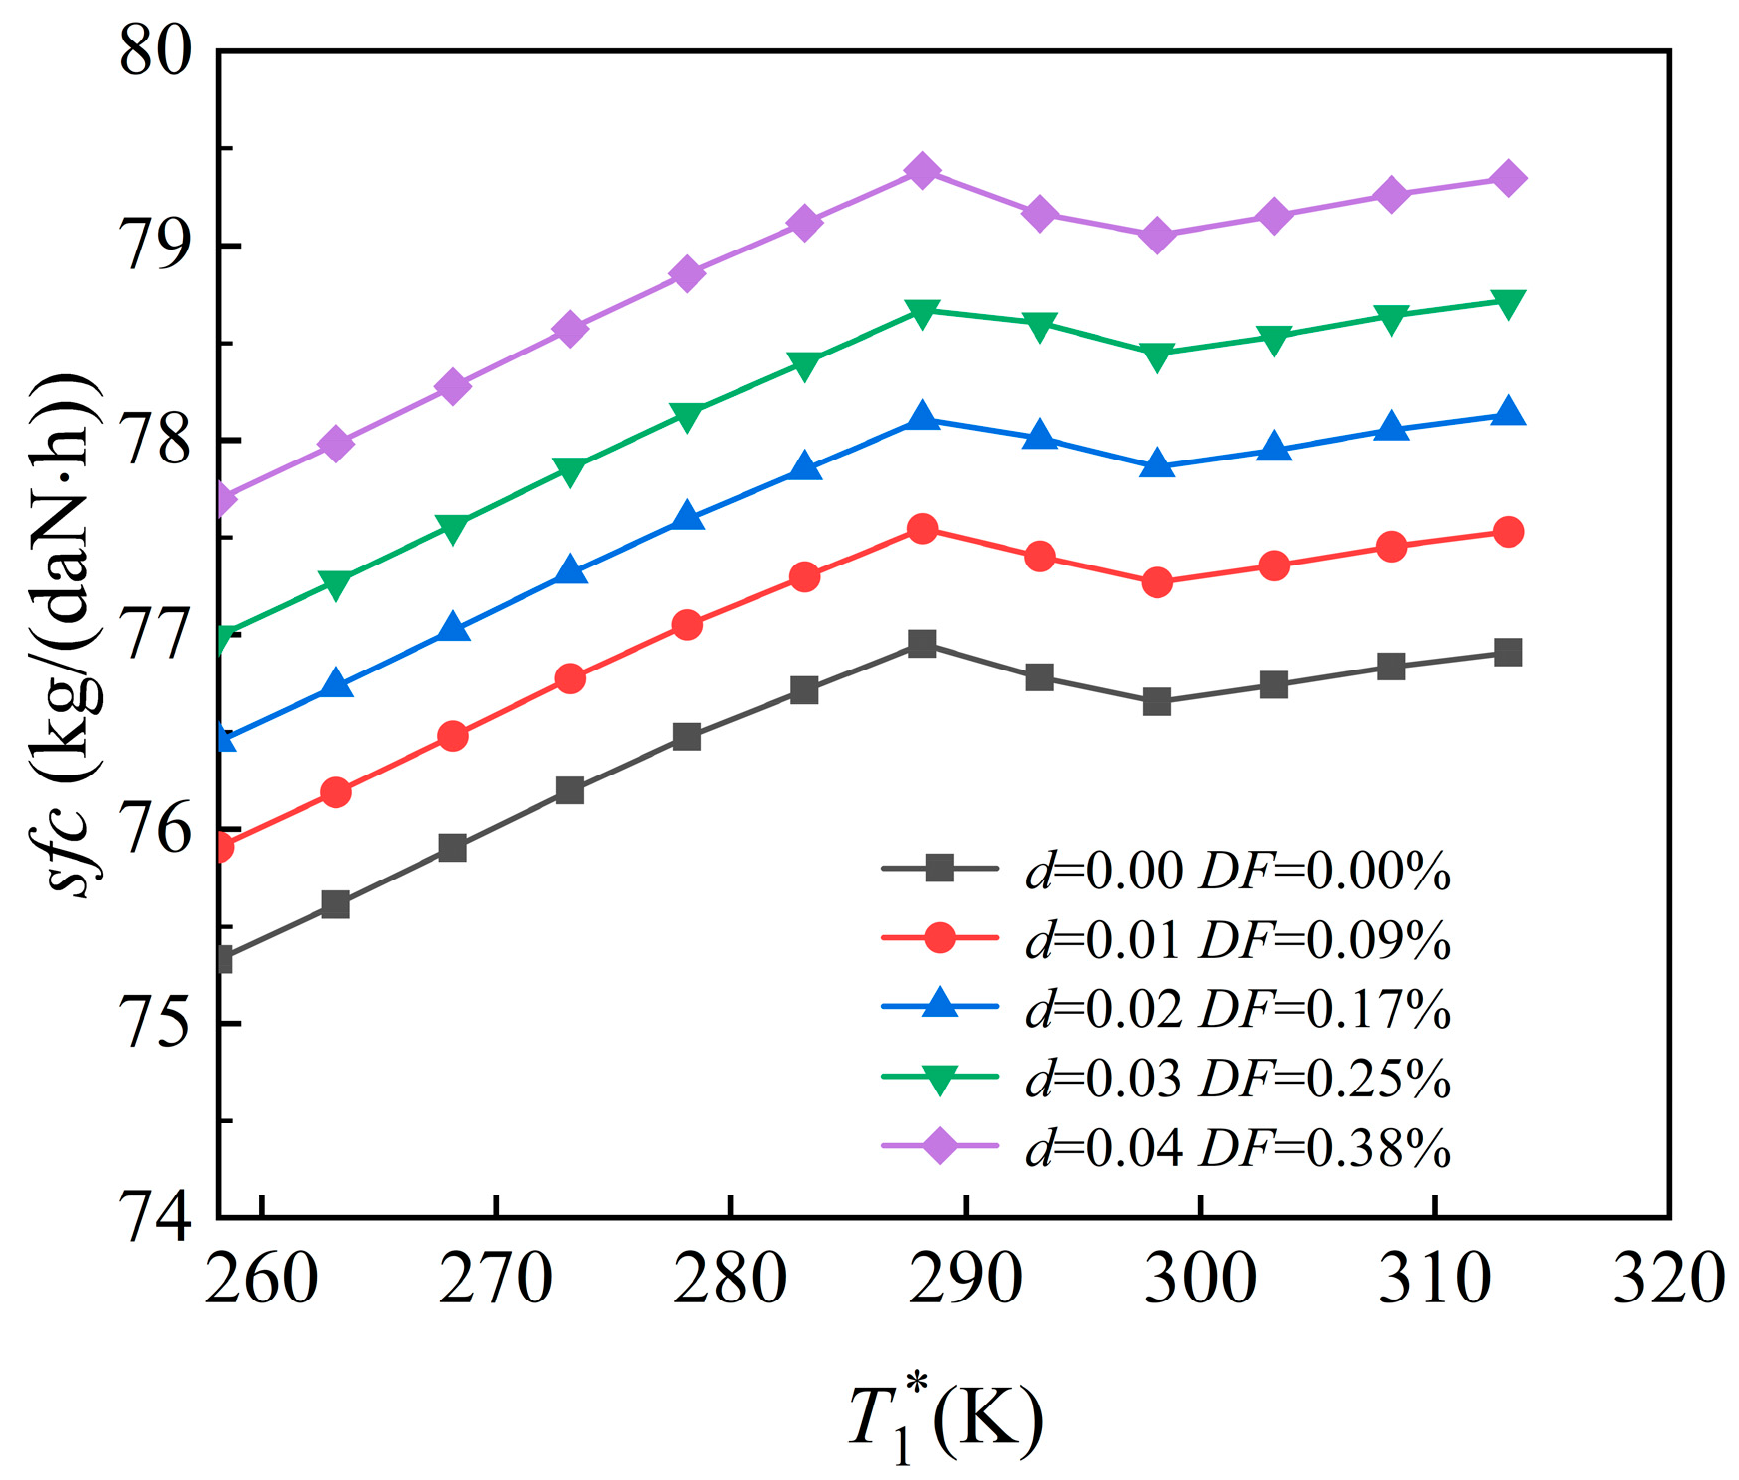
In contrast, sfc differs significantly from the baseline. Although the control plan inflection point appears unchanged, sfc steadily increases with rising humidity and higher degradation levels. As depicted in Figure 17, sfc initially rises with increasing inlet temperature, drops slightly at the inflection point, and then increases again beyond 298.15 K. The average fuel consumption increase is approximately 0.79%. The change from n L control to T 4 * control is mainly responsible for the bifurcation point seen in the sfc curve close to T 1 * = 288.15 K, as shown in Figure 3 and Figure 16. Aero-engine thrust decreases as a result of the fall in n L during this shift, and the magnitude of this thrust reduction increases. Consequently, there is a commensurate drop in the sfc.
Comparing sfc under combined degradation and humidity effects versus humidity alone reveals a steeper rise in the former case. As engine runtime increases, component degradation advances, shifting the control plan inflection point leftward and reducing overall performance. However, in high-humidity environments, this leftward shift may be offset, maintaining an apparently stable inflection point and constant thrust. In such cases, thrust alone is insufficient for performance assessment—sfc must be analyzed to detect latent degradation. Therefore, in field evaluations where the inflection point appears stable, assessing multiple performance metrics enables earlier detection of underlying performance shifts and more accurate attribution to humidity, degradation, or both. This supports more effective diagnostics and readiness assessments.

5. Conclusions

This study examined how environmental conditions and component degradation jointly affect aero-engine performance. A numerical aero-engine model was developed, incorporating corrections for ambient humidity and degradation. The analysis focused on how humidity influences the control plan inflection point and how its interaction with degradation alters engine performance. Key findings include the following:
(1)
As ambient humidity increases, the control plan inflection point shifts rightward, with the degree of displacement increasing proportionally. At h = 0 km and Ma = 0, the inflection temperature is 288.15 K when d = 0, while humidity levels of 0.01 and 0.04 delay the control transition by 3.38 K and 14.28 K, respectively. At h = 0 km and Ma = 0.2, the inflection temperature is 283.03 K when d = 0, while humidity levels of 0.01 and 0.04 delay the control transition by 3.35 K and 14.17 K, respectively. At h = 5 km and Ma = 0.8, the inflection temperature is 255.31 K when d = 0, while humidity levels of 0.01 and 0.04 delay the control transition by 3.14 K and 14.31 K, respectively.
(2)
Under ground test conditions, thrust increases post-inflection point shift, with an average gain of 0.53%. Under take-off conditions, thrust gains decline with increasing humidity, and higher thrust is observed under lower humidity. Under cruising conditions, trends are consistent with take-off behavior.
(3)
Under the coupled effects of humidity and degradation, the inflection point remains near 288.15 K. Compared to the undegraded, zero-humidity baseline, thrust variation is minimal. However, sfc increases with both rising humidity and degradation, averaging a 0.79% growth.
(4)
The sfc increase rate is higher when both humidity and component degradation are considered than when humidity alone is considered.
Future studies will concentrate on estimating the rate of degradation of aero-engine component characteristics inversely by using the impact of humidity on the control plan inflection point. To provide a more precise evaluation of aero-engine performance, optimization analysis of the engine’s control strategy will also be carried out.

Author Contributions

Conceptualization, W.L. and Y.Y.; methodology, W.L. and Y.Y.; software, W.L. and Y.Y.; validation, J.Y. and Y.Y.; formal analysis, W.L. and Y.Y.; investigation, W.L. and Y.Y.; resources, W.L. and Y.Y.; data curation, J.Y. and Y.Y.; writing—original draft, W.L. and Y.Y.; writing—review and editing, W.L. and Y.Y.; visualization, W.L. and Y.Y.; supervision, J.Y. and Y.Y.; project administration, J.Y.; funding acquisition, J.Y. All authors have read and agreed to the published version of the manuscript.

Funding

This work is supported by the National Science and Technology Major Project of China (J2022-I-0003-0003) funded by the Ministry of Industry and Information Technology.

Data Availability Statement

The original contributions presented in this study are included in the article. Further inquiries can be directed to the corresponding author.

Conflicts of Interest

The authors declare no conflicts of interest.

References

  1. Bird, J.; Grabe, W. Humidity Effects on Gas Turbine Performance. In Proceedings of the ASME 1991 International Gas Turbine and Aeroengine Congress and Exposition, Orlando, FL, USA, 3–6 June 1991. [Google Scholar] [CrossRef]
  2. Apostolidis, A.; Stamoulis, K. A Health Monitoring Modelling Case Study: Humidity Effects on Engine Deterioration Prediction. MATEC Web Conf. 2021, 349, 03011. [Google Scholar] [CrossRef]
  3. Gardiner, A.W. Atmospheric Humidity and Engine Performance. SAE Trans. 1929, 24, 267–272. [Google Scholar] [CrossRef]
  4. Naeem, M.; Singh, R.; Probert, D. Implications of Engine Deterioration for Operational Effectiveness of a Military Aircraft. Appl. Energy 1998, 60, 115–152. [Google Scholar] [CrossRef]
  5. Rhee, J.; Im, J.; Kim, J.; Song, S.J. Humidity Effects on the Aerodynamic Performance of a Transonic Compressor Cascade. Int. J. Heat Mass Transf. 2019, 140, 743–751. [Google Scholar] [CrossRef]
  6. Yamamoto, S.; Araki, K.; Moriguchi, S.; Miyazawa, H.; Furusawa, T.; Yonezawa, K.; Umezawa, S.; Ohmori, S.; Suzuki, T. Effects of Wetness and Humidity on Transonic Compressor of Gas Turbine. Int. J. Heat Mass Transf. 2021, 178, 121649. [Google Scholar] [CrossRef]
  7. Yu, D.; Zhao, H.X.Z.; Xu, Z.; Sui, Y.; Liu, J. An Approximate Non-Linear Model for Aeroengine Control. Proc. Inst. Mech. Eng. Part G J. Aerosp. Eng. 2011, 225, 1366–1381. [Google Scholar] [CrossRef]
  8. Chen, J.; Hu, Z.; Wang, J. Aero-Engine Real-Time Models and Their Applications. Math. Probl. Eng. 2021, 2021, 1–17. [Google Scholar] [CrossRef]
  9. Martínez, F.R.; Martínez, A.R.; Velazquez, M.T.; Diez, P.Q.; Eslava, G.T.; Francis, J.A. Evaluation of the Gas Turbine Inlet Temperature with Relation to the Excess Air. Energy Power Eng. 2011, 34, 517–524. [Google Scholar] [CrossRef]
  10. Li, Y.; Li, M.; Yan, Z.; Li, R.; Tian, A.; Xu, X.; Zhang, H. Application of Life Cycle of Aeroengine Mainshaft Bearing Based on Digital Twin. Processes 2023, 11, 1768. [Google Scholar] [CrossRef]
  11. Wang, Y.; Liu, F.; Xi, F.; Wei, B.; Duan, D.; Cai, Z.; Si, S. Data Driven Comprehensive Performance Evaluation of Aeroengines: A Network Dynamic Approach. Engineering 2025, 46, 292–305. [Google Scholar] [CrossRef]
  12. Wang, Q.; Zhang, W.; Yuan, X.; Wang, Y.; Shen, Z.; Wang, F. Research on the Impact of the Sand and Dust Ingestion Test on the Overall Performance of Turboshaft Engines. Aerospace 2025, 12, 146. [Google Scholar] [CrossRef]
  13. Fishbach, L.H.; Koenig, R.W. GENENG 2: A Program for Calculating Design and Off-Design Performance of Two- and Three-Spool Turbofans with as Many as Three Nozzles; NASA: Cleveland, OH, USA, 1972. [Google Scholar]
  14. Kurzke, J. Model Based Gas Turbine Parameter Corrections. In Proceedings of the 2003 ASME Turbo Expo: Power for Land, Sea, and Air, Atlanta, GA, USA, 16–19 June 2003. [Google Scholar] [CrossRef]
  15. Li, Y.G.; Pilidis, P.; Newby, M.A. An Adaptation Approach for Gas Turbine Design-Point Performance Simulation. J. Eng. Gas Turbines Power 2005, 128, 789–795. [Google Scholar] [CrossRef]
  16. Li, Y.G.; Abdul Ghafir, M.F.; Wang, L.; Singh, R.; Huang, K.; Feng, X.; Zhang, W. Improved Multiple Point Nonlinear Genetic Algorithm Based Performance Adaptation Using Least Square Method. J. Eng. Gas Turbines Power 2011, 134, 031701. [Google Scholar] [CrossRef]
  17. Pang, S.; Li, Q.; Zhang, H. An Exact Derivative Based Aero-Engine Modeling Method. IEEE Access 2018, 6, 34516–34526. [Google Scholar] [CrossRef]
  18. Lin, C.-Y.; Jeng, Y.-L. Influences of Charge Air Humidity and Temperature on the Performance and Emission Characteristics of Diesel Engines. J. Ship. Res 1996, 40, 172–177. [Google Scholar] [CrossRef]
  19. Nikolaidis, T. Water Ingestion Effects on Gas Turbine Engine Performance. Doctor Thesis, Cranfield University, Bedfordshire, UK, 2008. Available online: http://hdl.handle.net/1826/3516 (accessed on 8 September 2025).
  20. Castiglione, T.; Perrone, D.; Strafella, L.; Ficarella, A.; Bova, S. Linear Model of a Turboshaft Aero-Engine Including Compo nents Degradation for Control-Oriented Applications. Energies 2023, 16, 2634. [Google Scholar] [CrossRef]
  21. Zhang, S.; Yu, J.; Yu, Y. Effect of Performance Degradation on the Inflection Point of Engine Control Plan. J. Air Force Eng. Univ. (Nat. Sci.) 2022, 23, 70–78. [Google Scholar]
  22. Milojević, S.; Džunić, D.; Marić, D.; Skrúcaný, T.; Mitrović, S.; Pešić, R. Tribological Assessment of Aluminum Cylinder Material for Piston Compressors in Trucks and Buses Brake Systems. Teh. Vjesn.—Tech. Gaz. 2021, 28, 1268–1276. [Google Scholar] [CrossRef]
  23. Su, S.; Lian, X. Application of Genetic Algorithm in Nonlinear Mathematical Model of Aero Engine. J. Propul. Technol. 2004, 3, 237–240. [Google Scholar] [CrossRef]
  24. Luo, G.; Wang, R. The Numerical Simulation of Aero Gas Turbine Engine, 1st ed.; National Defense Industry Press: Beijing, China, 2006; pp. 71–74. [Google Scholar]
  25. Qian, F.; Song, W.; Luo, G. Calculation of integrated performance for aircraft/engines. J. Aerosp. Power 2013, 28, 1112–1118. [Google Scholar] [CrossRef]
  26. North Atlantic Treaty Organization. Recommended Practices for the Assessment of the Effects of Atmospheric Water Ingestion on the Performance and Operability of Gas Turbine Engines; North Atlantic Treaty Organization: Brussels, Belgium, 1995. [Google Scholar]
  27. Wang, Z. Aeroengine Degradation Evaluation Based on Thermodynamic Model and Neural Network. Master’s Thesis, Civil Aviation University of China, Tianjin, China, 2022. [Google Scholar]
Figure 1. Twin-spool mixed-exhaust aero-engine main interface division and structure: ①—Low-pressure compressor, ②—High-pressure compressor, ③—Combustor, ④—High-pressure turbine, ⑤—Low-pressure turbine, ⑥—Mixer, ⑦—Afterburner, ⑧—Nozzle, ⑨—Bypass.
Machines 13 00860 g001
Figure 2. Speed–altitude characteristics.
Machines 13 00860 g002
Figure 3. Control plan inflection point temperature schematic diagram.
Machines 13 00860 g003
Figure 4. Flowchart of numerical computation model including humidity correction.
Machines 13 00860 g004
Figure 5. Turbine inlet gas temperature variation curve at Ma = 0.
Machines 13 00860 g005
Figure 6. Turbine inlet gas temperature variation curve at Ma = 0.2.
Machines 13 00860 g006
Figure 7. Turbine inlet gas temperature variation curve at Ma = 0.8.
Machines 13 00860 g007
Figure 8. Thrust characteristics under ground test conditions.
Machines 13 00860 g008
Figure 9. Low-pressure rotor speed variation curve.
Machines 13 00860 g009
Figure 10. Specific fuel consumption characteristics under ground test conditions.
Machines 13 00860 g010
Figure 11. Thrust characteristics under take-off conditions at h = 0 km.
Machines 13 00860 g011
Figure 12. Exhaust gas temperature variation curve at h = 0 km.
Machines 13 00860 g012
Figure 13. Thrust characteristics under cruising conditions at h = 5 km.
Machines 13 00860 g013
Figure 14. Exhaust gas temperature variation curve at h = 5 km.
Machines 13 00860 g014
Figure 15. Turbine inlet gas temperature variation curve in the coupling case.
Machines 13 00860 g015
Figure 16. Thrust characteristics in the coupled case.
Machines 13 00860 g016
Figure 17. Specific fuel consumption characteristics in the coupled case.
Machines 13 00860 g017
Table 1. Relative thrust increase rate at h = 0 km.
dMa
0.00.10.20.3
0.010.600.620.640.67
0.020.550.560.580.62
0.030.500.520.540.57
0.040.460.470.490.52
Table 2. Relative thrust increase rate at h = 5 km.
dMa
0.50.60.70.80.91.01.11.21.3
0.010.690.730.790.871.031.040.860.800.96
0.020.640.680.740.810.951.020.870.750.87
0.030.580.630.680.750.870.990.890.720.80
0.040.530.580.630.700.800.980.890.710.73
Table 3. Relative thrust increase rate in the coupled case.
dDF/%Temperature/K
258.15268.15278.15288.15298.15303.15308.15313.15
0.010.090.090.080.070.090.190.210.210.22
0.020.170.040.020.0050.030.190.220.220.23
0.030.250.050.040.020.040.170.190.190.19
0.040.380.440.450.460.45−0.004−0.05−0.05−0.05
Table 4. Relative thrust values in the coupled case.
dDF/%Temperature/K
258.15268.15278.15288.15298.15303.15308.15313.15
0.000.000.83480.81210.78980.76680.72720.70100.67530.6509
0.010.090.83560.81270.79040.76740.72860.70250.67680.6523
0.020.170.83590.81280.79040.76770.73000.70400.67830.6538
0.030.250.83630.81310.79060.76800.73120.70530.67960.6551
0.040.380.84010.81680.79420.77150.73110.70500.67920.6547
Disclaimer/Publisher’s Note: The statements, opinions and data contained in all publications are solely those of the individual author(s) and contributor(s) and not of MDPI and/or the editor(s). MDPI and/or the editor(s) disclaim responsibility for any injury to people or property resulting from any ideas, methods, instructions or products referred to in the content.