Article

A Human-in-the-Loop Study of Eye-Movement-Based Control for Workload Reduction in Delayed Teleoperation of Ground Vehicles

1
College of Mechanical and Vehicle Engineering, Hunan University, Changsha 410009, China
2
School of Journalism & Communication, Shijiazhuang University, Shijiazhuang 050000, China
3
Network Information Center, Shijiazhuang University, Shijiazhuang 050000, China
4
School of Computer Science, University of Liverpool, Liverpool L69 3DR, UK
*
Author to whom correspondence should be addressed.
Machines 2025, 13(8), 735; https://doi.org/10.3390/machines13080735
Submission received: 9 July 2025 / Revised: 7 August 2025 / Accepted: 14 August 2025 / Published: 18 August 2025

Abstract

Teleoperated ground vehicles (TGVs) are widely applied in hazardous and dynamic environments, where communication delay and low transparency increase operator workload and reduce control performance. This study explores the cognitive and physiological workload associated with such conditions and evaluates the effectiveness of an eye-movement-based predicted trajectory guidance control (ePTGC) framework in alleviating operator burden. A human-in-the-loop teleoperation experiment was conducted using a 2 × 2 within-subject design, incorporating subjective ratings (NASA-TLX), objective performance metrics from a dual-task paradigm (one-back memory task), and multimodal physiological indicators (ECG and EDA). Results show that delay and low transparency significantly elevated subjective, objective, and physiological workload levels. Compared to direct control (DC), the ePTGC framework significantly reduced workload across all three dimensions, particularly under high-delay conditions, while maintaining or even improving task performance. Notably, ePTGC enabled even lower workload levels under low-delay conditions than the baseline condition. These findings demonstrate the potential of the ePTGC framework to enhance teleoperation stability and reduce operator burden in delay-prone and low-transparency scenarios.

1. Introduction

Teleoperation enables humans to remotely control objects in remote environments that are inaccessible or dangerous [1]. By ensuring operator safety, teleoperation maximizes the application of human cognitive abilities and domain-specific expertise in hazardous or otherwise unreachable areas [2]. It has broad application prospects in reconnaissance, space exploration, and telemedical robotics [3,4].
Despite advances in AI-driven autonomous systems, challenges like navigating unknown terrains, responding to unexpected events, and maintaining safety and robustness hinder full autonomy, especially in high-reliability scenarios [5,6]. Here, teleoperated ground vehicles (TGVs) offer a cost-effective and safe solution, leveraging human cognition for tasks such as reconnaissance, route clearance, surveillance, and rescue [7], where machine intelligence remains insufficient [8].
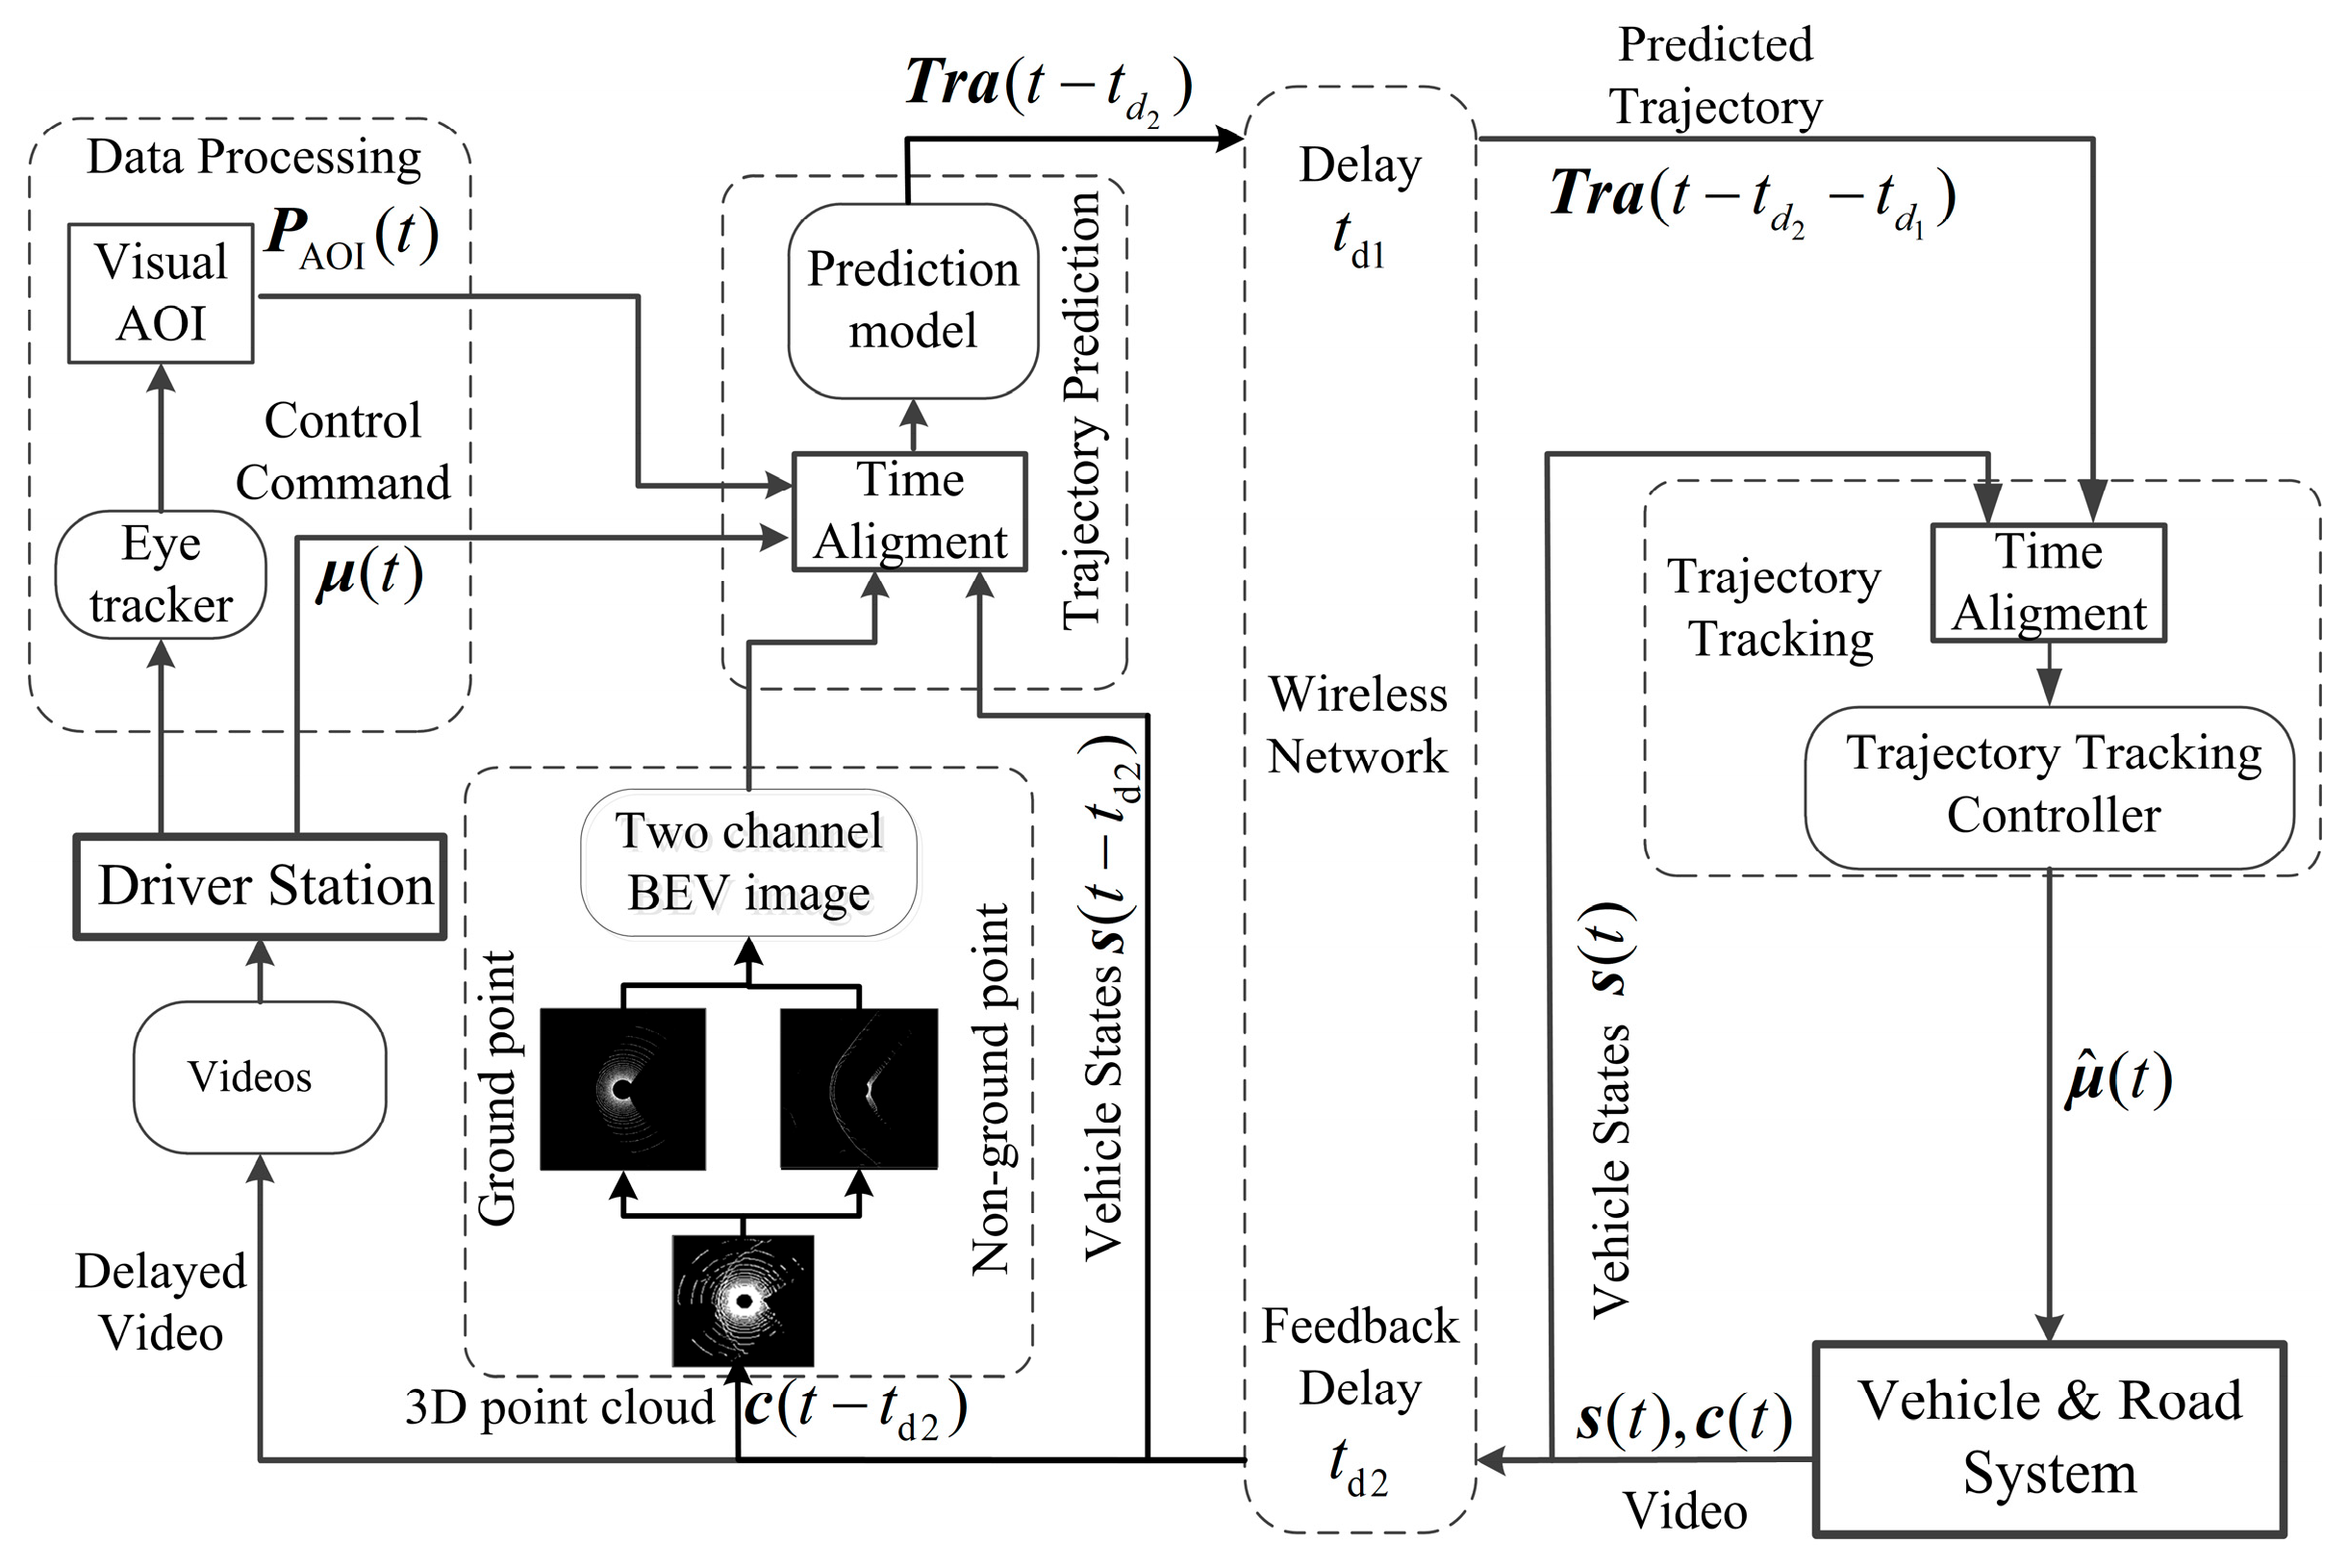
However, the development of TGVs still faces two significant challenges, i.e., communication delays and low transparency [9,10,11]. A typical schematic of TGVs is shown in Figure 1. TGVs operate in complex, hazardous environments where communication delays are common due to long-distance wireless transmission and terrain interference [12]. During operation, driver commands μ ( t ) and feedback signals s ( t ) (e.g., vehicle status, video feed) experience control delay t d 1 and feedback delay t d 2 , resulting in a round-trip delay of     t d 1 +   t d 2 . This delay causes temporal misalignment between operator input and vehicle response. While short delays can be mitigated through human prediction [13], increased delay disrupts the perceived input–response relationship, raising cognitive load and impairing control adaptability [14,15]. Performance drops notably when video delay exceeds 200 ms [16,17].
Another major challenge in TGVs is insufficient transparency, i.e., the extent to which operators can perceive environmental information compared to direct interaction [10]. In TGVs, video feedback is the primary source of situational awareness. However, its limitations hinder timely and accurate operator responses to dynamic changes [18,19]. While haptic feedback can enhance transparency in robotic teleoperation, it is less effective for TGVs operating at high speeds due to delay and limited information bandwidth [20]. Moreover, the potential benefits of haptic feedback in such systems are limited by issues such as delay amplification and operator information overload. These limitations not only undermine its ability to enhance transparency but may also disrupt operational stability.
To mitigate the negative impact of delay and low transparency on TGV teleoperation, our previous work [21,22] introduced an eye-movement-based predicted trajectory guidance control (ePTGC) framework to alleviate delay issues. Moreover, a Preview-LPV controller is extended and designed to ensure the robustness of the ePTGC framework under low-transparency conditions. Experimental evaluations demonstrated improvements in system-level performance metrics such as trajectory tracking accuracy and task completion time, particularly under high-delay and low-transparency conditions.
However, a critical limitation of the previous studies is the lack of investigation into how the ePTGC framework affects operator workload—especially under high task demands and time pressure. While prior evaluations [21,22] emphasized control performance and physical steering effort (SE), they did not consider how the framework influences the human operator’s cognitive and physiological workload.
In contrast to our earlier work, the current study adopts a human-centered evaluation perspective to systematically examine the impact of the ePTGC framework on operator workload. The specific contributions of this study are twofold:
(1)
It aims to further investigate the impact of delay and transparency on operator workload during TGV teleoperation tasks using a multimodal evaluation approach, including subjective ratings, task performance, and physiological signals (e.g., ECG, GSR).
(2)
It seeks to quantitatively assess the proposed ePTGC framework’s effect on operator workload and overall teleoperation task performance.

2. Related Work

TGVs are often used in high-risk environments where operators face significant cognitive and physical demands. Unlike natural driving, teleoperation is challenged by communication delays and low transparency, leading to increased workload. Sustained high workloads can degrade performance and endanger operator health [23], making workload management essential. Standard assessment methods include subjective, task performance, and physiological measures [24].
Subjective workload assessments rely on participants’ self-reports and are typically divided into unidimensional and multidimensional scales [25]. Unidimensional tools, such as the modified Cooper–Harper scale, focus on a single factor, whereas multidimensional tools, including NASA-TLX and SWAT, are designed to capture multiple dimensions. NASA-TLX evaluates six workload components (e.g., mental, physical, and temporal demand), while SWAT assesses time demand, mental effort, and stress.
Performance-based methods use a concurrent secondary task (e.g., N-back tests) to infer cognitive workload from changes in task performance [26].
Physiological measurement methods assess cognitive workload by monitoring various physiological indicators, which are generally divided into two categories: brain-activity-based and non-brain-activity-based measures. Brain-activity-based approaches include electroencephalography (EEG), near-infrared spectroscopy (NIRS), and functional magnetic resonance imaging (fMRI), which are widely used for cognitive state classification [27]. Non-brain-activity-based measures include electrocardiography (ECG) (e.g., heart rate (HR), heart rate variability (HRV)), skin conductance (SC), respiratory metrics (e.g., breathing rate, ventilation), and ocular metrics (e.g., blink frequency, pupil diameter) [28]. These physiological signals can effectively reflect an individual’s cognitive load and psychological state. For example, Lantieri et al. [29] used EEG and a mobile eye-tracking system to assess drivers’ mental workload in real-world driving with Adaptive Cruise Control (ACC). Their approach combined subjective, EEG, eye movement, and performance data to reveal workload variations under different conditions. However, unlike passive observation studies, our framework actively incorporates real-time eye movement data as control inputs, where operators intentionally use eye gaze to express their driving intentions. This active involvement of eye behavior introduces intentional modulation, making eye-tracking data less reliable as an objective workload indicator in our context.

2.1. Workload Assessment Research in Teleoperated Robotics

With the growing use of teleoperated robots, numerous studies have explored workload assessment in these systems. Timman et al. [30] demonstrated that communication delays in a lunar sampling task increased operator workload, using NASA-TLX and heart rate variability (HRV) metrics. Zhang et al. [31] analyzed workload using eye-tracking (SRT), NASA-TLX, and task performance, revealing that head-mounted displays (HMDs) influence workload over time. Nenna et al. [32] compared button-based and gesture-based VR control interfaces, finding that interface complexity impacts workload and performance, especially under dual-task conditions. Seo et al. [33] assessed time delay effects in lunar construction tasks using NASA-TLX, eye-tracking, and electrodermal activity (EDA), highlighting the relationship between delay and cognitive load. Dybvik et al. [34] compared workload under delayed teleoperation with and without predictive display support, finding that while predictive displays reduced workload, their effectiveness was limited. Guo et al. [35] showed that eye-tracking metrics (fixation duration, saccade rate, pupil diameter) reliably reflected workload under time pressure and delay in space-based teleoperation. In a follow-up, Seo et al. [36] further examined how delay influences control strategies and workload in lunar excavation, integrating eye-gaze data and NASA-TLX.
Most existing studies on teleoperated space robots or robotic manipulators have focused on low-speed, relatively static task scenarios, such as space assembly or lunar sampling. However, these tasks differ from the operational conditions of teleoperated ground vehicles (TGVs), which typically require higher mobility and must navigate complex, dynamic environments. This fundamental difference limits the direct applicability of existing research findings to TGV teleoperation. Consequently, further research and technical adaptations are necessary to address the unique challenges of high-dynamic, complex environments encountered in TGVs applications.

2.2. Workload Assessment in Teleoperated Ground Vehicle Tasks

Recent research has increasingly addressed the unique challenges of assessing operator workload in teleoperated ground vehicle tasks, an area previously dominated by methods developed for space and manipulator teleoperation. For example, Zheng et al. [20] introduced steering effort (SE) as an indirect workload metric in trajectory tracking, demonstrating its sensitivity to communication delay and compensation strategies. Lim et al. [37] extended this by showing that increased delay leads operators to adopt more active control strategies, with SE peaking at 900 ms due to vehicle instability. However, individual driving styles can influence such indirect metrics, and their correlation with actual workload remains to be validated. To provide more robust assessments, Lu et al. [38] examined the impact of delay on operator workload in TGV tasks and proposed a model predictive delay compensation method. Through human-in-the-loop experiments, they combined subjective workload assessments (NASA-TLX), task performance measures, and physiological indicators (e.g., pupil diameter) to evaluate the effectiveness of the proposed approach under different delay conditions. Papaioannou et al. [39] used the NASA-TLX to study the effects of time delay on performance, emotional state, cognitive workload, and perceived system usability. They found that delay increased frustration and reduced usability and task success, with delay exerting a more substantial negative impact than task complexity and showing additive interaction effects.
In a related study, Musicant et al. [40] simulated a driving environment and found that delays up to 250 ms increased perceived workload. To support real-time workload estimation, Luo et al. [41] proposed a Bayesian inference model based on physiological signals such as eye gaze and pupil dilation, achieving high accuracy (F1 = 0.823) and outperforming traditional single-model approaches. Additionally, Musicant et al. [42] investigated the influence of camera viewpoint height on teleoperation performance, showing that an elevated (roof-mounted) view reduced perceived workload and frustration compared to a driver-eye view. However, neither study addressed the combined effects of delay and interface transparency on operator workload, which are two critical factors in the teleoperation of TGVs.

2.3. Summary

Existing studies on workload assessment in teleoperated ground vehicle (TGV) tasks primarily rely on subjective measures (e.g., NASA-TLX) or single physiological indicators (e.g., pupil diameter). However, physiological signals are susceptible to individual variability, and single-modality indicators often fail to capture the operator’s cognitive and emotional state fully. Moreover, current research tends to focus narrowly on the effects of communication delay and compensation strategies while neglecting the impact of low transparency—such as insufficient feedback or inconsistent task responses in dynamic environments—on operator workload.
To enhance assessment accuracy and ecological validity, research should integrate multimodal physiological data (e.g., ECG, EDA) with subjective ratings and performance metrics, enabling a multidimensional evaluation of operator workload. Furthermore, experimental designs should reflect real-world complexity by jointly considering delay and transparency, enabling a deeper and more comprehensive understanding of how multiple interacting factors contribute to workload and supporting the development of more effective mitigation strategies.

3. Eye-Movement-Based Predicted Trajectory Guidance Control Framework

The ePTGC framework is illustrated in Figure 2. The framework has two modules: trajectory prediction and trajectory tracking.
In the trajectory prediction module, the teleoperator’s commands μ t , the eye movement P A O I t , the contextual constraints c ( t t d 2 ) and the vehicle states s ( t t d 2 ) are employed to predict the teleoperator’s intended trajectory, denoted as T r a t t d 2 . This predicted trajectory is transmitted to the vehicle side after a delay t d 1 and denoted as T r a t t d , here t d = t d 1 + t d 2 . After truncating the initial t d segment, the trajectory is aligned with s ( t ) and used to guide the vehicle’s future maneuvers. Unlike traditional direct control (DC), where operator inputs directly control the vehicle, ePTGC treats control commands as features for trajectory prediction. This decouples the operator from the control loop, mitigating over- and mis-maneuvering caused by delays. Moreover, the operator’s eye movement data provides predictive and accurate information about future control intentions. By integrating eye movement into the ePTGC framework, the system enables early perception and guidance of upcoming control demands, tightly coupling the operator’s visual attention with vehicle operation. This allows operators to make decisions based solely on the current state information received from the vehicle, without needing to account for delay-induced response discrepancies, thereby reducing their cognitive workload.
In the trajectory tracking module, a Preview-LPV (Linear Parameter-Varying) controller is designed to address transparency-related challenges. This controller integrates a preview-based feedforward gain and adaptive regulation based on external conditions, ensuring that vehicle responses remain consistent with operator intentions during low-transparency teleoperation tasks. It improves vehicle response consistency and enhances control stability under uncertainty.
Previous studies have commonly employed techniques such as predictive displays or Smith predictors to compensate for communication delays in teleoperation tasks [7,43]. Predictive displays assist operators by visually extrapolating future vehicle states, enhancing situation awareness without modifying the underlying control dynamics [44]. However, they typically require real-time rendering and are more suitable for low-speed or visually simple environments. In contrast, the Smith predictor depends on accurate modeling of system dynamics and delay characteristics to reconstruct a delay-free response [45], which limits its applicability in complex or uncertain scenarios.
The proposed ePTGC framework differs from these approaches in that it offers direct trajectory guidance based on predicted operator intent, which is inferred from multimodal cues such as gaze behavior and used to generate reference trajectories for control. This intent-aware mechanism enables a model-free and human-centric solution that actively shapes the control process. These distinctions highlight the practical advantages of ePTGC in uncertain and dynamically changing environments. Overall, ePTGC addresses communication delays and low transparency in teleoperation, enabling more intuitive and stable control.
Human-in-the-loop experiments demonstrate that the framework enhances both operator efficiency and vehicle stability under challenging conditions [21,22]. However, its impact on operator workload in delayed and low-transparency scenarios remains underexplored and warrants further investigation.

4. Methodology

4.1. Apparatus

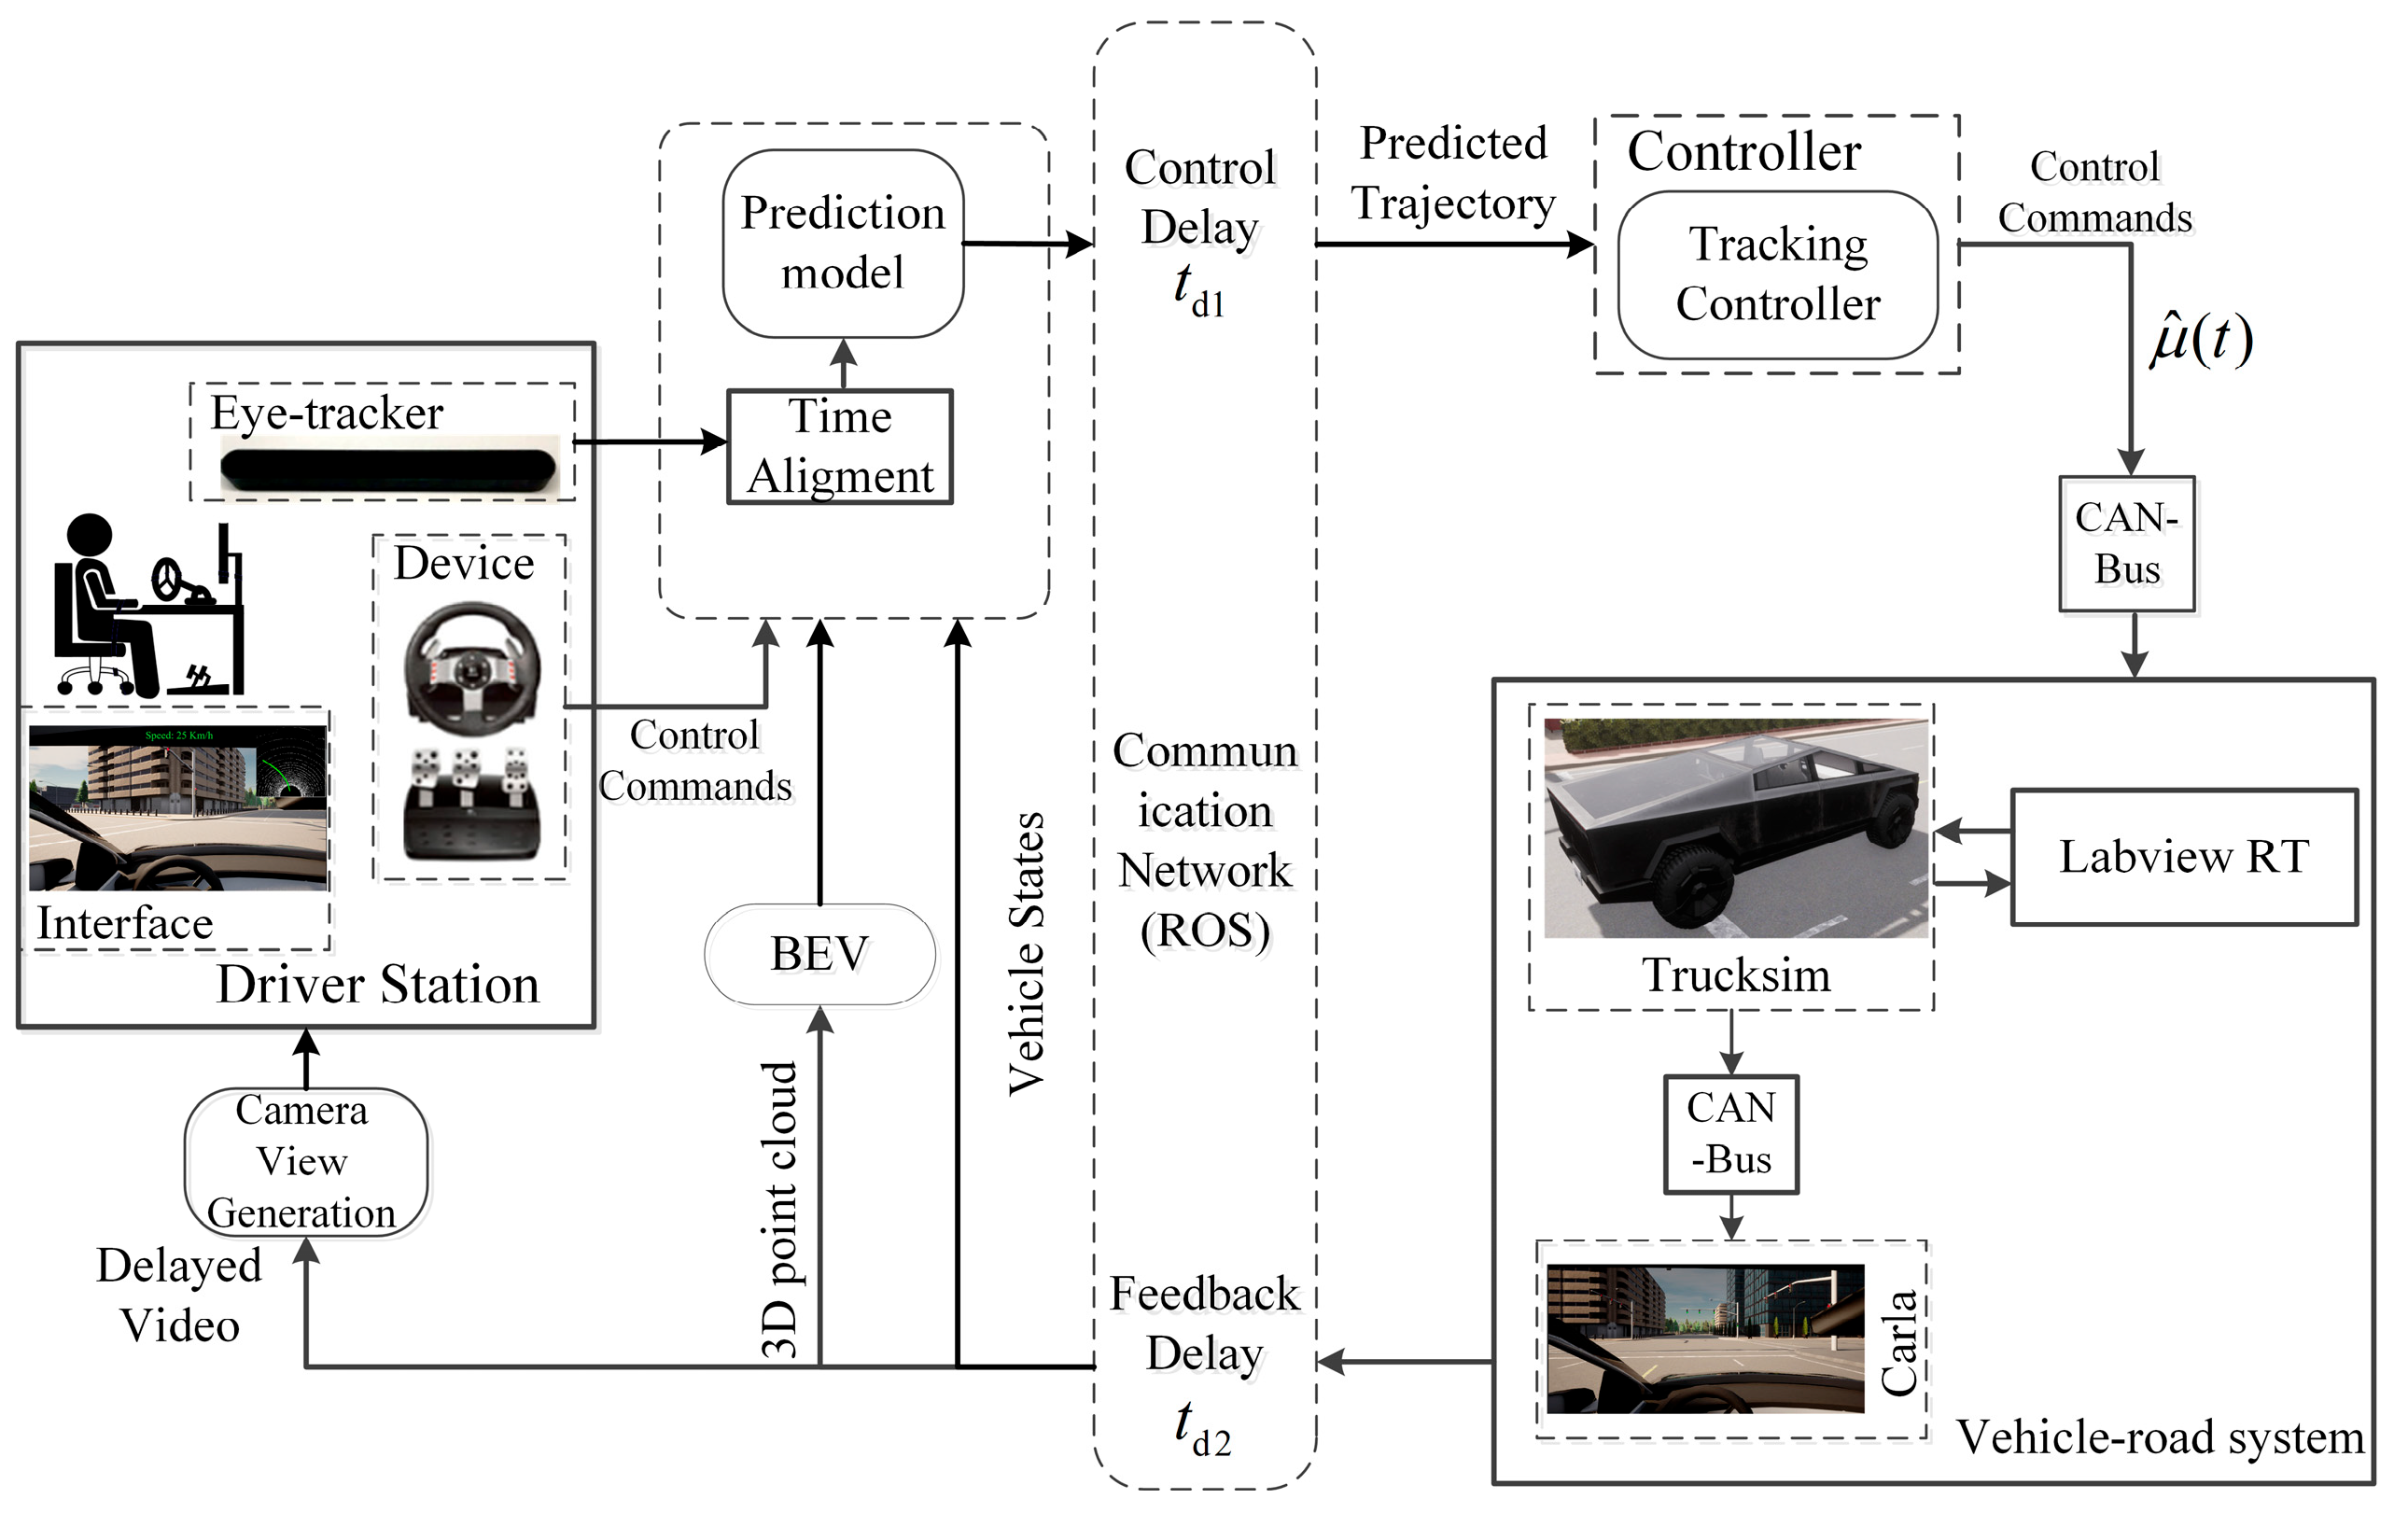
The experiment was conducted on a human-in-the-loop teleoperation simulation platform, as illustrated in Figure 3. The platform comprises four main subsystems: the driving station, the vehicle–road system, the controller, and the communication network module.
At the driving station, a Logitech G27 steering kit provides steering, throttle, and brake inputs. Visual feedback, delayed to simulate communication delay, is displayed on a monitor equipped with a Tobii eye-tracker to record the operator’s gaze behavior. Eye movement data, vehicle states, and 3D point clouds are integrated into the trajectory prediction module to generate the operator’s intended trajectory.
The vehicle–road system is built using CARLA and TruckSim. CARLA handles visual rendering and sensor simulation (e.g., RGB camera, LiDAR), while TruckSim simulates vehicle dynamics via CAN-based control input, updates vehicle states in real time, and models road conditions with varying friction levels.
Communication delay is emulated in ROS using a FIFO (First-In–First-Out) buffer. Video and vehicle state data are enqueued and dequeued according to the buffer length, allowing for adjustable delay simulation.
While the platform simulates only the vehicle–road dynamics and network latency, the human–machine interface closely mirrors real-world setups. This allows for accurate reproduction of operator responses to communication delays and sudden environmental changes.
The operator was equipped with physiological sensors to collect biosignals during the teleoperation task, as illustrated in Figure 4. Electrodermal activity (EDA) and electrocardiogram (ECG) signals were recorded using the MP150 physiological data acquisition system manufactured by Biopac Systems Inc, with a sampling rate of 2000 Hz. The corresponding sensors are also shown in Figure 4a,b. The one-back voice interaction task was implemented using PsychoPy (v2022.2.2). Audio files containing digit stimuli (0–9) were imported and configured to be randomly presented at one digit every 2 s, as shown in Figure 4c.

4.2. Participants

A total of 22 volunteers participated in the experiment, with a mean age of 24.9 years (SD = 2.9). All subjects held a valid driver’s license and had at least one year of practical driving experience. The participants were in good health, with normal or corrected vision and hearing, no history of neurological or cardiovascular diseases, and met the basic physiological stability requirements for the experiment. During the experiment, one participant could not complete the task after several attempts under high-delay conditions and voluntarily withdrew from the study. This participant did not complete the entire experimental process, so his data were excluded from the final analysis. The final valid sample size was 21.

4.3. Experimental Design

The experiment was conducted in a 2 × 2 within-subjects design to determine the effect of delay level and control method on the operator’s workload. The control method consists of two levels, i.e., {DC, ePTGC}, where DC refers to a direct control framework without any aids. To ensure the smooth implementation of the experiment and to capture a clear contrast between high- and low-delay conditions, the delay levels were selected based on pilot study results. Specifically, 200 ms (low delay) and 600 ms (high delay) were chosen as the experimental conditions, as they represent threshold values at which the impact of delay and transparency on teleoperation performance can be clearly observed. In addition, these delay values align with typical ranges encountered in communication networks [34,46,47] and are consistent with those reported in previous delay-related studies [37,38,48].
Using the results from the DC method under zero-delay and high-adhesion road conditions as a baseline, each participant completed five teleoperation driving tasks. To minimize the influence of specific scenarios or path memorization, the order of the tasks was randomized across subjects.

4.3.1. Test Road

As depicted in Figure 5, the experimental test route consists of several straight-line segments alternating with curved segments. The straight-line segments primarily evaluate the teleoperated system’s steady-state performance under constant input conditions, whereas the curved segments are designed to assess the system’s transient response under step or ramp input conditions. The total length of the test route is 588 m, including six sharp curves with radii ranging from 10 to 14 m and one gentle curve with a radius of 44 m. These variations in curvature introduce differing levels of maneuvering difficulty to increase task complexity. This design facilitates a more comprehensive elicitation of participants’ physiological responses and enables effective observation of both fluctuation patterns and recovery dynamics in physiological indicators.
The road surfaces were differentiated based on their adhesion coefficients to further investigate the operator’s workload in response to sudden environmental changes under low-transparency conditions. A higher adhesion coefficient (μ = 0.85) was applied to the straight segments to simulate typical dry road conditions, while a lower adhesion coefficient (μ = 0.25) was applied to the curved segments to simulate low-adhesion wet and slippery road conditions. The corresponding regions are highlighted with dashed ellipses in Figure 5. Participants were required to complete one lap along the centerline of the predefined trajectory, following task instructions. The driving direction could be either clockwise or counterclockwise.

4.3.2. Experimental Procedure

The entire experimental process was divided into two phases: the training phase and the testing phase. The training phase aimed to familiarize participants with the operational procedures of the human-in-the-loop teleoperation platform and to provide them with experience operating under different delay and road condition scenarios. Notably, the same test route described in Section 4.3.1 was used during both the training and experimental phases to ensure consistency in participants’ spatial awareness and control experience. During the training, participants were also asked to report any physical discomfort caused by teleoperation under delayed conditions.
Participants signed an informed consent form after completing the preparation and training phases. Next, two SC electrodes were attached to participants’ distal phalanges to obtain the SC signal (Figure 6a; [49]). Three electrodes were placed on the body in the lead II configuration (Figure 6a; [28]) to record the ECG. A five-minute baseline physiological data collection session was conducted to record their initial physiological state. Following this, a teleoperation task was randomly selected to begin the experiment. Participants completed two trials of the primary task, during which physiological data were collected in real-time. After each trial, they filled out the NASA-TLX scale to evaluate their subjective workload. A five-minute rest period followed each trial to allow participants’ physiological indicators to return to baseline levels. Upon completing the two primary trials, participants proceeded to the secondary task phase, during which physiological data were no longer recorded. Instead, they performed a one-back voice interaction task, which was also conducted in two trials. No further subjective workload assessments were conducted in this phase, as the increased cognitive load from the one-back task could potentially bias participants’ self-reports. It should be noted that the one-back verbal interaction task was not designed to induce stress but to provide an objective measure of cognitive workload during teleoperation. Its moderate difficulty level was validated through pilot testing and ensured consistency across experimental conditions. The overall experimental procedure is illustrated in Figure 7.
Upon completion of the experiment, interviews were conducted to obtain qualitative insights into task difficulty, user experience, and potential areas for improvement, thereby enriching the interpretation of the experimental findings.

4.4. Data Preprocessing and Data Description

This study assessed workload in teleoperation tasks from three dimensions: subjective workload, physiological measures, and task performance evaluation.

4.4.1. Subjective Workload-Related Dependent Variables

The subjective workload was measured using the NASA-TLX scale. The subjective workload-related dependent variables included six dimensions: Mental Demand, Physical Demand, Temporal Demand, Performance, Effort, and Frustration. In addition, an overall workload score (Score) was calculated based on an equal-weight principle, providing a comprehensive indicator of the operator’s subjective workload level.

4.4.2. Task Performance-Related Dependent Variables

Task performance was evaluated using a dual-task experimental design. The primary task consisted of a teleoperation path-tracking task, with performance assessed using three key metrics: deviation-to-centerline (D2C), heading-to-centerline (H2C), and task completion time (TCT), which reflected the control stability and maneuverability of the teleoperation system. Specifically, D2C quantifies the lateral tracking performance by calculating the enclosed area between the vehicle’s actual trajectory and the reference centerline. H2C, as a stability-related metric, represents the cumulative heading discrepancy between the vehicle orientation and the road direction over the entire path, capturing fluctuations caused by unstable control. TCT measures the time required to complete an entire loop of the driving task, reflecting longitudinal efficiency.
The secondary task was a one-back voice interaction task, where the operator workload during concurrent task execution was objectively evaluated through the Accuracy and Response Time time of the voice interaction task.

4.4.3. Physiological Measure Related Dependent Variables

In this subsection, we first preprocess the raw data (i.e., EDA and ECG) to remove noise and outliers and then perform standardization. Finally, feature extraction is performed on the preprocessed data.
The raw SC signal was down-sampled to 25 Hz and smoothed by a median smoothing filter with a 1 s width to eliminate movement artifacts [50]. To eliminate individual differences in EDA signals, they were normalized according to the following equation (Standardized EDA = (EDA value—minimum value)/(maximum value—minimum value)). The maximum and minimum values of EDA refer to the minimum value of the subject’s resting baseline and the maximum value of all task phases, respectively. The phasic component of the EDA was extracted using a 0.05 Hz high-pass filter from the standardized EDA [28]. The ECG signal was down-sampled to 200 Hz, and then a 0.5–35 Hz bandpass filter was used to remove the noise [51].
A total of 21 physiological features were extracted from the preprocessed data—11 ECG-related and 10 EDA-related. However, these features may be influenced by individual differences and environmental factors, and not all features are equally effective in capturing the overall workload state. To address this, a multi-stage feature selection strategy was developed and implemented to identify the most predictive physiological indicators of workload, enhancing the performance and interpretability of subsequent statistical modeling.
In the first stage, LASSO (Least Absolute Shrinkage and Selection Operator) regression was used to filter the initial physiological feature set. By introducing an L1-norm penalty, LASSO enables automatic variable selection, removing redundant and noisy features while retaining those most relevant to subjective workload ratings.
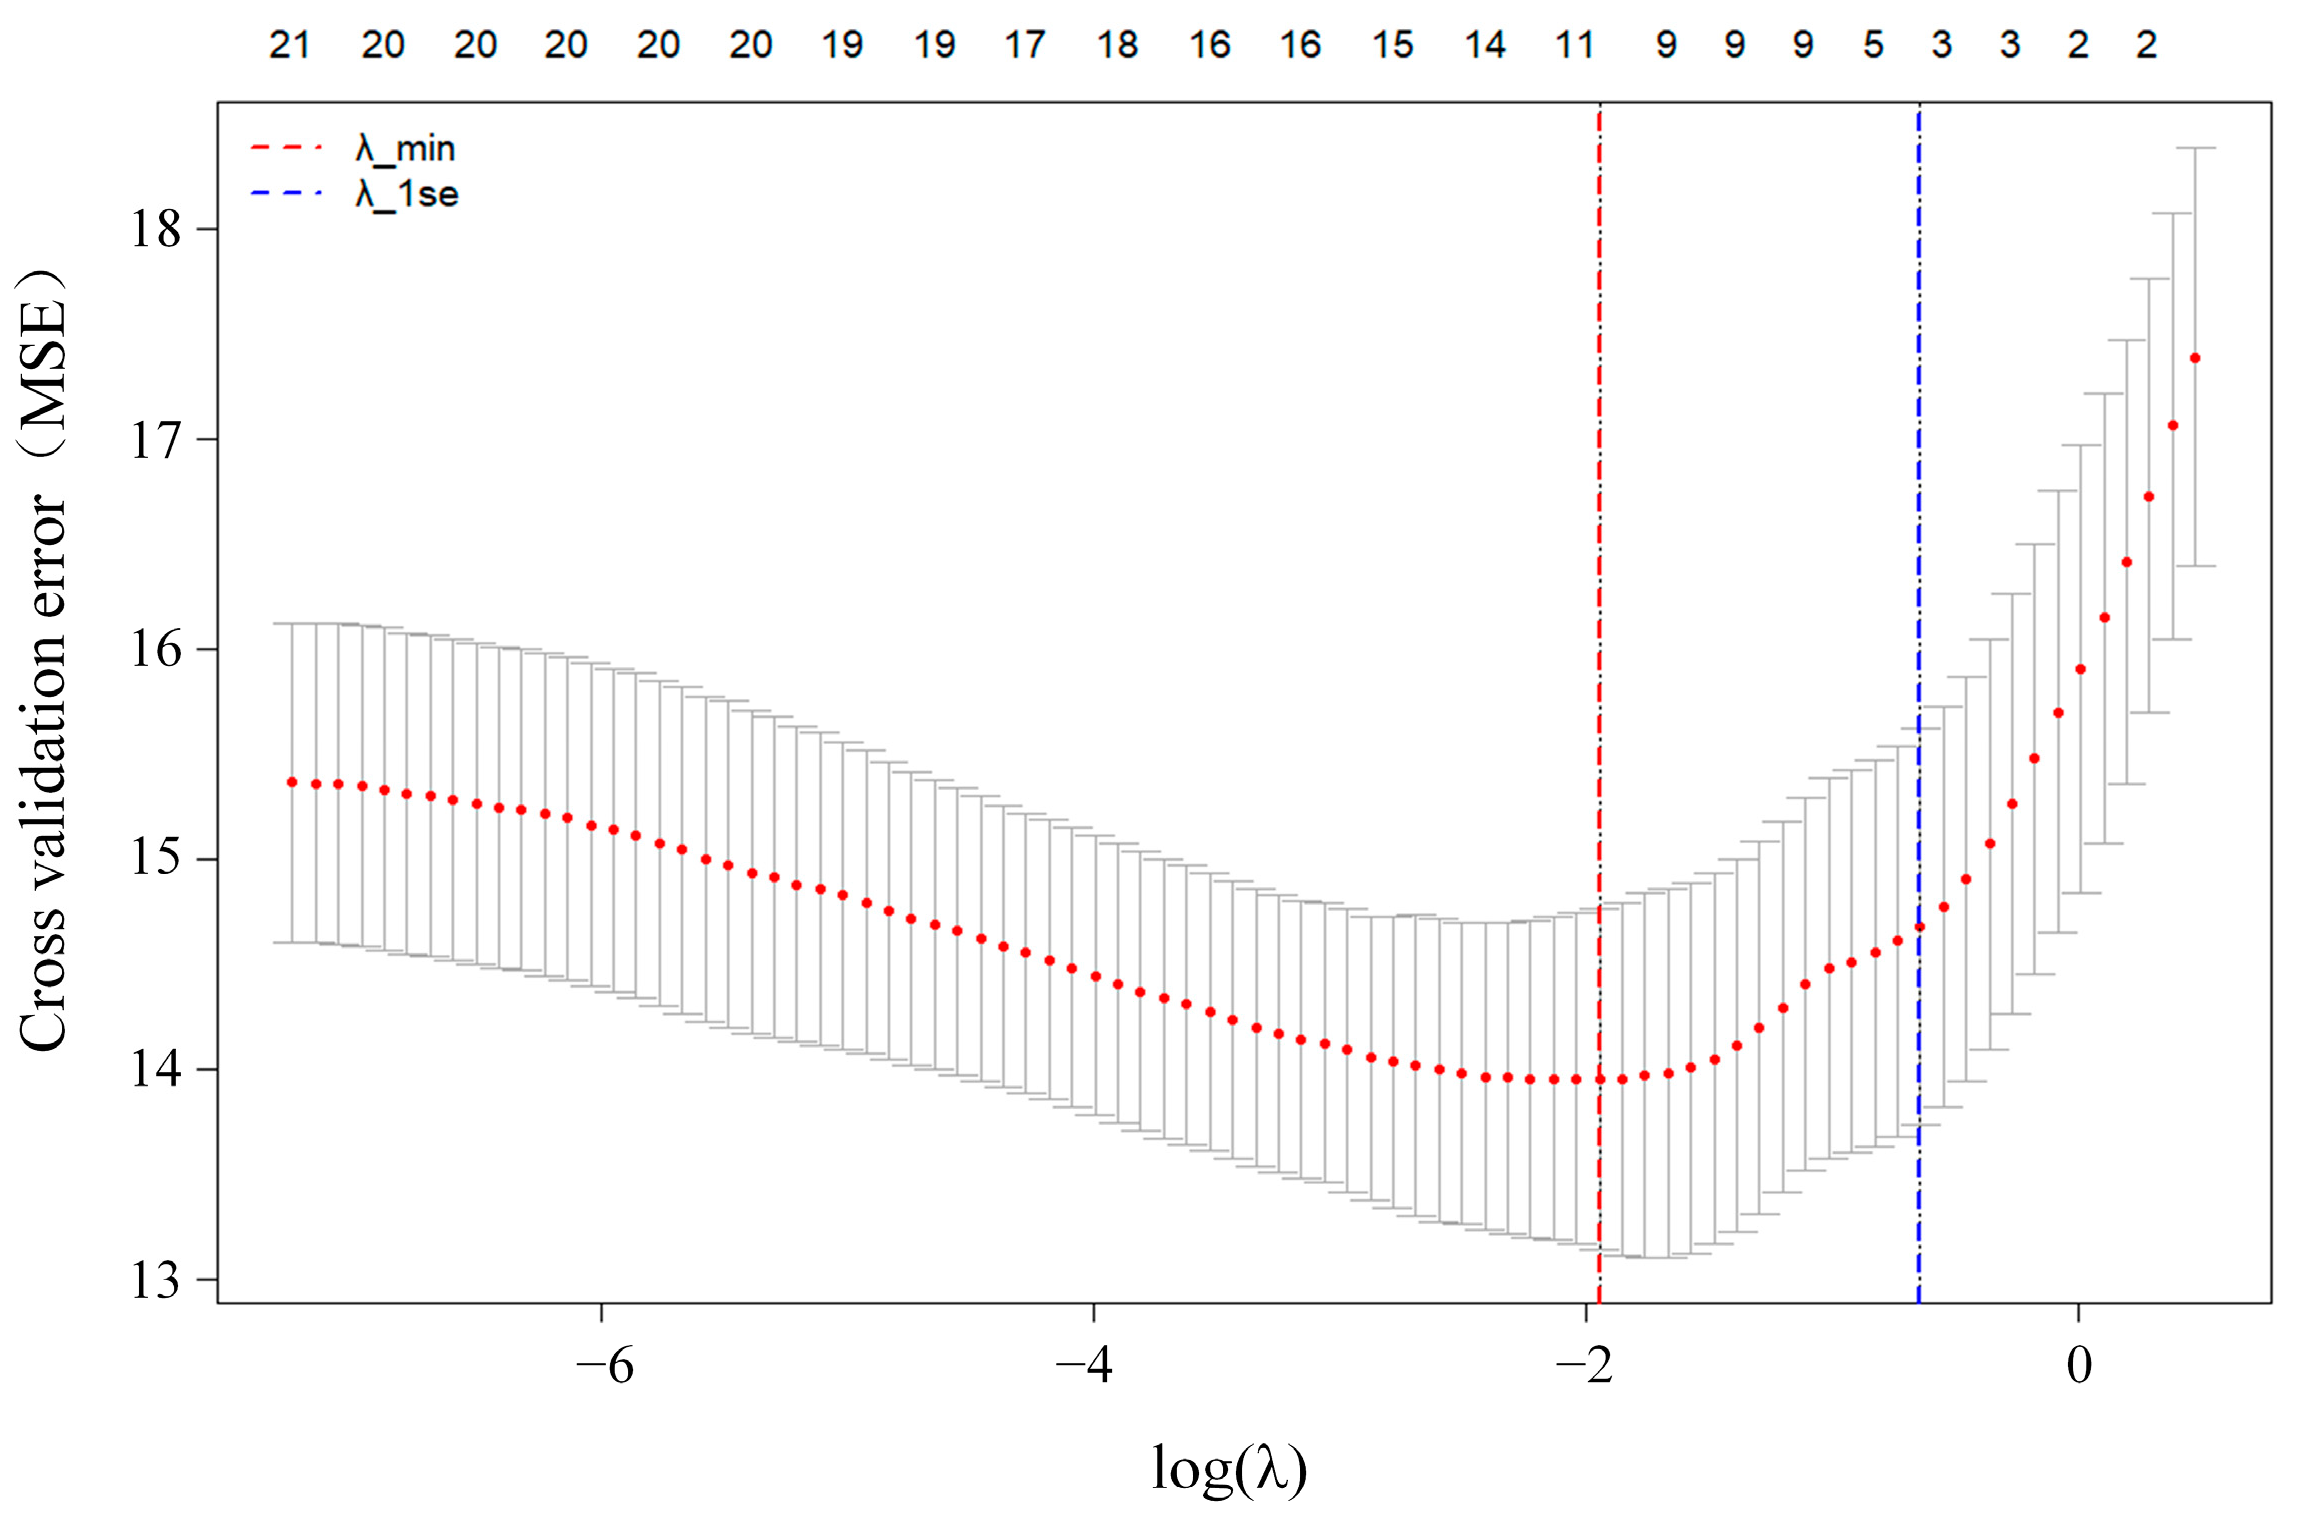
A five-fold cross-validation was conducted to determine the optimal regularization parameter λ. As shown in Figure 8, λ_min (0.14) corresponds to the minimum cross-validation error and retains 11 non-zero features, while λ_1se (0.53) yields a sparser model with only 3 features. Although the λ_1se model is simpler, it may exclude important variables. Therefore, the λ_min model was selected, and 12 non-zero coefficient features (see Figure 8) were used for subsequent analysis.
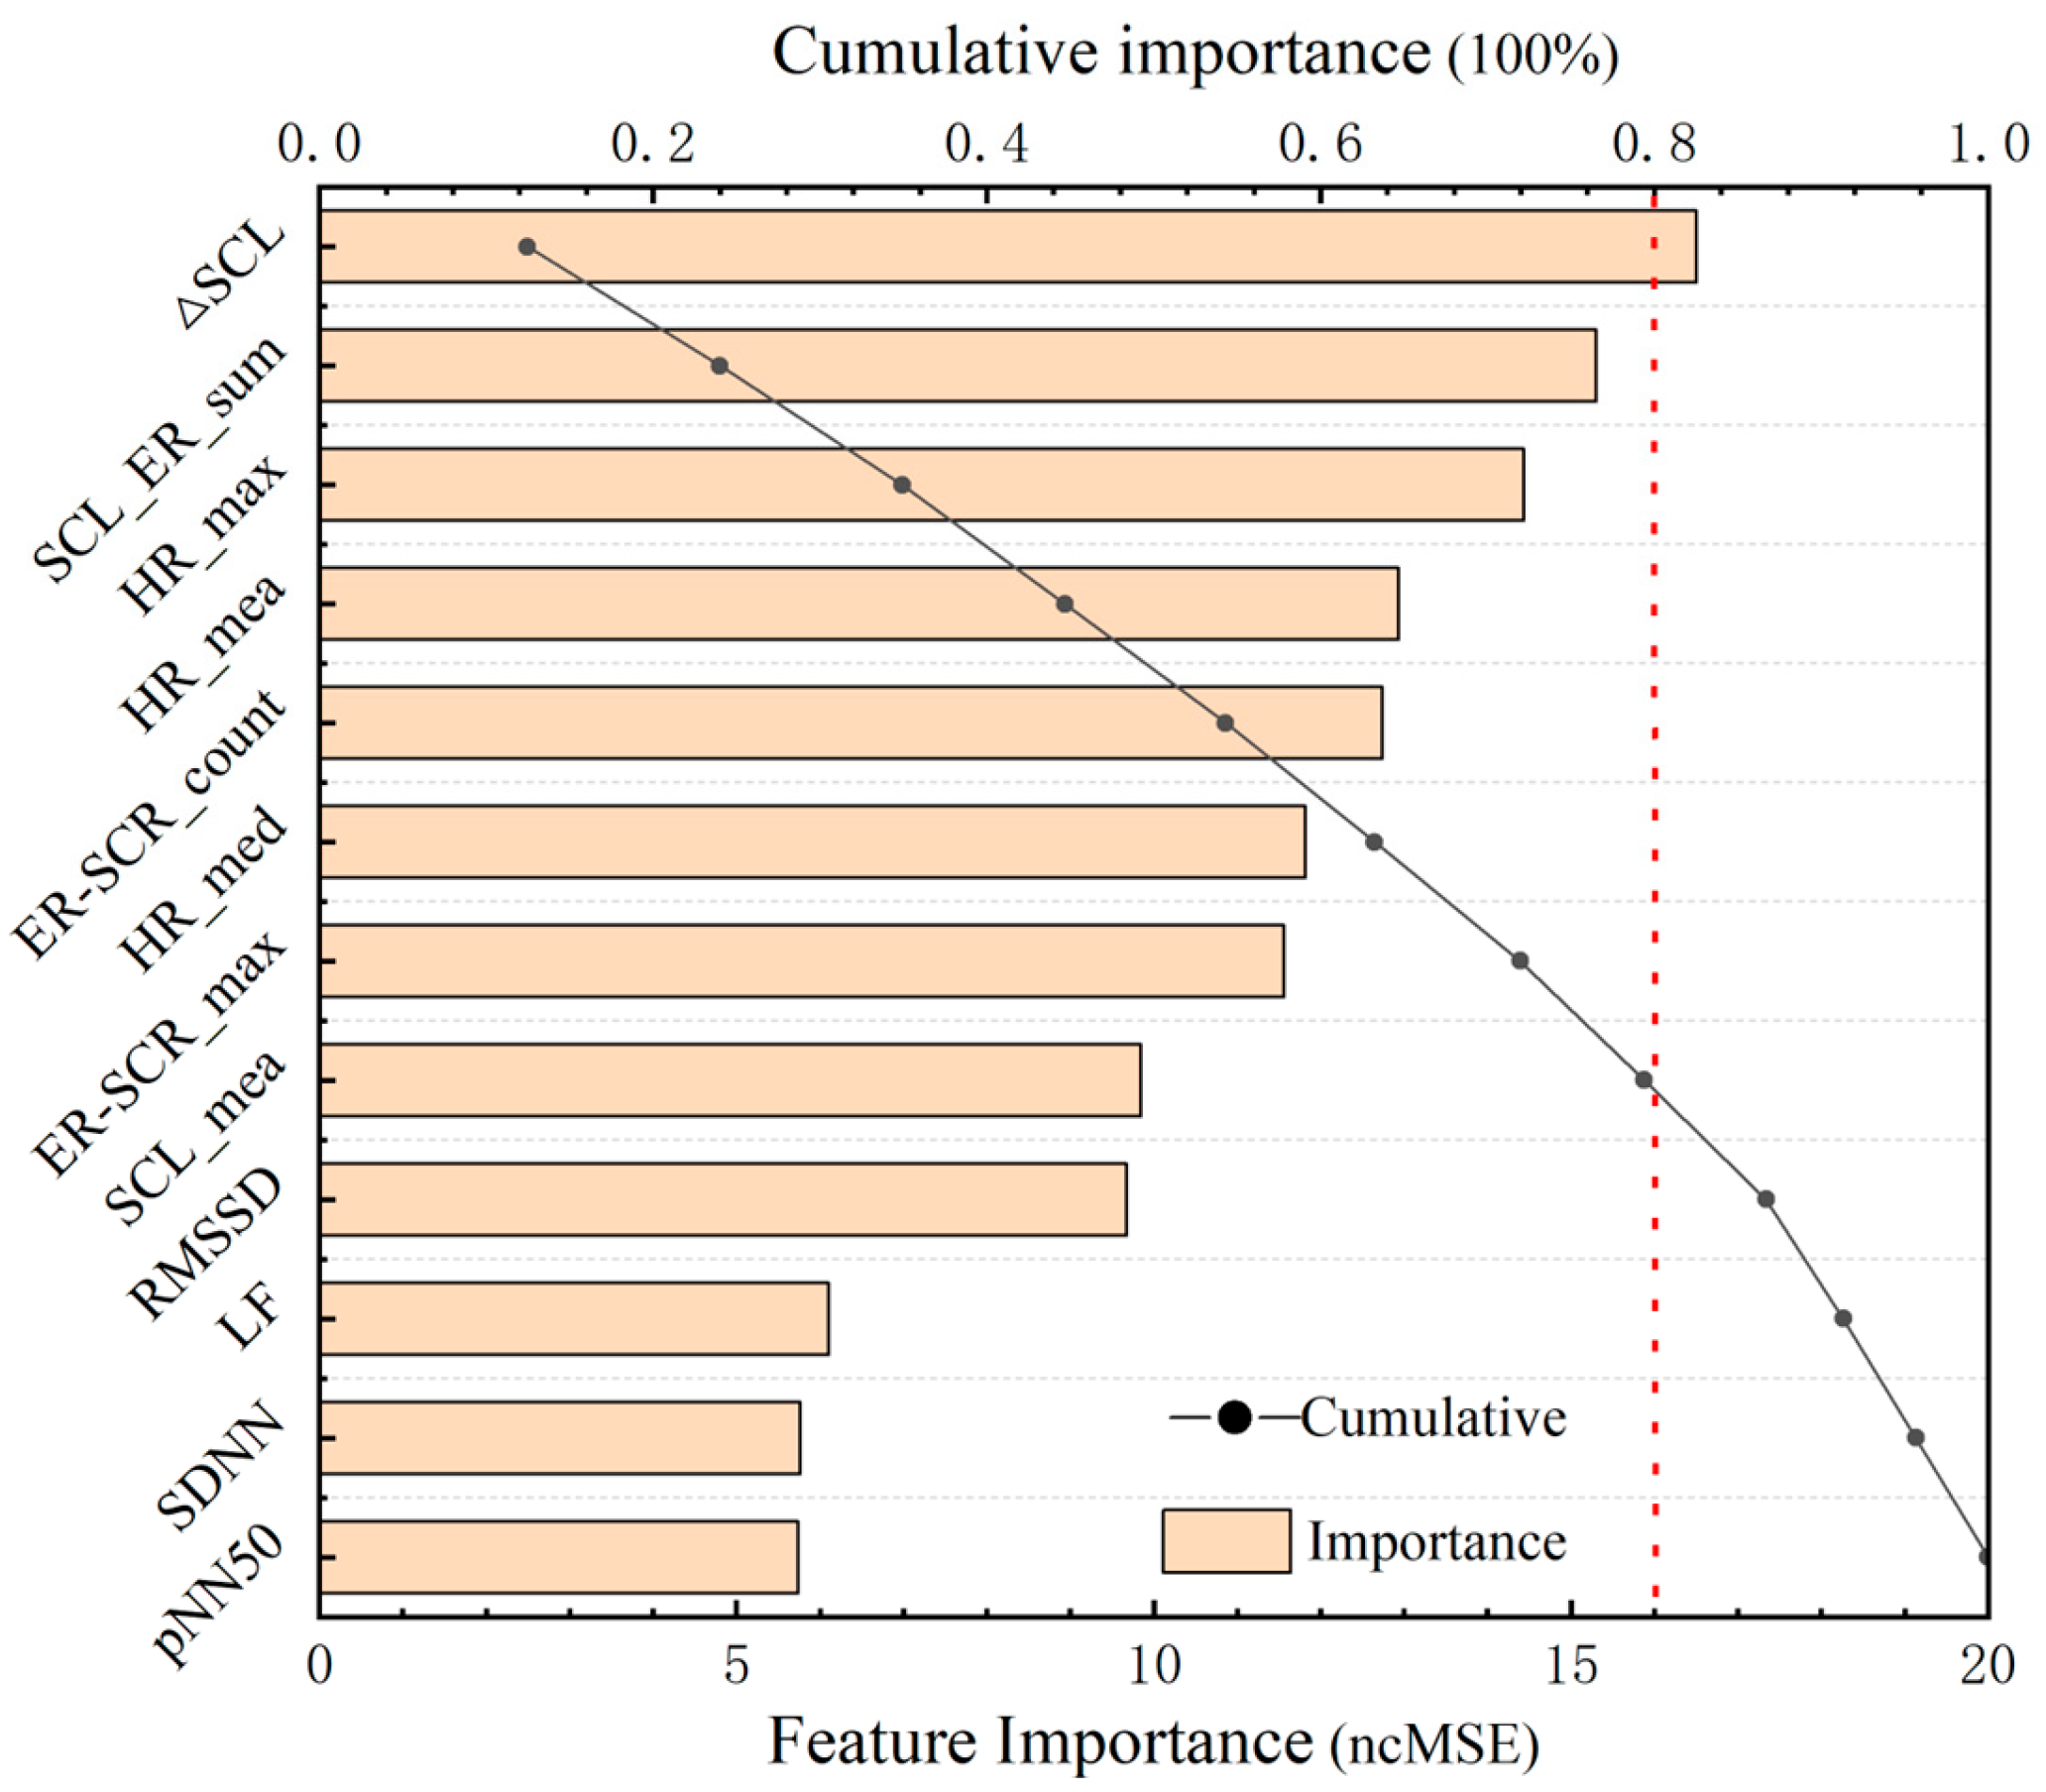
Although LASSO regression is effective for feature selection, it is sensitive to multicollinearity and only captures linear relationships. To address this, a second-stage analysis using a Random Forest model (n_estimators = 500) was conducted to assess the importance of the LASSO-selected features. As shown in Figure 9, the top eight features account for over 80% of the cumulative importance. Therefore, these eight features (△SCL, SCL_ER_sum, HR_max, HR_mea, ER-SCR_count, HR_med, ER-SCR_max, and SCL_mea; see Table 1 for details) were selected as the core physiological feature set for subsequent analysis.
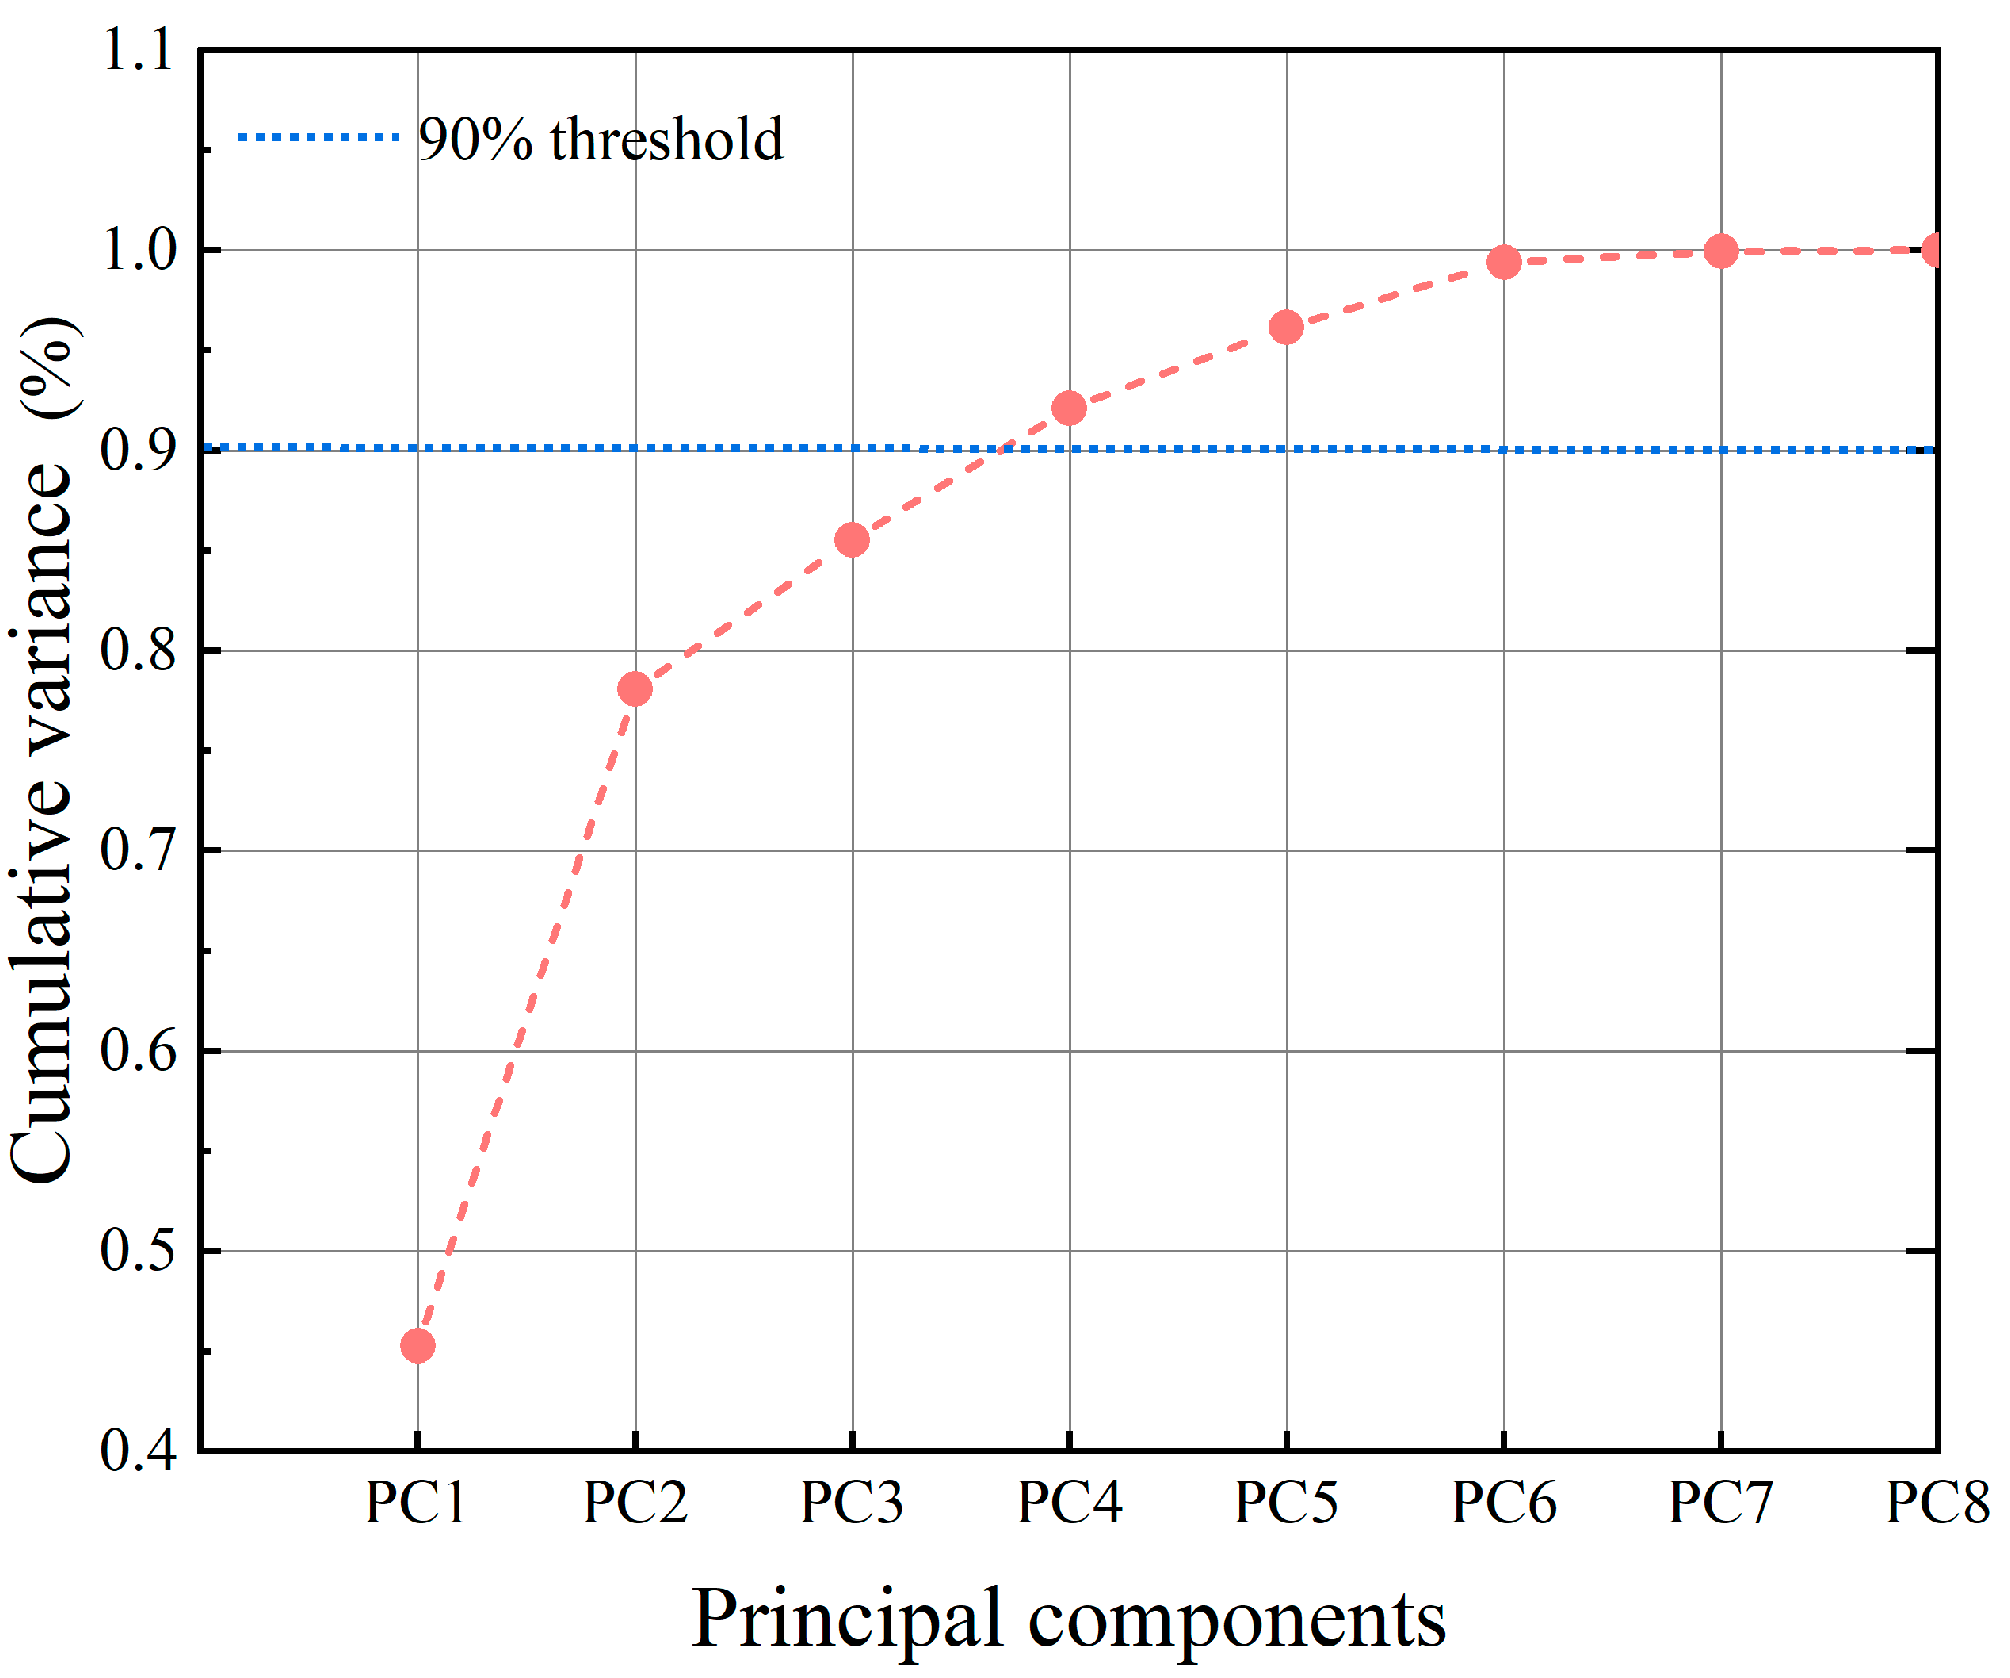
In the third stage, principal component analysis (PCA) was applied to the core feature set to reduce dimensionality. As shown in Figure 10, the cumulative variance explained by the first four principal components (PC1–PC4) exceeded 90%, indicating that they preserved most of the data’s information. Beyond these components, the curve leveled off, and additional components contributed little, suggesting they could be disregarded.
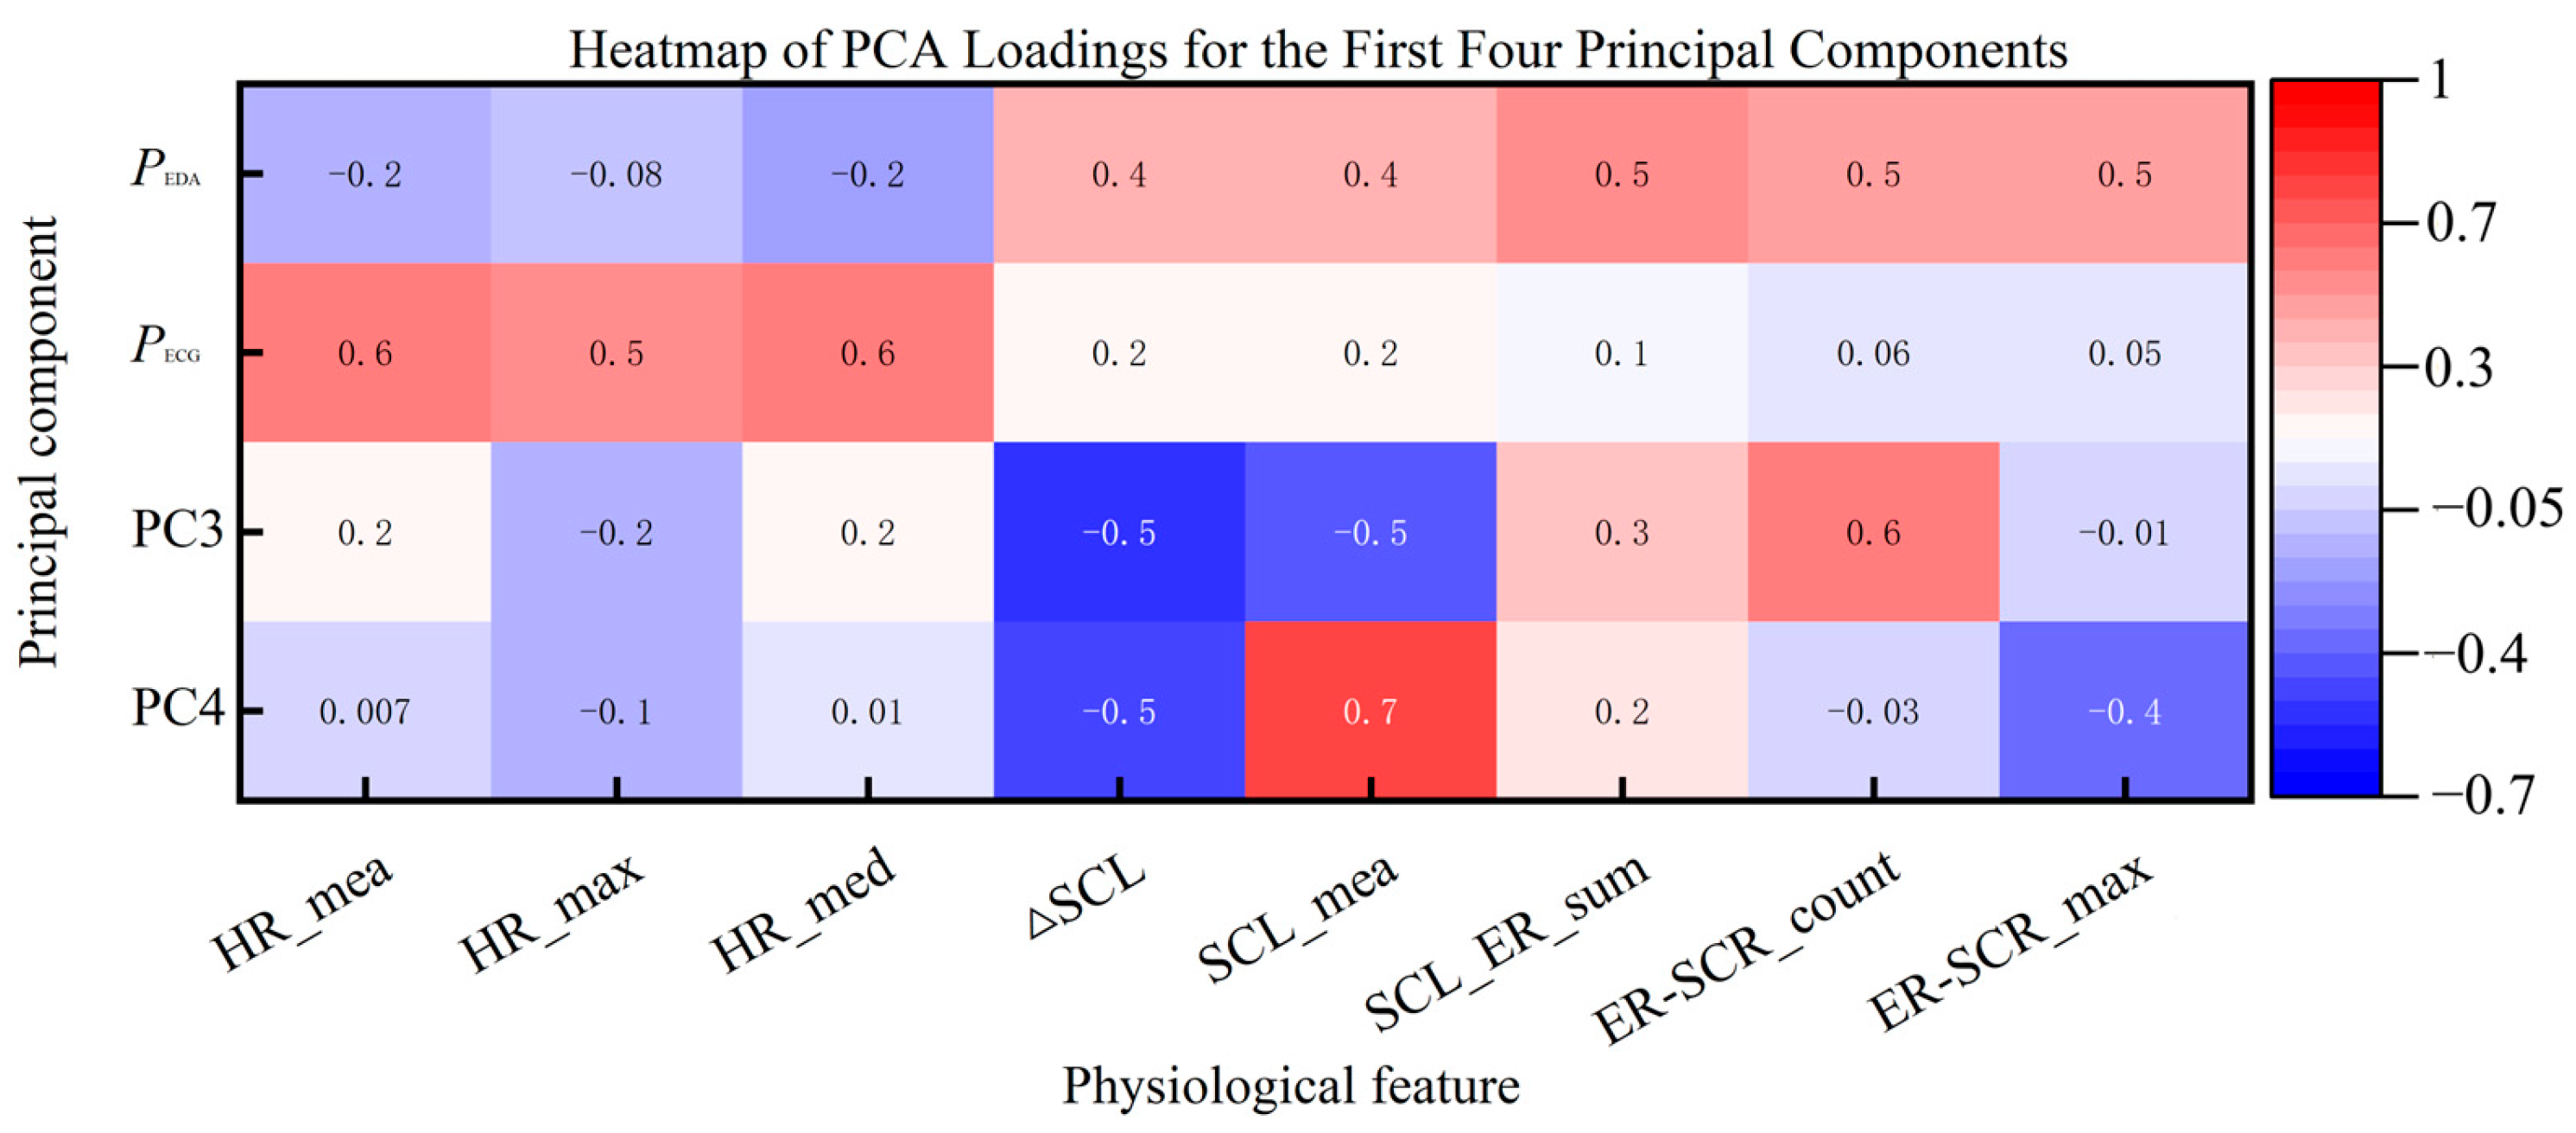
As shown in the loading plot (Figure 11), PEDA (PC1) was primarily composed of EDA-related features (△SCL, SCL_mea, SCL_ER_sum, ER-SCR_count, and ER-SCR_max), all of which had high positive loadings, while ECG-related features contributed minimally and negatively. This suggests that PEDA predominantly captures variability in electrodermal activity and reflects the main trends in EDA-related physiological processes.
In contrast, PECG (PC2) was mainly influenced by ECG-related features such as HR_mea, HR_std, and HR_max, all exhibiting high positive loadings. EDA features contributed less to this component, indicating that PECG primarily represents patterns in cardiac activity.
In terms of variance contribution, PEDA and PECG explained 45.27% and 32.80% of the total variance, respectively, reaching a cumulative variance contribution of 78.07%. This indicates that just the first two principal components effectively preserved over 70% of the original information, providing good dimensionality reduction while accurately representing the variation patterns of both EDA and ECG physiological channels. Therefore, the two principal components, PEDA and PECG, were used to represent electrodermal and electrocardiac physiological variations, respectively, in subsequent analyses.

5. Results and Discussion

Table 2 summarizes the mean and standard error (SE) values of the primary task performance, secondary task performance, subjective measure of workload, and physiological measure of workload. Following outlier removal via the boxplot method, the resulting sample size (N) for each dependent variable is presented in Table 2.
The Kolmogorov–Smirnov test revealed significant deviations from normality for all task performance and subjective measures, except for physiological indicators (p < 0.05). Furthermore, the assumption of data independence was violated due to the 2 × 2 within-subjects design in which each participant completed all conditions. To address these concerns, a Generalized Linear Mixed Model (GLMM) was employed to analyze each dependent variable, which accounts for within-subject correlations via random effects and does not assume normality or homoscedasticity. The GLMM was specified with a Gamma distribution and a log link function. Fixed effects included Delay Level, Control Method, and their interaction (Delay Level × Control Method), while Participant ID was treated as a random effect to account for individual variability.
To further examine differences between Control Method under each Delay Level, pairwise comparisons were conducted using estimated marginal means (EMMs). Bonferroni correction was applied to control for multiple comparisons, with the adjusted significance threshold set at α = 0.05.

5.1. Task Performance

5.1.1. Primary Task

The fixed effects results from the GLMM analysis for the primary task performance metrics are presented in Appendix BTable A2. As shown, Delay Level, Control Method, and their interaction significantly affected all three primary performance metrics: D2C, H2C, and TCT (p < 0.001). Among these, Control Method showed particularly strong effects on TCT (F = 84.4, p < 0.001) and D2C (F = 76.3, p < 0.001).
The results of the pairwise comparisons for the primary task performance metrics are shown in Figure 12. As illustrated, with increasing delay, all three primary performance metrics (D2C, H2C, and TCT) significantly increased under the DC method. At the 200 ms delay, D2C, H2C, and TCT significantly increased compared to no delay (p < 0.05), with a more pronounced increase at 600 ms (p < 0.001), indicating a more substantial negative impact of higher delays on task performance.
Although at a 600 ms delay, the ePTGC method also showed increases in D2C and H2C compared to the no-delay condition, the increase was relatively minor and better than the DC method at the same delay level. This suggests that the ePTGC method effectively maintains control accuracy and stability under high-delay conditions.
Notably, at the low delay level (200 ms), there was no significant difference between the DC and ePTGC methods in H2C, while a significant difference was observed in TCT. This can be attributed to the fact that operators can mitigate the delay’s effect on control accuracy and stability at low delay levels through their adaptability, often sacrificing speed to maintain higher control quality, which explains the significant difference in TCT.

5.1.2. Secondary Task

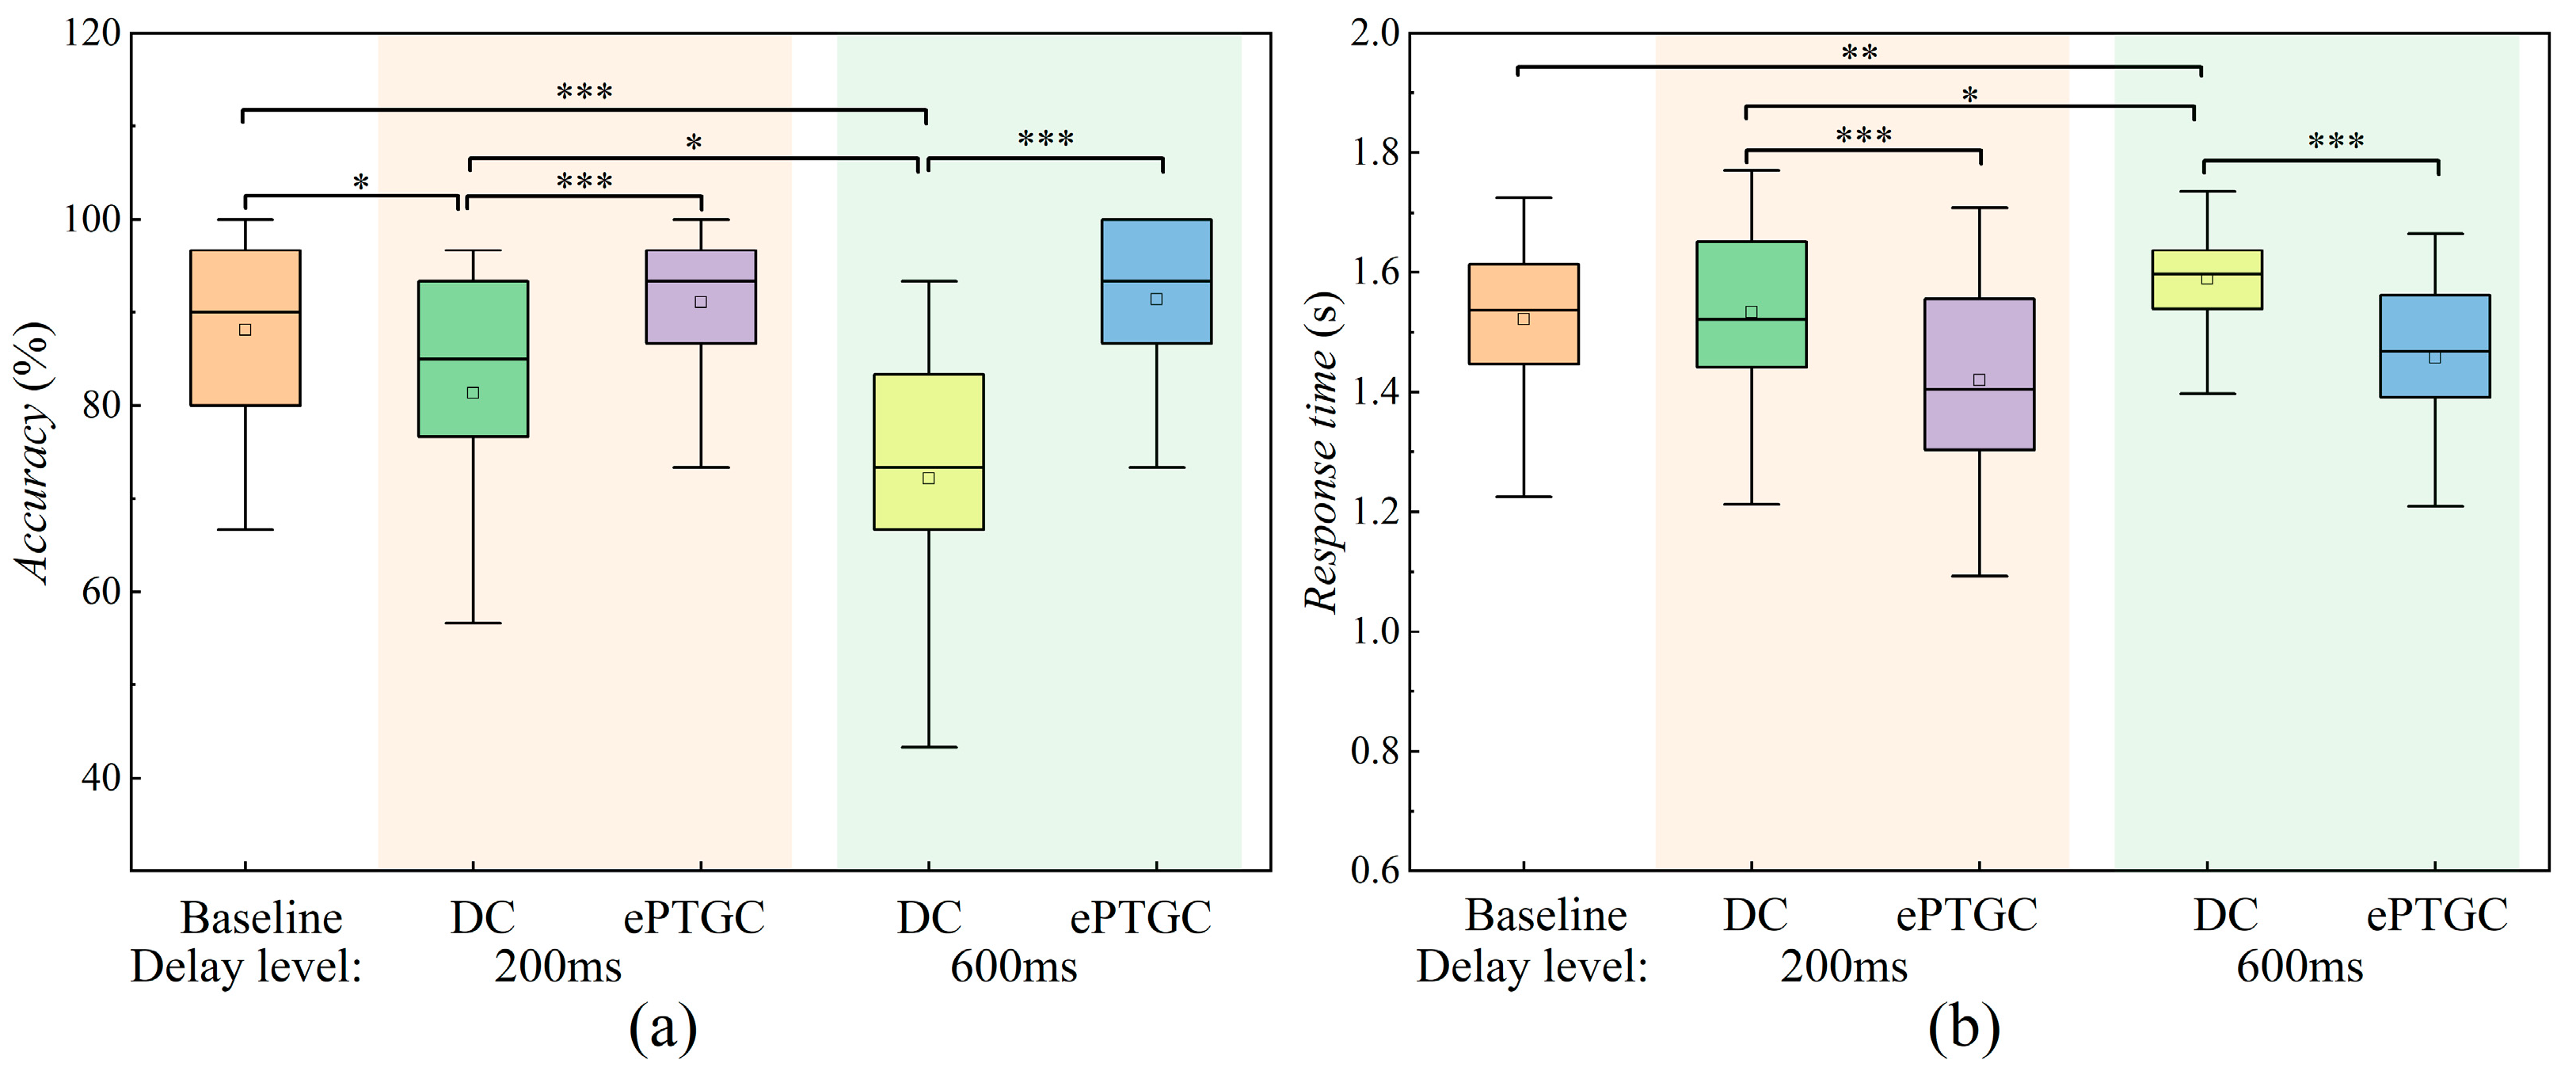
The fixed effects results from the GLMM analysis for the primary task performance metrics are presented in Appendix BTable A3. As shown, the Accuracy metric was significantly affected by both Delay Level (F = 15.3, p < 0.001) and Control Method (F = 59.0, p < 0.001), with a significant interaction between them (F = 6.1, p = 0.016), indicating that the effect of control method on Accuracy varied across delay levels. For Response Time, there was a significant effect of both Control Method and Delay Level (p < 0.01) but no significant interaction (F = 0.2, p = 0.657). Further pairwise comparison results are shown in Figure 13.
As shown in Figure 13, the Accuracy of the secondary task under the DC method decreased progressively with increasing delay. Compared to the baseline condition, Accuracy under the DC method was significantly lower at 200 ms (p < 0.05) and declined even further at 600 ms (p < 0.001). In contrast, the ePTGC method yielded higher Accuracy than the DC method under both delay levels (p < 0.05), with performance close to the baseline. This suggests that the ePTGC method effectively reduces operators’ objective workload under high-delay and variable road adhesion conditions, enabling performance closer to the ideal state.
For the Response Time metric (Figure 13b), the DC method resulted in significantly longer response times at both 200 ms and 600 ms delays compared to baseline (p < 0.05), mirroring the trend observed in Accuracy. The ePTGC method, however, consistently outperformed the DC method, showing significantly shorter response times under the same delays. Notably, at 200 ms, Response Time under the ePTGC method was even shorter than under baseline conditions (p < 0.05) and remained near baseline at 600 ms. These findings suggest that the ePTGC method effectively alleviates operator workload, with particularly pronounced benefits under low-delay conditions.
Although the ePTGC method did not yield significant improvements in primary task metrics (D2C, H2C) under low-delay conditions, it significantly reduced the objective workload in the secondary task. In conclusion, the ePTGC method effectively improved secondary task Accuracy and reduced Response Time under varying road adhesion and delay conditions, demonstrating strong workload mitigation capabilities.

5.2. Subjective Workload

The fixed effects results from the GLMM analysis for the subjective workload metrics are presented in Appendix BTable A4.
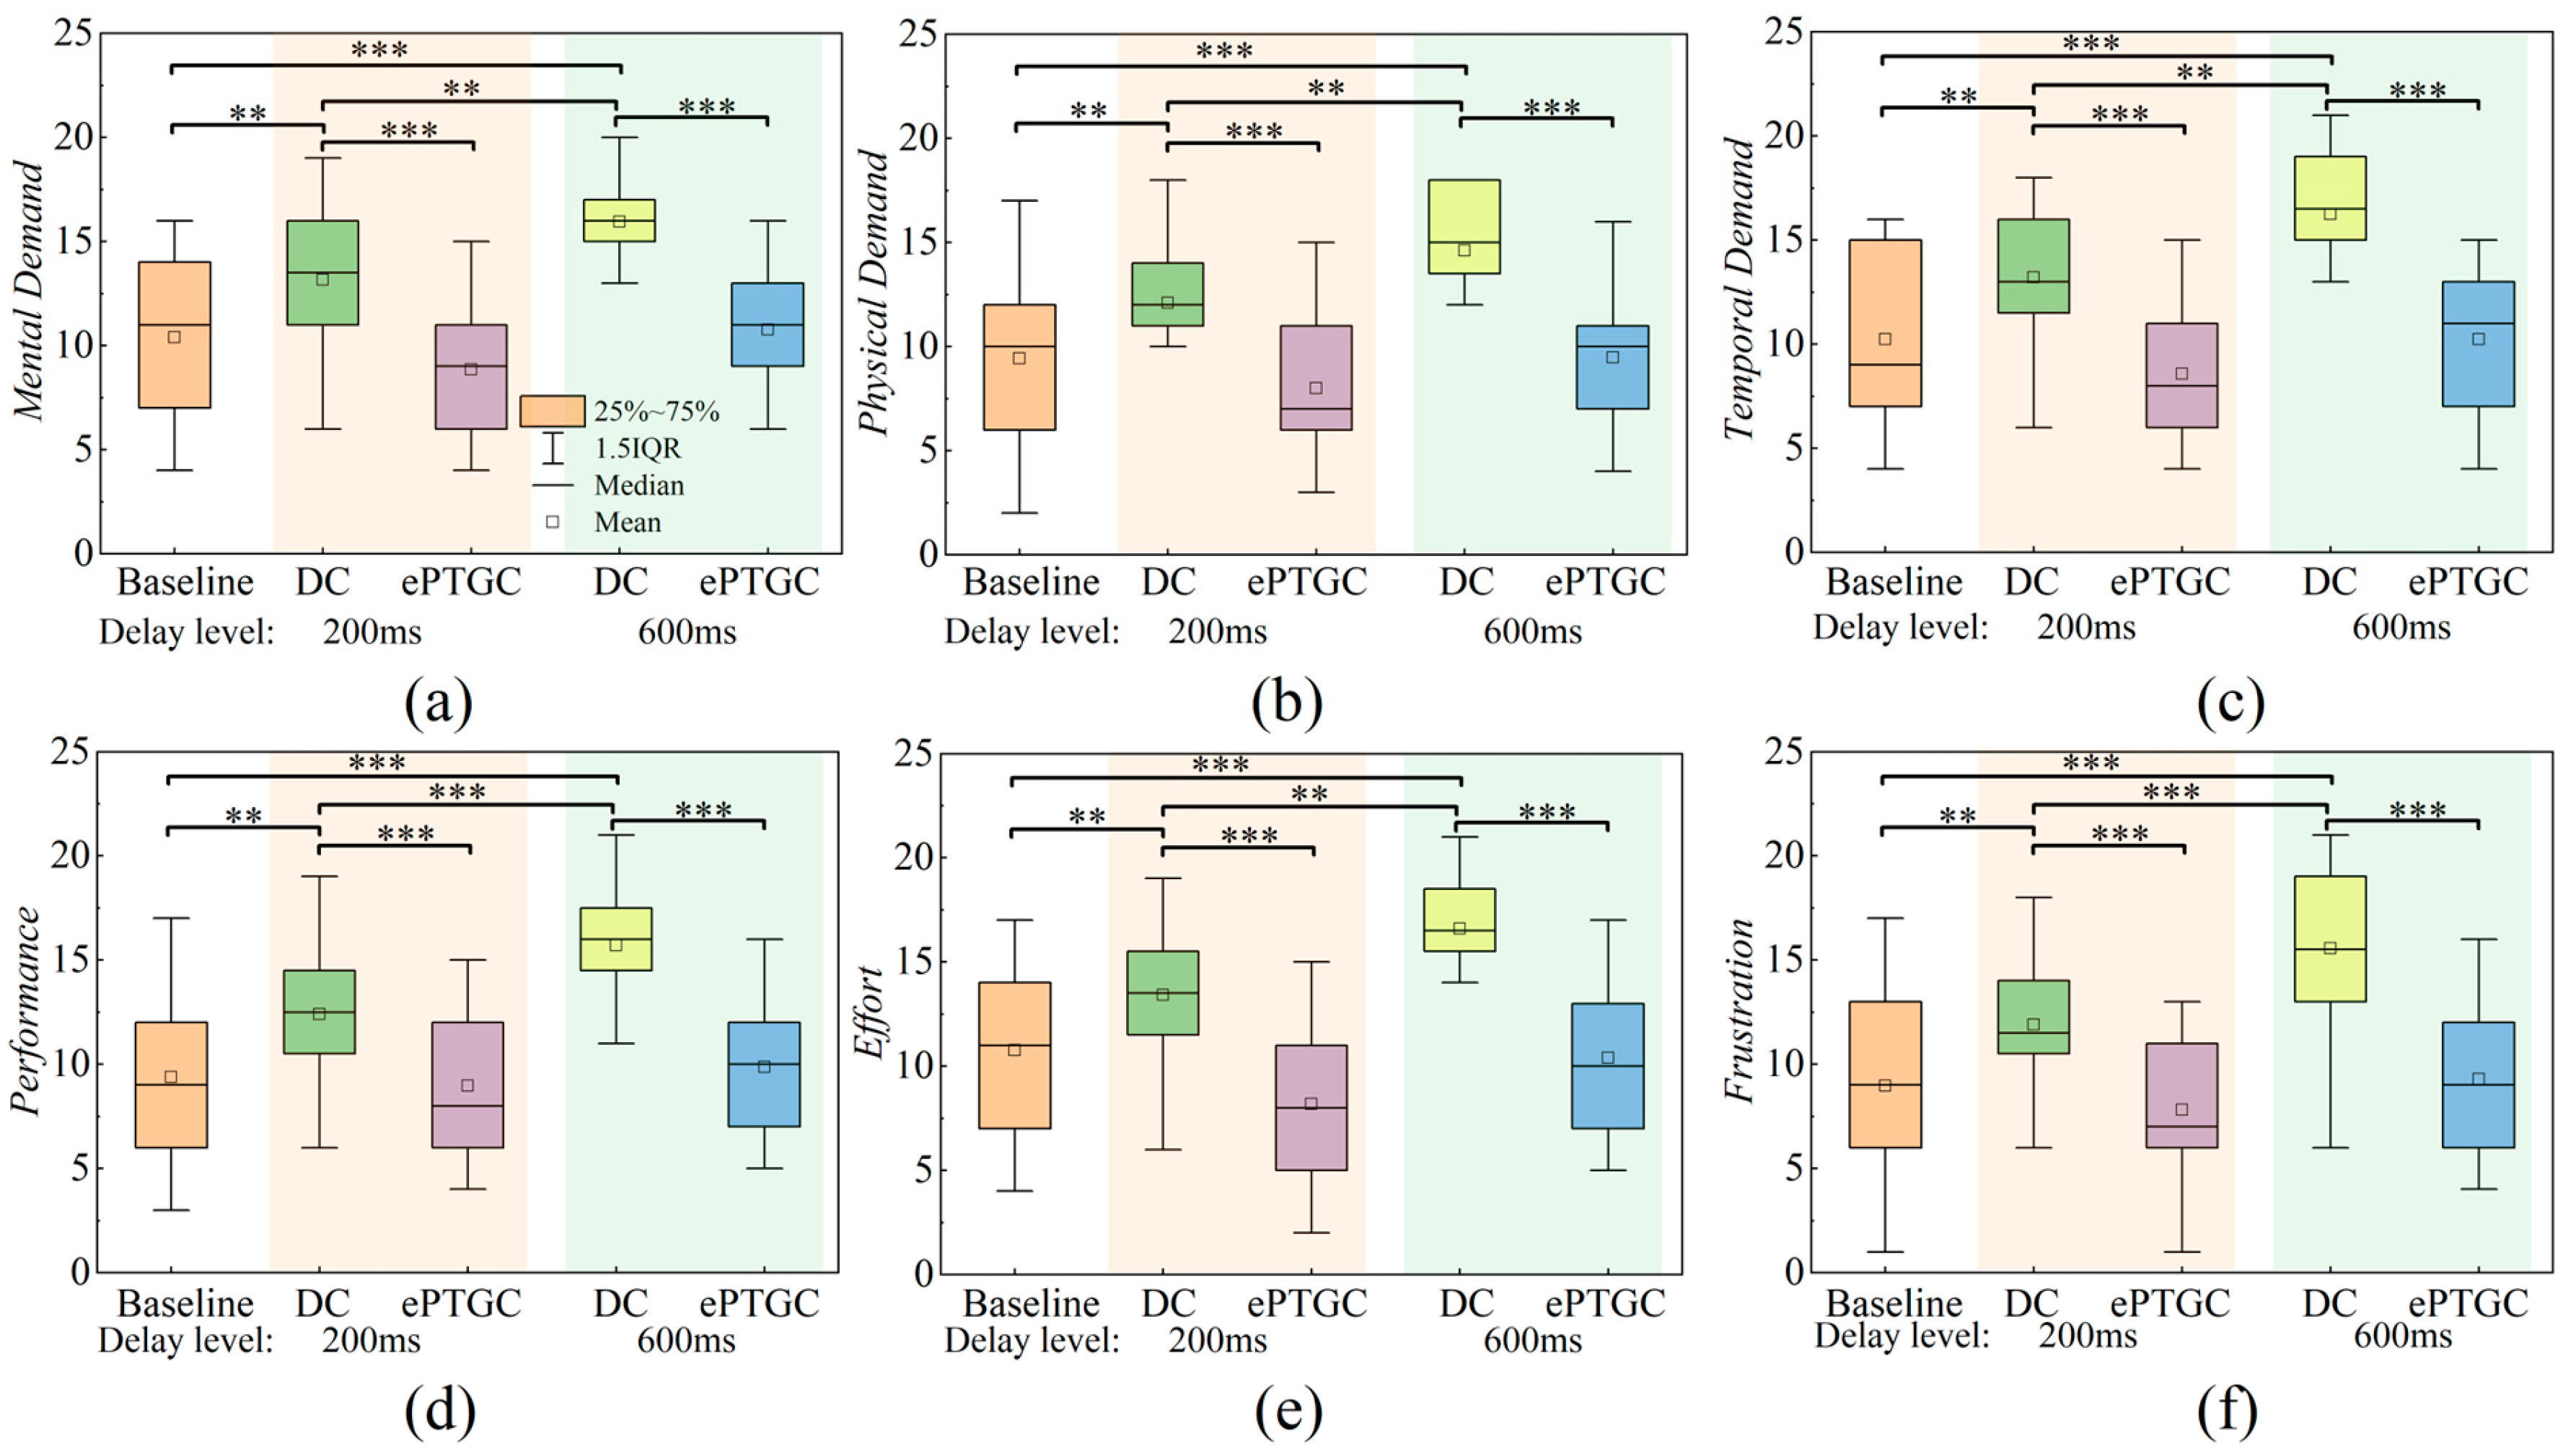
As shown in the fixed effect results, Delay Level had a significant effect (p < 0.001) on all NASA-TLX dimension scores as well as the overall Score, indicating that higher delay levels led to a significantly increased subjective workload. Similarly, Control Method also showed a significant main effect (p < 0.001) across all dimensions and the overall Score, suggesting that the ePTGC method effectively reduced workload compared to the DC method.
Notably, the interaction between Delay Level and Control Method was significant or marginally significant for Performance (p = 0.049) and Frustration (p = 0.067), implying that the influence of control strategies on these dimensions may differ depending on the delay condition. The results of the pairwise comparisons for the subjective workload metrics are shown in Figure 14.
Pairwise comparisons further confirmed that control methods significantly affected subjective workload under different delay levels. At both 200 ms and 600 ms delays, the DC method resulted in consistently higher scores than the ePTGC method, indicating that ePTGC effectively reduced perceived workload.

5.3. Physiological Measure

The fixed effects results from the GLMM analysis for the physiological measure metrics are presented in Appendix BTable A5.
The physiological workload metric PEDA was significantly influenced by both delay level (F = 50.59, p < 0.001) and control method (F = 76.07, p < 0.001), with a significant interaction between them (F = 9.76, p < 0.01). Similarly, the PECG metric was significantly affected by delay level (F = 15.90, p < 0.001) and control method (F = 121.20, p < 0.001), also showing a significant interaction effect (F = 4.08, p < 0.05). Detailed pairwise comparison results are presented in Figure 15.
As shown in Figure 15, physiological workload levels (PEDA and PECG) under the DC method increased progressively with rising delay. Compared to the baseline, both PEDA and PECG significantly increased at 200 ms delay (p < 0.05), with even more pronounced increases at 600 ms. This trend was especially evident in the PEDA metrics, where delay-induced differences in EDA-related measures were highly significant (p < 0.001).
In contrast, under the same delay and road conditions, the ePTGC method resulted in significantly lower physiological workload levels than the DC method (p < 0.05) and remained close to or even better than the baseline.

5.4. Overall Workload Analysis

To quantitatively assess the improvement of the ePTGC method over the DC method across different workload dimensions, secondary task performance and physiological measure metrics were first normalized and then separately integrated into two distinct composite metrics. The Score metric directly represented subjective workload, reflecting the operator’s perceived workload.
The Accuracy metric was reverse-normalized using (1), while the Response Time, PEDA and PECG metrics were normalized using (2) and (3), respectively. Then, the two secondary task performance metrics were combined using (4) to yield the overall objective workload metric Pobj, and the two physiological workload metrics were combined using (5) to yield the overall physiological workload metric Pphy.
P a c c u = r 0 a r a c c u r 0 a + 1 ,
P r e s = r t r 0 t r 0 t + 1 ,
P E D A / E C G n = r E D A / E C G r 0 E D A / E C G r 0 E D A / E C G + 1 ,
P o b j = ( P a c c u + P r e s ) / 2 ,
P p h y = ( P E D A n + P E C G n ) / 2 ,
where r a c c u and r t are the Accuracy and Response Time metrics before normalization, respectively; P E D A / E C G n and r E D A / E C G represent the PEDA and PECG metrics before and after normalization, respectively; r 0 a , r 0 t and r 0 E D A / E C G are the mean values of the Accuracy, Response Time, PEDA and PECG metrics for the baseline, respectively.
After processing, three workload metrics were obtained: Score (representing subjective workload), Pobj (representing objective workload), and Pphy (representing physiological workload). Then, the improvement of the ePTGC method over the DC method in each dimension was calculated using the following equation.
P S / o b j / p h y c , D C = P S / o b j / p h y c P S / o b j / p h y D C P S / o b j / p h y D C P S / o b j / p h y z e r o × 100 % ,
where P S / obj / phy c , P S / obj / phy D C and P S / obj / phy z e r o are the Score/Pobj/Pphy metrics using the ePTGC, DC method, and the baseline condition, respectively.
The pairwise comparison results for the Score, Pobj, and Pphy metrics are shown in Figure 16, which also illustrates the improvement of the ePTGC method over the DC method.
Figure 16a,c show that under delay and variable adhesion conditions, the DC method resulted in significantly higher subjective and physiological workload levels compared to baseline, highlighting the impact of delay and transparency on teleoperation workload. In contrast, at low delay levels, the ePTGC method reduced subjective workload, objective workload, and physiological workload by 151.5%, 218.9%, and 157.9%, respectively, compared to DC, with reductions exceeding 100%, indicating a workload level better than baseline.
At high delay levels, ePTGC reduced subjective, objective, and physiological workload by 97.6%, 135.2%, and 101.5%, respectively, compared to DC, showing improvements close to baseline levels. These results suggest that ePTGC effectively reduced operator workload by replacing part of the manual steering with an eye-tracking guidance mechanism, especially achieving better-than-baseline performance at low delay levels and maintaining near-baseline workload levels at high delay levels.
Additionally, while ePTGC did not significantly improve primary task performance (D2C, H2C) at low delay levels, it significantly reduced operator workload. At high delay levels (600 ms), ePTGC not only improved primary task performance but also significantly lowered operator workload to near baseline levels.
It is worth noting that although the present study used fixed delays for experimental control, previous research [20] has shown no significant difference in operator performance between fixed and variable delay conditions. Nonetheless, future work should assess the robustness of the ePTGC framework under variable or unpredictable delays to further validate its applicability in real-world teleoperation scenarios.

6. Conclusions

This study evaluated the impact of communication delay and low transparency on operator workload in teleoperated ground vehicle tasks and demonstrated the effectiveness of the eye-movement-based predicted trajectory guidance control (ePTGC) framework. Experimental results showed that, compared with the traditional direct control method, the ePTGC framework significantly reduced operator workload across all dimensions. Under high-delay conditions (600 ms), subjective, objective, and physiological workloads were reduced by 97.6%, 135.2%, and 101.5%, respectively. Under low-delay conditions (200 ms), the reductions were even more substantial, reaching 151.5%, 218.9%, and 157.9%. These findings confirm that the ePTGC framework effectively mitigates the adverse effects of delay and low transparency, enhances control stability, and provides a promising solution for improving operator performance and reducing workload in real-world teleoperation scenarios.
While this study focused on evaluating the effectiveness of the ePTGC framework, we acknowledge that factors such as age may influence operator performance due to differences in reaction time and cognitive capacity. However, our previous findings [22] suggest that ePTGC can mitigate performance variability across different experience levels, and potentially, age groups. Future studies should include participants with a wider age range to further assess the robustness and generalizability of the framework.
In addition, future work will also focus on validating the ePTGC framework in real or semi-realistic teleoperation scenarios, to further examine its effectiveness and adaptability under real-world operational conditions. Moreover, the integration of a delay adaptation mechanism, such as real-time delay estimation and adaptive control adjustment, will be explored to enhance the framework’s robustness under dynamically changing network conditions.

Author Contributions

Conceptualization, Q.Z.; methodology, Q.Z.; software, Q.Z.; validation, Q.Z. and W.W.; formal analysis, Q.Z.; investigation, Q.Z. and W.W.; resources, F.Z. and A.Z.; data curation, F.Z. and A.Z.; writing—original draft preparation, Q.Z.; writing—review and editing, F.Z. and A.Z.; visualization, Q.Z. and W.W.; supervision, F.Z. and A.Z.; project administration, F.Z. and A.Z.; funding acquisition, F.Z. and A.Z. All authors have read and agreed to the published version of the manuscript.

Funding

This research received no external funding.

Institutional Review Board Statement

This study was approved by the Institutional Review Board at the Shijiazhuang University.

Informed Consent Statement

Informed consent was obtained from all subjects involved in the study.

Data Availability Statement

The raw data supporting the conclusions of this article will be made available by the authors on request.

Conflicts of Interest

The authors declare no conflicts of interest. The authors declare that they have no known competing financial interests or personal relationships that could have appeared to influence the work reported in this paper.

Appendix A. Calculation Example of Normalized Improvement Metrics

Normalized computational procedure for P phy :
Table A1. Data of one of the records of a participant.
Subject_idDelay LevelControl Method r E D A r E C G P E D A n P E C G n P p h y
1200DC0.4390.6151.3061.4551.381
The above table shows the data of one of the records of a participant, where   r E D A and r E C G are the PEDA and PECG metric data before normalization, respectively, the mean value of PEDA in the baseline condition is denoted as r 0 E D A = 0.336 , and the mean value of PECG in the baseline condition is denoted as r 0 E C G = 0.423 , which is then calculated according to Equation (3) in the text:
P E D A n = r E D A r 0 E D A r 0 E D A + 1 = 0.439 0.336 0.336 + 1 = 1.306
P E C G n = r E C G r 0 E C G r 0 E C G + 1 = 0.615 0.423 0.423 + 1 = 1.455
P phy is obtained by normalizing and merging according to Equation (5) in the text:
P phy = P E D A n + P E C G n 2 = 1.306 + 1.455 2 = 1.381
Based on the obtained metric P phy , a pairwise comparison was performed to analyze and calculate the improvement of the ePTGC method with respect to the DC method at each delay level. As shown in the figure below, the mean value of P phy for each condition is labeled.
Take 200 ms delay level as an example:
P phy c , D C = P phy c P phy D C P phy D C P phy z e r o × 100 % = 0.890 1.189 1.189 1 × 100 % = 157.9 %
Figure A1. The pairwise comparison results for Pphy metrics. (The symbol “*” indicates a statistically significant difference, where ** denotes p < 0.01, and *** denotes p < 0.001. These symbols apply to all figures in this paper.).
Machines 13 00735 g0a1

Appendix B. Results of GLMM Fixed Effects

Table A2. Results of GLMM fixed effect tests on primary task performance metrics.
MetricFixed FactorsDFFp
D2CDelay Level262.70.000
Control Method176.30.000
Delay Level × Control Method133.30.000
H2CDelay Levellevel257.80.000
Control Method124.30.000
Delay Level × Control Method135.20.000
TCTDelay Level229.90.000
Control Method184.40.000
Delay Level × Control Method116.70.000
Table A3. Results of GLMM fixed effect tests on secondary task performance metrics.
MetricFixed FactorsDFFp
AccuracyDelay Level215.30.000
Control Method159.00.000
Delay Level × Control Method16.10.016
Response TimeDelay Level25.30.007
Control Method142.90.000
Delay Level ×Control Method10.20.657
Table A4. Fixed effect results of the GLMM for each subjective workload dimension.
MetricFixed FactorsDFFp
Mental DemandDelay Level228.10.000
Control Method187.00.000
Delay Level × Control Method10.80.362
Physical
Demand
Delay Level220.60.000
Control Method175.70.000
Delay Level × Control Method10.990.323
Temporal DemandDelay Level225.90.000
Control Method174.00.000
Delay Level × Control Method11.30.252
PerformanceDelay Level220.10.000
Control Method157.50.000
Delay Level × Control Method14.00.049
EffortDelay Level223.30.000
Control Method182.90.000
Delay Level × Control Method10.70.410
FrustrationDelay Level226.70.000
Control Method175.30.000
Delay Level × Control Method13.50.067
ScoreDelay Level227.90.000
Control Method190.00.000
Delay Level × Control Method12.10.155
Table A5. Results of GLMM fixed effects for physiological measure metrics.
MetricFixed FactorsDFFp
PEDADelay Level250.590.000
Control Method176.070.000
Delay Level × Control Method19.760.002
PECGDelay Level215.900.000
Control Method1121.200.000
Delay Level × Control Method14.080.046

References

  1. Wang, Z.; Chen, Z.; Zhang, Y.; Yu, X.; Wang, X.; Liang, B. Adaptive finite-time control for bilateral teleoperation systems with jittering time delays. Int. J. Robust Nonlinear Control. 2019, 29, 1007–1030. [Google Scholar] [CrossRef]
  2. Chae, Y.; Gupta, S.; Ham, Y. Divergent effects of visual interfaces on teleoperation for challenging jobsite environments. Autom. Constr. 2024, 167, 105683. [Google Scholar] [CrossRef]
  3. Coloma, S.; Martinez, C.; Yalçın, B.C.; Olivares-Mendez, M.A. Enhancing Rover Teleoperation on the Moon with Proprioceptive Sensors and Machine Learning Techniques. IEEE Robot. Autom. Lett. 2022, 7, 11434–11441. [Google Scholar] [CrossRef]
  4. Leonardis, D.; Gabardi, M.; Marcheschi, S.; Barsotti, M.; Porcini, F.; Chiaradia, D.; Frisoli, A. Hand Teleoperation with Combined Kinaesthetic and Tactile Feedback: A Full Upper Limb Exoskeleton Interface Enhanced by Tactile Linear Actuators. Robotics 2024, 13, 119. [Google Scholar] [CrossRef]
  5. Hang, P.; Lv, C.; Xing, Y.; Huang, C.; Hu, Z. Human-Like Decision Making for Autonomous Driving: A Noncooperative Game Theoretic Approach. IEEE Trans. Intell. Transp. Syst. 2021, 22, 2076–2087. [Google Scholar] [CrossRef]
  6. Yao, Z.; Zhu, Q.; Zhang, Y.; Huang, H.; Luo, M. Minimizing Long-Term Energy Consumption in RIS-Assisted AAV-Enabled MEC Network. IEEE Internet Things J. 2025, 12, 20942–20958. [Google Scholar] [CrossRef]
  7. Zheng, Y.; Brudnak, M.J.; Jayakumar, P.; Stein, J.L.; Ersal, T. A Delay Compensation Framework for Predicting Heading in Teleoperated Ground Vehicles. IEEE/ASME Trans. Mechatron. 2019, 24, 2365–2376. [Google Scholar] [CrossRef]
  8. Yeon, C.; Gupta, S.; Ham, Y. Design and Evaluation of Human-Centered Visualization Interfaces in Construction Teleoperation. In Proceedings of the Construction Research Congress, Des Moines, IA, USA, 20–23 March 2024; Volume 4, pp. 109–118. [Google Scholar]
  9. Zhao, L.; Nybacka, M.; Aramrattana, M.; Rothhämel, M.; Habibovic, A.; Drugge, L.; Jiang, F. Remote Driving of Road Vehicles: A Survey of Driving Feedback, Latency, Support Control, and Real Applications. IEEE Trans. Intell. Veh. 2024, 9, 6086–6107. [Google Scholar] [CrossRef]
  10. Kamtam, S.B.; Lu, Q.; Bouali, F.; Haas, O.C.L.; Birrell, S. Network Latency in Teleoperation of Connected and Autonomous Vehicles: A Review of Trends, Challenges, and Mitigation Strategies. Sensors 2024, 24, 3957. [Google Scholar] [CrossRef]
  11. Prakash, J.; Vignati, M.; Sabbioni, E. Performance of Successive Reference Pose Tracking vs Smith Predictor Approach for Direct Vehicle Teleoperation Under Variable Network Delays. IEEE Trans. Veh. Technol. 2024, 73, 4636–4645. [Google Scholar] [CrossRef]
  12. Zhang, H.; Song, A.; Li, H.; Chen, D.; Fan, L. Adaptive Finite-Time Control Scheme for Teleoperation with Time-Varying Delay and Uncertainties. IEEE Trans. Syst. Man Cybern. Syst. 2022, 52, 1552–1566. [Google Scholar] [CrossRef]
  13. Jernberg, C.; Sandin, J.; Ziemke, T.; Andersson, J. The effect of latency, speed and task on remote operation of vehicles. Transp. Res. Interdiscip. Perspect. 2024, 26, 101152. [Google Scholar] [CrossRef]
  14. Matheson, A.; Donmez, B.; Rehmatullah, F.; Jasiobedzki, P.; Ng, H.-K.; Panwar, V.; Li, M. The effects of predictive displays on performance in driving tasks with multi-second latency: Aiding tele-operation of lunar rovers. In Proceedings of the Human Factors and Ergonomics Society Annual Meeting, San Diego, CA, USA, 30 September–4 October 2013; pp. 21–25. [Google Scholar] [CrossRef]
  15. Chen, J.Y.C.; Haas, E.C.; Barnes, M.J. Human performance issues and user interface design for teleoperated robots. IEEE Trans. Syst. Man Cybern. Part C Appl. Rev. 2007, 37, 1231–1245. [Google Scholar] [CrossRef]
  16. Neumeier, S.; Wintersberger, P.; Frison, A.-K.; Becher, A.; Facchi, C.; Riener, A. Teleoperation: The Holy Grail to solve problems of automated driving? Sure, but latency matters. In Proceedings of the 11th International ACM Conference on Automotive User Interfaces and Interactive Vehicular Applications, Utrecht, The Netherlands, 21–25 September 2019; pp. 186–197. [Google Scholar] [CrossRef]
  17. Brudnak, M.J. Predictive displays for high latency teleoperation. In Proceedings of the 2016 NDIA Ground Vehicle Systems Engineering and Technology Symposium, Novi, MI, USA, 2–4 August 2016. [Google Scholar]
  18. Woods, D.; Tittle, J.; Feil, M.; Roesler, A. Envisioning human–robot coordination in future operations. IEEE Trans. Syst. Man Cybern. Part C Appl. Rev. 2004, 34, 210–218. [Google Scholar] [CrossRef]
  19. Yanco, H.; Drury, J. “Where am i?” Acquiring situation awareness using a remote robot platform. In Proceedings of the 2004 IEEE International Conference on Systems, Man and Cybernetics (IEEE Cat. No.04CH37583), The Hague, The Netherlands, 10–13 October 2004; pp. 2835–2840. [Google Scholar] [CrossRef]
  20. Zheng, Y.; Brudnak, M.J.; Jayakumar, P.; Stein, J.L.; Ersal, T. Evaluation of a Predictor-Based Framework in High-Speed Teleoperated Military UGVs. IEEE Trans. Hum. Mach. Syst. 2020, 50, 561–572. [Google Scholar] [CrossRef]
  21. Zhang, Q.; Xu, Z.; Wang, Y.; Yang, L.; Song, X.; Huang, Z. Predicted Trajectory Guidance Control Framework of Teleoperated Ground Vehicles Compensating for Delays. IEEE Trans. Veh. Technol. 2023, 72, 11264–11274. [Google Scholar] [CrossRef]
  22. Zhang, Q.; Yang, L.; Huang, Z.; Song, X. A Delay Compensation Framework Based on Eye-Movement for Teleoperated Ground Vehicles. IEEE Trans. Veh. Technol. 2025, 74, 390–401. [Google Scholar] [CrossRef]
  23. Pangabean, R.K.; Junita, A.; Miraza, Z. The Impact of Stress and Workload on Human Performance in Robot Teleoperation Tasks. J. Adm. Bisnis. 2024, 13, 19–30. [Google Scholar] [CrossRef]
  24. Das Chakladar, D.; Roy, P.P. Cognitive workload estimation using physiological measures: A review. Cogn. Neurodyn. 2023, 18, 1445–1465. [Google Scholar] [CrossRef]
  25. Rubio, S.; Diaz, E.; Martin, J.; Puente, J.M. Evaluation of Subjective Mental Workload: A Comparison of SWAT, NASA-TLX, and Workload Profile Methods. Appl. Psychol. 2004, 53, 61–86. [Google Scholar] [CrossRef]
  26. Mehler, B.B.; Reimer, B.; Dusek, J.A. MIT AgeLab Delayed Digit Recall Task; The Massachusetts Institute of Technology: Cambridge, MA, USA, 2011. [Google Scholar]
  27. Hao, S.; Zhang, L.; Hou, R.; Lau, S.S.Y. Research on the physiological and psychological impacts of extraordinary nature on emotions and restorative effects for young adults. J. Environ. Psychol. 2024, 97, 102345. [Google Scholar] [CrossRef]
  28. Yi, B.; Cao, H.; Song, X.; Zhao, S.; Guo, W.; Li, M. How to identify the take-over criticality in conditionally automated driving? An examination using drivers’ physiological parameters and situational factors. Transp. Res. Part F Traffic Psychol. Behav. 2021, 85, 161–178. [Google Scholar] [CrossRef]
  29. Lantieri, C.; Acerra, E.M.; Pazzini, M.; Simone, A.; Di Flumeri, G.; Borghini, G.; Babiloni, F.; Aricò, P.; Lanzi, P.; Vignali, V. The Impact of Adaptive Cruise Control on the Drivers’ Workload and Attention. IEEE Access 2024, 12, 158824–158836. [Google Scholar] [CrossRef]
  30. Timman, S.; Landgraf, M.; Haskamp, C.; Lizy-Destrez, S.; Dehais, F. Effect of time-delay on lunar sampling tele-operations: Evidences from cardiac, ocular and behavioral measures. Appl. Ergon. 2023, 107, 103910. [Google Scholar] [CrossRef] [PubMed]
  31. Zhang, G.; Hedegaard, S.; Oliver, H.; Behrens, R.; Paulin, J. Saccade response testing during teleoperations with a head-mounted display. Cogn. Technol. Work 2024, 26, 127–138. [Google Scholar] [CrossRef]
  32. Nenna, F.; Zanardi, D.; Gamberini, L. Enhanced Interactivity in VR-based Telerobotics: An Eye-tracking Investigation of Human Performance and Workload. Int. J. Hum. Comput. Stud. 2023, 177, 103079. [Google Scholar] [CrossRef]
  33. Seo, M.; Gupta, S.; Ham, Y. Evaluation of Work Performance, Task Load, and Behavior Changes on Time-Delayed Teleoperation Tasks in Space Construction. In Proceedings of the Construction Research Congress, Des Moines, IO, USA, 20–23 March 2024; pp. 89–98. [Google Scholar]
  34. Dybvik, H.; Løland, M.; Gerstenberg, A.; Slåttsveen, K.B.; Steinert, M. A low-cost predictive display for teleoperation: Investigating effects on human performance and workload. Int. J. Hum. Comput. Stud. 2021, 145, 102536. [Google Scholar] [CrossRef]
  35. Guo, Y.; Freer, D.; Deligianni, F.; Yang, G.-Z. Eye-Tracking for Performance Evaluation and Workload Estimation in Space Telerobotic Training. IEEE Trans. Hum. Mach. Syst. 2022, 52, 1–11. [Google Scholar] [CrossRef]
  36. Seo, M.; Gupta, S.; Ham, Y. Exploratory study on time-delayed excavator teleoperation in virtual lunar construction simulation: Task performance and operator behavior. Autom. Constr. 2024, 168, 105871. [Google Scholar] [CrossRef]
  37. Lim, T.; Hwang, M.; Byeon, J.; An, J.; Park, S.; Cha, H.; Yoon, S.; Kim, E. Communication Delay Thresholds for Effective Teleoperation in a Mobility System. Int. J. Hum. Comput. Interact. 2025, 1–17. [Google Scholar] [CrossRef]
  38. Lu, S.; Zhang, M.Y.; Ersal, T.; Yang, X.J. Workload Management in Teleoperation of Unmanned Ground Vehicles: Effects of a Delay Compensation Aid on Human Operators’ Workload and Teleoperation Performance. Int. J. Hum. Comput. Interact. 2019, 35, 1820–1830. [Google Scholar] [CrossRef]
  39. Yang, E.; Dorneich, M.C. The Emotional, Cognitive, Physiological, and Performance Effects of Variable Time Delay in Robotic Teleoperation. Int. J. Soc. Robot. 2017, 9, 491–508. [Google Scholar] [CrossRef]
  40. Musicant, O.; Botzer, A.; Shoval, S. Effects of simulated time delay on teleoperators’ performance in inter-urban conditions. Transp. Res. Part F Traffic Psychol. Behav. 2022, 92, 220–237. [Google Scholar] [CrossRef]
  41. Luo, R.; Weng, Y.; Jayakumar, P.; Brudnak, M.J.; Paul, V.; Desaraju, V.R.; Stein, J.L.; Ersal, T.; Yang, X.J. Real-Time Workload Estimation Using Eye Tracking: A Bayesian Inference Approach. Int. J. Hum. Comput. Interact. 2024, 40, 4042–4057. [Google Scholar] [CrossRef]
  42. Musicant, O.; Botzer, A.; Richmond-Hacham, B. Safety, Efficiency, and Mental Workload in Simulated Teledriving of a Vehicle as Functions of Camera Viewpoint. Sensors 2024, 24, 6134. [Google Scholar] [CrossRef] [PubMed]
  43. Smith, A.C.; Hashtrudi-Zaad, K. Smith predictor type control architectures for time delayed teleoperation. Int. J. Robot. Res. 2006, 25, 797–818. [Google Scholar] [CrossRef]
  44. Graf, G.; Xu, H.; Schitz, D.; Xu, X. Improving the prediction accuracy of predictive displays for teleoperated autonomous vehicles. In Proceedings of the 2020 6th International Conference on Control, Automation and Robotics (ICCAR), Singapore, 20–23 April 2020; pp. 440–445. [Google Scholar]
  45. Thomas, C.; Yi, S.; Meadows, S.; Sherrill, R. Adaptive Smith Predictor for Teleoperation of UAVs with Time-varying Internet Delay. Int. J. Control Autom. Syst. 2020, 18, 1465–1473. [Google Scholar] [CrossRef]
  46. Zheng, Y.; Brudnak, M.J.; Jayakumar, P.; Stein, J.L.; Ersal, T. A Predictor-Based Framework for Delay Compensation in Networked Closed-Loop Systems. IEEE/ASME Trans. Mechatron. 2018, 23, 2482–2493. [Google Scholar] [CrossRef]
  47. Testouri, M.; Elghazaly, G.; Hawlader, F.; Frank, R.; Mar, E.T. 5G-Enabled Teleoperated Driving: An Experimental Evaluation. ArXiv 2025, arXiv:2503.14186. [Google Scholar]
  48. Li, C.; Tang, Y.; Zheng, Y.; Jayakumar, P.; Ersal, T. Modeling Human Steering Behavior in Teleoperation of Unmanned Ground Vehicles with Varying Speed. Hum. Factors 2022, 64, 589–600. [Google Scholar] [CrossRef]
  49. Yi, B.; Cao, H.; Song, X.; Wang, J.; Zhao, S.; Guo, W.; Cao, D. How Can the Trust-Change Direction be Measured and Identified During Takeover Transitions in Conditionally Automated Driving? Using Physiological Responses and Takeover-Related Factors. Hum. Factors 2024, 66, 1276–1301. [Google Scholar] [CrossRef]
  50. Lascurain-Aguirrebeña, I.; Newham, D.J.; Galindez-Ibarbengoetxea, X.; Casado-Zumeta, X.; Lertxundi, A.; Critchley, D.J. Association between sympathoexcitatory changes and symptomatic improvement following cervical mobilisations in participants with neck pain. A double blind placebo controlled trial. Musculoskelet. Sci. Pract. 2019, 42, 90–97. [Google Scholar] [CrossRef]
  51. Yi, B.; Cao, H.; Song, X.; Wang, J.; Guo, W.; Huang, Z. How human-automation interaction experiences, trust propensity and dynamic trust affect drivers’ physiological responses in conditionally automated driving: Moderated moderated-mediation analyses. Transp. Res. Part F Traffic Psychol. Behav. 2023, 94, 133–150. [Google Scholar] [CrossRef]
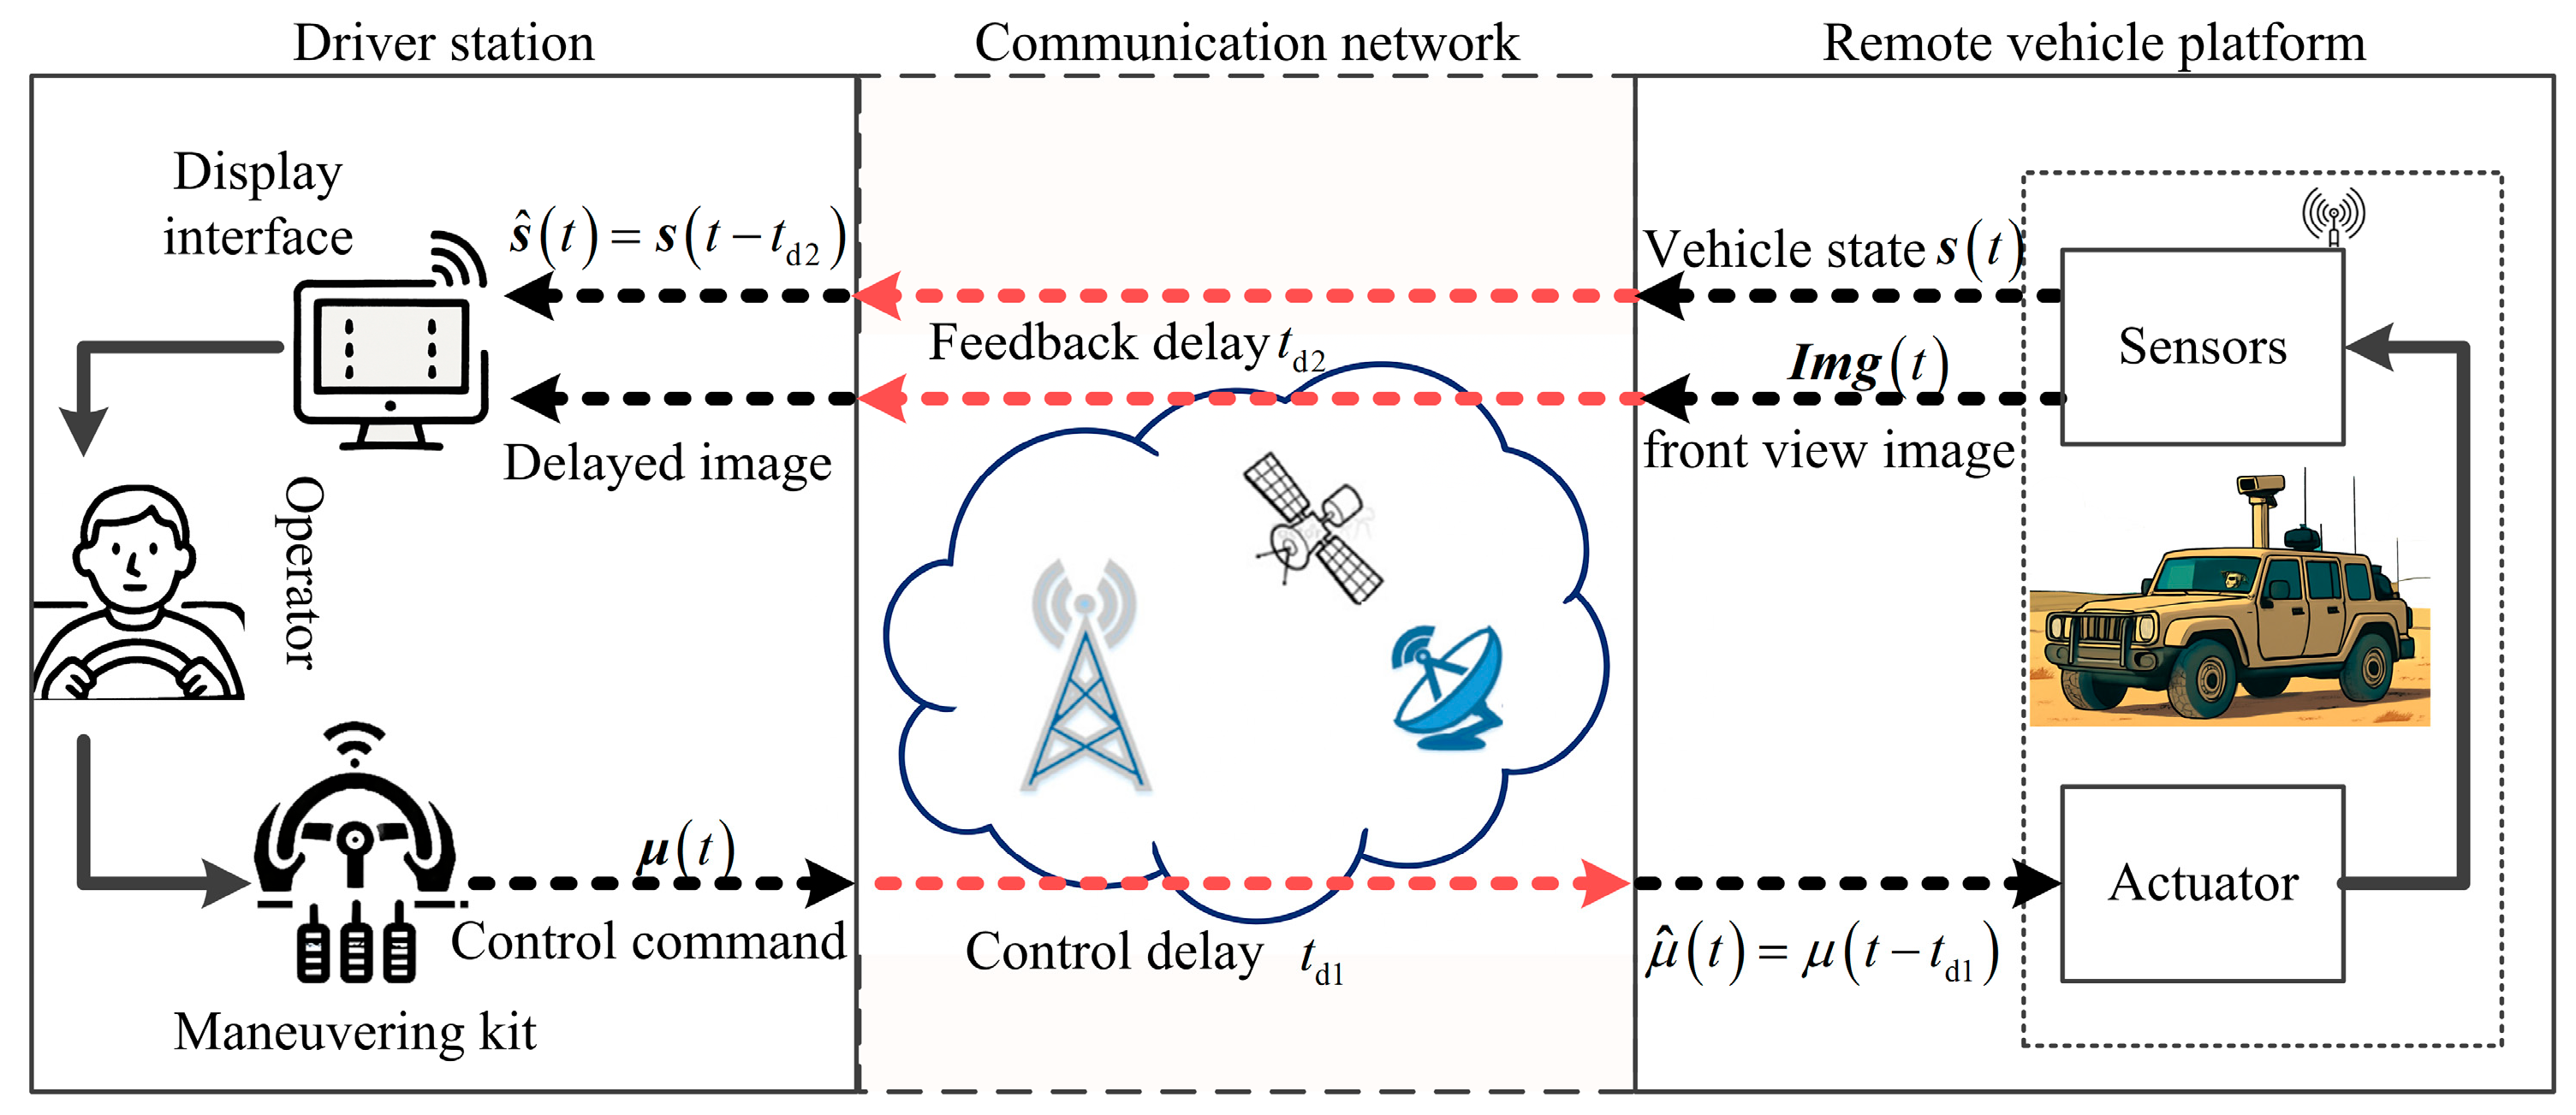
Figure 1. Schematic diagram of the structure of a TGVs.
Machines 13 00735 g001
Figure 2. Eye-movement-based predicted trajectory guidance control framework.
Machines 13 00735 g002
Figure 3. Human-in-the-loop teleoperation simulation platform.
Machines 13 00735 g003
Figure 4. Data acquisition process in teleoperation tasks.
Machines 13 00735 g004
Figure 5. Test road.
Machines 13 00735 g005
Figure 6. Electrode positions.
Machines 13 00735 g006
Figure 7. Experimental procedure.
Machines 13 00735 g007
Figure 8. The trend of MSE with λ.
Machines 13 00735 g008
Figure 9. Ranking of importance of features and their cumulative contribution.
Machines 13 00735 g009
Figure 10. PCA scree plot and principal component selection.
Machines 13 00735 g010
Figure 11. Loading plot.
Machines 13 00735 g011
Figure 12. Results of pairwise comparisons for primary task metrics. (a) results of D2C metric; (b) results of H2C metric; (c) results of TCT metric. (The symbol “*” indicates a statistically significant difference, where * denotes p < 0.05, ** denotes p < 0.01, and *** denotes p < 0.001. These symbols apply to all figures in this paper.).
Machines 13 00735 g012
Figure 13. Results of pairwise comparisons for secondary task metrics. (a) results of Accuracy metric; (b) results of Response Time C metric. (The symbol “*” indicates a statistically significant difference, where * denotes p < 0.05, ** denotes p < 0.01, and *** denotes p < 0.001. These symbols apply to all figures in this paper.).
Machines 13 00735 g013
Figure 14. Results of pairwise comparisons for the subjective workload metrics. (a) results of Mental Demand metric; (b) results of Physical Demand metric; (c) results of Temporal Demand metric; (d) results of Performance metric; (e) results of Effort metric; (f) results of Frustration metric. (The symbol “*” indicates a statistically significant difference, where ** denotes p < 0.01, and *** denotes p < 0.001. These symbols apply to all figures in this paper.).
Machines 13 00735 g014
Figure 15. Results of pairwise comparisons for physiological workload metrics. (a) results of PEDA metric; (b) results of PECG metric. (The symbol “*” indicates a statistically significant difference, where * denotes p < 0.05, ** denotes p < 0.01, and *** denotes p < 0.001. These symbols apply to all figures in this paper.).
Machines 13 00735 g015
Figure 16. The pairwise comparison results for the Score, Pobj, and Pphy metrics. (a) results of Score metric; (b) results of Pobj metric; (c) results of Pphy metric. (The symbol “*” indicates a statistically significant difference, where * denotes p < 0.05, ** denotes p < 0.01, and *** denotes p < 0.001. These symbols apply to all figures in this paper.).
Machines 13 00735 g016
Table 1. Detailed physiological profile.
FeaturesUnitClarification
HR_meabpmThe average heart rate measured during a single task is usually expressed as beats per minute (bpm). It reflects the overall level of cardiac activity and is regulated by the autonomic nervous system
HR_maxbpmHighest heart rate value measured during a task period
HR_medbpmMedian value of heart rate measured during a mission
△SCLµS (microsiemens)The range of skin conductance level (SCL) variation during a task session
SCL_meaµSAverage of SCL during a task session
SCL_ER_sumµSThe cumulative amplitude of skin conductance level (SCL) responses corresponding to event-related skin conductance responses (ER-SCRs) during a task session
ER-SCR_count The total count of ER-SCRs during a task session
ER-SCR_maxµSThe peak ER-SCR amplitude observed during the task session.
Table 2. Mean and SE of task performance, subjective workload, and physiological measure.
TasksMetricsNBaselineDelay 200 msDelay 600 ms
DCePTGCDCePTGC
Primary taskD2C (m2)2051033 ± 3421322 ± 5211109 ± 3122305 ± 7321259 ± 297
H2C (rad × m)20565.8 ± 15.877.8 ± 22.280.8 ± 16.2116.5 ± 28.883.7 ± 11.5
TCT (s)20559.6 ± 6.364.1 ± 7.758.7 ± 4.074.0 ± 9.560.0 ± 4.3
Secondary taskAccuracy (%)20588.10 ± 9.681.35 ± 16.391.06 ± 8.872.14 ± 15.291.38 ± 9.4
Response Time (s)2051.52 ± 0.121.53 ± 0.141.42 ± 0.171.59 ± 0.101.46 ± 0.13
Subjective workloadMental Demand20610.3 ± 3.813.2 ± 3.48.9 ± 3.216.0 ± 2.910.8 ± 3.1
Physical Demand2069.4 ± 3.812.1 ± 3.38.0 ± 3.414.6 ± 3.89.5 ± 3.1
Temporal Demand20610.2 ± 4.113.2 ± 3.48.6 ± 3.616.3 ± 3.310.2 ± 3.5
Performance2069.4 ± 4.412.4 ± 3.58.9 ± 3.515.7 ± 3.49.9 ± 3.3
Effort20610.8 ± 4.313.4 ± 3.58.2 ± 3.516.6 ± 3.110.3 ± 3.7
Frustration2068.9 ± 4.411.9 ± 3.37.8 ± 3.015.6 ± 3.89.3 ± 3.5
Score2069.8 ± 3.912.7 ± 3.18.4 ± 3.115.8 ± 3.010.0 ± 3.1
Physiological measurePEDA2100.34 ± 0.200.42 ± 0.200.31 ± 0.180.60 ± 0.170.36 ± 0.18
PECG2100.42 ± 0.150.47 ± 0.180.36 ± 0.190.54 ± 0.190.38 ± 0.20
Disclaimer/Publisher’s Note: The statements, opinions and data contained in all publications are solely those of the individual author(s) and contributor(s) and not of MDPI and/or the editor(s). MDPI and/or the editor(s) disclaim responsibility for any injury to people or property resulting from any ideas, methods, instructions or products referred to in the content.