Abstract
As engines trend toward miniaturization, lightweight design, and higher power density, noise issues have become increasingly prominent, necessitating precise radiated noise prediction for effective noise control. This study develops a machine learning model based on surface vibration test data, which enhances the efficiency of engine noise prediction and has the potential to serve as an alternative to traditional high-cost engine noise test methods. Experiments were conducted on a four-cylinder, four-stroke diesel engine, collecting surface vibration and radiated noise data under full-load conditions (1600–3000 r/min). Five prediction models were developed using support vector regression (SVR, including linear, polynomial, and radial basis function kernels), random forest regression, and multilayer perceptron, suitable for non-anechoic environments. The models were trained on time-domain and frequency-domain vibration data, with performance evaluated using the maximum absolute error, mean absolute error, and median absolute error. The results show that polynomial kernel SVR performs best in time domain modelling, with an average relative error of 0.10 and a prediction accuracy of up to 90%, which is 16% higher than that of MLP; the model does not require Fourier transform and principal component analysis, and the computational overhead is low, but it needs to collect data from multiple measurement points. The linear kernel SVR works best in frequency domain modelling, with an average relative error of 0.18 and a prediction accuracy of about 82%, which is suitable for single-point measurement scenarios with moderate accuracy requirements. Analysis of measurement points indicates optimal performance using data from the engine top between cylinders 3 and 4. This approach reduces reliance on costly anechoic facilities, providing practical value for noise control and design optimization.
1. Introduction
With the continuous increase in compression ratios and the widespread application of technologies such as turbocharging and exhaust gas recirculation, the current development trend of engines is toward miniaturization, lightweight design, and higher power density. These technological innovations not only enhance engine efficiency but also significantly improve fuel economy and emission performance, enabling modern engines to meet increasingly stringent environmental regulations while maintaining excellent power output [1]. However, these advancements have also intensified noise issues, directing more attention to engine noise, particularly as the rise in power density and compact structures leads to the superposition of various noise sources, including combustion noise, mechanical noise, and airflow noise, posing greater challenges for noise control [2]. Therefore, establishing accurate prediction models for engine radiated noise allows for the best anticipation of noise characteristics during the design phase, enabling the targeted optimization of structural parameters and noise reduction measures [3]. This not only helps reduce the overall noise level of the engine but also minimizes the cost and duration of later modifications, holding significant engineering significance and practical value for noise control, performance optimization, and enhancing product competitiveness.
Current research on noise prediction for fuel engines primarily relies on simulation and experimental testing. Siano et al. [4] optimized an engine simulation model by testing and decomposing in-cylinder pressure signals, ultimately reducing engine fuel consumption and noise. Moreau [5] accurately estimated the noise of complex asymmetric engine turbofans by combining simulation models with numerical methods. Férand et al. [6] accurately predicted engine combustion noise using a hybrid simulation approach that integrates far-field acoustic wave propagation with variable exhaust temperature fields. Liu et al. [7] obtained transfer functions related to instabilities in heat release rate, acoustics, entropy, and vortex fluctuations through computational fluid dynamics simulation, using these to calculate combustion noise. Hipparge et al. [8] analyzed the forces acting on the engine and applied these forces to the engine assembly FE model in commercial software to predict the surface vibration of the component surface and the engine noise. Dupré et al. [9] incorporated the time and frequency parameters of the resonant noise caused by sound transmission between the engine and the cabin of an internal combustion engine vehicle into a dynamic acoustic synthesis model of an electric vehicle based on the Shepard-Risset illusion and conducted a perceptual test. They showed that adding resonance to the synthesized sound can significantly improve the naturalness of the sound. Guo et al. [10] constructed the “acoustic-vibration” transfer function between the cabin sound and vibration monitoring points and the “acoustic/vibration-acoustic” transfer network inside and outside the cabin structure based on the OTPA technology; they predicted the far-field radiated noise of the cabin structure using the wave superposition method based on this network. While both experimental and simulation methods can accurately calculate combustion noise in fuel engines, the experimental process is typically time consuming and costly, limiting its engineering applications. Simulation methods can address the cost limitations of experiments, but the non-time-varying nature of noise propagation and the complex coupling effects in air acoustics make it challenging to define simulation boundary conditions, resulting in high computational costs and susceptibility to errors. These studies mainly rely on high-cost experimental tests or complex simulation boundary condition definitions, making it difficult to achieve real-time prediction or application in non-anechoic environments. In contrast, this study overcomes the limitations of traditional methods by combining vibration data in both time and frequency domains using machine learning methods, providing a more efficient and economical noise prediction scheme.
In recent years, with advancements in hardware capabilities and the rapid development of artificial intelligence, machine learning algorithms have been increasingly applied in engineering fields. Ding et al. [11] utilized one-dimensional convolutional neural networks for fault diagnosis of aero-engine bearings. Mariani et al. [12] applied a very fast single-iteration extreme learning machine model to predict mean effective pressure, thereby forecasting cycle variation rates in spark-ignition engines. Zhan et al. [13] integrated variational mode decomposition and convolutional neural network algorithms to achieve engine fault diagnosis based on vibration test data. Zhang et al. [14] combined improved segment angle acceleration and convolutional neural networks to diagnose complete misfire faults in single-cylinder diesel engines across the full speed range. Wang et al. [15] used residual data between predicted and actual coolant temperatures based on an engine cooling system model, applying support vector machine algorithms to achieve high-accuracy fault diagnosis of engine cooling systems. Li et al. [16] improved the K-nearest neighbor algorithm for diesel engine fault diagnosis to achieve the highest diagnostic accuracy, even with small-sample datasets. Wen et al. [17] applied a gradient boosting algorithm to predict motor noise with different sound insulation materials and compared it with common machine learning algorithms, finding it to have the highest noise prediction accuracy. Liu et al. [18] proposed a combination of support vector machines and genetic algorithms to build a subjective mapping model of psychoacoustic objective metrics for predicting the radiated noise of diesel engines by testing the radiated noise of diesel engines.
In summary, machine learning algorithms have been widely and effectively applied in engine-related fields, enabling the creation of stable, fast, and highly accurate predictive models for certain engine performance parameters [19,20]. However, noise prediction studies based on machine learning methods have primarily focused on the noise analysis of electric motors, with relatively few studies addressing noise radiation prediction based on vibration response data from conventional fuel engines [21,22]. Unlike existing studies that rely on high-cost experimental testing or complex simulation boundary conditions, this study pioneers the use of fuel engine surface vibration data to develop radiated noise prediction models using support vector regression (SVR), random forest regression (RFR), and multilayer perceptron (MLP) algorithms, enabling accurate predictions in non-anechoic environments and significantly reducing reliance on costly anechoic facilities. Meanwhile, existing studies on fuel engine noise prediction mainly focus on single-mode acoustic or vibration data analysis, ignoring the synergistic effect of time- and frequency-domain features. In contrast, the multimodal approach in this study captures the complex coupling characteristics of combustion, mechanical and airflow noises by fusing the time–frequency domain information, thus achieving a more comprehensive noise prediction. This study has two main contributions. (1) This study leverages surface vibration data from a fuel engine to develop radiated noise prediction models using SVR, RFR, and MLP algorithms, enabling accurate predictions in non-anechoic environments and significantly reducing reliance on costly anechoic facilities. (2) This study compares time-domain and frequency-domain vibration features for engine radiated noise prediction, highlighting their respective advantages and application scenarios. The findings provide a practical reference for improving prediction accuracy and optimizing measurement point selection.
The remainder of this study is structured as follows. Section 2 introduces the principles and applicability of the SVR, RFR, and MLP algorithms. Section 3 describes the experimental design, vibration and noise testing process, and data feature extraction methods. Section 4 details the model construction, dataset division, and hyperparameter optimization methods. Section 5 presents the models’ prediction results and analyzes the impact of measurement points on performance. Section 6 summarizes the findings and proposes directions for future research. An overview of the methodology employed in this study is illustrated in Figure 1.
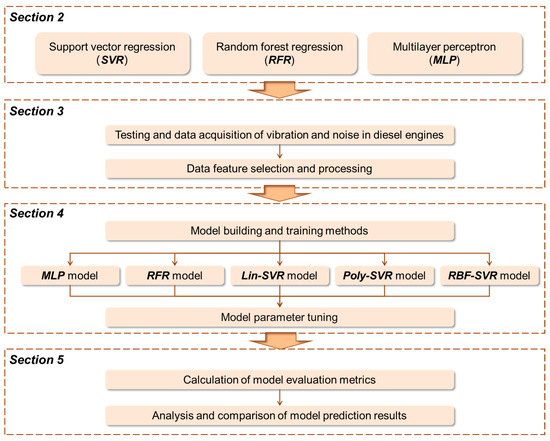
Figure 1.
Overall research framework.
2. Analysis and Comparison Methods
2.1. Support Vector Regression
SVR is a machine learning algorithm grounded in statistical learning theory and the principle of structural risk minimization. It is widely used for regression analysis and pattern recognition, excelling in handling small-sample, nonlinear, and high-dimensional problems with strong generalization capabilities [23,24]. The mechanism of SVR involves finding an optimal hyperplane in a high-dimensional feature space that contains most data points while maximizing the margin width [25]. Specifically, SVR aims to identify a function , as shown in Equation (1) [26]:
where is the weight vector, is the bias, and denotes the inner product of the weight vector and input . SVR optimizes the margin by minimizing the norm . For linearly inseparable data, input vectors can be mapped to a higher-dimensional feature space to achieve linear separation [27]. However, such nonlinear mapping increases data dimensionality and computational complexity. To address this, kernel functions are employed to reduce the computational load while obtaining the algorithm’s output in the nonlinear feature space [26], mapping input data to a high-dimensional space to handle complex nonlinear relationships, as shown in Equation (2) [26]:
where and are dual variables (support vector weights), with representing the positive deviation and the negative deviation for sample ; is the kernel function, with expressions and parameter ranges listed in Table 1. This study employs three kernel functions—linear kernel, polynomial kernel, and radial basis function kernel—for modeling and analysis [28].

Table 1.
The kernel function of SVR.
2.2. Random Forest Regression
RFR is an ensemble learning algorithm that performs regression tasks by constructing multiple decision trees and aggregating their predictions. It is renowned for its high prediction accuracy, robustness to outliers, and resistance to overfitting, meaning that it is widely applied in nonlinear modeling [29]. The RFR model consists of multiple decision tree models, as shown in Figure 2.
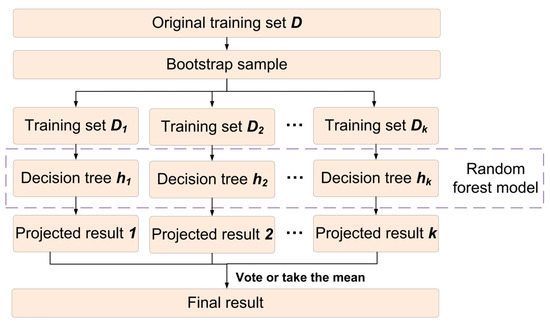
Figure 2.
Schematic diagram of random forest model.
In RFR prediction, consider a dataset D = {(, ),…, (, )} with K samples, where the feature set has p dimensions, = {, ,… }, and the target set has q dimensions, = {, , … }, with . When a decision tree selects the j-th feature vector and its value s as the splitting variable and point, the training set is divided into two subsets, as shown in Equations (3) and (4) [29]:
where is the set of samples with feature values less than or equal to s, and is the set with values greater than s, with . In practice, the optimal splitting variable and point are determined by traversing feature variables j [29]:
where is the target value corresponding to input , and
and are the average target values of samples in and . The term represents the sum of squared errors across all dimensions for samples in and . The minimization over j and s identifies the optimal splitting variable and point. The dataset is then split accordingly [30]. The optimal output value for each subset is calculated as shown in Equation (8) [29]:
where is the optimal output value for each subset, and is the number of samples in subset p. This splitting process is repeated, dividing the dataset into two subsets each time until a termination condition is met [31]. Ultimately, the dataset is divided into M subsets, forming a decision tree. The RFR models’ prediction is obtained by summing the results of all decision trees, as shown in Equation (9), where is an indicator function denoting that the data belong to the i-th subset [29]:
2.3. Multilayer Perceptron
The MLP is a fully connected artificial neural network comprising an input layer, multiple hidden layers, and an output layer. Each layer’s perceptron takes the previous layer’s output as input, with hidden layers performing nonlinear transformations and the output layer producing the final result [32]. Hidden layers typically use nonlinear activation functions such as Sigmoid, Tanh, or ReLU, as linear functions would result in linear combinations regardless of the number of hidden layers, making them unsuitable. In this study, the MLP algorithm employs the ReLU function as the activation function and includes two hidden layers, as shown in Figure 3. The MLP computation is given by Equations (10)–(12) [33]:
where is the input vector, is the neural network’s output, are the weights and bias of the input layer, and are the weights and bias of the output layer. represents the hidden layer’s output. For multiple hidden layers, the output of one hidden layer serves as the input to the next, continuing until the output layer is reached. The number of neurons in the hidden layers is determined through the cross-validation of parameters [33].
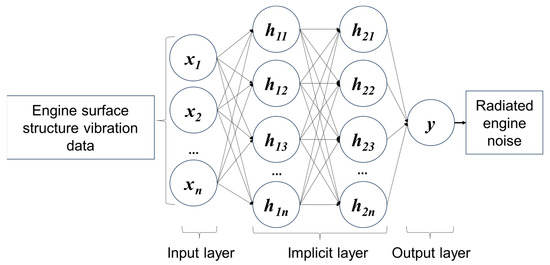
Figure 3.
Schematic diagram of the MLP algorithm architecture.
3. Experiment and Data Collection
3.1. Engine Vibration and Noise Test
This study focuses on a four-cylinder, four-stroke diesel engine as the research subject. The engine test conditions range from full load at 1600 r/min to full load at 3000 r/min. Starting from 1600 r/min, the engine speed is increased by 200 r/min increments, and vibration and noise data are measured for 10 s under stable operating conditions at each speed. The specific engine parameters and test conditions are shown in Table 2.

Table 2.
Engine operating parameters.
The vibration and noise tests are conducted in a semi-anechoic chamber [34], with a Siemens 32-channel data acquisition system used for collecting vibration and noise signals. The engine’s intake and exhaust systems are routed outside the chamber. A schematic diagram of the test setup is shown in Figure 4. The sensor specifications used in the test are shown in Table 3.
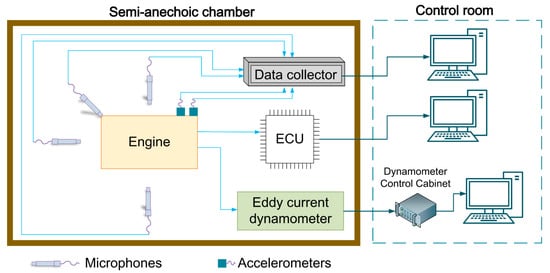
Figure 4.
Schematic diagram of engine vibration and noise test.

Table 3.
Specification of the sensors to be used.
The engine noise test follows the nine-point method specified in standard GB/T1859.3-2015 [35]. Due to spatial constraints imposed by the dynamometer, a microphone could not be placed at the rear of the engine, resulting in a total of eight microphones positioned as follows: right side (P1), front (P2), left side (P3), top center (P4), and the four corners of the top (P5–P8). The specific arrangement of the microphones is shown in Figure 5.
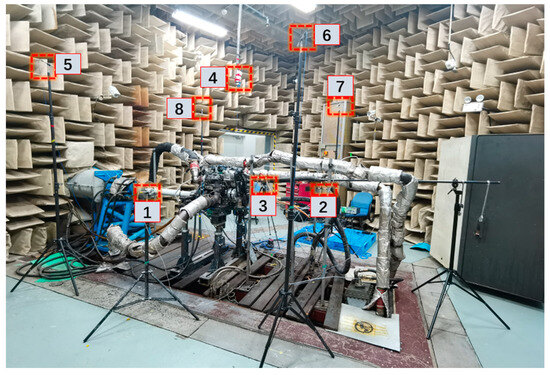
Figure 5.
Arrangement of acoustic sensor measurement points.
The radiated noise from the engine surface primarily originates from shock waves caused by combustion and various mechanical vibrations resulting from impacts and friction between engine components [36,37]. The placement of acceleration sensors for measuring engine vibration signals considers two main factors: the in-cylinder gas pressure, which is the primary excitation source for engine surface structure vibrations, requiring the collected vibration signals to reflect the cylinder’s vibration characteristics [38,39]; and the complex engine surface with numerous pipelines, necessitating sensor placement that avoids complex structures while ensuring safety and reliability [40]. Based on these considerations, a total of seven triaxial acceleration sensors are deployed at the following locations: high-pressure fuel rail system of cylinder 1 (P1), high-pressure fuel rail system of cylinder 3 (P2), high-pressure fuel rail system of cylinder 4 (P3), between cylinder 1 and cylinder 2 (P4), between cylinder 2 and cylinder 3 (P5), between cylinder 3 and cylinder 4 (P6), and the oil pump (P7). The specific arrangement of Positions 1–6 is shown in Figure 6, with the oil pump measurement point located outside the image and marked in Figure 6. The orientation of the measurement points is also indicated in the figure.
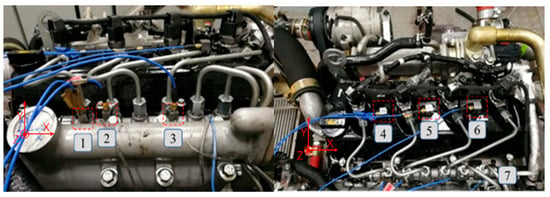
Figure 6.
Arrangement of acceleration sensor measurement points.
3.2. Feature Selection and Data Processing
When applying machine learning algorithms in engineering, the selection of feature parameters relies heavily on prior knowledge [41,42]. The noise radiated from the engine surface in the form of vibrations is referred to as radiated noise, indicating a direct relationship between the vibrations of engine components and the radiated noise [43].
This study selects two types of engine vibration data time-domain and frequency-domain data to form separate input datasets. To ensure the time-domain dataset has sufficient dimensionality for training models with adequate complexity, each direction of each acceleration sensor is treated as a feature dimension. The time-domain vibration data are processed by calculating the root mean square (RMS) value every 0.5 s, with each RMS value forming a sample. The dimensionality of these samples is 21 (7 sensors × 3 directions). A 0.5 s RMS window length was chosen based on the typical periodicity of pulsed vibration signals and the sampling rate of the data acquisition system. This 0.5 s window captures the short-term dynamics of the vibration signal while avoiding the noise intensity caused by an overly short window or the loss of detail caused by an overly long window. Furthermore, the RMS feature is clearly interpretable in the time domain, representing the energy intensity of the vibration signal and directly related to the physical properties of noise, making it suitable as an input feature for machine learning models. For frequency domain data, a single accelerometer’s vibration signal in a single direction over a period of 0.5 s was analyzed using a fast Fourier transform to generate a spectrum. A Hanning window was used to reduce spectral leakage. The frequency resolution was 1 Hz, covering the range of 0–20,480 Hz, with each spectral point serving as a feature dimension. Considering that the upper limit of human audibility is approximately 20 kHz, the frequency analysis range was set to 0–20,480 Hz. To ensure that the analysis met the Nyquist sampling theorem, the sampling frequency in this study was set to 51,200 Hz. Given the high dimensionality of frequency-domain datasets, which can easily lead to overfitting and computational inefficiency during model training, principal component analysis (PCA) is used for dimensionality reduction. PCA dimensionality reduction retains principal components (approximately 10–12 per frequency-domain dataset) with a cumulative explained variance exceeding 95%. These components capture the primary energy distribution of the signal and improve model efficiency. Although PCA can compromise physical interpretability, its effectiveness in modeling high-dimensional features has been widely demonstrated [44]. The RMS calculation formula is as follows [45]:
where RMS is the calculated root mean square value, k is the total number of points used in the calculation, and yi is the value of the i-th point.
The label value of each sample is the average sound pressure level (SPL) energy of the eight noise measurement points. SPL is measured using a microphone, and the sampling frequency is set to 51,200 Hz to be consistent with the vibration signal. The noise data is fast Fourier transformed (using a Hanning window, with a resolution of 100 Hz) every 0.5 s. After the spectrum is generated, the SPL value of each measurement point is calculated according to the sound pressure and sound pressure level conversion formula shown in Equation (14). The average SPL energy is calculated by taking the RMS of the SPL values of the eight measurement points, and the calculation formula is as follows [45]:
where is the sound pressure level at each test point (in dB), is the RMS sound pressure at each measurement point (in Pa), and is the reference sound pressure, defined as = 2 × 10⁻⁵ Pa, representing the hearing threshold of the human ear. is the calculated sound pressure level, m is the number of points used in the calculation, and is the value at the i-th point.
4. Development of Prediction Models
4.1. Training Methodology
Machine learning models are widely used in engineering vibration and noise prediction due to their powerful ability to handle complex nonlinear relationships and high-dimensional data. Compared to traditional simulation- and experiment-based methods, machine learning methods do not require detailed physical modeling and can directly learn the mapping relationship between vibration data and radiated noise. They are particularly suitable for processing high-dimensional, dynamic signals such as engine surface vibration. Therefore, this study used the three aforementioned machine learning algorithms to establish five models: linear kernel SVR (Lin-SVR), polynomial kernel SVR (Poly-SVR), radial basis function kernel SVR (RBF-SVR), RFR, and MLP. These models capture the nonlinear patterns between time- and frequency-domain vibration data and radiated noise, while balancing model complexity and computational efficiency. These models are trained using time-domain and frequency-domain vibration data of the engine surface structure. Both the time-domain dataset and the frequency-domain dataset consist of 168 samples. For the frequency-domain dataset, the frequency-domain data from each direction of the seven triaxial acceleration sensors are treated as separate datasets, resulting in a total of 21 frequency-domain datasets. Subsequently, 22 datasets (including the time-domain dataset) are independently trained to build machine learning models. The dataset is randomly split, with 80% allocated as the training set and the remaining 20% as the validation set. The training and validation sets are mutually exclusive, ensuring no samples in the training set appear in the validation set [46,47]. Thus, the training set contains 134 samples, and the validation set contains 34 samples.
The relatively small sample size may result in higher model variance, increasing the risk of overfitting and limiting the generalization ability of the model. To mitigate this problem, this study uses k-fold cross validation for hyperparameter optimization to maximize the use of limited sample data [48]. By further dividing the training set into k subsets, k-1 subsets are used to train models with different hyperparameter combinations and the one remaining subset is used for model evaluation. After k training and evaluation cycles, the average of the k evaluation results is taken to select the optimal hyperparameter combination as the parameters of the final model. In addition, in order to mitigate the impact of the random division of the training set on the prediction performance, this study performs multiple independent random divisions of the time and frequency domain datasets, generates multiple training and validation sets with different random conditions, repeats the training and validation process, and takes the average of the evaluation metrics of the validation set as the final evaluation result [49,50]. This approach effectively reduces the risk of overfitting and instability of model variance due to small sample size by increasing the diversity of data distribution. However, despite these measures, the small sample size may still limit the model’s ability to generalize to unseen data, so the robustness and generalization of the model can be further improved by increasing the sample size or introducing data enhancement techniques in future studies.
4.2. Parameter Tuning
Given the small sample size in this study and the goal of achieving better prediction performance, a grid search is employed for parameter optimization. This involves manually specifying a range of parameters and exhaustively evaluating all possible combinations to identify the optimal hyperparameters. The hyperparameter search spaces for the three learning algorithms are shown in Table 4.

Table 4.
Hyperparameter search space of each algorithm.
5. Results and Discussion
5.1. Model Evaluation Metrics
This study uses three evaluation metrics to assess the performance of the three learning algorithms in predicting engine radiated noise: maximum absolute error (MaxAE), mean absolute error (MAE), and median absolute error (MedAE) [51]. MaxAE represents the lower bound of the model’s prediction performance, MAE reflects the average prediction performance, and MedAE, with its robustness, reduces the impact of outliers on the evaluation of model predictions [52]. The formulas for these metrics are as follows [53]:
where is the number of samples in the validation set (in this study, ), is the true value, and is the predicted value. Lower values of MaxAE, MAE, and MedAE indicate better model prediction performance.
5.2. Analysis and Discussion
Based on the vibration data collected from seven measurement points, six models, including a linear regression (LR) model as a baseline, were developed for prediction and analysis, with error evaluation conducted using MaxAE, MAE, and MedAE. The prediction results are as follows. The radiated noise prediction models established using time-domain vibration data from the seven triaxial acceleration sensors are shown in Figure 7 for the same validation set. Figure 7a presents the prediction results of each model compared to the test values, including the LR model as a simpler benchmark to highlight the added value of the proposed methods. Figure 7b displays the error comparison across models, with 95% confidence intervals (CI) for MaxAE, MAE, and MedAE represented as error bars to reflect prediction uncertainty. The results show that all five advanced models (Poly-SVR, Lin-SVR, RFR, RBF-SVR, and MLP) achieved prediction performance superior to the LR baseline (MaxAE: 0.79 dB, MAE: 0.34 dB, MedAE: 0.25 dB). Among them, the Poly-SVR model yielded the lowest MAE and MedAE values, 0.10 dB (95% CI: 0.058–0.142 dB) and 0.08 dB (95% CI: 0.046–0.114 dB), respectively, significantly outperforming the other four advanced models and demonstrating excellent accuracy in radiated noise prediction based on time-domain data. Since the MAE differences did not pass the normality test (Shapiro–Wilk, p < 0.001), the Wilcoxon signed-rank test was used to assess the statistical significance of model differences. The results indicated that the MAE of Poly-SVR was significantly lower than that of LR (p < 0.0001), RBF-SVR (p < 0.0001), and Lin-SVR (p < 0.0001), with all differences reaching a high level of statistical significance. Despite the small sample size, the performance differences between models remained evident.
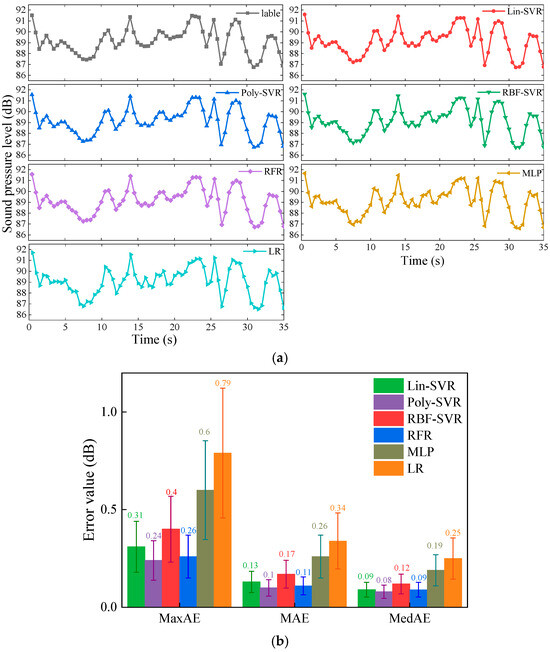
Figure 7.
Predictive effect of time-domain data at each measurement point. (a) Predictions by model; (b) indicators for evaluation of models.
Using 21 sets of frequency-domain data from different directions of the 7 measurement points’ acceleration sensors, 6 prediction models were established for each dataset, and the radiated noise prediction performance was evaluated based on the models’ metrics across different measurement points, directions, and algorithms. Figure 8 illustrates the prediction results for the X-directional frequency-domain vibration data from measurement point P1, with Figure 8a showing the prediction results compared to test values and Figure 8b presenting the error comparison, with 95% CI for MaxAE, MAE, and MedAE shown as error bars. Table 5, Table 6 and Table 7 indicate the prediction errors of different prediction models constructed with frequency domain data at different measurement points and test directions, where Table 5 lists the evaluation metrics for modelling frequency domain data at different measurement points in the X direction, Table 6 lists the evaluation metrics for modelling frequency domain data at different measurement points in the Y direction, and Table 7 lists the evaluation metrics for modelling frequency domain data at different measurement points in the Z direction. In frequency-domain predictions, the optimal degree parameter for the Poly-SVR algorithm is consistently 1, resulting in identical decision functions and prediction results for Lin-SVR and Poly-SVR models. Analysis of the figures and tables shows that the Lin-SVR, Poly-SVR, and RFR models exhibit lower MaxAE, MAE, and MedAE values, indicating better prediction performance. In contrast, the LR baseline model has larger errors (e.g., MAE in the P1 X-direction: 0.79 dB, 95% CI: 0.457–1.123 dB), although its MAE is slightly lower than that of RBF-SVR (e.g., MAE in the P1 X-direction: 0.89 dB, 95% CI: 0.515–1.265 dB). Some RFR models show relatively high MaxAE values, suggesting lower stability compared to Lin-SVR and Poly-SVR. Both RBF-SVR and MLP have high MaxAE values; however, MLP’s MAE is lower than that of RBF-SVR, indicating that MLP generally performs better but may produce larger errors under specific conditions, whereas RBF-SVR consistently performs poorly. Since the MAE differences did not pass the normality test (Shapiro–Wilk, p < 0.001), the Wilcoxon signed-rank test was used to assess model differences. The results show that, in most frequency-domain datasets, the MAEs of Lin-SVR and Poly-SVR (0.18 dB) were significantly lower than those of LR (0.79 dB, p < 0.0001) and RBF-SVR (0.89 dB, p < 0.0001), further demonstrating the robustness of Lin-SVR and Poly-SVR under a small sample size. The MAE difference between LR and RBF-SVR was not statistically significant (p > 0.05), suggesting that, although LR is a baseline model, its performance can still be comparable to that of RBF-SVR in certain frequency-domain scenarios.
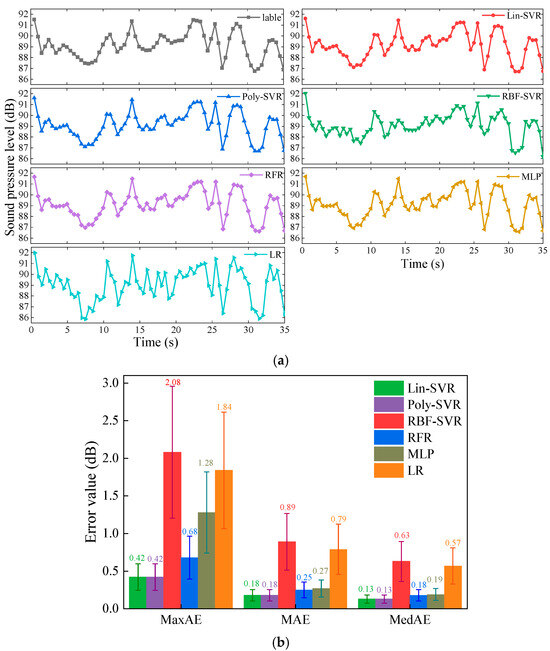
Figure 8.
Predictive effect of frequency domain data at the P1 measurement point. (a) Predictions by model; (b) indicators for evaluation of models.

Table 5.
Evaluation indexes of each prediction model constructed from X-direction vibration frequency domain data at each measurement point.

Table 6.
Evaluation indexes of each prediction model constructed from Y-direction vibration frequency domain data at each measurement point.

Table 7.
Evaluation indexes of each prediction model constructed from Z-direction vibration frequency domain data at each measurement point.
The quality of measurement points was evaluated based on the prediction performance (MaxAE, MAE, and MedAE) of the optimal model (Poly-SVR). The prediction models trained using frequency-domain vibration data from measurement point P6 exhibited the best performance, with high prediction accuracy across all algorithms for X, Y, and Z directional data, consistently outperforming the LR baseline (e.g., MAE at P6 X-direction: 0.15 dB vs. 0.42 dB). In contrast, models trained with data from measurement point P4 performed the worst, particularly those using X and Z directional data, which showed significantly higher evaluation metric values compared to other models, though still better than LR (e.g., MAE at P4 X-direction: 0.38 dB vs. 0.63 dB).
Overall, prediction models based on time-domain data outperform frequency-domain models, requiring less computational effort by avoiding Fourier transforms and principal component analysis but necessitating more measurement points. Frequency-domain models have slightly lower prediction performance, but Lin-SVR and RFR can achieve high accuracy with single-direction vibration data at certain measurement points, making them suitable for scenarios with fewer measurement points and moderate accuracy requirements. The inclusion of the LR baseline highlights the superior predictive power of the machine learning models, while the confidence intervals and statistical tests provide evidence of robust performance despite the limited sample size.
5.3. Transferability and Limitations
The model proposed in this study is transferable to different engine types and test conditions, but this requires relearning the relationship between vibration and noise for the new scenario. It also requires ensuring a consistent feature engineering process for the vibration data, using a 0.5 s RMS window and PCA dimensionality reduction. In practice, it is necessary to collect representative training samples that cover the target engine’s operating range and ensure consistent sensor placement. Changing sensor placement or the number of sensors may require readjusting the model’s hyperparameters to accommodate changes in vibration characteristics under different installation methods or boundary conditions. Nevertheless, some limitations should be acknowledged. First, the present study is based on data from a single engine platform under controlled laboratory conditions, which may not fully capture the variability present in real-world applications. Second, while the models demonstrated high accuracy with small datasets, their generalizability to engines with fundamentally different structural dynamics remains to be further validated. Future work will focus on cross-engine and cross-condition testing, as well as exploring domain adaptation techniques to enhance model robustness in diverse operational contexts.
6. Conclusions
This study utilizes time-domain and frequency-domain vibration data collected from the engine surface structure during experiments to apply three learning algorithms (RBF-SVR, Lin-SVR, Poly-SVR, and MLP) and establish five learning models. The performance of these models, built using time-domain and frequency-domain data, is compared based on three evaluation metrics: MAE, MaxAE, and MedAE. Additionally, the influence of engine measurement points on the prediction models is analyzed, leading to the following key conclusions:
- Using time-domain vibration data from the engine surface, radiated noise prediction models were constructed. The prediction results on the test set indicate that all algorithms effectively predict engine radiated noise, with the Poly-SVR model demonstrating the best overall performance (MAE: 0.1, MaxAE: 0.24, MedAE: 0.08). In contrast, the MLP model exhibited the poorest performance (e.g., MAE: 0.26, MaxAE: 0.6, MedAE: 0.19). This suggests that Poly-SVR is particularly suited for capturing the temporal dynamics in vibration signals, achieving up to 16% better accuracy compared to linear models in time-domain scenarios.
- A radiated noise prediction model was developed using frequency-domain vibration data from an engine surface. Performance comparisons on the test set showed that the Lin-SVR and Poly-SVR models achieved the best prediction performance. In this study, the optimal value of the degree parameter in the Poly-SVR algorithm is always 1, meaning the decision functions calculated by Poly-SVR and Lin-SVR are identical; as such, the final results were identical (MAE: 0.18, MaxAE: 0.42, MedAE: 0.13), outperforming the worst-performing RBF-SVR model (MAE: 0.89, MaxAE: 2.08, MedAE: 0.63). These findings highlight the effectiveness of linear and polynomial kernel functions in processing spectra, likely due to their ability to more effectively model harmonic components after dimensionality reduction using PCA, although RBF-SVR may overfit in high-dimensional frequency spaces.
- Evaluating the optimal algorithm for each measurement point using MaxAE, MAE, and MedAE as metrics, the measurement point between cylinders 3 and 4 on the engine top surface yields the best prediction performance (MAE: 0.15, MaxAE: 0.48, MedAE: 0.1). Because this location is close to critical engine components, it is likely to capture the most representative vibration mode, reducing the prediction error by 13% compared to other points.
Overall, the time-domain models developed in this study exhibit high prediction accuracy (average MAE across models: 0.1) and low computational requirements, making them well-suited for real-time monitoring applications. However, they require multiple measurement points for robustness. In contrast, frequency-domain models exhibit slightly lower accuracy (average MAE: 0.18, approximately 8% higher error than the time-domain models) and require dimensionality reduction using PCA to control computational complexity. However, they operate effectively with only a single measurement point, which is advantageous in resource-constrained environments.
These results underscore the importance of data domain selection in vibration-based noise prediction: time-domain approaches excel in precision for detailed engineering analyses, while frequency-domain methods prioritize efficiency and simplicity. However, limitations include reliance on experimental data from a specific engine type, which may not generalize to other configurations, and the potential sensitivity to noise in raw signals. Future work could explore hybrid models combining both domains, incorporate additional features such as temperature or load variations, or validate these findings on diverse engine datasets to enhance generalizability and practical deployment. The appropriate model can thus be selected based on the specific application scenario, balancing accuracy, computational cost, and sensor requirements.
Author Contributions
Methodology, R.L.; software, Y.Y.; validation, Y.P.; formal analysis, X.Z.; investigation, R.L.; resources, X.Z.; data curation, Y.Y.; writing—original draft preparation, R.L.; writing—review and editing, Y.Y.; visualization, Y.P.; supervision, X.Z.; project administration, Y.P.; funding acquisition, X.Z. All authors have read and agreed to the published version of the manuscript.
Funding
This paper was funded by the National Natural Science Foundation of China (No. 51876188 and No. 51975515).
Data Availability Statement
Dataset available on request from the authors.
Conflicts of Interest
The authors declare no conflicts of interest.
Abbreviations
The following abbreviations are used in this manuscript:
| SVR | Support vector regression |
| RFR | Random forest regression |
| MLP | Multilayer perceptron |
| RMS | Root mean square |
| PCA | Principal component analysis |
| Lin-SVR | Linear kernel support vector regression |
| Poly-SVR | Polynomial kernel support vector regression |
| RBF-SVR | Radial basis function kernel support vector regression |
| MaxAE | Maximum absolute error |
| MAE | Mean absolute error |
| MedAE | Median absolute error |
| LR | Linear regression |
| CI | Confidence interval |
References
- Huang, H.; Lim, T.C.; Wu, J.; Ding, W.; Pang, J. Multitarget prediction and optimization of pure electric vehicle tire/road airborne noise sound quality based on a knowledge-and data-driven method. Mech. Syst. Signal Process. 2023, 197, 110361. [Google Scholar] [CrossRef]
- Yu, X.; Dai, R.; Zhang, J.; Yin, Y.; Li, S.; Dai, P.; Huang, H. Vehicle structural road noise prediction based on an improved Long Short-Term Memory method. Sound Vib. 2025, 59, 2022. [Google Scholar] [CrossRef]
- Yang, M.; Dai, P.; Yin, Y.; Wang, D.; Wang, Y.; Huang, H. Predicting and optimizing pure electric vehicle road noise via a locality-sensitive hashing transformer and interval analysis. ISA Trans. 2025, 157, 556–572. [Google Scholar] [CrossRef] [PubMed]
- Siano, D.; Bozza, F. Combustion Noise Prediction in a Small Diesel Engine Finalized to the Optimization of the Fuel Injection Strategy. In Proceedings of the SAE 2009 Noise and Vibration Conference and Exhibition, St. Charles, IL, USA, 19–21 May 2009. [Google Scholar] [CrossRef]
- Moreau, S. Turbomachinery Noise Predictions: Present and Future. Acoustics 2019, 1, 92–116. [Google Scholar] [CrossRef]
- Férand, M.; Livebardon, T.; Moreau, S.; Sanjosé, M. Numerical Prediction of Far-Field Combustion Noise from Aeronautical Engines. Acoustics 2019, 1, 174–198. [Google Scholar] [CrossRef]
- Liu, Y.; Dowling, A.P.; Swaminathan, N.; Morvant, R.; Macquisten, M.A.; Caracciolo, L.F. Prediction of combustion noise for an aeroengine combustor. J. Propuls. Power 2014, 30, 114–122. [Google Scholar] [CrossRef]
- Hipparge, V.; Bhalerao, S.; Chavan, A.; Chaudhari, V.; Suresh, R. Agricultural Tractor Engine Noise Prediction and Optimization through Test and Simulation Techniques. In Proceedings of the Symposium on International Automotive Technology, Pune, India, 23–25 January 2024. [Google Scholar] [CrossRef]
- Dupré, T.; Denjean, S.; Aramaki, M.; Kronland-Martinet, R. Analysis by synthesis of engine sounds for the design of dynamic auditory feedback of electric vehicles. Acta Acust. 2023, 7, 36. [Google Scholar] [CrossRef]
- Guo, Q.; Zhang, H.; Yang, B.; Shi, S. Underwater Radiated Noise Prediction Method of Cabin Structures under Hybrid Excitation. Appl. Sci. 2023, 13, 12667. [Google Scholar] [CrossRef]
- Ding, P.; Xu, Y.; Sun, X.M. Multi-task learning for aero-engine bearing fault diagnosis with limited data. IEEE Trans. Instrum. Meas. 2024, 73, 1–11. [Google Scholar] [CrossRef]
- Mariani, V.C.; Och, S.H.; dos Santos Coelho, L.; Domingues, E. Pressure prediction of a spark ignition single cylinder engine using optimized extreme learning machine models. Appl. Energy 2019, 249, 204–221. [Google Scholar] [CrossRef]
- Zhan, X.; Bai, H.; Yan, H.; Wang, R.; Guo, C.; Jia, X. Diesel engine fault diagnosis method based on optimized VMD and improved CNN. Processes 2022, 10, 2162. [Google Scholar] [CrossRef]
- Zhang, P.; Gao, W.; Li, Y.; Wang, Y. Misfire detection of diesel engine based on convolutional neural networks. Proc. Inst. Mech. Eng. Part D J. Automob. Eng. 2021, 235, 2148–2165. [Google Scholar] [CrossRef]
- Wang, J.; Huang, Y.; Wei, L.; Wang, X. Research on engine cooling system condition monitoring based on deep digital twin. Proc. Inst. Mech. Eng. Part D: J. Automob. Eng. 2025, 9544070251317757. [Google Scholar] [CrossRef]
- Li, Y.; Han, M.; Han, B.; Le, X.; Kanae, S. Fault diagnosis method of diesel engine based on improved structure preserving and k-nn algorithm. In Advances in Neural Networks–ISNN 2018, Proceedings of the 15th International Symposium on Neural Networks, Minsk, Belarus, 25–28 June 2018; Springer International Publishing: Cham, Switzerland, 2018; Volume 15, pp. 656–664. [Google Scholar] [CrossRef]
- Wen, P.J.; Huang, C. Machine learning and prediction of masked motors with different materials based on noise analysis. IEEE Access 2022, 10, 75708–75719. [Google Scholar] [CrossRef]
- Liu, H.; Zhang, J.; Guo, P.; Bi, F.; Yu, H.; Ni, G. Sound quality prediction for engine-radiated noise. Mech. Syst. Signal Process. 2015, 56, 277–287. [Google Scholar] [CrossRef]
- Fu, J.; Yang, R.; Li, X.; Sun, X.; Li, Y.; Liu, Z.; Zhang, Y.; Sunden, B. Application of artificial neural network to forecast engine performance and emissions of a spark ignition engine. Appl. Therm. Eng. 2022, 201, 117749. [Google Scholar] [CrossRef]
- Molina, S.; Novella, R.; Gomez-Soriano, J.; Olcina-Girona, M. New combustion modelling approach for methane-hydrogen fueled engines using machine learning and engine virtualization. Energies 2021, 14, 6732. [Google Scholar] [CrossRef]
- Huang, H.; Huang, X.; Ding, W.; Zhang, S.; Pang, J. Optimization of electric vehicle sound package based on LSTM with an adaptive learning rate forest and multiple-level multiple-object method. Mech. Syst. Signal Process. 2023, 187, 109932. [Google Scholar] [CrossRef]
- Huang, H.; Huang, X.; Ding, W.; Yang, M.; Yu, X.; Pang, J. Vehicle vibro-acoustical comfort optimization using a multi-objective interval analysis method. Expert Syst. Appl. 2023, 213, 119001. [Google Scholar] [CrossRef]
- Hao, P.Y.; Chiang, J.H.; Chen, Y.D. Possibilistic classification by support vector networks. Neural Netw. 2022, 149, 40–56. [Google Scholar] [CrossRef] [PubMed]
- Teixeira, R.; Nogal, M.; O’Connor, A. Adaptive approaches in metamodel-based reliability analysis: A review. Struct. Saf. 2021, 89, 102019. [Google Scholar] [CrossRef]
- Chaabene, W.B.; Flah, M.; Nehdi, M.L. Machine learning prediction of mechanical properties of concrete: Critical review. Constr. Build. Mater. 2020, 260, 119889. [Google Scholar] [CrossRef]
- Zheng, B.; Myint, S.W.; Thenkabail, P.S.; Aggarwal, R.M. A support vector machine to identify irrigated crop types using time-series Landsat NDVI data. Int. J. Appl. Earth Obs. Geoinf. 2015, 34, 103–112. [Google Scholar] [CrossRef]
- Smola, A.J.; Schölkopf, B. A tutorial on support vector regression. Stat. Comput. 2004, 14, 199–222. [Google Scholar] [CrossRef]
- Kisi, O. Pan evaporation modeling using least square support vector machine, multivariate adaptive regression splines and M5 model tree. J. Hydrol. 2015, 528, 312–320. [Google Scholar] [CrossRef]
- Zhao, J.; Yin, Y.; Chen, J.; Zhao, W.; Ding, W.; Huang, H. Evaluation and Prediction of Vibration Comfort in Engineering Machinery Cabs Using Random Forest with Genetic Algorithm. SAE Int. J. Veh. Dyn. Stab. NVH 2024, 8, 491–512. [Google Scholar] [CrossRef]
- Cutler, A.; Cutler, D.R.; Stevens, J.R. Random forests. In Ensemble Machine Learning, 2nd ed.; Springer: New York, NY, USA, 2012; pp. 157–175. [Google Scholar] [CrossRef]
- Svetnik, V.; Liaw, A.; Tong, C.; Culberson, J.C.; Sheridan, R.P.; Feuston, B.P. Random forest: A classification and regression tool for compound classification and QSAR modeling. J. Chem. Inf. Comput. Sci. 2003, 43, 1947–1958. [Google Scholar] [CrossRef]
- Gardner, M.W.; Dorling, S.R. Artificial neural networks (the multilayer perceptron)—A review of applications in the atmospheric sciences. Atmos. Environ. 1998, 32, 2627–2636. [Google Scholar] [CrossRef]
- Afzal, S.; Ziapour, B.M.; Shokri, A.; Shakibi, H.; Sobhani, B. Building energy consumption prediction using multilayer perceptron neural network-assisted models; comparison of different optimization algorithms. Energy 2023, 282, 128446. [Google Scholar] [CrossRef]
- Popescu, M.C.; Balas, V.E.; Perescu-Popescu, L.; Mastorakis, N. Multilayer perceptron and neural networks. WSEAS Trans. Circuits Syst 2009, 8, 579–588. Available online: https://dl.acm.org/doi/abs/10.5555/1639537.1639542 (accessed on 12 August 2025).
- Wu, Y.; Liu, X.; Huang, H.; Wu, Y.; Ding, W.; Yang, M. Multi-objective prediction and optimization of vehicle acoustic package based on ResNet neural network. Sound Vib. 2023, 57, 73–95. [Google Scholar] [CrossRef]
- GB/T 1859.3-2015; Reciprocating Internal Combustion Engines—Measurement of Sound Power Level Using Sound Pressure—Part 3. Precision Methods for Hemi-Anechoic Rooms. General Administration of Quality Supervision, Inspection and Quarantine of the People’s Republic of China, Standardization Administration of the People’s Republic of China, Standards Press of China: Beijing, China, 2015.
- Masri, J.; Amer, M.; Salman, S.; Ismail, M.; Elsisi, M. A survey of modern vehicle noise, vibration, and harshness: A state-of-the-art. Ain Shams Eng. J. 2024, 15, 102957. [Google Scholar] [CrossRef]
- Dai, R.; Zhao, J.; Zhao, W.; Ding, W.; Huang, H. Exploratory study on sound quality evaluation and prediction for engineering machinery cabins. Measurement 2025, 253, 117684. [Google Scholar] [CrossRef]
- Jafari, M.; Verma, P.; Zare, A.; Borghesani, P.; Bodisco, T.A.; Ristovski, Z.D.; Brown, R.J. In-cylinder pressure reconstruction by engine acoustic emission. Mech. Syst. Signal Process. 2021, 152, 107490. [Google Scholar] [CrossRef]
- Payri, F.; Luján, J.M.; Martín, J.; Abbad, A. Digital signal processing of in-cylinder pressure for combustion diagnosis of internal combustion engines. Mech. Syst. Signal Process. 2010, 24, 1767–1784. [Google Scholar] [CrossRef]
- Wright, R.F.; Lu, P.; Devkota, J.; Lu, F.; Ziomek-Moroz, M.; Ohodnicki, P.R., Jr. Corrosion sensors for structural health monitoring of oil and natural gas infrastructure: A review. Sensors 2019, 19, 3964. [Google Scholar] [CrossRef]
- Fan, C.; Sun, Y.; Zhao, Y.; Song, M.; Wang, J. Deep learning-based feature engineering methods for improved building energy prediction. Appl. Energy 2019, 240, 35–45. [Google Scholar] [CrossRef]
- Lee, S.; Ha, J.; Zokhirova, M.; Moon, H.; Lee, J. Background information of deep learning for structural engineering. Arch. Comput. Methods Eng. 2018, 25, 121–129. [Google Scholar] [CrossRef]
- Barelli, L.; Bidini, G.; Bonucci, F.; Moretti, E. The radiation factor computation of energy systems by means of vibration and noise measurements: The case study of a cogenerative internal combustion engine. Appl. Energy 2012, 100, 258–266. [Google Scholar] [CrossRef]
- Greenacre, M.; Groenen, P.J.; Hastie, T.; d’Enza, A.I.; Markos, A.; Tuzhilina, E. Principal component analysis. Nat. Rev. Methods Prim. 2022, 2, 100. [Google Scholar] [CrossRef]
- Erbe, C.; Duncan, A.; Hawkins, L.; Terhune, J.M.; Thomas, J.A. Introduction to acoustic terminology and signal processing. In Exploring Animal Behavior Through Sound: Volume 1: Methods; Springer International Publishing: Cham, Switzerland, 2022; pp. 111–152. [Google Scholar] [CrossRef]
- Xu, Y.; Goodacre, R. On splitting training and validation set: A comparative study of cross-validation, bootstrap and systematic sampling for estimating the generalization performance of supervised learning. J. Anal. Test. 2018, 2, 249–262. [Google Scholar] [CrossRef] [PubMed]
- Huang, H.; Wang, Y.; Wu, J.; Ding, W.; Pang, J. Prediction and optimization of pure electric vehicle tire/road structure-borne noise based on knowledge graph and multi-task ResNet. Expert Syst. Appl. 2024, 255, 124536. [Google Scholar] [CrossRef]
- Rodriguez, J.D.; Perez, A.; Lozano, J. A Sensitivity analysis of k-fold cross validation in prediction error estimation. IEEE Trans. Pattern Anal. Mach. Intell. 2009, 32, 569–575. [Google Scholar] [CrossRef] [PubMed]
- Ramezan, C.A.; Warner, T.A.; Maxwell, A.E. Evaluation of sampling and cross-validation tuning strategies for regional-scale machine learning classification. Remote Sens. 2019, 11, 185. [Google Scholar] [CrossRef]
- Aldahdooh, A.; Masala, E.; Janssens, O.; Van Wallendael, G.; Barkowsky, M.; Le Callet, P. Improved performance measures for video quality assessment algorithms using training and validation sets. IEEE Trans. Multimed. 2018, 21, 2026–2041. [Google Scholar] [CrossRef]
- Huang, H.; Huang, X.; Ding, W.; Yang, M.; Fan, D.; Pang, J. Uncertainty optimization of pure electric vehicle interior tire/road noise comfort based on data-driven. Mech. Syst. Signal Process. 2022, 165, 108300. [Google Scholar] [CrossRef]
- Zhu, H.; Zhao, J.; Wang, Y.; Ding, W.; Pang, J.; Huang, H. Improving of pure electric vehicle sound and vibration comfort using a multi-task learning with task-dependent weighting method. Measurement 2024, 233, 114752. [Google Scholar] [CrossRef]
Disclaimer/Publisher’s Note: The statements, opinions and data contained in all publications are solely those of the individual author(s) and contributor(s) and not of MDPI and/or the editor(s). MDPI and/or the editor(s) disclaim responsibility for any injury to people or property resulting from any ideas, methods, instructions or products referred to in the content. |
© 2025 by the authors. Licensee MDPI, Basel, Switzerland. This article is an open access article distributed under the terms and conditions of the Creative Commons Attribution (CC BY) license (https://creativecommons.org/licenses/by/4.0/).