Abstract
The enhancement of weak-fault signal characteristics in rolling bearings under strong background noise interference has always been a challenging problem in rotating machinery fault diagnosis. Research indicates that multivariate statistical indicators such as skewness and kurtosis can characterize the fault features of vibration signals. However, when the fault features in the signal are weak and severely affected by noise, the characterization capability of these indicators diminishes, significantly compromising diagnostic accuracy. To address this issue, this paper proposes a novel multivariate statistical filtering (MSF) method for multi-band filtering, which can effectively screen the target fault information bands in vibration signals during bearing faults. The core idea involves constructing a multivariate matrix of fused-fault multidimensional features by integrating fault and healthy signals, and then utilizing eigenvalue distance metrics to significantly characterize the spectral differences between fault and healthy signals. This enables the selection of frequency bands containing the most informative fault features from the segmented frequency spectrum. To address the inherent in-band residual noise in the MSF-processed signals, this paper further proposes the Hilbert differential Teager energy operator (HDTEO) based on MSF to suppress the filtered in-band noise, thereby enhancing transient fault impulses more effectively. The proposed method has been validated using both public datasets and laboratory datasets. Results demonstrate its effectiveness in accurately identifying fault characteristic frequencies, even under challenging conditions such as incipient bearing faults or severely weak vibration signatures caused by strong background noise. Finally, comparative experiments confirm the superior performance of the proposed approach.
1. Introduction
Rotating machinery, serving as core power equipment in modern industry, is widely utilized across various sectors, including manufacturing plants, wind power generation, and aviation. Its operational condition directly impacts production stability, energy efficiency, and operational safety [1,2]. As critical components enabling relative rotational motion, rolling bearings exhibit high fault rates due to prolonged exposure to complex operational conditions, including alternating loads, impact vibrations, and lubrication degradation. This makes them the primary contributor to unplanned equipment downtime in industrial systems [3]. Failure to detect incipient faults promptly may trigger cascading faults, potentially leading to significant economic losses and safety hazards. The extraction and identification of weak-fault signatures represent a critical bottleneck in the engineering application of fault diagnosis technologies, primarily due to two fundamental challenges: first, the characteristic energy of early-stage faults is inherently weak and easily overwhelmed by strong background noise such as electromagnetic interference from motors and gear meshing vibrations, resulting in extremely low signal-to-noise ratios (SNRs). Second, fault-induced signatures undergo substantial attenuation and distortion along transmission paths, where structural resonance and nonlinear boundary conditions severely obscure the original impulse characteristics. Consequently, research on feature enhancement and diagnostic methodologies for weak-fault vibration signals in bearings carries substantial theoretical and practical significance.
In the current research field, mainstream technological approaches exhibit significant divergence. The latest advancements in data-driven deep learning techniques have demonstrated their capability to automatically extract meaningful features from input data that are effective for fault identification [4,5]. However, their strong dependence on large-scale annotated data and poor interpretability significantly limit their applicability in engineering fault analysis scenarios. These limitations become particularly pronounced under conditions of scarce early-stage bearing-fault samples and complex, variable operating conditions. In contrast, signal processing-based methods are better suited for such scenarios, as they do not require extensive training data and can achieve effective fault diagnosis through well-defined mathematical formulations. For instance, when calculating signal periodicity using autocorrelation functions, only a small number of observations are needed for analysis, perfectly aligning with the characteristic scarcity of fault samples [6]. Meanwhile, methods such as Fast Fourier Transform (FFT) [7] and Finite Impulse Response filters [8] exhibit low computational complexity, enabling them to deliver consistently superior diagnostic performance in field testing scenarios with stringent real-time engineering requirements.
Consequently, a majority of scholars have persistently pursued in-depth research and innovation in feature enhancement and diagnostic techniques for weak-fault vibration signals in bearings. Lin et al. [9] enhanced the weak periodic shock component in noise by constructing a structural feature matrix matching the oscillatory characteristics of the shock signal, and then combined a nonconvex penalty function fusing the signal itself and differential sparsity with an alternating-direction multiplier optimization algorithm to accurately extract the fault features, which significantly improves the diagnostic performance under the condition of low signal-to-noise ratio. Chen et al. [10] proposed a multiscale alternating-direction multiplier dictionary learning method by accurately extracting fault impact signals from segmented signals, combined with spectral averaging to enhance the frequency of bearing-fault features. Gao et al. [11] proposed an adaptive stochastic resonance method based on the positive cosine algorithm, which optimizes the structural parameters of the stochastic resonance by constructing a weighted-power spectral kurtosis evaluation index and effectively enhances the weak-fault signals. Shi et al. [12] proposed an adaptive multi-parameter unsaturated stochastic resonance method based on a novel adaptive multi-parameter unsaturated stochastic resonance-based weak-signal enhancement method, which significantly improves the fault feature-extraction capability by optimizing the potential function structure and parameter matching. However, the existing feature-enhancement methods do not fully utilize the advantage of the health signal as a key information reference [13,14], which leads to insufficient comparative benchmarks for fault feature extraction and makes it difficult to achieve high-precision weak-fault detection.
Statistical quantities of different orders can extract information from diverse representational dimensions of the signal, and their combined application enables a more comprehensive characterization of signal features. Song et al. [15] proposed a statistical filtering method based on mean and variance, employing a hypothesis testing criterion for frequency band selection. However, its reliance solely on low-order statistical characteristics results in limited performance in non-Gaussian and nonlinear signal scenarios. Zeng et al. [16] further expanded the application dimensions of statistical measures by simultaneously extracting multi-order time-domain and frequency-domain statistical features from both raw vibration signals and intrinsic mode function (IMF) components. A distance evaluation technique was introduced to select discriminative features as classifier inputs, enabling the model to learn characteristic distribution patterns under different fault conditions. This approach significantly enhanced the richness of feature representation. Rostaghi et al. [17] focused on the fusion strategy of higher-order statistics, proposing a novel approach that combines modified composite generalized multiscale dispersion entropy (based on variance) with modified composite multiscale dispersion entropy (based on skewness). Experimental results demonstrated that the synergistic use of second- and third-order statistics achieves optimal fault classification accuracy, thereby validating the complementary value of higher-order statistics in complex signal characterization. However, the dynamic changes in the operational status of equipment lead to a time-varying drift in the statistical characteristics of fault signals [18]. Although existing methods that integrate multi-order statistical moments can improve the comprehensiveness of features to a certain extent, they still struggle to effectively mitigate the ambiguity and vulnerability to interference of fault features under scenarios involving early-stage weak faults and strong background noise. This results in insufficient discriminability for early-stage weak faults.
To address the limitations of existing methods, this study proposes a novel approach for bearing weak-fault signal-feature enhancement and diagnosis, termed MS-HDTEO. The innovatively constructed multivariate matrix in this research integrates the fault characterization capabilities of multi-order frequency-domain statistics. By employing Kernel Principal Component Analysis (KPCA) to extract principal eigenvalues of fault signals, a distance metric between fault and healthy signals is established, which significantly amplifies the characteristic spectral differences between them. The application of HDTEO to enhance filtered signals after MSF processing results in substantial suppression of in-band noise, while further strengthening weak-fault impulses in vibration signals under strong background noise. Consequently, the extracted fault characteristic frequencies in the envelope spectrum achieve optimally prominent peaks. The main contributions of this paper are as follows:
- (1)
- A multivariate-matrix distance metric method incorporating multidimensional fault features is proposed, which can effectively characterize subtle spectral differences between faulty and healthy signals. By employing statistical criteria, it precisely localizes target fault-sensitive frequency bands, demonstrating superior characterization capability compared to single frequency-domain statistical indicators.
- (2)
- The application of HDTEO as a post-processing step for MSF effectively extracts transient energy variations in the signal, addressing the persistent issue of residual in-band noise inherent in multi-band filtering systems. This approach significantly suppresses residual noise, thereby achieving optimal extraction of weak-fault signal characteristics.
- (3)
- Validation on both public bearing datasets and experimental bench tests demonstrates that the proposed method effectively enhances weak-fault features in vibration signals, even under strong background noise conditions during early-stage bearing faults. The enhanced signals enable straightforward fault diagnosis through envelope spectrum analysis.
The remaining sections of this paper are organized as follows: Section 2 outlines the workflow of the proposed method for feature enhancement and diagnosis of weak bearing-fault signals. Section 3 elaborates on the theoretical foundations of the proposed methodology. Section 4 validates the effectiveness of the proposed approach using both public datasets and experimental bearing test platform datasets. Section 5 demonstrates the superiority of the method through multiple sets of comparative experiments. Section 6 concludes the paper with a comprehensive summary.
2. Overview of Bearing-Fault Diagnosis
2.1. Enhancement and Diagnosis of Weak Bearing-Fault Signals
Figure 1 shows the implementation process of the MS-HDTEO method proposed in this paper. The specific steps are as follows:
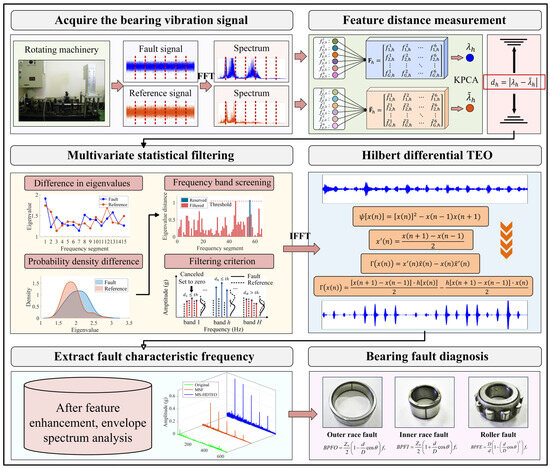
Figure 1.
The bearing-fault diagnosis process of the proposed method.
- (1)
- For the bearing-vibration fault signals (the signals to be diagnosed) and reference signals (healthy signals) collected from rotating machinery, the initial step involves segmental processing in the time–frequency domain, followed by the extraction of multi-order frequency-domain statistical indicators from each frequency band.
- (2)
- A multivariate matrix integrating multidimensional fault features of both fault and reference signals across all sub-bands is sequentially constructed. KPCA is subsequently applied to extract the first principal eigenvalue, followed by the calculation of a distance metric based on the extracted eigenvalues.
- (3)
- Based on the significant divergence observed in the distance metric, a multivariate statistical filtering threshold criterion is designed to identify the target fault-sensitive frequency bands.
- (4)
- The inverse Fourier transform (IFFT) is applied to the selected target frequency bands to obtain the filtered fault signal. Subsequently, HDTEO processing is performed to effectively suppress residual in-band noise.
- (5)
- Fault characteristic frequency is directly extracted through envelope spectrum analysis to ultimately accomplish fault diagnosis.
2.2. Bearing-Fault Characteristic Frequency
The characteristic fault frequency serves as a critical indicator for diagnosing bearing-fault types. It refers to specific inherent frequency components in the envelope spectrum of bearing-vibration signals, which are excited by periodic impacts caused by localized defects. These frequency components exhibit a direct correlation with the bearing’s geometric parameters and the rotational frequency of the shaft.
In particular, the bearing outer-race fault characteristic frequency BPFO, the inner-race fault characteristic frequency, BPFI, and the roller-fault characteristic frequency, BPFE, are calculated as follows:
where is the number of rolling elements, is the diameter of rolling elements, is the diameter of bearing pitch circle, is the contact angle between rolling elements and inner and outer races, and is the rotation frequency. These characteristic frequencies are manifested in the spectrum as fundamental frequency and its harmonics, which are an important basis for bearing-fault diagnosis.
3. Methodology
3.1. Multivariate Statistical Filtering
Statistical filtering, as a signal processing method that achieves multi-band filtering based on differences in the statistical characteristics of the signal spectrum, is fundamentally centered on the selective extraction of target frequency bands and interference suppression through the computation of statistical feature parameters for each frequency band [19]. Frequency band division-based statistical filtering technology demonstrates remarkable adaptability: it enables targeted processing according to the frequency band distribution characteristics of bearing-fault signals. By performing independent statistical analyses on signals from different frequency bands, this approach effectively enhances the discernibility of fault features, thereby preventing useful fault-related information from being obscured by interference components in other frequency bands.
3.1.1. Construction of Multivariate Matrices
The proposed MSF method requires time–frequency domain segmentation preprocessing of both the fault and reference signals. First, the original bearing-vibration signal is equally divided into G segments to obtain the signal sample as shown in Equation (4). Subsequently, each segment is normalized using Equation (5). This independent normalization process dynamically adjusts the amplitude reference for each segment, which not only eliminates dimensional differences in vibration signal amplitudes under varying operating conditions, but also fully preserves the fault-induced impulse characteristics within each segment.
where , with being the number of sampling points per segment of the bearing-vibration signal, and , where denotes the total number of signal segments. Here, represents the nth sampling point of the gth signal segment.
The gth segment of the time-domain vibration signal is normalized using min–max normalization:
Frequency domain analysis of the bearing-vibration signals is an effective way to obtain information about the operating state of the machinery. The corresponding spectrum is obtained by FFT of the normalized time-domain vibration signal using Equation (6), where .
Both the fault vibration signal and the reference signal undergo identical processing. After obtaining the frequency spectrum of each time-domain signal segment, it is necessary to further extract the fault characteristic information embedded within this spectrum. It reflects the energy distribution characteristics of the signals across different frequency bands. However, the raw spectral data exhibit high dimensionality and contain redundant information, resulting in suboptimal performance when directly applied to fault diagnosis. To address this issue, the entire frequency spectrum is first partitioned into several frequency bands, with each frequency band corresponding to specific characteristic frequency ranges of mechanical vibrations.
To explore the statistical characteristics embedded in the frequency spectrum, the spectrum is partitioned into H frequency bands, from each of which a 6-dimensional higher-order frequency-domain statistical feature set is sequentially extracted. The mathematical equations of these statistical features are provided in Table 1. Here, denotes the sub-band index, and represents the frequency index within each sub-band, where and correspond to the lower- and upper-frequency bounds, respectively.

Table 1.
Frequency-domain multi-order statistics incorporating multidimensional features of faults.
Table 1.
Frequency-domain multi-order statistics incorporating multidimensional features of faults.
| Frequency-Domain Statistic | Equations | Multidimensional Features of Faults | |
|---|---|---|---|
| Frequency centroid (FC): | (7) | Reflects the frequency position of fault energy concentration. | |
| Root mean square (RMS): | (8) | Quantifies the energy intensity of fault signals. | |
| Standard deviation (STD): | (9) | Measures the dispersion degree of fault frequencies. | |
| Variance (VAR): | (10) | Quantifies the overall scale of frequency fluctuations. | |
| Skewness (SKE): | (11) | Characterizes the symmetry features of the fault spectrum. | |
| Kurtosis (KUR): | (12) | Captures the features of fault impact components. | |
Using the statistical parameters extracted from each frequency band of the fault signal, the multivariate matrix is constructed according to Equation (13). Similarly, the multivariate matrix is derived for the reference signal. The construction principle of the multivariate matrix, as shown in Figure 2.
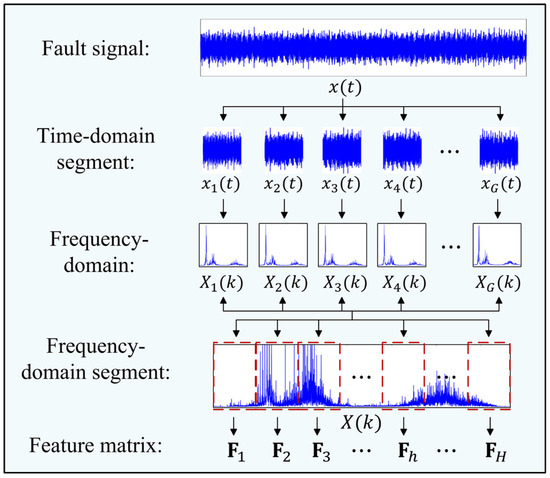
Figure 2.
Schematic diagram of multivariate-matrix construction.
3.1.2. Filtering Criteria
KPCA represents a nonlinear extension of conventional Principal Component Analysis (PCA). Its fundamental principle involves mapping the original data into a high-dimensional feature space via kernel functions, followed by PCA implementation in this transformed space, thereby achieving dimensionality reduction and feature extraction for nonlinear datasets. PCA can only extract linear principal components, whereas bearing-fault signals often contain nonlinear characteristics, which may lead to information loss. KPCA utilizes kernel functions to map features into a high-dimensional space, achieving linear separability of nonlinear features. It exhibits higher sensitivity to higher-order statistics, making it suitable for early weak-fault detection [20].
KPCA was performed on the multivariate matrix to reduce information redundancy. Given the dimensional heterogeneity among different order frequency-domain statistics, Z-score standardization was applied to the multivariate matrix to prevent certain parameters from dominating subsequent analyses. This standardization process ensures that each feature dimension has zero mean and unit variance. Following standardization, the kernel matrix was computed. The selection of kernel function type determines the approach to nonlinear mapping of the data. For the ith and jth row vectors ( and ) of the multivariate matrix, nonlinear mapping was conducted using the Gaussian kernel function, as defined in Equation (14):
where represents the Euclidean norm and denotes the bandwidth parameter of the Gaussian kernel. To satisfy the zero-mean constraint of the data, the kernel matrix was centralized following Equation (9).
where denotes the centering matrix, with representing the G×G identity matrix and indicating the matrix of all ones.
The centered kernel matrix was subjected to eigenvalue decomposition, satisfying
where with representing the eigenvalues, and denoting the orthogonal eigenvector matrix. The magnitude of each eigenvalue reflects the variance contribution along its corresponding principal-component direction. Larger variance indicates richer information contained in the principal component. To extract dominant features, the eigenvalues were sorted in descending order, while synchronously rearranging the column order of the eigenvector matrix V to maintain correspondence. Each eigenvector was then normalized according, to Equation (17).
where denotes the gth eigenvector in the eigenvector matrix and is the corresponding eigenvalue. For the multivariate matrices of the fault and reference signals, the above steps are followed to obtain their respective first eigenvalues.
We assume that the first eigenvalues obtained through KPCA for the multivariate matrices of the fault and reference signals in a specific frequency band are and , respectively. According to Equation (18), a distance metric is defined using these eigenvalues to quantify the deviation between the faulty and normal states in the principal-component space for the corresponding frequency band:
The difference in the primary principal-component’s variance contribution between the fault and reference signals is quantified by directly computing the deviation between their corresponding first eigenvalues ( and ). Since the eigenvalues represent the variance magnitude along their respective principal directions, this distance metric effectively captures the significance of feature variations induced by bearing condition changes.
When analyzing spectral feature differences using the distance metric, an appropriate distance threshold must be selected to determine whether the target sub-band corresponds to a fault state. The threshold criterion is based on the statistical assumption that eigenvalue distances follow a normal distribution, employing the mean plus standard deviation shown in Equation (19) as the threshold.
where represents the mean distance difference of eigenvalues within each divided sub-frequency band, and denotes the standard deviation. is an adjustable scaling factor. When the fault characteristics are relatively weak, the scaling factor can be reduced to accommodate early-stage weak faults in bearings. Conversely, when the fault characteristics are relatively strong, the scaling factor can be increased.
Based on Equation (20), the filter function is defined. If the distance exceeds the threshold, it indicates a significant difference between the fault and the reference signal within this frequency band, suggesting that the band corresponds to a fault-related component and should be retained. Conversely, if the distance is less than or equal to the threshold, it implies that the fault and the reference signal exhibit similarity, meaning the band corresponds to normal vibration or background noise, and should be filtered out. Statistical filtering principle, as shown in Figure 3.
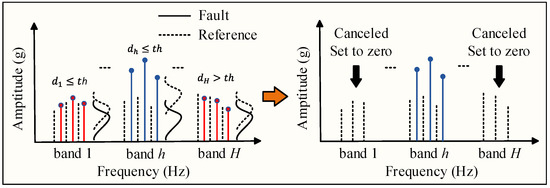
Figure 3.
The statistical filtering principle.
After the aforementioned processing, the fault signal can be effectively filtered. Subsequently, the frequency-domain signal is transformed back into the time domain via the IFFT, yielding the filtered signal.
3.2. Hilbert Differential Teager Energy Operator
After the aforementioned processing, most of the background noise in the bearing-vibration signal can be effectively suppressed. However, unavoidable in-band noise still remains [21,22]. To address this issue, this paper employs the HDTEO as a post-processing step on the filtered signal to further suppress residual noise and enhance fault features. The conventional TEO, originally proposed by Teager, is a nonlinear tracking operator designed for analyzing the energy of narrowband signals. It effectively tracks the instantaneous energy of a signal and possesses a wide demodulation bandwidth, enabling it to monitor the characteristic frequency peaks of bearing faults [23,24]. The TEO principle is shown in Figure 4. For a continuous signal , the energy operator is defined as follows:
where and represent the first and second temporal derivatives of the signal , where denotes the time variable.
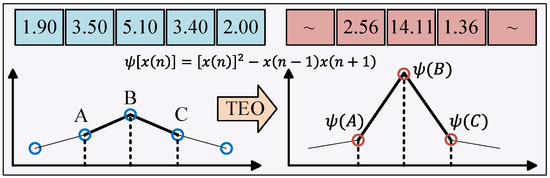
Figure 4.
The TEO principle.
For discrete-time signals, the derivatives are estimated using the forward-difference method in Equation (23), thereby yielding the discrete form of the energy operator:
The continuous form of the energy operator relies on the first and second derivatives of the signal. However, for discrete signals, derivatives can only be approximated using finite differences. Since the forward-difference scheme is a one-sided approximation, it introduces amplitude bias, leading to inaccurate energy estimation. Consequently, the actual value of deviates significantly from its theoretical counterpart, thereby degrading demodulation accuracy. To address this issue, an improved TEO algorithm must be developed.
The symmetric-difference method can effectively smooth sampled signals while performing signal filtering based on the symmetric distribution of sampling points in the difference sequence. First, the forward-difference scheme in Equation (23) is replaced with the symmetric-difference method for derivative estimation.
The aforementioned difference sequence can effectively smooth the original discrete signal, thereby enhancing demodulation accuracy.
Furthermore, the concept of the analytic signal is introduced based on the central finite difference scheme. According to analytic signal theory, the analytic representation of a signal can characterize its features through amplitude demodulation and instantaneous frequency. The analytic signal is defined as
where denotes the Hilbert transform of .
The analytic energy operator is defined as
Substituting Equation (24) into Equation (27) yields the symmetric-difference analytic energy operator:
where represents the Hilbert transform.
A comparative analysis of bearing-fault vibration signals processed by HDTEO, conventional TEO, and symmetric-difference Teager energy operator (DTEO) is presented in Figure 5. The continuous red shaded areas represent the extent to which the fault signal is affected by noise, with the height indicating the magnitude of the influence. The discontinuous red shaded areas represent the impulse intensity, where a greater distance from the continuous red shaded areas indicates stronger impulse intensity. Figure 5b displays the signal processed by TEO, where the fault impulses are enhanced relative to the background noise, but their amplitudes are attenuated. Figure 5c illustrates the signal processed by DTEO, showing significant amplification of the impulses, albeit with an asymmetric waveform. Figure 5d demonstrates the signal processed by HDTEO, in which the fault impulse amplitudes are enhanced compared to the original, while background noise is effectively suppressed. Consequently, HDTEO is adopted in this study for feature enhancement of fault signals after MSF processing.
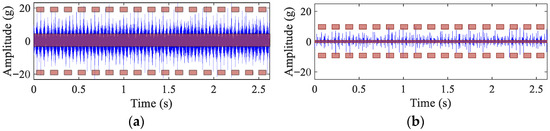
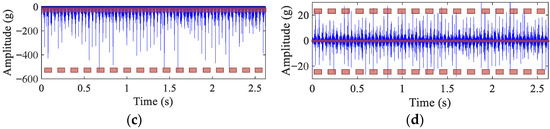
Figure 5.
Different TEO methods are used to deal with the bearing-vibration signal: (a) the original vibration signal; (b) TEO; (c) DTEO; (d) HDTEO.
4. Experimental Study
4.1. A Study of the Public Dataset of Rolling Bearings
4.1.1. Signal Description
In this study, the public dataset of rolling bearings at Xi’an Jiaotong University (XJTU) was selected to verify the validity of the proposed MS-HDTEO method. The dataset is collected in the rolling-bearing accelerated life test platform shown in Figure 6, which consists of AC motors, motor speed controllers, rotating shafts, support bearings, a hydraulic loading system, and test bearings, etc. The platform can carry out accelerated life tests of various types of rolling bearings or plain bearings under different working conditions, and obtain a full life-cycle test dataset of the test bearings. For a detailed description of the platform, please refer to the following literature [25]. In the accelerated degradation test, three different operating conditions were set up, and five bearings were tested in each condition. The operating conditions included the following: (1) 2100 rpm (35 Hz) and 12 kN; (2) 2250 rpm (37.5 Hz) and 11 kN; and (3) 2400 rpm (40 Hz) and 10 kN. The vibration signals were generated by mounting the bearing housings in 90° positions, i.e., one was mounted on the horizontal axis and the other on the vertical axis. The sampling frequency was 25.6 kHz. A total of 32,768 data sets (1.28 s) were recorded for each sample, with a sampling period of one minute.
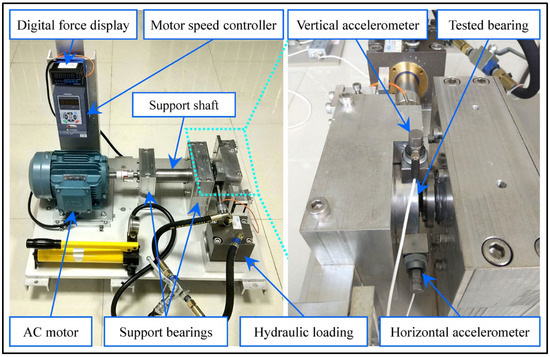
Figure 6.
Bearing accelerated life test platform.
The data package contains run-to-fault data for 15 rolling bearings. The vibration signals in the Bearing 1_1 file at 2100 rpm (35 Hz) and 12 kN were selected for this study, of which there are a total of 123 data. The signals before the 75th are normal, and those after are early weak-fault conditions. The outer ring of the bearing fails after the 75th datum. In this study, the vibration signal in column one of the 65th data set is used as the early weak-fault signal, and column one of the 1st data set is used as the reference signal. Table 2 presents the specific parameters of the test bearings used in the experimental platform with public datasets, where the model is LDK UER204. This data set’s theoretical outer-ring fault characteristic frequency under this condition is 107.91 Hz. Figure 7 shows the selected time-domain signals and the corresponding frequency spectra. Figure 7a shows a weak early fault pulse in the rolling bearing. Compared with the reference signal spectrum given in Figure 7d, the fault signal spectrum in Figure 7b has a small difference, which makes it impossible to locate the fault-sensitive frequency band accurately.
Table 2.
LDK UER204 Bearing Parameters.
Figure 7.
Rolling bearing-fault signal: (a) time-domain waveform of the fault signal; (b) fault signal spectrum; (c) time-domain waveform of the reference signals; (d) reference signal spectrum.
Figure 8 shows the envelope spectrum corresponding to the fault signal of the outer race of the rolling bearing (in this paper, the amplitude of the envelope spectrum is normalized to [0, 1], and the display range of the frequency axis is set to [1, 400] Hz), from which it is not possible to accurately extract the outer-race fault characteristic frequency. It is necessary to filter it to reduce the irrelevant component interference and enhance the fault characteristics.
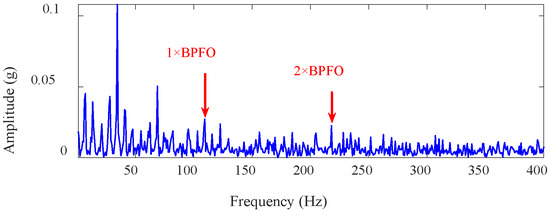
Figure 8.
Envelope spectrum of early weak-fault signals in rolling bearings.
4.1.2. Multi-Order Statistics in the Frequency Domain
In this study, the proposed MS-HDTEO method sets the number of time-domain segments to 8 and the number of frequency-domain segments to 15, and under this parameter configuration, the frequency band bandwidth is 852.34 Hz. Considering the weak nature of the fault features, the value of α is chosen to be 1. To validate the significant advantage of the constructed multivariate matrices for the distance metrics over the single statistic, the extracted frequency-domain multi-order statistics are analyzed separately. Figure 9 presents the distribution characteristics of the six frequency-domain statistics extracted from the fault signals in each frequency band. The results show that band 1 has the highest RMS, SKE, and KUR values, band 4 has the highest FC values, and band 12 has the highest STD and VAR. Based on a single statistical metric, this produces multiple results, making it difficult to accurately characterize fault-sensitive frequency bands.
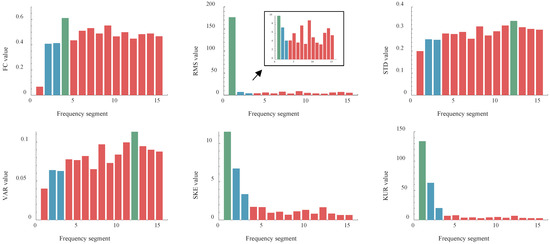
Figure 9.
Multi-order statistics in the frequency-domain for each frequency band.
Figure 10a shows the eigenvalue distances of each frequency band calculated using the proposed method, and the results show that the fault-sensitive frequency bands 2 and 3 are effectively identified with significantly higher eigenvalue distances than the other frequency bands. Correspondingly, Figure 10b shows the spectrum difference between the fault and the reference signal, with the frequency range of [853.13, 1705.47] Hz for the selected band 2 and [1706.25, 2558.59] Hz for band 3. Figure 10c gives the determination of the optimal distance threshold of 0.2722 by calculating the mean and standard deviation of the eigenvalue distances, which achieves the precise localization of the fault-sensitive frequency band.
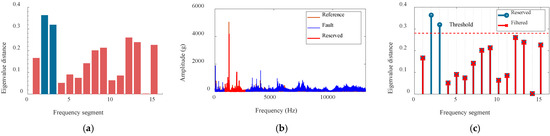
Figure 10.
Intermediate implementation of the proposed method: (a) distribution of eigenvalue differences in each frequency band; (b) spectrum differences; (c) distance thresholding to localize the selected frequency band.
4.1.3. Study Results
Based on the intermediate process analysis conducted using the proposed MS-HDTEO method, the determined distance threshold was applied to implement bandpass filtering, thereby obtaining the time-domain waveforms and envelope spectrum results of the fault signal after MSF and after MS-HDTEO. Figure 11a presents the time-domain waveform of the fault signal after applying the proposed MSF. Figure 11b shows the time-domain waveform of the fault signal after applying the proposed MS-HDTEO. Figure 11c presents the envelope spectrum obtained from the filtered signal without HDTEO processing, where the dominant characteristic frequency is visible. The extracted outer-race fault characteristic frequency is 109.4 Hz, which closely matches the theoretical value, thereby validating the effectiveness of the proposed MSF method in bearing-fault diagnosis. However, the second harmonic component appears relatively weak, due to interference from other frequency components, necessitating further feature enhancement. Figure 11d displays the envelope spectrum results after applying HDTEO processing to the filtered signal. In this case, the amplitudes of both the dominant outer-race fault characteristic frequency and its second harmonic component are significantly enhanced, demonstrating effective fault feature amplification.
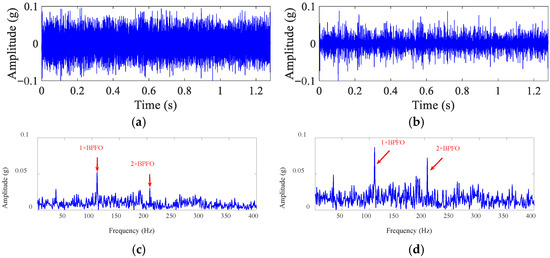
Figure 11.
The experimental results obtained using the proposed method: (a) time-domain waveform of the fault signal after MSF; (b) time-domain waveform of the fault signal after MS-HDTEO; (c) envelope spectrum of the fault signal after MSF; (d) envelope spectrum of the fault signal after MS-HDTEO.
To validate the effectiveness of the proposed method in feature enhancement and diagnosis of early fault vibration signals in rolling bearings, a comparative study was conducted using six commonly employed signal processing techniques for bearing-vibration analysis. The methods and their key parameter configurations are described as follows: (1) High-pass filter (HPF): a Butterworth high-pass filter was applied with a cutoff frequency of 1500 Hz and a filter order of 4; (2) Empirical mode decomposition (EMD): the decomposition level was set to 10, and the IMF component with the highest kurtosis and correlation coefficient was selected as the filtered signal; (3) Variational mode decomposition (VMD): the number of modes was set to 10, with zero noise tolerance and a bandwidth constraint of 1000. The IMF component exhibiting the highest kurtosis and correlation coefficient was retained for further analysis; (4) Singular value decomposition (SVD): a Hankel matrix was constructed from the fault signal, with a window length of 512 and a sliding step of 128. The signal was reconstructed using the first three singular values; (5) Fast kurtogram (FK): the decomposition level was set to 10, employing a recursive frequency band partitioning approach; and (6) Statistical hypothesis testing filter (SHF): a significance level of 0.05 was adopted, and the frequency domain was divided into 15 segments, for analysis. To ensure a rigorous comparison, all methods were applied to preprocess the original fault signal, followed by HDTEO processing of the filtered signals for subsequent evaluation.
Figure 12 displays the envelope spectrum of rolling-bearing outer-race fault signals obtained by other methods. Compared with the proposed MS-HDTEO approach in this study, existing methods exhibit significantly reduced amplitudes at both the outer-race fault characteristic frequency and their second harmonic, making accurate fault-type identification challenging. This demonstrates that most conventional methods possess inherent limitations in feature-extraction capability when diagnosing incipient weak faults. In contrast, the proposed method effectively characterizes subtle feature differences between fault and reference signal spectra, through the integration of multiscale frequency-domain statistics of multidimensional fault characteristics. By incorporating HDTEO technology, it further substantially enhances the precision of fault feature extraction. Consequently, the proposed methodology enables reliable identification of bearing-fault types during early-stage development, thereby achieving accurate diagnosis of incipient weak faults in rolling bearings.
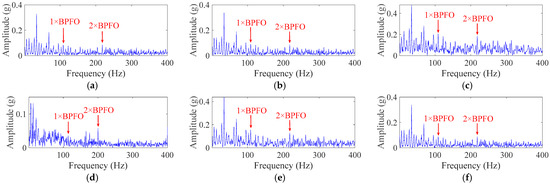
Figure 12.
Compare the envelope spectrum of fault signals after processing with other methods: (a) HPF; (b) EMD; (c) VMD; (d) SVD; (e) FK; (f) SHF.
4.2. Validation of Bearing Test Platform Datasets
4.2.1. Test Platform and Signal Description
In the validation of the bearing public dataset, the vibration signals of the selected bearings exhibit early weak-fault characteristics. The weak-fault features exist not only in the early stage of the bearings, but also in the strong background noise, and the fault features will still behave weakly when disturbed by the strong background noise. To verify that the proposed MS-HDTEO can suppress the noise and extract the weak-fault features, a rotating mechanical equipment bearing-fault diagnosis test platform is constructed as shown in Figure 13, with a rotational speed of 1500 rpm. The main structural components include rotating motors, couplings, bearings, rotors, etc. The testbed is deployed with adjustable-speed rotary motors, couplings, bearings, rotors, and so on. The test platform deploys an adjustable-speed rotating motor that generates wideband mechanical noise, due to unbalanced vibration transmitted by a rigidly connected coupling. To test the single point of fault of the bearings, square grooves are machined on the outer race, inner race, and roller, using wire-cutting technology.
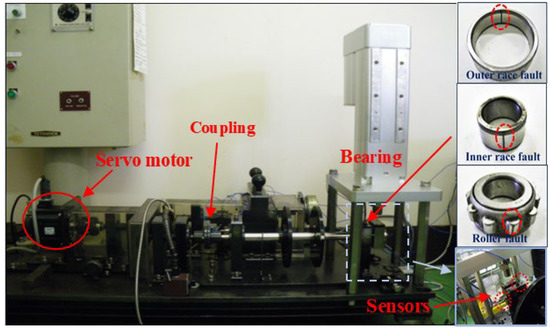
Figure 13.
Bearing-fault test platform and fault types.
The specific parameters of the bearings used in this experiment are shown in Table 3, and the number of rolling bodies is 10 in the outer-race fault experiment and 11 in the roller and inner-race fault experiment. The calculated theoretical value of the bearing outer-race fault characteristic frequency is 99.8 Hz, the theoretical value of the inner-race fault characteristic frequency is 165.2 Hz, and the theoretical value of the roller-fault characteristic frequency is 118.9 Hz. Within the error tolerance, the type of fault can be recognized by comparing the fault characteristic frequency extracted from the experimental results and the theoretical fault characteristic frequency.
Table 3.
Specific parameters of the bearing.
The bearing is located in a removable base, and an accelerometer is used to acquire the vibration signal. The sampling frequency is 100 kHz, the number of sampling points is 262,144, and the total sampling time is about 2.6 s. The reference signal is acquired in the health condition of the bearing, and all other conditions are kept constant. Figure 14 shows the reference signal and the corresponding frequency spectrum.
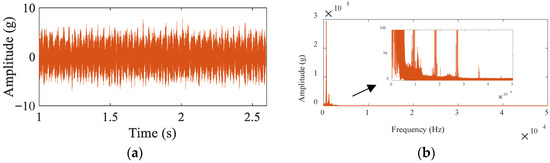
Figure 14.
Acquired bearing health vibration signals: (a) time-domain waveform; (b) spectrum.
4.2.2. Bearing Outer-Race Fault Diagnosis
The MS-HDTEO method proposed in this paper is used to filter and enhance the signal, and the number of time-domain segments is set to 16, the number of frequency-domain segments is set to 65, and the value of is selected as 3.
Figure 15a shows the spectrum of the fault signal, which is less different from the spectrum of the reference signal demonstrated in Figure 14b. The probability density analysis is performed by extracting the first eigenvalue of the multivariate matrix, which combines the multidimensional features of the fault and the reference signal. The probability density curves shown in Figure 15b show that the first eigenvalue of the frequency bands of the fault and the reference signal are significantly different. Figure 15c shows that the distance threshold of the eigenvalues determined based on the proposed method is 1.05. The filtering results in a fault-sensitive frequency band of 56, with a frequency center of 42,681.69 Hz and a frequency range of [42,297.36, 43,066.02] Hz.
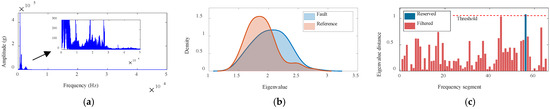
Figure 15.
Frequency band and characterization of the signal: (a) outer-race fault signal spectrum; (b) frequency band eigenvalue probability density; (c) distance threshold to locate the fault-sensitive frequency band.
Based on the experimental results of the above intermediate process, the IFFT is performed on the filtered spectrum to reconstruct the time-domain signal, and then the envelope spectral analysis is carried out to extract the outer-race fault characteristic frequency. A segment of the signal from 0–0.6 s was extracted for visualization. Figure 16a presents the outer-race fault vibration signal collected based on the bearing test platform, in which the fault impulse is overwhelmed by the strong background noise. Figure 16d shows the corresponding envelope spectrum, in which the fault characteristics are weak and there are a large number of irrelevant components interfering near the characteristic frequency of the outer-race fault, which leads to the inability to accurately identify the type of bearing fault. Figure 16c demonstrates the filtered signal after HDTEO processing, and, compared with the signal without HDTEO processing in Figure 16b, the background noise is significantly suppressed, the SNR is improved, and the fault impulse characteristics are visible. Correspondingly, in the envelope spectrum shown in Figure 16f, the amplitude of the characteristic frequency component of the outer-race fault and its harmonic components is significantly higher than that of the background noise component. Using the method proposed in this paper, the outer-race fault characteristic frequency extracted from the envelope spectrum is close to the theoretical value, which can be accurately judged as the outer-race fault.
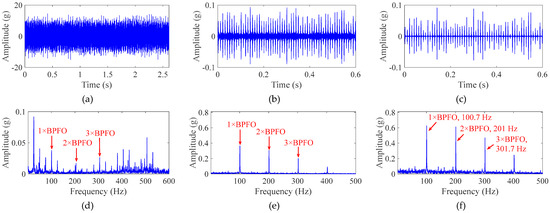
Figure 16.
Bearing outer-race fault signal: (a) original fault signal; (b) MSF-processed filtered signal; (c) MS-HDTEO-processed filtered signal; (d) envelope spectrum of original fault signal; (e) envelope spectrum of MSF-processed filtered signal; (f) envelope spectrum of MS-HDTEO-processed filtered signal.
4.2.3. Bearing Roller and Inner-Race Fault Diagnosis
In this section, the proposed MSF-HETEO method is used to process the fault vibration signals of roller and inner race collected from the bearing test platform, to verify the diagnostic effectiveness of the method on two other common fault types of bearings. Figure 17 and Figure 18 show the intermediate process based on the proposed methodology. The results show that the eigenvalue distances can characterize the fault-sensitive frequency bands significantly, and the determined distance thresholds precisely locate the target frequency bands. Combined with the ablation experiments, it can be seen from the results of Figure 19 and Figure 20 that the roller fault and inner-race fault characteristic frequencies extracted from the envelope spectrum are close to the theoretical values. In conclusion, the MS-HDTEO method proposed in this paper can effectively realize the diagnosis of bearing roller and inner-race fault.
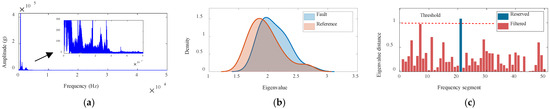
Figure 17.
Frequency band and characterization of the signal: (a) roller-fault signal spectrum; (b) frequency band eigenvalue probability density; (c) distance threshold to locate the fault-sensitive frequency band.
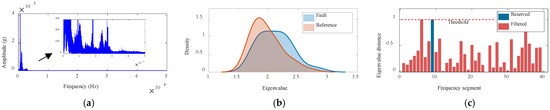
Figure 18.
Frequency band and characterization of the signal: (a) inner-race fault signal spectrum; (b) frequency band eigenvalue probability density; (c) distance threshold to locate the fault-sensitive frequency band.
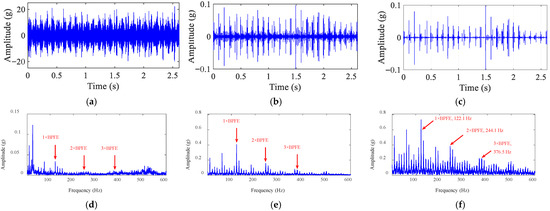
Figure 19.
Bearing roller-fault signal: (a) original fault signal; (b) MSF-processed filtered signal; (c) MS-HDTEO-processed filtered signal; (d) envelope spectrum of original fault signal; (e) envelope spectrum of MSF-processed filtered signal; (f) envelope spectrum of MS-HDTEO-processed filtered signal.
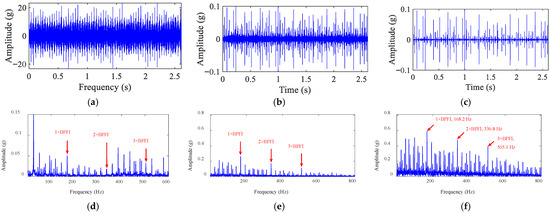
Figure 20.
Bearing inner-race fault signal: (a) original fault signal; (b) MSF-processed filtered signal; (c) MS-HDTEO-processed filtered signal; (d) envelope spectrum of original fault signal; (e) envelope spectrum of MSF-processed filtered signal; (f) envelope spectrum of MS-HDTEO-processed filtered signal.
5. Comparative Experiments
To highlight the superiority of the proposed method, spectral impairment (SII) and spectral variation (SVI) indices are designed in Equations (28) and (29) to evaluate and compare the effects of various methods [26]. In the envelope spectrum, the fault-characteristic frequency and its harmonic components become larger. As a result, SII and SVI are larger compared to the state-of-health signal. Experiments were performed using the following conditions: the Inter Core i7-11800H processor, 64-bit, 16-GB memory, and the MATLAB R2018a.
is the number of harmonics in the spectrum signal, is the fault characteristic frequency, is the frequency of the spectrum, is the value of the spectrum, and is set to 5 Hz. SII and SVI can evaluate the effectiveness of the method. A large value results in improved feature enhancement and SNR effect. The fault signals of the bearing outer race collected on the bearing experimental platform are used to verify the outstanding performance of the proposed method and other methods in noise suppression and feature enhancement. All configurations are the same as in Section 4.1.3. Results are shown in Table 4. Among the comparative experiments, SII and SVI of the proposed method have the largest values, indicating that the proposed method has the best performance. Although the proposed method is not the best in terms of runtime performance, it is similar in time to some of the other methods. But this phenomenon does not cause a major concern.
Table 4.
Performance comparison of different methods.
Based on the above analysis, the MS-HDTEO can significantly remove the background noise, suppress the residual noise, improve the SNR, and enhance the fault signal feature.
6. Conclusions
In this paper, an innovative method for characteristic enhancement and diagnosis of weak-fault signals of bearings based on MS-HDTEO is proposed. A multi-dimensional feature characterization method is proposed, which constructs a frequency-domain multivariate feature matrix by extracting the multi-order frequency-domain statistics of fault and reference signals, and uses KPCA to convert the weak spectral difference into a feature distance measure. Further, an adaptive selection method based on a dynamic threshold is proposed. By suggesting statistical decision-making criteria, the accurate localization of fault-sensitive frequency bands is realized. Finally, in terms of feature enhancement, the filtered signal is treated with HDTEO to solve the problem of in-band noise residue in the existing statistical filtering methods; the residual noise can be effectively suppressed, and the weak-fault characteristics are further enhanced. Based on the verification of the public dataset and the bearing-fault diagnosis test platform dataset, the results show that the proposed method can effectively enhance the significance of fault characteristics.
In future work, this study will focus on reducing the computational complexity of the proposed method in the face of a large number of frequency-domain segments and the adaptive adjustment of parameters, under variable conditions. The application prospect of the proposed method to other rotating machinery will be explored.
Author Contributions
Conceptualization, Z.L.; data curation, P.C.; formal analysis, R.C.; investigation, Z.Y.; methodology, Z.L., R.C. and P.C.; project administration, Z.L. and X.S.; resources, Z.L.; software, R.C.; supervision, X.S.; validation, R.C. and X.S.; writing—original draft, R.C.; writing—review and editing, Z.L., Z.Y. and X.S. All authors have read and agreed to the published version of the manuscript.
Funding
This research was supported by National Natural Science Foundation of China (Grant Nos. 52201355, 52401418).
Data Availability Statement
Data are unavailable due to privacy or ethical restrictions.
Conflicts of Interest
The authors declare no conflicts of interest.
References
- Ma, S.; Han, Q.; Chu, F. Sparse representation learning for fault feature extraction and diagnosis of rotating machinery. Expert Syst. Appl. 2023, 232, 120858. [Google Scholar] [CrossRef]
- Kannan, V.; Zhang, T.; Li, H. A review of the intelligent condition monitoring of rolling element bearings. Machines 2024, 12, 484. [Google Scholar] [CrossRef]
- Peng, C.; Wei, J.; Liu, K.; Cao, H. Dynamic characteristics of angular contact ball bearings with mild defect on outer raceway. Eng. Fail. Anal. 2025, 178, 109721. [Google Scholar] [CrossRef]
- Rui, L.; Ding, X.; Wu, S.; Wu, Q.; Shao, Y. Signal processing collaborated with deep learning: An interpretable FIRNet for industrial intelligent diagnosis. Mech. Syst. Signal Process. 2024, 212, 111314. [Google Scholar] [CrossRef]
- Zaman, W.; Siddique, M.F.; Khan, S.U.; Kim, J.M. A new dual-input CNN for multimodal fault classification using acoustic emission and vibration signals. Eng. Fail. Anal. 2025, 179, 109787. [Google Scholar] [CrossRef]
- Hou, B.; Feng, X.; Kong, J.Z.; Tsui, K.L.; Wang, D. Optimized weights spectrum autocorrelation: A new and promising method for fault characteristic frequency identification for rotating machine fault diagnosis. Mech. Syst. Signal Process. 2023, 191, 110200. [Google Scholar] [CrossRef]
- Touati, K.O.M.; Boudiaf, M.; Mazouz, L.; Cherroun, L. Efficient hybrid strategy based on FFT and fuzzy logic techniques applied to fault diagnosis in power transmission line. Soft Comput. 2024, 28, 8911–8930. [Google Scholar] [CrossRef]
- Liu, R.; Ding, X.; Liu, S.; Zheng, H.; Xu, Y.; Shao, Y. Knowledge-informed FIR-based cross-category filtering framework for interpretable machinery fault diagnosis under small samples. Reliab. Eng. Syst. Saf. 2025, 254, 110610. [Google Scholar] [CrossRef]
- Lin, H.; Wu, F.; He, G. Rolling bearing fault diagnosis using impulse feature enhancement and nonconvex regularization. Mech. Syst. Signal Process. 2020, 142, 106790. [Google Scholar] [CrossRef]
- Chen, Z.; Guo, L.; Gao, H.; Yu, Y.; Wu, W.; You, Z.; Dong, X. A fault pulse extraction and feature enhancement method for bearing fault diagnosis. Measurement 2021, 182, 109718. [Google Scholar] [CrossRef]
- Gao, K.; Xu, X.; Li, J.; Jiao, S.; Shi, N. Research on feature enhancement method of weak fault signal of rotating machinery based on adaptive stochastic resonance. J. Mech. Sci. Technol. 2022, 36, 553–563. [Google Scholar] [CrossRef]
- Shi, P.; Li, M.; Zhang, W.; Han, D. Weak signal enhancement for machinery fault diagnosis based on a novel adaptive multi-parameter unsaturated stochastic resonance. Appl. Acoust. 2022, 189, 108609. [Google Scholar] [CrossRef]
- Liu, Z.; Jin, Y.; Zuo, M.J.; Peng, D. ACCUGRAM: A novel approach based on classification to frequency band selection for rotating machinery fault diagnosis. ISA Trans. 2019, 95, 346–357. [Google Scholar] [CrossRef] [PubMed]
- Guo, J.; Liu, Y.; Yang, R.; Sun, W.; Xiang, J. Differgram: A convex optimization-based method for extracting optimal frequency band for fault diagnosis of rotating machinery. Expert Syst. Appl. 2024, 245, 123051. [Google Scholar] [CrossRef]
- Song, L.Y.; Wang, H.Q.; Gao, J.J.; Yang, J.F.; Liu, W.B.; Chen, P. Application of statistics filter method and clustering analysis in fault diagnosis of roller bearings. J. Phys. Conf. Ser. 2012, 364, 012024. [Google Scholar] [CrossRef]
- Zeng, M.; Yang, Y.; Zheng, J.; Cheng, J. Maximum margin classification based on flexible convex hulls for fault diagnosis of roller bearings. Mech. Syst. Signal Process. 2016, 66, 533–545. [Google Scholar] [CrossRef]
- Rostaghi, M.; Khatibi, M.M.; Ashory, M.R.; Azami, H. Bearing fault diagnosis using refined composite generalized multiscale dispersion entropy-based skewness and variance and multiclass FCM-ANFIS. Entropy 2021, 23, 1510. [Google Scholar] [CrossRef]
- Liu, D.; Cui, L.; Wang, H. Rotating machinery fault diagnosis under time-varying speeds: A review. IEEE Sens. J. 2023, 23, 29969–29990. [Google Scholar] [CrossRef]
- Tang, H.; Liao, Z.; Ozaki, Y.; Chen, P. Stepwise intelligent diagnosis method for rotor system with sliding bearing based on statistical filter and stacked auto-encoder. Appl. Sci. 2020, 10, 2477. [Google Scholar] [CrossRef]
- Fang, L.; Liu, S.; Cheng, F. Early micro-short circuit fault diagnosis of lithium battery pack based on Pearson correlation coefficient and KPCA. Comput. Electr. Eng. 2024, 118, 109481. [Google Scholar] [CrossRef]
- Chen, B.; Cheng, Y.; Zhang, W.; Gu, F.; Mei, G. Optimal frequency band selection using blind and targeted features for spectral coherence-based bearing diagnostics: A comparative study. ISA Trans. 2022, 127, 395–414. [Google Scholar] [CrossRef]
- Xu, H.; Zhou, S. Maximum L-Kurtosis deconvolution and frequency-domain filtering algorithm for bearing fault diagnosis. Mech. Syst. Signal Process. 2025, 223, 111916. [Google Scholar] [CrossRef]
- Xu, B.; Zhou, F.; Li, H.; Yan, B.; Liu, Y. Early fault feature extraction of bearings based on Teager energy operator and optimal VMD. ISA Trans. 2019, 86, 249–265. [Google Scholar] [CrossRef]
- Gu, R.; Chen, J.; Hong, R.; Wang, H.; Wu, W. Incipient fault diagnosis of rolling bearings based on adaptive variational mode decomposition and Teager energy operator. Measurement 2020, 149, 106941. [Google Scholar] [CrossRef]
- Wang, B.; Lei, Y.; Li, N.; Li, N. A hybrid prognostics approach for estimating remaining useful life of rolling element bearings. IEEE Trans. Reliab. 2018, 69, 401–412. [Google Scholar] [CrossRef]
- Liao, Z.; Song, X.; Jia, B.; Chen, P. Bearing fault feature enhancement and diagnosis based on statistical filtering and 1.5-dimensional symmetric difference analytic energy spectrum. IEEE Sens. J. 2021, 21, 9959–9968. [Google Scholar] [CrossRef]


Disclaimer/Publisher’s Note: The statements, opinions and data contained in all publications are solely those of the individual author(s) and contributor(s) and not of MDPI and/or the editor(s). MDPI and/or the editor(s) disclaim responsibility for any injury to people or property resulting from any ideas, methods, instructions or products referred to in the content. |
© 2025 by the authors. Licensee MDPI, Basel, Switzerland. This article is an open access article distributed under the terms and conditions of the Creative Commons Attribution (CC BY) license (https://creativecommons.org/licenses/by/4.0/).