Abstract
This paper addresses the challenges of anomaly detection in industrial components by proposing a two-stage deep-learning approach combining semantic segmentation and knowledge distillation. Traditional methods, such as manual inspection and machine vision, face limitations in efficiency and accuracy when dealing with complex defects. To overcome these issues, we first introduce a small-sample semantic segmentation model based on a U-Net architecture, enhanced with an Adaptive Multi-Scale Attention Module (AMAM) and gate attention mechanisms to improve edge detection and multi-scale feature extraction. The second stage employs a knowledge distillation-based anomaly detection model, where a pre-trained teacher network (WideResNet50) extracts features, and a student network reconstructs them, with differences indicating anomalies. A Transformer-based feature aggregation module further refines the process. Experiments on the MVTec dataset demonstrate superior performance, with the segmentation model achieving 96.4% mIoU and the anomaly detection model attaining 98.3% AUC, outperforming State-of-the-Art methods. Under an extremely small-sample regime of merely 27 training images, the proposed model still attains a mIoU exceeding 94%. The two-stage approach significantly enhances detection accuracy by reducing background interference and focusing on localized defects. This work contributes to industrial quality control by improving efficiency, reducing false positives, and adapting to limited annotated data.
1. Introduction
In the contemporary globalized industrial production environment, as the scale of production continues to expand and technology becomes increasingly complex, quality control of industrial components has emerged as a crucial element in ensuring the stable operation of the entire production system. The quality of components directly affects the performance and reliability of products, which in turn influences the market competitiveness and economic benefits of enterprises. Therefore, efficient and accurate anomaly detection technologies are of paramount importance to modern industrial manufacturing [1]. Traditional component inspection methods primarily rely on manual visual inspection and basic machine vision techniques. These methods, when confronted with the growing production demands and the increasingly complex and diverse defects of components, gradually reveal their limitations.
Manual visual inspection is the earliest and most widespread method for component inspection [2,3]. Operators visually examine components to identify obvious defects. However, this method is inefficient and is susceptible to the effects of operator fatigue, subjective judgment, and differences in experience, leading to unstable and inaccurate inspection results. Moreover, for minute or concealed defects, manual visual inspection often fails to detect them. The development of machine vision technology has brought about certain improvements in component inspection. By employing cameras and image processing algorithms, machine vision systems are capable of automatically identifying and classifying defects in components [4,5]. Nevertheless, traditional machine vision systems still face challenges when dealing with complex defect features [6]. Additionally, machine vision systems typically require cumbersome parameter adjustments and algorithm optimizations for specific types of defects, lacking flexibility and generalization ability [7].
In recent years, deep-learning technologies have achieved remarkable success in the fields of image recognition, speech recognition, and natural language processing, providing new ideas and methods for solving complex problems. Deep-learning models, particularly Convolutional Neural Networks (CNNs), have demonstrated powerful capabilities in image feature extraction and classification [8]. Deep-learning models can automatically learn features from large amounts of image data without the need for manually designing complex feature extraction algorithms. This not only improves the efficiency of feature extraction but also enables the discovery of subtle features that are difficult to detect using traditional methods [9]. Through extensive training data, deep-learning models can learn the feature variations of components under different lighting conditions, angles, and backgrounds, thereby enhancing the model’s generalization ability and enabling more accurate identification of various anomalies in actual production environments [10]. Deep-learning models are capable of handling a variety of defect types, including minute cracks, surface scratches, and internal defects. Even for rare or complex defects, high detection accuracy can be achieved through appropriate data augmentation and model optimization [11]. With the advancement in hardware technologies, the inference speed of deep-learning models has been continuously improving, enabling real-time or near-real-time component inspection to meet the efficiency requirements of modern industrial production [12]. Beyond convolutional neural networks, recent studies have explored Transformer architectures—exemplified by Vision Transformer (ViT) [13] and its hierarchical variant Swin Transformer [14]—for anomaly detection in high-resolution industrial imagery. Their intrinsic global receptive fields facilitate the capture of long-range spatial dependencies, yet this advantage is often counterbalanced by a marked increase in computational demand. Concurrently, classical machine-learning paradigms, including support vector machines, random forests, and the isolation-forest algorithm [15], continue to demonstrate viability under low-sample regimes, particularly when feature dimensionality is modest and computational resources are constrained. Nevertheless, reliance on handcrafted feature engineering inherently limits their adaptability to the nuanced variability of complex industrial defects.
While deep learning has brought significant advancement to anomaly detection, several domain-specific challenges remain. First, high-quality defect annotations are scarce, especially for rare or subtle anomalies, resulting in severe data imbalance [16]. Second, the large intra-class variation in industrial textures and the small spatial extent of defects make it difficult for standard CNNs to capture discriminative features [17]. Third, most State-of-the-Art methods rely on massive computational resources, which hinders real-time deployment on resource-constrained shop-floor devices [18]. Finally, the black-box nature of deep networks complicates root-cause analysis and operator trust [19]. Recent works attempt to alleviate these issues via few-shot learning [20], knowledge distillation [21], and attention-based architectures [22], yet a comprehensive solution that simultaneously addresses data scarcity, computational efficiency, and interpretability in industrial anomaly detection is still lacking.
Deep-learning-based anomaly detection techniques for industrial components hold broad application prospects but also face numerous challenges. With the advancement of Industry 4.0, the development of intelligent manufacturing and the Industrial Internet of Things (IIoT) has imposed higher requirements on the quality control of components. Traditional inspection methods are no longer sufficient to meet the demands of modern industrial production, while deep-learning technologies offer new opportunities to address this issue. Research on deep-learning-based anomaly detection for industrial components can enhance detection efficiency and accuracy, reduce product defect rates, improve production efficiency, lower production costs, and strengthen the market competitiveness of enterprises. This paper proposes a deep-learning-based anomaly detection method for industrial components, with the following main contributions:
- Small-Sample Semantic Segmentation Model Based on Industrial Dataset: We employ deep-learning methods to achieve a comprehensive understanding of image content by integrating visual features across different scales and incorporating attention computation strategies. Specifically, the method utilizes hierarchical feature extraction techniques to capture diverse information ranging from local details to global structures, while establishing correlations among distant pixels through an attention weight allocation mechanism. This design not only enhances the model’s ability to represent multi-granular semantic features but also effectively suppresses the impact of local interference factors. To verify the effectiveness of the proposed method, a semantic segmentation benchmark dataset containing complex scenes was specifically constructed. Experimental results demonstrate that this approach significantly improves segmentation accuracy.
- Anomaly Detection Method Based on Knowledge Distillation: We design a cascaded knowledge transfer framework specifically for defect identification tasks in industrial images. The scheme consists of three key stages: First, a multi-level feature analysis of the input image is conducted, followed by optimization, integration, and dimensionality reduction of the features, and finally, high-quality reconstruction of the target image is achieved. In terms of implementation, a pre-trained teacher model serves as the backbone for feature extraction. The extracted visual features are then transformed into low-dimensional representations through a feature refinement module, which serves as the input signal for the reconstruction network. This architecture fully leverages the powerful feature representation capabilities of the pre-trained model, while the feature compression mechanism effectively enhances the efficiency and accuracy of anomaly detection.
- Two-Stage Anomaly Detection Method: We propose a two-stage detection method. In the first stage, a semantic segmentation algorithm is used to extract the target region from high-resolution input images. In the second stage, the cropped local images are fed into the defect identification model. This approach significantly reduces the texture complexity of the region to be inspected, thereby effectively improving the accuracy of defect identification. Specifically, the preliminary region segmentation step not only minimizes background interference but also enables the anomaly detection model to focus on subtle feature differences in the key areas, ultimately achieving a significant optimization of detection performance.
2. Related Work
2.1. Traditional Anomaly Detection Techniques
Traditional anomaly detection techniques primarily rely on the assessment of the physical properties of the objects under inspection. These techniques mainly include three forms: contact measurement, template-based comparison measurement, and non-contact measurement. Xu [23] proposed a point cloud measurement strategy based on contact probes for large-sized complex curved surface components and a discrete point measurement method for precision hole system components such as sensor mounting brackets. Zhang et al. [24] systematically compared the performance of commercial contact electronic extensometers and advanced video extensometers based on the Digital Image Correlation (DIC) method. Cheng et al. Sun et al. [25] summarized the main features of industrial CT technology and its applications in non-destructive testing. Lv et al. [26] proposed a line structured light calibration method suitable for on-site use, improved the system structure of phase profilometry, and analyzed calibration, image processing, and phase retrieval methods.
2.2. Statistics-Based Anomaly Detection Techniques
Statistics-based anomaly detection techniques represent an early-developed category of detection methods. These techniques primarily involve preprocessing and feature extraction of images of the objects under inspection, followed by analysis of the distribution of the extracted feature vectors to determine the presence of anomalies [27]. With the advancement in machine-learning technologies, feature extraction methods based on machine learning have emerged, such as Support Vector Machines (SVM), Random Forests, XGBoost, and LightGBM [28]. These methods have improved the accuracy of anomaly detection and have been widely applied. Despite the widespread application of statistics-based anomaly detection techniques in many fields, they also have certain limitations. For example, the assumptions about data distribution may not align with actual conditions, and they may not be sufficiently accurate for complex data structures and anomaly types. Additionally, when dealing with large-scale images, the feature vector extraction methods based on statistical models face significant computational challenges. With the development of machine-learning and deep-learning technologies, statistics-based anomaly detection techniques are increasingly being integrated with these new technologies to enhance the accuracy and robustness of anomaly detection.
2.3. Deep-Learning-Based Anomaly Detection Techniques
Machine-learning techniques have achieved significant results in the critical task of feature extraction for anomaly detection. Meanwhile, anomaly detection algorithms that have emerged from the field of deep learning are gradually gaining prominence and have become a highly promising and worthy research direction in contemporary times [29]. Jia et al. [30] proposed an anomaly detection method that combines supervised learning with various statistical approaches. Liu et al. [31] introduced a rail surface defect detection technique based on CNNs. In recent years, the emergence of unsupervised training methods that do not rely on labeled data has become the main developmental direction for anomaly detection. Unsupervised anomaly detection methods can primarily be categorized into approaches based on autoencoders [32,33,34,35], Generative Adversarial Networks (GANs) [36,37,38], and knowledge distillation models [39,40]. Varalakshmi et al. [33] explored the application of autoencoders in self-supervised learning within industrial environments, constructing and training a general time-convolutional network based on autoencoders. Zhan et al. [34] investigated the application of a Seq2Seq model based on GRU autoencoders in anomaly detection and fault recognition of pressure data from coal mine hydraulic supports. Jiang et al. [35] proposed a reconstruction-based unsupervised anomaly detection method. By introducing interpretability scores in both training and testing phases and using a loss function that includes interpretability-aware error terms during autoencoder training, attention maps are generated for anomaly detection. Xiao et al. [36] introduced a distribution Transformer and a distribution discriminator. The distribution Transformer converts normal data into a compact target distribution, while the discriminator attempts to distinguish between the transformed data and data from the target distribution. Zhuang et al. [37], addressing the issue that many detection models are affected by factors such as data imbalance and the complexity of anomaly data, proposed a data anomaly detection method based on GANs. Akcay et al. [38] proposed a semi-supervised anomaly detection model based on GANs. This model employs an encoder–decoder–encoder subnetwork structure to map input images to low-dimensional vectors. Bergmann et al. [39] proposed an anomaly detection method based on a student-teacher framework. By comparing the feature embeddings of the student and teacher networks, anomaly data can be detected. Gu et al. [40] introduced a novel Multi-Modal Reverse Distillation (MMRD) paradigm for anomaly detection in industrial scenarios.
Deep-learning-based industrial anomaly detection using knowledge distillation techniques has numerous advantages. First, it does not require a large amount of labeled data, effectively reducing the cost of data annotation. Second, by transferring knowledge from the teacher network to the student network, the student network can achieve high detection accuracy with a smaller model size, thereby improving detection efficiency. Additionally, this technique enhances the robustness and generalization ability of the model, enabling it to maintain high detection accuracy in complex industrial scenarios. It also simplifies the design of loss functions and reduces the difficulty of model tuning. However, existing methods rely on complex network structures and substantial computational resources, which may lead to high computational costs and difficulties in real-time applications in practical industrial environments. When dealing with large-scale datasets, these methods are prone to overfitting, especially when the data distribution is imbalanced. In such cases, the model may perform well on normal samples but have insufficient detection capabilities for anomaly samples. Some knowledge distillation-based methods may lose critical information during the distillation process, resulting in the student model’s performance not fully reaching the level of the teacher model. Some methods have high requirements for data quality and preprocessing; if the data contains noise or inaccurate labels, it can affect the model’s training effectiveness and detection accuracy. Some methods perform poorly in terms of generalization across domains or datasets, making it difficult to adapt to different industrial scenarios and data types.
3. Method
3.1. Small-Sample Semantic Segmentation Model Based on Industrial Dataset
At present, mainstream semantic segmentation techniques primarily rely on large-scale datasets for training to achieve precise recognition and segmentation of specific semantic features. However, when applied to industrial components with a small number of defects, these methods often struggle to accurately distinguish between normal textures, structural features, and localized irregular anomalies (such as bent, color, and scratch defect regions). The segmentation performance exhibits significant variability and unreliability.
The deep-learning model proposed in this paper draws on the core design philosophy of U-Net, employing a symmetric encoder–decoder framework with skip connections across layers. This architectural design is particularly well-suited for small-sample learning scenarios and can significantly enhance the model’s performance in edge detection and detail preservation. Moreover, the model incorporates a Multi-Scale Feature Fusion module to focus on the extraction of high-dimensional features. This not only expands the network’s receptive field but also effectively suppresses noise interference caused by abnormal features.
We design an innovative Adaptive Multi-Scale Attention Module (AMAM) to enhance image segmentation outcomes by optimizing the feature extraction process. The core innovations of this module are twofold: First, it employs a parallel multi-level depthwise separable convolution structure, enabling the network to process feature information at different scales simultaneously. Second, it introduces self-attention computation units to effectively capture long-range dependencies, thereby improving global context understanding. This dual-strategy design not only significantly reduces the model’s parameter count and enhances computational efficiency but also strengthens the network’s ability to integrate multi-level features.
The small-sample learning segmentation method we proposed, tailored for industrial scenarios, demonstrates exceptional segmentation accuracy and robustness in addressing common abnormal feature issues in industrial images. Unlike traditional methods, this model is specifically optimized for the characteristics of industrial data and can maintain stable segmentation performance even with limited sample sizes.
3.1.1. Semantic Segmentation Model Architecture
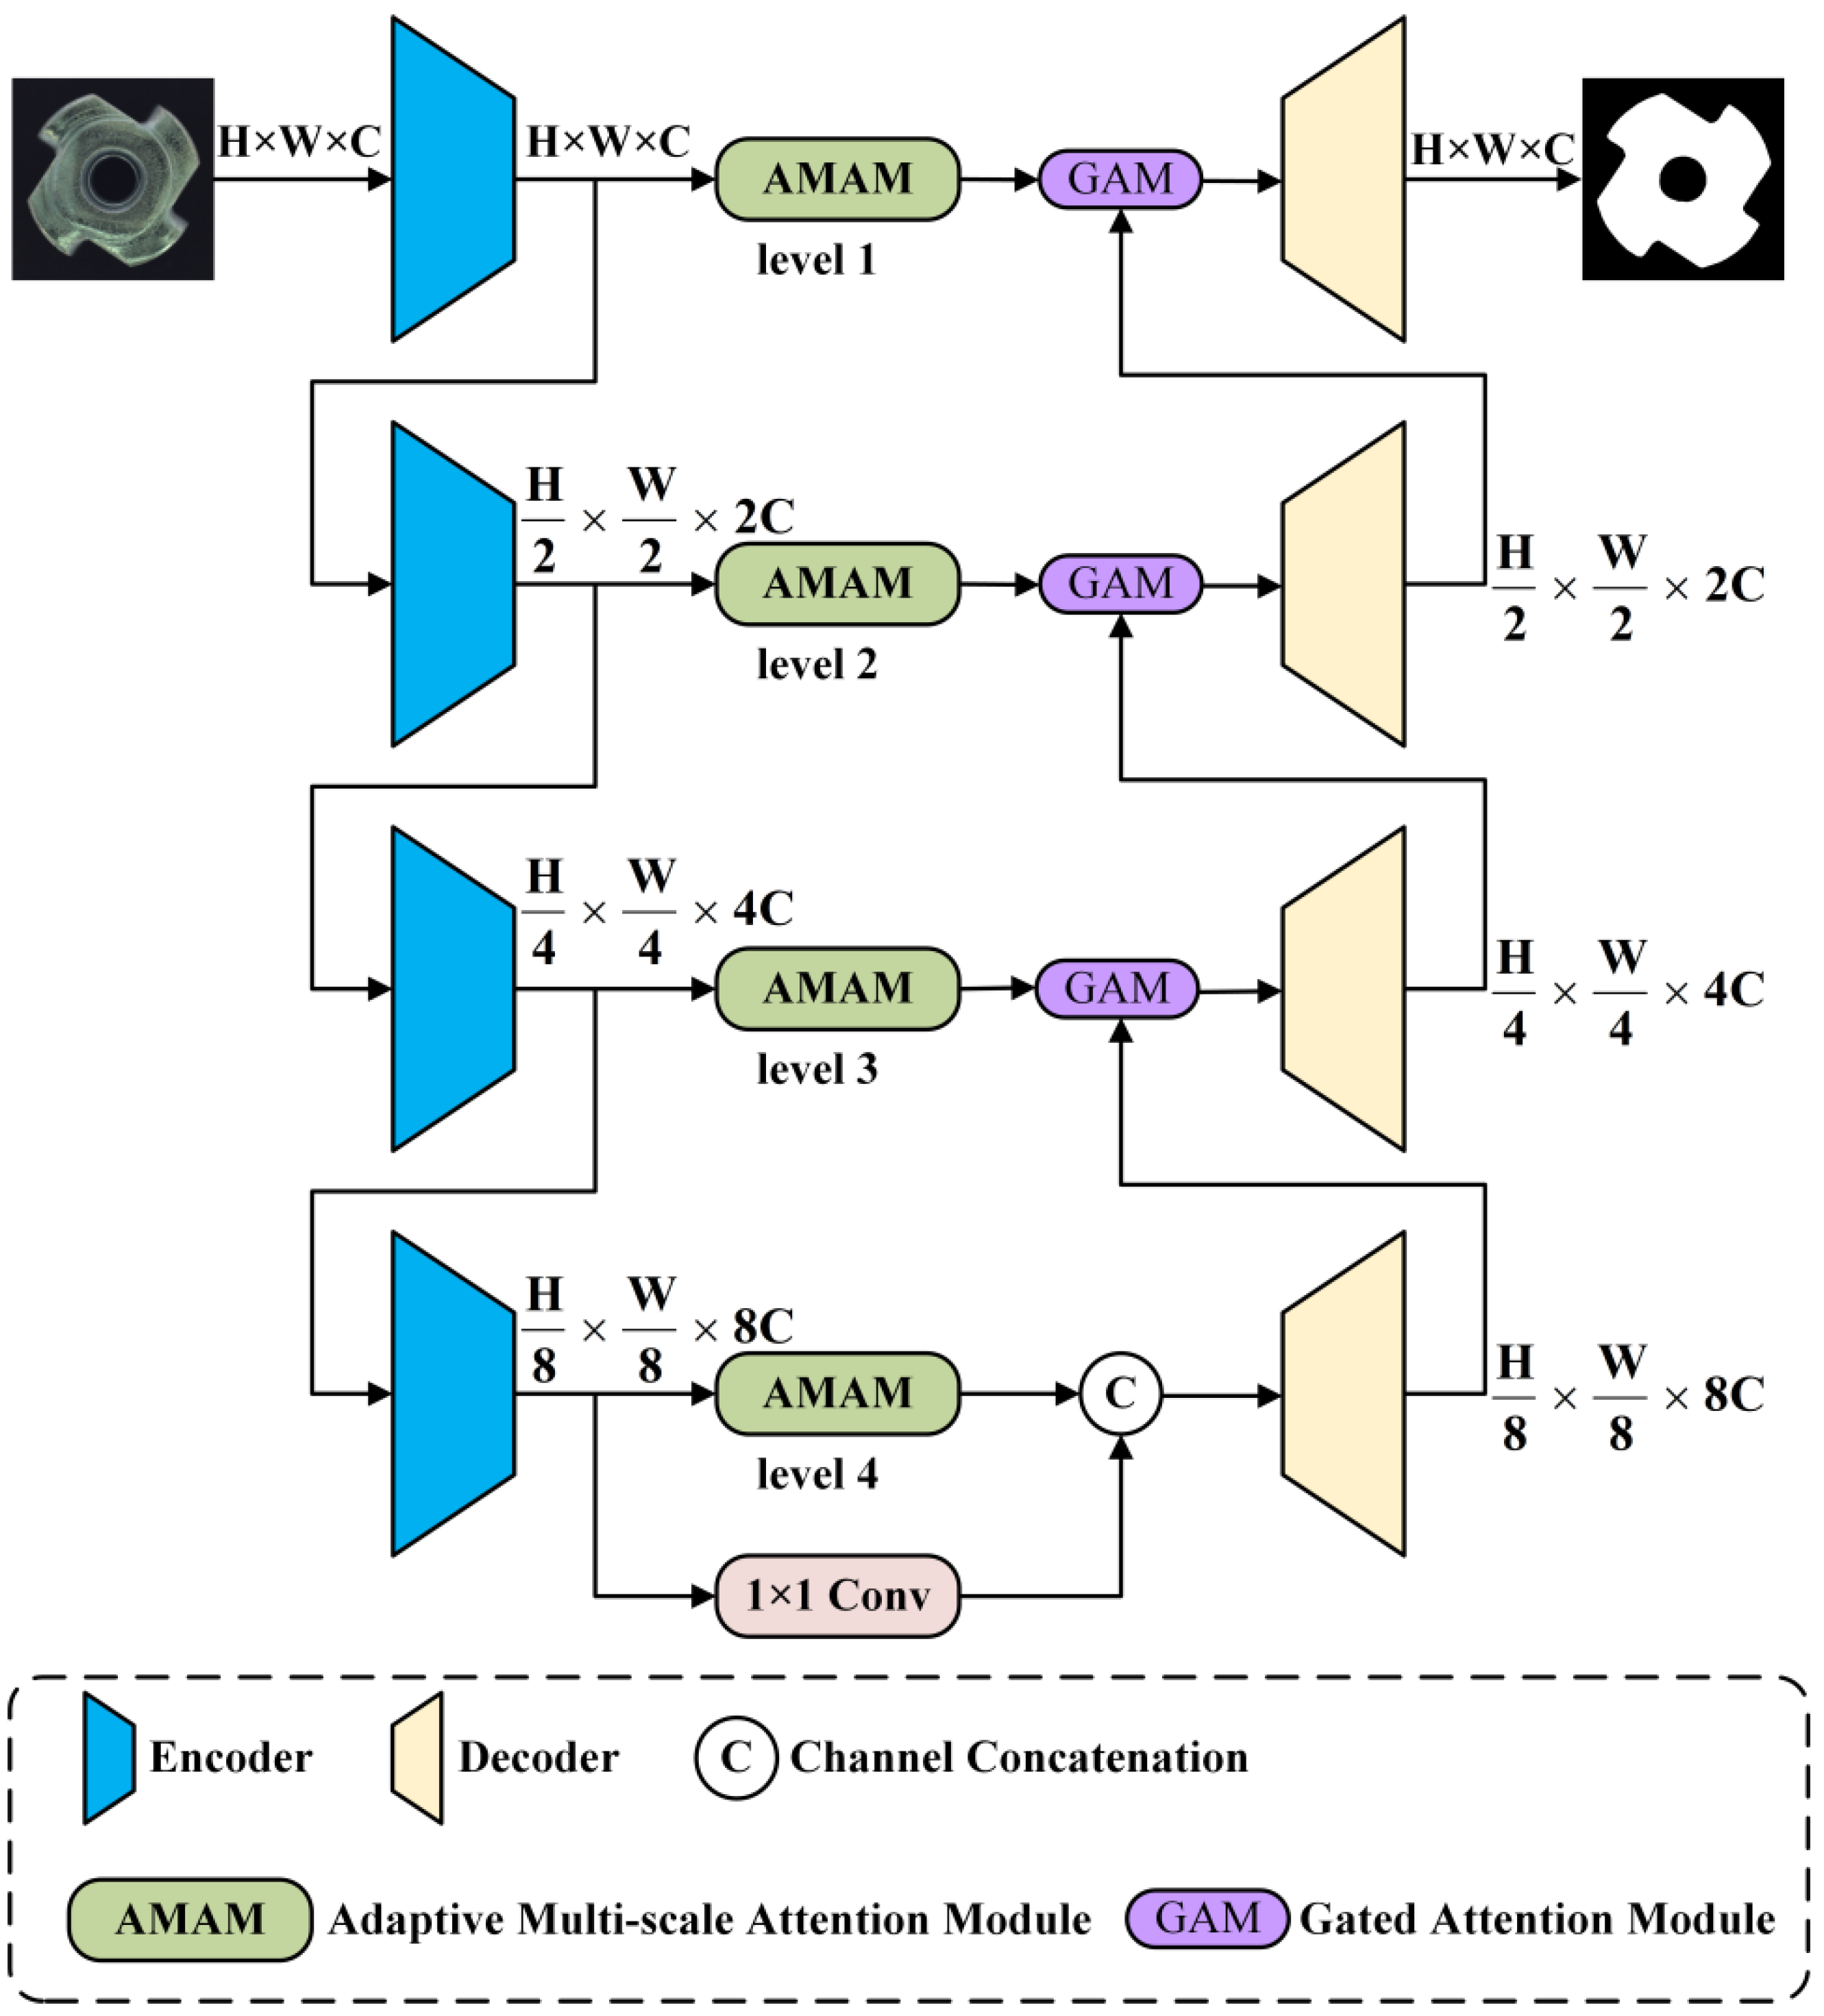
Figure 1 illustrates the small-sample semantic segmentation model proposed in this section, which primarily comprises three modules: First, the encoder module, which functions to extract semantic information from the input data and optimize these features; second, the AMAM, which enhances the expressive capability of feature encoding by fusing features across different scales and utilizes the optimized features for the segmentation task; and third, the decoder module, which generates segmentation results that match the input image. The encoder network consists of four ResNets based on the ResNet50 architecture [41], with dilated convolutions introduced into the backbone network to effectively expand the local receptive field and reduce the model’s parameter count. The decoder framework employs a multi-layer upsampling module to enhance the detail representation in semantic segmentation. Additionally, to improve segmentation performance, the model incorporates attention mechanisms and skip connection techniques. The AMAM extracts high-level semantic information from multi-scale features and integrates these features through a self-attention mechanism, learning more adaptive latent features to support the segmentation results during the decoding process.
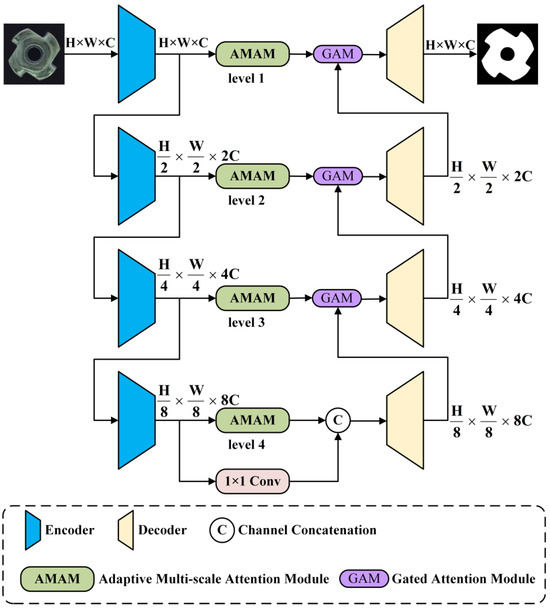
Figure 1.
Semantic segmentation model structure.
For the encoder, a pre-trained ResNet50 is utilized as the backbone network for multi-scale feature extraction. To achieve a larger receptive field and enhance the effectiveness of semantic segmentation, dilated convolutions are incorporated into the encoder, as demonstrated in a series of studies on DeepLab [42]. The output stride is defined as the ratio of the spatial resolution of the input image to the final output resolution. To attain satisfactory segmentation performance on industrial data, this paper sets the output stride to 16 to extract denser features, which is an empirically determined value since 16 has been found to be optimal through experimentation in the context of industrial applications [43]. For the decoder, it fuses multi-scale features and performs upsampling across four sets of convolutional layers. Skip connections are introduced between corresponding layers of the encoder and decoder to effectively capture and fuse low-level and high-level features for detailed prediction. Moreover, an attention mechanism is added to capture a larger context.
The semantic segmentation model is designed to process high-resolution industrial images efficiently. As shown in Table 1, the encoder reduces the spatial dimensions while increasing the number of feature channels. The AMAM module maintains the spatial dimensions while enhancing the feature representation through multi-scale attention. The decoder then upsamples the feature maps to restore the original image dimensions, resulting in a high-resolution segmentation map. This detailed dimension change is crucial for understanding the model’s ability to capture both global and local features effectively.

Table 1.
Changes in image dimensions in the semantic segmentation model.
3.1.2. Adaptive Multi-Scale Attention Module
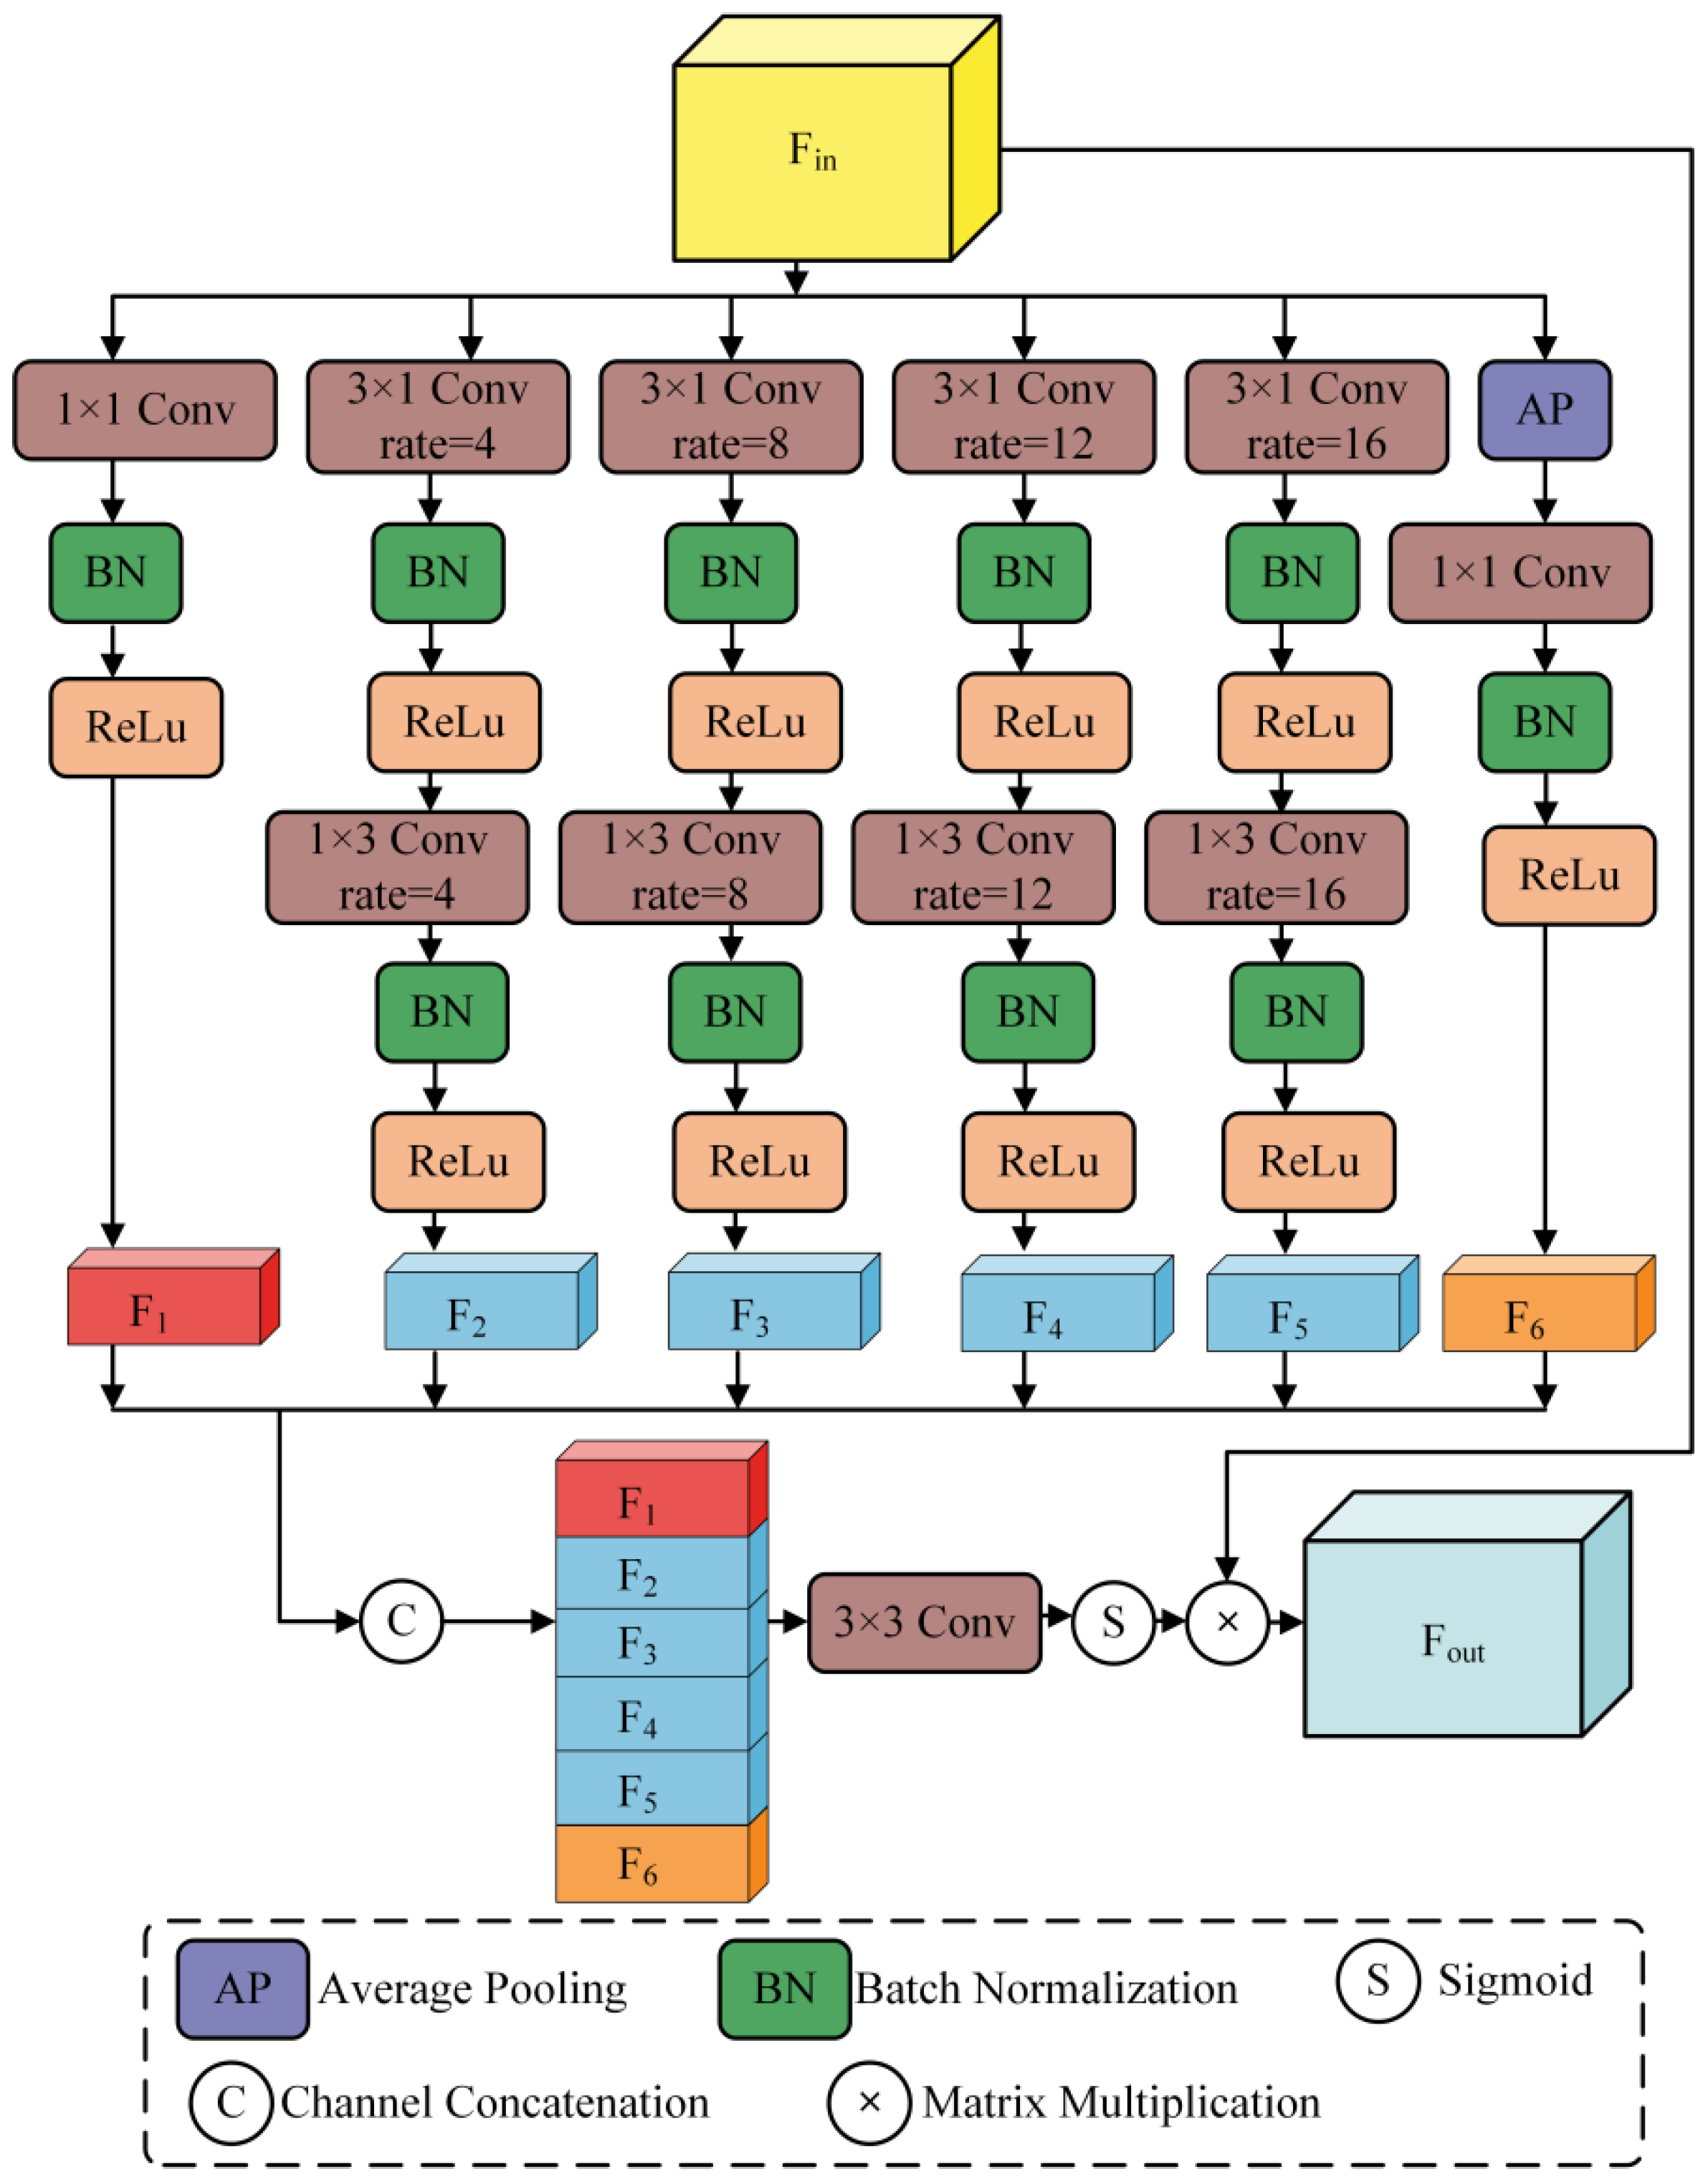
The AMAM architecture processes six groups of feature information at different scales, which are then concatenated into a single feature representation. The corresponding mathematical description is as follows:
where denotes Batch Normalization, denotes Average Pooling, denotes the Sigmoid function, ⊗ represents Matrix Multiplication, and ⨁ represents Channel Concatenation.
As illustrated in Figure 2, the AMAM processes the feature data extracted by the encoder through six distinct pathways: 1 × 1 convolution, 3 × 3 dilated convolutions with dilation rates of 4, 8, 12, and 16, and a global average pooling layer. The feature maps resulting from these six pathways are subsequently concatenated into a single feature representation. To enhance the extraction of global feature information, in addition to fusing multi-scale features, we incorporate a self-attention mechanism to further integrate multi-scale feature information.
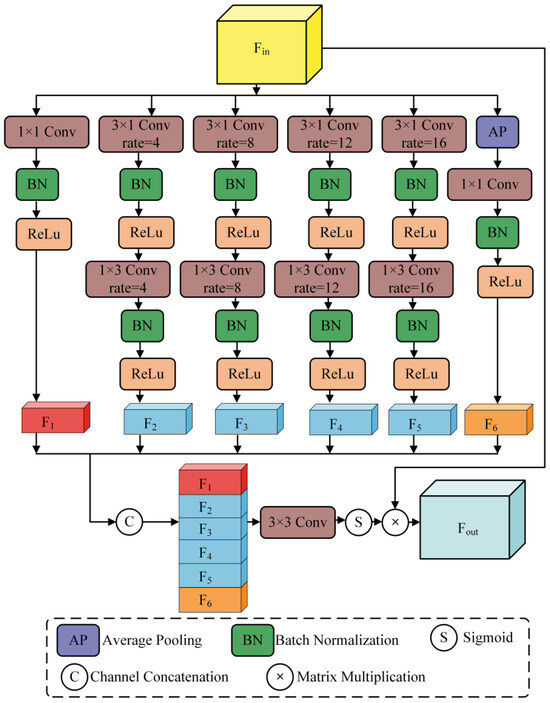
Figure 2.
Structure of the Adaptive Multi-Scale Attention Module.
Given that the feature data extracted by the encoder represents high-level semantic information with a high capacity for semantic content, excessively high dilation rates can easily lead to the loss of feature information. Therefore, we employ multiple layers of dilated convolutions with dilation rates set to 4, 8, 12, and 16 to obtain feature information across a broader range of scales. By reducing the dilation rates, the processing of high-level features is refined, and by increasing the number of dilated convolution layers, a richer set of feature information is obtained. This approach enhances the model’s ability to extract feature information effectively.
Depthwise separable convolutions [44] decompose the standard convolution operation into two separate steps, resulting in a parameter count that is one-third that of a standard convolution and a reduced computational cost. Consequently, in the AMAM, standard convolutions are replaced with depthwise separable convolutions to improve the training performance and efficiency of the system.
To validate the effectiveness of these dilation rates, we conducted experiments on the MVTec dataset, comparing the performance of the model with different sets of dilation rates. The results are summarized in Table 2. The results show that the dilation rates of 4, 8, 12, and 16 achieve the highest mIoU score of 96.4 and an accuracy of 98.3%, while maintaining a reasonable inference time of 35.2 ms. Lower dilation rates (2, 4, 6, 8) result in slightly lower performance metrics, while higher dilation rates (6, 10, 14, 18 and 8, 12, 16, 20) increase the computational load without significant gains in performance. Therefore, the dilation rates of 4, 8, 12, and 16 were chosen as they provide the best trade-off between performance and efficiency.

Table 2.
Performance comparison with different dilation rates.
3.1.3. Gate Attention Module
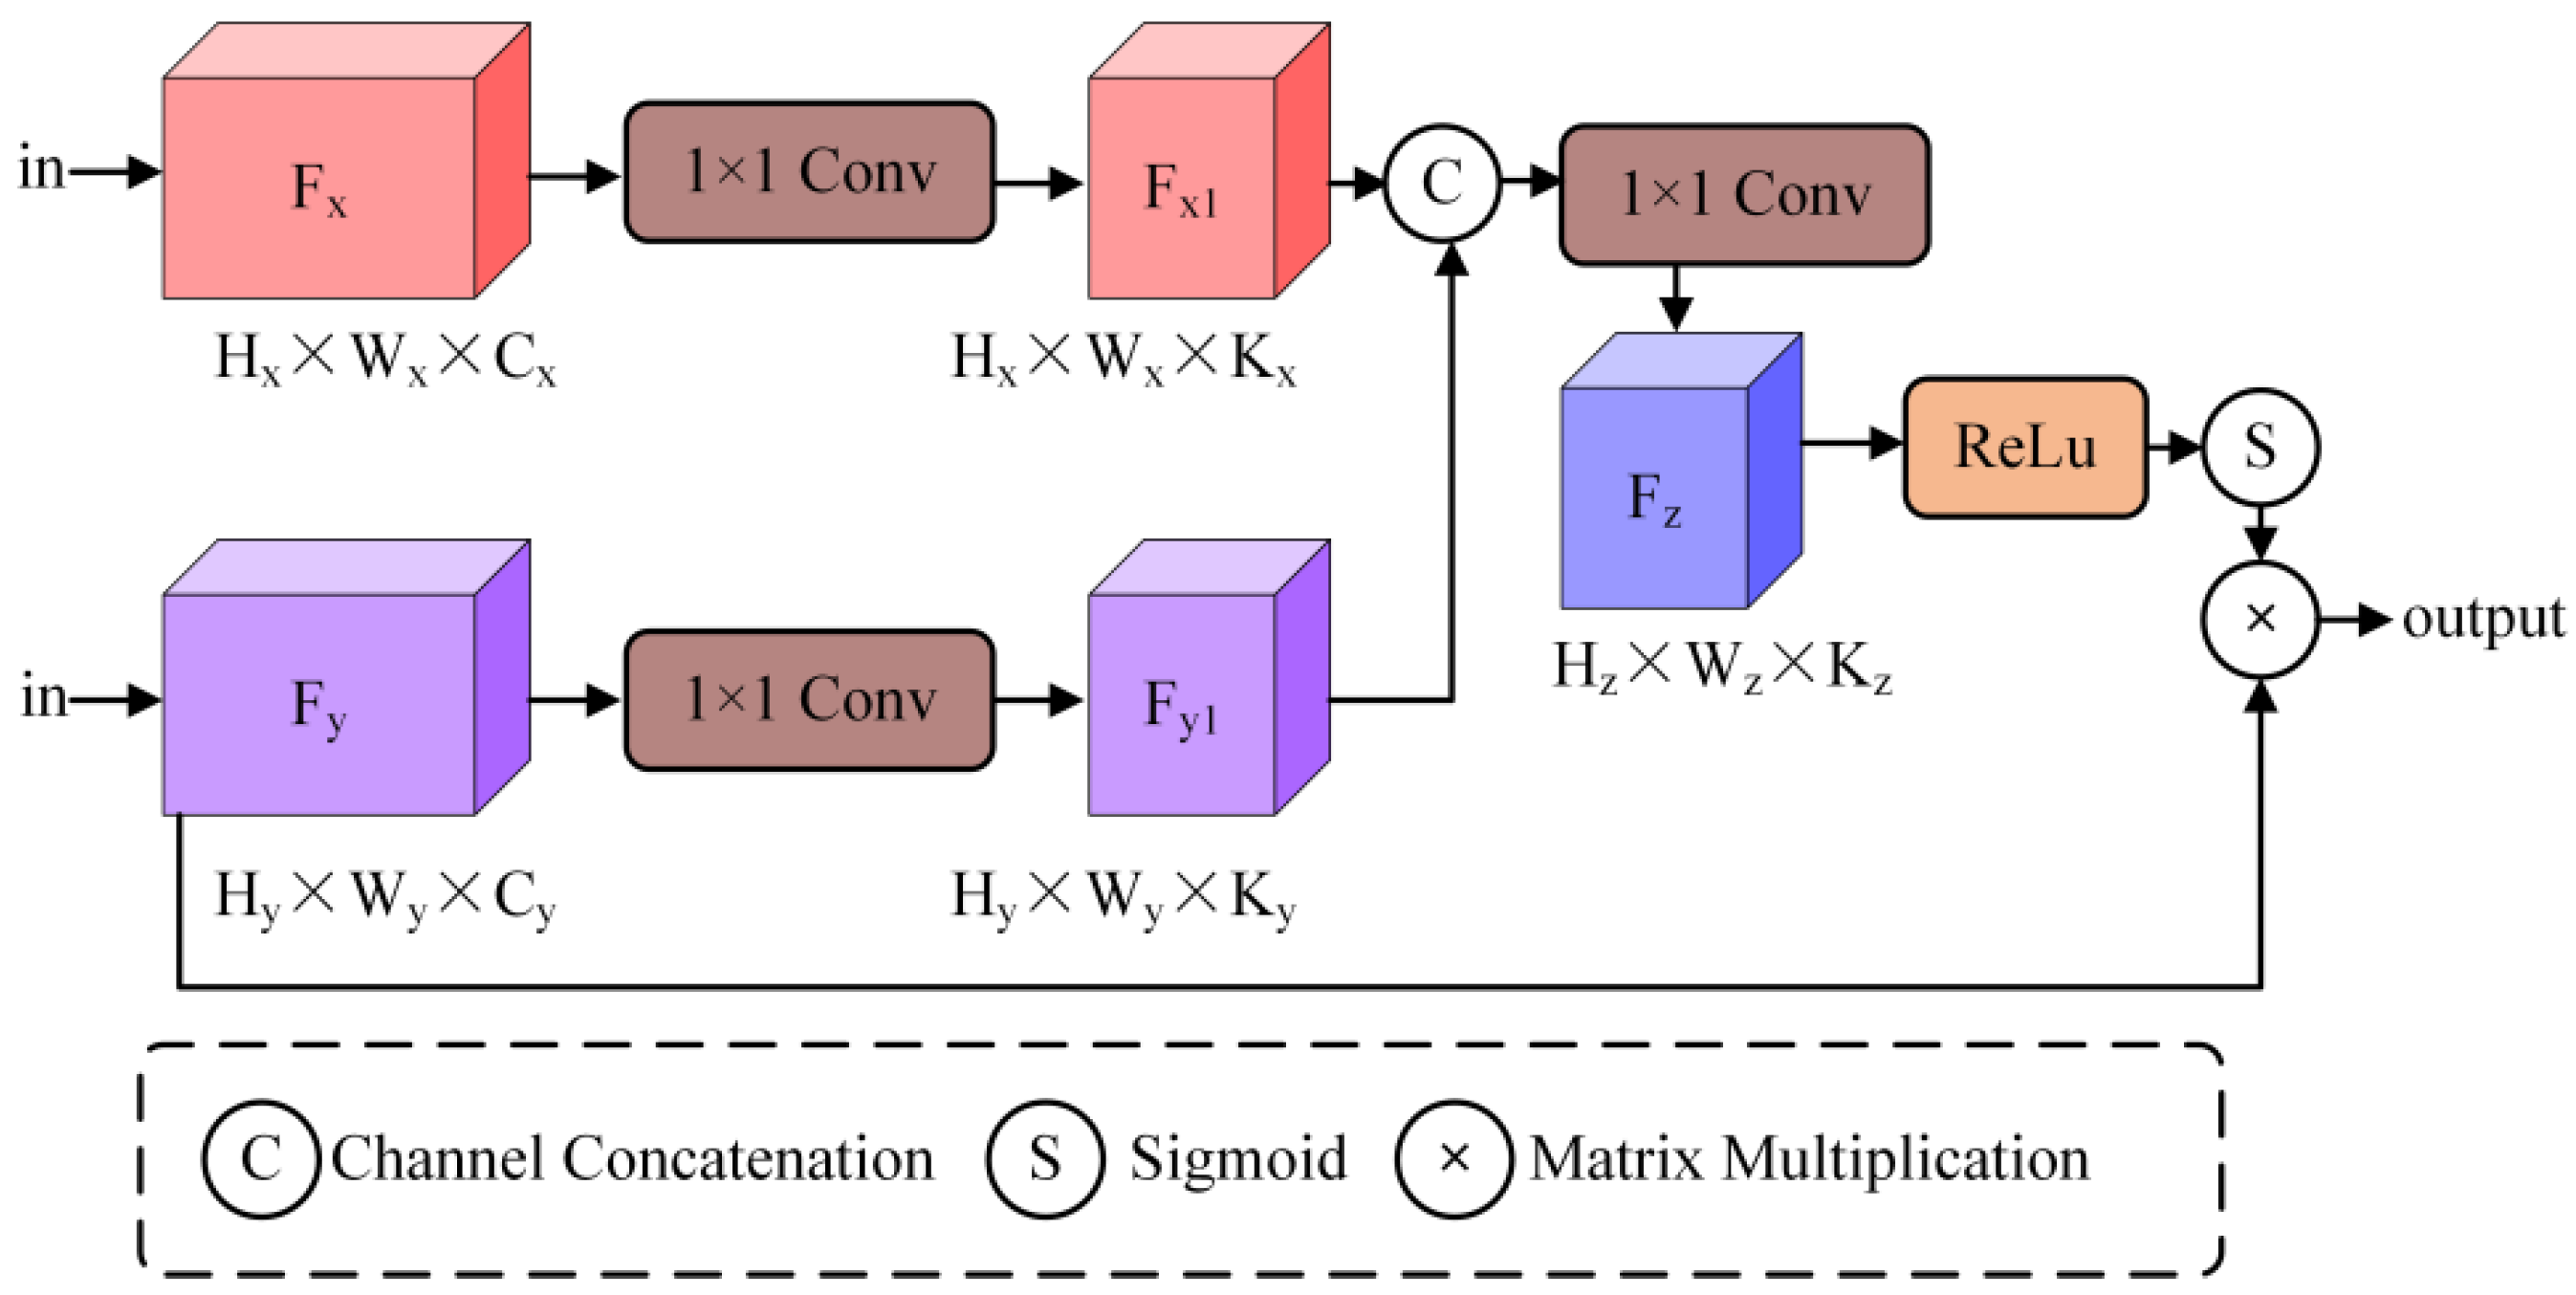
To achieve a larger receptive field while analyzing the semantic positional relationships in the context, feature data in the standard U-Net architecture is progressively downsampled through a grid. This facilitates the extraction of positional and relational information from low-level feature maps. However, small-area features with distinct semantic information are easily overlooked by high-level feature information. To enhance segmentation accuracy, we introduce a gate attention module into the model to simplify the task into separate localization and subsequent segmentation steps. As shown in Figure 3, the use of the ReLU function in the gate attention module effectively suppresses the responses of irrelevant features without compromising the expression of semantic information. Moreover, due to its simple structure, it eliminates the need for training multiple models and a large number of additional model parameters.
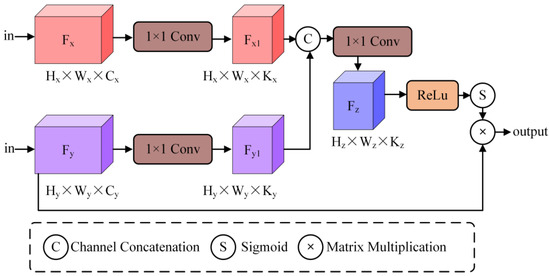
Figure 3.
Structure of Gate Attention Module.
In practice, the gate attention module is integrated into the skip connections that convey salient features. Prior to the skip connection, information extracted from coarse-scale features is used for gating, with fine-scale features serving as a reference, to eliminate ambiguities related to irrelevant and noisy responses in the skip connections. Additionally, the gate attention module is incorporated into the first three layers, allowing for layer-by-layer weighting during forward propagation and thereby preventing the potential loss of small-area semantic information during prediction.
During the experimental process, it was observed that the full-scale application of the gate attention module in the model did not yield the optimal results. However, employing only 1 × 1 convolution to adjust spatial structure in the Adaptive Multi-Scale Attention Module at the lowest layer, while using the gate attention module in the first three layers, produced better outcomes. Specifically, this configuration achieved a Mean Intersection Over Union (mIoU) of 96.4% on the industrial dataset, which is 1.5% higher than the model using the gate attention module throughout all layers. We hypothesize that after passing through the Adaptive Multi-Scale Attention Module, the structural features become more complex. Although attention mechanisms can capture a sufficiently large receptive field to obtain semantic contextual information, they may also lead to information loss, thereby reducing segmentation accuracy. To verify this hypothesis, we conducted ablation studies comparing the performance of different configurations. The results showed that using 1 × 1 convolution in the lowest layer while applying gate attention in the first three layers resulted in a 2.1% improvement in mIoU compared to using gate attention alone. This suggests that the combination of 1 × 1 convolution and gate attention effectively balances the trade-off between capturing detailed features and maintaining semantic context, thus enhancing segmentation accuracy.
3.2. Anomaly Detection Method Based on Knowledge Distillation
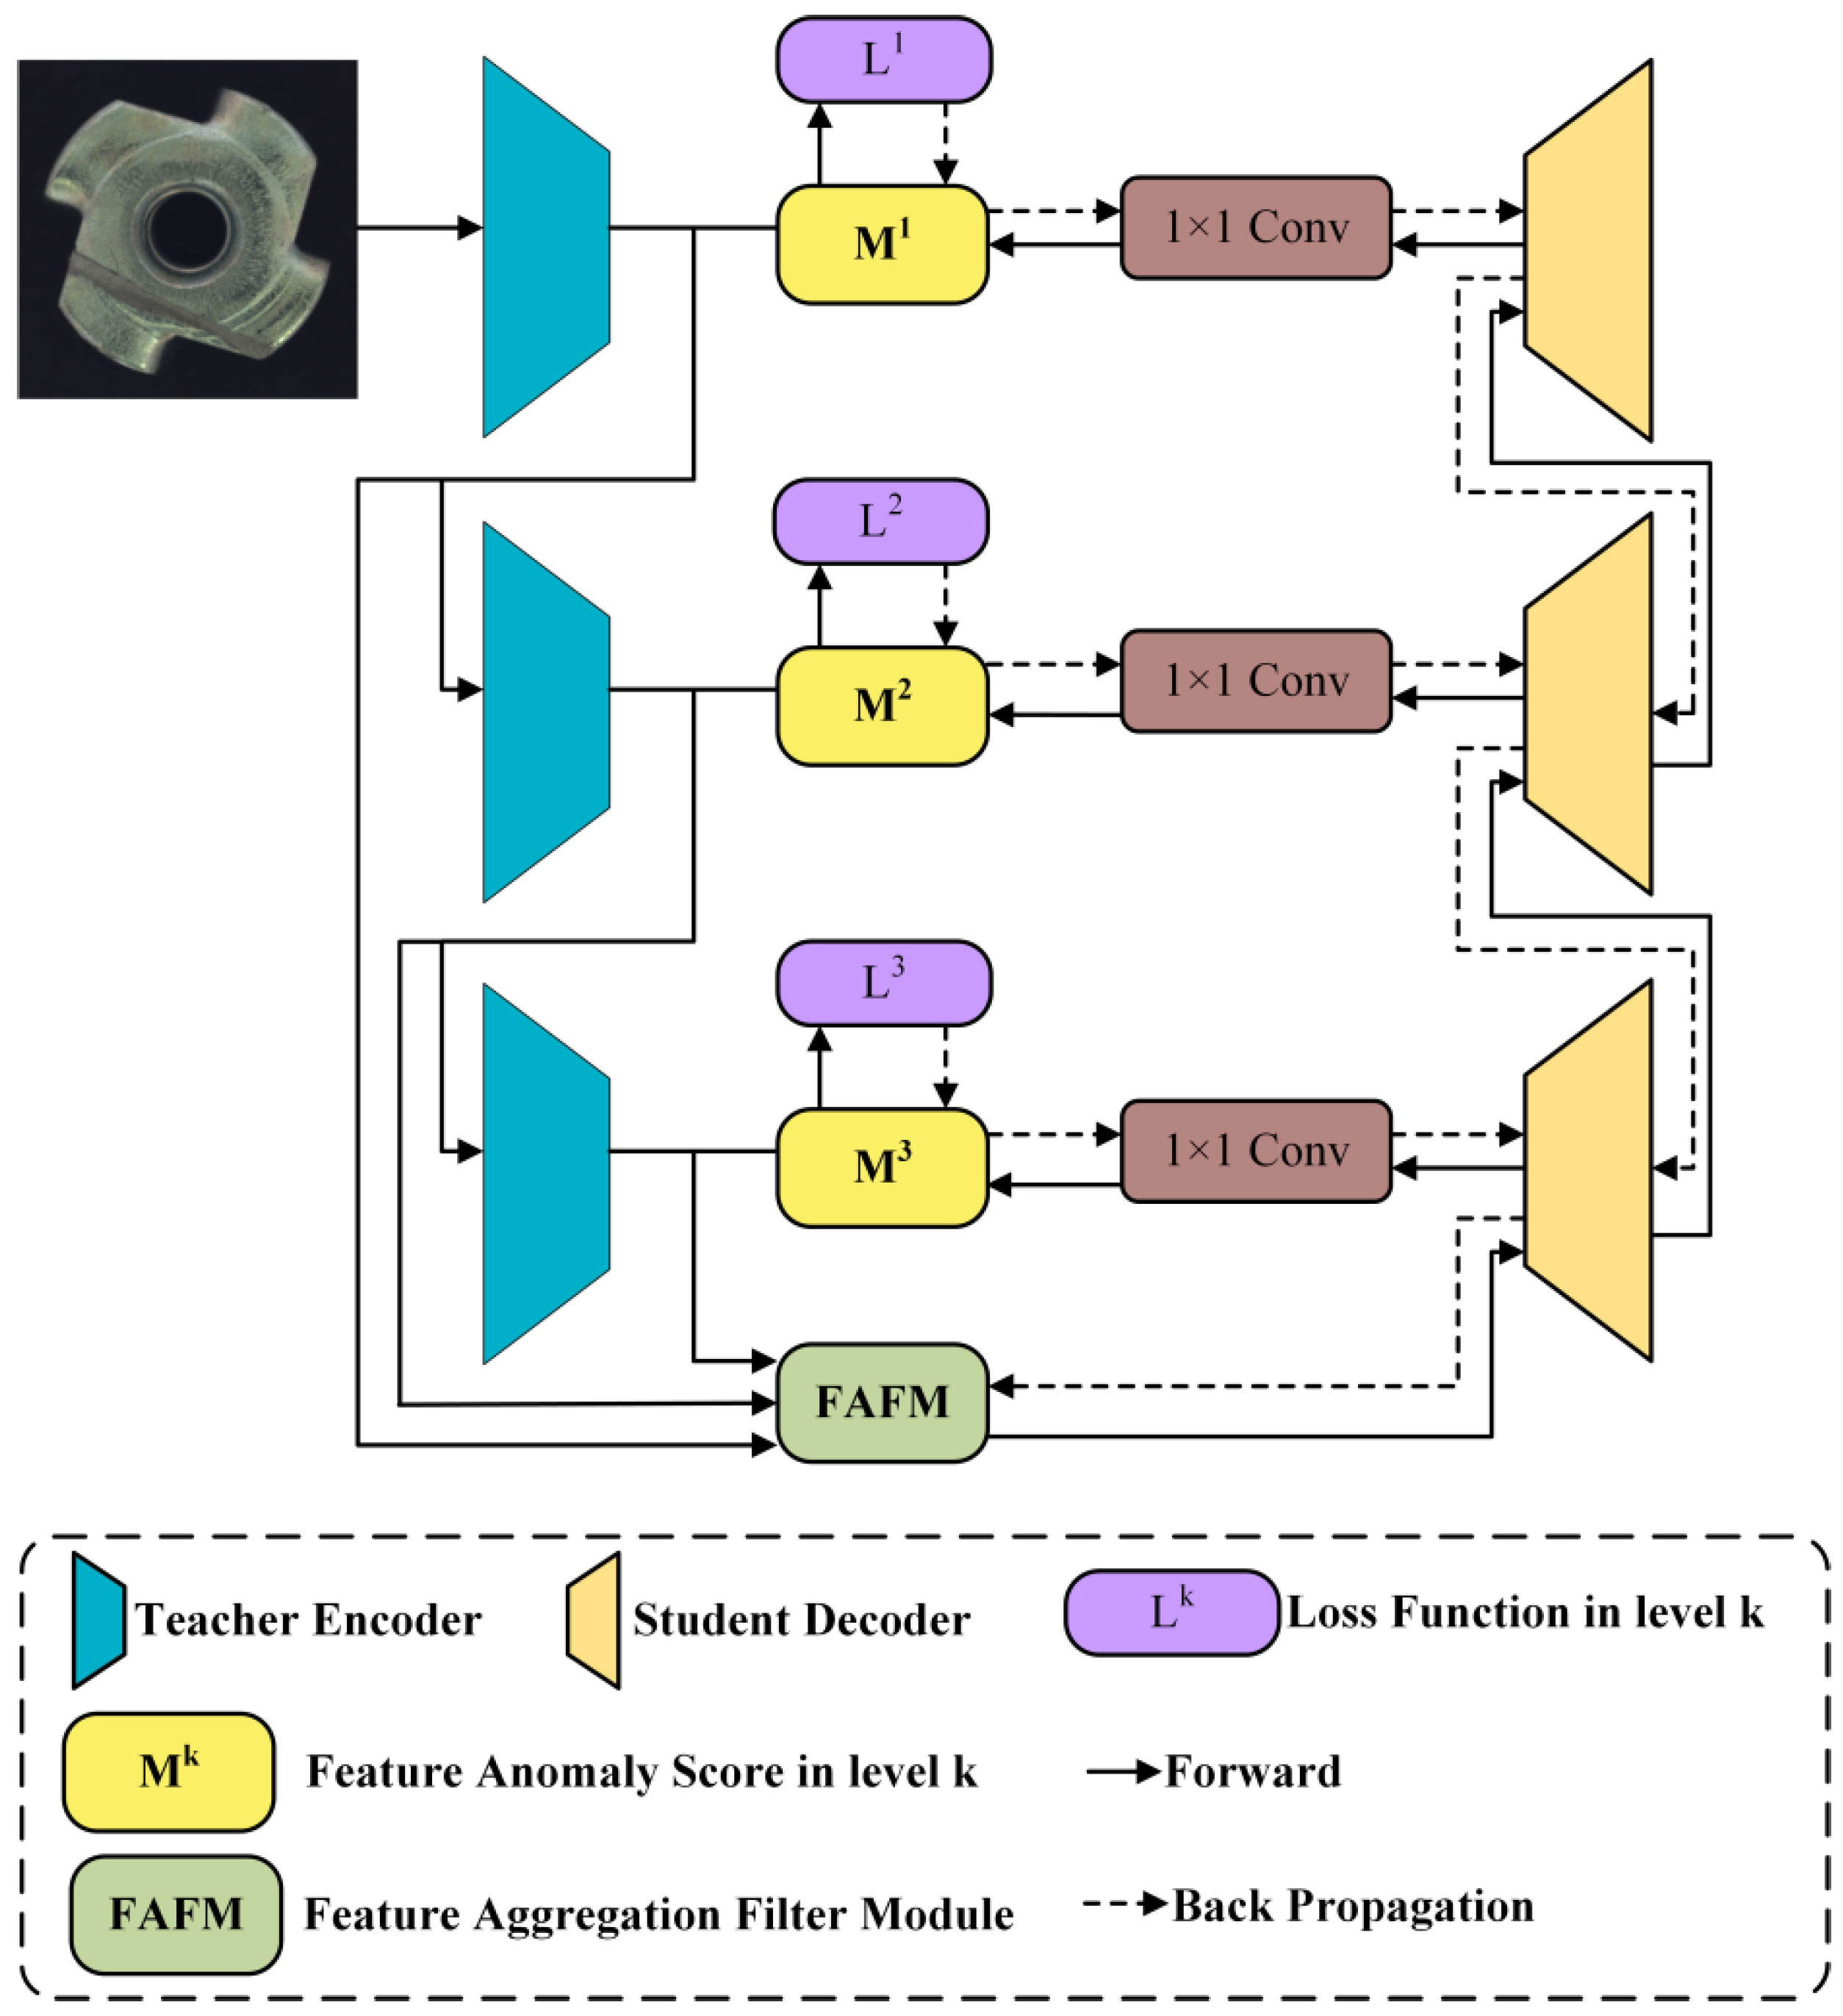
The knowledge distillation framework model proposed in this paper is illustrated in Figure 4. The model consists of a fixed pre-trained teacher network, a trainable feature aggregation and filtering module, and a student network. During the training process, the teacher network is first utilized to extract multi-scale features from the input normal samples. Subsequently, a student network is trained to reconstruct these multi-scale features from the compact feature data extracted by the feature aggregation and filtering module. In the prediction phase, the representations extracted by the pre-trained teacher network can capture additional abnormal features in the samples. However, the untrained student network is unable to reconstruct these abnormal features from the corresponding aggregated features. Therefore, the lower similarity of abnormal representations in the proposed teacher–student model indicates a higher anomaly score. The teacher network employs a pre-trained WideResNet50 [45], while the student network utilizes a custom multi-level residual network. The heterogeneity between the teacher and student networks effectively reduces the possibility of complete reconstruction of abnormal features in knowledge distillation. Moreover, the trainable feature aggregation and filtering module further compresses the multi-scale patterns into an extremely low-dimensional space for serial downstream reconstruction. This not only reduces redundant upstream data but also focuses the features more on global information rather than details.
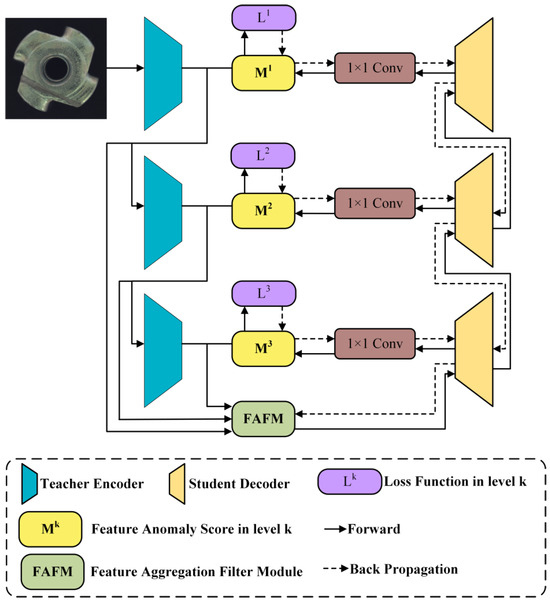
Figure 4.
Structure of the knowledge distillation-based anomaly detection model.
In common teacher–student models for anomaly detection, during training, normal samples are simultaneously fed into both the pre-trained teacher network and the untrained student network. The parameters of the student network are continuously updated to make the feature data extracted by the teacher and student networks as consistent as possible. During prediction, since the teacher network only trains the student network to extract features from normal samples, the feature data output by the teacher and student networks will be similar for normal samples, but the difference will be significant for abnormal samples. This approach, due to the similar structure of the student and teacher networks and the similarity of input and output data, can easily lead to similar results when processing abnormal samples. The proposed model adopts a serial approach, using the teacher network as the upstream component. Normal samples are only fed into the teacher model for multi-scale feature extraction. After compression and filtering of the multi-scale features, the data are passed to the downstream student network, which reconstructs the multi-scale data extracted by the teacher network. This serial structure enhances the diversity of the student network’s representation and the randomness of reconstructing abnormal samples, thereby improving the detection performance. In terms of model selection, this paper employs a backbone network pre-trained on the ImageNet dataset [46] as the teacher network, with all parameters of the teacher network frozen during the knowledge distillation process. Additionally, ablation studies in this paper demonstrate that ResNet [41] and WideResNet [45] are both effective feature extraction networks, as they can extract rich features from images.
To match the multi-scale features of the teacher network, the student network is designed to be symmetrical to the teacher network, meaning they have opposite network architectures. The reverse design facilitates the filtering of abnormal features by the student network, while the symmetry ensures that the student network has the same feature dimensions as the teacher network. In reverse distillation, the objective of the student network is to simulate the behavior of the teacher network. In anomaly detection, since the shallow layers of neural networks extract local descriptors for low-level information (such as color descriptors, edges, textures, etc.), while the deeper layers have a broader receptive field and can reflect global semantic and structural information, the similarity between low-level and high-level features in the teacher–student model is low. This indicates local anomalies and global structural outliers, respectively. Therefore, we employ a distillation technique based on multi-scale features.
To provide a clear understanding of the changes in image dimensions throughout the anomaly detection model, we have included Table 3, which shows the specific input and output dimensions for each layer. The anomaly detection model processes high-resolution industrial images efficiently. The teacher network, a pre-trained WideResNet50, extracts multi-scale features from the input image, reducing the spatial dimensions while increasing the number of feature channels. The feature aggregation and filtering module further compresses and filters these features, resulting in a compact representation. The student network then attempts to reconstruct these features, with the difference between the reconstructed and original features indicating anomalies. This detailed dimension change is crucial for understanding the model’s ability to capture both global and local features effectively.

Table 3.
Changes in Image Dimensions in the Knowledge Distillation-Based Anomaly Detection Model.
3.2.1. Feature Aggregation and Filtering Module
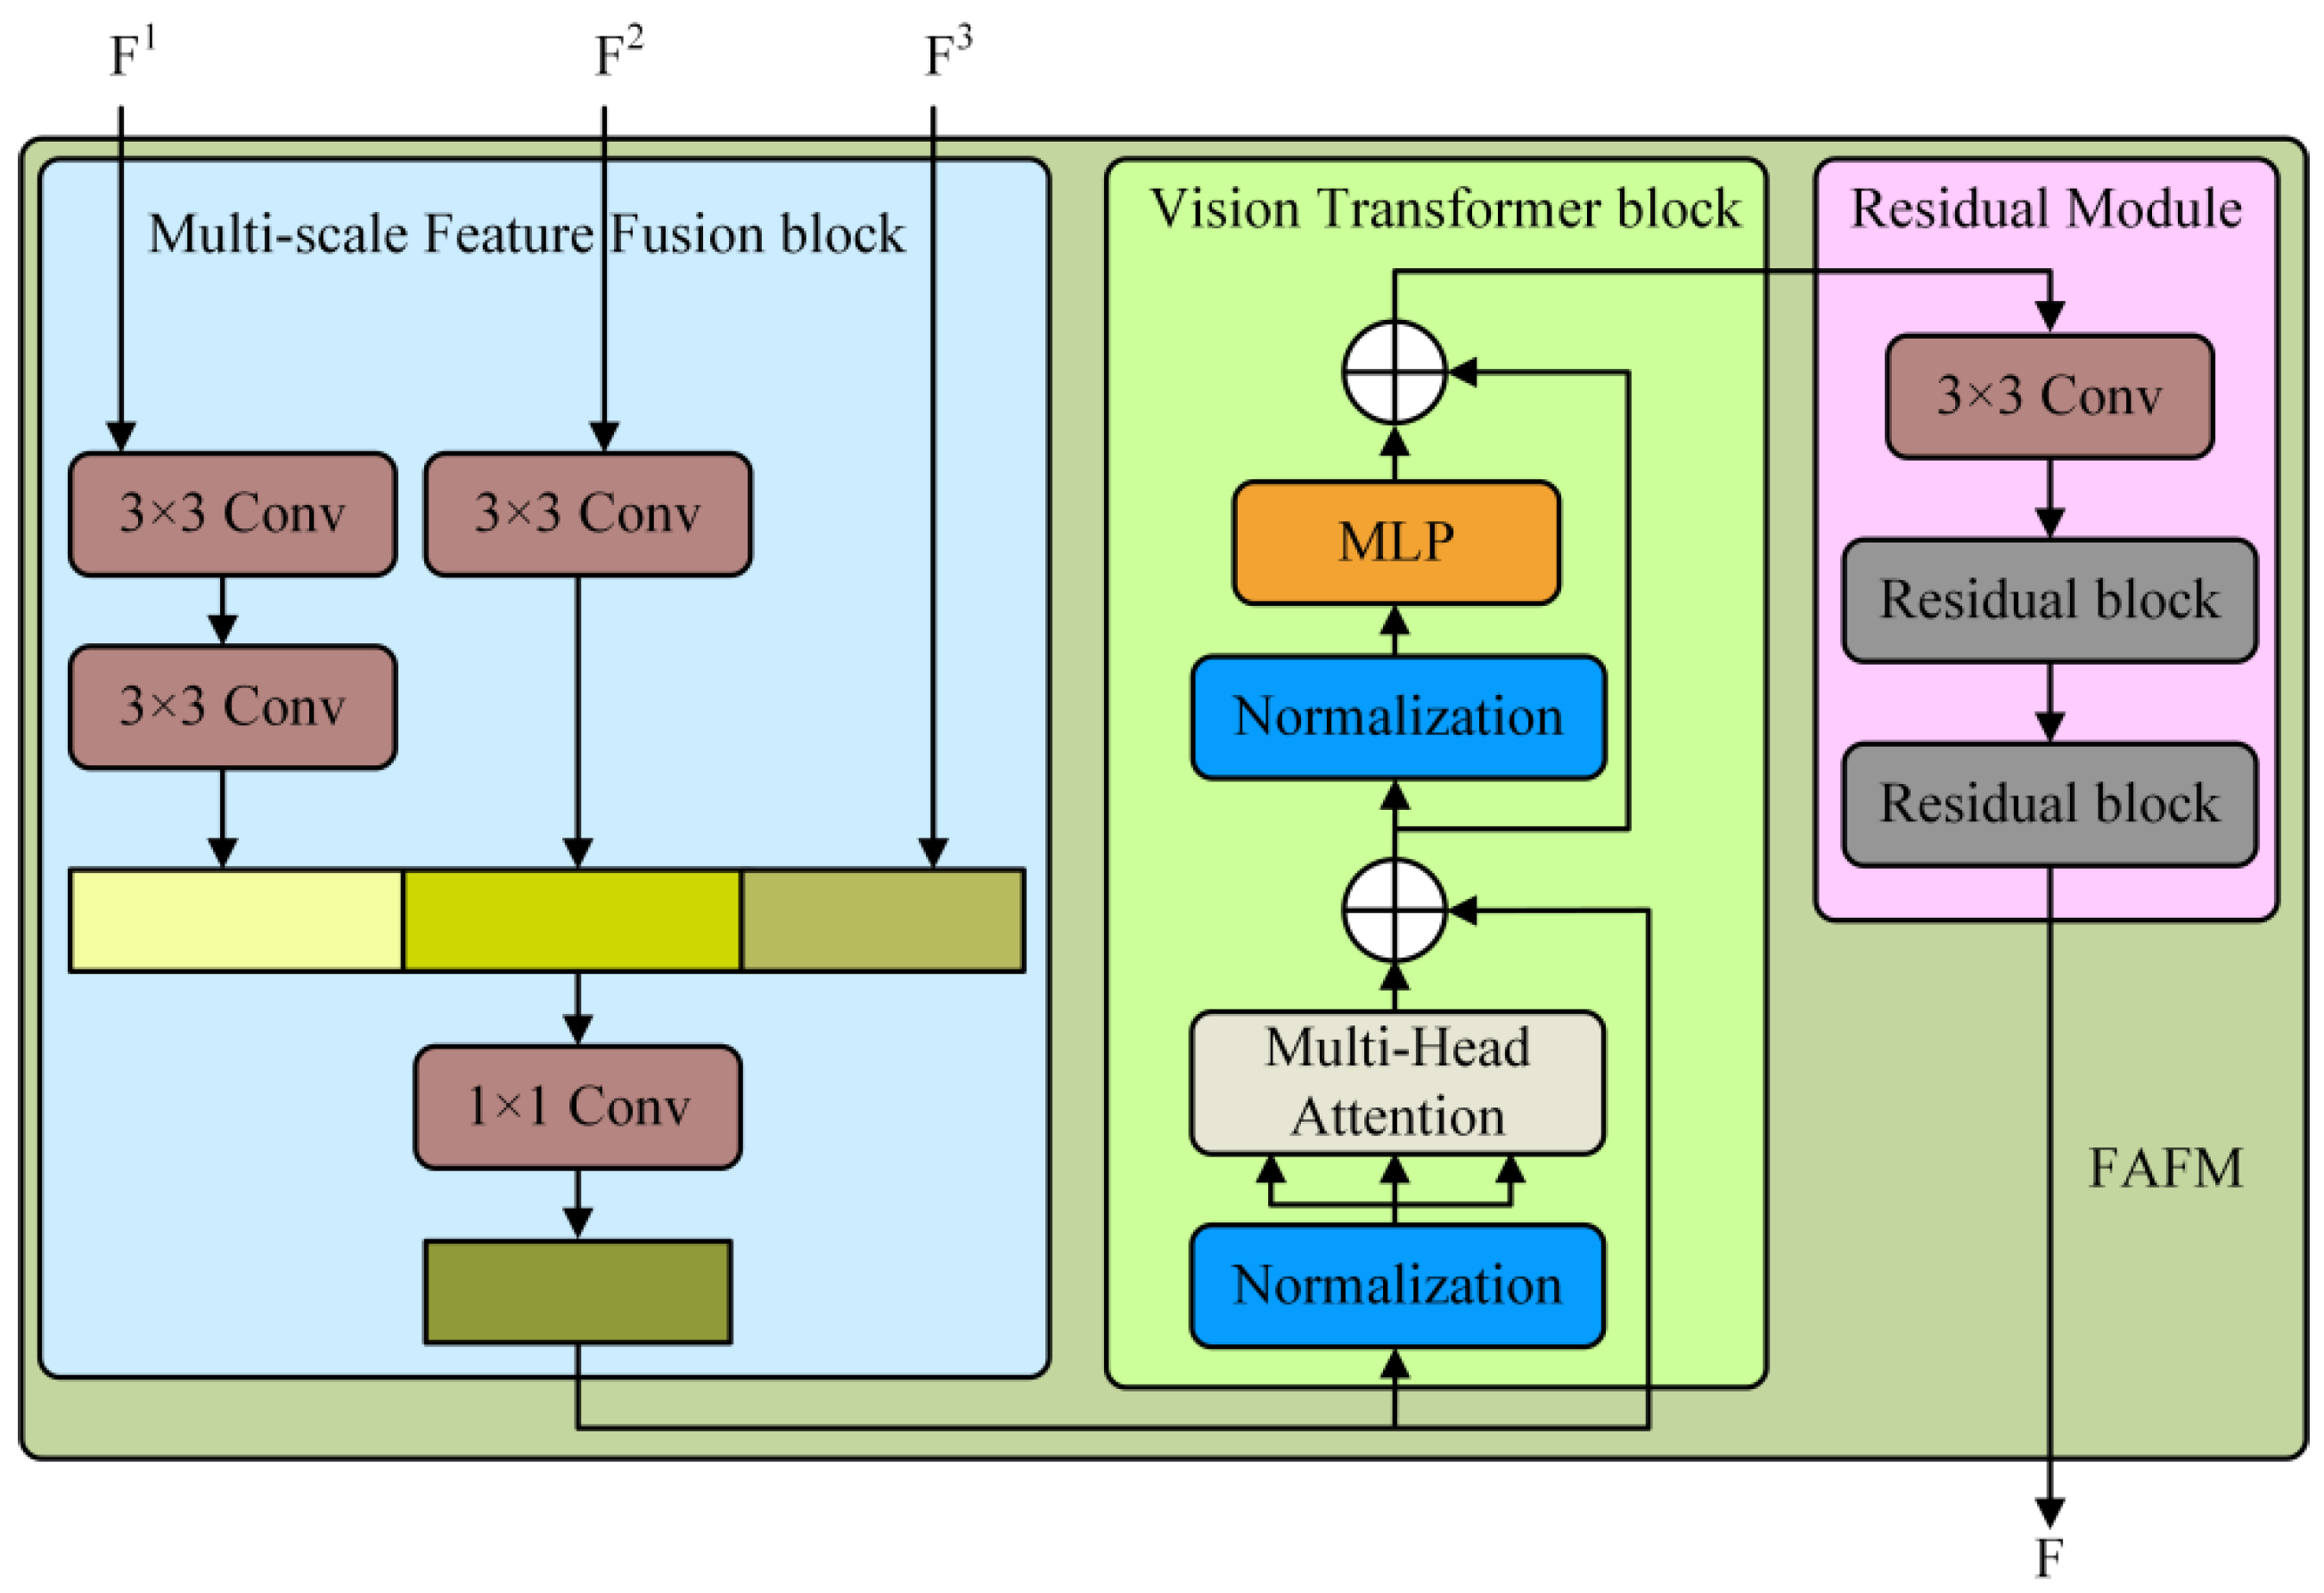
As shown in Figure 5, the feature aggregation and filtering module does not adopt a pure Transformer architecture but innovatively introduces a CNN-Transformer hybrid model. Specifically, the CNN first functions as a feature extractor, responsible for generating feature mappings of the input data. Subsequently, a 14×14 embedding is extracted from the feature maps generated by the CNN and used as the input to the Transformer module, rather than directly from the original image. This design choice is based on the following considerations: First, it fully utilizes the intermediate high-resolution CNN feature maps in the decoding path. Second, experimental results indicate that the hybrid CNN-Transformer encoder outperforms the pure Transformer encoder. Finally, by reducing the size of the embedding, the number of parameters in the Transformer is effectively decreased, thereby reducing the computational burden. In the proposed reverse knowledge distillation framework, the objective of the student network is to reconstruct the multi-scale features of the teacher network. Therefore, the output features of the last encoding block in the backbone network can be directly passed to the student network. However, this direct connection poses two main issues. On one hand, although the high capacity of the teacher network enables it to extract rich features, these high-dimensional feature descriptions may contain a large amount of detail and noise, which can interfere with the student network’s decoding of normal features. On the other hand, the output of the last encoder block in the backbone network typically reflects the semantic and structural information of the input data. Given that the order of knowledge distillation is reversed, directly passing the high-level feature representation to the student network poses a significant challenge for the reconstruction of low-level features.
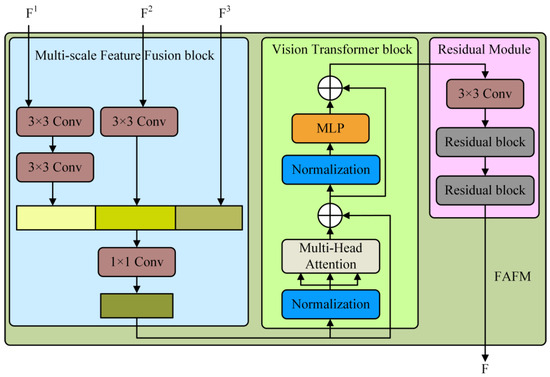
Figure 5.
Structure of the feature aggregation and filtering module.
In previous studies, data reconstruction has often been achieved by introducing skip connections to link the encoder and decoder. However, this method is not feasible in the context of knowledge distillation, as skipping connections would leak abnormal information to the student network during inference. To address the difficulties faced by the student network in reconstructing images from high-level features, we employ a Multi-Scale Feature Fusion (MFF) block to integrate multi-scale features before passing them to the teacher network. To achieve representation alignment in feature connections, we downsample the shallow features through one or more 3 × 3 convolutional layers, followed by batch normalization and ReLU activation. Subsequently, a 1 × 1 convolutional layer with stride 1 and batch-normalized ReLU activation is used to generate rich and compact feature representations. The MFF block aggregates low-level and high-level features into a fused feature dataset. Then, a ViT block is utilized to perform context-based analysis of multi-layer feature information, filtering out the fundamental information beneficial to the student network. Finally, two residual network modules are employed to further reduce feature noise and optimize the feature representation.
3.2.2. Loss Function and Anomaly Scoring
During the training process, the primary objective is to enable the student network to accurately reconstruct the multi-scale feature information extracted by the teacher network from normal images and to minimize the discrepancy between the multi-scale feature information reconstructed by the student network and that extracted by the teacher network. In the prediction phase, the pre-trained teacher network remains capable of effectively extracting features from abnormal images. However, since the student network has not been trained to reconstruct the multi-scale features of abnormal images, the difference between the multi-scale feature information reconstructed by the student network and that extracted by the teacher network for abnormal images may significantly increase. Based on this difference in feature information, we define the method for calculating abnormal features as follows.
Given the necessity to compute the differences between multi-scale feature information, it is essential to clearly define the feature information extracted by the teacher network (denoted as Advisor, A) and the feature information reconstructed by the student network (denoted as Student, S) at each scale. The specific definitions are as follows:
In the context of the knowledge distillation model, and denote the k-th feature reconstruction layer and feature extraction layer within the student network and teacher network, respectively. and represent the feature reconstruction results and feature extraction results from the preceding layer, respectively. , where , and correspond to the height, width, and number of channels of the k-th layer feature data, respectively. In the image reconstruction task of knowledge distillation models, cosine similarity is commonly employed as the loss function, as it is capable of more accurately analyzing the relationships between high-dimensional and low-dimensional information. Based on this, we calculate the differences among multi-scale feature information to identify anomalous features:
When the value of is relatively large, it indicates a higher degree of anomaly at that particular location. By integrating the multi-scale knowledge distillation approach and aggregating the multi-scale anomaly maps, we derive a scalar loss function for the optimization of the student network:
To comprehensively evaluate the performance of anomaly detection and anomaly localization, we select anomaly scores at two levels for comparative analysis. The first level is the pixel-level anomaly detection score (AL). Specifically, the method involves calculating the cosine similarity among three sets of distinct features generated by three pairs of encoders and decoders, using the aforementioned formula, to obtain the anomalous features. Subsequently, these anomalous features are upsampled to the image size via bilinear interpolation. In the initial computation of the anomaly score, we directly summed the three sets of anomalous feature information to derive the pixel-level anomaly score. However, this straightforward summation approach fails to achieve the optimal feature combination effect. Therefore, we employ convolutional operations to adjust the weights of anomalous feature information. During the experimental phase, to compute the optimal weights for the multi-scale features, a convolutional layer was added to feature information prior to the calculation of the anomaly score, serving as an adaptive weight for training purposes. To determine the appropriate kernel size for the convolutional operation, we conducted a series of experiments. The results indicate that utilizing a 1 × 1 convolutional kernel as the adaptive weight yields the best performance in anomaly detection. The relevant formulas are as follows:
The other score we use is the sample-level anomaly score (AD) utilized for the anomaly detection task. In some approaches, the average of the summation of pixel-level anomaly scores across all pixel locations is typically employed as the anomaly score for a sample. However, this method may no longer be appropriate when the anomalous region is relatively small. For such anomalous images, although the pixel-level anomaly scores within the anomalous region are high, the vast majority of the image is composed of normal regions. Consequently, the average anomaly score of the entire image may fall within the threshold range of normal images, leading to misjudgment in anomaly detection. To avoid this situation, we opt to use the maximum value of the pixel-level anomaly scores as the sample-level anomaly score. If the score of any single pixel location in the image exceeds the threshold, we deem the image as anomalous. The calculation formula is as follows:
4. Experiments
4.1. Experiments on Small-Sample Semantic Segmentation Model
The initial experiments we conducted were focused on the small-sample semantic segmentation model proposed in this paper. The MVTec dataset’s Metal Nut subset [47] was utilized for this experiment. This subset comprises 242 images of normal nuts and 93 images of nuts with various anomalies. The anomalies in the nuts include bending, flipping, scratching, and color deviations. The regions of the nuts in the images were manually annotated to serve as the ground truth, with each image in the dataset accompanied by a corresponding binary mask. During the experiment, the images were divided into a training set (268 images), a validation set (33 images), and a testing set (34 images). In the training phase, data augmentation was performed using random horizontal and vertical flipping, while no data augmentation was applied during the prediction phase. The Adam optimizer [48] was employed in the experiments, with β = (0.5, 0.999) and a learning rate set at 0.002 for training. A cosine annealing scheduler [49] was utilized during training for optimization purposes. All experiments in this section were conducted on an NVIDIA RTX 3090 GPU with 24 GB of memory, with an epoch size of 400 until convergence and a batch size of 8. All experiments were performed in an Ubuntu 20.04 environment, using PyTorch version 2.0.0 as the deep-learning framework in conjunction with CUDA 11.8 for training.
During the experiments, the model was trained using the binary cross-entropy loss between the model’s predicted results and the ground truth. The definition of the cross-entropy loss is:
where and denote the dimensions of the image, represents the ground truth at the specific pixel location , and represents the predicted output at the specific pixel location .
4.1.1. Comparative Experiments of Segmentation Models
To demonstrate the effectiveness of the proposed model for industrial component segmentation, we selected six mainstream image segmentation models for comparison, encompassing classical segmentation models, medical segmentation models, and State-of-the-Art (SOTA) segmentation models.
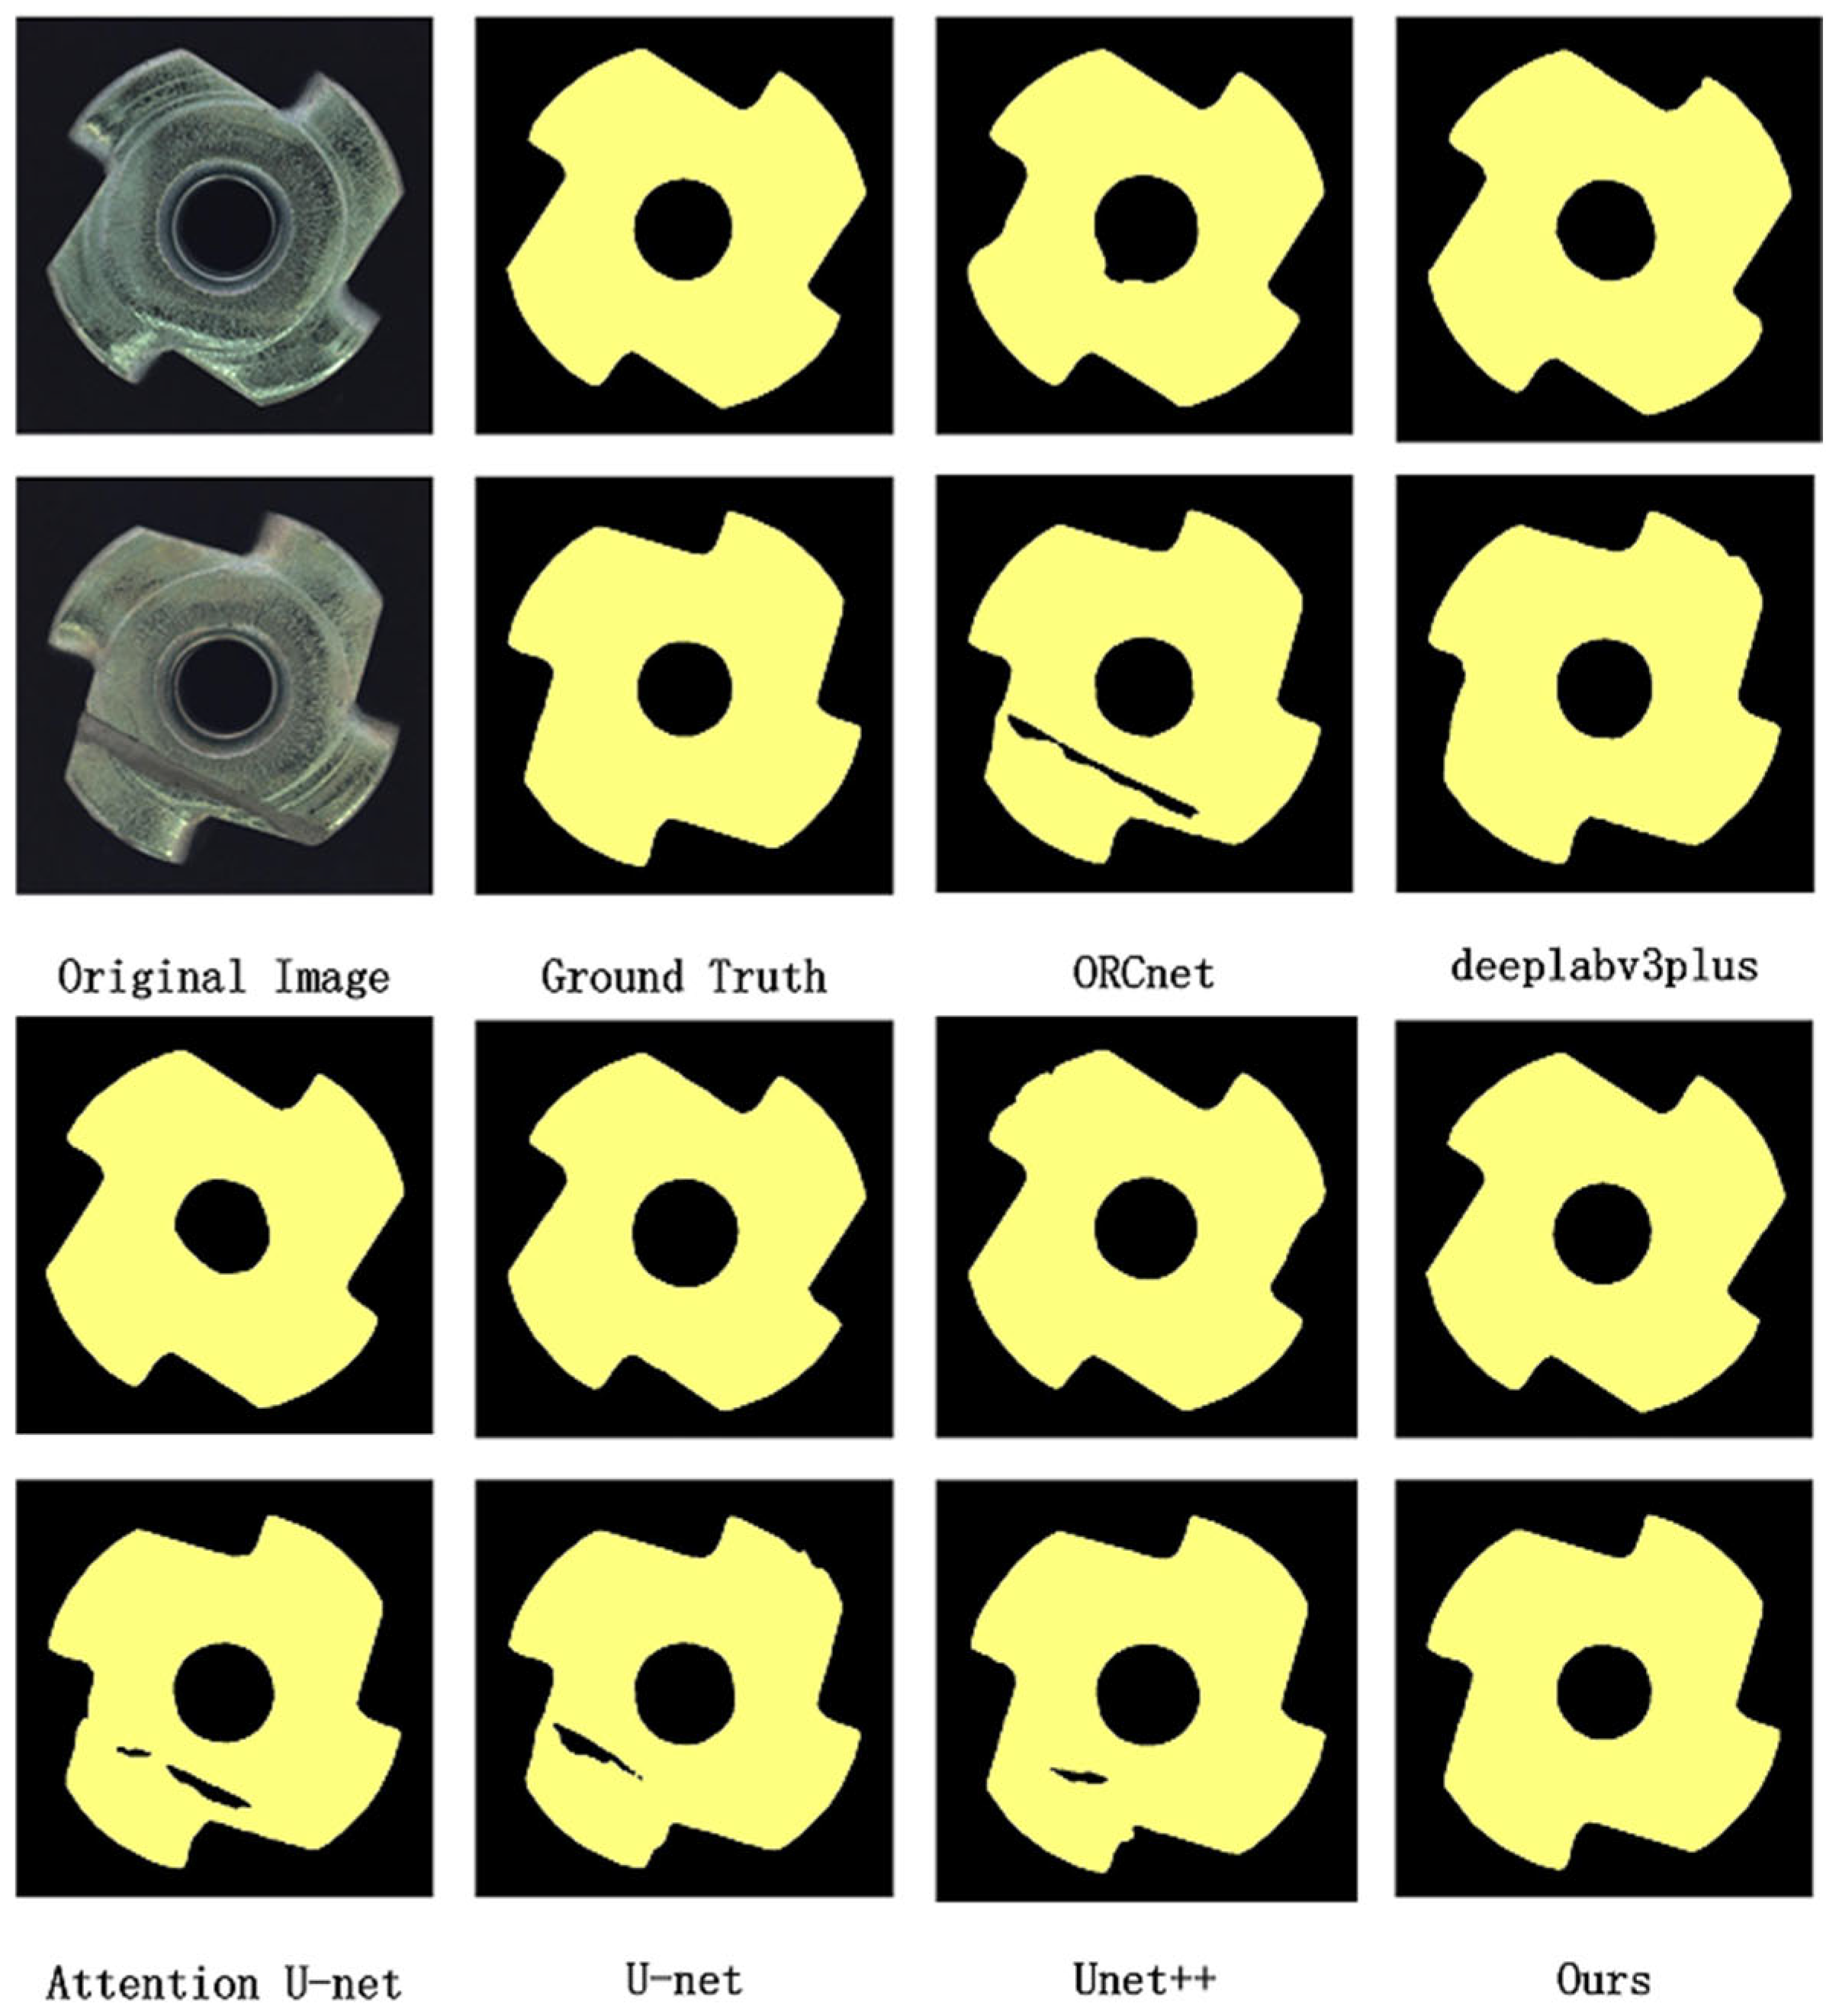
As illustrated in Figure 6, U-Net achieves relatively superior performance in the semantic segmentation of industrial components. This is particularly attributed to its skip connection mechanism, which integrates low-level feature information with high-level feature representations, thereby enabling it to perform well in capturing edges and details. However, due to its over-reliance on hierarchical image features, U-Net may struggle when segmenting defective parts. The randomness of defect features can interfere with the model’s acquisition of normal sample feature information and subsequent semantic segmentation.
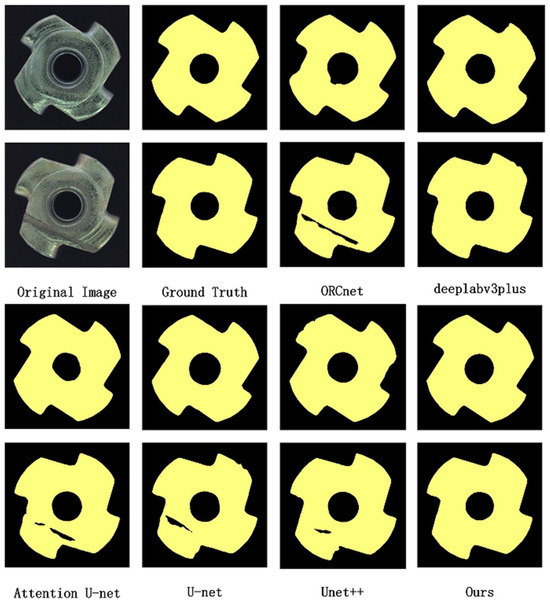
Figure 6.
Comparative analysis of semantic segmentation models.
In the case of DeepLabV3plus, its results demonstrate notable performance in identifying defective parts. This is largely due to its dilated convolution, which expands the receptive field while reducing computational load. Additionally, the incorporation of Atrous Spatial Pyramid Pooling (ASPP) [50] optimizes the segmentation of objects at different scales. Despite these advantages, DeepLabV3plus exhibits lower segmentation accuracy at edges compared to the U-Net network. The model proposed in this paper, by virtue of incorporating an Adaptive Multi-Scale Attention Module in addition to the skip connection mechanism, not only integrates low-level feature information with high-level feature representations but also extracts more multi-scale information from high-level features. As a result, it achieves superior segmentation performance during feature extraction.
To further evaluate the model’s performance, we employed six evaluation metrics for semantic segmentation [51]. As shown in Table 4, the proposed model demonstrates a leading advantage in the majority of these metrics on the small-sample dataset. Specifically, it achieves an accuracy of 96.4% in the Mean Intersection Over Union (mIoU) metric, which is the optimal result on this dataset.

Table 4.
Comparative experimental results of semantic segmentation models.
The experimental results indicate that increasing the depth of the decoder module improves the model’s performance on the industrial dataset by 1.7% in terms of the mean mIoU metric. The configuration labeled “Baseline with U-Net” adds skip connections to the four convolutional layers in the decoder. The results demonstrate that incorporating skip connections to fuse high-level and low-level feature maps enhances the model’s performance on the industrial dataset by 2.2% in terms of the mIoU metric. The configuration labeled “Baseline with all attention” introduces gated attention mechanisms before each skip connection. The results show that the gated attention mechanism effectively strengthens semantic information while mitigating the impact of noise, thereby improving the model’s performance on the industrial dataset by 3.1% in terms of the mIoU metric. The configuration labeled “Baseline with attention” adds gated attention mechanisms before the first three skip connections. The results suggest that when the semantic information structure exhibits significant disparities, the use of convolutional layers is more effective than gated attention. The configuration labeled “Ours” represents the proposed model in this paper.
4.1.2. Ablation Studies of Segmentation Model
To investigate the effectiveness of each component in the proposed method, we conducted ablation experiments. Using ResNet50 as the baseline, different components were incrementally added to the baseline model to assess their contributions. As shown in Table 5, the configuration labeled “Baseline with decoder” involves replacing the decoder part of the baseline model with four convolutional layers for upsampling.

Table 5.
Ablation studies of semantic segmentation models.
Based on the quantitative results presented in Table 4 and Table 5, it can be concluded that compared to other models, the proposed model in this paper achieves a substantial improvement in segmentation performance, with a 4.8% increase in the mIoU metric on the industrial dataset relative to ResNet50. Additionally, from the perspective of the performance improvements attributed to individual components, the U-shaped architecture based on the U-Net design has the most pronounced impact on enhancing model performance.
To rigorously assess the efficacy of the AMAM in extremely low-label regimes, we conducted a dataset reduction experiment on the MVTec Metal Nut training set. Training subsets were randomly constructed by retaining 10%, 20%, and 50% of the original annotations, corresponding to 27, 54, and 134 images, respectively; all other experimental settings remained unchanged. Table 6 compares the mIoU achieved with and without AMAM under these ratios. When only 10% of the labels are available, the model augmented with AMAM attains an mIoU of 0.942, an absolute improvement of 14.9% over the baseline without AMAM (0.823), and closely matches the performance of the conventional U-Net trained on the full dataset (0.946). These results empirically confirm that the synergistic integration of multi-scale attention and depthwise separable convolutions in AMAM markedly mitigates reliance on large-scale annotations.

Table 6.
Ablation studies on dataset reduction.
4.2. Experiments on Anomaly Detection Based on Knowledge Distillation
To validate the performance of the proposed anomaly detection model based on knowledge distillation, several experiments were conducted on the MVTec dataset [47], a publicly available benchmark. This dataset comprises high-resolution color images of 10 objects and 5 texture categories, totaling 15 classes, with approximately 5300 images. It includes normal (defect-free) images for training and anomalous images for prediction, with pixel-level ground truth annotations provided for the anomalous regions. The performance of the model was evaluated using the Area Under the Receiver Operating Characteristic (ROC) Curve (AUC) [58]. The ROC curve is plotted with the True Positive Rate (TPR) on the vertical axis and the False Positive Rate (FPR) on the horizontal axis. The AUC metric is utilized to assess the model’s predictive accuracy.
In this experiment, the teacher model employed a WideResNet50 backbone pre-trained on ImageNet. During the training phase, data augmentation was performed using random horizontal and vertical flipping, while no data augmentation was applied during the prediction phase. The Adam optimizer [48] was used with β = (0.5, 0.999) and a learning rate set at 0.005. A cosine annealing scheduler [49] was employed for optimization during training.
4.2.1. Comparative Experiments of Anomaly Detection Model
To demonstrate the effectiveness of the proposed architecture in anomaly detection, seven existing anomaly detection methods were selected for comparison, including SPADE [59], PaDiM [60], RIADP [61], and CutPaste [62]. The results of anomaly detection on the MVTec dataset are shown in Table 7. The experimental results indicate that the proposed method outperforms the SOTA methods by an average of 3.5%. For textures and objects, the proposed model achieved new SOTA AUC (AL) values of 97.9% and 98.4%, respectively.

Table 7.
Comparative experimental results of anomaly detection.
The experimental results demonstrate that the proposed method exhibits superior performance in anomaly detection for both texture and object images on the MVTec dataset compared to existing methods. Among them, the CutPaste model, which also employs reconstruction-based anomaly detection, shows promising performance, thereby validating the effectiveness of reconstruction-based approaches in anomaly detection. However, unlike the proposed method, CutPaste reconstructs the sample itself rather than the feature information extracted by the teacher model. Reconstructing feature information instead of the sample itself can more effectively reduce noise and better identify latent features. Moreover, in the proposed model, the teacher and student networks are designed to be inversely symmetric, which helps to avoid performance degradation in anomaly detection due to overfitting of the teacher and student networks, thereby enhancing overall anomaly detection performance.
4.2.2. Ablation Studies of Anomaly Detection Model
The backbone network serves as a core component of the model, responsible for extracting feature information from the input data. Deeper and wider networks typically possess a greater number of parameters and stronger representational capabilities, enabling them to more effectively capture complex features within the data. In anomaly detection tasks, employing a deeper and wider network as the teacher network is generally expected to yield better performance. We conducted ablation experiments using different backbone networks for the teacher network. The results are presented in Table 8. The Swin Transformer, which has more parameters and stronger feature extraction capabilities, did not achieve the best performance in the anomaly detection task. This may be attributed to the characteristics of the dataset or the distribution of anomalous samples, which could have led to a decline in the performance of the Swin Transformer for anomaly detection.

Table 8.
Ablation studies on the teacher backbone network.
To validate the effectiveness of the feature aggregation and filtering module, we conducted ablation experiments involving the MFF block, the Vision Transformer (ViT) module, and the Residual (Res) module to investigate their contributions to anomaly detection. As shown in Table 9, a pre-trained teacher model (Pre) was employed as the baseline in the ablation experiments. The effects of adding the residual module alone, adding the residual module and the Multi-Scale Feature Fusion module, and adding the residual module, the Multi-Scale Feature Fusion module, and the ViT module were tested, respectively.

Table 9.
Ablation Studies on the feature aggregation and filtering module.
The experimental results demonstrate that the incorporation of residual blocks, which focus on extracting single high-level features, leads to significant improvements in both detection and localization performance. The addition of the Multi-Scale Feature Fusion module integrates rich multi-scale features into the embedding space, endowing the student model with more detailed feature information and thereby enhancing its performance in anomaly localization. However, an excess of detailed features may cause the student model’s reconstruction to closely resemble that of the teacher model when dealing with anomalous samples, resulting in a substantial decline in anomaly detection performance. The inclusion of the ViT module filters out some anomalous details and noise, thereby improving the performance in both anomaly detection and localization.
To evaluate the effectiveness of the loss functions employed in this paper for anomaly detection, ablation experiments were conducted to assess the average AUC scores for AL using different loss functions on the Textures and Objects subsets. The experimental results are presented in Table 10. It can be observed that the loss function based on Cosine Similarity utilized in this paper outperforms other loss functions.

Table 10.
Ablation studies on the loss functions.
When calculating the anomaly scores, simply summing the multi-scale anomaly characteristic information fails to achieve the optimal combination. Therefore, we consider employing a convolution to adjust the weights of anomaly characteristic information. In the ablation experiments, 1 × 1, 3 × 3, and 5 × 5 convolutions, as well as no convolution, were added before the anomaly characteristic information at each scale to adaptively modulate the weights of the anomaly characteristic information at different scales. The results indicate that using 1 × 1 convolution as the adaptive weight yields better detection performance and a higher AUC score for AL, as shown in Table 11.

Table 11.
Experiments on adaptive weighting using different convolutions.
To verify whether the heterogeneity of the teacher and student networks can effectively prevent the complete reconstruction of abnormal features, we designed an experiment. In the experiment, we compared homogeneous networks (both the teacher and student networks are WideResNet50) and heterogeneous networks (the teacher network is WideResNet50, while the student network is a custom multi-level residual network). The dataset used was the MVTec Metal Nut, which includes both normal and abnormal samples. Under the homogeneous network setting, the model achieved an AUC of 95.2%, indicating that the feature reconstruction differences between the teacher and student networks were relatively small for abnormal samples, leading to limited anomaly detection performance. In contrast, under the heterogeneous network setting, the model’s AUC increased to 98.3%, significantly higher than that of the homogeneous network. This suggests that the heterogeneous network can more effectively capture the feature differences in abnormal samples, thereby enhancing the accuracy of anomaly detection.
4.3. Experiments on Two-Stage Anomaly Detection Method
To investigate the impact of segmentation results on anomaly detection, we utilized the Metal Nut subset of the MVTec dataset. Two sets of experiments were designed for evaluation. The first set employed a one-stage anomaly detection approach, where a knowledge distillation-based anomaly detection model was trained using normal data and subsequently used for anomaly detection. The second set adopted a two-stage anomaly detection approach. Initially, the proposed small-sample semantic segmentation model was used to segment the images. Subsequently, the knowledge distillation-based anomaly detection model was employed to conduct cascaded knowledge distillation training on the segmented normal data, followed by anomaly detection. The experimental procedure is illustrated in Figure 7.

Figure 7.
The Workflow of the two-stage anomaly detection method.
In terms of the AOC (AL) scores obtained from the two sets of experiments, the one-stage anomaly detection approach achieved a score of 97.8% on the Metal Nut dataset, while the two-stage anomaly detection approach attained a score of 98.5%. The results demonstrate that the two-stage anomaly detection method significantly outperforms direct anomaly detection.
As illustrated in Figure 8, (a) depicts the distribution of results from the two-stage anomaly detection method, while (b) shows the distribution from the one-stage anomaly detection method. It can be observed that in (a), the overlap between the blue region (representing normal data) and the red region (representing anomalous data) is significantly reduced. The two types of data are clearly distinguished, with the blue region predominantly concentrated near 0, indicating that the method can effectively differentiate between these two types of data. In contrast, (b) exhibits a greater overlap between the blue and red regions, particularly with a uniform distribution trend for the anomalous data, suggesting a weaker capability in identifying anomalous data.

Figure 8.
Comparison of Anomaly Score Distributions. (a) the distribution of results from the two-stage anomaly detection method; (b) distribution from the one-stage anomaly detection method.
The experimental results indicate that in anomaly detection for complex industrial data, the intricate structure and texture of industrial data can make subtle anomalies difficult to detect, thereby affecting the detection performance. Based on the two-stage detection method, the initial step involves segmenting the larger-sized inspection images using a semantic segmentation model to isolate the regions of interest. Subsequently, these segmented regions are fed into the anomaly detection model. With the reduction in the size of the detection area and the simplification of the texture within the inspection images, the accuracy of anomaly detection is significantly enhanced.
5. Conclusions
Confronted with complex industrial components, we employ a two-stage detection approach to enhance the accuracy of anomaly detection. In the semantic segmentation phase, a U-shaped architecture with skip connections is proposed as the fundamental framework for the semantic segmentation model, thereby achieving satisfactory performance in terms of edges and details when dealing with limited industrial component data. Additionally, it increases the focus on high-resolution features, enabling the capture of a sufficiently large receptive field and effectively mitigating interference caused by anomalous features. Moreover, to reduce the number of network parameters for improved efficiency and to better extract global information from high-level features, an Adaptive Multi-Scale Attention Module (AMAM) is proposed to enhance segmentation performance. Within this module, parallel multi-level depthwise separable convolutions are employed, allowing feature information to better adapt to multiple scales. To obtain more comprehensive contextual information, a self-attention mechanism is designed to complement it.
In the anomaly detection model segment, a novel Transformer-based serial knowledge distillation anomaly detection model is proposed. A pre-trained WideResNet50 network is utilized as the teacher network, while the student network employs a customized multi-level residual network. The heterogeneity between the teacher and student networks effectively reduces the likelihood of complete reconstruction of anomalous features by knowledge distillation. A Transformer-based multi-scale feature aggregation and filtering module is used to further compress feature data and reduce noise. Ultimately, the normality of input images is determined by the differences in cosine similarity between corresponding features in the teacher and student networks.
Experiments conducted on the MVTec dataset demonstrate that, compared to existing mainstream image segmentation models, the proposed small-sample semantic segmentation model achieves superior segmentation performance. Experiments demonstrate that AMAM maintains an mIoU above 94% when only 10% of the annotations are available, substantially alleviating the scarcity of defective samples in industrial scenarios. In comparison with SOTA anomaly detection methods, the proposed knowledge distillation-based anomaly detection model exhibits better performance in detecting anomalies in both texture and object images on the MVTec dataset. Additionally, through experimental comparisons, the proposed two-stage anomaly detection method is shown to more accurately localize anomalous regions and achieve better detection results than direct one-stage anomaly detection.
Author Contributions
Conceptualization, L.G.; methodology, L.G.; software, L.G.; validation, L.G.; formal analysis, F.L.; investigation, F.L.; resources, F.L.; writing—original draft preparation, L.G.; writing—review and editing, L.G.; supervision, L.G.; project administration, L.G.; funding acquisition, F.L. All authors have read and agreed to the published version of the manuscript.
Funding
This research was funded by the National Natural Science Foundation of China, grant number 62003004.
Data Availability Statement
No new data were created or analyzed in this study. Data sharing is not applicable to this article.
Conflicts of Interest
The authors declare no conflicts of interest.
Abbreviations
The following abbreviations are used in this manuscript:
| AMAM | Adaptive Multi-Scale Attention Module |
| CNNs | Convolutional Neural Networks |
| IIoT | Industrial Internet of Things |
| SVM | Support Vector Machines |
| GANs | Generative Adversarial Networks |
| MMRD | Multi-Modal Reverse Distillation |
| MFF | Multi-Scale Feature Fusion |
| AL | Pixel-Level Anomaly Detection Score |
| AD | Sample-Level Anomaly Score |
| SOTA | State-of-the-Art |
| ASPP | Atrous Spatial Pyramid Pooling |
| mIoU | Mean Intersection Over Union |
| ROC | Receiver Operating Characteristic |
| AUC | Area Under the Receiver Operating Characteristic Curve |
| TPR | True Positive Rate |
| FPR | False Positive Rate |
| ViT | Vision Transformer |
| Res | Residual Module |
| Pre | A Pre-Trained Teacher Model |
References
- Wen, L.; Zhang, Y.; Hu, W.; Li, X. The survey of industrial anomaly detection for industry 5.0. Int. J. Comput. Integr. Manuf. 2024, 9, 1–22. [Google Scholar] [CrossRef]
- Lu, R.; Wu, A.; Zhang, T.; Wang, Y. Review on automated optical (visual) inspection and its applications in defect detection. Acta Opt. Sin. 2018, 38, 8. [Google Scholar] [CrossRef]
- Li, Z.; Yang, Q. System design for PCB defects detection based on AOI technology. In Proceedings of the 2011 4th International Congress on Image and Signal Processing, Shanghai, China, 15–17 October 2011; pp. 1988–1991. [Google Scholar] [CrossRef]
- UnitX. Machine Vision in Industrial Automation: A Comprehensive Guide. Available online: https://resources.unitxlabs.com/machine-vision-industrial-automation-guide/ (accessed on 5 July 2025).
- Ren, Z.; Fang, F.; Yan, N.; Wu, Y. State of the Art in Defect Detection Based on Machine Vision. Int. J. Precis. Eng. Manuf. Green Technol. 2022, 9, 661–691. [Google Scholar] [CrossRef]
- The Evolution of Defect Detection: From Traditional Methods to Machine Vision and AI|Robro Systems. Available online: https://www.robrosystems.com/blogs/post/the-evolution-of-defect-detection-from-traditional-methods-to-machine-vision-and-ai (accessed on 5 July 2025).
- Ghelani, H. AI-Driven Quality Control in PCB Manufacturing: Enhancing Production Efficiency and Precision. Int. J. Sci. Res. Manag. IJSRM 2024, 12, 1549–1564. [Google Scholar] [CrossRef]
- Cheng, M.-M.; Jiang, P.-T.; Han, L.-H.; Wang, L.; Torr, P. Deeply Explain CNN Via Hierarchical Decomposition. Int. J. Comput. Vis. 2023, 131, 1091–1105. [Google Scholar] [CrossRef]
- Mohammadi, S.; Rahmanian, V.; Karganroudi, S.S.; Adda, M. Smart Defect Detection in Aero-Engines: Evaluating Transfer Learning with VGG19 and Data-Efficient Image Transformer Models. Machines 2025, 13, 49. [Google Scholar] [CrossRef]
- Xu, J.; Ma, J. Auto Parts Defect Detection Based on Few-shot Learning. In Proceedings of the 2022 3rd International Conference on Computer Vision, Image and Deep Learning & International Conference on Computer Engineering and Applications (CVIDL & ICCEA), Changchun, China, 20–22 May 2022; pp. 943–946. [Google Scholar] [CrossRef]
- De La Rosa, F.L.; Gómez-Sirvent, J.L.; Morales, R.; Sánchez-Reolid, R.; Fernández-Caballero, A. Defect detection and classification on semiconductor wafers using two-stage geometric transformation-based data augmentation and SqueezeNet lightweight convolutional neural network. Comput. Ind. Eng. 2023, 183, 109549. [Google Scholar] [CrossRef]
- Wang, J.; Wu, Y.; Chen, Y.-Q. Branchy Deep Learning Based Real-Time Defect Detection Under Edge-Cloud Fusion Architecture. IEEE Trans. Cloud Comput. 2023, 11, 3301–3313. [Google Scholar] [CrossRef]
- Dosovitskiy, A.; Beyer, L.; Kolesnikov, A.; Weissenborn, D.; Zhai, X.; Unterthiner, T.; Dehghani, M.; Minderer, M.; Heigold, G.; Gelly, S.; et al. An Image is Worth 16x16 Words: Transformers for Image Recognition at Scale. arXiv 2021, arXiv:2010.11929. [Google Scholar] [CrossRef]
- Yao, D.; Shao, Y. A data efficient transformer based on Swin Transformer. Vis. Comput. 2024, 40, 2589–2598. [Google Scholar] [CrossRef]
- Xu, H.; Pang, G.; Wang, Y.; Wang, Y. Deep Isolation Forest for Anomaly Detection. IEEE Trans. Knowl. Data Eng. 2023, 35, 12591–12604. [Google Scholar] [CrossRef]
- Prunella, M.; Scardigno, R.M.; Buongiorno, D.; Brunetti, A.; Longo, N.; Carli, R.; Dotoli, M.; Bevilacqua, V. Deep Learning for Automatic Vision-Based Recognition of Industrial Surface Defects: A Survey. IEEE Access 2023, 11, 43370–43423. [Google Scholar] [CrossRef]
- Gobert, C.; Reutzel, E.W.; Petrich, J.; Nassar, A.R.; Phoha, S. Application of supervised machine learning for defect detection during metallic powder bed fusion additive manufacturing using high resolution imaging. Addit. Manuf. 2018, 21, 517–528. [Google Scholar] [CrossRef]
- Ding, C.; Pang, G.; Shen, C. Catching Both Gray and Black Swans: Open-set Supervised Anomaly Detection. In Proceedings of the 2022 IEEE/CVF Conference on Computer Vision and Pattern Recognition (CVPR), New Orleans, LA, USA, 18–24 June 2022; IEEE: Piscataway, NJ, USA, 2022; pp. 7378–7388. [Google Scholar] [CrossRef]
- Guo, Y.; Kalinin, S.V.; Cai, H.; Xiao, K.; Krylyuk, S.; Davydov, A.V.; Guo, Q.; Lupini, A.R. Defect detection in atomic-resolution images via unsupervised learning with translational invariance. Npj Comput. Mater. 2021, 7, 180. [Google Scholar] [CrossRef]
- Zabin, M.; Kabir, A.N.B.; Kabir, M.K.; Choi, H.-J.; Uddin, J. Contrastive self-supervised representation learning framework for metal surface defect detection. J. Big Data 2023, 10, 145. [Google Scholar] [CrossRef]
- Kim, Y.; Lee, J.-S.; Lee, J.-H. Automatic Defect Classification Using Semi-Supervised Learning with Defect Localization. IEEE Trans. Semicond. Manuf. 2023, 36, 476–485. [Google Scholar] [CrossRef]
- Kong, F.; Li, J.; Jiang, B.; Wang, H.; Song, H. Integrated Generative Model for Industrial Anomaly Detection via Bidirectional LSTM and Attention Mechanism. IEEE Trans. Ind. Inform. 2023, 19, 541–550. [Google Scholar] [CrossRef]
- Xu, X. Research on the application of coordinate measuring machines in aerospace vehicle component inspection. Autom. Appl. 2024, 65, 121–123. [Google Scholar]
- Zhang, Y.; Pan, B.; Guo, G.; Zhao, P. Comparison of measurement precision of strain and Poisson’s ratio using contact and non-contact extensometer. J. Exp. Mech. 2018, 33, 59–68. [Google Scholar]
- Sun, L.; Ye, Y. Technical property and application of industrial computed tomography. Nucl. Electron. Detect. Technol. 2006, 26, 486–488. [Google Scholar]
- Lv, N.; Sun, P.; Lou, X.; Han, J. Key Techniques for 3-D structured light photogrammetry. J. Beijing Inf. Sci. Technol. Univ. 2010, 25, 1–5. [Google Scholar]
- Jin, W. Research of outlier detection and data recovery based on statistical method. Master’s Thesis, Nanjing University of Posts and Telecommunications, Nanjing, China, May 2016. [Google Scholar]
- Tseng, C.-J.; Tang, C. An optimized XGBoost technique for accurate brain tumor detection using feature selection and image segmentation. Healthc. Anal. 2023, 4, 100217. [Google Scholar] [CrossRef]
- Pang, G.; Shen, C.; Cao, L.; Hengel, A.V.D. Deep Learning for Anomaly Detection: A Review. ACM Comput. Surv. 2022, 54, 1–38. [Google Scholar] [CrossRef]
- Jia, W.; Shukla, R.M.; Sengupta, S. Anomaly Detection using Supervised Learning and Multiple Statistical Methods. In Proceedings of the 2019 18th IEEE International Conference on Machine Learning and Applications (ICMLA), Boca Raton, FL, USA, 16–19 December 2019; IEEE: Piscataway, NJ, USA, 2019; pp. 1291–1297. [Google Scholar] [CrossRef]
- Liu, M.; Wu, Y.; Wang, X. Implementation of track surface defect inspection based on convolutional neural network. Mod. Comput. 2017, 29, 65–69. [Google Scholar]
- Chen, S.; Guo, W. Auto-Encoders in Deep Learning—A Review with New Perspectives. Mathematics 2023, 11, 1777. [Google Scholar] [CrossRef]
- Varalakshmi, B.D.; Lingaraju, G.M. Enhancing Industrial Anomaly Detection with Auto Encoder-Based Temporal Convolutional Networks for Motor Fault Classification. SN Comput. Sci. 2024, 5, 1067. [Google Scholar] [CrossRef]
- Zhan, K.; Wang, C.; Zheng, X.; Kong, C.; Li, G.; Xin, W.; Liu, L. Seq2Seq-based GRU autoencoder for anomaly detection and failure identification in coal mining hydraulic support systems. Sci. Rep. 2025, 15, 542. [Google Scholar] [CrossRef]
- Jiang, R.; Xue, Y.; Zou, D. Interpretability-Aware Industrial Anomaly Detection Using Autoencoders. IEEE Access 2023, 11, 60490–60500. [Google Scholar] [CrossRef]
- Xiao, F.; Zhou, J.; Han, K.; Hu, H.; Fan, J. Unsupervised anomaly detection using inverse generative adversarial networks. Inf. Sci. 2025, 689, 121435. [Google Scholar] [CrossRef]
- Zhuang, Y.; Lin, S.; Lin, Z.; Zhang, Y.; Guo, T. Study on generative adversarial network for data anomaly detection. Comput. Eng. Appl. 2022, 58, 143–149. [Google Scholar]
- Akcay, S.; Atapour-Abarghouei, A.; Breckon, T. GANomaly: Semi-supervised Anomaly Detection via Adversarial Training. In Computer Vision—ACCV 2018; Jawahar, C.V., Li, H., Mori, G., Schindler, K., Eds.; Lecture Notes in Computer Science; Springer International Publishing: Cham, Switzerland, 2019; Volume 11363, pp. 622–637. [Google Scholar] [CrossRef]
- Bergmann, P.; Fauser, M.; Sattlegger, D.; Steger, C. Uninformed Students: Student-Teacher Anomaly Detection with Discriminative Latent Embeddings. In Proceedings of the 2020 IEEE/CVF Conference on Computer Vision and Pattern Recognition (CVPR), Seattle, WA, USA, 13–19 June 2020; IEEE: Piscataway, NJ, USA, 2020; pp. 4182–4191. [Google Scholar] [CrossRef]
- Gu, Z.; Zhang, J.; Liu, L.; Chen, X.; Peng, J.; Gan, Z.; Jiang, G.; Shu, A.; Wang, Y.; Ma, L. Rethinking Reverse Distillation for Multi-Modal Anomaly Detection. Proc. AAAI Conf. Artif. Intell. 2024, 38, 8445–8453. [Google Scholar] [CrossRef]
- He, K.; Zhang, X.; Ren, S.; Sun, J. Deep Residual Learning for Image Recognition. In Proceedings of the 2016 IEEE Conference on Computer Vision and Pattern Recognition (CVPR), Las Vegas, NV, USA, 27–30 June 2016; IEEE: Piscataway, NJ, USA, 2016; pp. 770–778. [Google Scholar] [CrossRef]
- Chen, L.-C.; Zhu, Y.; Papandreou, G.; Schroff, F.; Adam, H. Encoder-Decoder with Atrous Separable Convolution for Semantic Image Segmentation. In Computer Vision—ECCV 2018; Ferrari, V., Hebert, M., Sminchisescu, C., Weiss, Y., Eds.; Lecture Notes in Computer Science; Springer International Publishing: Cham, Switzerland, 2018; Volume 11211, pp. 833–851. [Google Scholar] [CrossRef]
- Chen, L.-C.; Papandreou, G.; Schroff, F.; Adam, H. Rethinking Atrous Convolution for Semantic Image Segmentation. arXiv 2017, arXiv:1706.05587. [Google Scholar] [CrossRef]
- Dong, W.; Liang, H.; Liu, G.; Hu, Q.; Yu, X. Review of deep convolution applied to target detection algorithms. J. Front. Comput. Sci. Technol. 2022, 16, 1025–1042. [Google Scholar]
- Zagoruyko, S.; Komodakis, N. Wide Residual Networks. arXiv 2016, arXiv:1605.07146. [Google Scholar] [CrossRef]
- Deng, J.; Dong, W.; Socher, R.; Li, L.-J.; Li, K.; Li, F. ImageNet: A large-scale hierarchical image database. In Proceedings of the 2009 IEEE Conference on Computer Vision and Pattern Recognition, Miami, FL, USA, 20–25 June 2009; IEEE: Piscataway, NJ, USA, 2009; pp. 248–255. [Google Scholar] [CrossRef]
- Bergmann, P.; Fauser, M.; Sattlegger, D.; Steger, C. MVTec AD—A Comprehensive Real-World Dataset for Unsupervised Anomaly Detection. In Proceedings of the 2019 IEEE/CVF Conference on Computer Vision and Pattern Recognition (CVPR), Long Beach, CA, USA, 15–20 June 2019; IEEE: Piscataway, NJ, USA, 2019; pp. 9584–9592. [Google Scholar] [CrossRef]
- Zhang, Z. Improved Adam Optimizer for Deep Neural Networks. In Proceedings of the 2018 IEEE/ACM 26th International Symposium on Quality of Service (IWQoS), Banff, AB, Canada, 4–6 June 2018; IEEE: Piscataway, NJ, USA, 2018; pp. 1–2. [Google Scholar] [CrossRef]
- Wang, Z.; Hou, F.; Qiu, Y.; Ma, Z.; Singh, S.; Wang, R. CyclicAugment: Speech Data Random Augmentation with Cosine Annealing Scheduler for Automatic Speech Recognition. In Proceedings of the Interspeech 2022, Incheon, Republic of Korea, 18–22 September 2022; pp. 3859–3863. [Google Scholar] [CrossRef]
- Lian, X.; Pang, Y.; Han, J.; Pan, J. Cascaded hierarchical atrous spatial pyramid pooling module for semantic segmentation. Pattern Recognit. 2021, 110, 107622. [Google Scholar] [CrossRef]
- Tian, X.; Wang, L.; Ding, Q. Review of image semantic segmentation based on deep learning. J. Softw. 2019, 30, 440–468. [Google Scholar]
- Lucio, D.R.; Zanlorensi, L.A.; Costa, Y.M.G.; Menotti, D. ORCNet: A Context-Based Network to Simultaneously Segment the Ocular Region Components. Neural Process. Lett. 2025, 57, 49. [Google Scholar] [CrossRef]
- Chen, L.-C.; Papandreou, G.; Kokkinos, I.; Murphy, K.; Yuille, A.L. DeepLab: Semantic Image Segmentation with Deep Convolutional Nets, Atrous Convolution, and Fully Connected CRFs. IEEE Trans. Pattern Anal. Mach. Intell. 2018, 40, 834–848. [Google Scholar] [CrossRef]
- Zhao, H.; Shi, J.; Qi, X.; Wang, X.; Jia, J. Pyramid Scene Parsing Network. In Proceedings of the 2017 IEEE Conference on Computer Vision and Pattern Recognition (CVPR), Honolulu, HI, USA, 21–26 July 2017; IEEE: Piscataway, NJ, USA, 2017; pp. 6230–6239. [Google Scholar] [CrossRef]
- Oktay, O.; Schlemper, J.; Folgoc, L.; Lee, M.; Heinrich, M.; Misawa, K.; Mori, K.; McDonagh, S.; Hammerla, N.; Kainz, B.; et al. Attention U-Net: Learning Where to Look for the Pancreas. arXiv 2018, arXiv:1804.03999. [Google Scholar] [CrossRef]
- Ronneberger, O.; Fischer, P.; Brox, T. U-Net: Convolutional Networks for Biomedical Image Segmentation. In Medical Image Computing and Computer-Assisted Intervention—MICCAI 2015; Navab, N., Hornegger, J., Wells, W.M., Frangi, A.F., Eds.; Lecture Notes in Computer Science; Springer International Publishing: Cham, Switzerland, 2015; Volume 9351, pp. 234–241. [Google Scholar] [CrossRef]
- Zhou, Z.; Siddiquee, M.M.R.; Tajbakhsh, N.; Liang, J. UNet++: Redesigning Skip Connections to Exploit Multiscale Features in Image Segmentation. IEEE Trans. Med. Imaging 2020, 39, 1856–1867. [Google Scholar] [CrossRef]
- Bewick, V.; Cheek, L.; Ball, J. Statistics review 13: Receiver operating characteristic curves. Crit. Care 2004, 8, 508. [Google Scholar] [CrossRef] [PubMed]
- Cohen, N.; Hoshen, Y. Sub-Image Anomaly Detection with Deep Pyramid Correspondences. arXiv 2020, arXiv:2005.02357. [Google Scholar] [CrossRef]
- Defard, T.; Setkov, A.; Loesch, A.; Audigier, R. PaDiM: A Patch Distribution Modeling Framework for Anomaly Detection and Localization. In Pattern Recognition. ICPR International Workshops and Challenges; Lecture Notes in Computer Science; Springer International Publishing: Cham, Switzerland, 2021; pp. 475–489. [Google Scholar] [CrossRef]
- Hong, D.; Ni, J.; Shan, W.; Li, L.; Hu, X.; Yang, H.; Zhao, Q.; Zhang, X. Establishment of a rapid identification of adverse drug reaction program in R language implementation based on monitoring data. J. Zhejiang Univ. Med. Sci. 2020, 49, 253–259. [Google Scholar]
- Li, C.-L.; Sohn, K.; Yoon, J.; Pfister, T. CutPaste: Self-Supervised Learning for Anomaly Detection and Localization. In Proceedings of the 2021 IEEE/CVF Conference on Computer Vision and Pattern Recognition (CVPR), Nashville, TN, USA, 20–25 June 2021; IEEE: Piscataway, NJ, USA, 2021. [Google Scholar] [CrossRef]
Disclaimer/Publisher’s Note: The statements, opinions and data contained in all publications are solely those of the individual author(s) and contributor(s) and not of MDPI and/or the editor(s). MDPI and/or the editor(s) disclaim responsibility for any injury to people or property resulting from any ideas, methods, instructions or products referred to in the content. |
© 2025 by the authors. Licensee MDPI, Basel, Switzerland. This article is an open access article distributed under the terms and conditions of the Creative Commons Attribution (CC BY) license (https://creativecommons.org/licenses/by/4.0/).

