1. Introduction
In recent years, artificial intelligence (AI) has significantly impacted various scientific disciplines, including mechanical engineering. In the context of Industry 4.0, the implementation of AI techniques has become essential for enhancing fault monitoring and diagnosis of industrial machinery, offering rapid computation, increased accuracy, and robust performance [
1]. These advancements not only improve timely detection of anomalies but also contribute to minimizing downtime and extending machinery lifespan. The integration of advanced machine learning (ML) [
2] and deep learning (DL) [
3] techniques has driven progress in this area, particularly in optimizing the safety and reliability of industrial systems. Data-driven approaches enable the identification of patterns that are not easily recognizable through alternative methods, such as model-based ones. One of the most notable advancements is in the field of predictive maintenance, which has evolved rapidly due to the enhanced ability to monitor and forecast the machinery’s state of health (SOH). This approach, corresponding to condition-based maintenance (CBM), seeks to enhance operational efficiency, reduce costs, and promote a safer working environment, particularly in technologically advanced and complex industrial settings [
4].
In contrast to time-based maintenance (TBM), which entails scheduled preventive maintenance [
5], CBM is a strategy focused on detecting abnormalities to reduce unnecessary tasks. This approach involves three essential steps [
6]: (1) acquiring relevant data inherent to the system SOH; (2) processing and analyzing this information to gain valuable insights; and finally, (3) making decisions about maintenance tasks. A fundamental element of CBM is vibration monitoring (VM). VM is recognized as a highly effective and widely utilized technique, which employs accelerometers to measure and analyze vibrations produced by machinery during operation [
7,
8]. VM allows for a comprehensive evaluation of the health status of mechanical systems, thanks to its versatility, reliability, and cost-effectiveness. Indeed, VM guarantees rapid responses to sudden machine changes with respect to other techniques [
9]. In addition, accelerometers are not only cost-effective and reliable but also compact and lightweight, allowing for easy integration into machines. Several works in the literature report the industrial applications of VM, highlighting its relevance in the field of CBM of mechanical systems [
10,
11,
12,
13].
The analysis of accelerometric signals for classifying machinery health conditions is enabled by advanced data processing techniques. Among these, novelty detection (ND) has proven to be a robust method for detecting anomalies. The main goal of ND is to assess a system’s dynamic response to identify whether it significantly deviates from a reference condition, enabling the timely detection of abnormal operating conditions. ND operates under the assumption that the system does not encounter significant variations in environmental and operational conditions that could affect its dynamic characteristics. To mitigate the influence of confounding factors or to account for changes in the system, specific methods can be applied to enhance ND [
14]. The integration of ND with optimization algorithms, such as heuristic techniques, has shown considerable promise in diagnosing complex machinery, significantly enhancing the formulation of preventive and predictive maintenance strategies [
15].
Data-driven methods provide powerful tools to analyze complex systems and generate accurate models. However, the large volumes of data involved entail significant challenges, such as increased computational demands that require considerable resources, and the potential for overfitting, where models may capture irrelevant noise instead of meaningful patterns. In addition, the continuous growth of data generated by modern industrial systems intensifies difficulties related to both data management and analysis [
16]. The implementation of robust big data strategies [
17] is necessary to effectively manage these complexities. Various techniques, including data extraction, selection, and dimensionality reduction, have been developed to enhance the efficiency and accuracy of data analysis, particularly in machinery condition monitoring [
18]. These approaches are crucial for developing effective CBM strategies, which aim to improve operational efficiency and ensure the maximum availability of industrial systems.
In the field of machinery diagnostics and prognostics, the development of data-driven models typically involves several phases to ensure accurate condition monitoring and predictive maintenance [
19]. The main stages include (1) data acquisition, (2) data preprocessing, (3) feature extraction and feature selection, and (4) model training and validation. Within the vast literature on machinery diagnostics and prognostics, specific attention has been given to studies focused on rotating machinery diagnostics and prognostics [
20,
21,
22,
23].
This research, conducted in partnership with Tecnau SRL [
24], aims to create an innovative data-driven diagnostic system suitable for industrial use, both in specific control cycles and for real-time diagnostics during operational conditions, designed for industrial applications and capable of functioning both in specific control cycles and for real-time diagnostics under operational conditions. Unlike traditional approaches, this work does not propose a fundamentally new diagnostic technique; rather, it adapts and integrates well-established methodologies from the literature for a novel industrial application. Notably, a review of the state-of-the-art reveals that studies focused on the adjustment of rotating blades in industrial machinery are remarkably scarce, despite the presence of extensive research on diagnosing other common faults in rotating machinery [
25,
26], such as bearing faults [
27,
28], gear wear [
29,
30], or mass unbalances [
31]. Even slight blade misalignment can significantly impact product quality and production efficiency, leading to increased costs. By enabling early and reliable detection of such deviations, our approach provides a cost-effective diagnostic solution for industrial deployment. For this reason, as demonstrated by a leading industry partner, it is essential to identify the state of the rotating blade quickly and reliably, even if only through a binary classification. The two conditions analyzed in this classification—a well-aligned blade and one exhibiting incipient damage—are physically similar and difficult to distinguish, even for expert technicians. Successfully classifying these subtle differences validates the system’s sensitivity to early-stage damage, thus addressing a gap in current diagnostic systems. The condition of incipient damage refers to early-stage wear, not complete degradation. Given the high precision required by machinery, even a slight blade misalignment could compromise both product quality and the entire production process. For this reason, the proposed classification approach does not compare the two extreme SOHs of the blade. Instead, it focuses on detecting a critical threshold near the optimal operating condition. To simplify further discussion, the two analyzed conditions will be referred to as
healthy and
damaged, following standard practice in diagnostic binary classifications.
The present study builds upon prior work [
32], where the feasibility of implementing a diagnostic system was initially evaluated. That preliminary analysis provided a foundation for the proposed development of a diagnostic framework using ML techniques, such as classification. The machine under investigation is part of the “Revolution 50” series, which is used for paper processing and on-demand book production. A previous study focused on a different machine, also produced by the same company, which was designed for similar purposes in the book production phases. Although [
33] pursued a similar goal in predictive maintenance, the two systems differ considerably in their approaches to machinery health assessment due to differences in the machines themselves. In this case, the Revolution 50 uses rotating blades mounted on cylinders for cutting, whereas the system in [
33] employed a linear impulsive cutting mechanism.
This work focuses on CBM by incorporating temperature sensors (including an infrared pyrometer and thermocouples) alongside the accelerometer-based VM system, with potential integration into a Supervisory Control and Data Acquisition (SCADA) system. In the previous feasibility study, the experimental campaign was set up using Design of Experiments (DOE) techniques [
34]. Based on those initial outcomes, data from endurance tests under various operating conditions have now been collected for continuous monitoring. Rather than developing new signal features, this study demonstrates that even simple statistical features, when paired with an optimized classification pipeline, can effectively detect subtle degradation, ensuring industrial feasibility. The performance of these models was evaluated using specific indicators, and overall, the results demonstrate a high level of accuracy in recognizing the SOH of the machinery. Additionally, the analysis of the diagnostic system’s downgrade helped identify the optimal trade-offs between accuracy and cost, ensuring the system’s readiness for industrial implementation.
The article is organized as follows.
Section 2 provides a detailed description of the machinery under investigation, the data collected, and the complete data acquisition system.
Section 3 and
Section 4, respectively, outline the methodology and present the results. Finally, the conclusions of the study are summarized in
Section 5.
2. System and Dataset Description
This section briefly describes the machinery under study, the definition of tests for the condition monitoring of the machinery, and the related choices regarding the proposed diagnostic system in terms of sensors and the acquisition system implemented on the test bench.
2.1. Test Bench
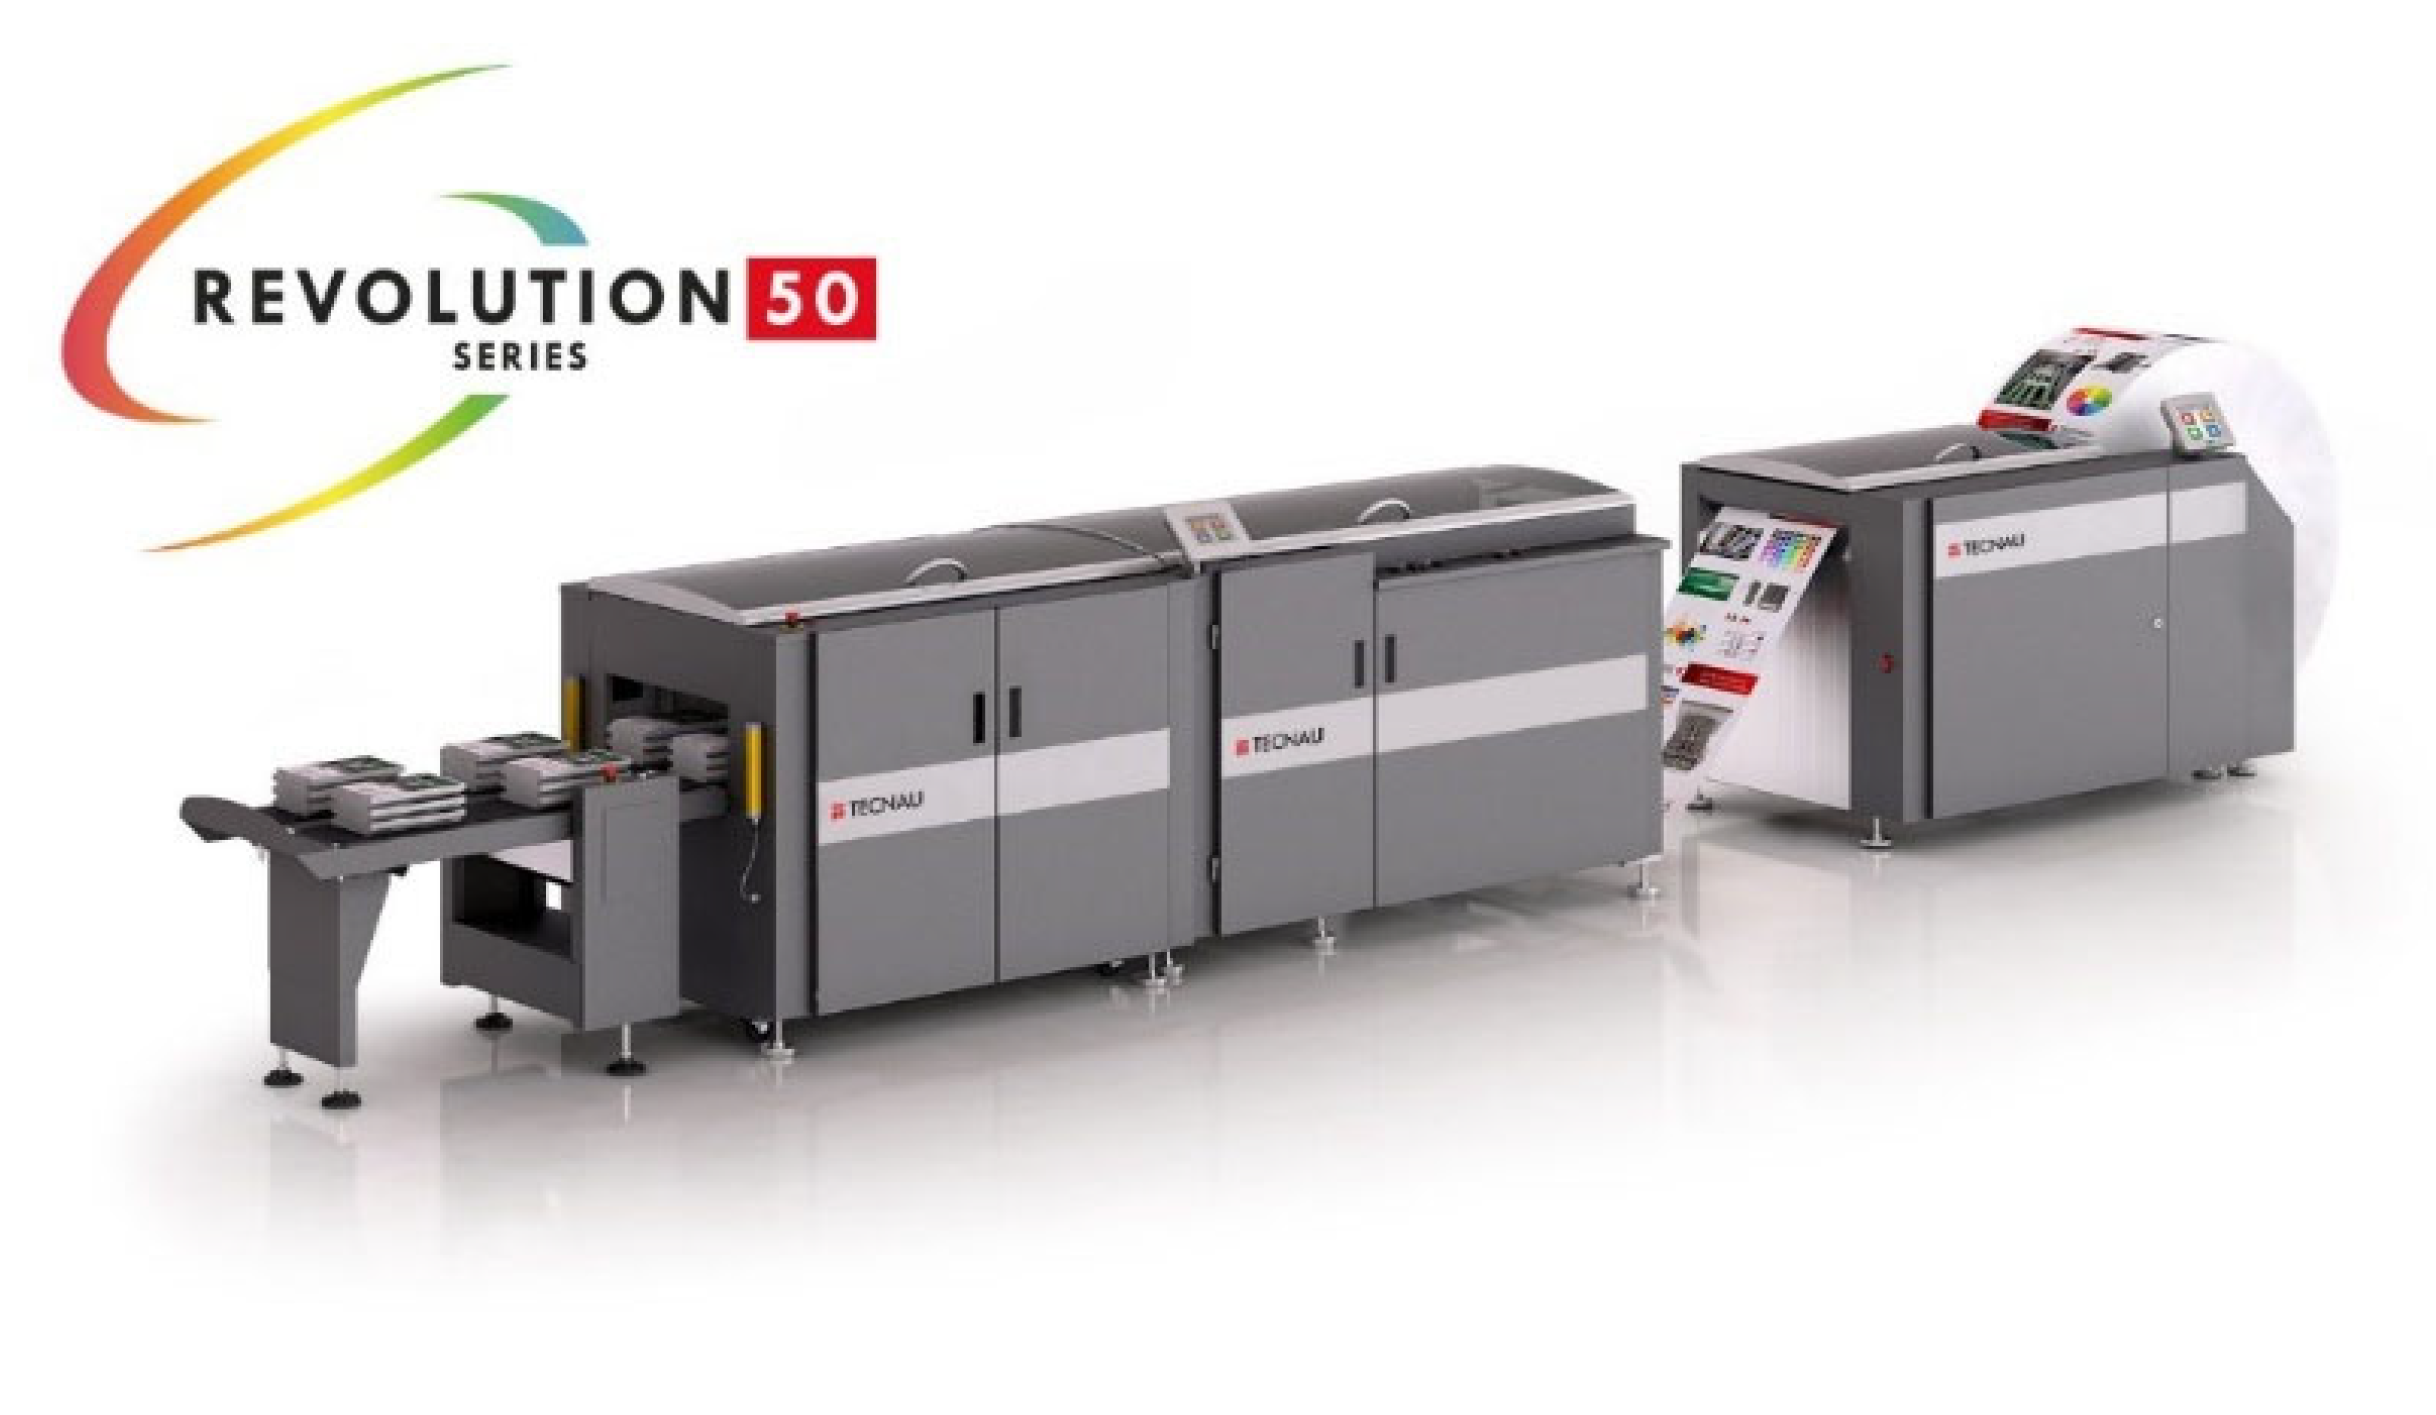
The machinery designed and manufactured by Tecnau SRL (Ivrea, Italy) is part of the “Revolution 50” series, depicted in
Figure 1. It features a sophisticated cutting system engineered for integration with high-speed printing systems. This system is primarily equipped with either single or double rotating cutters, providing exceptional performance at elevated operating speeds.
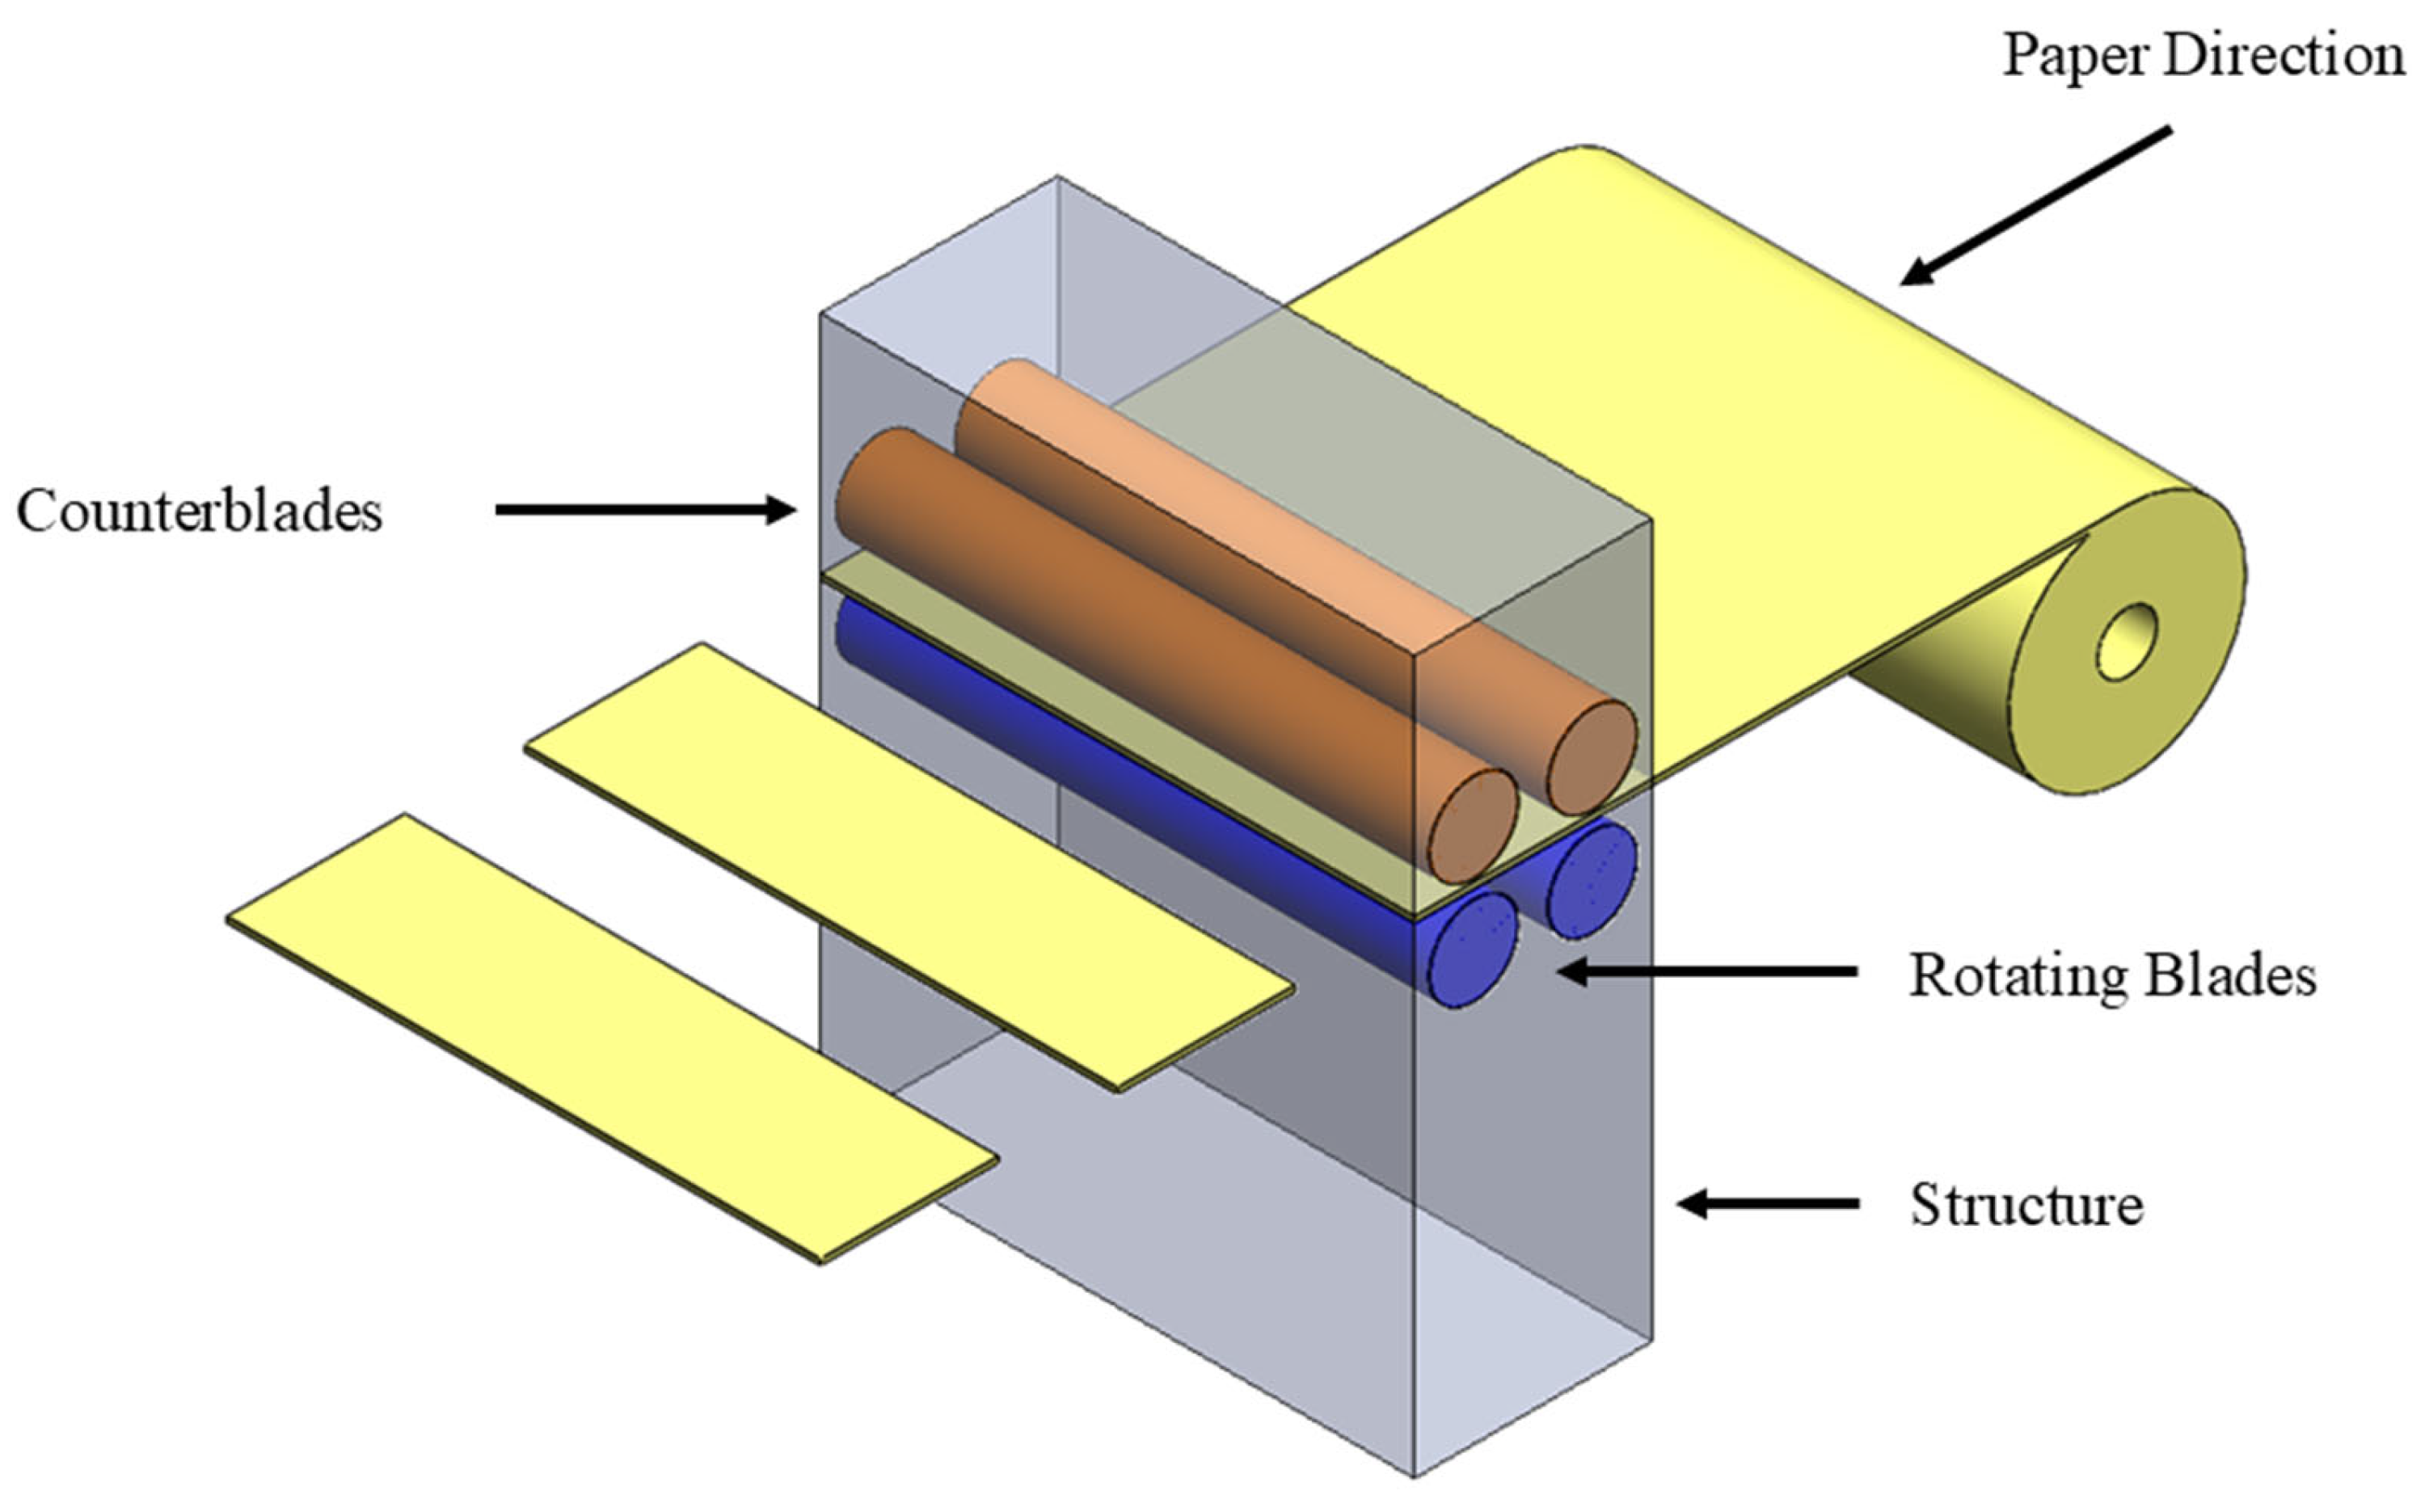
The rotating blades are critical components of the machinery, acting as its primary elements. These cylindrical blades permit the cutting of paper rolls into sheets of various sizes, utilizing variable rotational speeds. Each machine is predominantly constructed with two rotating blades and corresponding counter-blades, which undergo periodic impacts during operation.
Figure 2 provides a simplified representation of the cutting machine and its key components. Consequently, the analysis focuses on these elements, with the experimental campaign designed to measure the signals generated by the rotation and the impacts of the blades, primarily focusing on transmitted vibrations and temperature.
2.2. Sensors
To enable a comprehensive condition monitoring system, a combination of vibration and temperature sensors was deployed. Vibration measurements were acquired using two PCB 355B03 monoaxial accelerometers (PCB Piezotronics, Inc., Depew, NY, USA) and one PCB 356A16 triaxial accelerometer (PCB Piezotronics, Inc., Depew, NY, USA). With a sensitivity of approximately 100 mV/g and an operational range of ±50 g, these sensors provided precise measurements of the mechanical oscillations occurring during the cutting process. The combination of monoaxial and triaxial configurations allowed for a detailed characterization of the dynamic behavior of the system, enhancing fault detection capabilities. The accelerometers were mounted using cyanoacrylate glue, with a thin insulating layer (e.g., adhesive tape) placed between the sensor and the surface. This approach ensures electrical isolation, reducing noise and interference, while maintaining reliable mechanical coupling.
In addition to vibration monitoring, temperature measurements played a crucial role in assessing the thermal behavior of the system. An Optris CT4M fast temperature sensor (Optris GmbH & Co. KG, Berlin, Germany), a high-speed pyrometer with an exposure time of 90 µs, was implemented to obtain real-time and highly accurate measurements of the blade temperature. Furthermore, three thermocouples were placed at key points on the supporting structure to monitor temperature variations, offering valuable insights into heat dissipation and potential thermal effects on machinery performance. This integrated sensor setup was optimized to ensure high sensitivity to both mechanical and thermal deviations. Importantly, the pyrometer was utilized not solely for temperature acquisition but was also innovatively exploited to infer the angular position and rotational velocity of the blade, effectively removing the necessity for an external encoder. This novel approach simplifies the sensor setup while maintaining high accuracy in assessing the blade operational state.
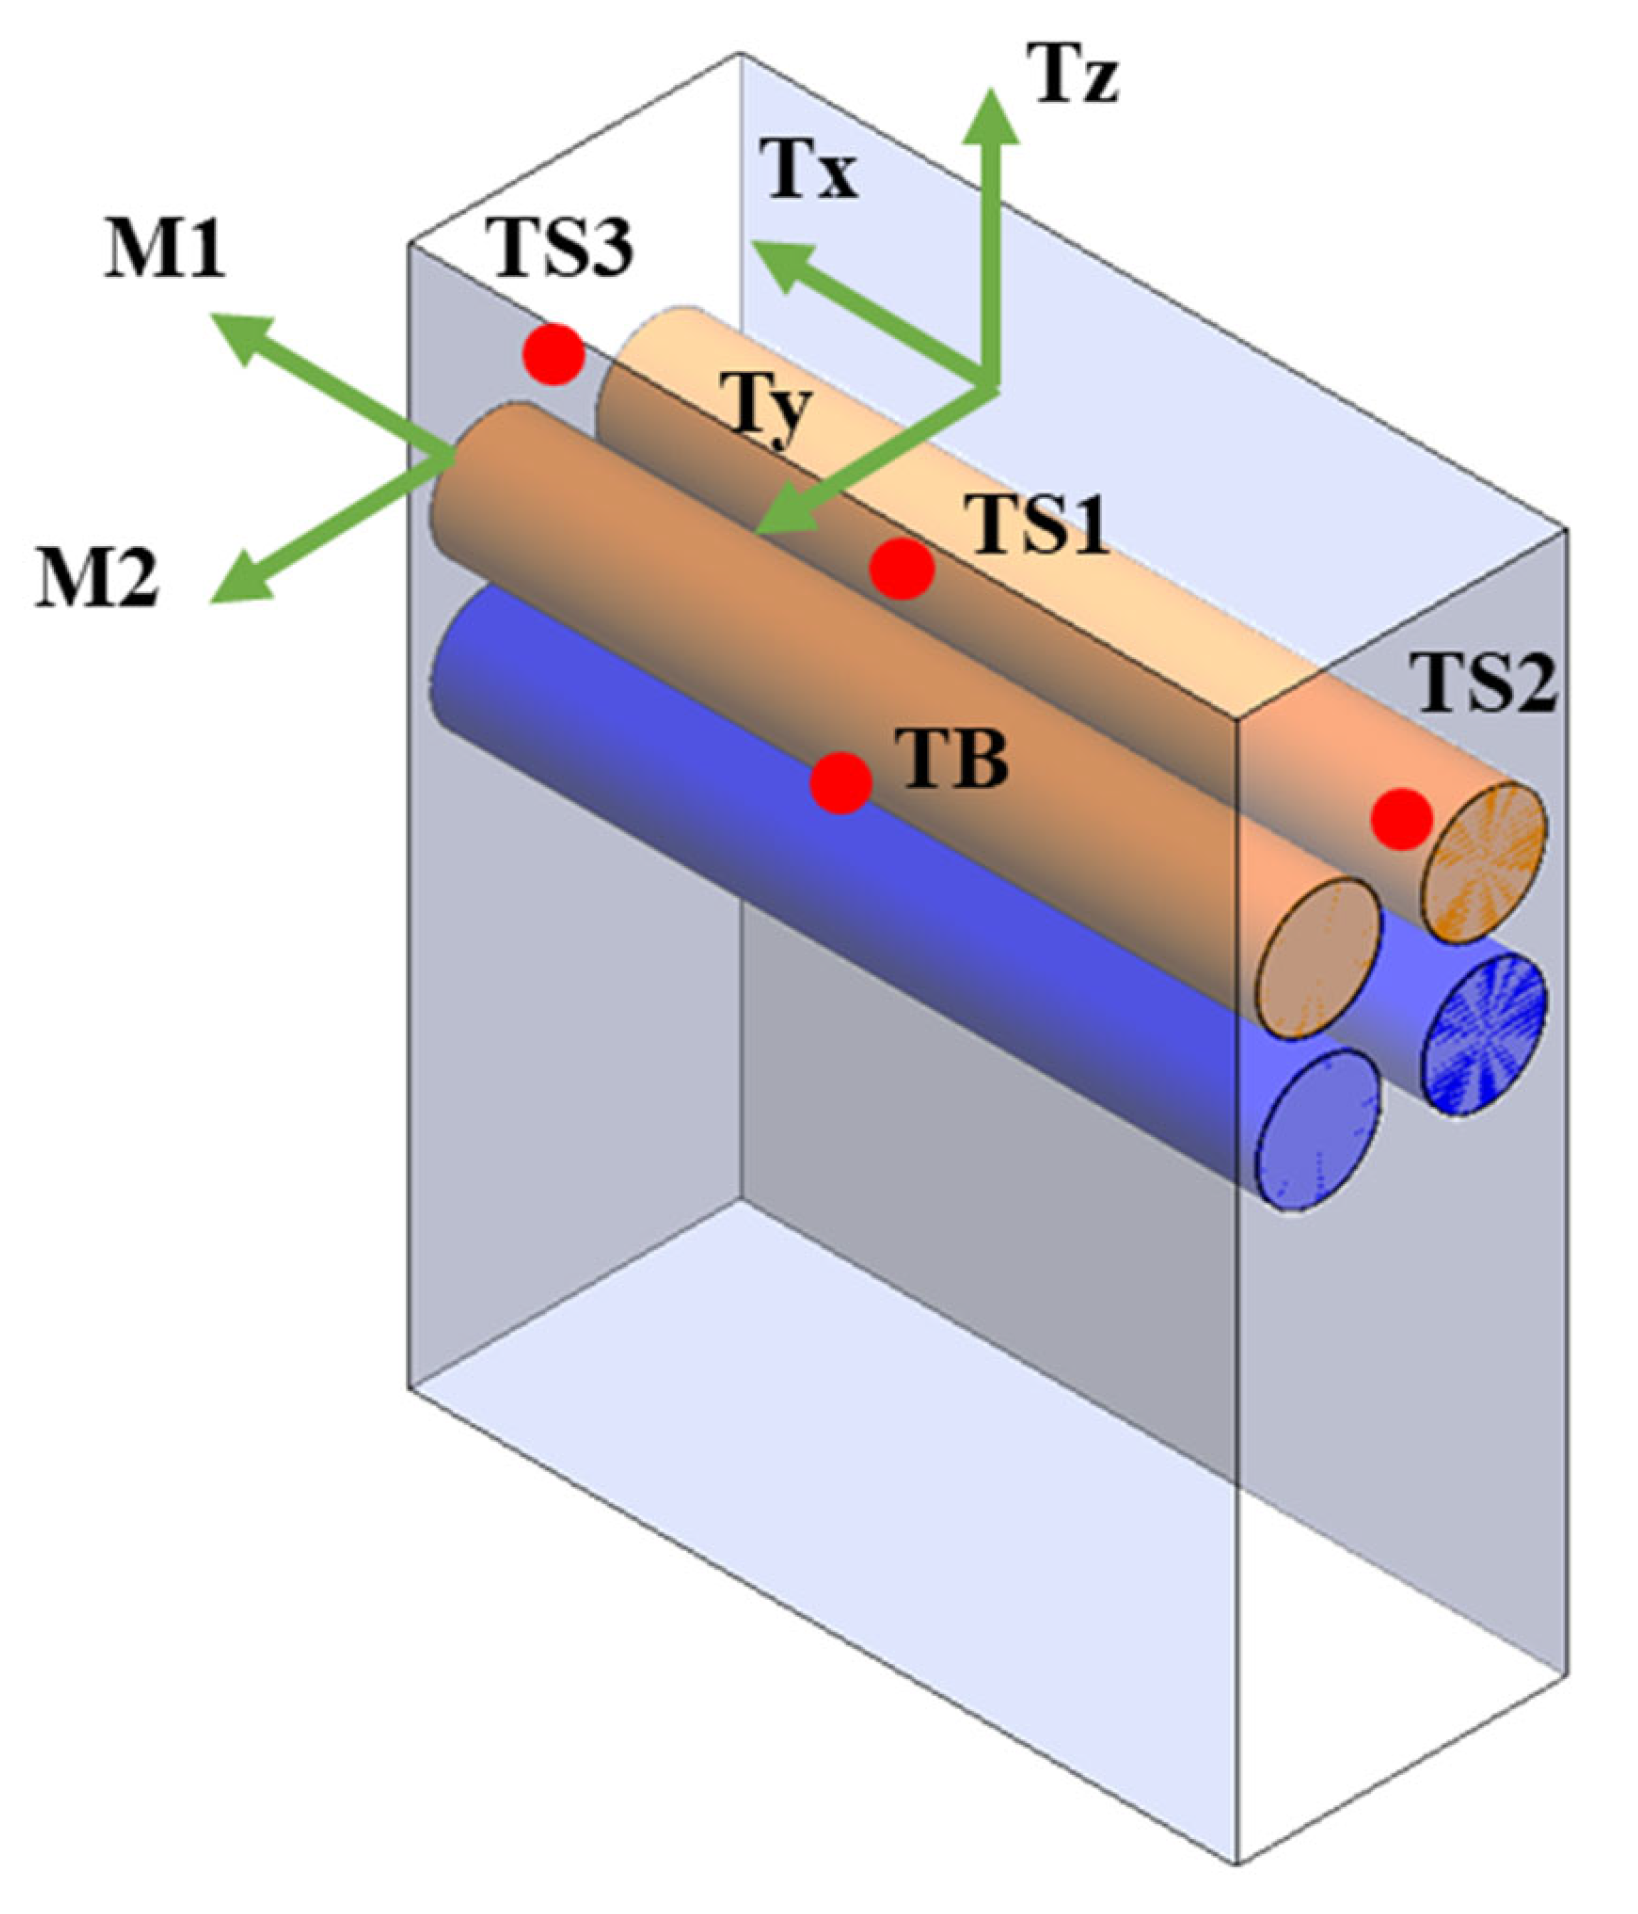
Figure 3 illustrates the positioning of the sensors, which was determined based on the operational characteristics of the machinery. For example, the triaxial accelerometer has been strategically located near the counter-blade to minimize the transmission path from the source of the phenomenon and, consequently, from the critical component being monitored.
2.3. Data Acquisition
The data acquisition system employed in this study was designed to ensure high-fidelity signal recording and precise synchronization of measurements. A cDAQ-9185 chassis was used as the central unit, housing three NI-9234 modules, each featuring four channels with a maximum sampling frequency of 51.2 kS/s per channel and an input range of ±5 V, allowing for accurate acquisition of vibration signals from the accelerometers. Additionally, a NI-9203 module with eight current inputs (±20 mA) was utilized for acquiring signals from the temperature sensors, ensuring reliable monitoring of thermal variations. This setup enabled seamless integration of multiple sensor types, providing a comprehensive dataset for condition monitoring and diagnostic analysis. In order to properly picture the machine dynamics, a sampling frequency of 25.6 kHz was selected. Notably, all sensors have a resonance frequency above 25 kHz to ensure accurate measurement without significant interference from structural resonance, thereby preserving the integrity and reliability of the acquired data across the operating frequency range.
The employed acquisition system is characterized by a significant cost attributed to its ability to ensure high precision. One of the objectives in developing a diagnostic system is to reduce expenses, making it more suitable for industrial applications. To achieve this, a systematic downgrade of the system has been explored to decrease sensor specifications and find an optimal cost–performance trade-off.
2.4. Dataset Description
The dataset used in this study was acquired through a series of controlled tests designed to evaluate the SOH of a high-speed industrial rotating blade under varying operational conditions. These experiments, involving the definition of a healthy and damaged state, were carefully planned at the DOE stage.
A damaged condition refers to a state of the blade that is not normal, which leads to reduced cutting performance. Such a state can both refer to a slight degradation of the blade edge or to a non-optimal blade mounting. Indeed, blade adjustment is an intricate process that necessitates the expertise of highly skilled technicians. This condition, which can be considered as incipient damage, is then physically barely recognizable, but ultimately leads to poorer paper cutting, conditions which should be detected and avoided by the herein proposed diagnostic system.
Obviously, several confounding factors may affect the measurements, such as the rotational speed of the blades, the type of processed paper, the room temperature, the machine temperature and gradients, and the single or simultaneous activation of the blades (two pairs, as visible in
Figure 2).
To limit the influence of these parameters and foster the diagnostic process, the incipient damaged condition was simulated by an expert Tecnau technician introducing a slight blade mis-adjustment, and a standard test cycle was defined for the measurements. This mistuning is not visually detectable nor easily quantifiable; however, it is highly repeatable when induced by rotating the tuning screws by a predetermined amount. This adjustment, defined by Tecnau based on their expertise and referenced from the ideal setting, is intended to simulate the effects of wear conditions. It was selected to (a) focus on one pair of blades alone, which is one blade and one counter-blade, (b) keep a constant rotational speed, (c) run the machine without paper, and (d) assume the room temperature to be constant. The repeatability of these parameters and of the blade adjustments was likely to be a crucial aspect of the study. Given such consideration, the sequence of tests was carefully organized to minimize the need for blade disassembly, thereby ensuring that comparisons between different conditions are both feasible and repeatable.
Two datasets were ultimately collected. The first was intended for an exploratory preliminary analysis aimed at characterizing the dynamic and thermal behavior of the machine. Given that dynamic and thermal responses occur on distinct time scales, a multi-scale analysis was necessary to properly capture the dual nature of the system behavior. Due to the slow evolution of thermal transients, endurance tests were conducted—one with a healthy blade and one with a damaged blade—lasting until steady-state conditions were reached. These tests enabled the assessment of both transient and steady-state phases. The following fine-scale classification results are based on 800 samples, evenly split between blades in healthy and damaged states (50% each). Each sample comprises a set of features extracted from a single cutting cycle, recorded at a sampling rate of 25.6 kHz. The environmental conditions during the two test sessions (for healthy and damaged blades, respectively) were highly comparable, as the tests were conducted on consecutive days. If environmental variations were present, temperature decorrelation methods could be applied (see temperature decorrelation in the Conclusions section); however, once thermal steady-state is achieved, such differences are expected to have minimal impact.
Following this initial analysis, and once the sensor layout was finalized, as illustrated in
Figure 3, a second dataset was acquired using the same measurement protocol as the first, but on a different day and under potentially different environmental conditions. Unlike the first dataset, the second acquisition focused mainly on the dynamic response of the blade–machine system and on damage detection, which both require higher temporal resolution and thus a micro-scale analysis. Given that the transient and steady-state phases had already been identified, the duration of the second acquisition was reduced accordingly to minimize data volume while preserving the most informative portions of the machine operational behavior.
In summary, endurance tests were planned and executed to develop the diagnostic system as the operating conditions (such as the absolute temperature and the temperature gradients of the machine) vary. Indeed, endurance tests allow the analysis of both transient and steady-state conditions.
3. Methodology
In [
32], a preliminary study was conducted to analyze and understand the behavior of the machinery. Starting from those findings, this work aims to develop a diagnostic system suitable for industrial applications. This section begins by outlining the multi-scale analysis employed for feature extraction. The diagnostic system incorporates ML algorithms; thus, the methodology of the classification process is thoroughly detailed. Lastly, to ensure the system implementation within an industrial context, a comprehensive analysis of system performance downgrade is conducted, focusing on the impact of reduced sampling frequency and the quantity of sensors. Finally, based on the outcomes of the analysis, a possible temperature decorrelation strategy is proposed to enhance classification accuracy.
The proposed methodology is summarized in the block diagram presented in
Figure 4, which outlines the structured sequence of operations of the study phase to develop a reliable and industrializable diagnostic system. This includes key steps such as multi-scale analysis and signal downgrade. These steps demonstrate the methodological flexibility and adaptability of the framework, which can be generalized and extended to other machinery with appropriate modifications and tuning. The final diagnostic system, streamlined for real-world applications, is depicted in Figure 13.
3.1. Feature Extraction
In the field of machinery fault detection, a correlation between specific symptoms observed in vibration signals and the presence of damage is assumed by identifying underlying patterns within the data. However, raw vibration signals usually represent the contribution of complex effects and noise. The process of extracting and selecting features is fundamental for ensuring accurate damage detection. Indeed, a feature is defined as a measurable characteristic derived from raw signals, which should consistently correlate with the level of damage.
In the present work, the most used features were extracted from the signals. Most of them were statistical moments, and they are reported in the following list for the sake of completeness:
where
represents the acceleration signal as a quantity discretized during the acquisition process, and
is the number of samples, which defines the multi-scale time window. The feature extraction procedure is identical across all scales; however, the difference lies in the length of the time window used for analysis. Specifically, in the macro-scale analysis, features were extracted over fixed 60 s windows to capture long-term thermal and dynamic behavior. In contrast, the micro-scale feature extraction was guided by the infrared pyrometer signal, which monitored the temperature of the rotating blade. For the latter scale, features related to the accelerometer signals were computed over time intervals corresponding to a single full rotation of the blade. While the exact rotational speed is confidential and, therefore, the precise time window cannot be disclosed, it is worth noting that the micro-scale windows are several orders of magnitude shorter than the macro-scale ones.
The mean and standard deviation were computed for each of the four temperature channels, while variance, skewness, kurtosis, and positive/negative peaks were calculated for each acceleration signal. In total, 33 features were extracted, but only the 25 acceleration-related features were utilized for the classification process due to the encouraging results observed in the preliminary vibration monitoring analysis (temperature features were dropped). These latter features were converted into z-scores to standardize the magnitude orders recorded by the different channels. As a preliminary analysis, simple time-domain features were selected due to their suitability for real-time computation [
35]. More complex features were not explored at this stage, given the satisfactory performance achieved with the current feature set (see
Section 4.3).
3.2. Multi-Scale Analysis
To understand the functioning of the machinery and how its operational conditions vary throughout a working cycle, endurance tests with extended duration were performed. Due to the substantial amount of data to analyze, a multi-scale approach was implemented to reduce the computational burden. In this study, multi-scale analysis refers to examining the cutter system at different temporal resolutions, enabling the detection of both short-term fluctuations and long-term trends. Specifically, temporal multi-scale analysis is an approach that decomposes a signal or phenomenon into various time scales to study its characteristics at different levels. This method is particularly useful for analyzing complex systems or signals containing information distributed across multiple time scales. An example of applying multi-scale analysis in bearing defect diagnostics is provided by Wu et al. in [
36].
3.2.1. Coarse Scale Analysis
The initial focus was placed on the macro-scale, which provides a high-level understanding of the overall behavior of the machinery. At the macro-scale, features were extracted using coarse time intervals, with the mean and standard deviation calculated over a 60 s time window. This approach enabled the identification of temperature trends, which evolve gradually and are more apparent at longer time scales. The macro-scale analysis provides insights into the general behavior of the machine, including identifying transient and steady-state phases, and reduces the volume of data requiring further analysis. The first operational phase covers the machine’s activation and the initial transient stage, while the second phase represents the steady-state conditions, which occur after several hours of operation. As a result, the subsequent micro-scale analysis can concentrate on a smaller, more specific subset of the data, allowing for direct comparisons under equivalent conditions.
3.2.2. Fine Scale Analysis
Following the coarse-scale evaluation, the analysis was refined to a micro-scale perspective to investigate the dynamic behavior of the system with greater temporal resolution. While the macro-scale provided insights into broad thermal and operational trends, the micro-scale focuses on the mechanical dynamics of the system. Specifically, this analysis focuses on short time windows corresponding to a single full rotation of the blade, allowing for the detection of subtle dynamic variations that may indicate incipient faults. Features extracted at this finer time scale will be used to classify and assess the SOH of the machine.
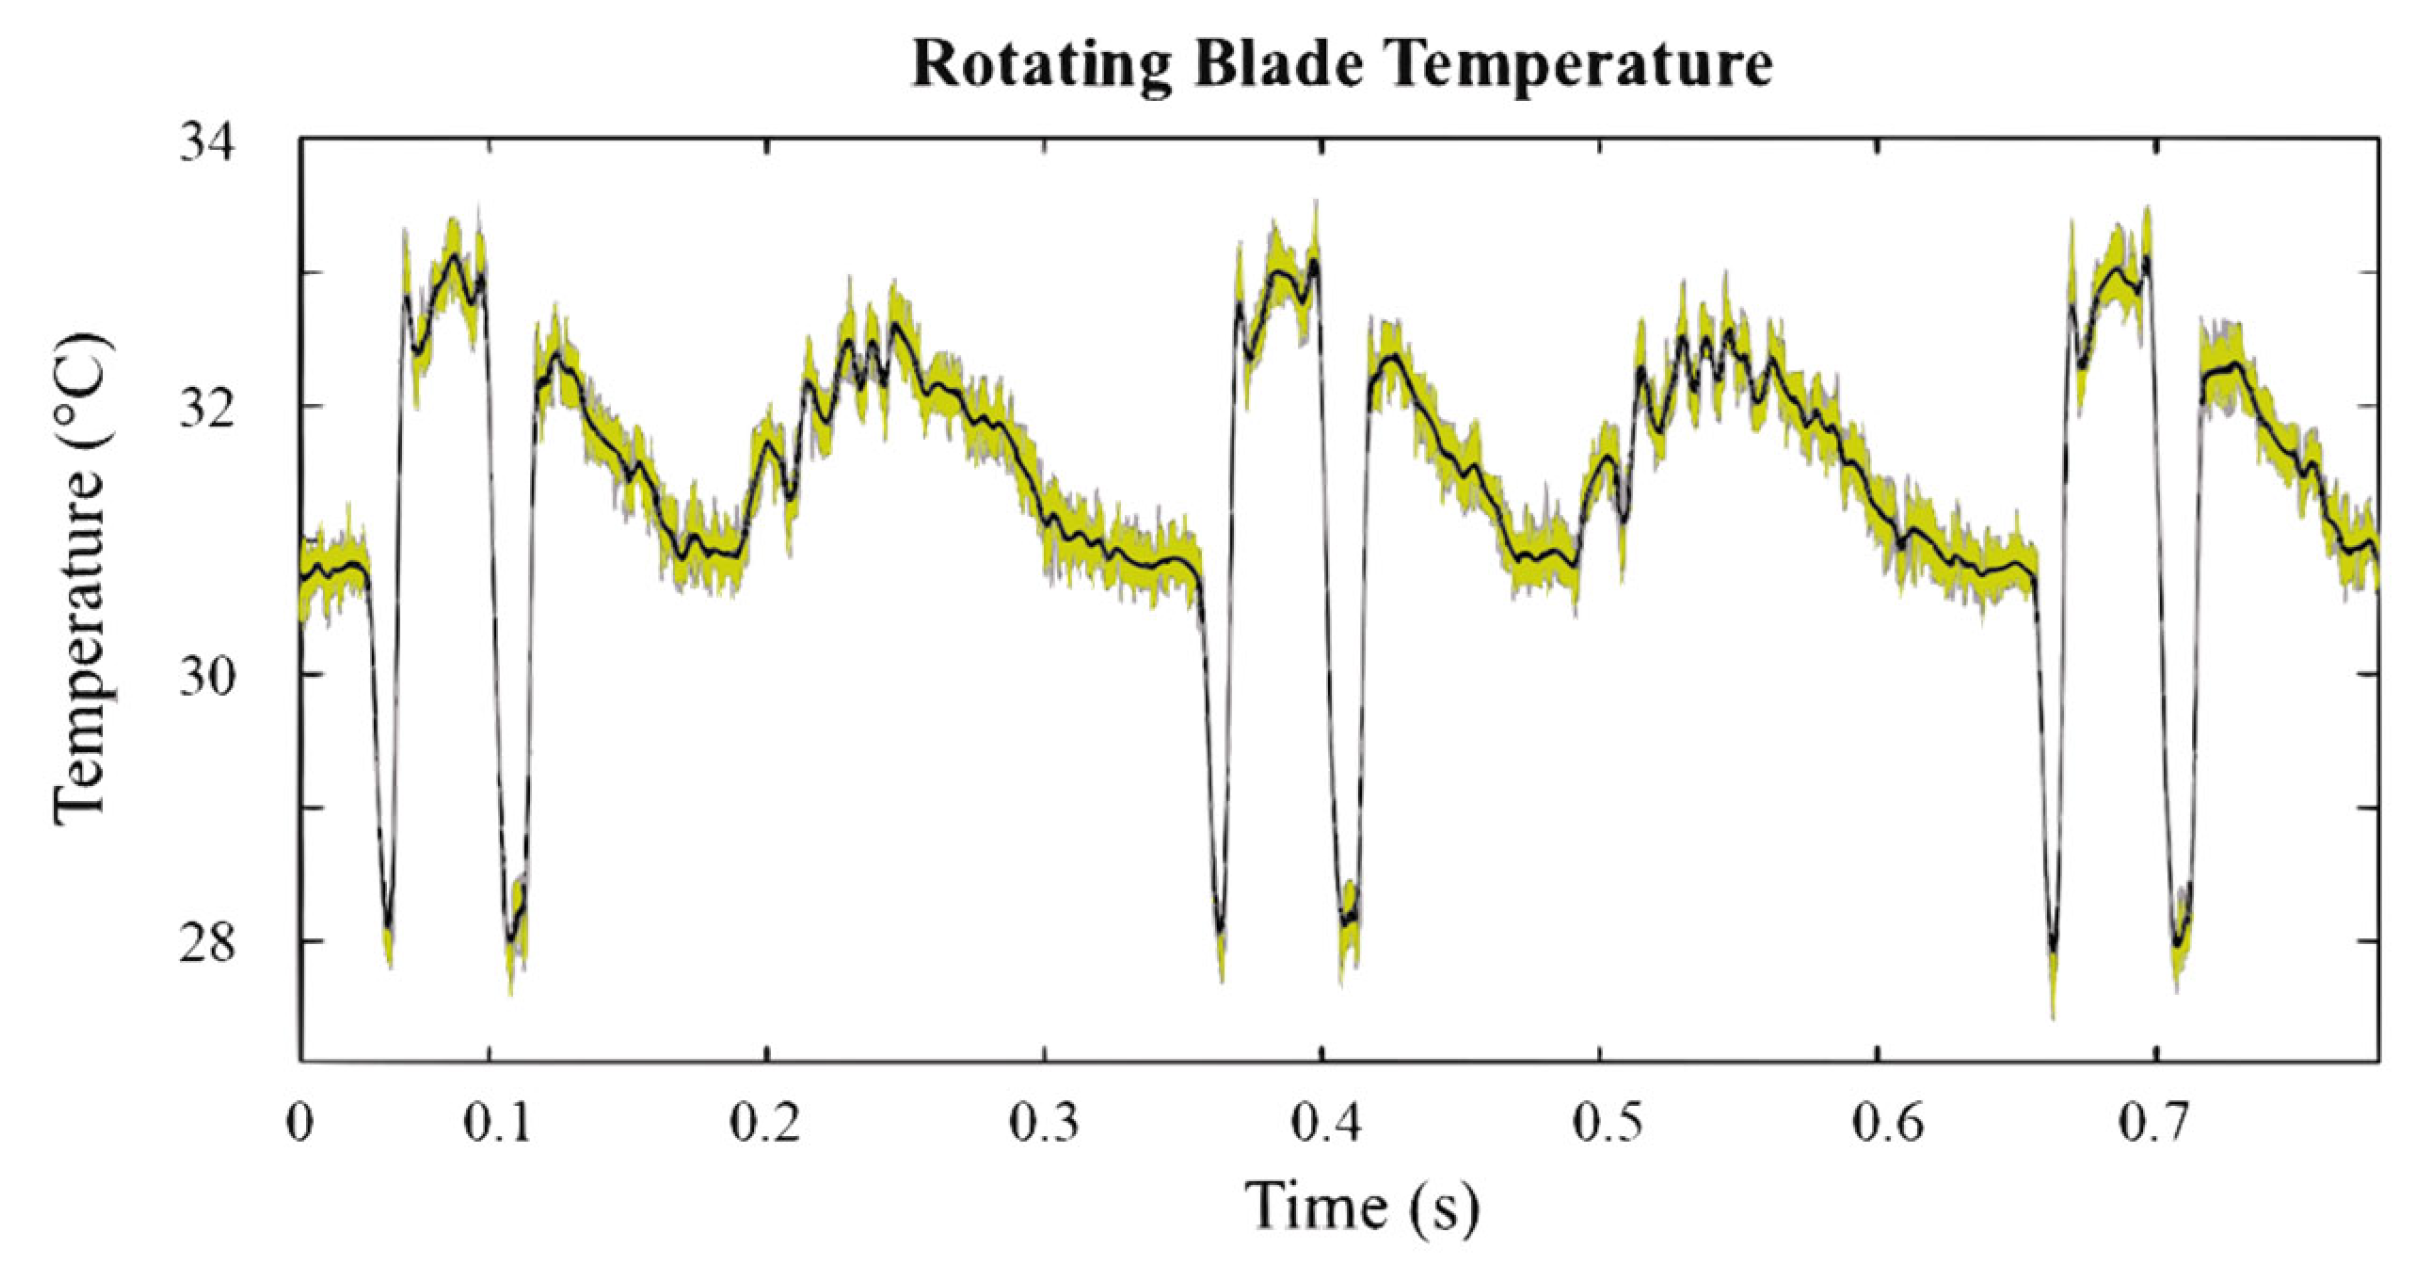
A key novelty of this approach lies in the dual use of the infrared pyrometer not only for thermal monitoring but also to infer the blade rotational speed, effectively serving as a virtual encoder. This enabled the segmentation of vibration data into rotation-synchronized intervals without requiring additional hardware.
Figure 5 illustrates the temperature trend recorded by the pyrometer, clearly distinguishing between the blade and the rotating cylindrical body. The micro-scale analysis applies the same feature extraction methodology used at the macro scale—namely, the computation of statistical descriptors such as mean and standard deviation—but over significantly shorter windows. The temporal window depends on the rotation speed of the blade, and it is generally several orders of magnitude smaller than the time window used in the macro-scale analysis.
The micro-scale analysis targets subtle variations in the mechanical behavior of the system, as captured by the high-frequency accelerometer signals. Therefore, it is crucial to extract acceleration features at this scale in order to detect potential differences caused by the SOH of the blade. The extracted features were standardized as z-scores with respect to the ideal blade condition for the sake of a fair comparison. This process involved calculating the mean and standard deviation of the features corresponding to the ideal state, using data from the endurance test conducted under consistent operating conditions.
3.3. Classification
The multi-scale analysis was designed to exploit the complementary nature of coarse and fine temporal resolutions. At the macro-scale, the focus was on capturing slow thermal dynamics and identifying broader operational phases—such as transient behavior and steady-state conditions—across the endurance tests. This provided contextual insight into the system overall behavior. Conversely, the micro-scale analysis targeted the fast mechanical dynamics of the blade–machine interaction by extracting features over time intervals corresponding to a single blade rotation. This level of resolution was essential for capturing subtle vibrational patterns indicative of early-stage degradation. Based on the outcomes of the multi-scale analysis, classification algorithms were then implemented to distinguish between healthy and damaged blade conditions during both transient and steady-state phases. Notably, the classification relied exclusively on micro-scale features, which are better suited for real-time fault detection due to their high sensitivity to rapid mechanical changes and their compatibility with online monitoring frameworks.
The inputs to the classifiers consist of five features (variance, skewness, kurtosis, positive, and negative peaks) computed for each of the five accelerometric channels, resulting in a total of 25 features. Features related to temperature measurements were excluded from this stage, particularly as the results of the preliminary analysis were promising. Before analyzing the performance of different types of classifiers, the features were standardized as z-scores with respect to the ideal blade conditions. To evaluate the performance of the proposed method across different algorithm types, five of the most widely used supervised (and semi-supervised) machine learning algorithms were applied: Linear Discriminant Analysis (LDA), k-Nearest Neighbor (kNN) with = 10, Decision Trees (DTs), Linear Support Vector Machine (SVM), and Gaussian Naive Bayes (GNB).
To build a classification model, it is essential to have both a training dataset and a separate dataset for validation. The selection of these datasets can be conducted in various ways. One common approach is
k-fold Cross-Validation (CV), which involves partitioning the data into
k groups. In each iteration, one group is designated as the validation dataset, while the remaining
groups serve as the training dataset. This process is repeated
k times (with
= 5 in this study) to ensure that each group is used for validation once. For a general CV, varying data splits can lead to differences in model generation and accuracy outcomes. To mitigate this variability and obtain more reliable performance metrics, Monte Carlo Cross-Validation (MCCV) [
37] was utilized, as described in [
38].
MCCV is a robust method that involves random partitioning of the samples into training and validation sets, followed by repeated execution of this process over = 50 iterations. This approach significantly reduces computational complexity while ensuring that the average accuracy converges toward the theoretical value of the model. As the number of iterations increases, the performance metrics derived from MCCV tend to stabilize and become more reliable.
The performance of the proposed method is evaluated using some selected comparative indices. While this is not a multi-class application—only two conditions, healthy and damaged, are analyzed—multiple performance indices are examined to provide a comprehensive evaluation of the diagnostic system. The following indices are introduced to measure the effectiveness of the methods:
In this initial phase, lightweight classification methods were intentionally selected to ensure computational efficiency and facilitate real-time implementation. The use of more complex models, such as deep learning approaches, was not pursued due to the limited size of the available dataset. Deep learning models, including neural networks, typically require large amounts of training data, which were not available in this study. Given the satisfactory performance achieved with simpler methods, more advanced techniques were not considered necessary at this stage.
3.4. Downgrade
In view of industrial implementation, it is essential to assess the robustness of the proposed diagnostic framework when subject to hardware constraints, which are the reductions in sampling frequency and the number of acquisition channels (and consequently, sensors). The aim is to evaluate the impact of these downgrades on classification performance, identifying sensor configurations that strike an optimal trade-off between diagnostic accuracy and cost-efficiency. This approach promotes the development of a simplified, low-cost diagnostic system without compromising reliability, paving the way for large-scale deployment in production environments. In the following subsections, the effects of these two downgrade types—sampling frequency and sensor quantity—are analyzed separately. This approach will enable drawing the necessary conclusions to define and establish a new setup for a diagnostic system ready for industrialization.
3.4.1. Sampling Frequency Downgrade
The acquired data recordings were resampled at new sampling frequencies, , where = 25.6 kHz (i.e., the sampling frequency used during the experimental phase) and is a reduction factor defined by the following values, = 2, 4, 6, 8, 10, 20, 40, 60, 80, 100. The results presented below refer to these fractions of , representing a decimation of the recorded values by a factor of . The decrease in sample rate by the integer factor was performed using the MATLAB R2023a command decimate, which uses an 8th-order Chebyshev Type I lowpass Infinite Impulse Response (IIR) filter to prevent aliasing. It is important to note that, at this stage, all accelerometric channels (M1, M2, Tx, Ty, Tz) were still considered.
3.4.2. Sensors Downgrade
After analyzing the downgrade in terms of sampling frequency, a further reduction in the number of channels, and consequently sensors, was implemented. In addition to maintaining the reduction by a factor in sampling frequency, a reduction in the number of channels was introduced, starting from the five currently used (M1, M2, Tx, Ty, Tz). Specifically, two reductions were analyzed. The first considered only the triaxial accelerometer channels Tx, Ty, and Tz, eliminating all uniaxial sensors. The second reduction further decreased the number of channels, selecting only the Ty channel. This channel was presumed to be the most relevant due to its positioning and orientation.
4. Results
To evaluate the performance of the proposed diagnostic methodology, the results are presented following the same structure as the methodology: beginning with the macro-scale analysis, followed by the micro-scale used for the classification, and finally the system downgrade study. This structured approach ensures clarity and allows each level of analysis to build upon the insights gained in the previous phase.
4.1. Coarse-Scale Preliminary Analysis
In the macro-scale analysis, features were extracted over coarse time windows—specifically 60 s intervals—allowing the detection of slow-evolving trends in the system’s physical behavior. This approach helps capture the overall trends in the recorded physical quantities and to identify specific segments for closer examination. Systems, such as the one studied here, often display behaviors or properties that change noticeably across different time scales, such as during the shift from a transient phase to steady-state conditions, making this method particularly useful. The macro-scale analysis employed temperature-related features, which evolve gradually and become more evident over longer time scales, to identify and compare the operational conditions and evaluate the validity of comparisons among them.
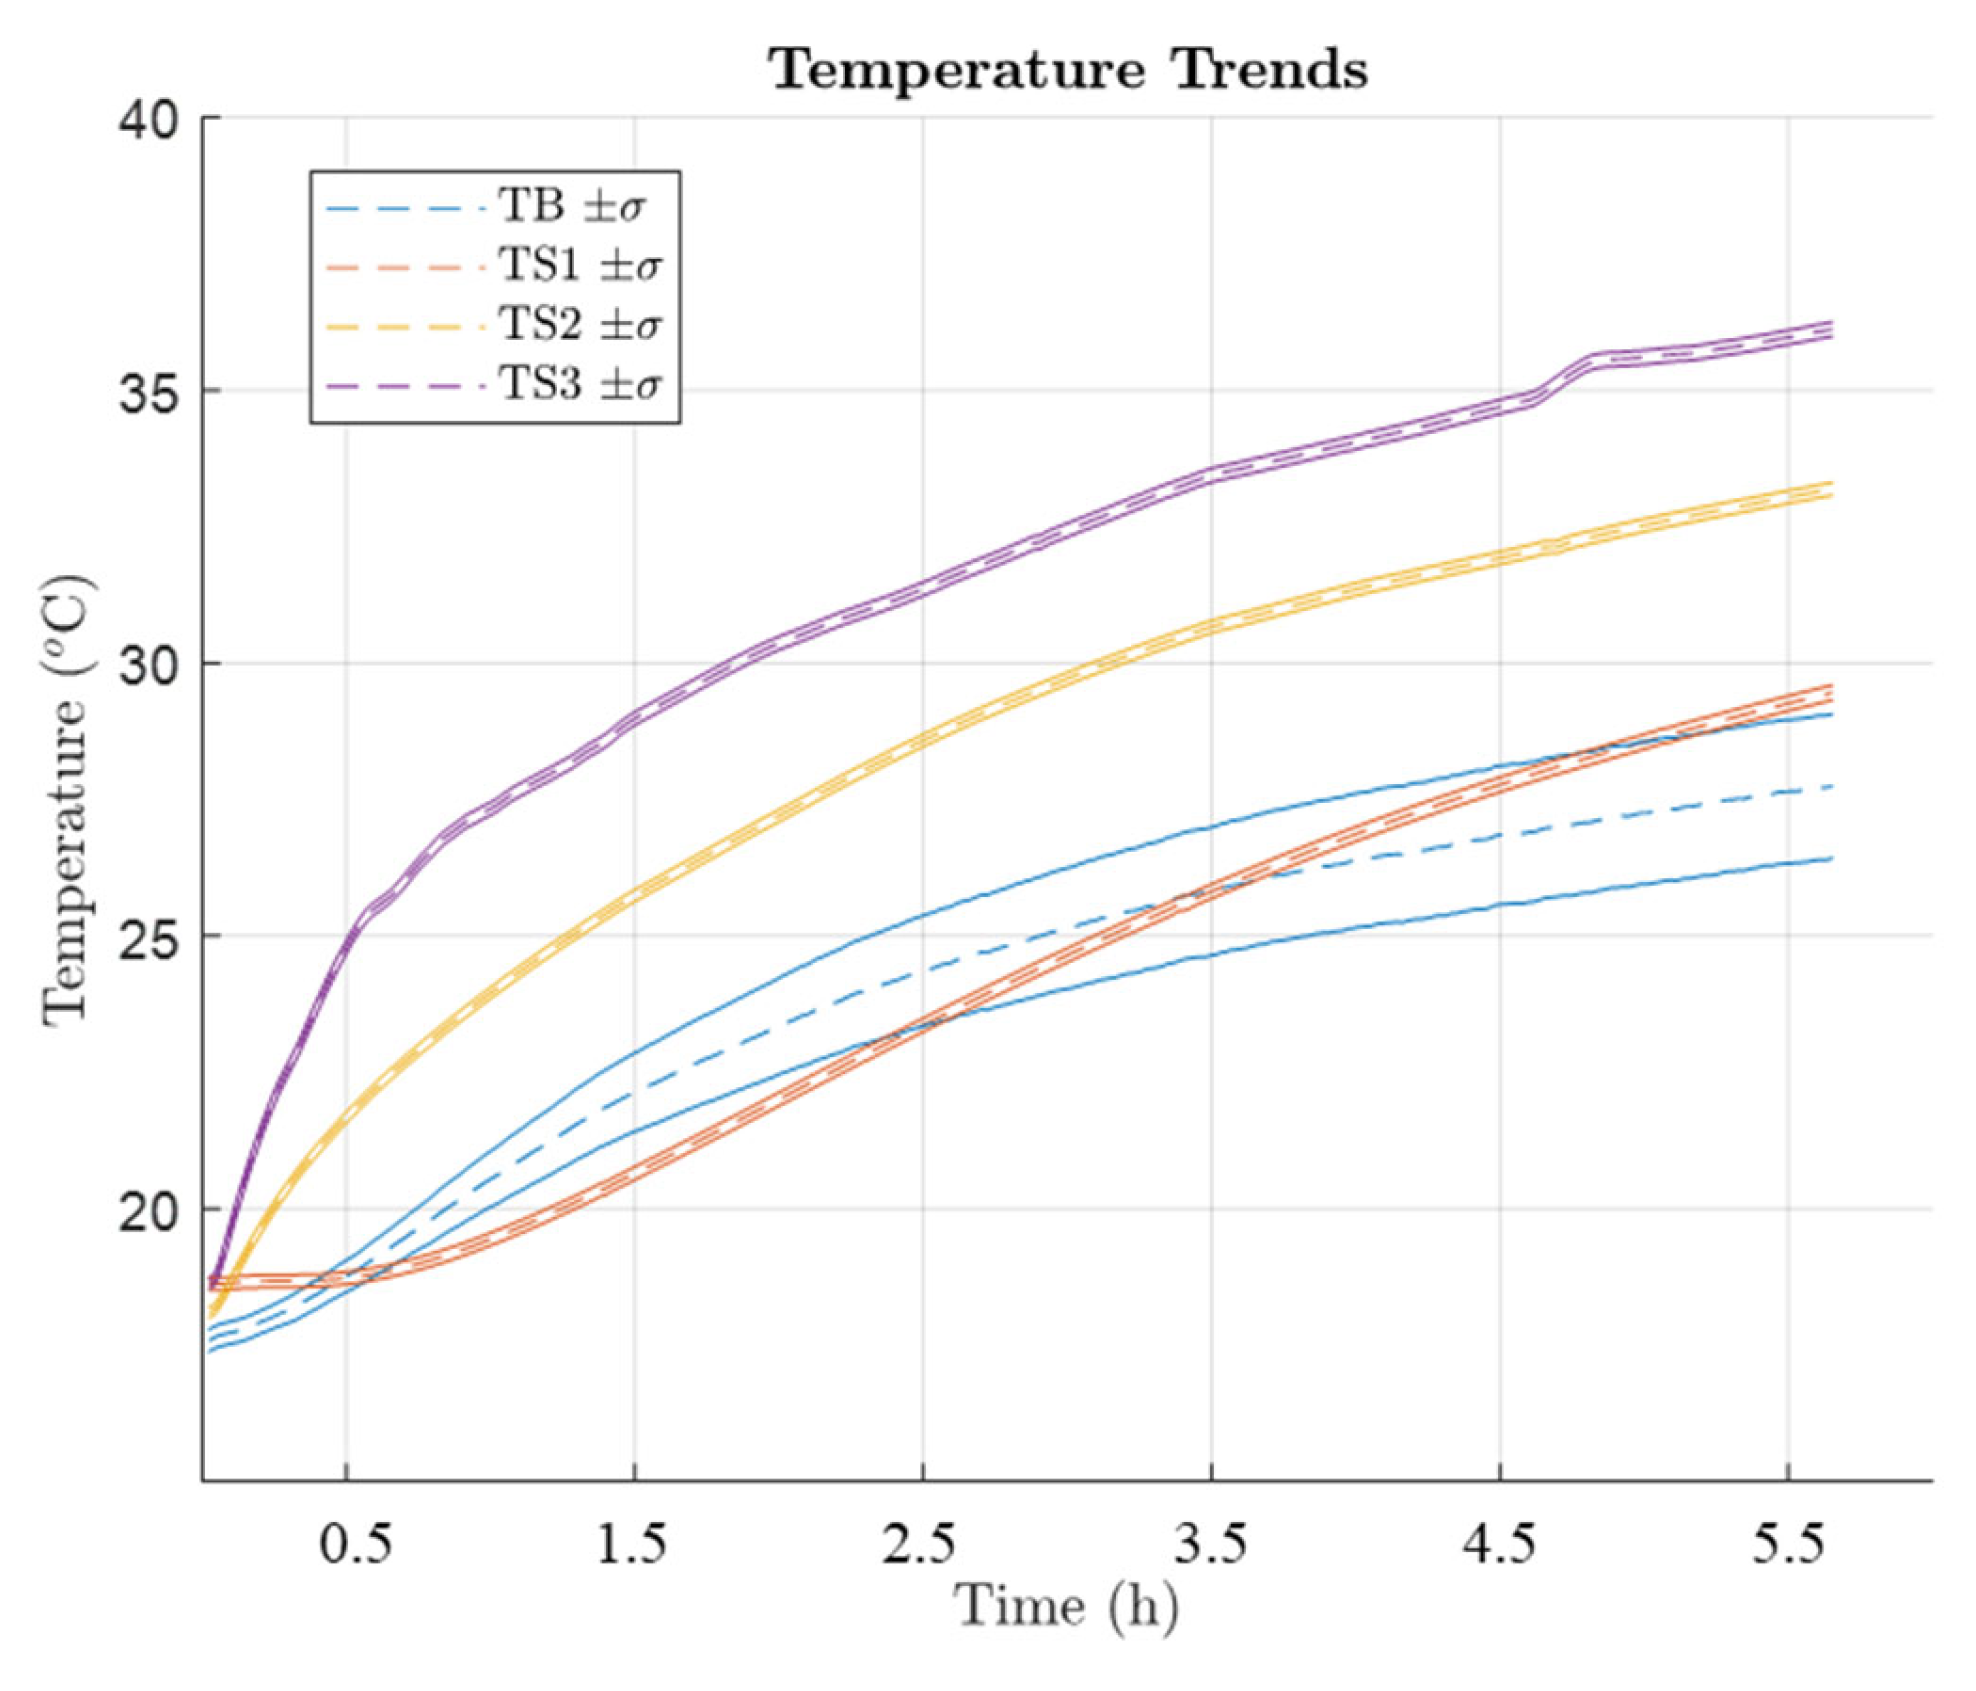
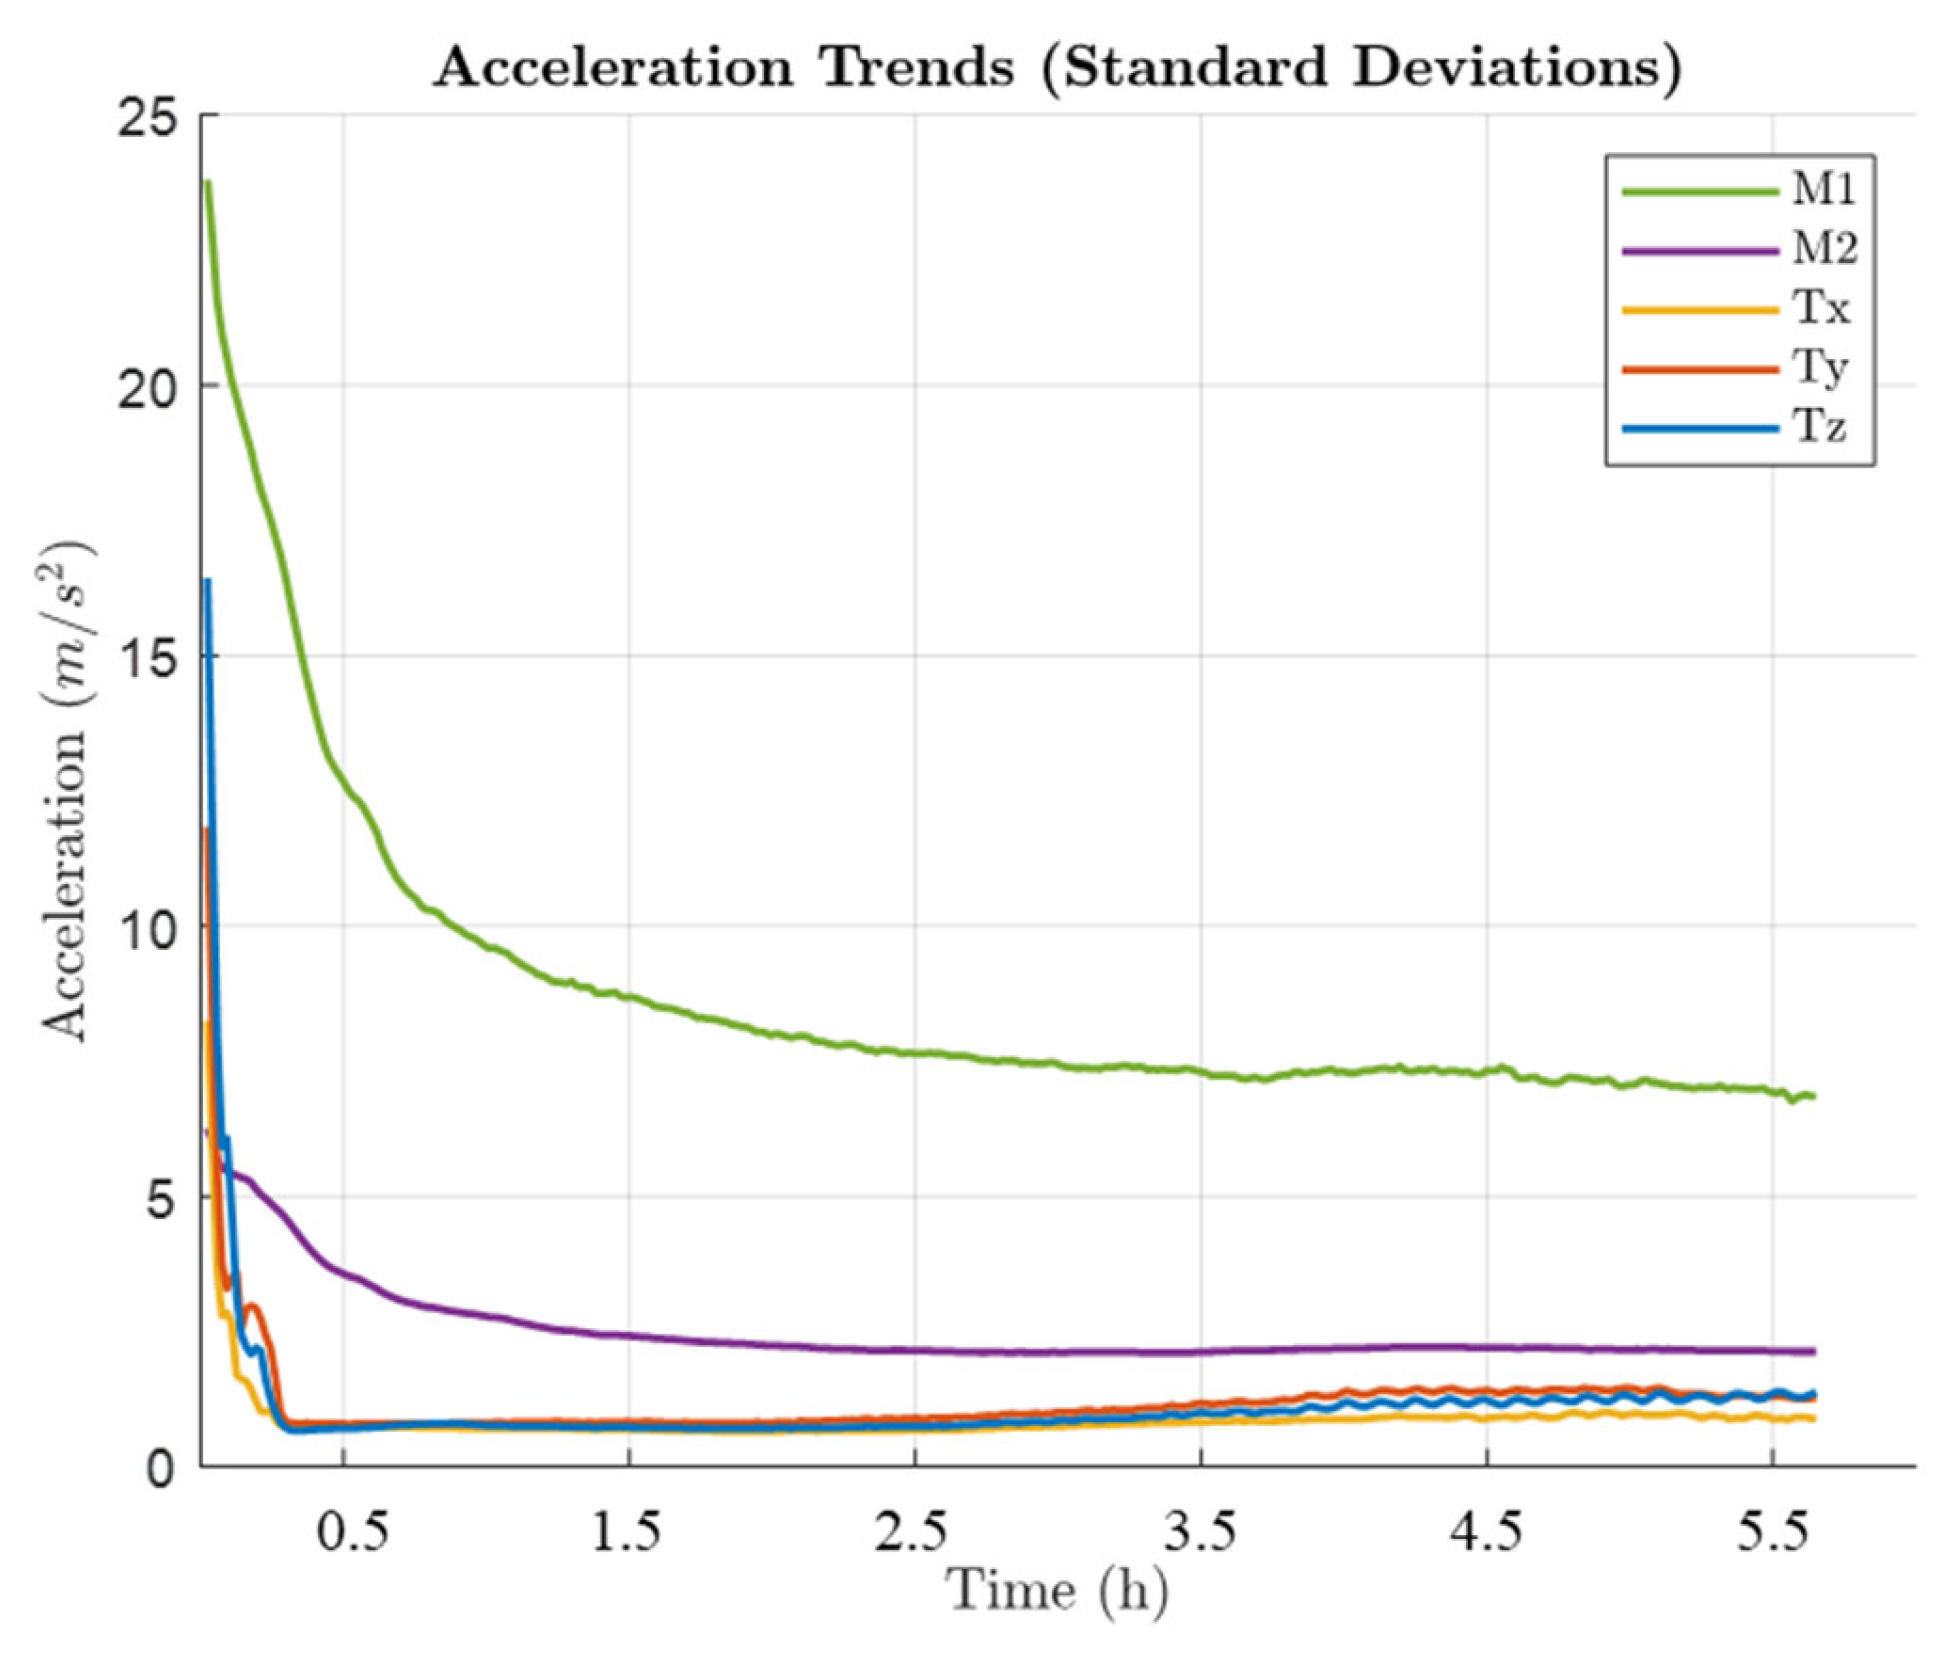
Figure 6 and
Figure 7 present the outcomes of this analysis. Specifically,
Figure 6 presents the trends of the average temperatures recorded each minute, along with their standard deviations in healthy conditions. Overall, tests conducted with the healthy blade exhibited higher levels of overheating in the machinery. This observation can be attributed to the well-adjusted blade, which is designed to generate more friction against the counter-blade to achieve a more efficient paper cut. Consequently, this increased friction leads to greater heat generation and, in turn, results in enhanced overheating of the machine.
The macro-scale results reveal a consistent ascending trend in temperature for all sensors, attributable to the operation of the machinery. Sensors TS2 and TS3 display similar curves due to their symmetrical positioning, although sensor TS2 records lower temperatures, which may be influenced by varying environmental and operational factors. Additionally, it is worth noting that the standard deviation values recorded by the pyrometer (which measures the blade temperature) increase as the test continues, suggesting that the blade temperature rises significantly more than that of its cylindrical body, leading to a greater temperature gradient. Finally, an analysis of the slopes of the four temperature curves suggests that the primary heat source is located near the lateral sensors, which exhibit a more rapid temperature increase. In contrast, the average temperatures recorded by the pyrometer (monitoring the rotating blade) and sensor TS1 rise more gradually, indicating a delayed thermal response in those areas.
Figure 7 illustrates the trend of standard deviations throughout the endurance test. Mean values are not displayed since the mean values of accelerations are expected to be zero, given that accelerometers do not experience displacement. As shown, all sensors exhibit a decreasing trend, reaching a minimum or knee point at different times. This behavior is closely correlated with the previously observed temperature profile and directly depends on it. The anisotropic thermal deformations of the machinery induce variations in its dynamic response during the operational phase. Specifically, the observed trend shows that the machinery vibrational energy decreases during the transient phase until it stabilizes under near-steady-state conditions.
4.2. Fine-Scale Analysis and Classification
Building on the insights from the macro-scale analysis—particularly the identification of transient and steady-state phases—the subsequent multi-scale analysis allowed for the extraction of dynamic features essential for real-time fault detection. These extracted features laid the groundwork for the subsequent classification process, enabling a more subtle understanding of the machine’s SOH.
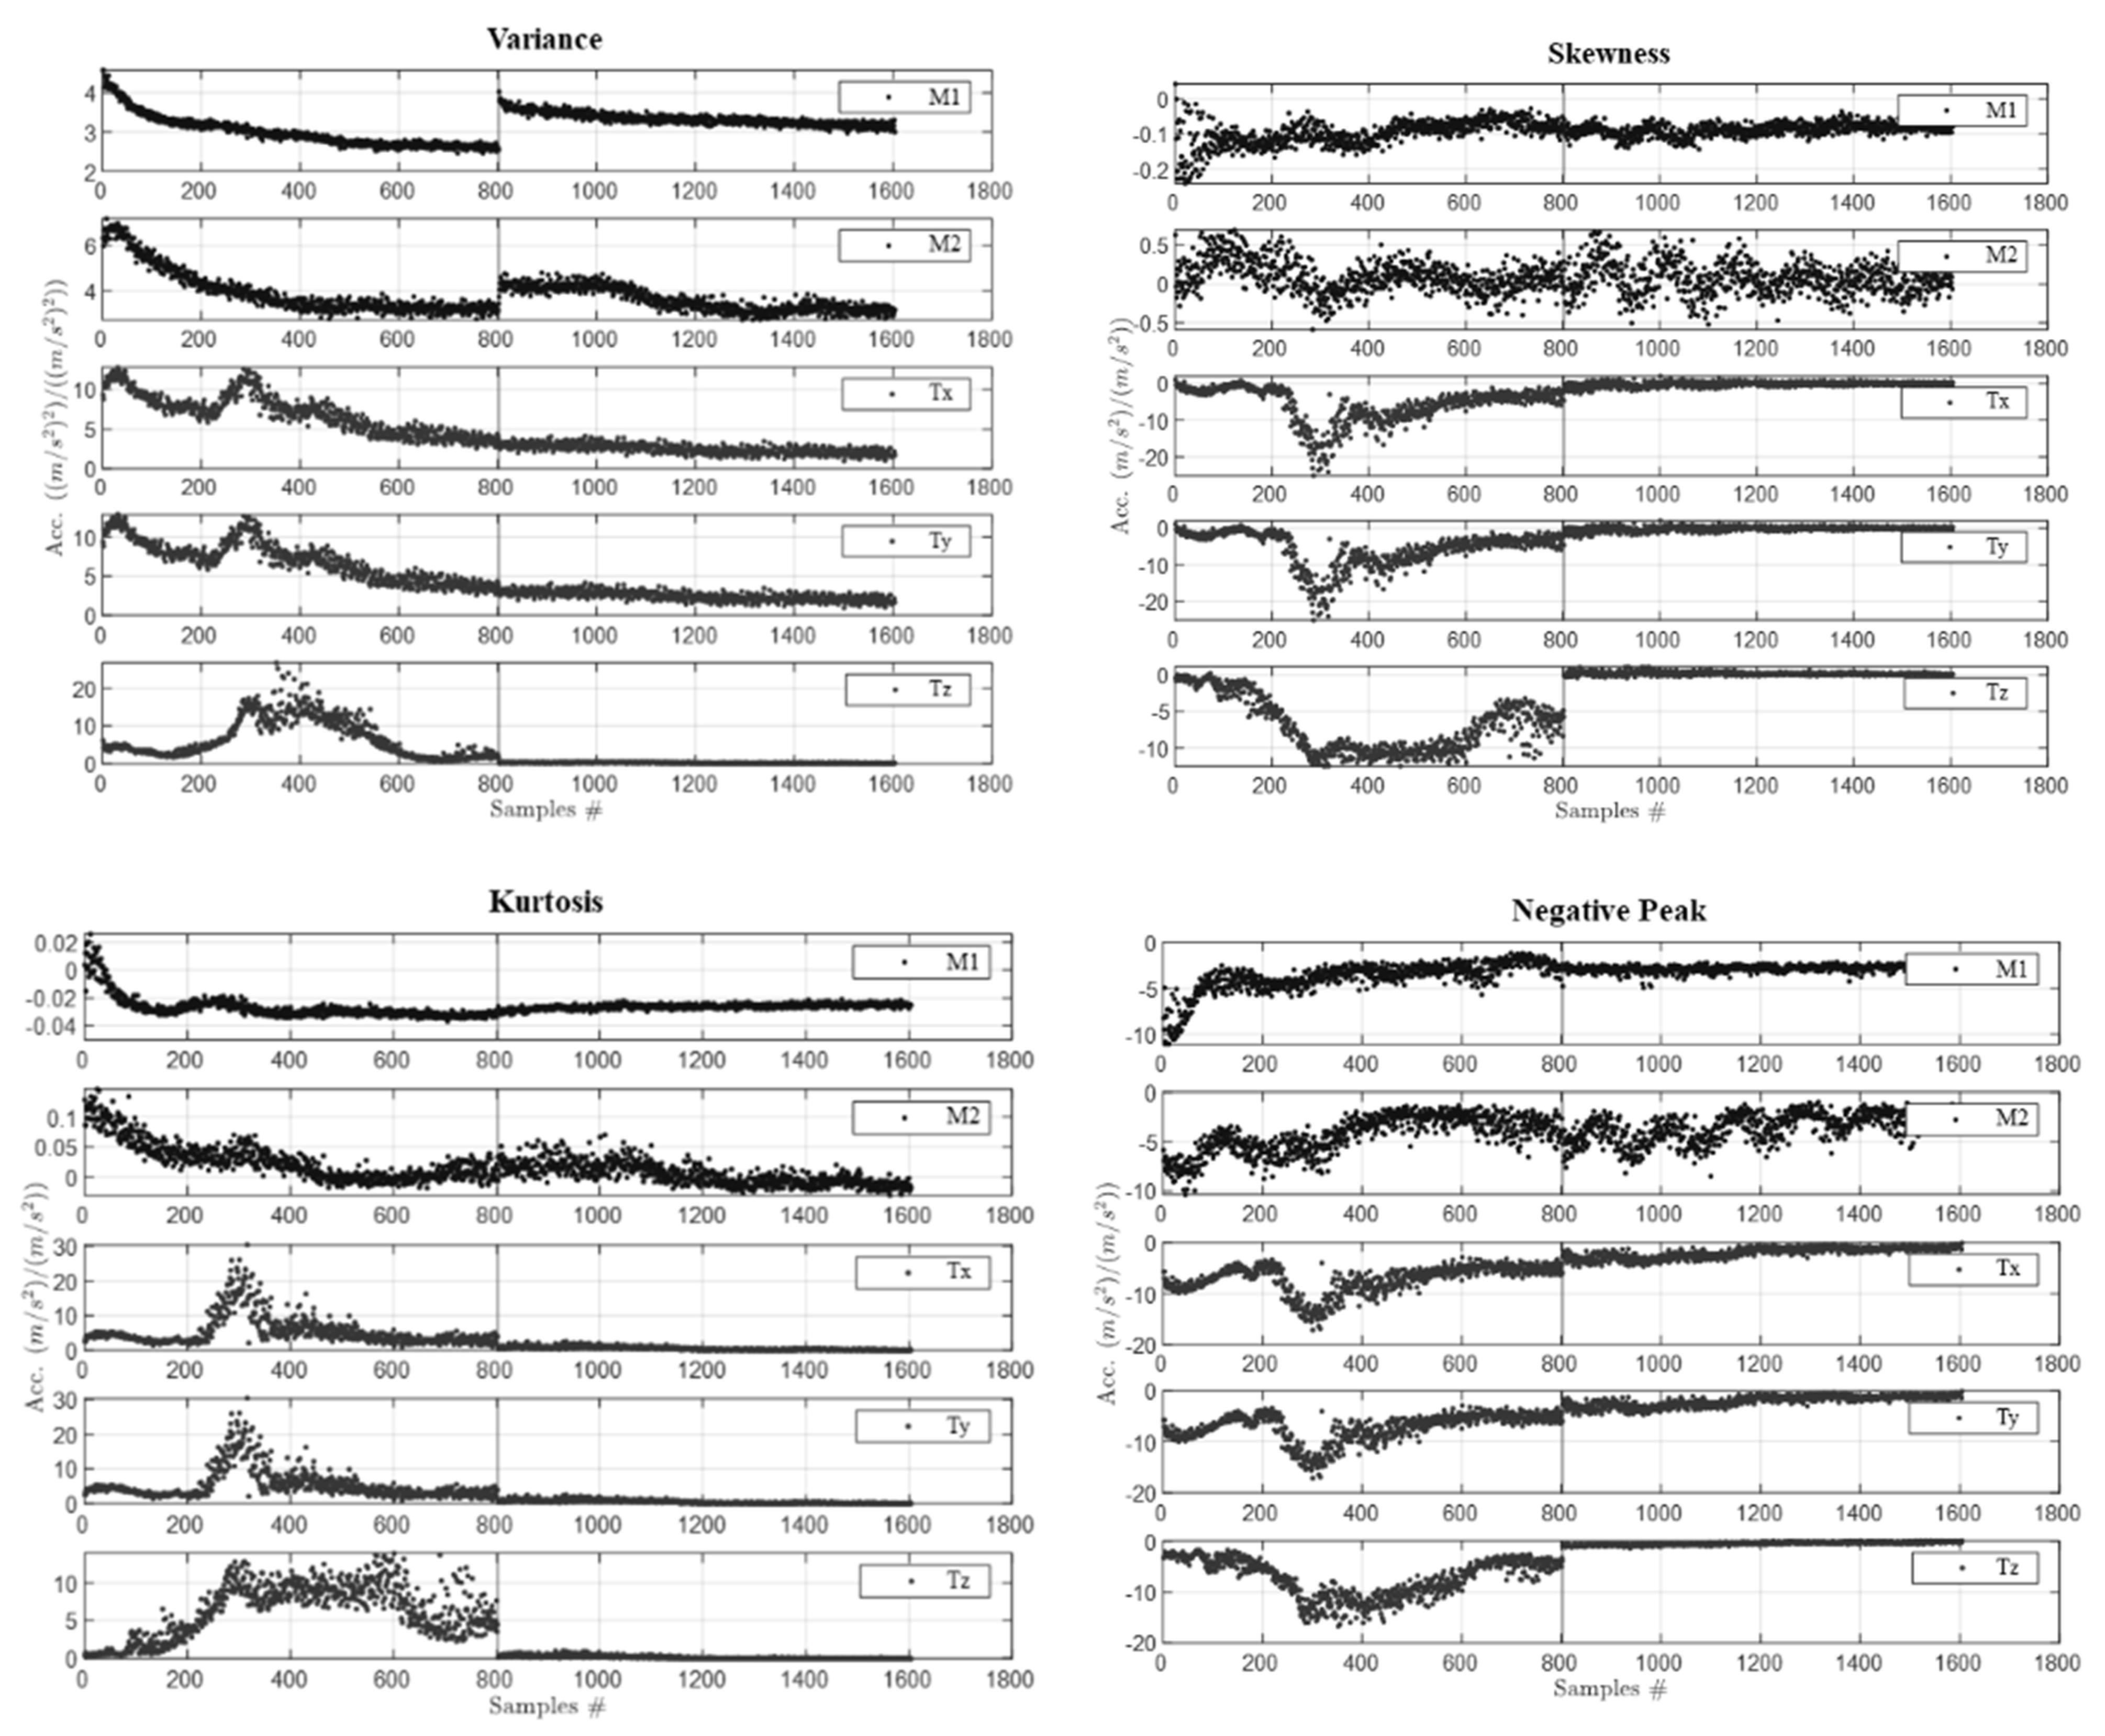
Figure 8 illustrates comparisons of the extracted features on the micro-scale to highlight the differences due to the SOH of the blade. For the sake of conciseness, only the comparisons from the initial transient phase are presented, and the mean values are omitted since they are theoretically null and not relevant for identifying blade conditions. Upon visual inspection, the charts reveal a clear and objective distinction in the distributions of the features corresponding to the two machine SOH, suggesting that the features hold significant potential for accurate classification. A true statistical testing of the class separability was then avoided, and classification was directly implemented. Notice that classifiers like Linear Discriminant Analysis (LDA) are actually closely related to Fisher class separability scores, as LDA generalizes the concept of the Fisher score to multiple dimensions (features). For the sake of completeness, LDA projection vector weights are shown in
Figure 9 to show which features and sensor channels contribute most to linear classification. As LDA shows good results in classification (see
Table 1), this can be considered valid proof of class separability in the original space, under linear assumptions.
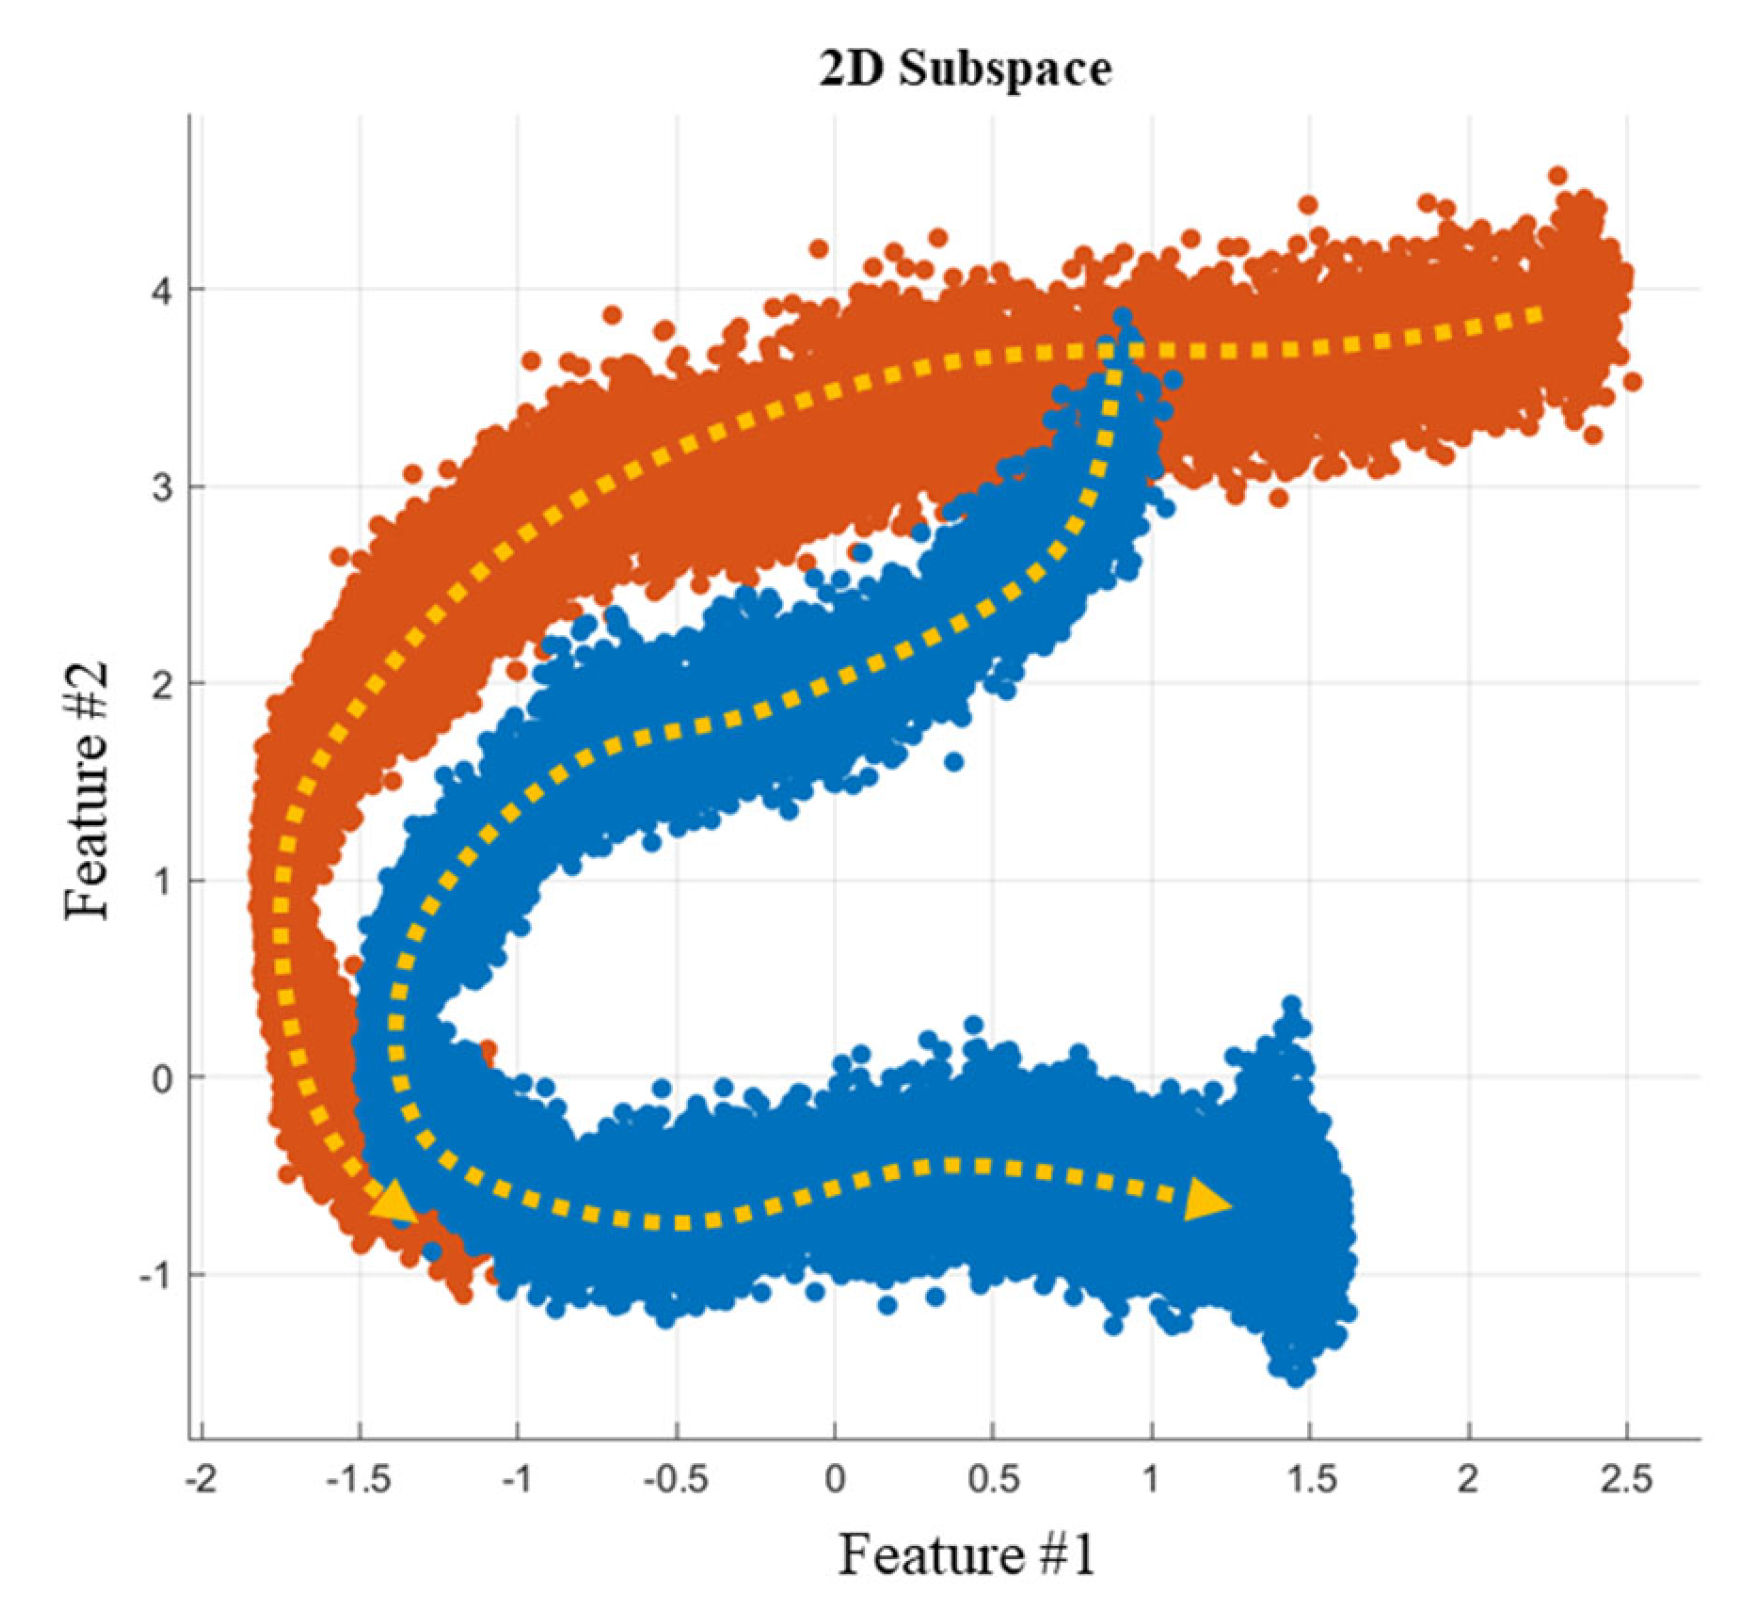
The classification process was then applied to the features extracted from both the transient and steady-state phases. The results from the transient operational phase were highly successful, with 100% accuracy achieved by all classifiers, except for GNB, which achieved 99.6% accuracy. However, for the steady-state phase, a slight decrease in accuracy was observed, ranging from 95.9% to 99.8%. This decrease can be attributed to the multidimensional feature space in steady-state conditions, where the paths of data points representing different endurance tests begin to overlap, making the separation between conditions more difficult. As an example,
Figure 10 illustrates the feature points in a 2D projection (variance of sensors
M1 and
M2, respectively) of the multivariate space. It demonstrates how the paths during the machinery steady-state phase for both healthy and damaged blades intersect in certain regions. As a result, the classifiers have difficulty accurately distinguishing the class of features located in these regions, leading to a slight reduction in accuracy.
4.3. Downgrade Analysis
Given the excellent recognition of blade regulation conditions achieved by all types of classifiers, the analysis can proceed with the study of system downgrades. For brevity, the results related to the transient phase of the machinery will be presented.
4.3.1. Sampling Frequency Downgrade
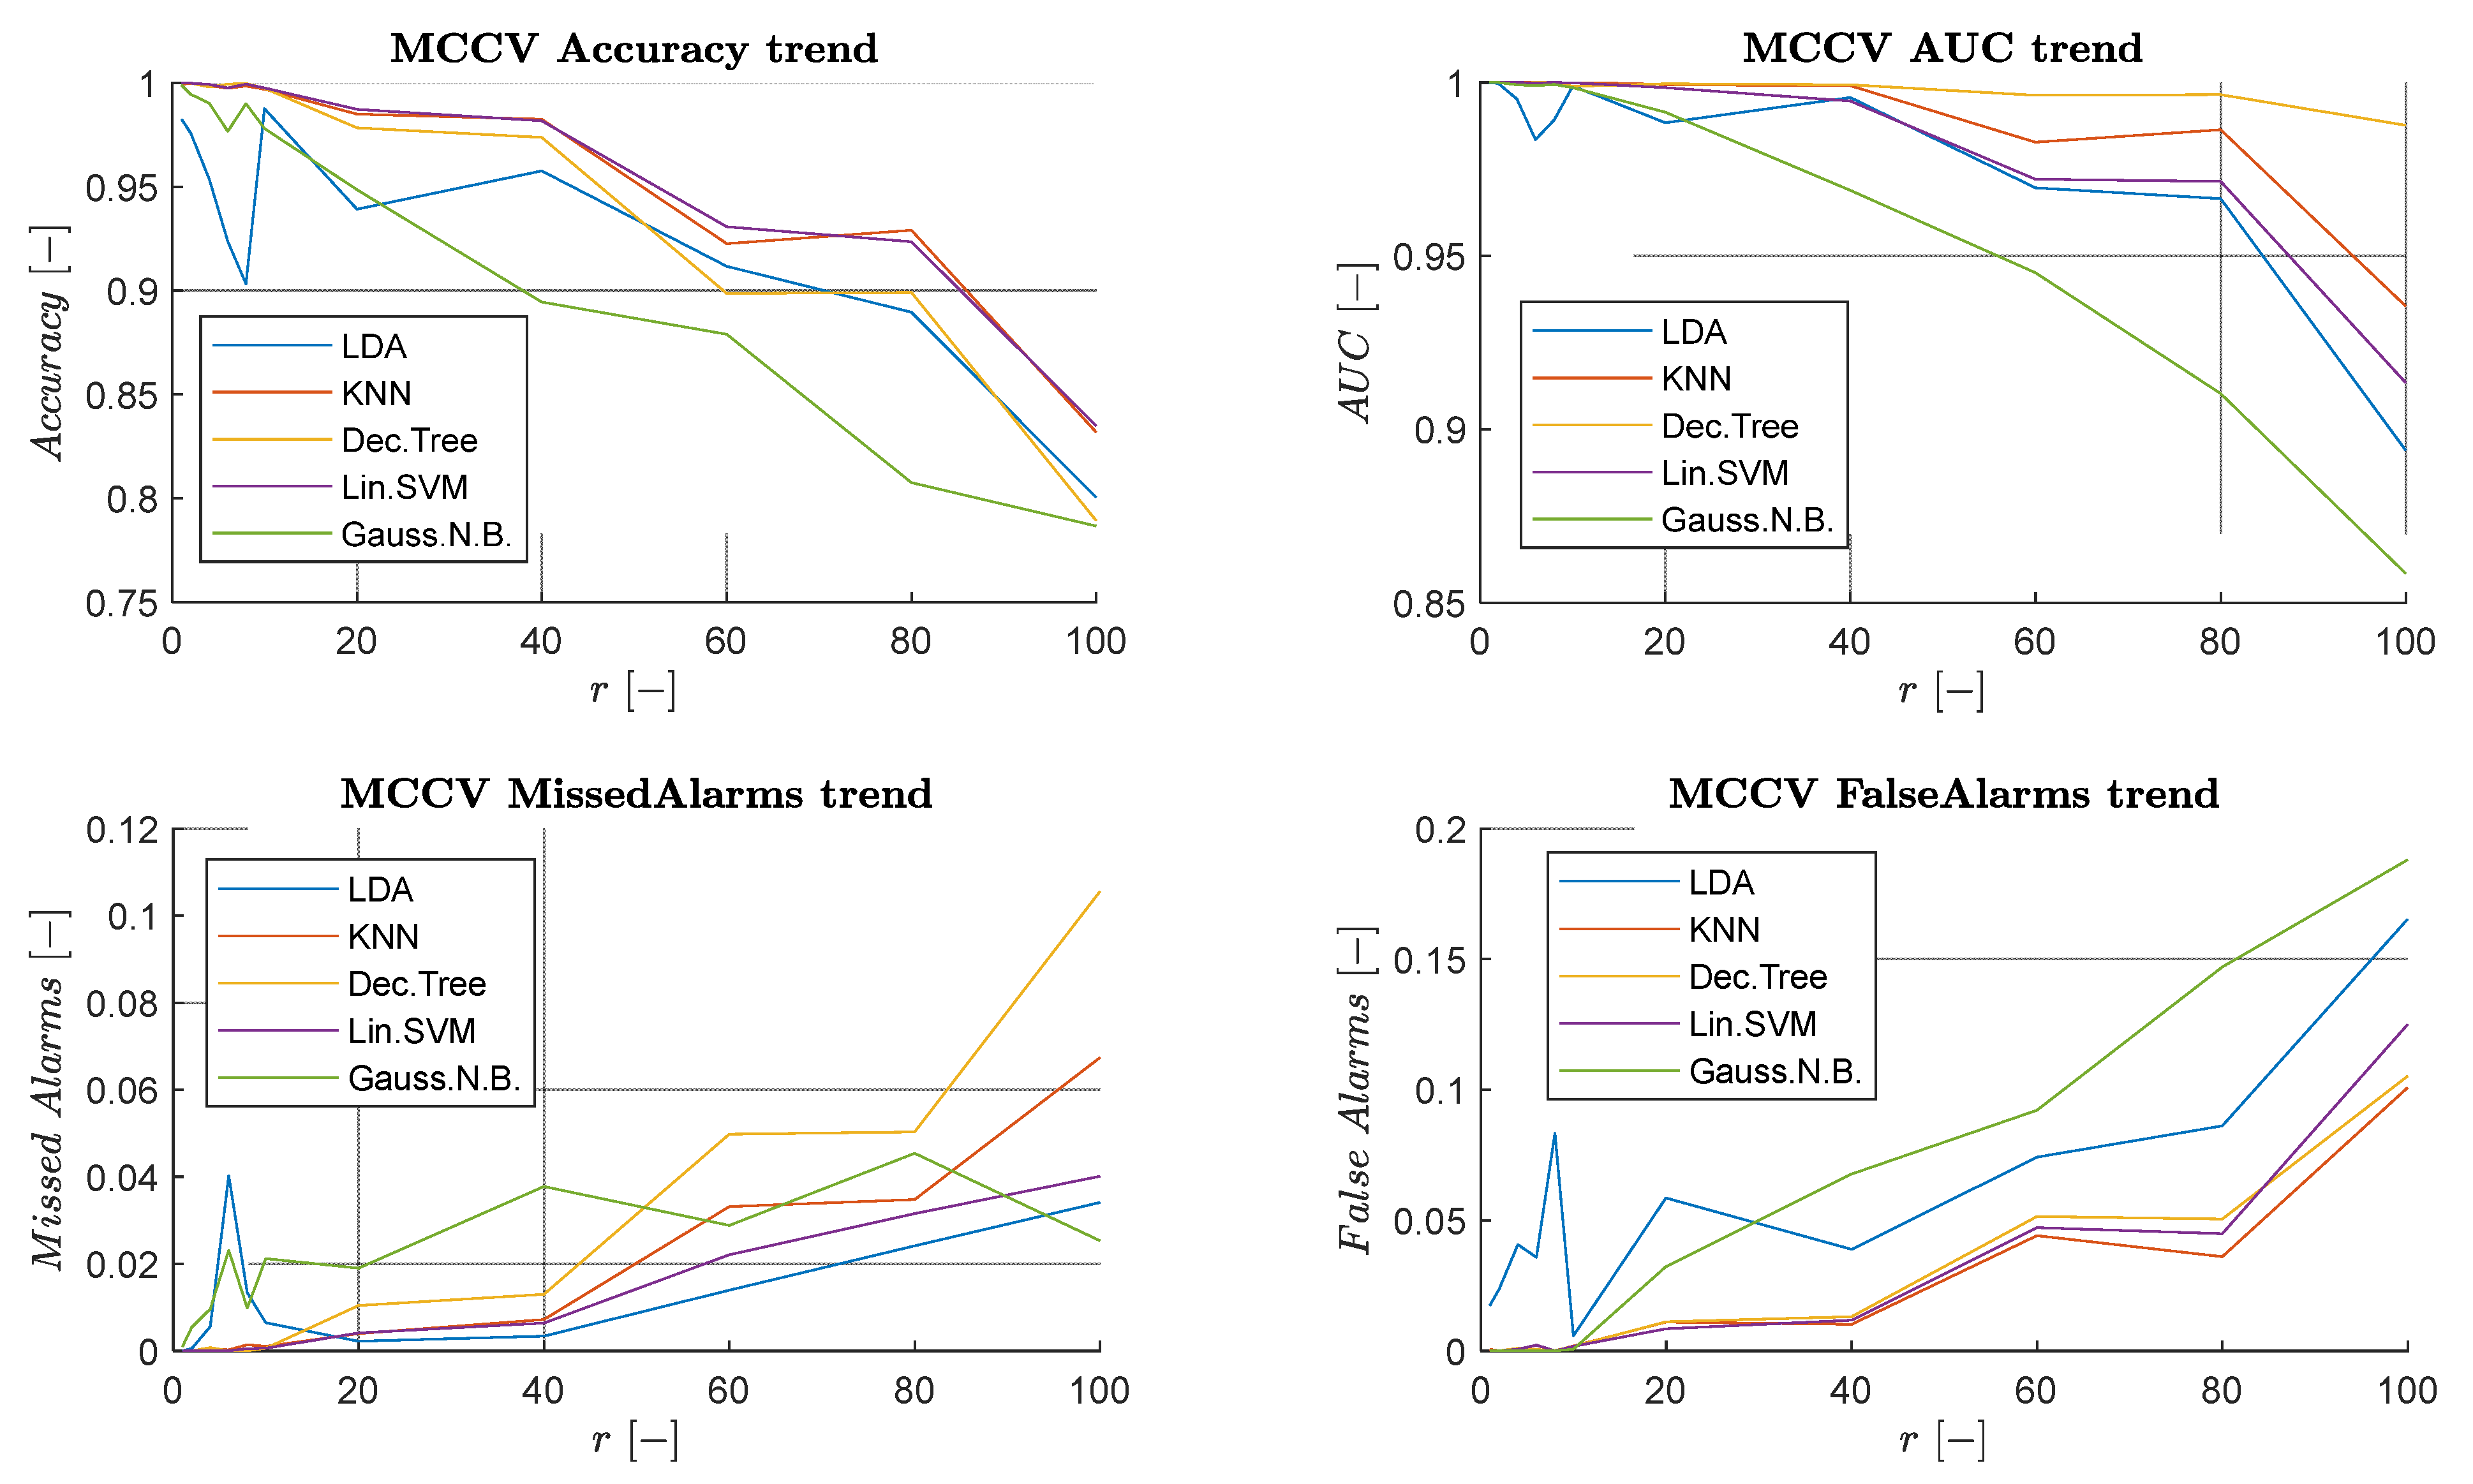
After applying the a posteriori resampling based on the proposed method, the MCCV technique was repeated to derive the performance indices of the different classifiers. As shown in
Figure 11, all indices appear to experience slight performance declines as the reduction factor
increases (i.e., as the simulated sampling frequency decreases), until reaching a plateau around
= 80. Based on these results, it may be feasible to reduce the sampling frequency to 640 Hz (corresponding to
= 40), as this would provide an optimal trade-off between downgrade and performance. Furthermore, in this case, there would be no need to modify the feature extraction method, as with
= 40, the window length would still contain a statistically significant number of samples.
Table 1 presents the performance indices obtained after downgrading the sampling frequency by a factor
= 40. Comparing these results with those without downgrading, it can be observed that the classifier performances remain excellent despite the reduction in information, and they allow for accurate recognition of the blade condition.
4.3.2. Sensors Downgrade
This subsection explores the impact of reducing the number of sensors in the diagnostic system. Two different conditions are analyzed: the first condition considers the full triaxial accelerometer setup, utilizing all three channels, while the second condition evaluates the performance using only a single channel, simulating the use of a simpler uniaxial accelerometer, which could be more suitable for industrial applications. This comparison aims to assess the trade-off between sensor complexity, costs, and diagnostic accuracy, providing valuable insights for potential industrial implementation. For the sake of brevity,
Figure 12 presents the results obtained by reducing the channels to
Ty only, while
Table 2 and
Table 3 show the performance indices for both cases analyzed.
The results show that it is possible to achieve accuracy values consistently above 90% by using at least one channel (e.g., Ty) and reducing the sampling frequency to = 640 Hz. This could represent a good cost–performance trade-off for the diagnostic system and the new sensor technology to be selected for industrialization. It is worth noting that, since downsampling was performed using appropriate filters to prevent aliasing, the obtained result indicates that the most relevant diagnostic information related to the correct adjustment of the blade is primarily contained within the identified frequency range.
This analysis can be extended to steady-state data to investigate the real-time recognition of blade regulation (during the machine operation) or further explore and integrate blade wear detection. However, the company did not pursue this type of analysis, as even minor blade damage significantly affects product quality. Consequently, damage must be detected immediately at machine start-up, without waiting for steady-state conditions to be established.
To conclude,
Figure 13 shows the block diagram of the final diagnostic system, optimized for industrial implementation. Unlike the extended methodology illustrated in
Figure 4, the final system omits certain phases—such as the multi-scale analysis and downgrade procedures—that were essential during the development but not required in the industrial environment. This streamlined design highlights the practical feasibility of the solution while confirming the broader applicability of the proposed method to different types of machinery, provided that the preliminary phase is tailored accordingly.
5. Conclusions
This study presented a comprehensive approach to assessing the health conditions of industrial machinery by combining endurance testing with a multi-scale analysis to observe the overall trends in the recorded signals, gain insights into the mechanical behavior of the machinery, and identify the most critical phases for analysis. Focus was placed on both the transient and steady-state conditions to assess the accuracy of recognizing blade conditions during different operational phases of the machinery. Initially, damage detection was established through a preliminary cycle when the machinery starts from a standstill. Conversely, the steady-state phase demonstrated the feasibility of a real-time monitoring strategy.
The aim of the present work is not to propose a novel diagnostic technique but rather to adapt and combine well-established methodologies from the literature (e.g., novelty detection, signal processing techniques, and feature extraction) for the specific application. The obtained results suggest that the development of a diagnostic and prognostic system could effectively identify the health conditions of the analyzed machinery. The proposed method enabled a 100% accurate classification of the blade condition, utilizing the maximum amount of measured information. The study of the system downgrade demonstrates that satisfactory accuracy levels can be achieved while reducing the specifications of the employed acquisition system. Indeed, by reducing the number of sensors used and simulating a lower sampling frequency, it was still possible to achieve accuracy values ranging from 96% to 99% on average for most classifiers. Identifying the optimal trade-off between the performance of the diagnostic system and its costs has led to the definition of a scalable system, suitable for industrial applications [
39]. Clearly, while the total cost of implementing the diagnostic system largely depends on the type and number of sensors employed [
40], further optimization may be needed in data acquisition and processing to enable real-time analysis. Nevertheless, the use of simple features and well-established classification algorithms is expected to keep implementation costs relatively low, virtually negligible compared to the overall cost of the machine.
To enhance diagnostic accuracy across all operating conditions, temperature data, previously unused, could help align current measurements with similar conditions in the training set. While building a comprehensive temperature-based dataset would be complex and potentially cost-ineffective given already high accuracy levels, temperature information might still be useful. Specifically, it could be used with PCA to remove temperature-related trends and transients from accelerometer signals, improving the consistency of blade damage detection.
Despite the positive results, this work can be extended by exploring additional aspects and further improving the accuracy of the diagnostic system. For example, studying the decorrelation of temperature-dependent effects could be incorporated into the data preprocessing phase to reduce confounding effects and, consequently, enhance classification outcomes. Additionally, recognizing blade regulation in real-time during the machine operation could be a valuable direction for further development, along with deepening and integrating the detection of blade wear. However, accurately identifying the blade wear would require significantly more data to develop a multi-level—or ideally, a continuous—classification. Finally, since the data used in this study were acquired from a single machine, it would be valuable to expand the analysis to a larger population of machines to generalize the model and explore different configurations and additional parameters, such as in a real industrial environment. The proposed system, if integrated into actual production, could help establish the huge database necessary for such an analysis.
