Article

Optimization of Structural Parameters for 304 Stainless Steel Specific Spiral Taps Based on Finite Element Simulation

1
The Institute of Engineering Thermophysics, Chinese Academy of Sciences, Beijing 100094, China
2
College of Engineering, China Agricultural University, Beijing 100091, China
*
Author to whom correspondence should be addressed.
Machines 2025, 13(8), 655; https://doi.org/10.3390/machines13080655 (registering DOI)
Submission received: 23 June 2025 / Revised: 21 July 2025 / Accepted: 23 July 2025 / Published: 26 July 2025
(This article belongs to the Section Machine Design and Theory)

Abstract

To address the issues of large errors, low accuracy, and time-consuming simulations in finite element (FE) models of tapping processes, which hinder the identification of optimal structural parameters, this study integrates FE simulation with experimental testing to optimize the structural parameters of spiral taps specifically designed for stainless steel. Initially, single-factor experiments were conducted to analyze the influence of mesh parameters on experimental outcomes, leading to the identification of optimal mesh coefficients. Subsequently, the accuracy of the FE tapping simulation model was validated by comparing trends in axial force, torque, and chip morphology between simulations and actual tapping experiments. Orthogonal experimental design combined with entropy weight analysis and range analysis was then employed to conduct FE simulations. The results indicated that the optimal structural parameter combination is a helix angle of 43°, cone angle of 19°, and cutting edge relief amount of 0.18 mm. Finally, based on this combination, optimized spiral taps were manufactured and subjected to comparative performance testing. The results demonstrated significant improvements: the average maximum axial force decreased by 33.22%, average maximum torque decreased by 13.41%, average axial force decreased by 38.22%, and average torque decreased by 24.87%. Error analysis comparing corrected simulation results with actual tapping tests revealed axial force and torque error rates of 5.04% and 0.24%, respectively.

1. Introduction

Possessing excellent corrosion resistance, high-temperature resistance, and mechanical properties, 304 stainless steel is widely used in the aerospace field. However, precisely because of these outstanding properties, 304 stainless steel is also considered a difficult-to-machine material. Particularly during tapping processes, it often encounters problems such as high cutting resistance, chip evacuation difficulties, and accelerated tool wear, leading to low machining efficiency and short tool life. Therefore, when using spiral taps for tapping 304 stainless steel, it is necessary to reasonably select structural parameters to improve tapping performance, thereby enhancing processing efficiency and extending tool service life.
Al-Zkeri et al. [1] established a finite element simulation model for turning 42CrMo alloy steel using DEFORM software (https://www.deform.com/), analyzed the influence of cutting edge radius on cutting stress, and optimized the cutting edge radius. However, they did not verify the accuracy of the model nor analyze and correct the error. Ahmed et al. [2] established a finite element simulation model for ball-end milling of AISI H13 using AdvantEdge software (http://www.thirdwavesys.com). They used the Taguchi method to analyze the influence of structural parameters (rake angle, clearance angle, helix angle) on cutting force and temperature, and optimized the structural parameters. However, they only validated the finite element simulation model’s accuracy through two dimensions (cutting force and temperature), resulting in significant simulation error. Furthermore, they did not analyze or correct the error. Yuksel et al. [3] established a milling finite element simulation model for 316 L stainless steel using AdvantEdge software. They used response surface methodology and analysis of variance (ANOVA) to analyze the influence of structural parameters (clearance angle, rake angle, radius) on milling force and optimized the structural parameters. However, they only validated the model accuracy through one dimension (cutting force), resulting in significant simulation error. They also did not analyze or correct the error. Puoza et al. [4] established a drilling finite element simulation model, analyzed the influence of structural parameters (rake angle, clearance angle, base circle, helix angle) on drilling force, and optimized the structural parameters. They validated the finite element simulation model’s accuracy only through one dimension (drilling force), resulting in significant simulation error. Error analysis and correction were not performed. Senthilkumar and Tamizharasan. Ref. [5] established a turning finite element simulation model for AISI 1045 steel using DEFORM software. They used the Taguchi method, signal-to-noise ratio (SNR), and analysis of variance (ANOVA) to analyze the influence of cutting edge angle, clearance angle, and tool nose radius on flank wear, surface roughness, and material removal rate, selecting the optimal structural parameter combination. However, model accuracy was validated only through one dimension (cutting force), and error analysis and correction were not performed. Imad et al. [6] established a hardened steel milling finite element simulation model using ABAQUS software (https://www.3ds.com/products/simulia/abaqus), studying the effect of cutting edge radius variation during hardened steel milling and selecting the better edge radius. However, model accuracy was validated only through one dimension (cutting force), and error analysis and correction were not implemented. Padmakumar and Arunachalam. [7] established a ductile cast iron milling finite element simulation model using AdvantEdge software. They analyzed the influence of different cutting speeds and feed rates, along with different cutting edge radii, on axial force, temperature, and stress, finding a better cutting edge radius. However, model accuracy was validated only through one dimension (resultant force), resulting in significant simulation error. Error analysis and correction were not performed. Wang et al. [8] established a Ti-6Al-4V drilling finite element simulation model using DEFORM-3D software (https://www.deform.com/deform-3d/), analyzed the chip-breaking performance of three drills with different point angles, and found the optimal drill point angle. However, model accuracy was validated only through one dimension (axial force), resulting in significant simulation error. Error analysis and correction were not performed. Suresh et al. [9] established a titanium alloy drilling finite element simulation model using DEFORM-3D software, studying the influence of drill point angle and edge radius on energy consumption. However, model accuracy was validated only through one dimension (average axial force), resulting in significant simulation error. Error analysis and correction were not performed. Wu M.C. et al. [10] established a finite element simulation model for tapping 7075-T6 using a small slotless forming tap with DEFORM software. They analyzed the influence of geometric parameters (tool width, root diameter, front end diameter, tooth angle) on thread fill rate and torque during tapping. However, they did not verify the model’s accuracy nor analyze or correct the error. Priest et al. [11] established an AISI 1045 steel drilling finite element simulation model using DEFORM software, analyzing the influence of different modeling methods on simulation accuracy. They validated the model accuracy through two dimensions (axial force and torque), but the error was significant. Error analysis and correction were not performed. Li et al. [12] established an AA 6061-T6 milling finite element simulation model using DEFORM software, analyzing the influence of cutting parameters and tool geometric parameters on cutting temperature, stress, and strain distribution. However, model accuracy was validated only through one dimension (cutting force), resulting in significant simulation error. Error analysis and correction were not performed. Magalhães et al. [13] established a PCBN insert turning finite element simulation model using DEFORM software, analyzing the influence of chamfer number on turning force, tool wear, stress, and temperature. However, they did not verify the model’s accuracy, resulting in significant simulation error. Error analysis and correction were not performed. Jagadesh and Samuel. [14] established a Ti-6Al-4V turning finite element simulation model using DEFORM software, analyzing the influence of different coated tools on surface roughness and temperature. They validated the model accuracy through three dimensions (cutting force, thrust force, feed force), but the simulation error was significant. Error analysis and correction were not performed.
Regarding research on spiral taps using finite element simulation: Dogrusadik et al. [15] established a Ti-6Al-4V titanium alloy tapping finite element simulation model using AdvantEdge software. They used the Taguchi method to analyze the influence of design parameters (rake angle, spiral groove angle, chamfer, and tool coating) on tapping torque and temperature, finding the optimal design parameters. However, they did not verify the accuracy of the model nor analyze or correct the error. Demirel et al. [16] established an AISI 1050 steel tapping finite element simulation model using AdvantEdge software, analyzing the influence of different helix angles and coatings on stress. However, they did not verify the accuracy of the model nor analyze or correct the error.
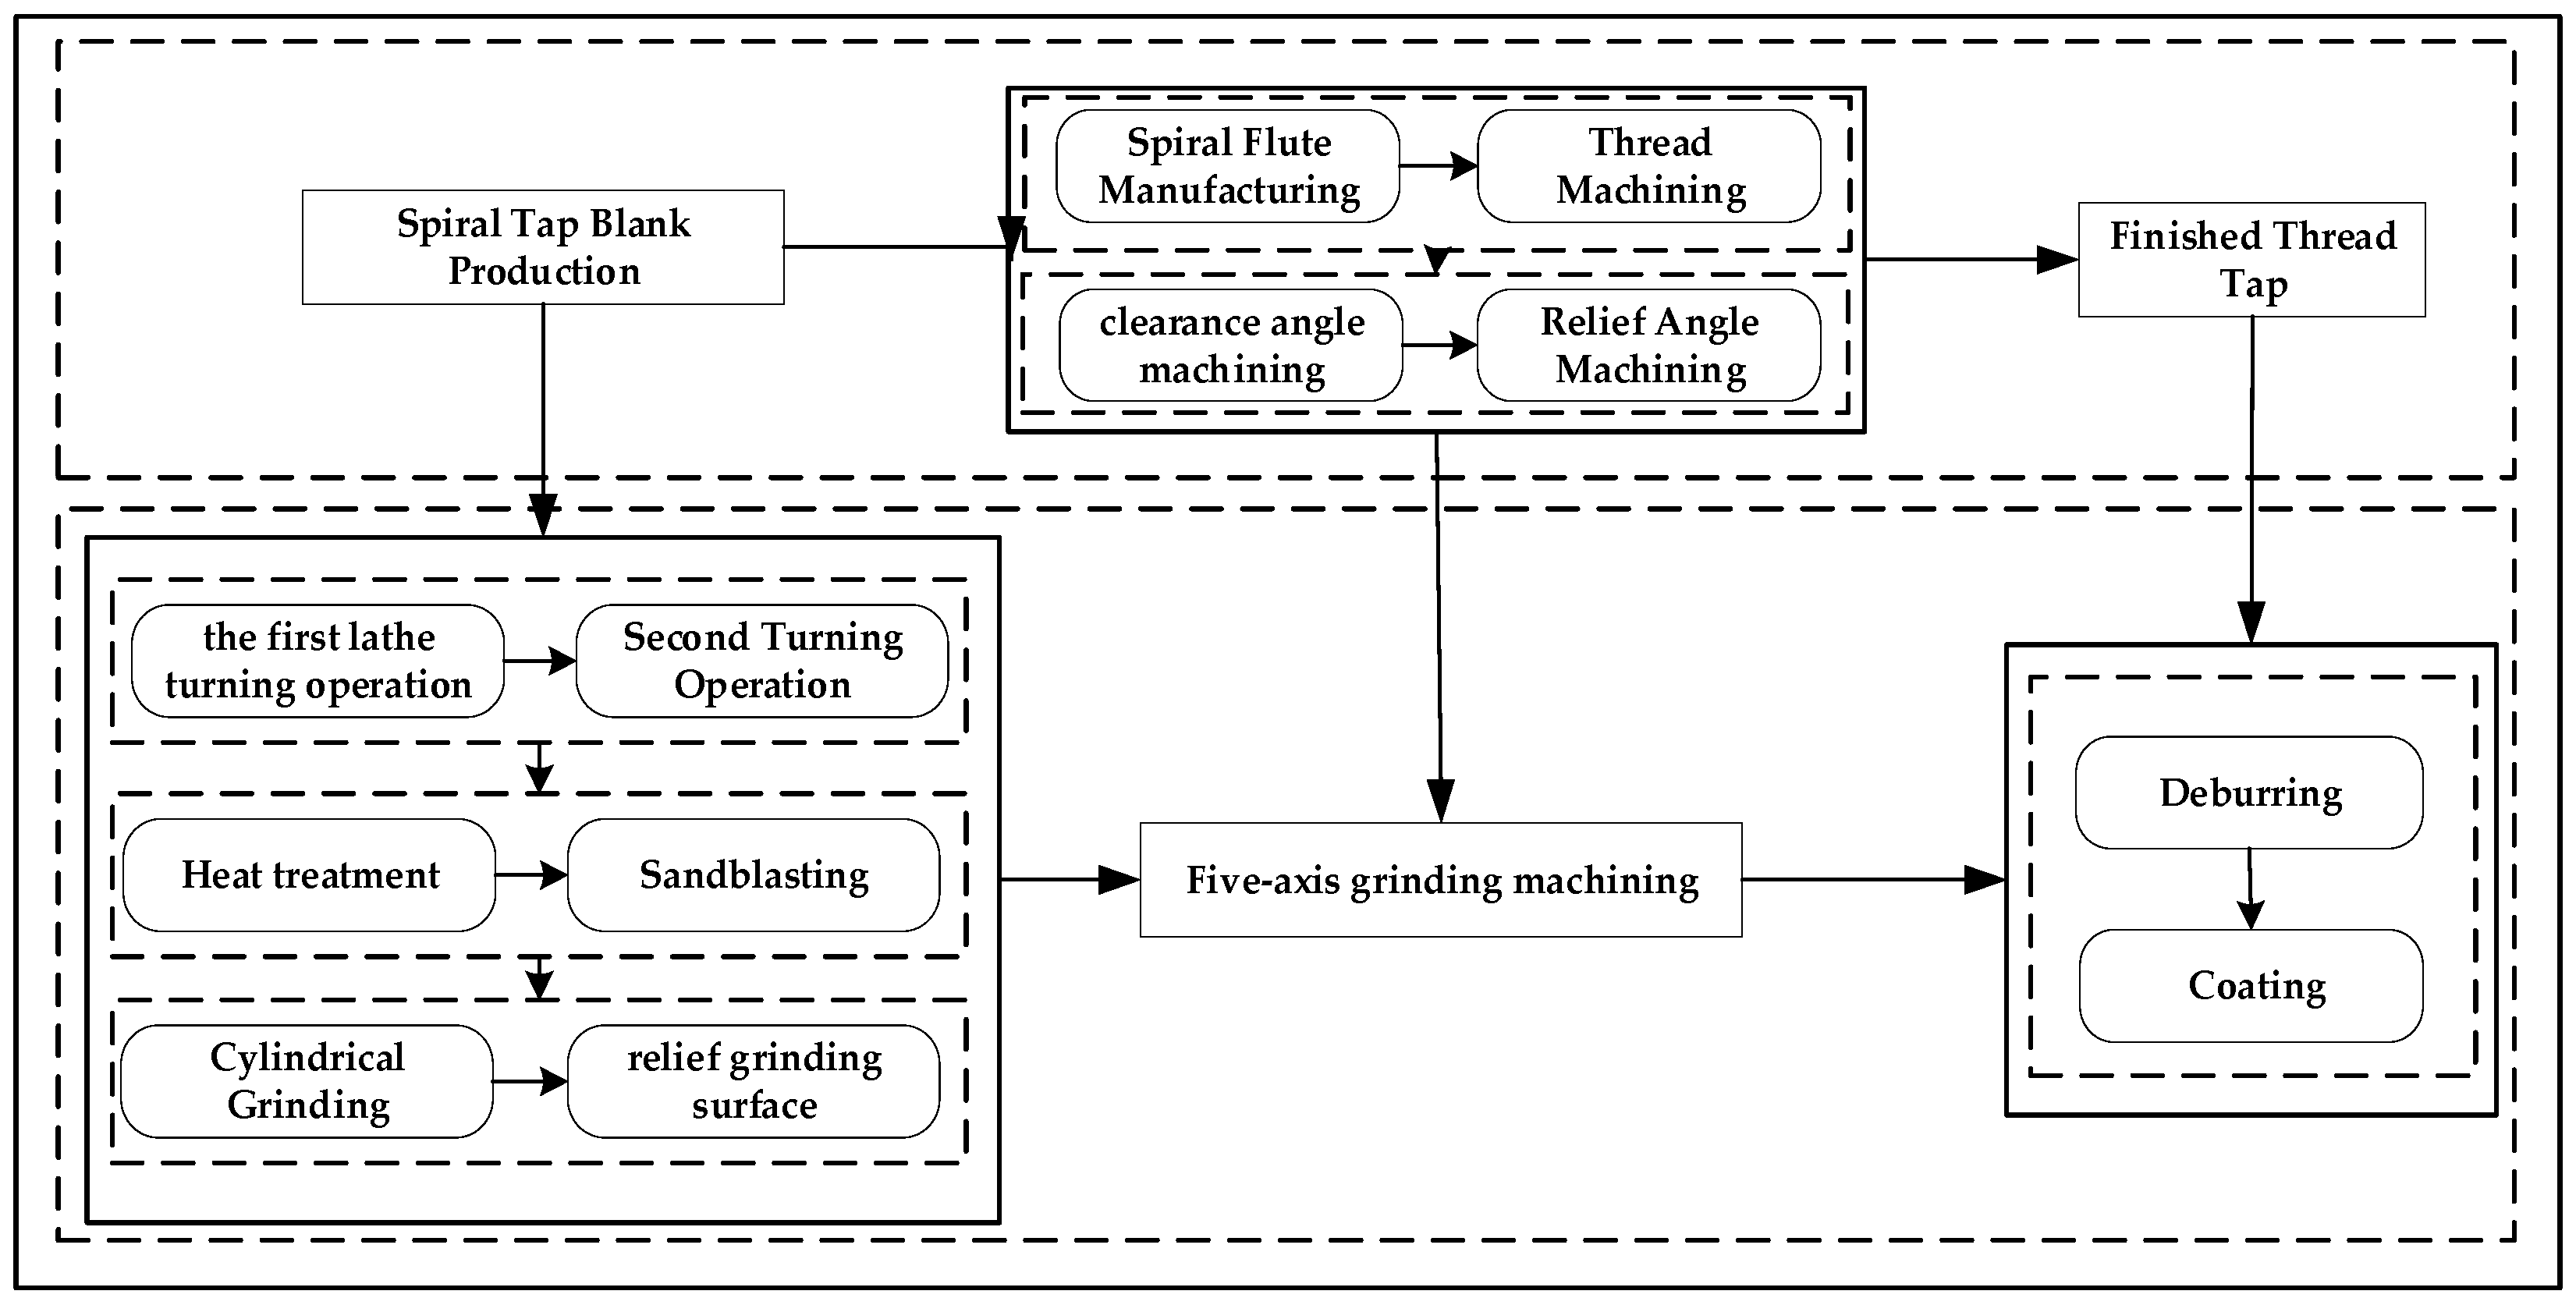
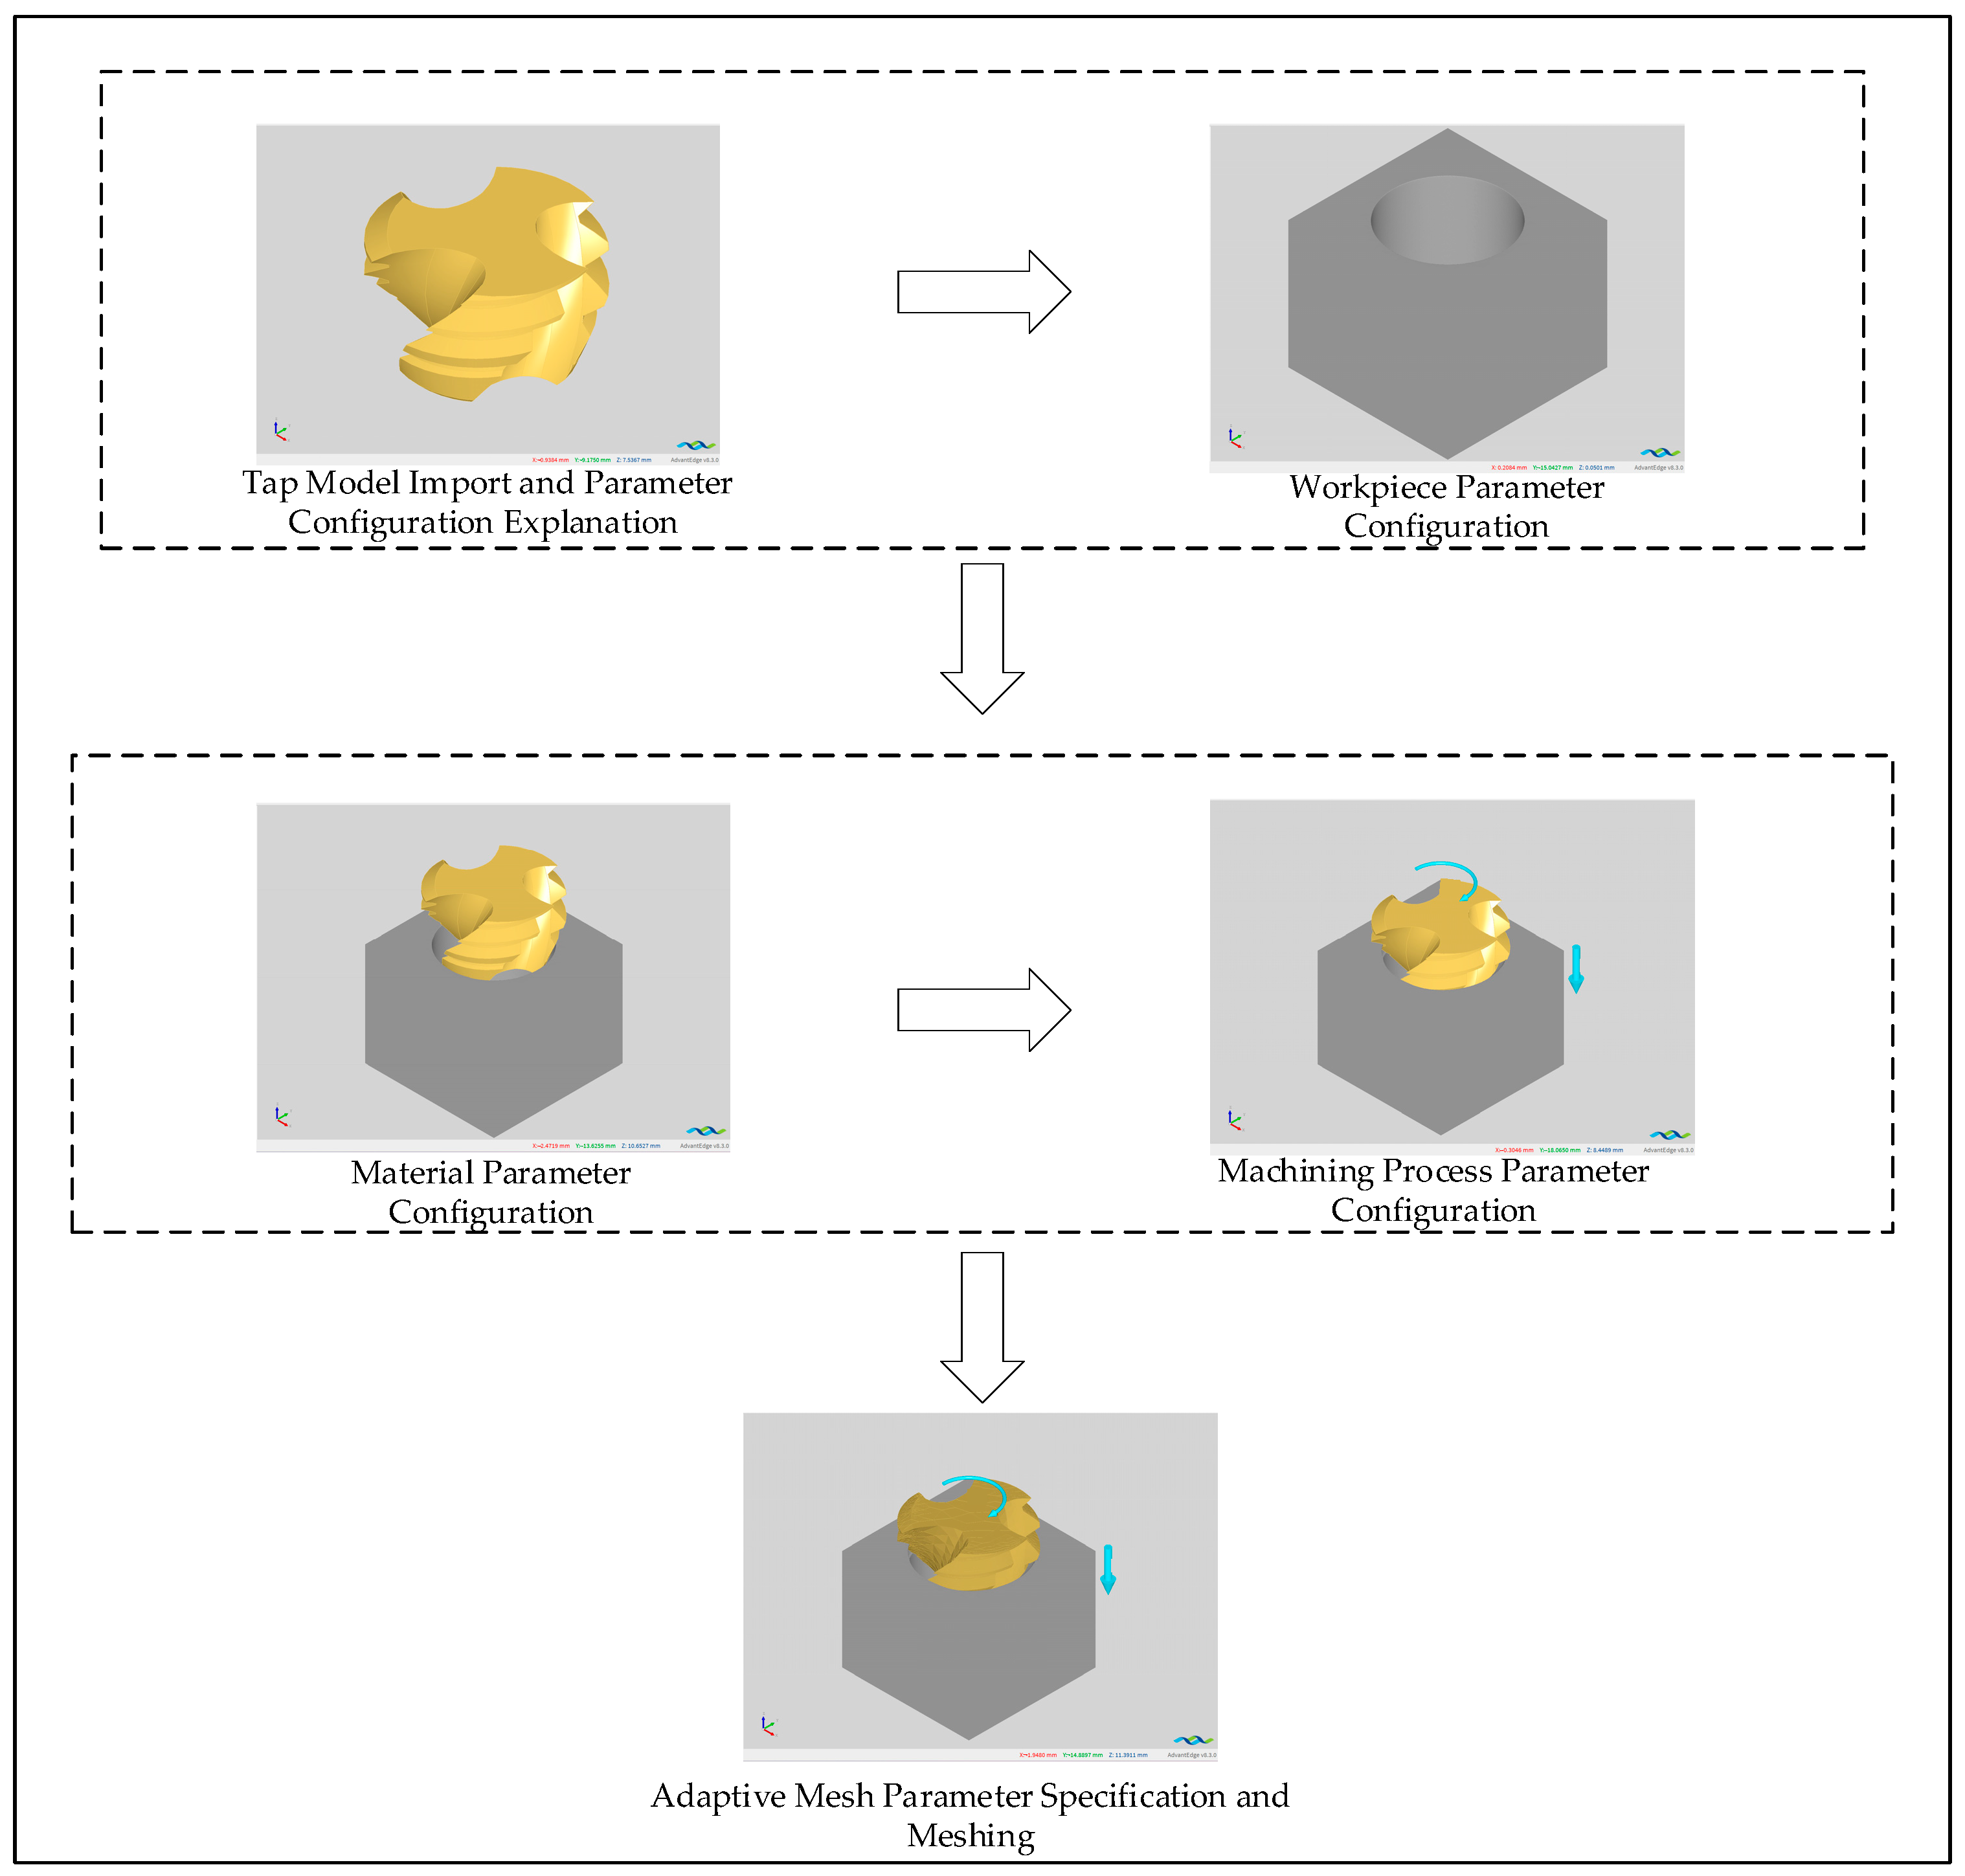
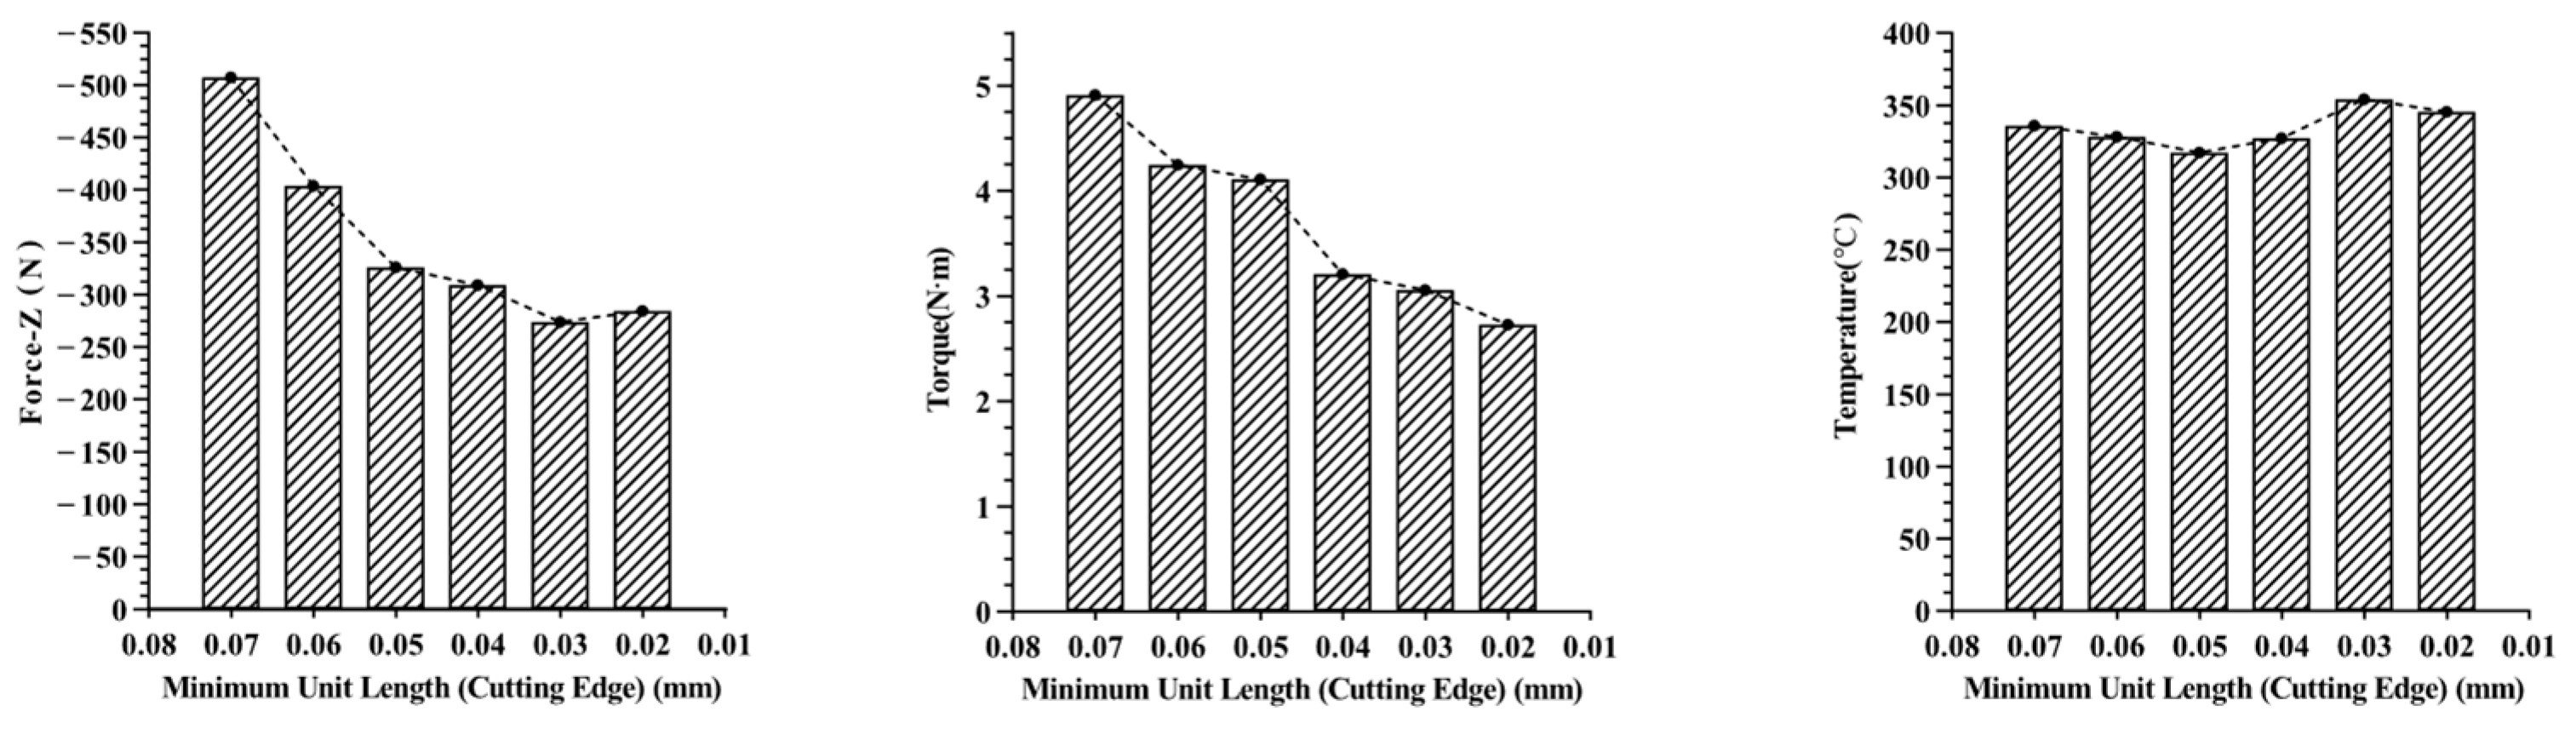
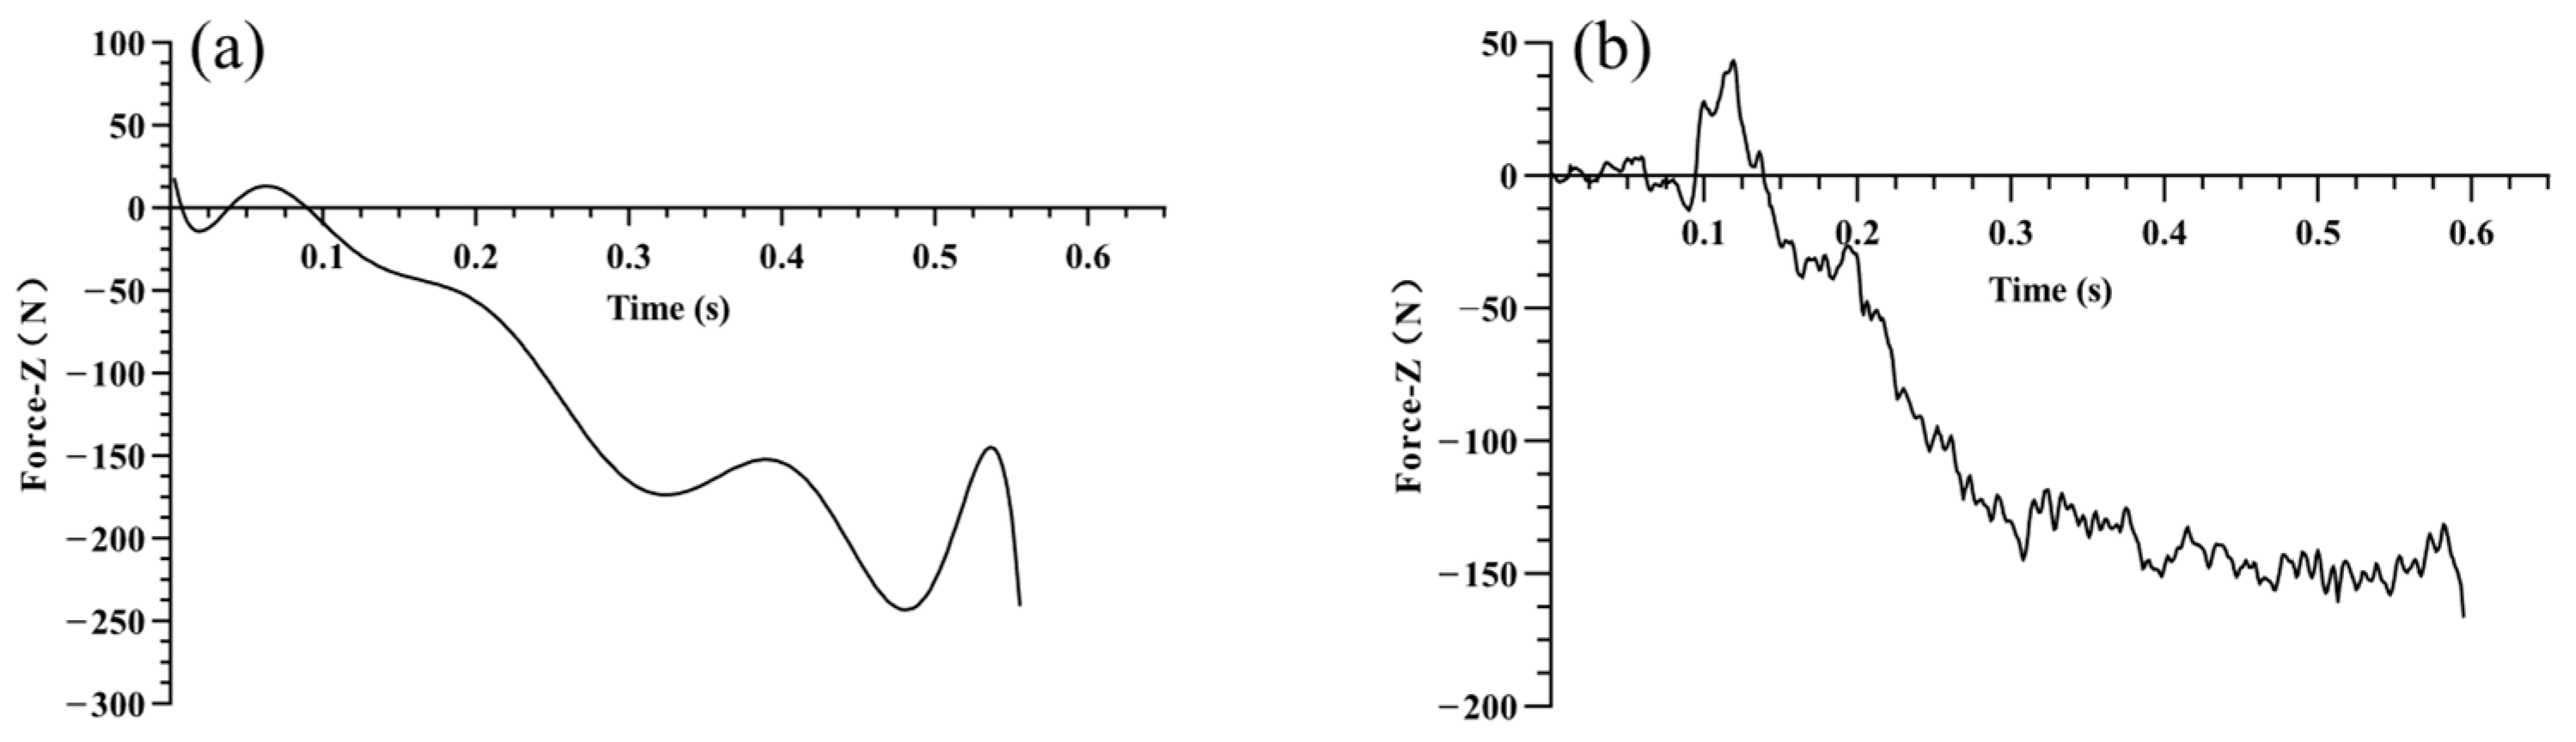
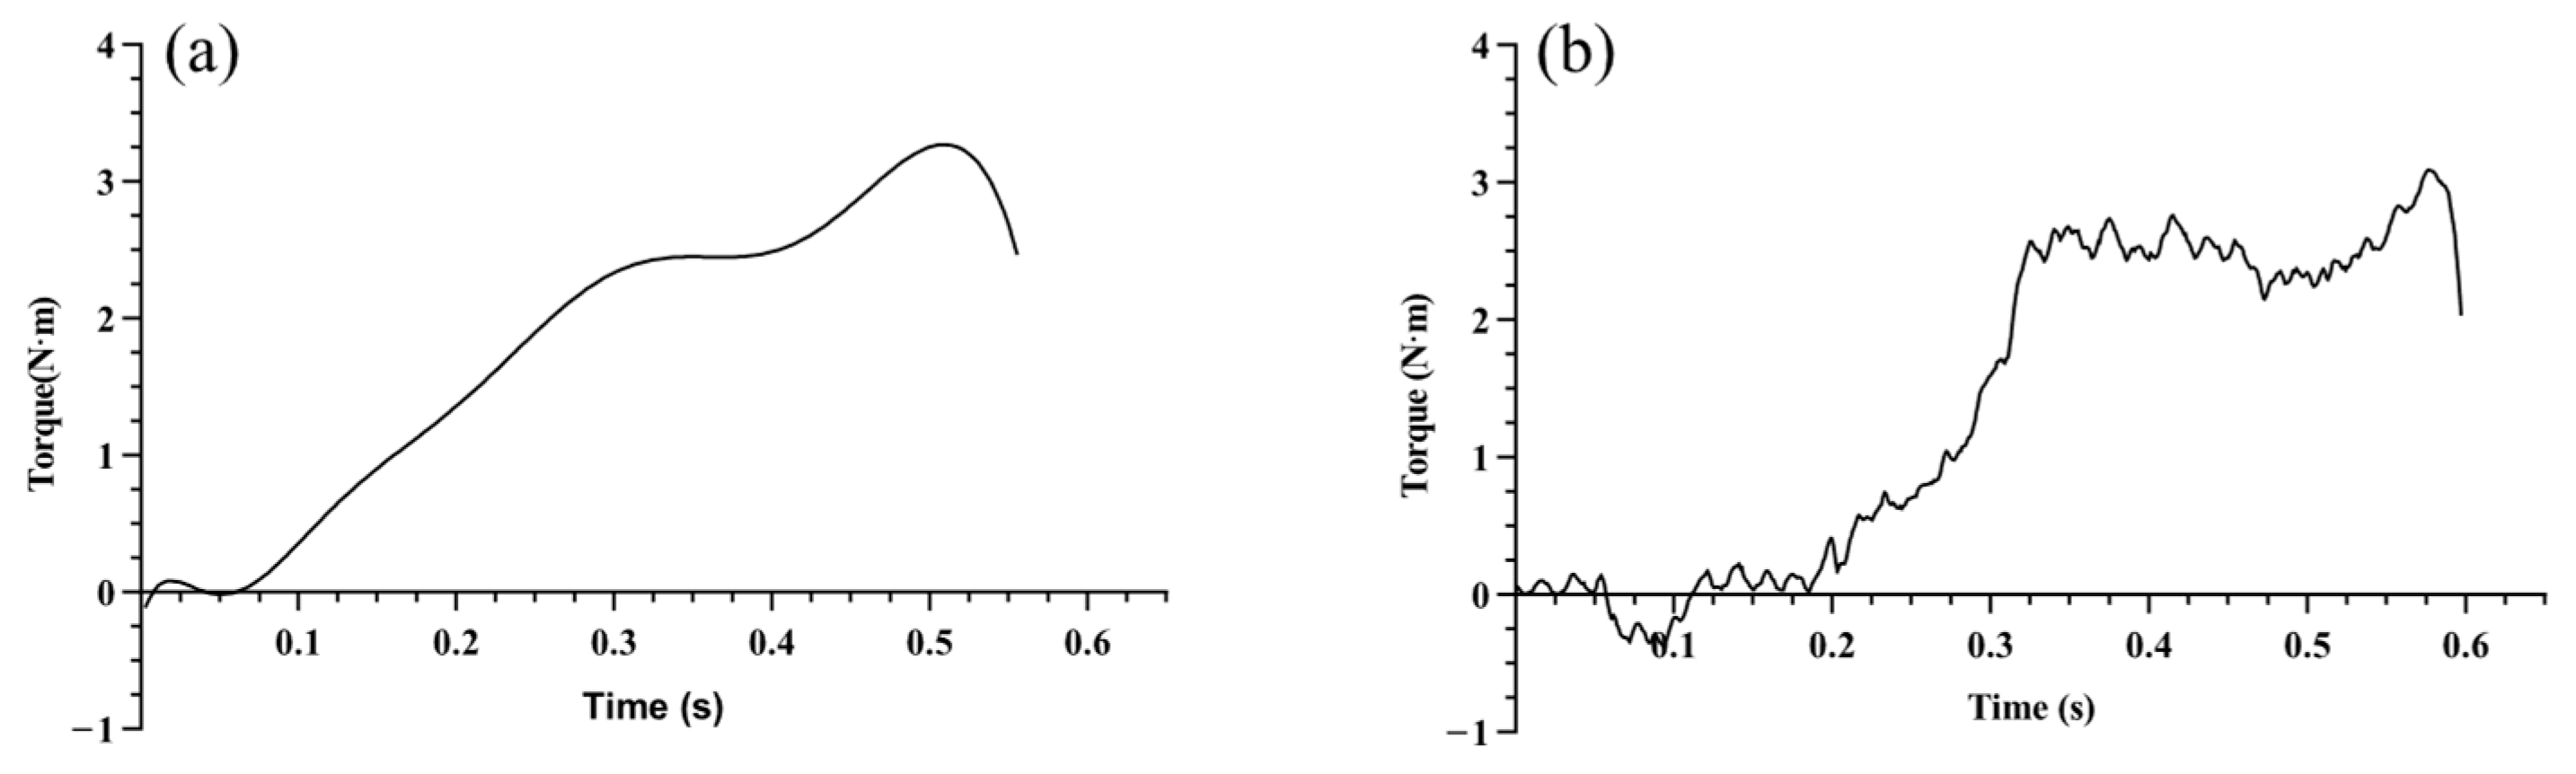
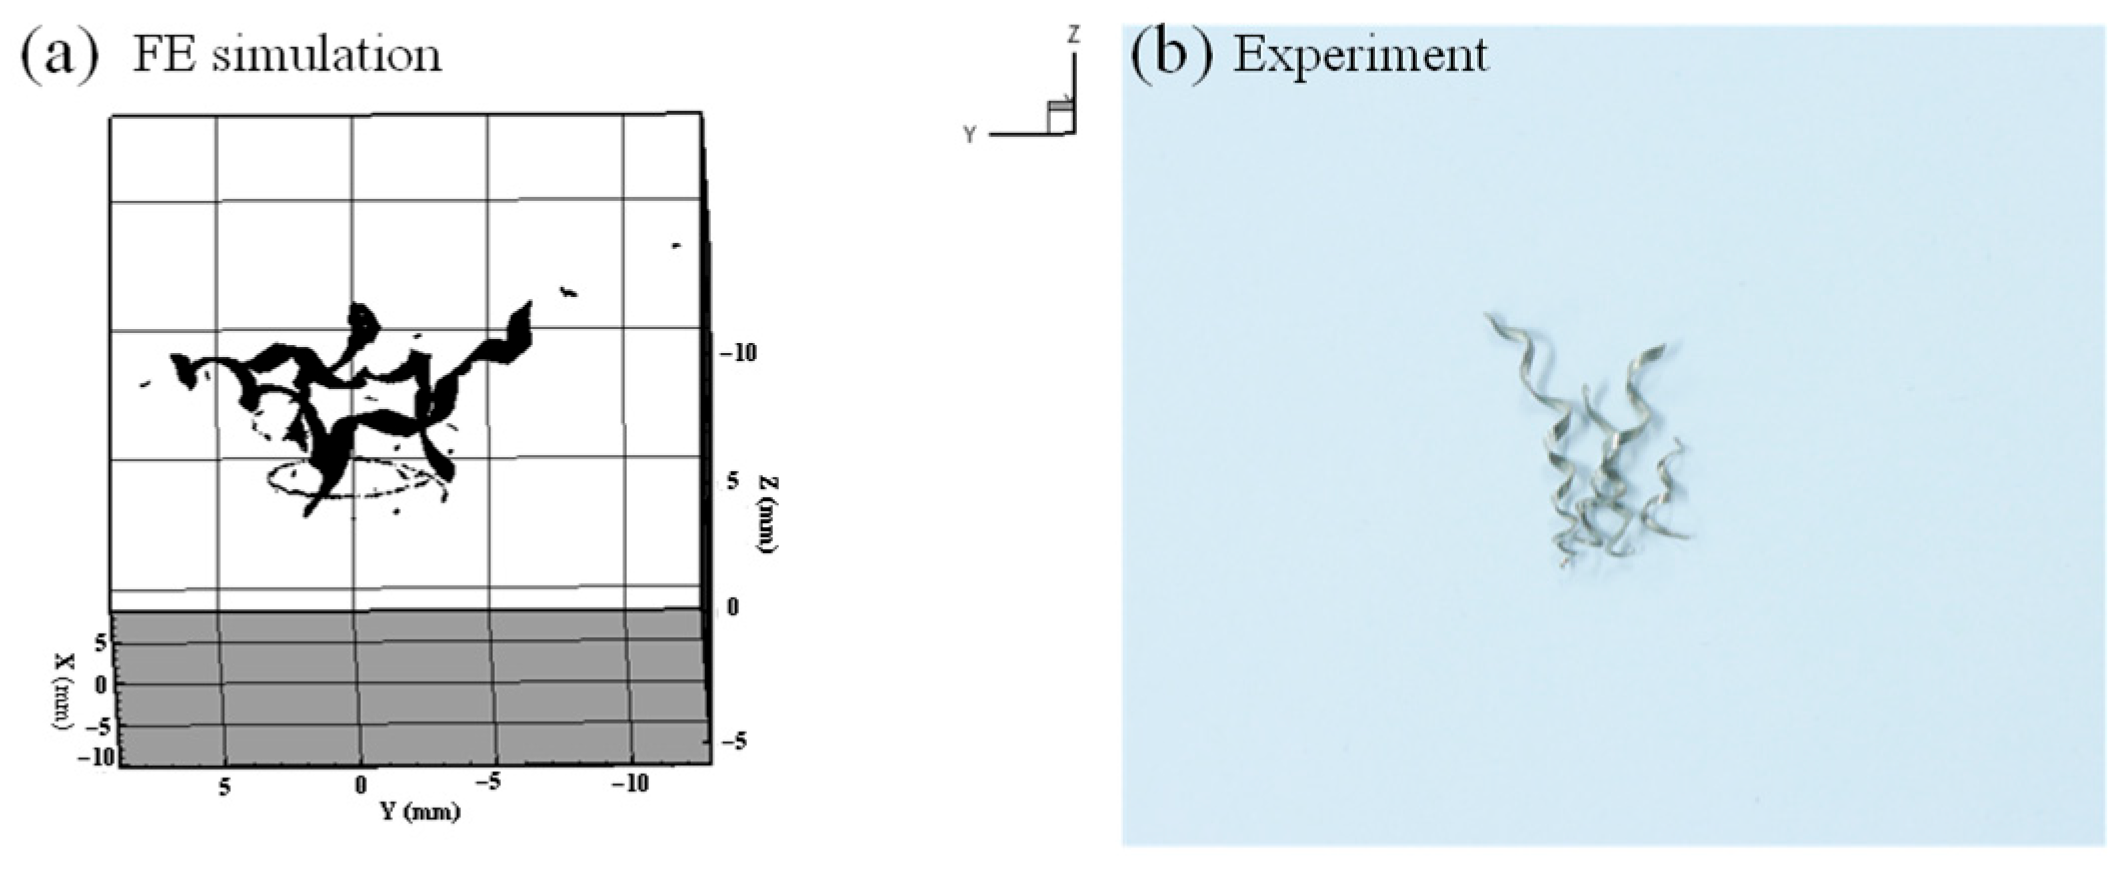
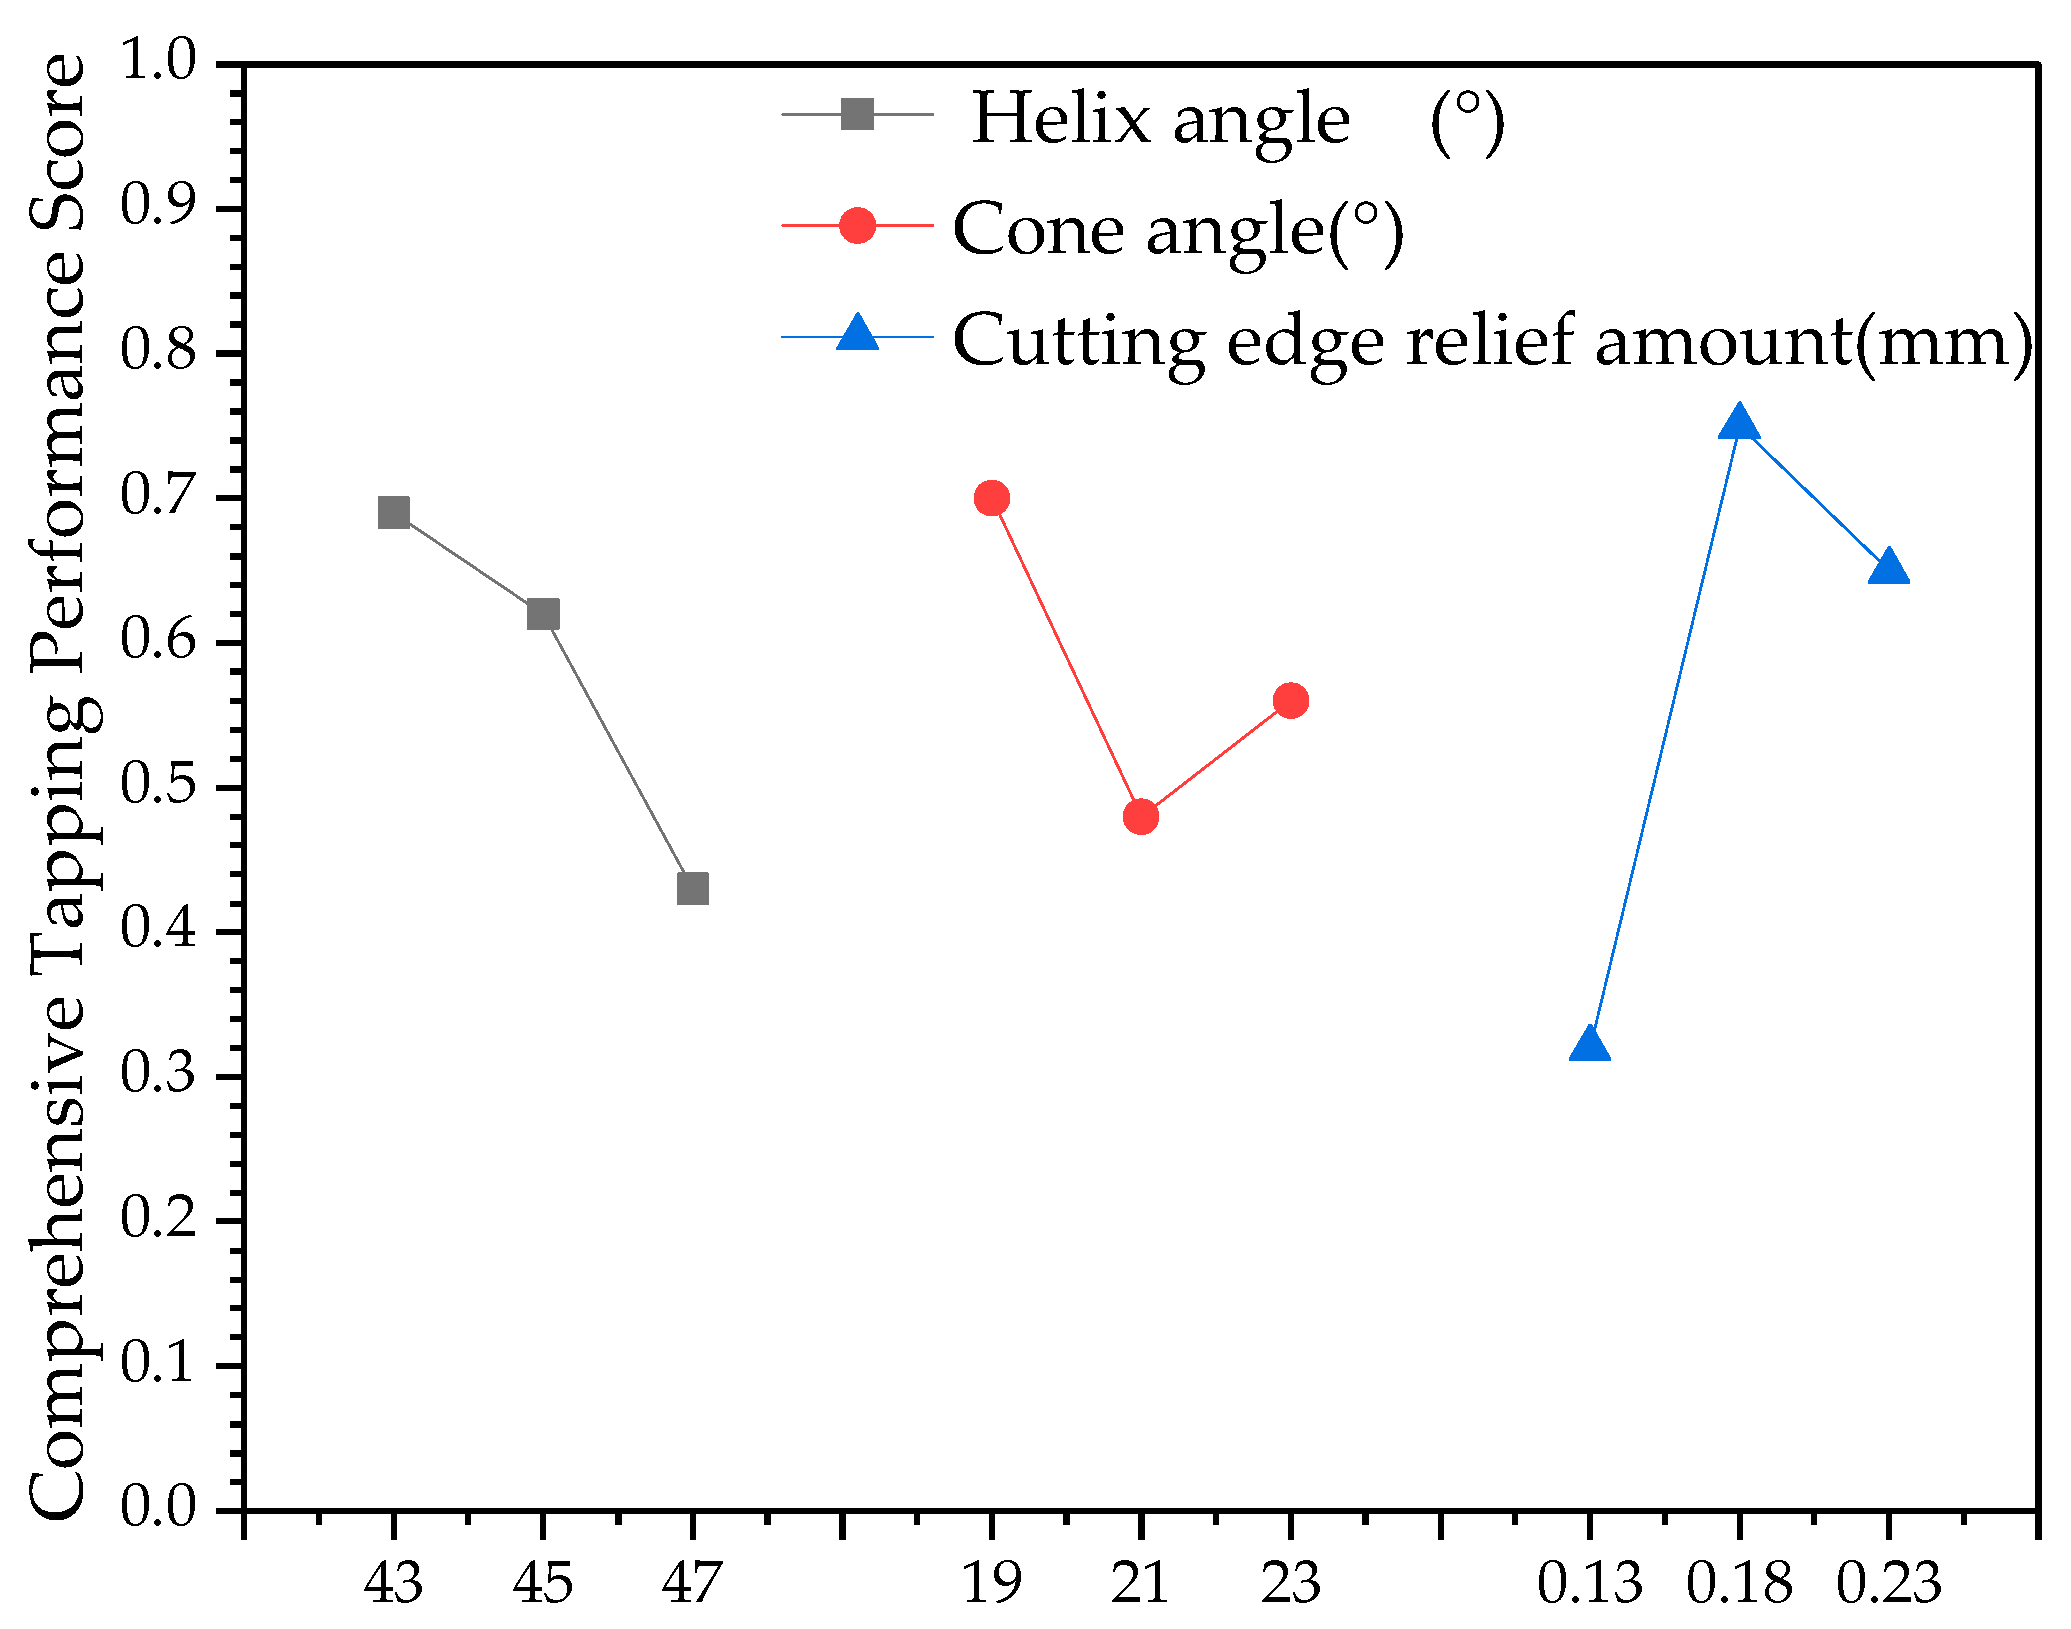
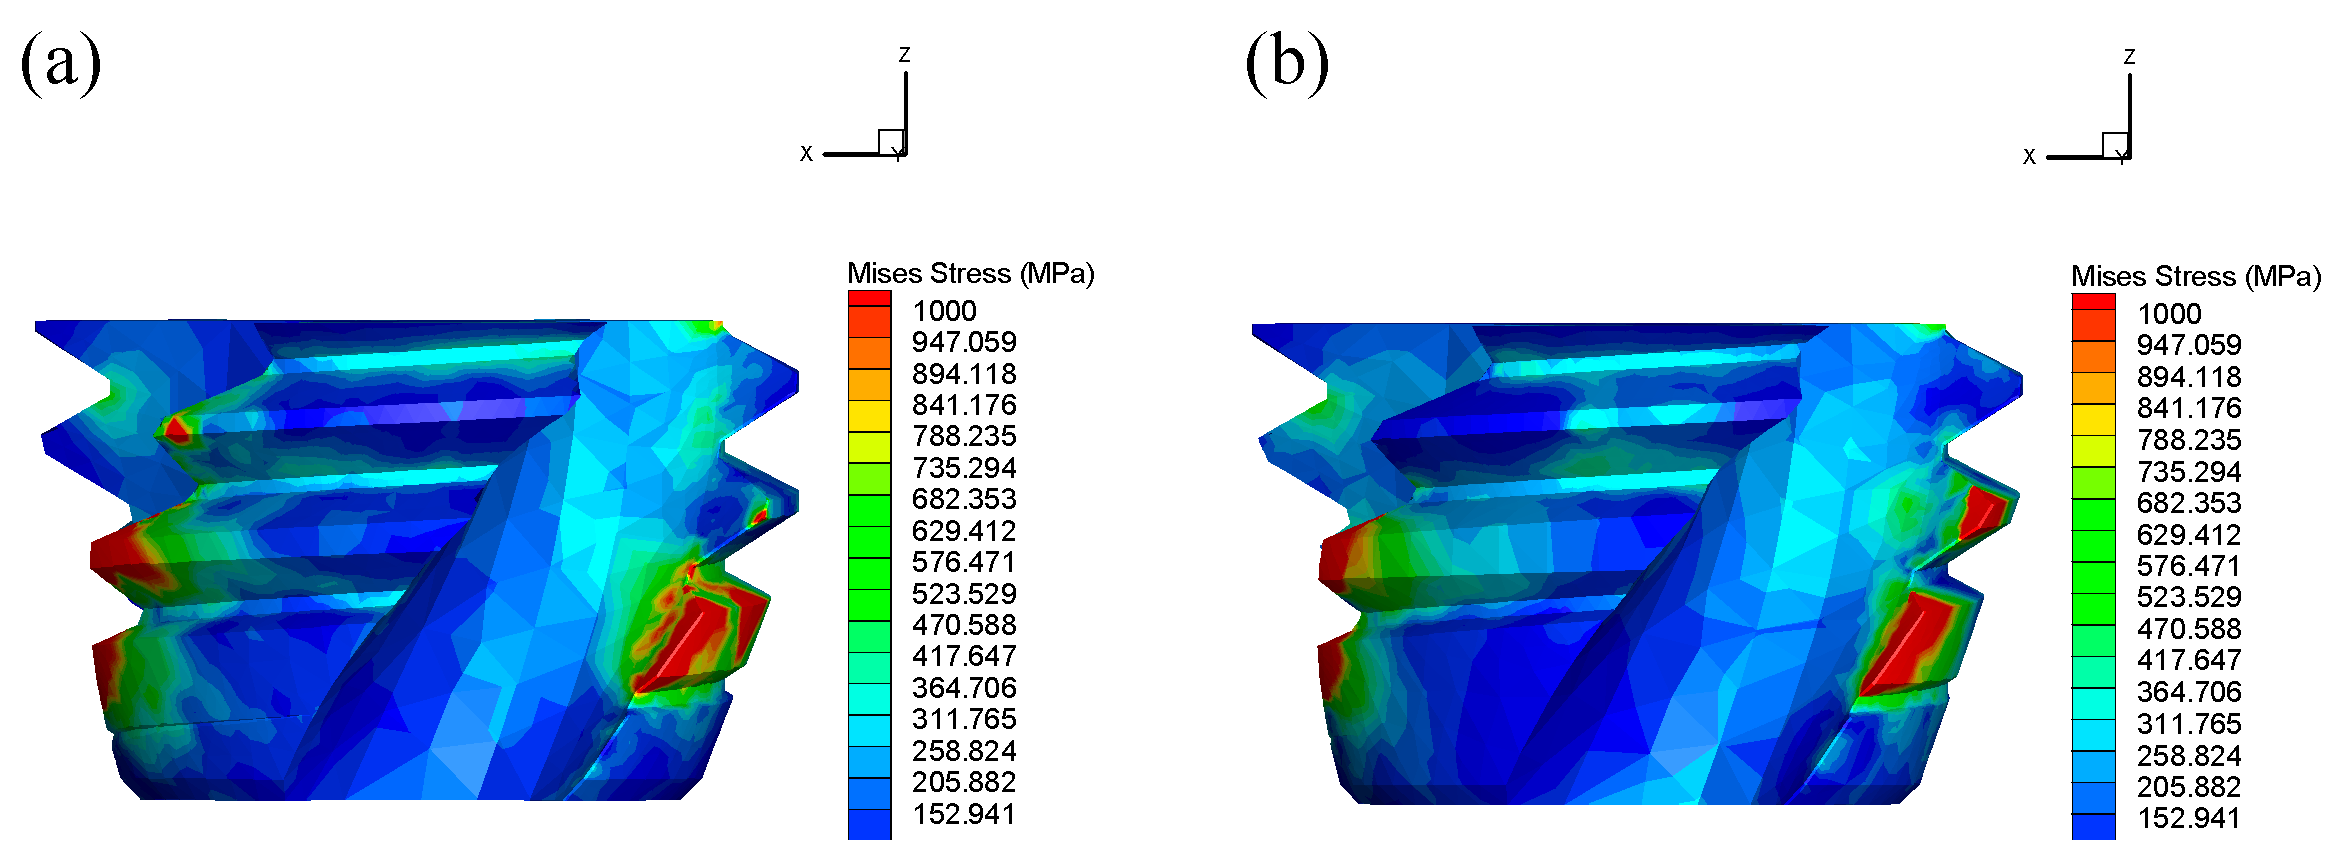
In summary, there is a large volume of research on the optimization of tool structural parameters based on finite element simulation, but it is mainly concentrated in processes such as turning, milling, and drilling. Research on tapping primarily focuses on optimizing parameters for straight-flute taps; research on spiral tap parameter optimization is relatively scarce. Furthermore, model validation is often insufficient, leading to significant simulation errors. To address this, first, this study designed the spiral tap according to the actual production process flow, ensuring the accuracy of the spiral tap model. Secondly, the influence laws of mesh parameters on axial force, torque, and temperature were investigated, and better mesh parameters were selected, effectively reducing simulation error and shortening simulation time. Subsequently, the accuracy of the tapping finite element simulation model was verified through multiple dimensions including axial force variation trends, torque variation trends, and chip morphology. Potential sources of error were analyzed, and the error was analyzed and corrected, improving simulation accuracy while shortening simulation time. Finally, based on this, orthogonal experimental design was further utilized to conduct finite element simulation experiments. Entropy weight analysis and range analysis methods were used to analyze the influence of structural parameters (helix angle, cone angle, cutting cone relief grinding amount) on tapping performance, and the optimal structural parameter combination was found. Furthermore, the production of optimized spiral taps was guided, and tapping performance comparison tests were conducted to validate the improvement in tapping performance.

2. Materials and Methods

2.1. Development of a Special Spiral Tap Model for 304 Stainless Steel

Based on actual production processes (Figure 1), SolidWorks (Dassault Systèmes SolidWorks Corporation, Waltham, MA, USA, version 2024) was used to design and model the spiral tap, including components such as the blank, helical groove, thread, clearance angle, cutting cone, and cutting edge relief. Key design parameters are listed in Table 1, and the resulting 3D model is depicted in Figure 2.

2.2. Construction of the FE Simulation Model

The FE tapping simulation model for machining 304 stainless steel was developed using industry-specific metal cutting software AdvantEdge (Third Wave Systems lnc., Eden Prairie, MN, USA, version 8.3.0) (Figure 3). Key settings include the following:
  • Tap import and parameterization: Only the cutting portion was imported to reduce simulation time. Settings included right-hand rotation, pitch of 1.5 mm, and three flutes.
  • Workpiece parameters: dimensions 10 mm × 10 mm × 8 mm, hole diameter 6.8 mm, hole depth 8 mm, chamfer angle 45°.
  • Material properties: tool material set to high-speed steel/Co-M35, workpiece material to 304 stainless steel, coating layers disabled.
  • Process parameters: Spindle speed 300 r/min, the feed rate was set equal to the tap pitch at 1.25 mm/rev., initial temperature 30 °C, starting depth 0.278 mm, rotation angle 1000°. Friction was defined using the standard test method, dry tapping without coolant was employed. To save time, only the final tapping rotation was simulated post-validation.
  • Mesh settings: The mesh type was configured as tetrahedral elements with adaptive refinement. Adaptive meshing with minimum edge length (cutting edge) of 0.03 mm, minimum chip length of 0.090208 mm, edge refinement radius of 0.27063 mm, coarsening factor of 5, and chip refinement factor of 3.

2.3. Application of FE Simulation Correction Coefficients

Trends in axial force and torque between simulation and experimental tapping were consistent across spindle speeds, but discrepancies persisted (Figure 4). Error sources included mesh discretization, model simplification, manufacturing tolerances, workpiece clamping, material variability, and boundary conditions. To enhance accuracy, correction coefficients were derived as follows:
  • Mesh error correction:
k g r i d = X f i n e X c o a r s e
where kgrid is the mesh correction coefficient, Xfine is the refined mesh simulation value, and Xcoarse is the coarse mesh simulation value.
2.
Other error correction:
k o t h e r = 1 n i = 1 n X e x p ( ω i ) X s i m ( ω i )
where kother is the correction coefficient for other errors, Xexp( ω i ) is the experimental value at speed ω i , and Xsim( ω i ) is the simulation value.
3.
Integrated correction coefficient:
k = k g r i d × k o t h e r
This approach minimized errors and accelerated tool development.

2.4. Orthogonal Simulation Experimental Design for 304 Stainless Steel Tapping

Orthogonal experimental design can effectively reduce testing time and rapidly identify optimal parameter combinations, making it widely applicable in multi-objective parameter optimization tasks. For example, Liu et al. [17] established a finite element simulation model for turning AISI 4340 using Deform-3D software, employing orthogonal experimental design and range analysis to investigate the influence of cutting parameters on tapping performance, ultimately determining the optimal cutting parameter combination. In this study, three levels of helix angle (43°, 45°, 47°), three levels of cone angle (19°, 21°, 23°), and three levels of cutting cone relief grinding amount (0.13 mm, 0.18 mm, 0.23 mm) were selected to construct the level factor table for 304 stainless steel tapping, as shown in Table 2. Based on the selected factors and levels, an L9(33) orthogonal array was constructed, presented in Table 3.

3. Results

3.1. Mesh Parameter Analysis

The calculation efficiency and accuracy of cutting process numerical simulation are significantly affected by mesh parameter settings. For instance, Zhu et al. [18] established a finite element simulation model for Ti-6Al-4V alloy drilling using Abaqus software (https://www.3ds.com/products/simulia/abaqus) and analyzed the influence of different mesh sizes on simulation results. In AdvantEdge software, the minimum element length (cutting edge) serves as a critical control parameter, directly determining the refinement level of finite element meshes, computational resource allocation, and simulation accuracy. To investigate the impact of mesh parameters on axial force, torque, temperature, and computational time, and to seek an optimal balance between computational efficiency and simulation accuracy, this study employed a single-factor experimental design methodology after optimizing other parameters. A systematic finite element simulation experiment was conducted by varying the minimum element length (0.07~0.005 mm) to analyze the correlation between mesh parameters and axial force, torque, temperature, and computational time. The experimental results are presented in Table 4 and Figure 5.
As shown in Figure 5, axial force decreased and stabilized with finer meshing, minimizing at 0.03 mm. Torque minimized at 0.02 mm, while temperature varied insignificantly. Refinement beyond 0.03 mm yielded negligible performance gains but drastically increased computational time. Thus, 0.03 mm was selected for subsequent simulations.
As presented in Table 4, simulation time grows monotonically with mesh refinement. Using the finest mesh (minimum edge length 0.03 mm), the tapping analysis required 44 h of wall-clock time, whereas the mesh-error-corrected coarser grid (0.07 mm) completed in only 2.83 h, corresponding to a 93.6% reduction in computational cost. Although tapping simulations are inherently more demanding than orthogonal cutting analyses—because of simultaneous multi-flute engagement, chip evacuation constraints, and contact re-meshing—the present model remains markedly more efficient than prior drilling studies: Giasin et al. [19] reported an average runtime of 96 h per 3-D drilling case, confirming the improved computational performance achieved in this work.

3.2. Validation of the Finite Element Simulation Model

Validation of the finite element simulation model. To validate the effectiveness of the finite element model, tapping tests were performed using a Minano machining center(Mino Machine Tool Co., Ltd., Ningbo, China). A Kistler four-component dynamometer (KISTLER-5073A) (Kistler Instruments AG, Winterthur, Switzerland) was employed to measure the axial force and torque generated during tapping. A laptop computer served as the processor for collecting and processing the experimental data. The tap used in the experiments was identical to the designed tap, with its structural parameters presented in Table 1. The tap material was HSS/Co-M35. The workpiece material used in the tests was 304 stainless steel (its chemical composition is listed in Table 5), with dimensions of 100 mm × 100 mm × 20 mm. The diameter of the pilot hole was 6.8 mm. The rotational speed for tapping the 304 stainless steel workpiece was set at 300 r/min. The feed rate was set equal to the tap pitch at 1.25 mm/rev. The tapping depth during the experiments was consistent with the simulation depth at 3.75 mm. The experimental setup for tapping is shown in Figure 6.
As shown in Figure 7 and Figure 8, the axial force and torque profiles obtained from the simulated tapping tests exhibit essentially the same trend as those from the actual tapping tests on 304 stainless steel, and the peak values are very close; nevertheless, a certain discrepancy remains.
As shown in Figure 9, the morphology and degree of curling of the chips generated in the simulated tapping test and the actual tapping test on 304 stainless steel are similar. This validates the accuracy of the finite element simulation model.
As shown in Figure 10, the variation trend of the maximum axial force is essentially consistent across different rotational speeds, while the variation trend of torque is partially consistent; the maximum values are close, but certain errors still exist.
As seen from Table 6, current studies on validating the accuracy of finite element simulation models primarily rely on one or two verification dimensions. This insufficient validation leads to significant model errors in subsequent experiments. In contrast, our study validates the model through multiple dimensions: axial force and torque, maximum axial force and torque under the same rotational speed, and chip morphology. This comprehensive approach results in higher model accuracy, minor discrepancies, and establishes a robust foundation for follow-up experimental research.

3.3. Error Analysis and Correction

3.3.1. Error Analysis

When the finite element model was validated by comparing the axial force and torque evolutions together with chip morphology, the simulated and experimental trends were found to be highly similar and the peak values very close; nevertheless, a residual discrepancy persisted. Furthermore, an additional comparison of the maximum axial force and torque at different spindle speeds revealed essentially identical trends and comparable peak magnitudes, yet measurable deviations could still be observed. Based on a detailed analysis of the simulation and actual tapping tests, the most probable sources of error are summarized as follows:
  • Discrepancies between Simulation Assumptions and Experimental Environment: While FEM tapping simulations operate under idealized conditions, inherent approximations exist (e.g., mesh discretization, model simplification). Conversely, actual tapping tests involve numerous uncontrolled variables. Consequently, discrepancies between simulated and experimental results are inevitable.
  • Material Variability: Although the tap and workpiece materials (304 stainless steel) were nominally identical in simulation and experiment, subtle variations in chemical composition can lead to minor differences in physical properties (e.g., hardness, elastic modulus). These variations can impact performance metrics such as cutting force, torque, and temperature.
  • Tap Manufacturing Tolerances: Despite designing the spiral tap based on actual production processes, manufacturing variations inevitably occur. Factors like grinding wheel wear, coolant temperature fluctuations, and machine tool vibrations during production can introduce deviations between the manufactured tap and its CAD model, leading to inconsistencies between simulated and experimental outcomes.
  • Workpiece Fixturing and Tool Alignment Errors: practical aspects of experimental setup, such as workpiece clamping methods and tap alignment precision, introduce operational errors that are challenging to fully replicate in the simulation environment.
  • Drill Bit Wear and Hole Quality Inconsistencies: Wear on the drill bit used to create the pre-drilled hole alters its cutting performance, subsequently affecting the final hole dimensions and surface quality. These variations can increase cutting forces and temperatures during tapping, cause deviations in hole diameter, increase surface roughness, and ultimately impact tapping performance and precision.
  • Machine Tool Resonance and Electromagnetic Interference: during physical machining, vibrations, resonance phenomena within the machine tool structure, and ambient electromagnetic noise can interfere with the accuracy of force dynamometer measurements (e.g., Kistler 5073A), introducing measurement errors.
In summary, while the FEM model effectively captures key mechanical characteristics of the tapping process, discrepancies compared to experimental results persist. These errors stem from the combined influence of multiple factors, many of which are difficult to fully account for and precisely represent within the simulation framework.

3.3.2. Error Correction

For the tapping simulation of 304 stainless steel, an investigation into the minimum element length (cutting edge) parameter within the adaptive meshing settings revealed that a value of 0.03 mm yielded simulation results closest to the experimental values. However, considering computational costs and experimental constraints, the mesh parameter with the shortest computation time—namely, a minimum element length (cutting edge) of 0.07 mm—was selected. The grid error correction coefficients were subsequently calculated using Equation (1), with the results presented in Table 7. Subsequently, the coefficients for other errors (model simplification, tool manufacturing, etc.) were corrected using Equation (2), as detailed in Table 8. Finally, the comprehensive error correction coefficient was computed according to Equation (3), as summarized in Table 9.
By tapping 304 stainless steel at different rotation speeds, the maximum axial force, maximum torque, and highest temperature after stabilization were collected. The average correction coefficients and correction coefficients for each tapping performance evaluation indicator were calculated using Equations (2) and (3), as shown in Table 7 and Table 8.

3.4. Orthogonal Simulation Test Results Analysis

In this section, the experimental results are corrected using correction coefficients, and analyzed through the entropy weight method and range analysis method. The experimental and analytical results are shown in Table 10, Table 11, Table 12, Table 13, and Table 14, respectively.
The entropy weight method, as an objective weighting approach, determines the weight of evaluation indicators based on the information content derived from their data values. Specifically, a higher dispersion degree of an indicator corresponds to a larger information entropy value, indicating a greater influence of that indicator on the evaluation and thus a higher assigned weight. This method has been widely applied in multi-objective optimization tasks [20]. For example, Yang et al. [21] established a finite element simulation model for drilling 304 stainless steel using AdvantEdge software. By adopting cutting temperature, stress, pressure, and maximum principal stress as evaluation indicators for cutting performance, they utilized the entropy weight method to determine the optimal front angle range across different sections of the primary cutting edge. In this study, axial force, torque, and temperature were adopted as tapping performance evaluation indicators. The optimal structural parameter combination was determined through entropy weight analysis and range analysis. The weight percentages of axial force, torque, and temperature in the tapping performance evaluation indicators, calculated via the entropy weight method, are presented in Table 12. The detailed steps of the entropy weight method are as follows:
To normalize the levels of each factor, it is necessary to preprocess “positive” and “negative” indicators separately. In order to avoid the special case in which an entire column of data is identical, a very small adjustment is applied: 0.0001 is subtracted from the minimum value and added to the maximum value. This adjustment has a negligible effect on the overall results.
In the present study, the tapping performance indicators—axial force, torque, and temperature—are all negative indicators (i.e., smaller values are preferred). Consequently, they are processed according to the “smaller-is-better” principle using the following formula:
X m i n = m i n ( X 1 j , X 2 j , , X n j ) 0.0001
X m a x = m a x ( X 1 j , X 2 j , , X n j ) + 0.0001
For positive indicators (larger-is-better):
p i j = X i j X m i n X m a x X m i n
For negative indicators (smaller-is-better):
p i j = X m a x X i j X m a x X m i n
After standardizing the original experimental data, the resulting matrix is denoted as R:
R = p 11 p 12 p 1 n p 21 p 22 p 2 n p m 1 p m 2 p m n
Calculate the entropy value for the j-th indicator:
e j = k i = 1 n p i j ln ( p i j ) , j = 1 , , m
In the formula, where k = 1/ln(n) > 0 satisfies ej ≥ 0, n denotes the number of trials, and pij represents the standardized experimental data.
Calculate the information entropy redundancy (differential):
d j = 1 e j , j = 1 , , m
Calculate the weight of each indicator:
w j = d j j = 1 m d j , j = 1 , , m
Calculate the comprehensive score for each sample:
s i = j = 1 m w j x i j , i = 1 , , n
In the formula, si is the comprehensive score for the i-th trial, w j represents the weight coefficient of the j-th performance indicator.
The data in Table 11 indicates that temperature carries the highest weight in tapping performance evaluation at 46.573%, followed by torque at 33.500%, while axial force has the lowest weight of only 19.927%, with the specific expression as follows:
s i = 19.927 % × x i 1 + 33.500 % × x i 2 + 46.537 % × x i 3 , i = 1 , , n
In the above equation, x i 1 is the axial force, x i 2 is the torque, and x i 1 is the temperature, while n denotes the number of tapping performance evaluation indicators.
Calculate the comprehensive score of tapping performance according to Equation (4), as shown in Table 13.
Based on the range analysis of the comprehensive score for tapping performance, the optimal structural parameter combination was determined, as shown in Table 14.
Based on the range analysis of the comprehensive score during the tapping process of 304 stainless steel (as shown in Table 13, where a larger range value R indicates a more significant influence of the corresponding factor on the process), the influence order of each factor on the comprehensive score can be determined. Specifically, the spiral angle has the most significant influence on the comprehensive score, followed by the cone angle, and finally the cutting edge relief amount. Therefore, the spiral angle is the most critical factor, with the cone angle and cutting edge relief amount being secondary.
To select the optimal combination of levels for each factor, the comprehensive score data for each factor level must be analyzed in detail. The specific method is as follows: first, sum the comprehensive score data for the same level to obtain the total value K for each level. Then, calculate the average value ‘k_ave’ for each level. By comparing the magnitude of ‘k_ave’ across different levels, the corresponding optimal level can be selected. The selection criterion here is based on the tapping performance evaluation metric—a higher comprehensive score indicates better tapping performance. Therefore, the selection of the optimal level should follow the larger-the-better principle.
Based on this analysis method, the following order of superiority for the levels corresponding to each factor is derived:
  • Spiral angle (°): 43 > 45 > 47;
  • Cone angle (°): 19 > 23 > 21;
  • Cutting edge relief amount (mm): 0.18 > 0.13 > 0.23.
By comprehensively analyzing the superiority order of the above factors, the optimal combination targeting tapping performance is ultimately selected as: Spiral angle: 43°, cone angle: 19°, cutting edge relief amount: 0.18 mm.
Furthermore, for specialized spiral taps used for tapping stainless steel, if the goal is to improve tapping performance during actual machining, priority should be given to the spiral angle, the primary factor, during production and manufacturing.
As shown in Figure 11, for the tapping of 304 stainless steel within the investigated range of structural parameters, the comprehensive score decreases as the helix angle increases. Furthermore, the magnitude of this decrease progressively intensifies with increasing helix angle. Therefore, within this range, the helix angle should be appropriately reduced to optimize tapping performance, thereby improving tapping quality.
Within the investigated range of parameters, when the cone angle increases from 19° to 21°, the comprehensive score significantly decreases with a large reduction magnitude. Whereas when the cone angle further increases to 23°, the comprehensive score increases, but the magnitude of this increase is relatively limited. It can be concluded that within this range of structural parameters, selecting a smaller cone angle facilitates enhanced tapping performance and stability.
Within the investigated range of parameters, as the relief grinding amount increases from 0.13 mm to 0.18 mm, the comprehensive score significantly increases with a large increase in magnitude. However, when the relief grinding amount is further increased to 0.23 mm, the comprehensive score decreases, but the magnitude of this reduction is relatively small. Consequently, within the investigated range of structural parameters, selecting a larger relief grinding amount effectively enhances tapping performance.
In summary, the helix angle, cone angle, and relief grinding amount exert a significant influence on the tapping performance during the tapping process of 304 stainless steel. In practical applications, these three parameters should be optimized according to the research results to maximize the comprehensive score. Reasonably adjusting the helix angle, selecting a smaller cone angle, and appropriately increasing the relief grinding amount constitute important means to improve the tapping performance of 304 stainless steel.

3.5. Stress Contour Analysis

Based on the experimental results of the optimized spiral tap specifically for tapping 304 stainless steel, the post-processing tool Tecplot in AdvantEdge software (Third Wave Systems lnc., Eden Prairie, MN, USA, version 8.3.0) was used to further analyze the differences in stress distribution between the optimized and non-optimized spiral taps, as illustrated in Figure 12.
Based on the analysis of Figure 12, the stress concentration zones during the tapping process primarily reside on the cutting edge of the tap. By analyzing the area where the stress is maximal (σ ≥ 1000 MPa), the differences in stress and performance between the optimized spiral tap and the non-optimized tap can be further explored. Compared to the non-optimized spiral tap, the optimized tap exhibits a significantly smaller area of maximum stress. This indicates that the optimized tap bears a lower load during the cutting process, consequently possessing superior fatigue resistance, reduced chipping risk, and lower wear rates. Further analysis of stress distribution uniformity reveals that the optimized tap displays a more uniformly distributed stress profile and exhibits no abrupt changes in stress gradients. This demonstrates that the optimized tap has achieved a marked improvement in stress distribution, leading to enhanced durability and superior tapping performance.

3.6. Experimental Analysis of Optimization Results

Based on the selected combination of structural parameters for the spiral tap, an optimized spiral tap specialized for tapping stainless steel was manufactured using a five-axis tool grinding machine (Kede CNC Co., Ltd., Dalian, China) (as shown in Figure 13). Subsequently, a comparative performance test was conducted on the unoptimized and optimized spiral taps (as shown in Figure 14 and Table 15) using a dynamometer (as shown in Figure 6). Actual tapping test parameters matched the simulation settings: rotational speed at 300 r/min and feed rate at 1.25 mm/rev. To minimize interference from factors such as hole quality, workpiece clamping, and tool alignment errors on the test results, three repeated tests were performed for both the unoptimized and optimized spiral taps at the same rotational speed during the testing process. The test results are presented in Table 16.
According to the data presented in Table 16, significant improvements in axial force and torque were observed during the tapping of 304 stainless steel. Specifically, the average maximum axial force decreased from −153.10 N to −102.24 N, representing a reduction of 50.86 N and a 33.22% decrease. The average maximum torque decreased from 4.15 N·m to 3.59 N·m, representing a reduction of 0.56 N·m and a 13.41% decrease. This indicates effective control over axial forces, friction, and resistance during the machining process. Furthermore, the average axial force decreased from −69.39 N to −42.87 N, a reduction of 26.52 N (38.22% decrease), while the average torque decreased from 1.94 N·m to 1.46 N·m, a reduction of 0.48 N·m (24.87% decrease). These results demonstrate that optimized structural parameters effectively reduced the mechanical load generated during tapping, thereby validating the enhanced tapping performance of the optimized spiral tap.
The data in Table 17 reveal that the difference between the simulated tapping tests and actual tapping tests for 304 stainless steel is minimal. The error rate for axial force was 5.04%, while the error rate for torque was as low as 0.24%. This demonstrates the high accuracy of the corrected finite element simulation results for the tapping process.

4. Conclusions

This study employed a combined approach of finite element simulation and experimental testing. First, the influence of mesh parameters on the experimental results was investigated using the single-factor experimental method. Subsequently, the accuracy of the finite element simulation model was verified by comparing the trends of axial force and torque, as well as chip morphology, between the simulation and actual tapping tests. Furthermore, finite element simulation experiments were conducted based on an orthogonal experimental design, and the results were analyzed using the entropy weight analysis method and the range analysis method. Finally, the improvement in tapping performance of the optimized spiral tap was validated through actual tapping performance comparison tests. The following conclusions were drawn:
  • As the mesh was refined, simulation time gradually increased, with the rate of increase becoming more pronounced, exhibiting an exponential growth trend. Both axial force and torque showed a decreasing trend and gradually stabilized, while temperature exhibited minimal fluctuation with mesh refinement.
  • The trends of axial force and torque between the simulation tapping tests and the actual tapping tests were consistent, and the chip morphologies were similar, confirming the accuracy and reliability of the finite element simulation model.
  • Within the investigated range of structural parameters, the spiral angle had the most significant impact on tapping performance, followed by the cone angle and flank relief. The optimal structural parameter combination was identified as follows: spiral angle: 43°, cone angle: 19°, flank relief: 0.18 mm.
  • For the optimized tap, the maximum stress area was significantly reduced, and the stress distribution became more uniform without exhibiting sudden stress gradient changes.
  • The tapping performance of the optimized spiral tap was significantly enhanced. Specifically, the average values of maximum axial force and torque were notably reduced, with reductions of 33.22% and 13.41%, respectively. The average values of mean axial force and mean torque were also significantly reduced, with reductions of 38.22% and 24.87%, respectively.
  • The application of the error correction coefficient effectively reduced the discrepancy between the simulated tapping tests and actual tapping tests, with an axial force error rate of 5.04% and a torque error rate of as low as 0.24%.

Author Contributions

Conceptualization, H.Y.; methodology, J.P.; software, J.P. and W.Z.; validation, J.P.; formal analysis, H.Y. and W.Z.; investigation, H.Y. and W.Z.; resources, H.Y.; data curation, J.P.; writing—original draft preparation, J.P.; writing—review and editing, H.Y. and W.Z.; visualization, J.P.; supervision, W.Z. and H.Y.; project administration, H.Y. All authors have read and agreed to the published version of the manuscript.

Funding

This research received no external funding.

Data Availability Statement

These data were derived from actual cutting processing experiments.

Acknowledgments

We would like to express our appreciation for the support provided by the research community, which has been instrumental in facilitating this work.

Conflicts of Interest

The authors declare no conflicts of interest.

References

  1. Al-Zkeri, I.; Rech, J.; Altan, T.; Hamdi, H.; Valiorgue, F. Optimization of the cutting edge geometry of coated carbide tools in dry turning of steels using a finite element analysis. Mach. Sci. Technol. 2009, 13, 36–51. [Google Scholar] [CrossRef]
  2. Ahmed, F.; Ko, T.J.; Jongmin, L.; Kwak, Y.; Yoon, I.J.; Kumaran, S.T. Tool geometry optimization of a ball end mill based on finite element simulation of machining the tool steel-AISI H13 using grey relational method. Int. J. Precis. Eng. Manuf. 2021, 22, 1191–1203. [Google Scholar] [CrossRef]
  3. Yuksel, S.; Sirin, T.B.; Ay, M.; Uçar, M.; Kurt, M. A study on end mill tool geometry parameters for end milling of 316L: Finite element analysis and response surface methodology optimization based on resultant cutting force. J. Braz. Soc. Mech. Sci. Eng. 2024, 46, 452. [Google Scholar] [CrossRef]
  4. Puoza, J.C.; Appiah, S.T.; Zhang, T.; Aboagye, B. Chamfer drill geometric parameters optimisation by finite element simulation and experimental analysis. Int. J. Mach. Mach. Mater. 2020, 22, 406–429. [Google Scholar] [CrossRef]
  5. Senthilkumar, N.; Tamizharasan, T. Effect of tool geometry in turning AISI 1045 steel: Experimental investigation and FEM analysis. Arab. J. Sci. Eng. 2014, 39, 4963–4975. [Google Scholar] [CrossRef]
  6. Imad, M.; Kishawy, H.A.; Yussefian, N.Z.; Hosseini, A. Effect of cutTiNg edge radius when milling hardened steels: A finite element analysis and surface integrity investigation. Mach. Sci. Technol. 2022, 26, 571–594. [Google Scholar] [CrossRef]
  7. Padmakumar, M.; Arunachalam, M. Analyzing the effect of cutting parameters and tool nose radius on forces, machining power and tool life in face milling of ductile iron and validation using finite element analysis. Eng. Res. Express 2020, 2, 035003. [Google Scholar] [CrossRef]
  8. Wang, P.; Wang, D. Evaluation of different tool geometries in the finite element simulation of ultrasonic-assisted drilling of Ti6A14V. J. Braz. Soc. Mech. Sci. Eng. 2020, 42, 181. [Google Scholar] [CrossRef]
  9. Suresh, N.; Ganesh, S.; Jagadesh, T. Investigations into edge radius and point angle on energy consumption during micro drilling of titanium alloy. Mater. Today Proc. 2020, 26, 586–591. [Google Scholar] [CrossRef]
  10. Wu, M.C.; Jian, W.R.; Hsu, L.S.; Tsao, C.-C. Optimization of tool geometric parameters for a small fluteless forming tap (FFT). Int. J. Adv. Manuf. Technol. 2022, 120, 3437–3449. [Google Scholar] [CrossRef]
  11. Priest, J.; Ghadbeigi, H.; Avar-Soberanis, S.; Gerardis, S. 3D finite element modelling of drilling: The effect of modelling method. CIRP J. Manuf. Sci. Technol. 2021, 35, 158–168. [Google Scholar] [CrossRef]
  12. Li, S.; Sui, J.; Ding, F.; Wu, S.; Chen, W.; Wang, C. Optimization of milling aluminum alloy 6061-T6 using modified Johnson-Cook model. Simul. Model. Pract. Theory 2021, 111, 102330. [Google Scholar] [CrossRef]
  13. Magalhães, F.C.; Ventura, C.E.H.; Abrão, A.M.; Denkena, B. Experimental and numerical analysis of hard turning with multi-chamfered cutting edges. J. Manuf. Process. 2020, 49, 126–134. [Google Scholar] [CrossRef]
  14. Jagadesh, T.; Samuel, G.L. Finite element simulations of micro turning of Ti-6Al-4V using PCD and coated carbide tools. J. Inst. Eng. (India) Ser. C 2017, 98, 5–15. [Google Scholar] [CrossRef]
  15. Dogrusadik, A.; Aycicek, C.; Kentli, A. Optimization of tool design parameters for thread tapping process of Ti-6Al-4V. Proc. Inst. Mech. Eng. Part E J. Process Mech. Eng. 2021, 235, 870–878. [Google Scholar] [CrossRef]
  16. Demirel, T.; Yağmur, S.; Kayır, Y.; Kurt, A. Finite element simulation of stresses in cutting tools during tapping. Proc. Inst. Mech. Eng. Part C J. Mech. Eng. Sci. 2023, 237, 1119–1129. [Google Scholar] [CrossRef]
  17. Liu, C.; Zhang, Z.; Yang, G.; Zhou, A.; Wang, G.; Qin, S.; Wang, A.; Wang, W.; Zhang, X. Finite element analysis and wear mechanism of B4C–TiB2 ceramic tools in turning AISI 4340 workpieces. Ceram. Int. 2022, 48, 5459–5467. [Google Scholar] [CrossRef]
  18. Zhu, Z.; Zhu, Y.; Sun, X.; Gao, C.; Lin, Z.; He, B. 3D finite element simulation for tool temperature distribution and chip formation during drilling of Ti6Al4V alloy. Int. J. Adv. Manuf. Technol. 2022, 121, 5155–5169. [Google Scholar] [CrossRef]
  19. Giasin, K.; Ayvar-Soberanis, S.; French, T.; Phadnis, V. 3D finite element modelling of cutting forces in drilling fibre metal laminates and experimental hole quality analysis. Appl. Compos. Mater. 2017, 24, 113–137. [Google Scholar] [CrossRef]
  20. Wang, H.; Meng, Y.; Wang, H.; Wu, Z.; Guan, X. The application of integrating comprehensive evaluation and clustering algorithms weighted by maximal information coefficient for urban flood susceptibility. J. Environ. Manag. 2023, 344, 118846. [Google Scholar] [CrossRef]
  21. Yang, H.; Jiang, F.; Wu, X.; Zhao, G.; Shi, X.; Liu, G.; Wang, M. Optimizing the cutting edge geometry of micro drill based on the entropy weight method. Int. J. Adv. Manuf. Technol. 2023, 125, 2673–2689. [Google Scholar] [CrossRef]
Figure 1. Production process flow chart of spiral tap.
Machines 13 00655 g001
Figure 2. 3D model of special spiral tap for 304 stainless steel.
Machines 13 00655 g002
Figure 3. Establishment of tapping FE simulation model.
Machines 13 00655 g003
Figure 4. Flowchart of error analysis and correction.
Machines 13 00655 g004
Figure 5. Bar chart of mesh parameter effects on tapping performance indicators.
Machines 13 00655 g005
Figure 6. Setup for tapping experiments.
Machines 13 00655 g006
Figure 7. Comparison of axial force variation trends for 304 stainless steel tapping. Note: (a) Axial force variation trend diagram from simulation tapping test; (b) Axial force variation trend diagram from actual tapping test.
Machines 13 00655 g007
Figure 8. Comparison of torque variation patterns during tapping of 304 stainless steel. Note: (a) Torque variation pattern from simulation tapping test; (b) Torque variation pattern from actual tapping test.
Machines 13 00655 g008
Figure 9. Chips morphology comparison under 300 r/min and f = 1.25 mm/rev: (a) FE simulation, (b) experiment.
Machines 13 00655 g009
Figure 10. Comparison chart of the trend of maximum axial force and torque variations in simulation and actual tapping tests for 304 stainless steel at different speeds.
Machines 13 00655 g010
Figure 11. Trend chart of comprehensive score with factor changes.
Machines 13 00655 g011
Figure 12. Stress cloud diagram comparison. Note: (a) Stress cloud diagram of unoptimized spiral tap; (b) Stress cloud diagram of optimized spiral tap.
Machines 13 00655 g012
Figure 13. Five-axis tool grinding machine.
Machines 13 00655 g013
Figure 14. Comparison diagram of taps before and after optimization. Note: (a) Physical object of unoptimized spiral flute tap; (b) Physical object of optimized spiral flute tap.
Machines 13 00655 g014
Table 1. Basic parameters of special spiral tap for 304 stainless steel.
SpecificationHelix Angle (β)Relief Angle (kr)Cutting Edge Relief Amount (mm)
M8 × 1.2543°21°0.13
Table 2. Factor levels for 304 stainless steel tapping.
LevelHelix Angle (°)Cone Angle (°)Cutting Edge Relief Amount (mm)
143190.13
245210.18
347230.23
Table 3. L9(33) orthogonal array.
Factor
TrialHelix AngleCone AngleCutting Edge Relief
1111
2123
3132
4213
5222
6231
7312
8321
9333
Table 4. FE simulation results for mesh parameter effects on 304 stainless steel tapping.
Min. Edge Length (mm)Axial Force (N)Torque (N·m)Temperature (°C)Time (h)
0.07−507.594.91336.012.83
0.06−404.274.25328.133.50
0.05−326.314.11317.306.18
0.04−309.733.21327.2714.83
0.03−274.113.06354.1744.00
0.02−285.012.73345.5877.00
0.01---936.67
Table 5. Chemical composition of 304 stainless steel (wt.%).
ElementCSiMnPSCrNiCuMoFe
Composition (wt.%)0.0510.421.050.360.00418.198.000.140.021Bal.
Table 6. Comparison of model validation dimensions with prior studies.
AuthorValidation Dimensions (Prior Work)Validation Dimensions (This Study)
Ahmed et al. [7]Axial force and temperatureAxial force, torque, max values at same speed, chip morphology
Yuksel et al. [8]Cutting force
Imad et al. [11]Cutting force
Padmakumar et al. [12]Resultant force
Table 7. Mesh error correction coefficients for 304 stainless steel.
Minimum Element Length
(Cutting Edge) (mm)
Axial Force (N) Torque (N·m)Temperature (°C)
0.07−507.594.91336.01
0.03−275.093.06320.95
Mesh correction coefficient0.5420.623-
Table 8. Other error correction coefficients for 304 stainless steel tapping.
Sequence No.Rotational Speed (r/min)Simulated Axial Force (N)Experimental Axial Force (N)Axial Force Correction
Coefficient
Simulated Torque (N·m)Experimental Torque (N·m)Torque
Correction
Coefficient
1300−275.09−160.300.5833.063.091.010
2350−283.06−186.500.6573.213.971.237
3400−252.07−177.400.7043.054.421.449
4450−278.67−201.400.7233.114.571.469
5500−256.43−170.000.6633.285.111.558
6550−337.21−213.500.6332.985.391.809
Axial force other error correction factor0.660Other Error Correction Coefficient for Torque1.422
Table 9. Error correction coefficients for 304 stainless steel tapping.
Axial Force Mesh Correction Factor0.542Torque Mesh Correction Factor0.623
Axial Force Other Corr. Coeff.0.660Torque Other Corr. Coeff.1.422
Comprehensive Correction Factor for Axial Force0.358Torque Comprehensive Correction Factor0.886
Table 10. L9(33) orthogonal test results for 304 stainless steel tapping.
TrialTapping Performance Evaluation Indicators
Axial Force (N)Torque (N·m)Temperature (°C)
1−449.304.67367.54
2−446.184.82326.29
3−415.994.58334.64
4−474.324.65330.14
5−464.954.76341.25
6−559.784.64370.37
7−500.414.74322.04
8−767.694.91365.77
9−574.764.95340.50
Note: The negative sign (“−“) in the axial force column merely indicates the direction of the axial force and does not represent its magnitude. This note will not be repeated in subsequent tables.
Table 11. Data correction of tapping performance evaluation metrics for orthogonal experiment on 304 stainless steel.
TrialCorrected Tapping Performance Evaluation Indicators
Axial Force (N)Torque (N·m)Temperature (°C)
1−160.824.14367.54
2−159.704.27326.29
3−148.904.06334.64
4−169.784.12330.14
5−166.424.22341.25
6−200.374.11370.37
7−179.124.20322.04
8−274.784.35365.77
9−205.734.39340.50
Table 12. Calculation results of entropy weight method weights.
ItemInformation Entropy Value eInformation Utility Value dWeight (%)
Axial force (N)0.9380.06219.927
Torque (N·m)0.8960.10433.500
Temperature (°C)0.8550.14546.573
Table 13. Normalization and entropy weight method analysis of performance evaluation indicators for the orthogonal tapping experiment on 304 stainless steel.
TrialNormalized Tapping Performance IndicatorsComprehensive Evaluation Score
Axial Force (N)Torque (N·m)Temperature (°C)
10.90530.75750.05850.4614
20.91420.36360.91200.7287
3110.73920.8785
40.83410.82000.83240.8286
50.86080.51510.60250.6247
60.59110.848400.4020
70.75990.575710.8100
800.12120.09510.0849
90.548500.61800.3971
Table 14. Range analysis of tapping performance for 304 stainless steel.
TrialHelix Angle (°)Cone Angle (°)Cutting Edge Relief Amount (mm)Comprehensive Evaluation Score
143190.130.4614
243210.230.7287
343230.180.8785
445190.230.8286
545210.180.6247
645230.130.4020
747190.180.8100
847210.130.0849
947230.230.3971
K12.072.100.95
K21.861.442.26
K31.291.681.95
kave10.690.700.32
kav20.620.480.75
kav30.430.560.65
R0.260.220.10
Primary and
Secondary Factors
Helix Angle, Cone Angle, Cutting Edge Relief Amount
Optimum
Combination
Helix Angle:43°, Cone Angle:19°, Cutting Edge Relief Amount: 0.18 mm
Table 15. Comparison of structural parameters before and after optimization for spiral taps specialized in 304 stainless steel tapping.
Structural ParameterUnoptimized Spiral TapOptimized Spiral Tap
Helix angle (°)4343
cone angle (°)2119
cutting edge relief amount (mm)0.130.18
Table 16. Comparative tests of optimized vs. unoptimized tapping performance for 304 stainless steel.
TrialRotational Speed (r/min)Unoptimized Tap
Maximum Axial Force (N)Maximum Torque (N·m)Average Axial Force (N)Average Torque
(N·m)
1300−140.603.77−61.741.84
2300−152.003.89−73.231.86
3300−166.704.79−73.212.13
Mean Value−153.104.15−69.391.94
TrialRotational Speed (r/min)Optimized Tap
Maximum Axial Force (N)Maximum Torque (N·m)Average Axial Force (N)Average Torque
(N·m)
1300−112.303.52−43.941.29
2300−98.603.39−40.341.33
3300−95.833.87−44.331.76
Mean Value−50.860.56−26.520.48
Difference−112.303.52−43.941.29
Reduction (%)33.22%13.41%38.22%24.87%
Table 17. Comparison of error rates between simulated and actual tapping tests for 304 stainless steel.
Corrected simulated axial force (N)−160.82Corrected simulated torque (N·m)4.14
Average maximum axial force (N)−153.10Average maximum torque (N·m)4.15
Error rate for axial force (%)5.04Error rate for axial force (%)0.24
Disclaimer/Publisher’s Note: The statements, opinions and data contained in all publications are solely those of the individual author(s) and contributor(s) and not of MDPI and/or the editor(s). MDPI and/or the editor(s) disclaim responsibility for any injury to people or property resulting from any ideas, methods, instructions or products referred to in the content.

