Article

Synthesis of Vibration Environment Spectra and Fatigue Assessment for Underfloor Equipment in High-Speed EMU Trains

1
School of Mechanical, Electronic and Control Engineering, Beijing Jiaotong University, Beijing 100044, China
2
Locomotive & Car Research Institute, China Academy of Railway Sciences Corporation Limited, Beijing 100081, China
3
College of Transportation, Shanghai Key Laboratory of Rail Infrastructure Durability and System Safety, Tongji University, Shanghai 201804, China
*
Authors to whom correspondence should be addressed.
Machines 2025, 13(7), 628; https://doi.org/10.3390/machines13070628
Submission received: 11 June 2025 / Revised: 10 July 2025 / Accepted: 19 July 2025 / Published: 21 July 2025
(This article belongs to the Special Issue Research and Application of Rail Vehicle Technology)

Abstract

With the continuous development of high-speed electric multiple units (EMUs), vibration issues of vehicles have become increasingly prominent. During operation, the underfloor equipment installed on the carbody is subjected to random multi-point vibrations transmitted from the carbody, inducing significant fatigue damage. This paper presents a comprehensive analysis of multi-channel vibration environment data for various underfloor equipment across different operating speeds obtained through on-site measurements. A spectral synthetic method grounded in statistical principles is then proposed to generate vibration environment spectra for diverse underfloor equipment. Finally, utilizing fatigue analysis in the frequency domain, the fatigue damage to underfloor equipment is assessed under different operational environments. The research results show that the vibration environment spectrum of the underfloor equipment in high-speed EMU trains differs significantly from the vibration spectrum specified in the IEC 61373 standard, especially at high frequencies. Despite this difference in spectral characteristics, the overall vibration energy values of the two spectra are comparable. Additionally, the vibration spectra of different underfloor equipment exhibit variations that can be attributed to their installation positions. As operational speed increases, the fatigue damage to the underfloor equipment exhibits exponential growth. However, the total accumulated fatigue damage remains relatively low, consistently staying below a value of 1.

1. Introduction

China’s high-speed electric multiple units (EMUs) continue to advance rapidly, leading to heightened vehicle vibrations. As a result, issues related to vehicle structural fatigue induced by the vibration are becoming increasingly significant [1,2,3,4,5]. For instance, the cable bracket [1] and wire bracket [5] mounted on the bogie of high-speed vehicles have experienced fatigue failures. Failures in these critical structural components can significantly compromise the safety of train operations.
In recent years, extensive research has been conducted to understand how structural vibrations induce fatigue failures. S. Dietz et al. [6] initially obtained stress spectra of welded structures by using dynamic simulations based on wheel–rail irregularities and finite element calculations, and then the fatigue life of the structure was analyzed. Lu et al. [7] analyzed the influence of vibration modes on fatigue damage within the frames of high-speed train bogies. Wei et al. [1] analyzed the fatigue failure of cable brackets and identified that modal vibrations induced by high-frequency excitation from the wheel–rail system significantly contribute to the brackets’ fatigue failure. In summary, structural fatigue failures are primarily caused by the vibrational environment, which arises from wheel/rail excitation, and the resonance of structure vibrational modes.
However, current research focusing on the vibration environment spectra of structures, which is crucial for directly analyzing structural fatigue damage [8,9,10,11,12], remains relatively scarce. Although the IEC 61373 standard [13] offers a random vibration environment spectrum for equipment derived from the mean and standard deviation of the root-mean-square value of vibration data measured on rail vehicles, it falls short in detailing the vibration energy’s frequency-domain characteristics. Consequently, its applicability is somewhat limited [14,15,16]. For this purpose, the synthetic spectrum method is proposed to generate a more applicable vibration environment spectrum in these studies. The method specifically targets the non-stationary and non-Gaussian vibration data that equipment experiences, utilizing the power spectral density (PSD) function to provide a detailed characterization of the vibration energy distribution in the frequency domain [17]. Despite its potential, this approach has seen limited application in the field of vehicle carbody equipment, with few reported cases.
The study of coupled vibrations between high-speed trains and underbody equipment has become one of the key research topics in the rail transit field in recent years [18,19,20,21,22]. With the widespread adoption of lightweight train designs and distributed traction systems, vibration issues in underbody-mounted equipment (such as traction transformers, traction converters, and cooling fans) have become increasingly prominent. The elastic vibrations of the vehicle carbody and its interaction with the installed equipment significantly influence the equipment’s vibration and fatigue behavior, imposing stricter requirements on structural safety.
In short, compiling vibration environment spectra for equipment is crucial for maintaining operational safety. Additionally, the coupled system of the car carbody and the under-chassis equipment allows for a deeper understanding of the vibration environment spectrum’s characteristics. To this end, this paper models the coupled dynamics of carbody and equipment, then proposes a method for summarizing the random vibration environment of underfloor equipment that is suitable for multiple inputs. Based on the vibration environment spectra of underfloor equipment, a frequency-domain fatigue analysis method is used to evaluate the service life of underfloor equipment in high-speed EMU trains.

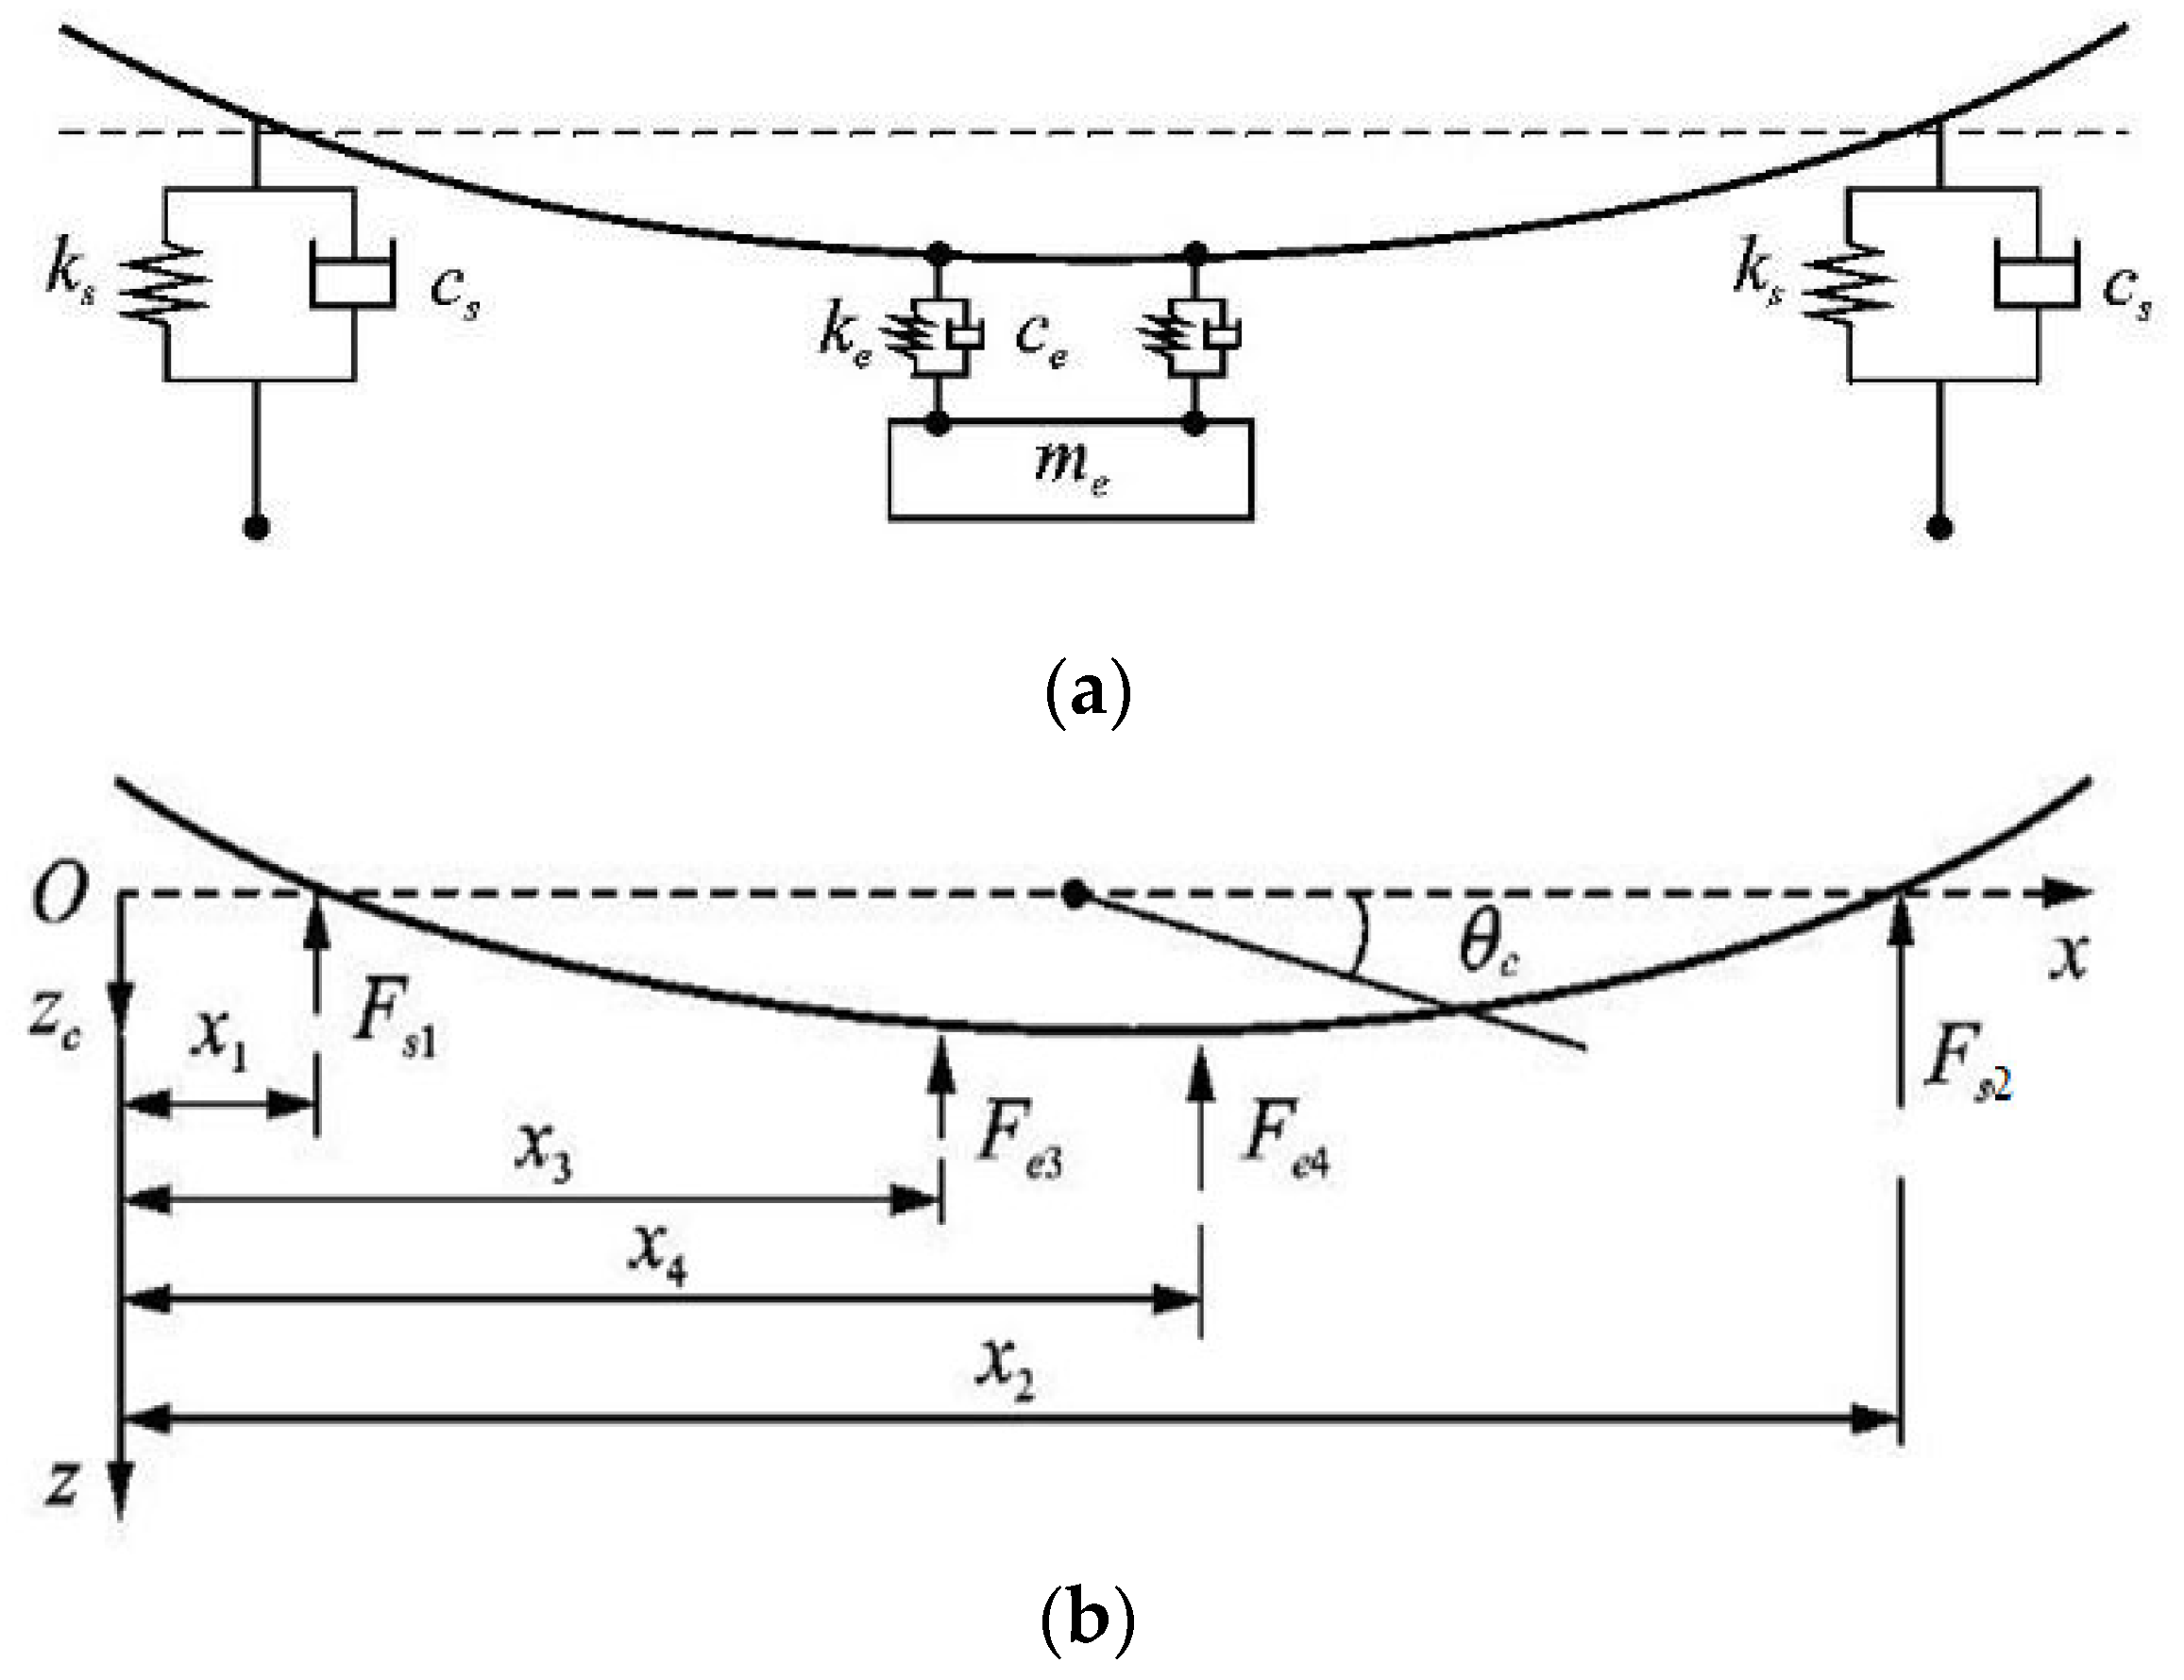
2. Coupled Vibration Analysis of Carbody and Underfloor Equipment

The mechanical model of the coupled vibration between the carbody and underfloor equipment is shown in Figure 1. The vibration sources considered in the study are primarily the coupled vibrations between the carbody and underfloor equipment. Therefore, the vibration transfer relationships between the flexible carbody and underfloor suspension equipment are presented here. The carbody is connected to the air springs and equipment through parallel spring–damper systems. The carbody is considered a straight Euler beam, taking into account its elastic mode vibrations, while the underfloor equipment is assumed to be a rigid carbody suspended by two-point hangers. The rigid mode of the model includes heave and pitch motions of both the carbody and equipment.
F s 1 , F s 2 represent the forces exerted on the carbody by two air springs, and the corresponding equation for their calculation is:
F s j = k s z x j , t g ( t ) c s z ˙ x j , t g ˙ ( t ) , j = 1 , 2
F e 3 , F e 4 represent the forces exerted on the carbody by the two suspension points of the underfloor equipment, and the corresponding equation for their calculation is:
F e j = k e z x j , t z e c e z ˙ x j , t z ˙ e , j = 3 , 4
where:
  • g ( t ) represents the displacement of the bogie acting on the air springs
  • k s , c s are the stiffness and damping of the air springs, respectively
  • k e , c e are the stiffness and damping of the elastic connections of the equipment
  • x j is the position coordinate, j = 1 , 2 , 3 , 4  j is the variable
  • z ( x , t ) is the elastic displacement
  • z e is the heave displacement of the equipment
Based on the theory of elastic carbody vibration, the partial differential equation [18] governing the vibration of the carbody can be written as:
E I 4 z ( x , t ) x 4 + μ I 5 z ( x , t ) t x 4 + ρ A 2 z ( x , t ) t 2 = j = 1 2 F s j δ x x j + j = 3 4 F e j δ x x j
where:
  • E is the elastic modulus of the carbody
  • I is the moment of inertia of the cross section
  • μ is the internal hysteresis damping coefficient
  • ρ is the material density
  • A is the cross-sectional area
  • δ is the Dirac function
Usually, the method of separation of variables is applied to solve Equation (3). Assuming the mode function and modal coordinate of the carbody for the i-th mode as Y i ( x ) and q i ( t ) , respectively, if the carbody displacement z ( x , t ) considers rigid carbody motion modes, then the first-order mode would be the heave mode, corresponding to the mode function:
Y 1 ( x ) = 1
The second-order mode would be the pitch mode, corresponding to the mode function:
Y 2 ( x ) = x L c / 2
where:
  • Lc is the length of the carbody.
Therefore, the displacement of the carbody in the N-th mode, considering both rigid and elastic motion, can be expressed as:
z ( x , t ) = z c ( t ) + ( x L c / 2 ) θ c ( t ) + i = 3 n Y i ( x ) q i ( t )
where z c ( t ) , θ c ( t ) are the heave and pitch mode displacements of the carbody, respectively. By substituting Equation (4) into Equation (3) and integrating along the length of the carbody while considering the orthogonality of the mode functions and the properties of the Dirac function, the motion equations for each mode of the carbody can be obtained as:
q ¨ i ( t ) + 2 ξ i ω i q i ( t ) = j = 1 2 Y i x j M c F s j + j = 3 4 Y i x j M c F e j M c z ¨ c ( t ) = j = 1 2 F s j + j = 3 4 F e j I c θ ¨ c ( t ) = j = 1 2 F s j ( x L c / 2 ) + j = 1 4 F e j ( x L c / 2 )
where:
  • ω i is the modal frequency of the elastic carbody, i = 3 , 4 , 5 , , n
  • ξ i is the structural damping ratio, i = 3 , 4 , 5 , , n
  • M c is the carbody mass
  • I c is the pitch moment of inertia
Similarly, the heave displacement z e and pitch displacement θ e of the equipment can be expressed as:
m e z ¨ e = j = 3 4 F e j I e θ ¨ e = j = 3 4 F e j x i x 3 + x 4 / 2
where:
  • m e is the mass of the underfloor equipment
  • I e is the moment of inertia of the underfloor equipment i = 3 , 4 , 5 , , n
It can be seen that the vibration environment of the underfloor equipment is mainly related to factors such as the mass of the underfloor equipment, the installation position of the underfloor equipment, and the stiffness and damping of the elastic connections of the underfloor equipment. Relevant studies have shown that for different underfloor equipment, the larger the equipment mass and the closer it is installed to the middle of the carbody, the more significant the effect of suppressing carbody elastic vibration. However, as the equipment moves farther away from the center of the carbody, its own vibration decreases, providing reference for the subsequent research in this paper.

3. Method for Compilation of Vibration Environment Spectrum for Underfloor Equipment

Currently, underfloor equipment in high-speed train units is often suspended in a multi-point hanging configuration from the car carbody floor or side beams. During train operation, the random irregularities [23,24,25] in the wheel–rail interaction result in random vibrations of the car carbody, thereby affecting the vibration environment of the underfloor suspended equipment. Therefore, the underfloor equipment in high-speed train units is subjected to multi-point random vibration loads during train operation. In order to analyze the vibration environment of the underfloor equipment, this section proposes a method for compiling the vibration environment spectrum of underfloor equipment based on measured vibration data that enables the quantification and compilation of the vibration environment load spectrum for underfloor equipment.
The definitions are as follows:
x k p , q = G k p , q
We estimate the mean X k p and variance S k 2 p of sample x k p , q , that is,
X k p = 1 Q p q = 1 Q p x k p , q S k 2 p = 1 Q p 1 q = 1 Q p x k p , q X k p 2
We calculate the upper tolerance coefficient F1 for a confidence level of (1–α) and a quantile point of β, i.e., α = 0.05, β = 0.9,
F 1 = t 1 α Q p 1 Q p + Z β Q p 1 χ 2 α Q p 1
where Zβ is the normal quantile point satisfying P(ZZβ) = β and χ 2 1 α / 2 Q p 1 is the χ2 distribution α quantile point whose degree of freedom is Qp − 1.
The upper tolerance limit is estimated for the p-th sample, i.e.,
G k p = X k p + F 1 S k p 2
This results in the measured spectrum of the random vibration of the bogie motor, i.e., Gk(p).
The time-domain vibration acceleration data are collected from the measurement-point channels of the bogie motor (at least 20 s per segment). First, the power spectra of all the samples are calculated and denoted Gk(i, j) (i = 1, 2, …, L; j = 1, 2, …, M; k = 1, 2, …, N), where i represents the channel number, L represents the total number of channels, j represents the sample number, M represents the total number of samples, k represents the spectral-line number, and N represents the total number of spectral lines. For the k-th dimension, we take the root-mean-square value of Gk(i, j) and denote it R(i, j).
For different channels, the mean Xi and variance S i 2 of sequence R(i, j) are estimated separately:
X i = 1 M 1 j = 1 M R i , j S i 2 = 1 M 1 1 j = 1 M R i , j X i 2
The a-th and b-th channels are selected, and the statistics F(a, b) and t(a, b) are computed using the estimated means and variances.
F a , b = S a 2 S b 2 t a , b = X a X b S a 2 + S b 2 / M a b
If the power spectra of channels a and b belong to the same general population, F(a, b) obeys the F distribution with degrees of freedom (M − 1, M − 1) and t(a, b) obeys the central t distribution with degrees of freedom 2(M − 1), which implies that it holds for a given confidence level of 1 − α. Conversely, they do not belong to the same aggregate.
F α / 2 M 1 , M 1 F a , b F 1 α / 2 M 1 , M 1 t a , b t 1 α / 2 2 M 2
The data belonging to the same channel are grouped together to form the feature sample Gk(p, q) (p = 1, 2, …, P; q = 1, 2, …, Q; k = 1, 2, …, N), where p represents the feature channel serial number, P represents the total number of feature channels (fewer than or equal to the total number of channels), q represents the sample serial number, and Qp represents the number of samples in the p-th feature channel.

4. Vibration Environment Analysis of Under-Vehicle Equipment
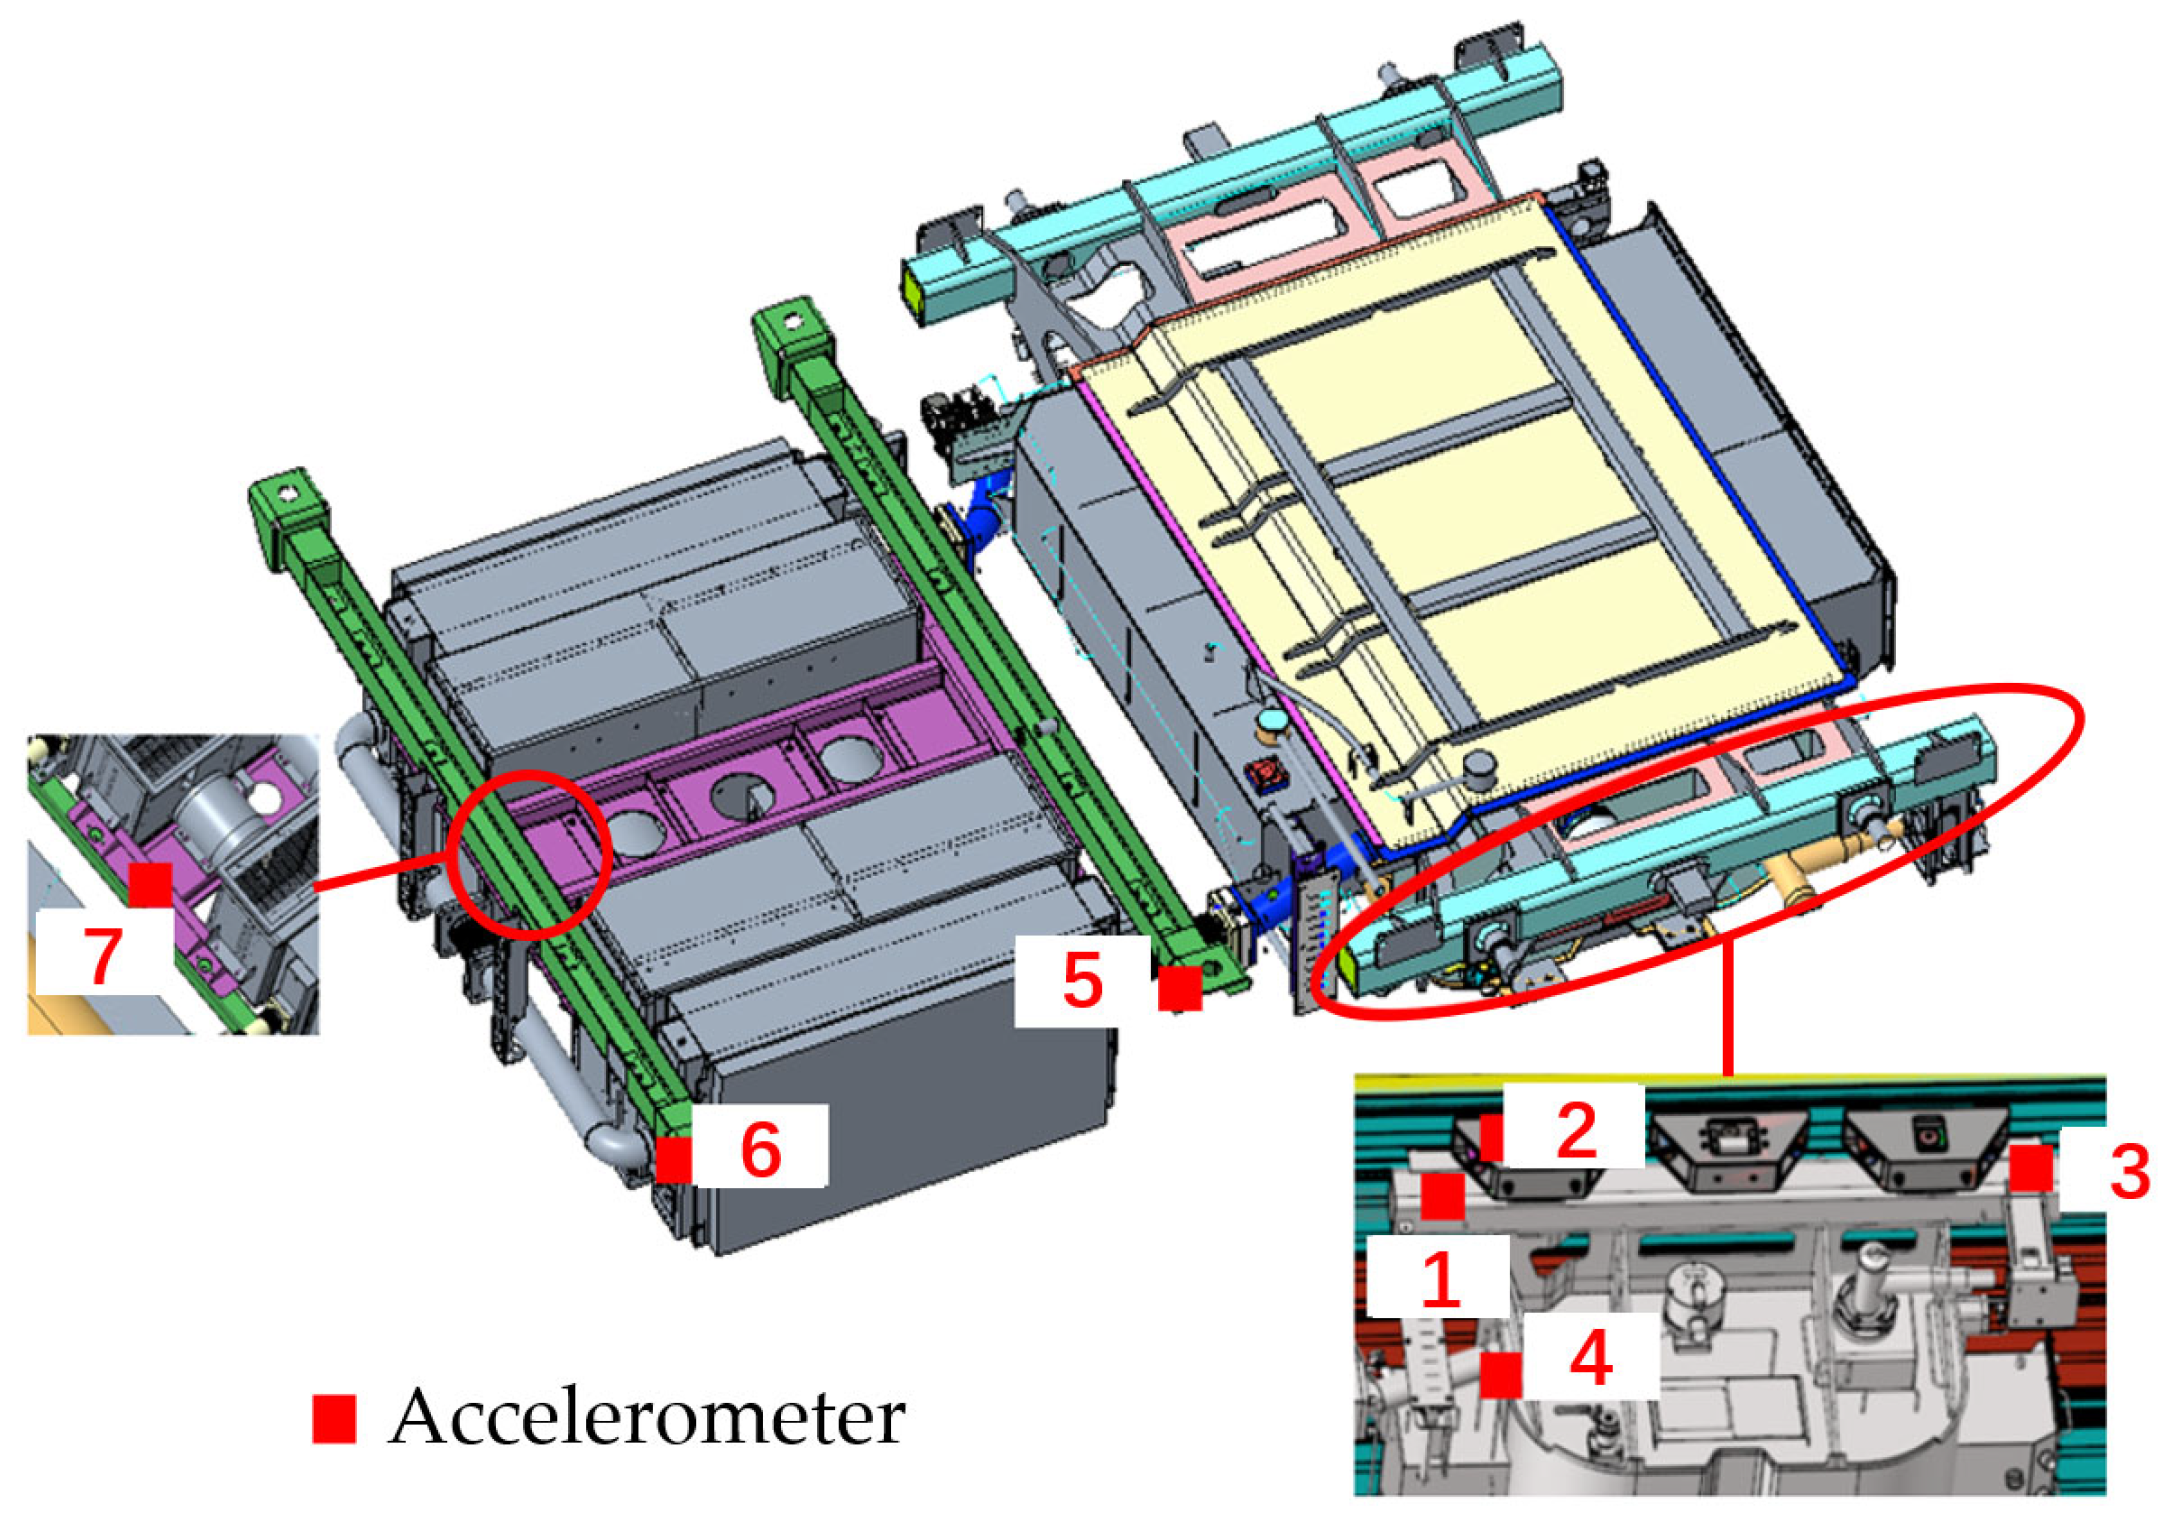
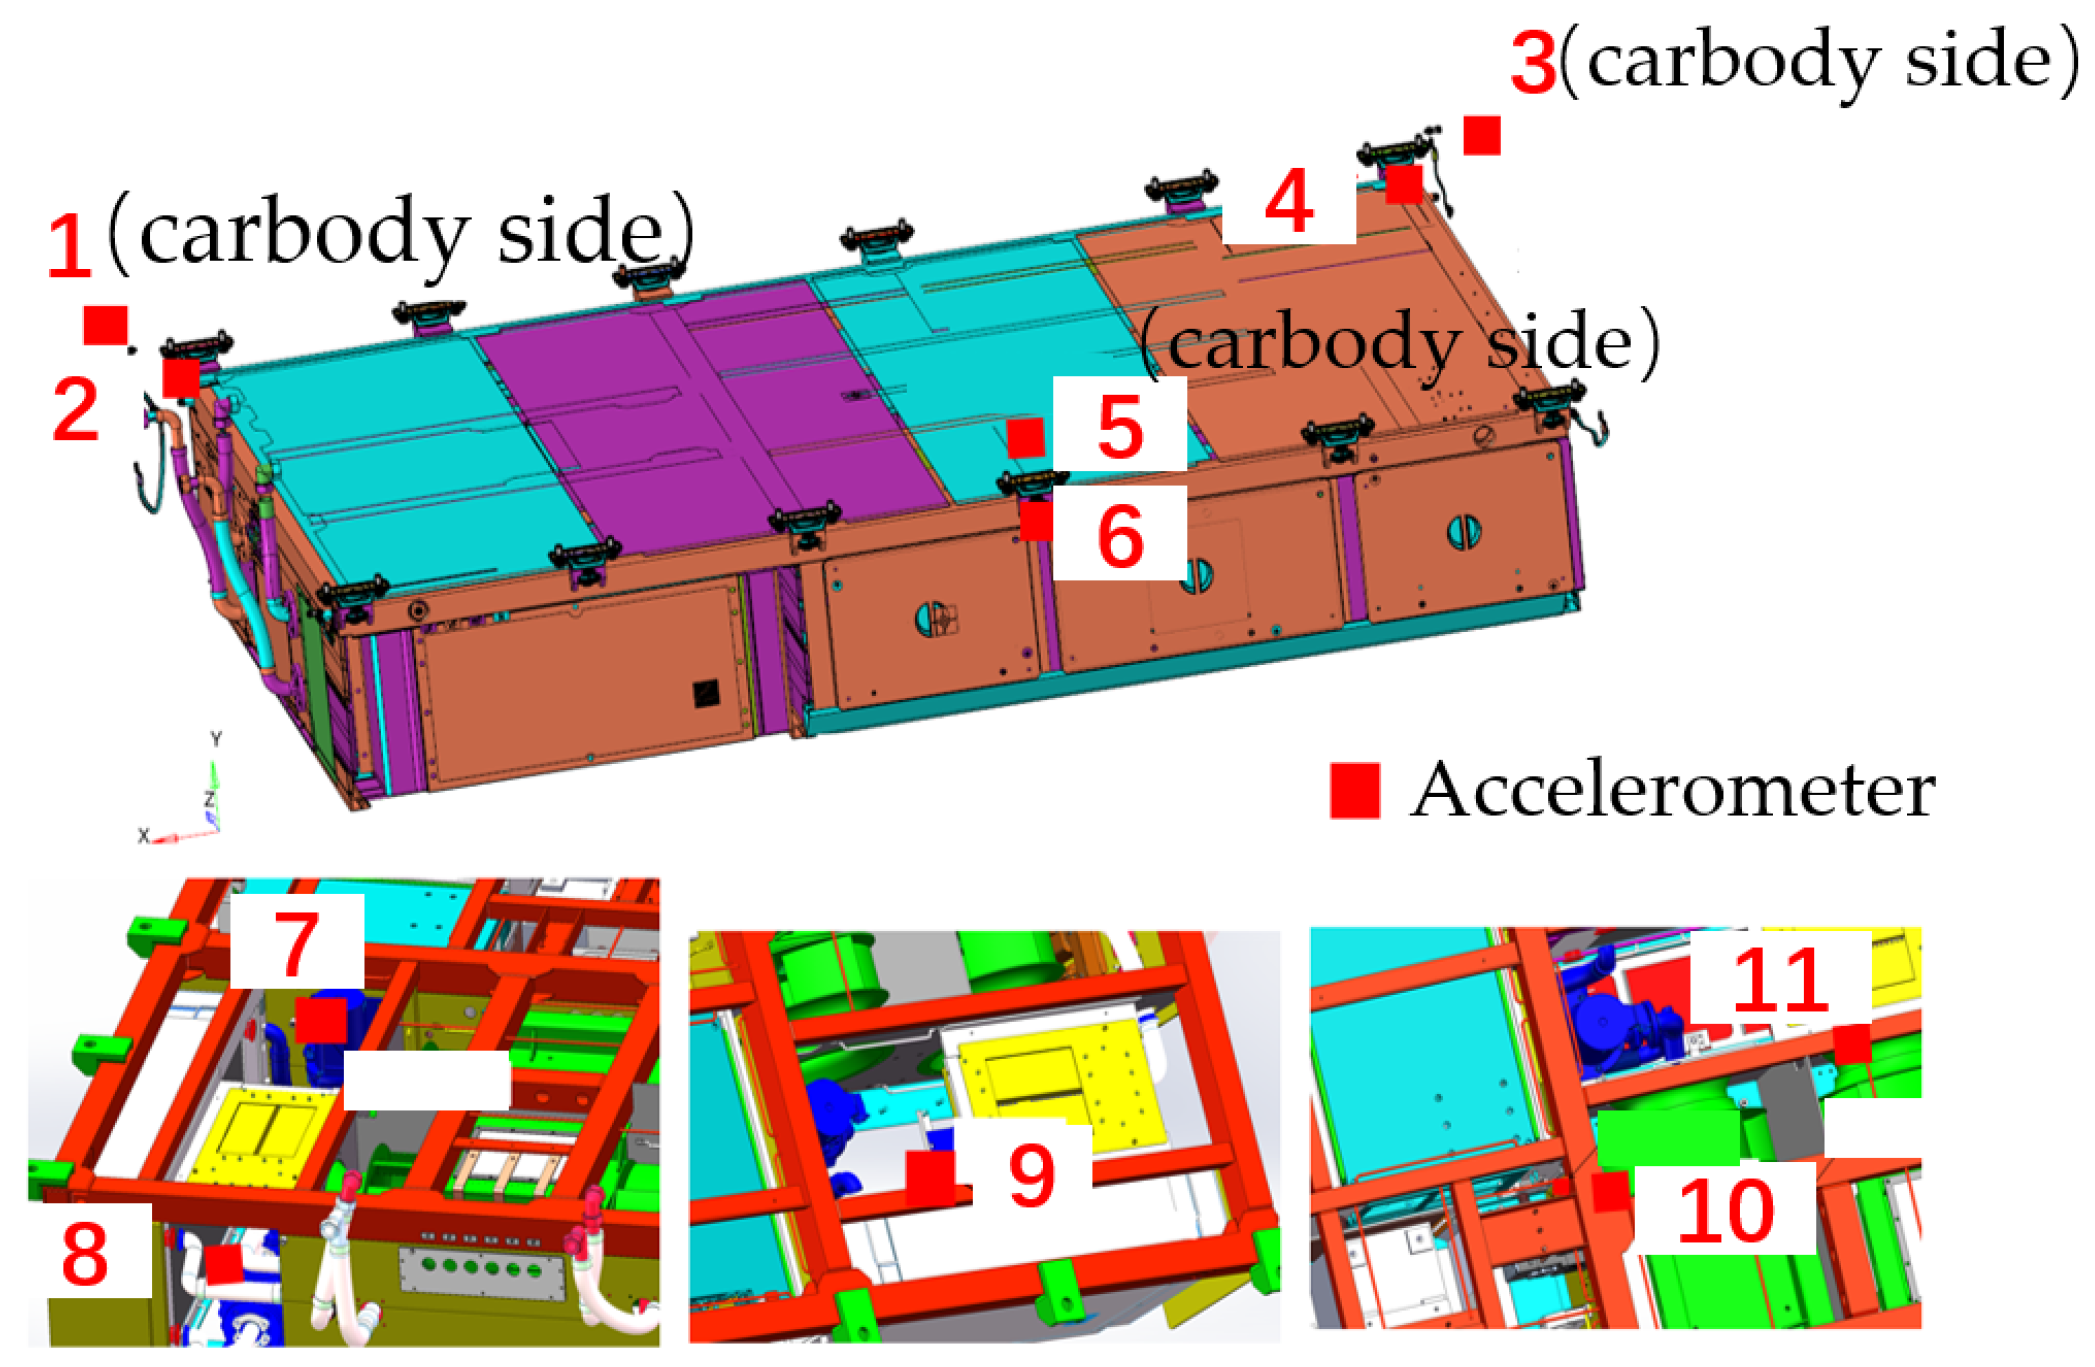
4.1. Field Testing

Line tests were conducted on different underfloor equipment of high-speed train sets to obtain vibration load data of equipment. The main objects of data collection were traction transformers, traction converters, and air compressors. Measurement points were mainly arranged on the equipment enclosures, suspensions, and the carbody above the suspensions. The locations of some measurement points are shown in Figure 2 and Figure 3. After the arrangement of measurement points, tests were conducted on the same section, and the vibration accelerations of the measurement points during the operation of the train sets at speeds of 300 km/h, 350 km/h, 380 km/h, and 400 km/h were collected. The sampling frequency was 2000 Hz. Based on the measured vibration test data of the underfloor equipment, vibration spectra were compiled using the method mentioned above to facilitate the subsequent analysis of frequency-domain distribution characteristics.

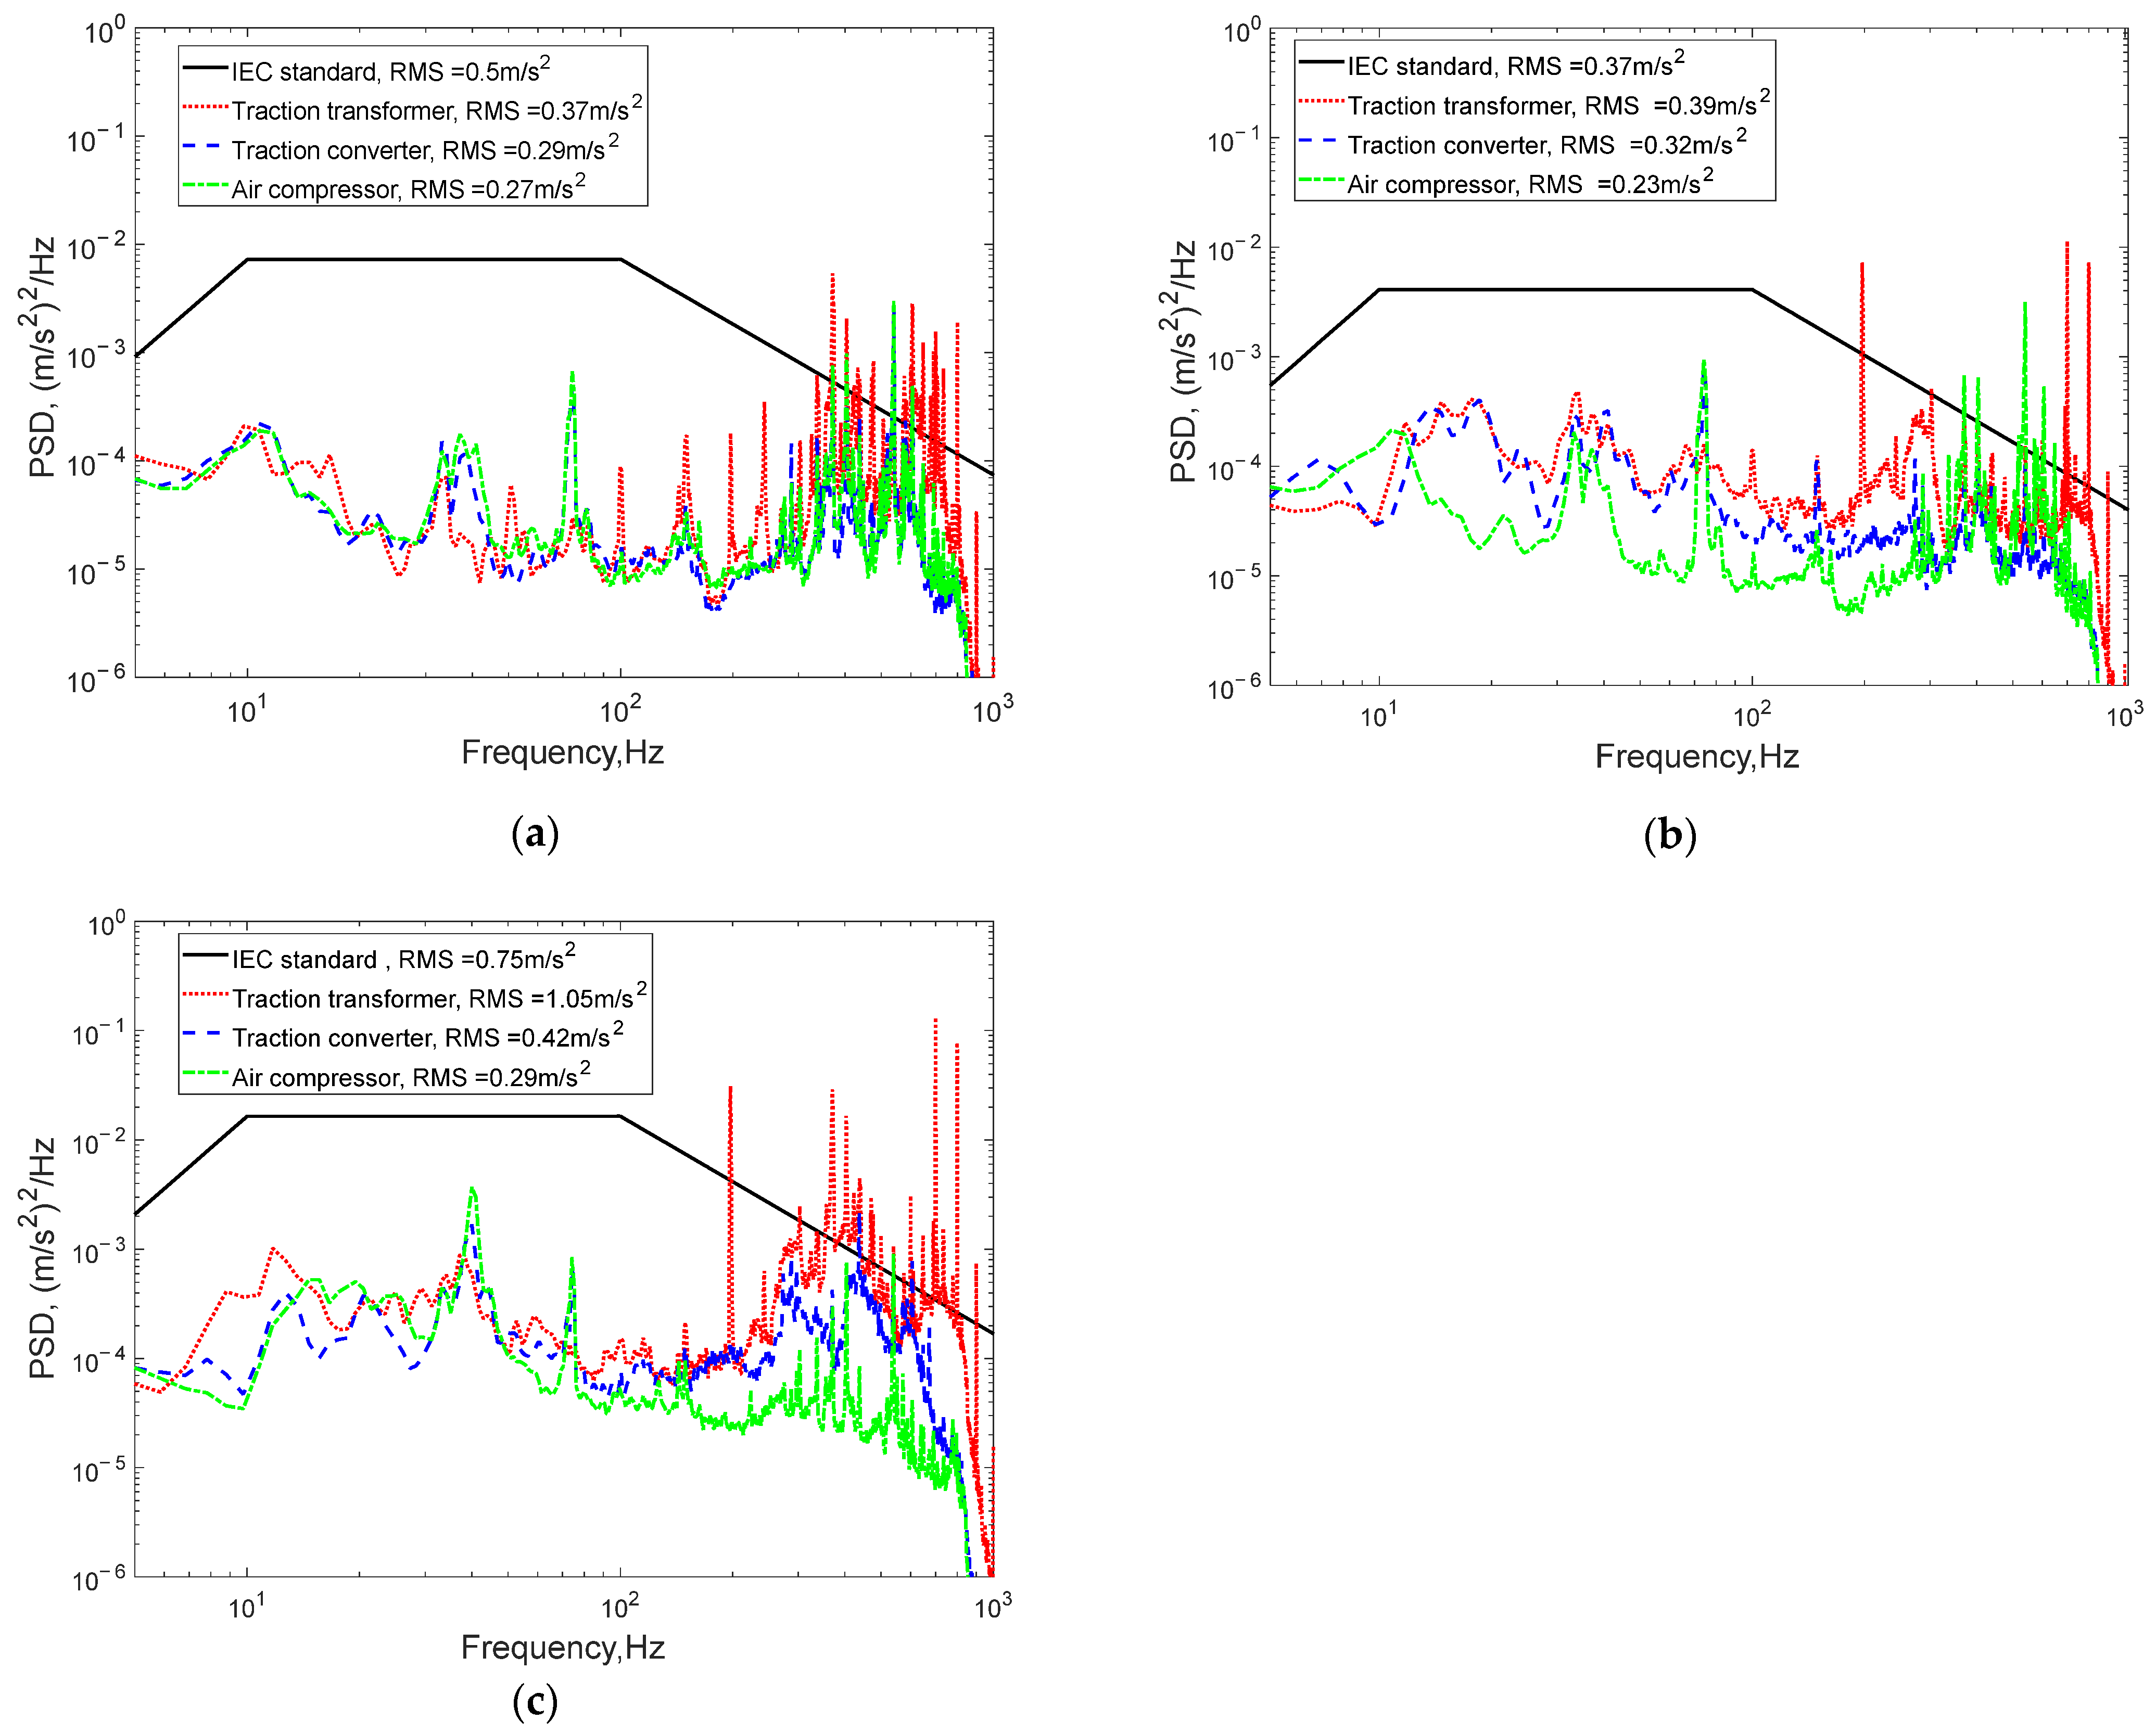
4.2. Comparative Analysis of Vibration Environment for Different Underfloor Equipment

Firstly, vibration test data of carbody measurement points corresponding to different underfloor equipment at the same speed were selected, and vibration spectra were compiled for comparative analysis. At a speed of 350 km/h, the differences in vibration environment between traction transformers, traction converters, and air compressors were analyzed. The vibration spectra of the underfloor equipment of high-speed train sets at a speed of 350 km/h are shown in Figure 4.
It can be observed from Figure 4 that at a speed of 350 km/h, the vibration energy (herein referring to the root-mean-square (RMS) acceleration (the square root of the integrated PSD), quantifying the overall vibration magnitude) at carbody positions corresponding to different underfloor equipment is generally similar, with similar frequency-domain distribution characteristics, but still with slight differences. Firstly, in the X-axis direction, the vibration energy values at the carbody positions corresponding to the traction transformer, traction converter, and air compressor decrease in order, measuring 0.37 m/s2, 0.29 m/s2, and 0.27 m/s2, respectively, all below the IEC standard limit of 0.5 m/s2. In the low-frequency range, the vibration spectrum values at the carbody positions corresponding to each piece of equipment are generally lower than the standard values, while in the high-frequency range, the vibration spectrum values at the carbody positions corresponding to each piece of equipment are slightly higher than the standard values.
In the Y-axis direction, the vibration energy values at the carbody positions corresponding to the traction transformer, traction converter, and air compressor decrease in order, measuring 0.39 m/s2, 0.32 m/s2, and 0.23 m/s2, respectively. The vibration energy value of the traction transformer is slightly higher than the IEC standard limit of 0.37 m/s2, while the vibration energy values of the traction converter and air compressor are below the standard. In the low-frequency range, the vibration spectrum values at the carbody positions corresponding to each equipment are generally lower than the standard values, while in the high-frequency range, the vibration spectrum values at the carbody positions corresponding to each equipment are slightly higher than the standard values.
In the Z-axis direction, the vibration energy values at the carbody positions corresponding to the traction transformer, traction converter, and air compressor decrease in order, measuring 1.05 m/s2, 0.42 m/s2, and 0.29 m/s2, respectively. The vibration energy value of the traction transformer is slightly higher than the IEC standard limit of 0.75 m/s2, while the vibration energy values of the traction converter and air compressor are below the standard. In the low-frequency range, the vibration spectrum values at the carbody positions corresponding to each piece of equipment are generally lower than the standard values, while in the high-frequency range, the vibration spectrum values at the carbody positions corresponding to each piece of equipment are slightly higher than the standard values.
The vibration test data of the corresponding carbody measurement points of the same underfloor equipment at different speeds, 300, 350, 380, and 400 mph, were selected. Vibration spectra were prepared for comparative analysis. The vibration spectra of the underfloor equipment of high-speed train sets at different speeds are shown in Figure 5.

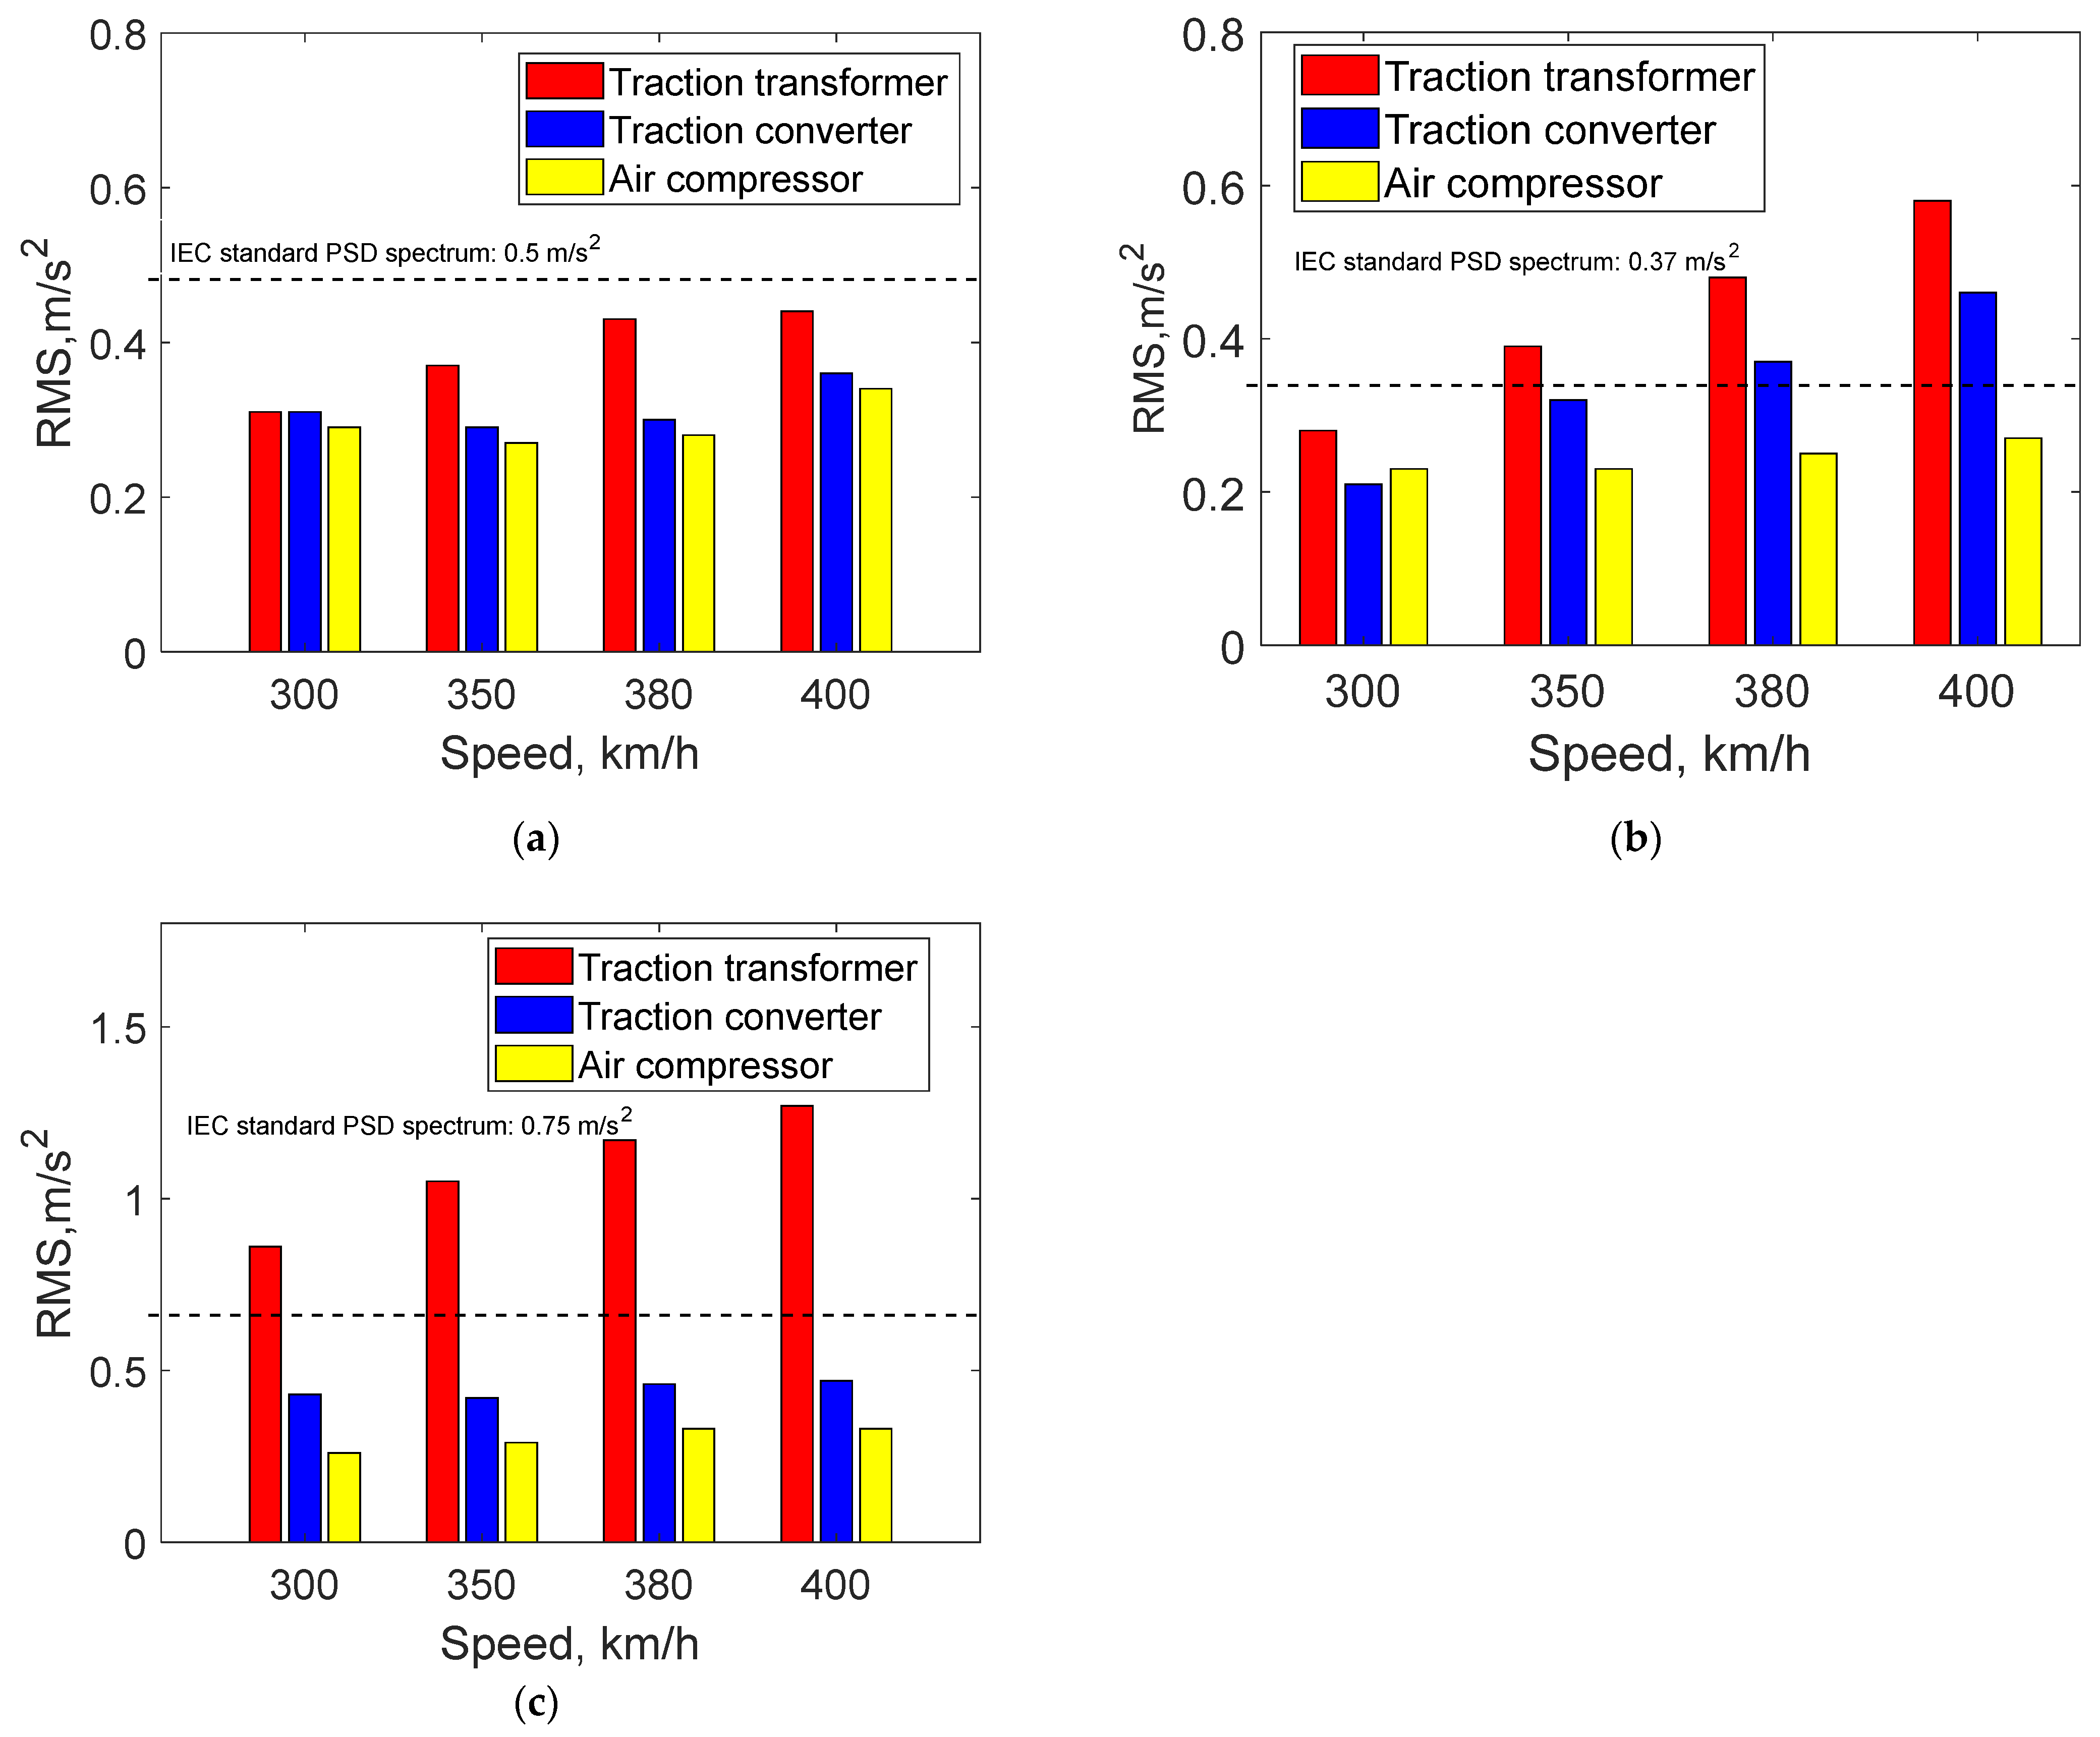
4.3. Comparative Analysis of Vibration Environment at Different Speeds

Subsequently, the differences and variations in the vibration environment at different speeds were investigated for the vibration test data of the carbody measurement points corresponding to the underfloor equipment. The carbody measurement points associated with the three types of underfloor equipment mentioned earlier were selected as the subjects of study. The operating speeds of the high-speed train sets were set to 300 km/h, 350 km/h, 380 km/h, and 400 km/h. A comparative analysis was conducted to examine the disparities in the vibration environment of the underfloor equipment at different speeds. The vibration spectra of the carbody measurement points corresponding to the underfloor equipment of the high-speed train sets at different speeds were compiled, and their RMS values were calculated. The results are illustrated in Figure 5.
It can be observed in Figure 5 that the vibration energy values at the carbody measurement points of different underfloor equipment vary in all directions. Firstly, in the X-direction (Figure 5a), at the same speed, the vibration energy value is highest at the carbody measurement point corresponding to the traction transformer, followed by the traction converter, and the air compressor exhibits the lowest value. This finding is consistent with the previous conclusion. As the speed increases, the vibration energy values at the carbody measurement points of each piece of equipment also increase. The vibration energy value at the traction transformer location exhibits the most pronounced growth trend, and the vibration energy values at all equipment locations remain below the IEC standard of 0.5 m/s2.
In the Y-direction (Figure 5b), at the same speed, the vibration energy value is highest at the carbody measurement point corresponding to the traction transformer, followed by the traction converter, and the air compressor exhibits the lowest value. This finding is consistent with the previous conclusion. As the speed increases, the vibration energy values at the carbody measurement points of each piece of equipment also increase. Specifically, when the speed exceeds 350 km/h, the vibration energy value at the traction transformer location surpasses the IEC standard of 0.37 m/s2, while the vibration energy values at the traction converter and air compressor locations remain below the standard.
In the Z-direction (Figure 5c), at the same speed, the vibration energy value is highest at the carbody measurement point corresponding to the traction transformer, followed by the traction converter, and the air compressor exhibits the lowest value. This finding is consistent with the previous conclusion. As the speed increases, the vibration energy values at the carbody measurement points of each piece of equipment also increase. Particularly, when the speed exceeds 300 km/h, the vibration energy value at the traction transformer location exceeds the IEC standard of 0.75 m/s2, while the vibration energy values at the traction converter and air compressor locations remain below the standard.
By comparing and analyzing the vibration spectra of the underfloor equipment at the same speed, it can be observed that the vibration energy value is highest at the traction transformer, followed by the traction converter, and the air compressor exhibits the lowest value in all directions. Considering the hanging positions of the three components under the train, it can be deduced that the traction transformer is located directly beneath the center of the carbody, the traction converter is situated slightly forward in the middle section of the carbody, and the air compressor is positioned near the end. The observed patterns of vibration energy values align with the research conclusions in Section 1. Moreover, for the same equipment at different speeds, the vibration energy value increases as the speed rises and the frequency-domain distribution characteristics are similar, but with a rightward shift in peak values.
The above equipment vibration loads were analyzed using the kernel density estimation function. The probability density function (PDF) analysis results were obtained, and are shown in Figure 6. It can be observed that with growing speed, the vibration loads of the equipment under the car at different speeds conform to nearly normal distribution characteristics. As the speed increases, the PDF curve shifts from narrow to broad, which is basically consistent with vibration rms performance.

5. Fatigue Analysis of Underfloor Equipment Mounts

5.1. Fatigue Analysis Theory

For the stress–response spectrum of the bogie frame motor, the Dirlik rainflow amplitude PDF was used to calculate the number of stress cycles. The Dirlik rainflow counting method is based on the results of numerous Monte Carlo simulations and employs a purely empirical closed-form expression [26,27] that approximates the probability density function of rainflow amplitude, consisting of one exponential and two Rayleigh distributions. The expressions are as follows:
f ( S a ) ( S a ) = A 1 2 M 0 T e Z T S a + A 2 Z 2 M 0 V 2 e Z 2 2 V 2 S a 2 + A 3 Z 2 M 0 e Z 2 2 S a 2
where: Z = 1 2 M 0 , γ = M 2 M 0 M 4 , X m = M 1 M 0 M 2 M 4 , A 1 = 2 ( X m γ 2 ) 1 + γ 2 , V = γ X A 1 2 1 γ A 1 + A 1 2 , A 2 = 1 γ A 1 + A 1 2 1 V , A 3 = 1 A 1 A 2 , and T = 1.25 ( γ A 3 A 2 V ) A 1 .
The one-sided response stress PSD function is defined by M0, M1, M2, and M4. The zero-, first-, second-, and fourth- order moments of the response stress, then Mi is defined as:
M i = 0 + f i W f d f
where W(f) is the PSD function. The Dirlik fatigue damage model for the time period τ is expressed as follows:
D = E ( P ) τ C 0 + S a m f S a S a d S a
where E ( P ) = M 4 M 2 represents the peak crossing rate of the one-sided PSD function of the response stress, and C and m are the material constants of the power-function expression of the S-N curve of the material.
The input load is described by the PSD function, the response stress PSD function of the structure is obtained via frequency response calculation and modal analysis of the system, and the fatigue life of the system is calculated according to the fatigue failure model and the fatigue properties of the material.

5.2. Fatigue Analysis

Taking the traction transformer as an example, a finite element model of the suspension points for the traction transformer on the vehicle carbody was established to calculate the stress response spectrum. The equipment carbody is composed of hexahedral elements, and the suspended equipment beneath the mounting seat is represented by a single mass point, which is rigidly coupled to the mounting seat. The bolt holes connecting the suspension points and the vehicle carbody side beams are completely constrained. Modal analysis was performed based on this and the stress response calculated. Unit vertical, lateral, and longitudinal accelerations at various frequencies were applied at the bolt holes, and the corresponding frequency response functions were solved separately, as shown in Figure 7.
The measured stress data of the suspension points for the traction transformer under operating speeds of 300 km/h, 350 km/h, 380 km/h, and 400 km/h were analyzed separately, and the rainflow counting method was used for statistical analysis. The results are shown in Figure 8.
It can be observed that at low cycle counts, as the operating speed increases, the stress amplitude increases from 6.8 MPa to 19.1 MPa. At low stress amplitudes, the required cycle count to reach the fatigue limit also increases with the operating speed.
Based on the data obtained from the rainflow counting method, fatigue damage graphs for the suspension points of the traction transformer at different speeds were plotted, as shown in Figure 9.
It can be seen that with increasing operating speed, the fatigue damage exhibits an exponential growth pattern. The maximum damage reaches 0.28 at 400 km/h, but it is still below 1.0, which is within the safety range.

6. Conclusions

This paper presents a novel, statistically grounded spectral synthesis method for generating vibration environment spectra of underfloor equipment in high-speed EMU trains, addressing key limitations of the IEC 61373 standard by providing frequency-specific insights and accounting for multi-point random vibrations from the car carbody.
(1)
This paper proposes a method for organizing and summarizing the random vibrations of the vehicle body caused by the random irregularities of the wheel–rail interaction during the service of equipment installed beneath high-speed trains. The measured vibration data of different equipment installed beneath high-speed trains at various speeds were compiled into environmental spectra and analyzed, which provides a novel method for generating vibration load spectrum of the vehicle structures.
(2)
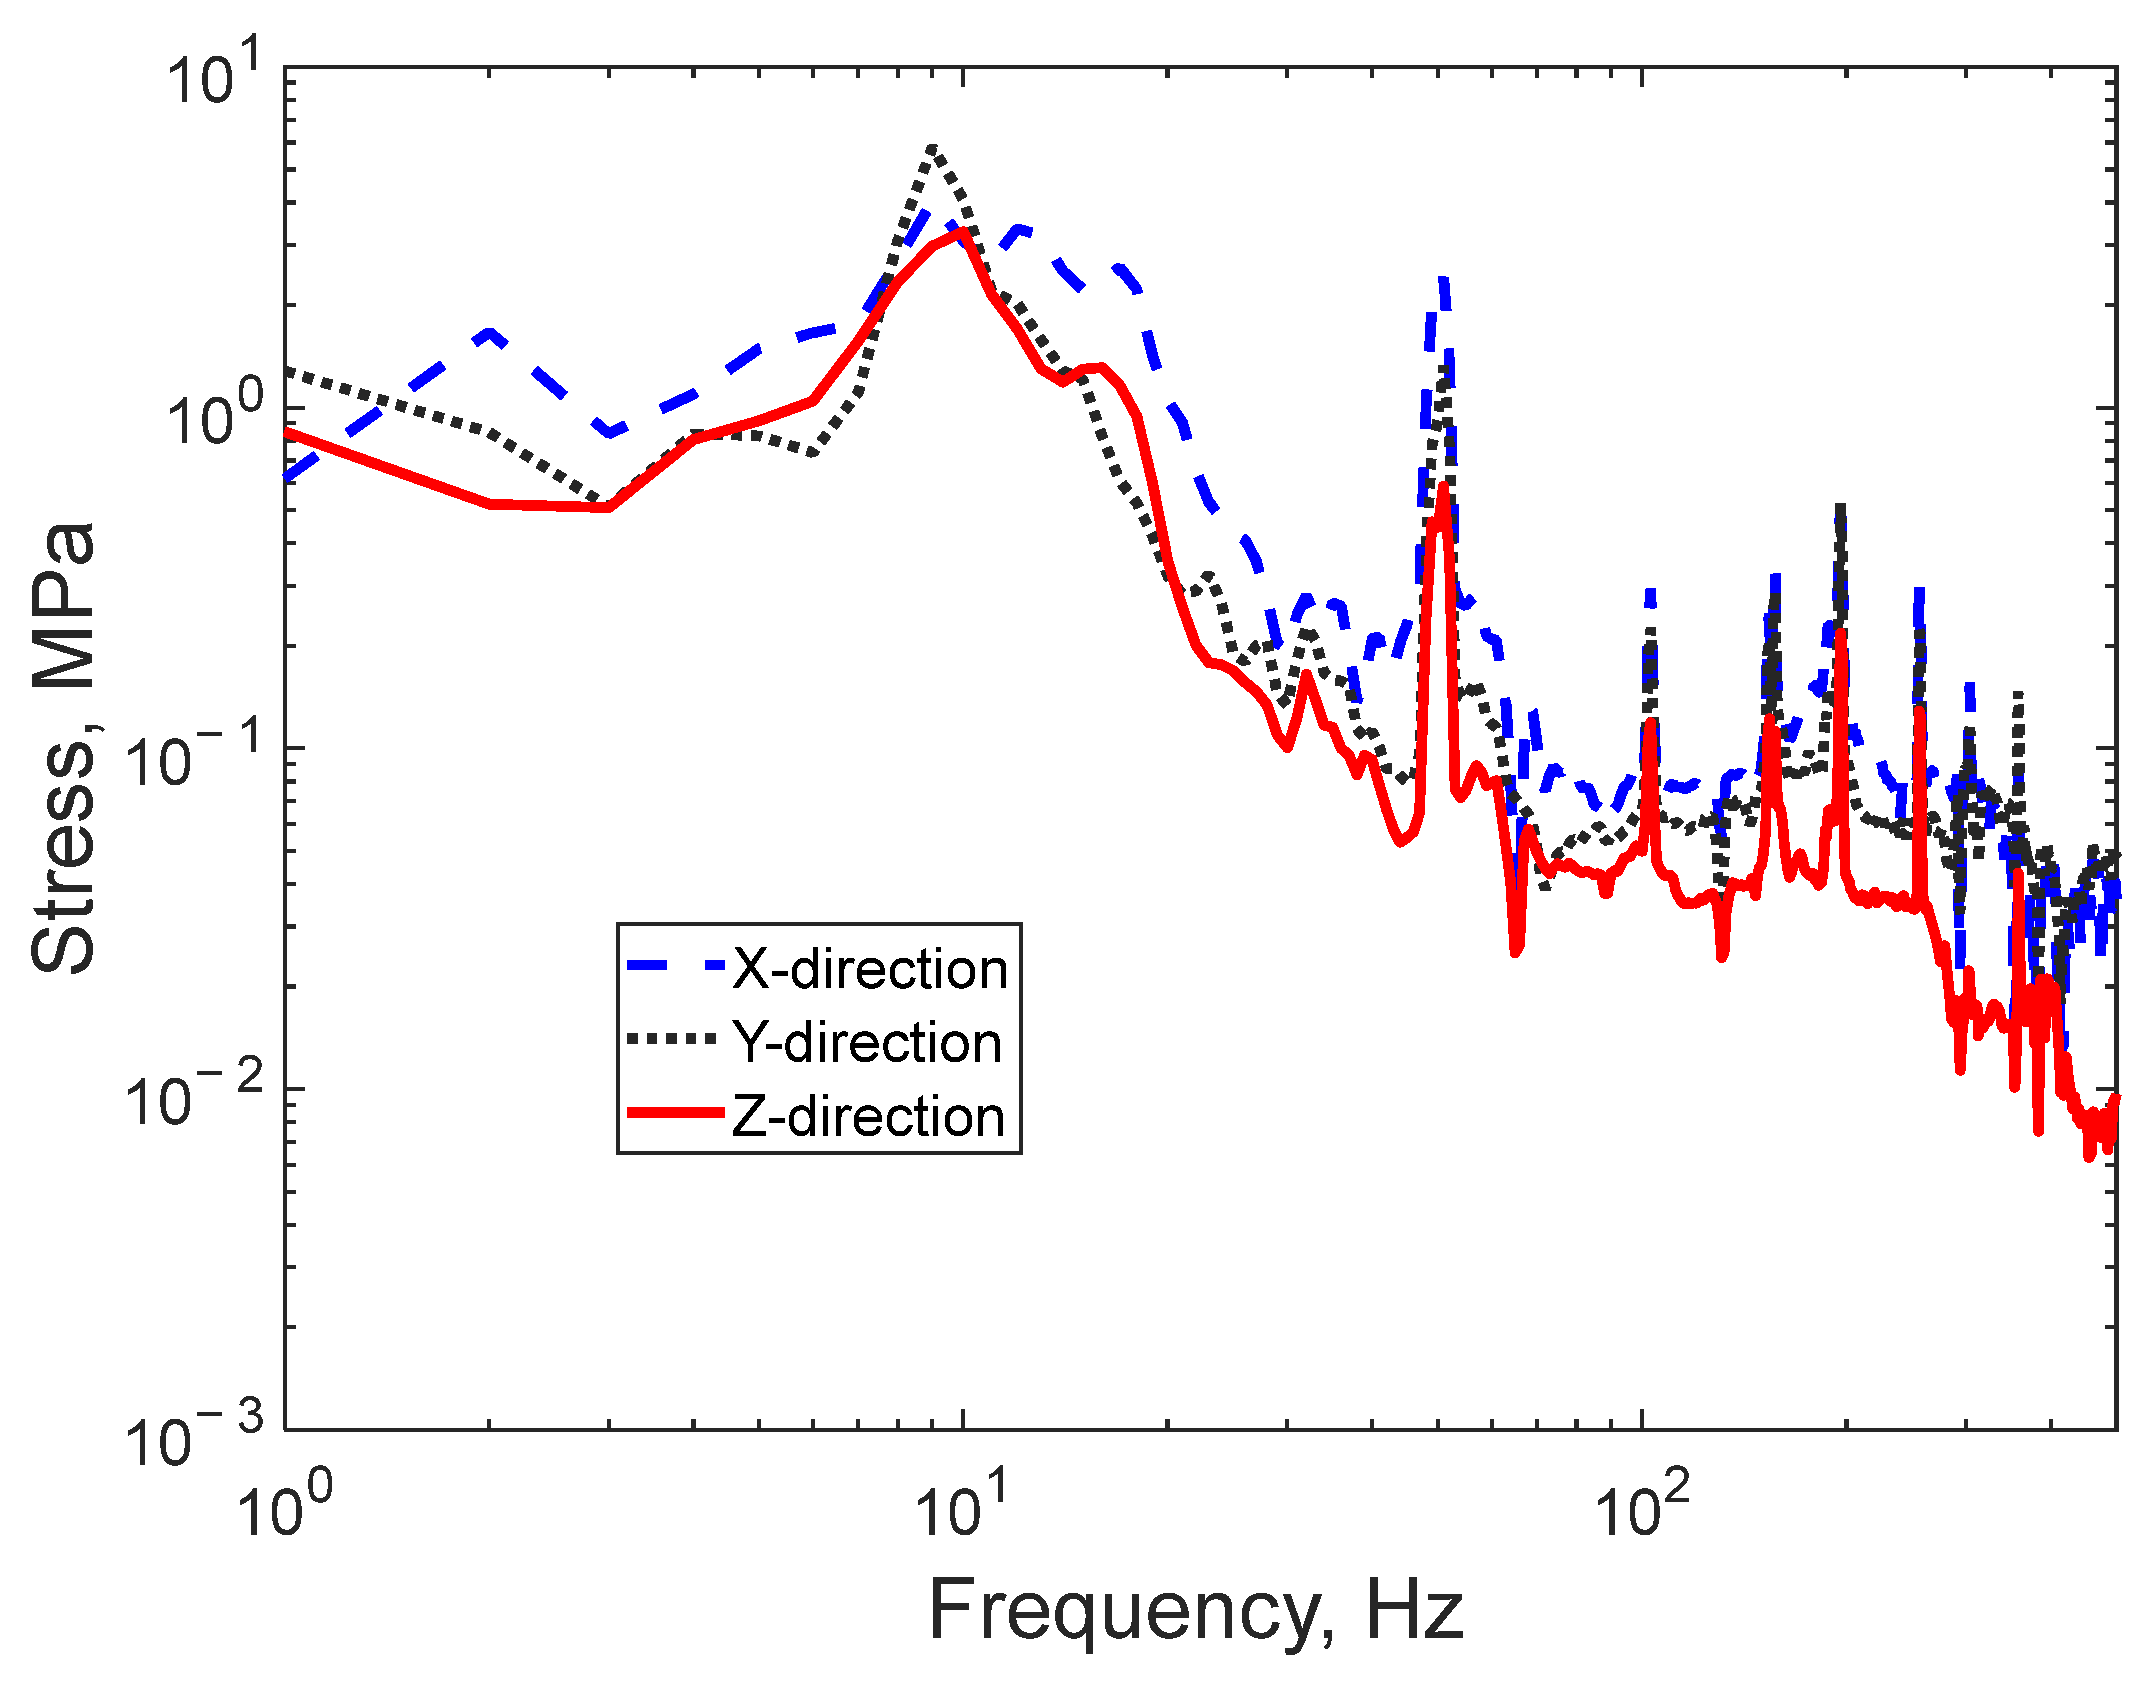
By comparing and analyzing the vibration environmental spectra of different equipment installed beneath the trains at the same speed, it was found that the traction transformer had the highest vibration energy in all directions, followed by the traction converter and the air compressor, which is related to each unit’s mass (generally, equipment with greater mass exhibits higher vibration energy levels) and mounting positions beneath the carbody. For the same equipment at different speeds, the higher the speed, the higher the vibration energy and similar frequency-domain distribution characteristics with a rightward shift of the peak.
(3)
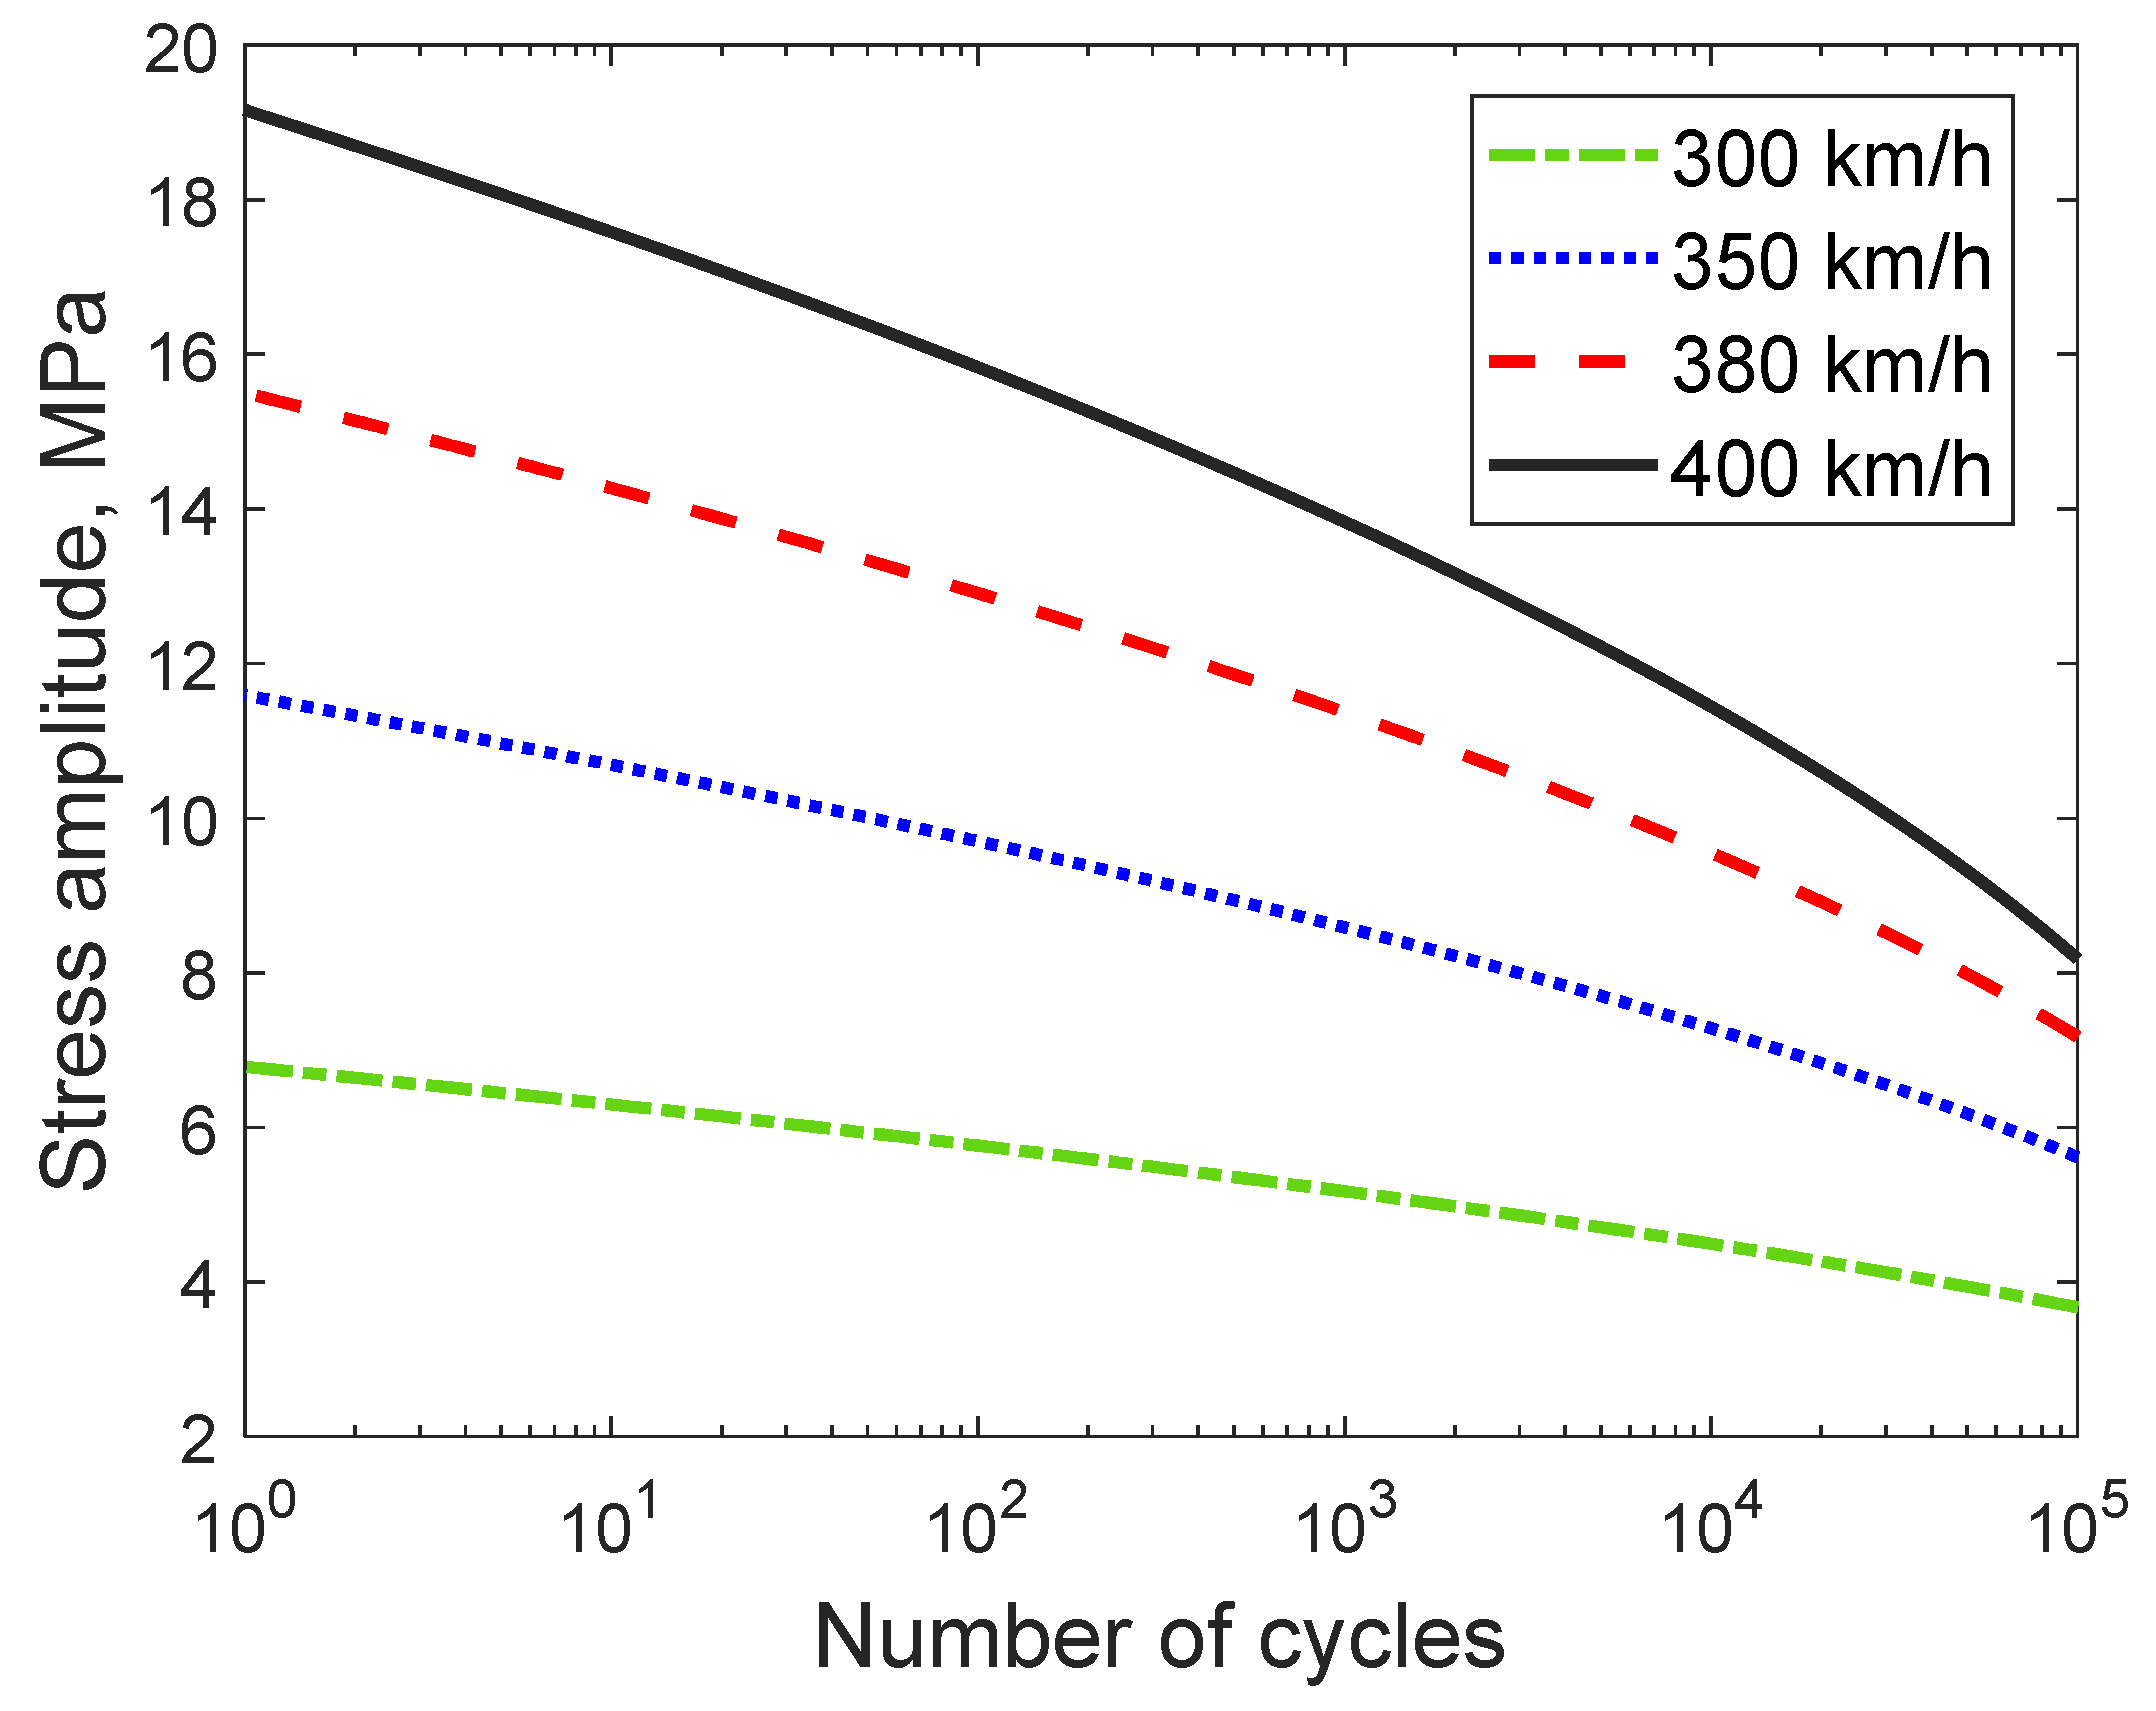
Based on the proposed fatigue prediction method in this paper, the cumulative damage to the hanging points of the equipment installed beneath the train at different speeds was evaluated.
(4)
This research facilitates the translation from theoretical spectral analysis to engineering applications, with an emphasis on advancing industry standards to incorporate the effects of equipment positioning and operational speed on fatigue assessment while establishing a comprehensive field validation framework encompassing track-condition adaptability and multi-equipment interactions. These developments will ultimately enhance the operational reliability of next-generation high-speed trains and promote technology transfer.

Author Contributions

Methodology, C.C. and L.G.; Validation, G.L.; Investigation, H.Z.; Data curation, Y.L. and Y.Z.; Writing—original draft, C.C.; Writing—review & editing, D.G. All authors have read and agreed to the published version of the manuscript.

Funding

The authors gratefully acknowledge the financial support provided by the Major Project of China Academy of Railway Sciences Group Co., Ltd.: [2024YJ048]; the Project of Science and Technology Research and Development Program of China National Railway Group Co., Ltd.: [P2024J001].

Data Availability Statement

The datasets used and/or analyzed during the current study are available from the corresponding author on reasonable request.

Conflicts of Interest

Authors Can Chen, Lirong Guo, Guoshun Li, Yongheng Li, Yichao Zhang and Hongwei Zhang were employed by the company China Academy of Railway Sciences Corporation Limited. The remaining authors declare that the research was conducted in the absence of any commercial or financial relationships that could be construed as a potential conflict of interest. The authors declare that this study received funding from China Academy of Railway Sciences Group Co., Ltd. and China National Railway Group Co., Ltd. The funder was not involved in the study design, collection, analysis, interpretation of data, the writing of this article or the decision to submit it for publication.

Abbreviations

EMUelectric multiple unit
IECInternational Electrotechnical Commission
PSDpower spectral density
RMSroot mean square
PDFprobability density function

References

  1. Wei, X.; Ren, Z.; Yang, G. Investigation into fatigue failure of cable brackets and vibration suppression methods. Eng. Fail. Anal. 2024, 165, 108782. [Google Scholar] [CrossRef]
  2. Wang, Z.; Gong, D.; Zhou, J. Mechanism and countermeasure of polygon development of metro wheels under fluctuating wheel-rail normal force. Mech. Based Des. Struct. Mach. 2025. [Google Scholar] [CrossRef]
  3. Çati, Y.; Düzgün, M.; Kracht, F. Development of a new vertical dynamic model of a rail vehicle for the analysis of ride comfort. Appl. Sci. 2024, 24, 3848. [Google Scholar] [CrossRef]
  4. Wang, Z.; Gong, D. A survey on countermeasures of railway vehicle stability decrease caused by the evolution of hollow-worn wheels. J. Vib. Control 2025, 31, 864–877. [Google Scholar] [CrossRef]
  5. Dong, Z.; Wang, W.; Dai, S.; Zheng, J.; Feng, Y. Study on structure optimization and vibration fatigue damage of wire bracket for rail vehicles. Eng. Fail. Anal. 2024, 156, 107732. [Google Scholar] [CrossRef]
  6. Dietz, S.; Netter, H.; Sachau, D. Fatigue life prediction of railway bogie under dynamic loads through simulation. Veh. Syst. Dyn. 1998, 29, 385–402. [Google Scholar] [CrossRef]
  7. Lu, Y.; Xiang, P.; Dong, P.S.; Zhang, X.; Zeng, J. Analysis of the effects of vibration modes on fatigue damage in high-speed train bogie frames. Eng. Fail. Anal. 2018, 89, 222–241. [Google Scholar] [CrossRef]
  8. Smith, R. Railway fatigue failures: An overview of a long standing problem. Mater. Sci. Eng. Technol. 2005, 36, 697–705. [Google Scholar] [CrossRef]
  9. Wu, Y.; Ren, Z. Fatigue damage assessment of a metro vehicle bogie frame based on measured field load. Machines 2025, 13, 306. [Google Scholar] [CrossRef]
  10. Wang, S.; Wu, P.; Song, Y.; Liu, C.; Ye, Y.; Li, F. Vibration environment spectrum investigation of metro bogie frame end. Eng. Fail. Anal. 2024, 157, 107865. [Google Scholar] [CrossRef]
  11. Bokaeian, V.; Rezvani, M.; Arcos, R. Nonlinear impact of traction rod on the dynamics of a high-speed rail vehicle carbody. J. Mech. Sci. Technol. 2020, 34, 4989–5003. [Google Scholar] [CrossRef]
  12. Bernal, E.; Spiryagin, M.; Cole, C. Wheel flat detectability for Y25 railway freight wagon using vehicle component acceleration signals. Veh. Syst. Dyn. 2020, 58, 1893–1913. [Google Scholar] [CrossRef]
  13. IEC 61373: 2010; International Electro Technical Commission Technical Committee 9. Railway Applications-Rolling Stock Equipment-Shock and Vibration Test. Standards Press of International Electro Technical Commission: Geneva, Switzerland, 2010.
  14. You, T.; Zhou, J.; Gong, D.; Sun, Y.; Li, B.; Chen, J. Synthesis of random vibration environment spectra for the fatigue analysis and optimization of railway vehicles. Int. J. Fatigue 2022, 159, 106752. [Google Scholar] [CrossRef]
  15. Wang, T.; Zhou, J.; Zhou, K.; Gong, D.; Zhang, Z. A preliminary study on generation of axle box vibration spectra for metro vehicles in China using the developed spectral synthesis method. Int. J. Rail Transp. 2025, 13, 578–596. [Google Scholar] [CrossRef]
  16. Wang, T.; Sun, W.; Wang, Q.; Zhang, Z.; He, Y.; Zhou, J. Generation of vibration load spectrum for fatigue analysis of equipment mounted on bogie frame of railway vehicle based on fatigue damage spectrum. Proc. Inst. Mech. Eng. Part F J. Rail Rapid Transit 2023, 237, 1082–1093. [Google Scholar] [CrossRef]
  17. Deng, C.; Zhou, J.; Sun, W.; Gong, D.; Sun, Y. Analysis of the spectral induction and hierarchical transmissibility for railway vehicles’ measurement vibration environment. Veh. Syst. Dyn. 2021, 59, 1587–1606. [Google Scholar] [CrossRef]
  18. Gong, D.; Zhou, J.; Sun, W. On the resonant vibration of a flexible railway car body and its suppression with a dynamic vibration absorber. J. Vib. Control 2013, 19, 649–657. [Google Scholar] [CrossRef]
  19. Tomioka, T.; Takigami, T.; Suzuki, Y. Numerical analysis of three-dimensional flexural vibration of railway vehicle car body. Veh. Syst. Dyn. 2006, 44 (Suppl. S1), 272–285. [Google Scholar] [CrossRef]
  20. Ling, L.; Zhang, Q.; Xiao, X.; Wen, Z.; Jin, X. Integration of car-body flexibility into train–track coupling system dynamics analysis. Veh. Syst. Dyn. 2018, 56, 485–505. [Google Scholar] [CrossRef]
  21. Dao, G.; Youhong, S.; Guangyu, L.; Zegen, W.; Xin, D.; Weiguang, S.; Qiushi, W.; Tengfei, W.; Yuanjin, J.; Kai, Z.; et al. Frequency veering between car body and under-chassis equipment of railway vehicles in vertical bending mode. Mech. Syst. Signal Process. 2023, 185, 109768. [Google Scholar] [CrossRef]
  22. Dumitriu, M.; Dihoru, I. Influence of bending vibration on the vertical vibration behaviour of railway vehicles carbody. Appl. Sci. 2021, 11, 8502. [Google Scholar] [CrossRef]
  23. Liu, C.; Lai, S.; Ni, Y.; Chen, L. Dynamic modelling and analysis of a physics-driven strategy for vibration control of railway vehicles. Veh. Syst. Dyn. 2025, 63, 1080–1110. [Google Scholar] [CrossRef]
  24. Nitish Singh, A. Dynamic modeling and ride comfort evaluation of railway vehicle under random track irregularities: A case study of a Linke-Hofmann-Busch coach. J. Eng. Res. 2024, 12, 984–993. [Google Scholar] [CrossRef]
  25. De Rosa, A.; Kulkarni, R.; Qazizadeh, A.; Berg, M.; Di Gialleonardo, E.; Facchinetti, A.; Bruni, S. Monitoring of lateral and cross level track geometry irregularities through onboard vehicle dynamics measurements using machine learning classification algorithms. Proc. Inst. Mech. Eng. Part F-J. Rail Rapid Transit 2021, 235, 107–120. [Google Scholar] [CrossRef]
  26. Dirlik, T. Application of Statistical Concepts to Fatigue Damage. Ph.D. Thesis, University of Warwick, Coventry, UK, 1985. [Google Scholar]
  27. Zorman, A.; Slavič, J.; Boltežar, M. Vibration fatigue by spectral methods-A review with open-source support. Mech. Syst. Signal Process. 2023, 190, 110149. [Google Scholar] [CrossRef]
Figure 1. Flexible carbody and underfloor equipment’s vertical flexible coupling mechanical model: (a) carbody and equipment coupling; (b) carbody load.
Machines 13 00628 g001
Figure 2. Measurement points for traction transformer vibration acceleration.
Machines 13 00628 g002
Figure 3. Measurement points for traction converter vibration acceleration.
Machines 13 00628 g003
Figure 4. Vibration spectra at measurement points corresponding to different underfloor equipment: (a) longitudinal direction; (b) lateral direction; (c) vertical direction.
Machines 13 00628 g004
Figure 5. RMS values at measurement points corresponding to underfloor equipment at different speeds: (a) longitudinal direction; (b) lateral direction; (c) vertical direction.
Machines 13 00628 g005
Figure 6. PDF analytics in the triaxial direction at the carbody measurement points corresponding to underfloor equipment at different speeds: (a) longitudinal direction; (b) lateral direction; (c) vertical direction.
Machines 13 00628 g006
Figure 7. Frequency response graph.
Machines 13 00628 g007
Figure 8. Rainflow counting graph.
Machines 13 00628 g008
Figure 9. Fatigue damage graph.
Machines 13 00628 g009
Disclaimer/Publisher’s Note: The statements, opinions and data contained in all publications are solely those of the individual author(s) and contributor(s) and not of MDPI and/or the editor(s). MDPI and/or the editor(s) disclaim responsibility for any injury to people or property resulting from any ideas, methods, instructions or products referred to in the content.

