Article

Dynamic Correction of Preview Weighting in the Driver Model Inspired by Human Brain Memory Mechanisms

1
State Key Laboratory of Intelligent Vehicle Safety Technology, Chongqing 401133, China
2
Key Laboratory of Optoelectronic Technology and Systems of Ministry of Education, College of Optoelectronic Engineering, Chongqing University, Chongqing 400044, China
*
Author to whom correspondence should be addressed.
These authors contributed equally to this work.
Machines 2025, 13(7), 617; https://doi.org/10.3390/machines13070617
Submission received: 19 June 2025 / Revised: 9 July 2025 / Accepted: 15 July 2025 / Published: 17 July 2025
(This article belongs to the Special Issue Advances in Autonomous Vehicles Dynamics and Control, 2nd Edition)

Abstract

Driver models, which provide mathematical or computational representations of human driving behavior, are crucial for intelligent driving systems by enabling stable and repeatable operations. However, existing models typically employ fixed weighting parameters to simulate preview delay, failing to reflect individual driver differences and real-time dynamic behaviors. This paper proposes a Brain-Memory Driver Model (BMDM) that emulates human brain memory mechanisms to dynamically adjust preview weights by integrating global path curvature, real-time vehicle speed, and steering torque. This emulation involves a three-stage process: capturing data in an Instantaneous Memory (IM) region, filtering data via a forgetting mechanism in a Short-Time Memory (STM) region to reduce scale, and retaining data based on correlation strength in a Long-Time Memory (LTM) region for persistent mining. By deploying a trained behavioral memory database, the model dynamically calibrates preview weights based on the driver’s state and real-time curvature variations under different road conditions. This enables the model to more accurately simulate authentic preview characteristics and improves its adaptability. Simulation results from an automated steering case study demonstrate that the improved model exhibits control performance closer to the real driving process, reproducing authentic steering behavior within the human–vehicle–road closed-loop system from an intelligent biomimetic perspective.

1. Introduction

In recent years, human–machine cooperative driving technology has been advancing rapidly. During its development, real driver-simulator experiments provide reliable data support but are time-consuming and resource-intensive [1,2,3]. Moreover, uncertainties in test subjects can pose intractable technical challenges. To enhance efficiency and reduce resource demands, researchers often employ driver models to replace actual driver control behaviors, enabling rapid offline algorithm iteration [4,5], thus significantly lowering the human and material costs of real driver-simulator trials.
Driver models, based on modeling strategies, are categorized into control theory-based and data mining-based types [6,7]; based on control dimensions, they include longitudinal, lateral, and combined longitudinal–lateral models [8,9]. Among these, lateral driver models hold significant research value in autonomous driving and human–machine co-driving. The first widely adopted model across various system developments was an optimal curvature preview model predicting lateral errors [10]. Subsequently, the near-far two-point perspective model emerged and has been extensively applied in lateral steering strategy development [11,12]. A cognition-time delay-arm neuromuscular model, rooted in real driver physiological traits, has also been integrated into driver models, enhancing their naturalness and interpretability through steering torque feedback and weighted visual studies [13].
To improve tracking performance, advanced control strategies—starting from the initial optimal control model [14]—such as an improved PID algorithm [15], LQR-based algorithms [16], MPC algorithms [17], adaptive control algorithms [18], and fuzzy control algorithms [19] have been progressively incorporated into driver models. However, purely control theory-based models often lack the ability to simulate driver preview and personalized characteristics. Data mining-based learning models simplify traditional physical modeling complexity via end-to-end computation but require extensive real driving data for training to construct predictive behavioral models. Researchers have leveraged learning methods to address the highly nonlinear nature of driver behavior, proposing personalized models for lane departure and lane-keeping using Gaussian mixture and hidden Markov models. These enabled the development of online predictive algorithms for forecasting vehicle trajectories and detecting lane-change intent [20]. Additionally, a personalized model handling non-Gaussian and bounded natural driving data was proposed and applied [21], successfully realizing a tailored driver model for haptic-shared ADAS systems via machine learning algorithms [22].
While both strategies yield effective models reflecting real driver behavior, control theory-based modeling struggles to capture advanced cognitive abilities arising from uncertainty and individual driving environments, whereas data mining-based modeling lacks clarity in the physical meaning of learned parameters. Hybrid approaches combining these strategies are emerging [13,23]. Integrating the Brain Emotional Learning Circuit Model (BELCM) with the two-point preview model incorporates emotional regulation, simulating driver emotional perception and decision-making in complex traffic, yielding a decision model closer to human behavior [24]. Trajectory prediction of driver intent using Extended State Observers (ESO) and Long-Short Time Memory (LSTM) networks, combined with dynamic load allocation and control weight adjustments, simulates driver behavior across varying conditions [25].
Furthermore, another burgeoning research direction for enhancing driver model anthropomorphism is the integration of the driver’s real-time emotional state into the control loop, a field that has shown significant promise. Studies have systematically evaluated how in-car feedback, using modalities like light, sound, and vibration, can help regulate driver emotions detected via facial analysis [26]. Other advanced approaches have even utilized non-contact physiological sensing, such as functional infrared imaging, to assess a user’s affective state and enable an agent to adapt its behavior in real time [27]. While these emotion-centric models offer a valuable path toward more human-like systems, the present study focuses on a complementary cognitive dimension: the role of memory and learned experience in dynamic adaptation.
While these hybrid approaches represent a significant step forward, they often treat the driver’s cognitive processing as a ‘black box.’ They excel at learning complex input–output relationships but do not explicitly model the underlying cognitive mechanism of how a human driver filters vast amounts of transient sensory data to form a stable, long-term behavioral knowledge base. Consequently, they may lack a structured framework for systematically distinguishing critical information from redundant data in real-time. This leaves a gap in modeling the progressive, multi-stage process of information filtering, abstraction, and memory consolidation that is fundamental to human learning and adaptation in driving.
Addressing these challenges, this paper proposes a BMDM for dynamic correction of parameters in the two-point preview model. Hierarchical processing mechanisms, previously explored in structural health monitoring [28,29], are integrated here, enabling control theory-based modeling to precisely depict driver control behavior with robust system stability and performance guarantees. Simultaneously, it leverages data mining’s strength in handling complex nonlinear and dynamic driving behaviors, learning and capturing personalized driver traits from extensive data to meet diverse needs. The resulting high-fidelity model is thus intended to serve as a robust virtual driver to streamline the offline validation and iteration of human–machine cooperative strategies.The main contributions of this paper are summarized as follows:
(1) A novel driver model framework, the Brain-Memory Driver Model (BMDM), is proposed, inspired by the multi-stage processing of human memory. This structured approach, emulating Instantaneous, Short-Time, and Long-Time Memory (IM-STM-LTM), provides a transparent mechanism for information filtering and consolidation, overcoming the limitations of conventional black-box models.
(2) A dynamic weighting correction mechanism for the two-point preview model is developed. By leveraging real-time road curvature, vehicle speed, and steering torque, this mechanism allows the model to continuously adapt to changing conditions, significantly enhancing the personalization and biomimetic fidelity of the simulated driving behavior.
This paper is organized as follows. Section 2 presents the theoretical foundation and overall architecture of the proposed model, including the vehicle dynamics and the underlying two-point preview driver model. Section 3 provides a detailed explanation of the core innovation: the implementation of the three-stage human brain memory mechanism. Section 4 describes the experimental validation conducted on a semi-physical simulation platform, presenting a comparative performance analysis of the BMDM against traditional and human–driver benchmarks. Finally, Section 5 summarizes the conclusions and contributions of this work.

2. Theoretical Foundation and Model Construction

2.1. Overall Model Architecture

The overall architecture of the BMDM proposed in this paper, inspired by human brain memory mechanisms, is illustrated in Figure 1. The model comprises three core components: the preview steering reference acquisition module, the neuromuscular system, and the human brain memory mechanism. These components interact synergistically to optimize the driver model’s performance.
The preview steering reference acquisition module is tasked with extracting critical information from the traffic environment. Supported by a two-point preview model, it captures both near and far visual cues, enabling a comprehensive assessment of upcoming road conditions. The extraction of preview features is influenced by reaction latency, representing the cognitive processing time required by the brain prior to executing steering adjustments. The extracted visual data are subsequently transformed into executable steering control inputs via a steering conversion mechanism, effectively translating the driver’s visual perception into appropriate control actions.
Following the steering conversion process, the neuromuscular system plays a pivotal role in converting cognitive decisions into physical responses. This system accounts for the biomechanical properties of human muscle activation and the feedback mechanisms of the nervous system, ensuring smooth and adaptive steering behavior. Steering commands generated by the neuromuscular system are then transmitted to the vehicle through the steering gear ratio, determining the precise magnitude and manner of the mechanical response.
A key innovation of this study is the introduction of a human brain memory mechanism, which processes and stores critical driving data through three sequential stages: IM, STM, and LTM. The IM stage captures and retains immediate response data during driving. The STM stage employs a forgetting mechanism to eliminate redundant information, reducing data dimensionality and computational load. Finally, the LTM stage preserves highly correlated data in a long-time memory repository, providing a foundation for predicting and decision-making in subsequent driving scenarios. By comprehensively utilizing curvature data from the global reference path, real-time vehicle speed, and steering wheel torque, the model achieves dynamic correction of the preview module. The BMDM, emulating human brain memory mechanisms, continuously updates its memory database during real-time driving and adaptively adjusts weighting parameters—such as preview time or steering gain—based on varying road conditions and driver states.
Through this dynamic adjustment strategy, the BMDM can more precisely simulate the driver’s instantaneous response process, particularly in complex and dynamic driving environments. When significant fluctuations occur, the model retrieves historical data from the LTM repository for comparison with similar scenarios, adaptively tuning the preview parameters. This approach enables effective adaptation to individual driver differences to a certain extent while enhancing the stability and performance of intelligent driving systems. By integrating the preview steering reference acquisition module, the neuromuscular system, and the human brain memory mechanism, BMDM demonstrates significant advantages in the accuracy and robustness of anthropomorphic driver modeling.

2.2. Vehicle Dynamics Model

For the lateral motion problem in human–machine cooperative control, constructing a dynamics model that accurately describes the vehicle’s position and motion state is essential. As shown in Figure 2, this paper adopts the classical linear bicycle dynamics model [30], which offers high precision when tire forces remain within the linear region. To simplify the modeling process and reduce the computational burden of control algorithms, the following assumptions are obtained based on practical conditions: the vehicle exhibits symmetric dynamic characteristics [31]; the sideslip angles of tires on the same axle are equal and small [32]; vehicle roll and pitch dynamics are neglected [33]; and longitudinal speed variations are assumed to be gradual [34]. Ultimately, based on the Newton–Euler theorem, the lateral dynamics can be expressed by the following differential equations.
m v x ( β ˙ + φ ˙ ) = F x f sin ( δ f ) + F y f cos ( δ f ) + F y r I z φ ¨ = l f F x f sin ( δ f ) + F y f cos ( δ f ) l r F y r
where m represents vehicle mass; x and y denote the longitudinal and lateral displacements of the vehicle, respectively; v x is the longitudinal vehicle speed; φ is the vehicle heading angle; φ ˙ is the yaw rate; φ ¨ is the yaw angular acceleration; β is the centroid sideslip angle; δ f is the front wheel steering angle; l f and l r are the distances from the front and rear axles to the centroid, respectively; F x f is the longitudinal force on the tire; F y f and F y r are the lateral forces on the front and rear wheels, respectively; and I z is the moment of inertia about the vertical axis.
Assuming δ f is small and the lateral forces of the front and rear wheels are proportional to their sideslip angles [35], the vehicle lateral dynamics can be further simplified as follows:
m v x ( β ˙ + φ ˙ ) = F y f cos δ f + F y r I z φ ¨ = l f F y f l r F y r
F y f = 2 C f α f F y r = 2 C r α r
where C f and C r represent the cornering stiffness of the front and rear wheels, respectively; α f and α r are the sideslip angles of the front and rear wheels, defined as the angle between the tire’s motion trajectory and its orientation during ground rolling, expressed as follows:
α f = β + l f φ ˙ v x δ f α r = β l r φ ˙ v x
By combining the above equations, the lateral dynamics model of the vehicle is derived as follows:
x ˙ = A x + B u y = C x
where the system state variable is x = y φ β φ ˙ T the system input is the front wheel steering angle, i.e., u = δ f and the output is the lateral position y. The specific expressions for the matrix A, B, and C are given below:
A = 0 v x v x 0 0 0 0 1 0 0 2 C f + 2 C r m v x 2 l f C f 2 l r C r m v x 2 1 0 0 2 l f C f 2 l r C r I z 2 l f 2 C f + 2 l r 2 C r I z v x , B = 0 0 2 C f m v x 2 l f C f I z , C = 1 0 0 0
In the context of this simulation-based study, all state variables required by the model are assumed to be directly available from the high-fidelity CarSim simulation environment. For a real-world application, these states would be obtained through onboard sensors or by using a state observer.

2.3. Driver Model

The comprehensive human driving process is often conceptualized in four key stages: perception, decision-making, path planning, and control [36]. The driver model developed in this paper focuses specifically on the path-tracking task, where ‘decision-making’ is simplified to the intent to follow a given lane, and ‘path planning’ is implicitly handled by providing a pre-defined reference trajectory. To characterize driver operational behavior within this framework, this paper integrates a two-point preview driver model with a vehicle dynamics model [37]. The model’s objective is typically regarded as a path-tracking controller, aimed at minimizing the deviation between the vehicle’s actual and target positions. In this study, the target position is defined by the centerline of the pre-designed test routes, which serves as the reference trajectory for calculating the lateral error.
As depicted in Figure 3, the near and far points are selected as preview points. The near point lies on the lane centerline, while the far point is the tangent point of the lane line at a distant turn. In the figure, L n represents the distance from the vehicle’s centroid to the near point, L f denotes the distance from the vehicle’s centroid to the far point, θ n is the angle between the vehicle’s heading direction and the line connecting the centroid to the near point, θ f is the angle between the vehicle’s heading direction and the line connecting the centroid to the far point, O road indicates the curvature center of the far point, φ L is the vehicle yaw angle deviation (defined as the difference between the vehicle yaw angle φ and the desired road yaw angle φ ref at the near point), and e L represents the lateral position deviation.
Based on the relationships illustrated in Figure 3, the two-point preview model [38] can be expressed as follows:
φ ˙ L = φ ˙ x ˙ ρ r e ˙ L = D n φ ˙ L + x ˙ φ L + y ˙ θ n φ L + e L D n θ f D f R = D f ρ r
where ρ r represents the curvature of the current road, and R denotes the radius of curvature of the current road.
The driver obtains vehicle position information by previewing the near point, with θ n representing the driver’s feedback control behavior. The driver’s control over the vehicle involves a delayed, continuous proportional control and a relatively weak differential control [39]. Proportional-derivative control is applied to θ n to maintain the vehicle’s trajectory near the lane centerline, serving as the input to the visual compensation module G c . By previewing the far point, the driver acquires information about distant road conditions, assessing the curvature ahead to prepare for the vehicle’s next steering action, with θ f representing the driver’s feedforward control behavior, serving as the input to the visual prediction module G p .
The expressions for G c and G p are given as follows: where the proportional gain of the prediction module is K p , the proportional gain of the compensation module is K c , the vehicle speed is v, the compensation rate is T L , and the compensation bandwidth is T I .
G p = K p G c = K c v · T L s + 1 T I s + 1
The process by which the driver perceives deviations in yaw angle and lateral position involves a reaction delay time τ 1 , modeled using a pure delay element e τ 1 s . Additionally, the process from the brain issuing commands to eliminate deviations to their execution by the arm introduces a neuromuscular delay time τ 2 , represented by a first-order lag element 1 τ 2 s + 1 .
Based on the above analysis, as shown in Figure 4, the driver model primarily consists of three components—feedforward, feedback, and neuromuscular dynamics. These components form a closed-loop system where the vehicle’s state dynamically influences the driver’s perceptual inputs, and the resulting steering command from the driver model acts as the control input for the vehicle model.
The target steering wheel angle δ ^ s w can be formulated as follows:
δ ^ s w = e τ 1 s K p θ f ( s ) K c ( T L s + 1 ) v ( T I s + 1 ) θ n ( s )
Typically, the value of τ 1 is much less than 1 s. To enhance the model’s generality, a first-order Taylor approximation is applied as follows:
e τ 1 s 1 τ 1 s
This can be further simplified as follows:
τ 1 δ ^ ˙ s w + δ ^ s w = K p θ f τ 1 θ ˙ f K c v θ n + ( T I T s ) θ ˙ n
In the above equation, θ f , θ n is the input, derived from Equation (6). It is also assumed that the near preview distance D n and far preview distance D f maintain a fixed proportional relationship, and the driver’s preview time T p is defined as follows:
D n = 0.4 D f T p = D f x ˙
By adjusting the preview time, delay time, and steering proportional gain, the driver model in Equation (10) can simulate human drivers with varying steering characteristics. Furthermore, δ ^ s w and δ ^ ˙ s w can be used to represent the driver’s operational and psychological workload, respectively.
The driver’s intent, conveyed through the target steering wheel angle δ ^ s w , is transmitted to the Neuromuscular System (NMS) [40], where it is further converted into torque output T d . As shown in Figure 4, the neuromuscular dynamics component G N a serves as a feedforward torque module, reflecting the internalized stiffness from angle to torque and characterizing the dynamic properties of the steering system, where K r is the proportionality coefficient between torque and angle, and v is the vehicle’s longitudinal speed. The feedback steering module G N f compensates for steering wheel disturbance torques caused by external factors (e.g., uneven road surfaces) by continuously acting on the difference between δ ^ s w and δ s w , where K t is the proportionality factor for steering angle deviation.
G N a = K r · v G N f = K t
In this paper, the NMS is simplified as an arm dynamics model, effectively simulating the mechanical behavior of the driver during steering operations. The proposed driver model assumes that the driver controls vehicle steering by applying torque T d to the steering wheel. The model incorporates self-aligning torque T s to enhance the stability and responsiveness of the steering system, with dynamic adjustments made based on longitudinal speed to accommodate steering demands and vehicle dynamics characteristics at different velocities.
The torque output from the NMS acts on the vehicle’s steering column, a critical component linking the steering wheel to the steering mechanism. When the steering wheel is subjected to the driver’s input torque T d and the self-aligning torque T s —which is the restoring torque from the tires that is primarily dependent on vehicle speed and lateral forces—the steering system produces the actual steering wheel angle δ s w [41]. Neglecting nonlinear effects such as friction torque and backlash, the dynamic equation of the steering system is approximated as follows:
J s δ ¨ s w + B s δ ˙ s w = T d + T s
where J s and B s represent the inertia and damping parameters of the steering system, respectively. Assuming the steering system’s gear ratio is R g , the final steering angle applied to the front wheels is δ f s = R g δ s w .

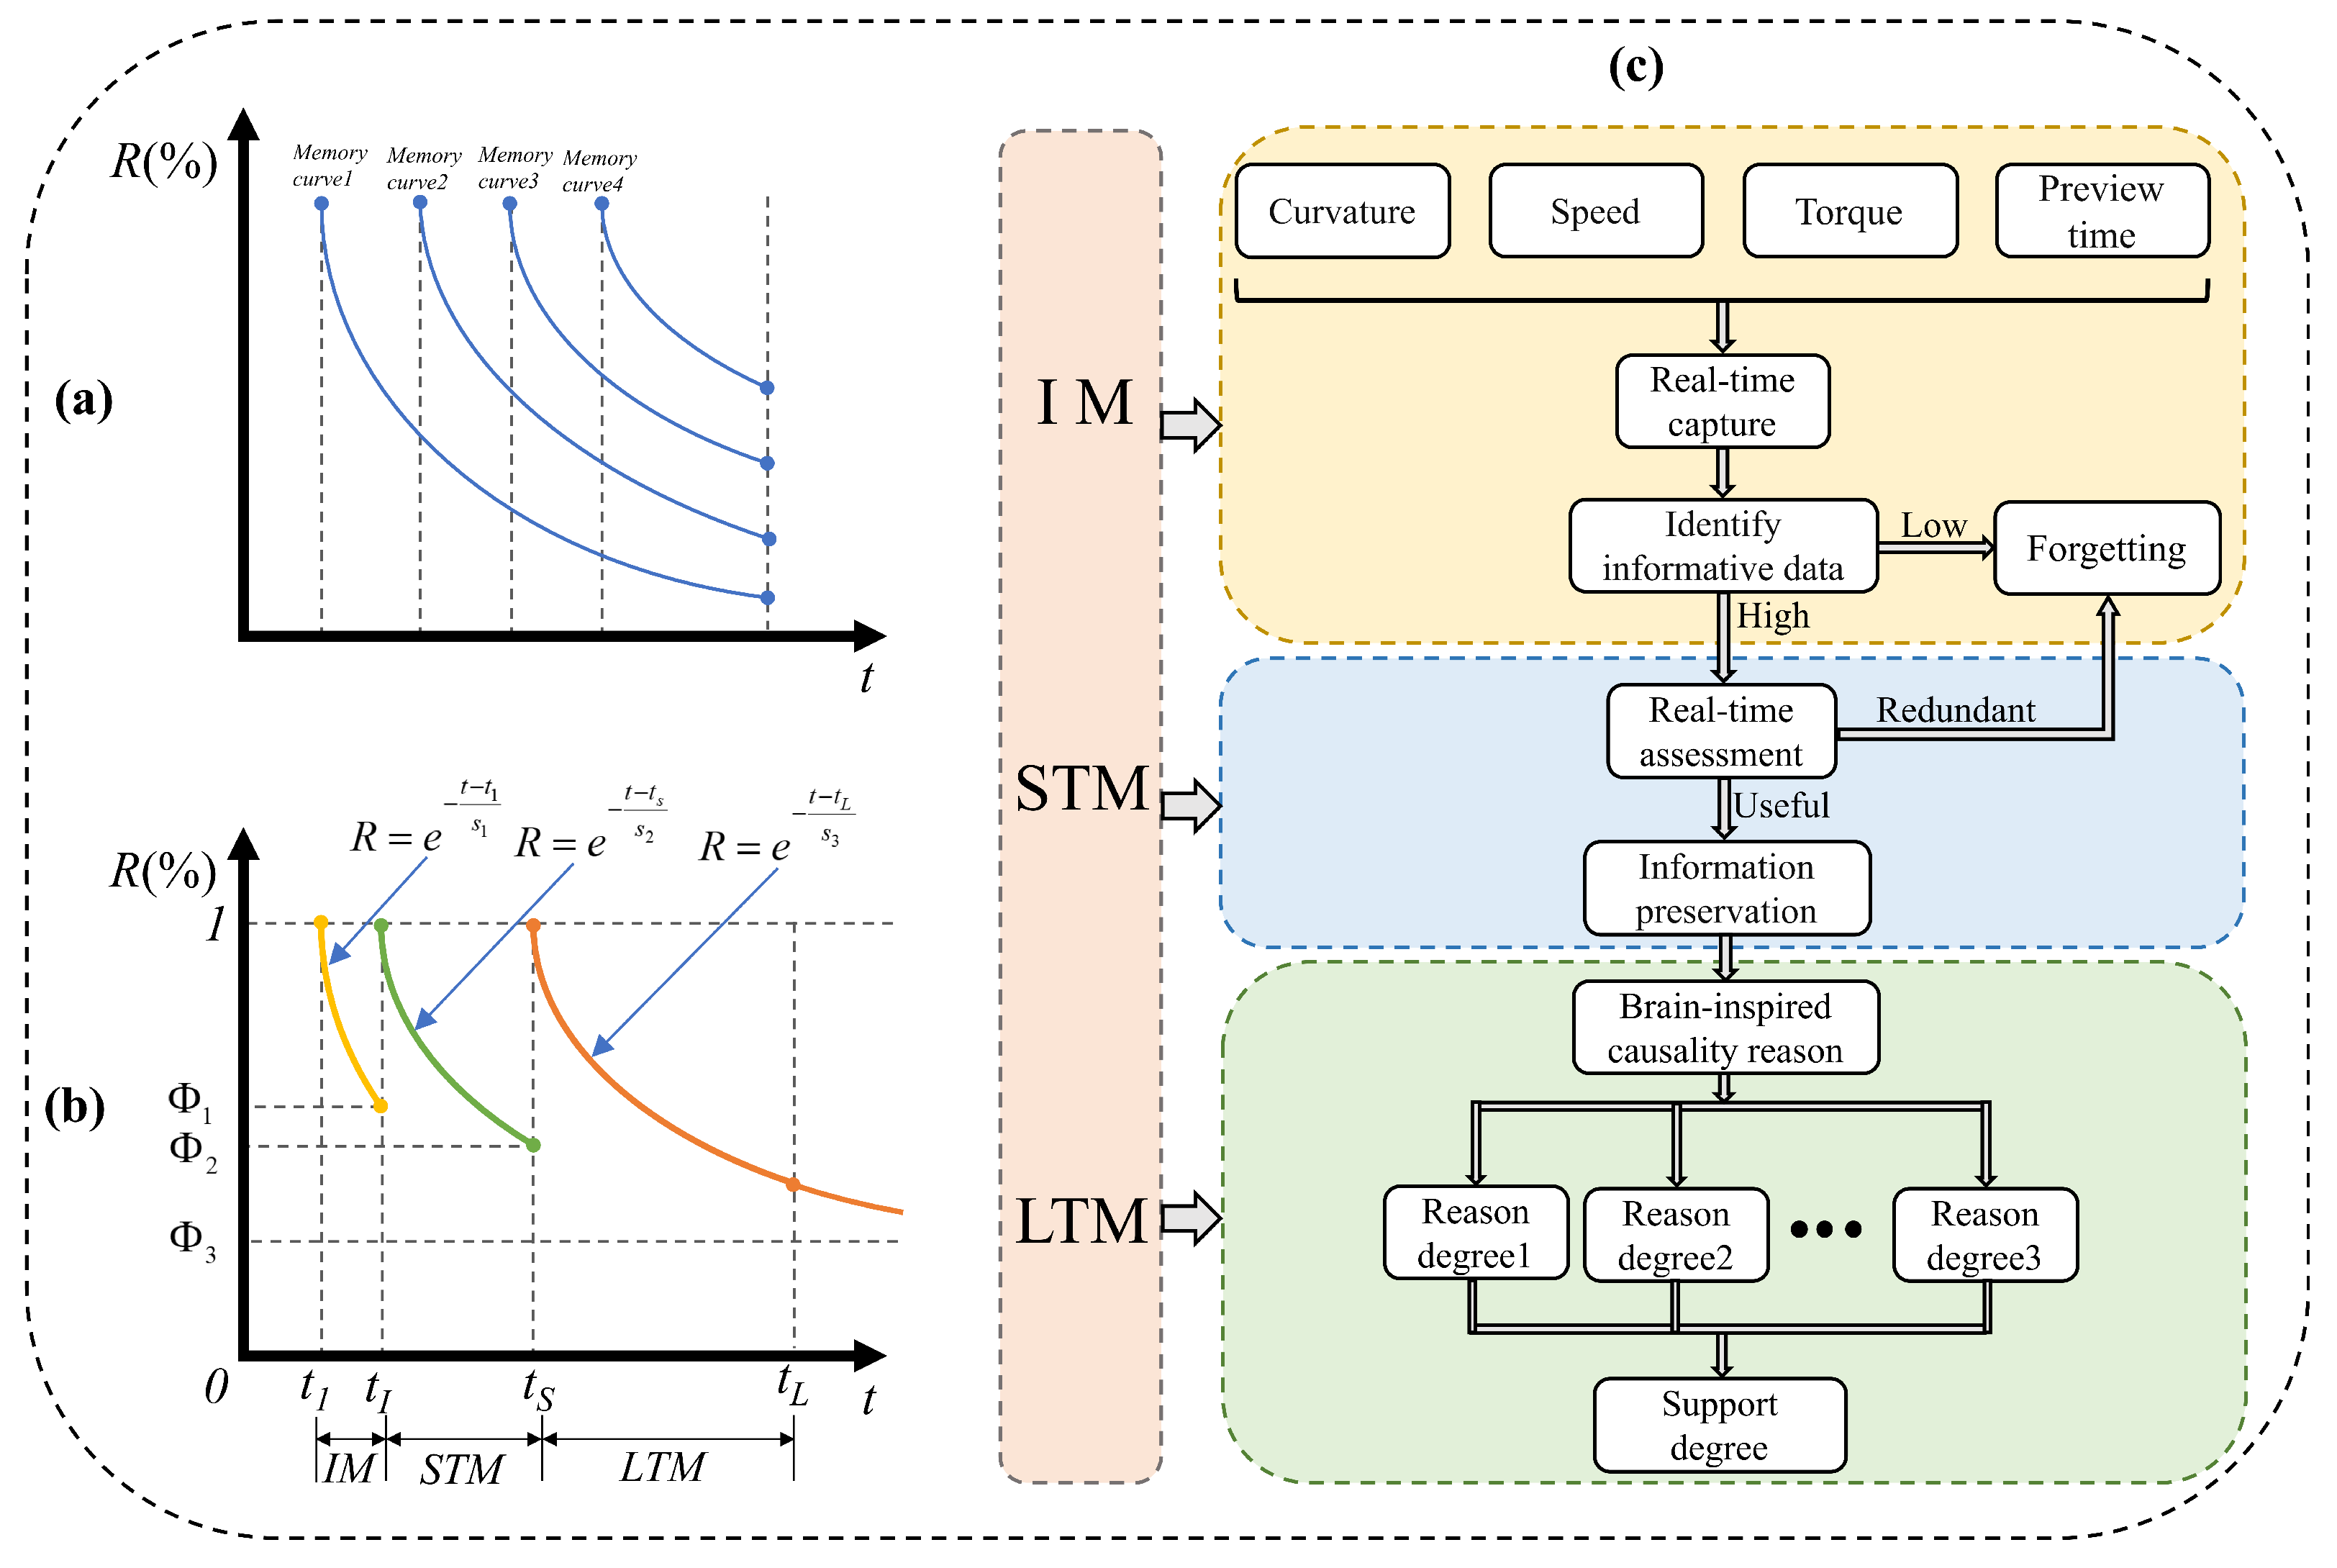
3. Human Brain Memory Mechanism

3.1. Mechanism Overview

The human brain’s memory mechanism is a multi-stage dynamic process for handling external information, characterized by progressive filtering and abstraction over time, with distinct storage functions at each stage. Based on the memory decay pattern revealed by the Ebbinghaus forgetting curve [42], the retention of memory can be expressed by the following equation:
R = e t s
This exponential form is adopted as it is the standard mathematical representation of the Ebbinghaus forgetting curve, a foundational principle in the psychology of memory. It effectively models the nonlinear manner in which memory retention strength diminishes over time. Where R represents memory retention, s is the memory decay coefficient, and t is the time variable. The forgetting model indicates that memory strength decreases exponentially with time, though the temporal trends vary significantly across different memory types [43]. As shown in Figure 5, this pattern divides human memory processing into three regions: IM, STM, and LTM. The IM region captures immediate environmental information, with an extremely brief storage duration on the order of milliseconds; most data decay rapidly or are forgotten, with only information significantly deviating from a threshold or exhibiting high correlation being transferred to the STM region. In the STM region, data undergo further processing, where a forgetting mechanism filters out redundant information, retaining only high-value data to reduce storage and processing demands. The duration of STM is typically longer than that of IM, gradually transitioning to LTM over time. The LTM region is responsible for storing highly correlated, filtered information, which is abstracted into conceptual knowledge upon entry, enabling long-time retention for future use.

3.2. Implementation of Human Brain Memory Mechanism

To accurately simulate the multi-stage memory processing of the human brain within the BMDM, this section elaborates on the specific implementation mechanisms of the three regions. By integrating neuroscience theories on memory encoding, maintenance, and retrieval, the model is designed to efficiently capture, filter, and store complex dynamic information generated during driving. The IM region handles real-time capture of high-frequency data, ensuring immediate responses to environmental changes; the STM region employs forgetting curves and correlation evaluation to effectively filter and compress redundant information; and the LTM region establishes a stable knowledge base, storing highly correlated data to support long-time behavior prediction and model parameter optimization.

3.2.1. IM Data Capture

The IM region is responsible for real-time capture and temporary storage of high-frequency dynamic data generated during driving, providing timely and high-quality inputs for the subsequent STM stage. Inspired by the human sensory system’s immediate response to external stimuli, the IM stage ensures the driver model can rapidly acquire and process instantaneous features of environmental changes and driving behavior. A high-sampling-frequency data capture mechanism is adopted at this stage, achieving millisecond-level temporal resolution to precisely detect transient variations in key driving variables such as road curvature κ , vehicle speed v, steering torque M, and preview time T p . Here, the steering torque M represents the operational torque applied by the driver, corresponding to the driver’s torque output T d from the neuromuscular system model in Section 2.3.
Captured data are organized into a multidimensional matrix, with each row corresponding to a timestamp and each column representing a key variable value, expressed as follows:
D I M = t 1 κ ( t 1 ) v ( t 1 ) M ( t 1 ) T p ( t 1 ) t 2 κ ( t 2 ) v ( t 2 ) M ( t 2 ) T p ( t 2 ) t n κ ( t n ) v ( t n ) M ( t n ) T p ( t n )
where t i denotes the data acquisition timestamp, κ ( t i ) is the road curvature, v ( t i ) is the vehicle speed, M ( t i ) is the steering torque, and T p ( t i ) is the preview time.
The core mechanism of the IM stage involves detecting the rate of change in preview time and calculating Shannon information entropy to identify and filter data with high information content. When the rate of change in preview time d T p d t exceeds a predefined threshold Φ t p , the system records the vehicle speed, road curvature, and steering torque at that moment and computes the information entropy of these variables. This threshold serves to trigger deeper analysis only during significant shifts in driver intention, thus conserving computational resources. Its value was determined empirically from the training data to best capture these events. The detection of the preview time change rate is performed using the following equation:
d T p d t T p ( t + Δ t ) T p ( t ) Δ t
When the condition is as follows:
T p ( t + Δ t ) T p ( t ) Δ t Φ t p
is satisfied, the system records the current values of κ ( t j ) , v ( t j ) , and M ( t j ) , and calculates their information entropy. Shannon information entropy is defined as follows:
H ( X ) = i = 1 n p ( x i ) log p ( x i )
where H ( X ) represents the information entropy of a variable (e.g., κ , v, or M), and p ( x i ) is the probability distribution of the variable X taking the value x i . By computing the information entropy of each key variable, the information content at the current moment can be quantified.
For each recorded data point, a comprehensive information metric I ( t ) is defined as follows:
I ( t ) = α H ( κ ( t ) ) + β H ( v ( t ) ) + γ H ( M ( t ) )
The use of Shannon information entropy is grounded in information theory and provides a principled method for quantifying signal novelty or surprise. In this context, it serves as a robust computational proxy for the brain’s pre-attentive filtering mechanisms, which prioritize unexpected and informative stimuli for further cognitive processing. Where α , β , and γ are weighting coefficients used to balance the contributions of each variable to the comprehensive information metric. These coefficients balance the relative importance of road curvature, vehicle speed, and steering torque in defining an informative event. Their values were set based on a parameter sensitivity analysis to reflect the stronger influence of curvature and torque on driver preview behavior compared to speed. The calculation of I ( t ) comprehensively accounts for variations in road curvature, vehicle speed, and steering torque, ensuring a thorough assessment of information content.
When the comprehensive information metric I ( t ) exceeds a predefined threshold Φ I M , the function of Φ I M is to filter out low-information data at the initial stage. It was calibrated through preliminary testing to achieve a balance between data reduction and the preservation of critical driving events. The current data segment is deemed high-priority and requires further processing:
Priority ( I ( t ) ) = High if I ( t ) Φ I M Low otherwise
This entropy-based prioritization method enhances the accuracy of data filtering, ensuring that data segments with high information content are preferentially transferred to the STM region, thereby optimizing resource allocation for subsequent memory processing. The IM stage segments and caches data using fixed time windows, treating each 10-ms interval as an independent window to process continuous data into discrete blocks. This segmentation strategy preserves the temporal sequence of the data while significantly improving processing efficiency and real-time performance.

3.2.2. STM Data Filtering

The STM region in the BMDM is responsible for filtering and compressing real-time dynamic data transferred from the IM region. The STM stage is designed to emulate the human brain’s short-time memory capability for preliminary information processing and filtering. Its primary objective is to employ a forgetting mechanism and correlation assessment to retain only high-value data closely relevant to the current driving task, providing high-quality inputs for the LTM region. This process effectively reduces the data processing burden, enhancing the model’s responsiveness, accuracy, and adaptability to critical driving behaviors.
The core mechanism of the STM stage is based on the memory curve in Equation (14), incorporating a time-decay model to simulate the natural decay of information in human short-time memory over time. In this equation, determines the rate of memory decay, with a smaller indicating a shorter retention duration in STM, consistent with the limited capacity of human short-time memory.
To simulate the progressive data filtering process, the STM stage defines a time window t 1 , t s , where t 1 is the starting time of the STM phase, and t s is the transition point from short-time to long-time memory. The memory retention within this time window is calculated using the following formula:
R S T M = e ( t t 1 ) s 1
In this model, the short-time memory decay coefficient s 1 is set to be positively correlated with the comprehensive information metric I ( t ) of the corresponding data segment, ensuring that information deemed more significant by the IM stage is forgotten more slowly. To determine whether data should be retained, the STM stage establishes a retention threshold, denoted as Φ S T M . This threshold directly controls the rate of data compression and was empirically tuned to achieve a significant but reasonable level of data reduction, ensuring that only data with high relevance survives for long-term storage. The specific data reduction performance achieved by this tuning is quantitatively detailed in the experimental analysis in Section 4.3. The value of Φ S T M is computed as follows:
Φ S T M = e ( t s t 1 ) s 1 t s t 1 = Δ T S T M = s 1 ln Φ S T M
When the memory retention R S T M for a given time segment exceeds the threshold Φ S T M , the data are classified as high-priority and retained; otherwise, they are deemed low-priority and discarded. The filtered high-priority data are stored in a structured multidimensional matrix, significantly reducing the volume of data for subsequent processing while preserving high relevance and value.
The STM’s filtering and retention mechanism integrates closely with information management and the LTM region, forming a synergistic memory processing system. The IM region captures high-frequency data, while the STM region efficiently reduces data volume through forgetting and correlation-based filtering, ensuring that inputs to the LTM region are both highly relevant and non-redundant. This enhances the overall model’s processing efficiency and decision-making accuracy.

3.2.3. LTM Data Storage

LTM region in the BMDM stores highly correlated data filtered by the STM stage, supporting subsequent driver behavior modeling and parameter correction. Inspired by the human brain’s capacity for persistent storage and complex association, this stage constructs a stable, efficient knowledge base for historical data extraction, analysis, and correlation.
In the LTM stage, modeling aims to establish plausible causal associations, with the correlation between road curvature, vehicle speed, steering torque, and preview time as the core of data storage. The cause event set C = { c 1 , c 2 , , c u } and effect event set Z = { z 1 , z 2 , , z m } are defined, where C i includes variables like road curvature κ ( t ) , vehicle speed v ( t ) , and steering torque M ( t ) , while Z j includes dynamic changes in preview time T p ( t ) . A correlation between cause event C i and effect event Z j is denoted as C i Z j . To quantify this association, a causal association index σ i j is defined as follows:
σ i j = k 1 t h t q e t s d t + k 2 t q t h t q t p + k 3 R h r ( t h )
Here, k 1 , k 2 , and k 3 are coefficients adjusting term weights. These coefficients are critical for tuning the causality model. k 1 weighs the influence of stimulus duration, k 2 weighs temporal proximity, and k 3 weighs direct activity correlation. Their values were determined empirically to ensure the model’s output best matched the causal relationships observed in the human driver training data. t p and t q are the start and end times of the cause event; s is the forgetting parameter controlling time decay; R h is the memory retention of Z j ; and r ( t h ) is the memory retention of C i at time t h , r ( t h ) given by the following:
r ( t h ) = e t h s · k 1 t h t q e t s d t
The first term captures the time accumulation of C i on Z j , the second reflects time overlap, and the third measures activity correlation between Z j and C i . By integrating time decay, overlap, and activity ratio, σ i j accurately reflects the overall impact of C i on Z j . This formulation serves as a heuristic model designed to synthesize key principles of associative learning into a single, quantifiable metric. It moves beyond simple correlation by integrating the influence of stimulus duration, the principle of temporal contiguity, and direct activity correlation, providing a more holistic and cognitively plausible measure of the association’s strength.
The knowledge base stored in the LTM is actively utilized to dynamically optimize the driver model. Specifically, key parameters at both the cognitive and neuromuscular levels are adaptively calibrated. At the cognitive level, the model adjusts the preview time T p and the predictive gain K p to adapt the driver’s visual-predictive strategy to different road conditions. At the neuromuscular level, the steering feedback gain K t from Equation (12) is modulated to reflect changes in the driver’s physical response, such as arm stiffness. The update mechanism operates as follows: when the model encounters a new driving state, defined by the real-time vector of [ κ ( t ) , v ( t ) , M ( t ) ], it queries the LTM to find stored antecedent events C i that are most similar to the current state. The new parameter values are then calculated as a weighted average of the parameter values associated with these retrieved historical scenarios. The weights used in this average are determined by the strength of the stored causal associations σ i j , giving greater influence to past scenarios with stronger, more reliable learned relationships. This inference process allows the model to continuously leverage its stored experience to adapt its behavior to the current driving environment.
It should be noted that while the architecture of the memory mechanism is conceptually grounded in cognitive science, all operational parameters and thresholds throughout the IM, STM, and LTM stages were determined empirically through data-driven tuning. This process ensures the model’s behavior is calibrated to optimally reflect the characteristics observed in the collected human driver data.

4. Experimental and Discussion

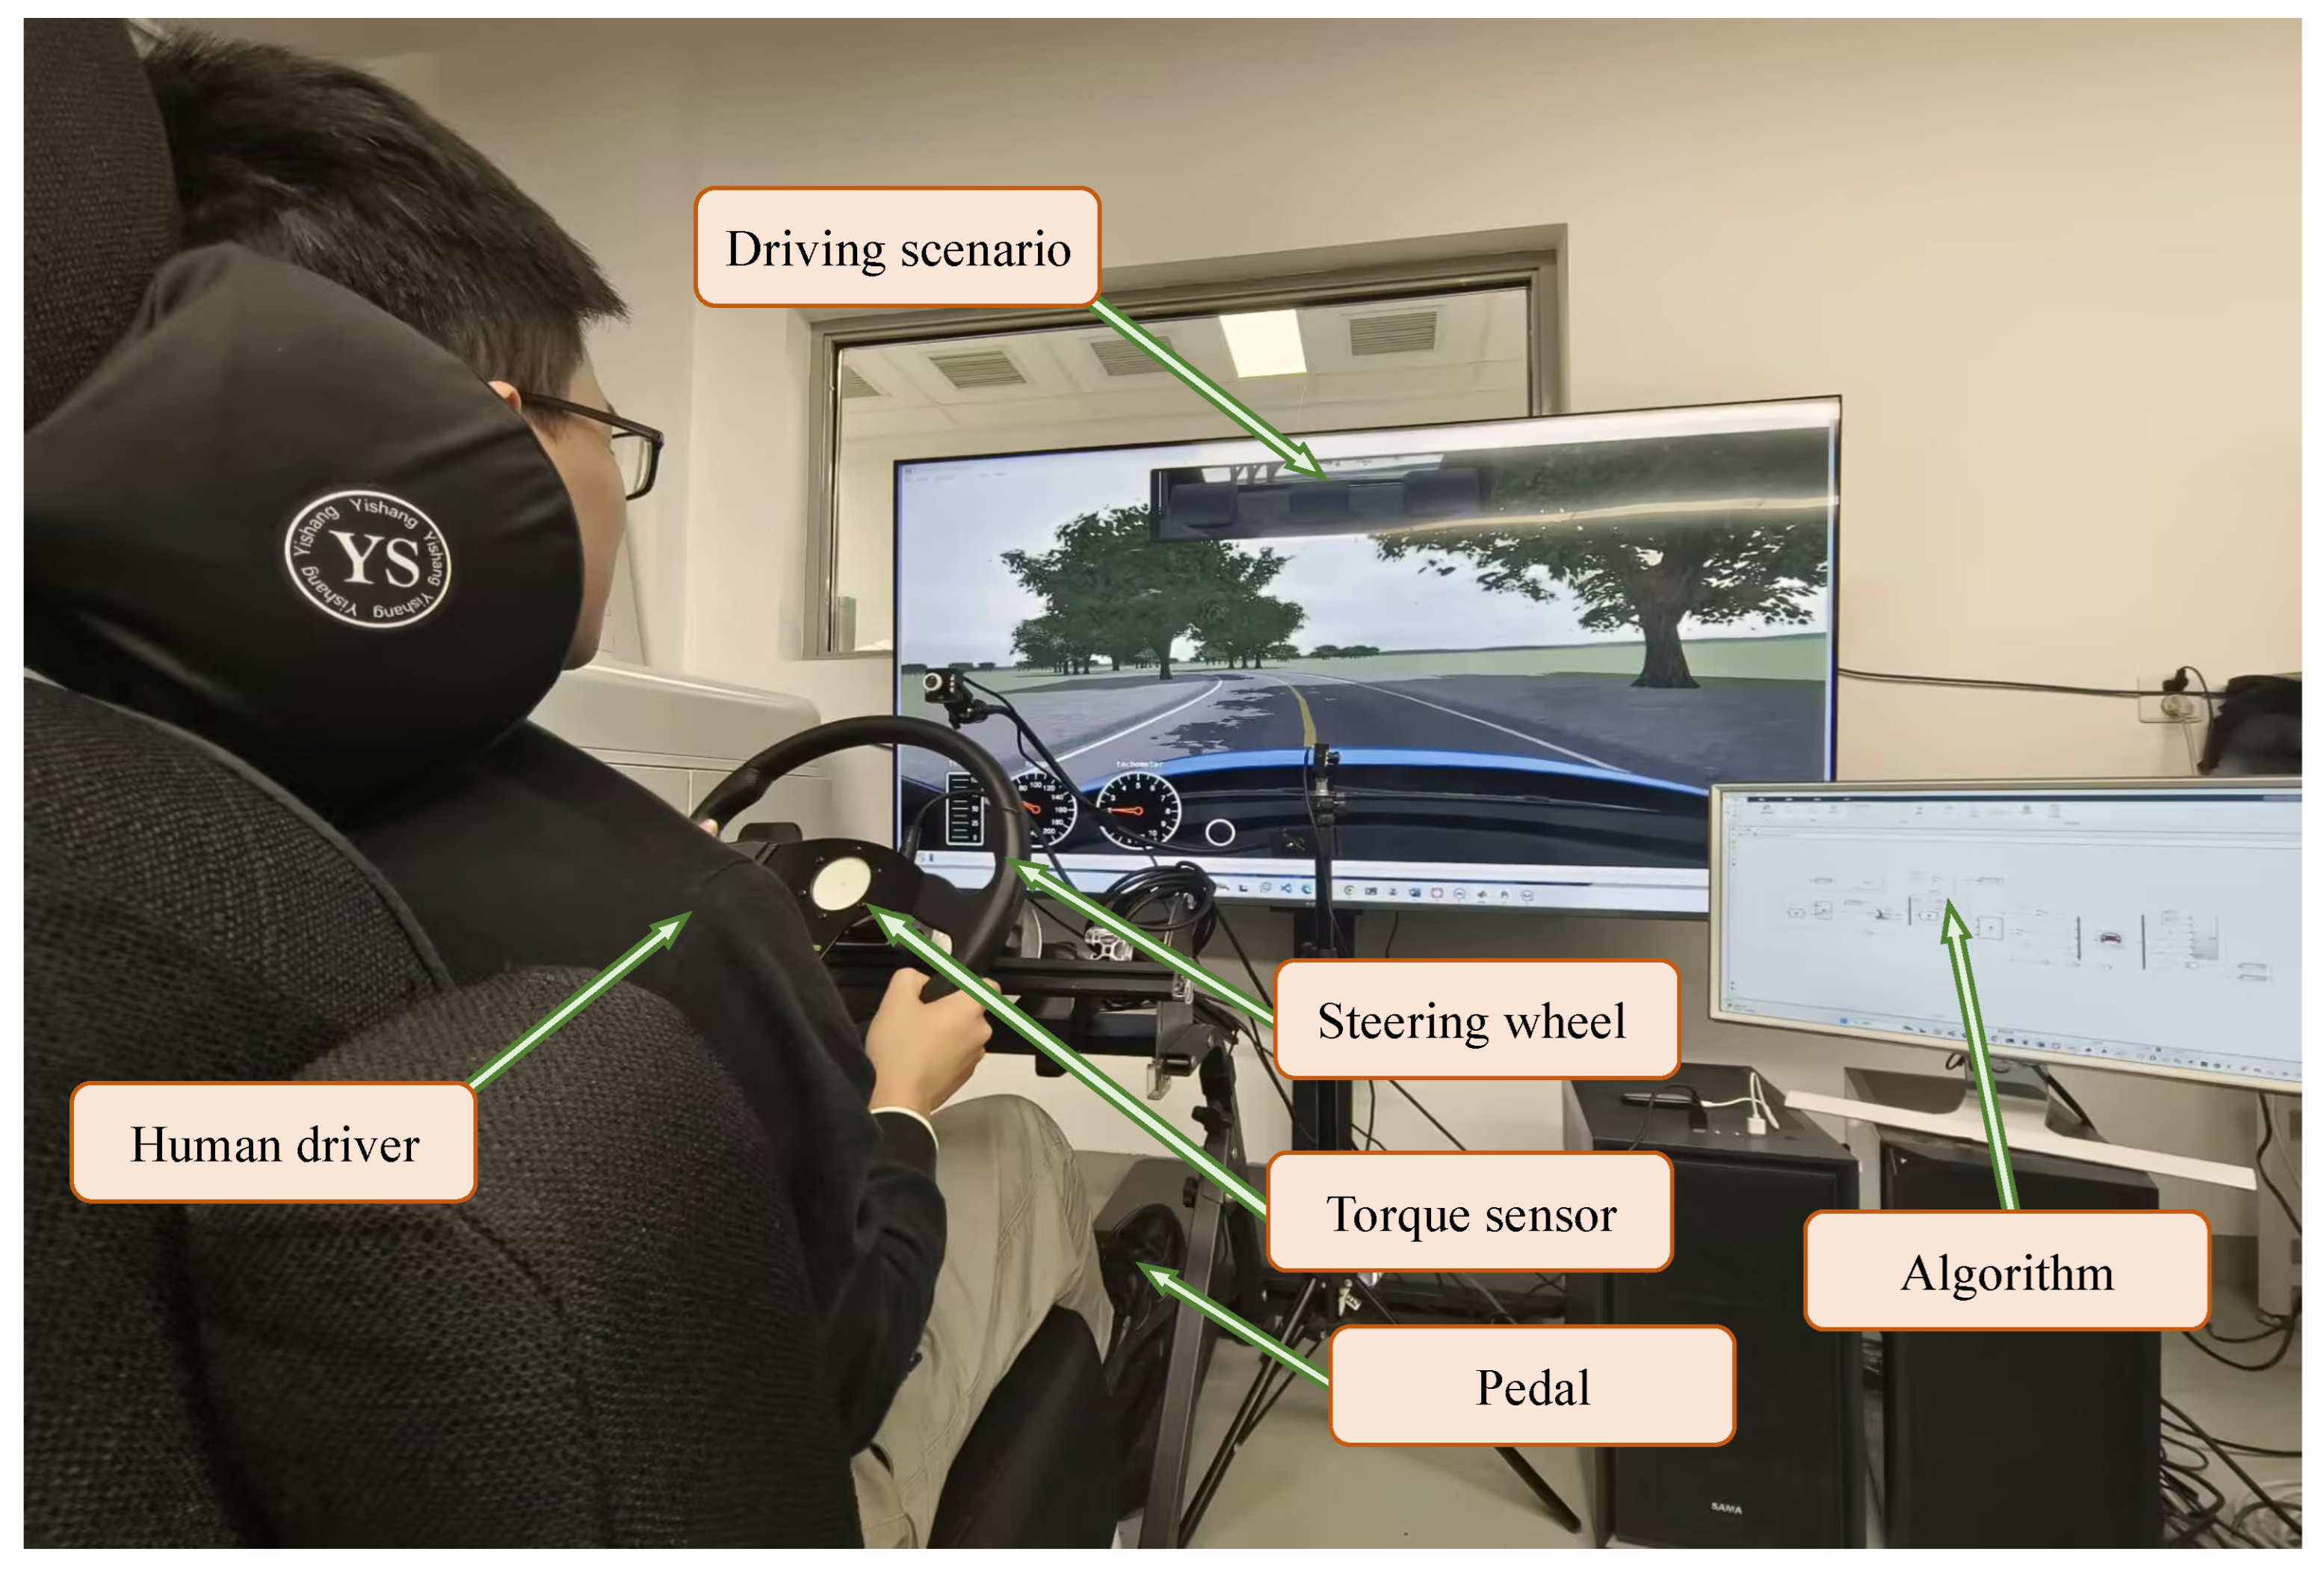
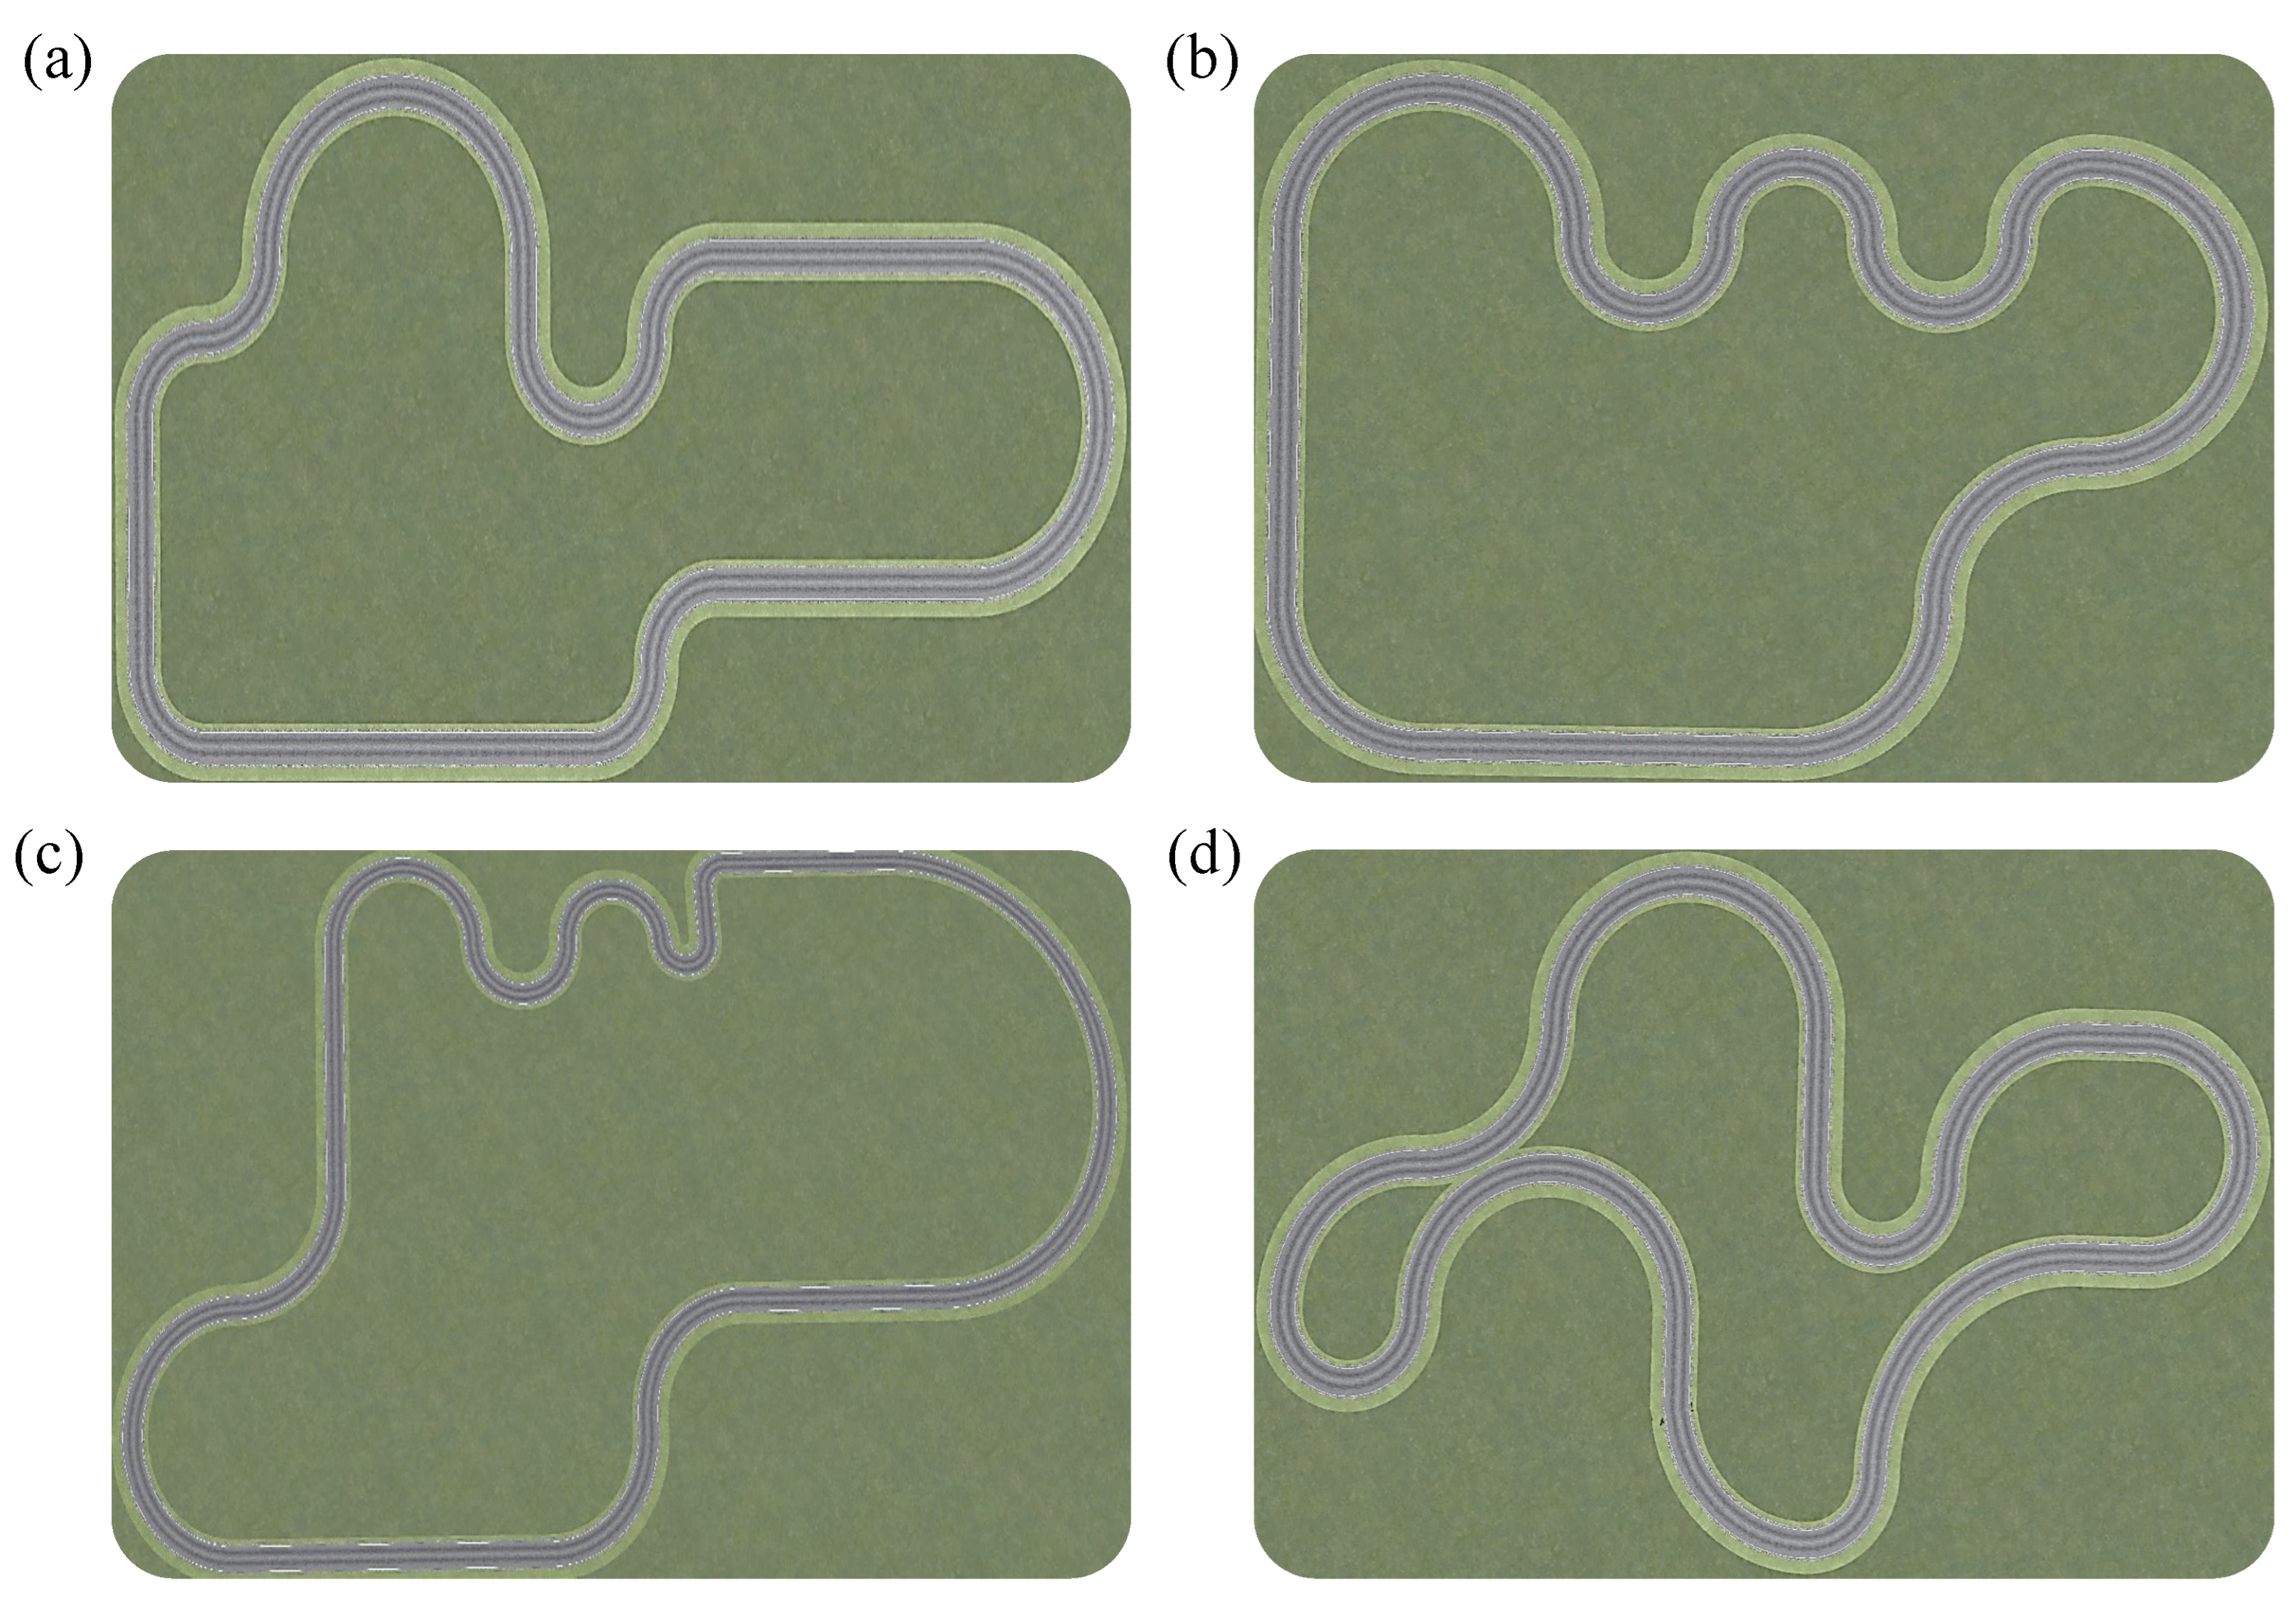
4.1. Experimental Background

As shown in Figure 6, the experimental setup utilizes a laboratory-designed semi-physical driving simulation platform, comprising a driving simulator, torque sensor, and PC host. The driving simulator, equipped with a steering wheel, accelerator, and brake pedal, controls the simulated vehicle. The torque sensor collects steering torque data to analyze driver behavior and response characteristics. The PC host, running Simulink, Carsim, and real-time scene simulation software, serves as the central unit for signal interaction between the simulator and sensor.
Figure 7 illustrates the platform’s schematic, highlighting the synergy among the driving simulator, torque sensor, and PC host. The simulator transmits driver inputs via the steering wheel, accelerator, and brake pedal to the control system in real time, while the torque sensor captures steering torque data for behavioral analysis. The PC host, as the core control unit, integrates simulator and sensor data with vehicle dynamics models using MATLAB R2023b/Simulink and Carsim 2021, executing control strategies to accurately simulate and optimize driving behavior.This setup operates as a co-simulation platform where the roles are clearly defined: the proposed BMDM is implemented in MATLAB R2023b/Simulink, while the high-fidelity, nonlinear vehicle dynamics and road environment are provided by CarSim. Consequently, the simplified linear model introduced in Section 2.2 is confined to the theoretical derivation of the control strategy and is not used in this validation loop. This ensures that the BMDM is tested against a realistic plant model, with its performance evaluated using accurate feedback signals from the high-fidelity simulation.

4.2. Database Construction and Training

To enable dynamic preview weighting correction in the BMDM, a diverse driver behavior memory database was constructed. This database includes operational data collected from a cohort of 11 licensed drivers with diverse backgrounds across multiple road conditions, encompassing vehicle speed, road curvature, steering torque, and steering angle. Regarding vehicle speed, it should be noted that the trials were not conducted at a strictly fixed speed. Instead, speed varied gradually, a condition consistent with the foundational assumption of our vehicle model, thus validating its use for analyzing the driver’s lateral control behavior. Data were collected via the semi-physical driving simulation platform, preprocessed, and used to train the model.
As shown in Figure 8, to encompass a range of road conditions from simple to complex in the simulation environment, four distinct test routes were selected: Figure 8a a flat route without continuous curves; Figure 8b a route with moderate continuous curves; Figure 8c a route with sharp bends, demanding higher reaction speed and steering precision; and Figure 8d a highly complex route with near-continuous curves requiring sustained steering. Data collected from these routes enable the BMDM to learn diverse driving styles and operational patterns, facilitating dynamic preview weighting adjustments across varied conditions and providing a robust basis for training and testing.

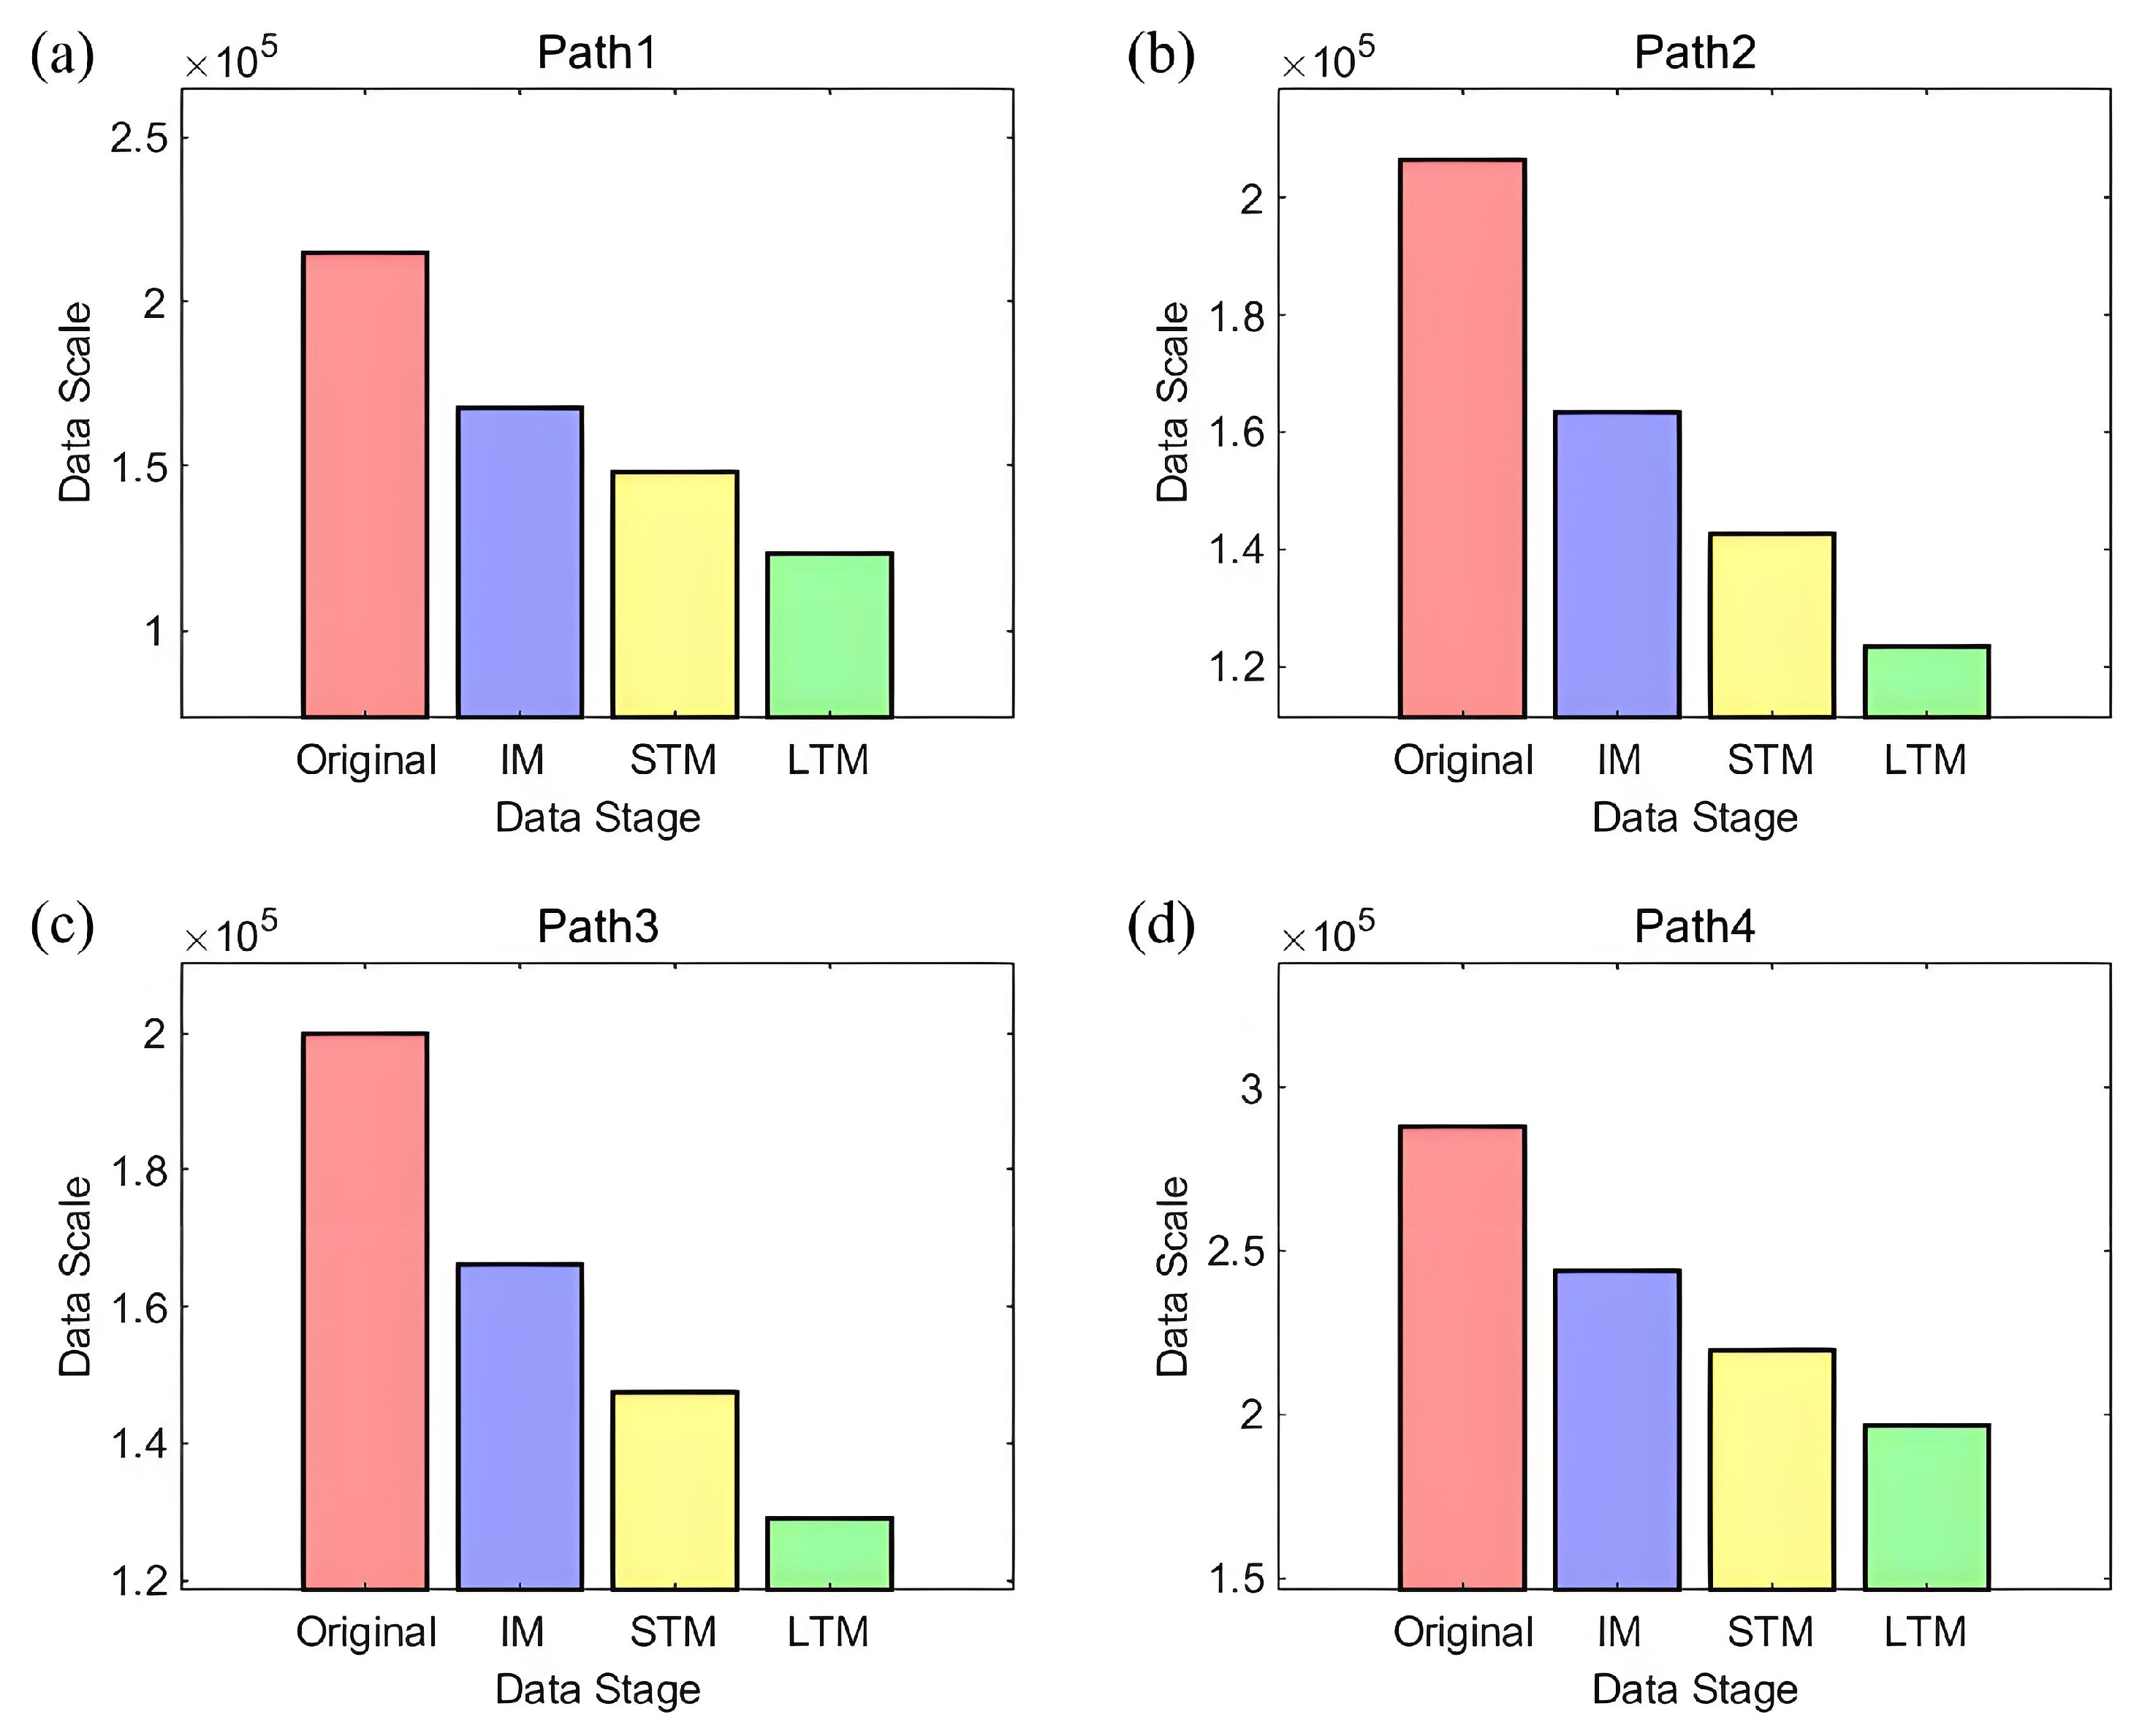
4.3. Data Volume Analysis

To assess the data compression efficacy of the brain-inspired memory mechanism, this section quantitatively analyzes the dimensionality reduction across IM, STM, and LTM stages for the four test routes described in Section 4.2. Figure 9 illustrates data volumes at each memory stage, while Table 1 lists the percentage reductions per stage and total reduction.
Figure analysis reveals that, compared to raw data, the IM, STM, and LTM stages effectively reduce data volume with progressive reductions. For Path 1, IM decreases data by 21.86%, STM by 9.09%, and LTM by 11.60%, yielding a total reduction of 42.55%. Path 2 follows a similar trend with a 40.17% reduction. In contrast, Path 3 and Path 4 show lower reductions of 35.40% and 31.81%, respectively. Simpler routes with repetitive or redundant data allow multi-stage processing to eliminate more similar features, achieving higher reductions, whereas complex, curve-intensive routes retain more uncertain, high-value data, resulting in lower reductions.
This pattern aligns with the complexity descriptions in Section 4.2. Path 1, lacking continuous curves, exhibits repetitive operations; Path 2 has moderate curves with increased frequency; Path 3 includes sharp bends; and Path 4 features constant curves, demanding frequent steering. Greater complexity increases data novelty, reducing redundancy removable by IM and STM, elevating LTM storage, and lowering total reduction compared to simpler scenarios, where multi-stage filtering eliminates more similar data, significantly enhancing reduction.
The brain-inspired memory mechanism efficiently compresses large-scale raw data across route types, retaining more high-value data as complexity rises, demonstrating the adaptive nature of IM-STM-LTM processing. This approach substantially reduces data burdens for subsequent modeling and analysis while preserving critical information for complex driving behavior modeling, providing a solid foundation for performance evaluation and anthropomorphic control strategy research in Section 4.4. This inherent efficiency resulting from significant data compression allowed the BMDM algorithm to operate well within real-time constraints on the simulation platform during all experimental trials.

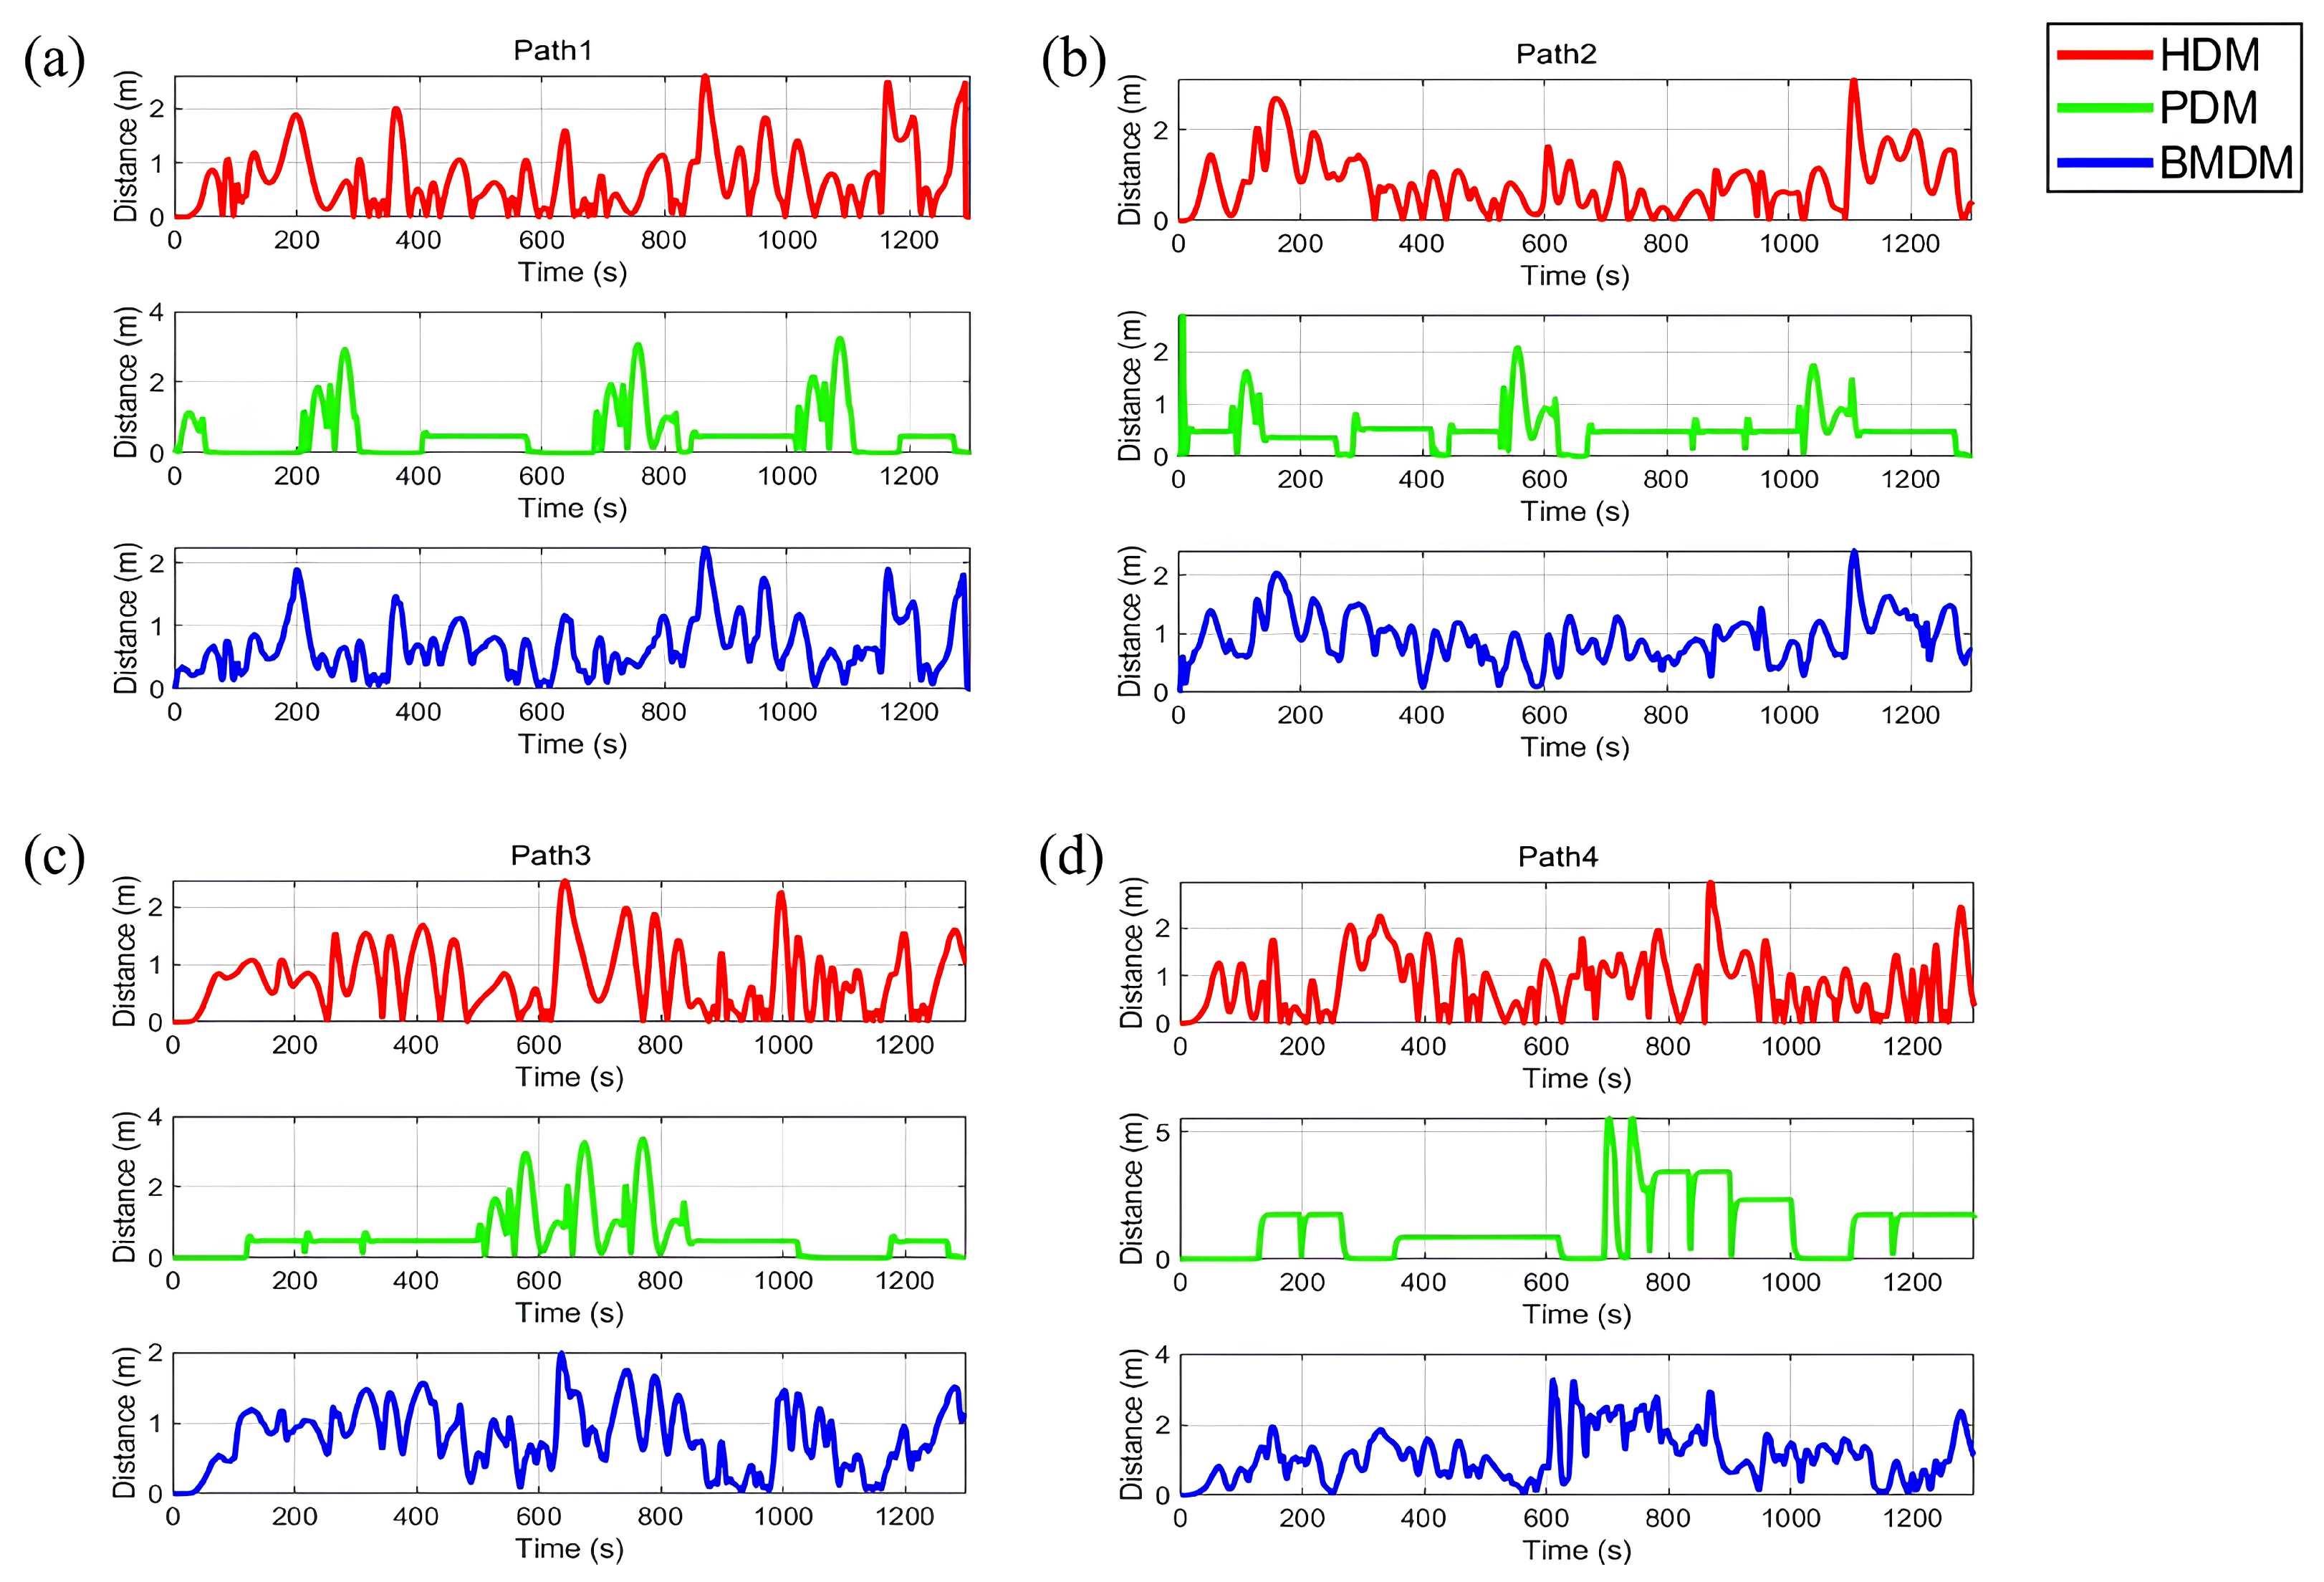
4.4. Comparative Performance Analysis

Following the construction and training of the behavioral memory database, a comparative analysis was conducted to evaluate the performance of the proposed Brain-Memory Driver Model (BMDM). The BMDM was benchmarked against two models on the four test routes depicted in Figure 8, a conventional Preview Driver Model (PDM) and the Human Driver Model (HDM). The PDM refers to the classical two-point preview model detailed in Section 2.3, which forms the direct foundation of our proposed model. This baseline was specifically chosen to isolate and rigorously evaluate the performance gains attributable to the brain-inspired memory mechanism. The HDM in this context does not refer to a computational model but represents the ground-truth driving data collected from human participants in the experiments described in Section 4.1, serving as the benchmark for anthropomorphism. To establish a single, representative baseline for comparison, the data collected from all participants were averaged for each test route. The lateral error performance of these models is presented in Figure 10 and analyzed below in conjunction with route characteristics.
Overall, BMDM consistently achieves lower lateral errors than PDM across all routes, closely aligning with HDM. In the simplest route (a), HDM exhibits slight lag and over-correction at curves, while PDM shows larger, mechanical error fluctuations lacking personalization. BMDM, utilizing memory-based processing of real-time curvature and speed, dynamically adjusts preview weights, approximating human responses even in this scenario.
As complexity increases in routes (b) with continuous curves and (c) with sharp bends, HDM retains natural fluctuations, PDM remains stable but inflexible to abrupt changes, and BMDM leverages STM and LTM data to adapt weights, reducing error magnitude and mirroring HDM.
In the most complex route (d), with frequent steering demands, HDM fluctuates notably, PDM exhibits rigid, high-error strategies, and BMDM, using historical curve analysis and real-time feedback, maintains flexible steering, converging errors more smoothly than PDM and HDM’s over-corrections. These findings confirm BMDM’s superior simulation of human driving in challenging conditions.
The brain-inspired dynamic correction strategy demonstrates adaptability to road condition variations across all four routes. In the simple scenario (a), BMDM matches human driver performance, while in the more challenging routes (b), (c), and (d), it reduces steering error fluctuations through real-time preview weight adjustments, exhibiting high anthropomorphism. Compared to HDM, BMDM offers greater automation and repeatability; relative to PDM, it significantly enhances simulation of complex environments and individualized driving behavior. Thus, BMDM’s flexible, adaptive preview strategy across diverse conditions validates its effectiveness and superiority in anthropomorphic driver modeling.

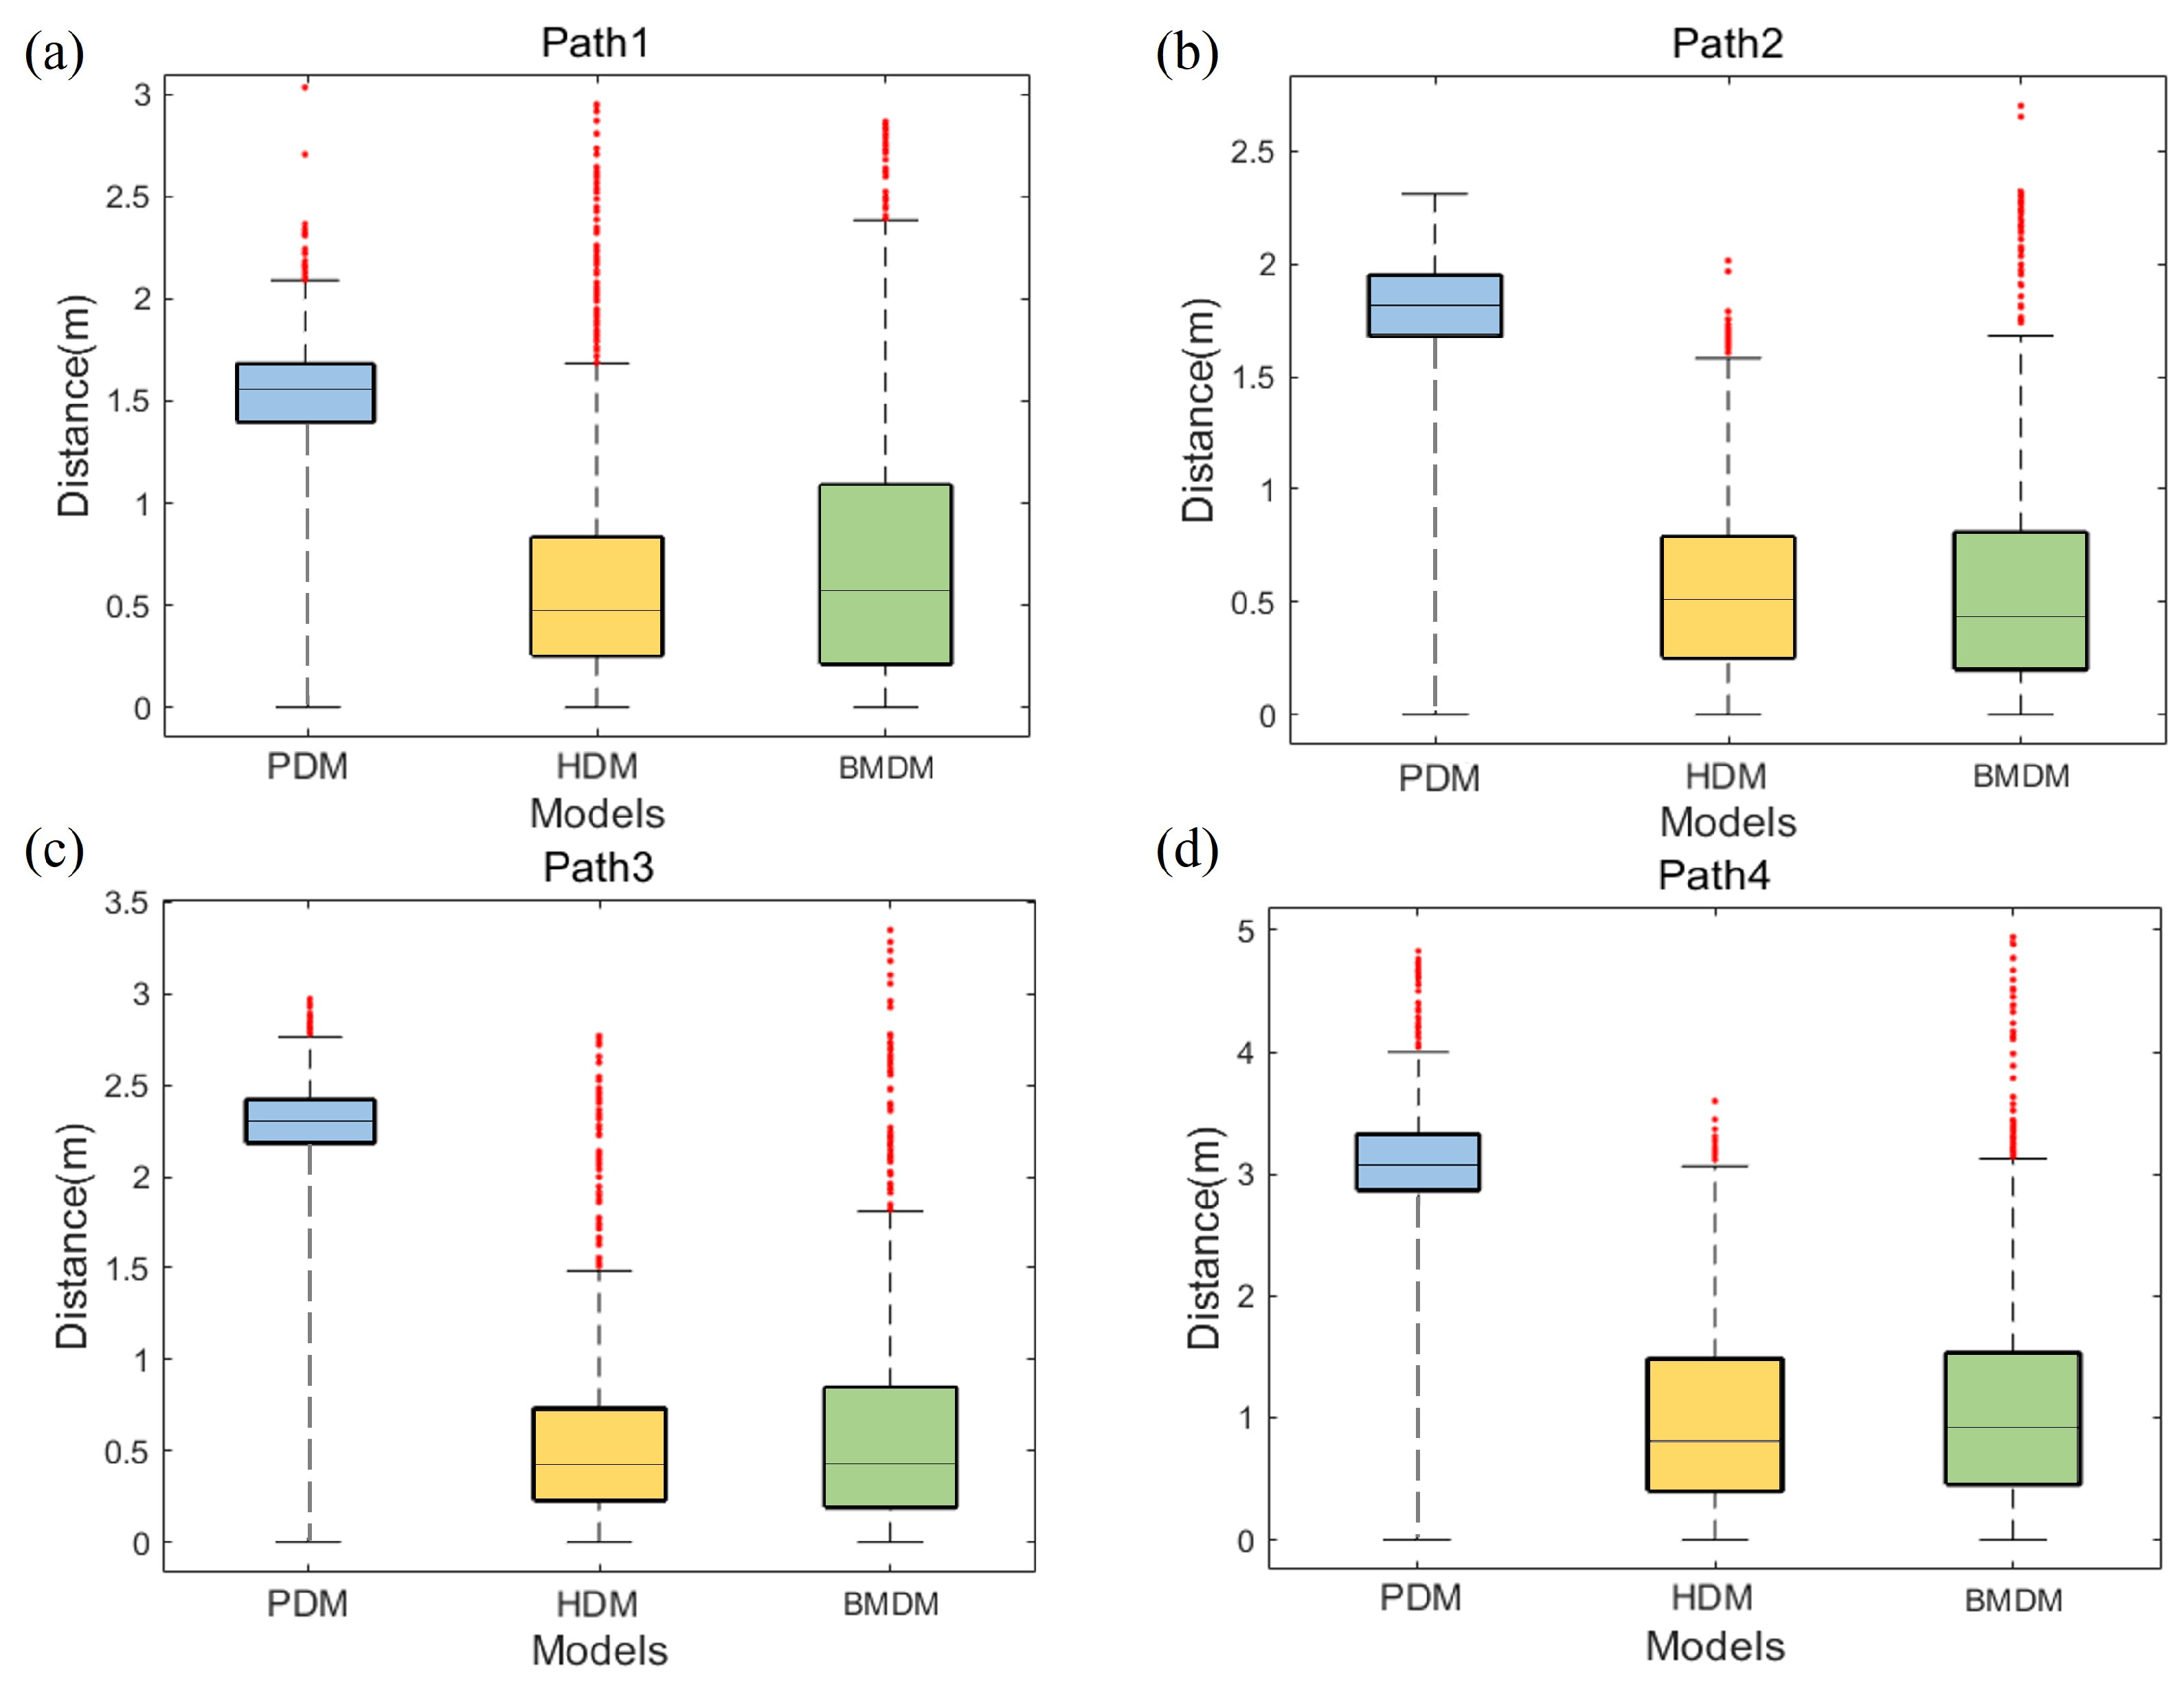
4.5. Statistical Analysis

The evaluation of the proposed BMDM is approached from a comprehensive perspective, designed to validate not only path-tracking accuracy but also the model’s inherent anthropomorphic characteristics. The model’s core learning mechanism in Section 3.2 is fundamentally built upon processing real-time vehicle speed and steering torque, grounding its adaptive behavior in realistic driver inputs. The architecture also incorporates a neuromuscular system in Section 2.3 to explicitly replicate human-like steering dynamics. The resulting behaviors, such as steering flexibility, are qualitatively assessed in the performance analysis of Section 4.4. The following statistical analysis of lateral error thus serves as the key quantitative benchmark to verify the summative effect of these integrated anthropomorphic features, providing definitive evidence of the model’s enhanced performance.
To evaluate significant differences in lateral errors, a statistical analysis was performed on the driver models. The Kolmogorov–Smirnov test confirmed that the HDM, PDM, and BMDM data met the normal distribution assumption. A one-way ANOVA conducted at a significance level of 0.05 revealed significant overall differences in lateral errors among the models. Tukey post hoc tests indicated significant differences between HDM and PDM, and between PDM and BMDM, but no significant difference between HDM and BMDM.
This analysis highlights a notable gap between the traditional PDM and real human drivers (HDM) in lateral error, whereas BMDM, leveraging brain-inspired dynamic correction, shows no significant deviation from HDM, indicating superior alignment with human lateral control characteristics. Figure 11 presents boxplots of lateral errors for the three models across routes, visually reinforcing these statistical findings.
The box represents the interquartile range of errors, the horizontal line denotes the median, and whiskers with outliers indicate the error distribution’s range and extremes. The figure shows that the PDM exhibits a large and consistent systematic lateral error, as indicated by its high median value. In contrast, the median errors of both the BMDM and HDM are significantly lower and centered close to zero. Although the BMDM shows a wider error variance compared to the PDM, its overall performance profile, particularly its central tendency, is much more aligned with the human driver (HDM), highlighting the dynamic correction mechanism’s significant advantage.

5. Conclusions

This study addressed a key limitation of conventional driver models: their reliance on fixed weighting parameters, which fails to capture the dynamic and individual nature of human driving. To overcome this, we proposed and validated a Brain-Memory Driver Model (BMDM) that enhances a two-point preview model by dynamically adjusting its parameters.
Inspired by human cognitive processes, the BMDM integrates real-time road curvature, vehicle speed, and steering torque. It uniquely employs a multi-stage memory framework that emulates how humans process information: capturing vast sensory data in Instantaneous Memory (IM), filtering for relevance in Short-Time Memory (STM), and consolidating critical experiences in Long-Time Memory (LTM). This allows the model to continuously learn from and adapt to changing conditions.
Experimental results from a semi-physical simulation platform demonstrated the BMDM’s superior performance. When benchmarked against a traditional Preview Driver Model (PDM) and real human driver data (HDM), the BMDM consistently replicated human steering behavior with significantly higher fidelity, particularly on complex routes. Statistical analysis confirmed that the BMDM’s performance was not significantly different from that of human drivers, validating its ability to produce highly realistic, anthropomorphic control actions.
In conclusion, this research demonstrates that a biomimetic approach grounded in human memory mechanisms can overcome the rigidity of traditional models. By providing a structured framework for information filtering and adaptation, the BMDM enhances the personalization and real-time adaptability of driver simulation. This work contributes a robust, high-fidelity virtual driver for developing and testing future human–machine cooperative technologies and offers new methods for creating more intelligent and human-like autonomous systems.

Author Contributions

Conceptualization, C.L. and H.W.; methodology, C.L. and H.W.; software, H.L.; validation, H.W.; formal analysis, H.W.; investigation, C.L. and H.W.; resources, B.Y.; data curation, B.Y.; writing—original draft preparation, C.L. and H.W.; writing—review and editing, J.L.; visualization, H.L.; supervision, W.Z.; project administration, B.Y.; funding acquisition, W.Z. All authors have read and agreed to the published version of the manuscript.

Funding

This work was supported by the Chongqing Natural Science Foundation Innovation and Development Joint Fund (Project NO. CSTB2024NSCQ-LZX0153).

Data Availability Statement

Relevant data, models, or code supporting this study’s findings can be obtained from the corresponding author upon reasonable request.

Acknowledgments

The authors would like to thank the Chongqing Natural Science Foundation for supporting this work.

Conflicts of Interest

The authors confirm that they have no financial interests or personal relationships that could have influenced the work presented in this paper.

References

  1. Ungoren, A.; Peng, H. An adaptive lateral preview driver model. Veh. Syst. Dyn. 2005, 43, 245–259. [Google Scholar] [CrossRef]
  2. Zhao, Z.; Zhou, L.; Luo, Y.; Li, K. Emergency Steering Evasion Assistance Control Based on Driving Behavior Analysis. IEEE Trans. Intell. Transp. Syst. 2019, 20, 457–475. [Google Scholar] [CrossRef]
  3. Na, X.; Cole, D.J. Experimental Evaluation of a Game-Theoretic Human Driver Steering Control Model. IEEE Trans. Cybern. 2023, 53, 4791–4804. [Google Scholar] [CrossRef] [PubMed]
  4. Na, X.; Cole, D.J. Linear quadratic game and non-cooperative predictive methods for potential application to modelling driver–AFS interactive steering control. Veh. Syst. Dyn. 2013, 51, 165–198. [Google Scholar] [CrossRef]
  5. Wang, W.; Na, X.; Cao, D.; Gong, J.; Xi, J.; Xing, Y.; Wang, F.Y. Decision-making in driver-automation shared control: A review and perspectives. IEEE/CAA J. Autom. Sin. 2020, 7, 1289–1307. [Google Scholar] [CrossRef]
  6. Negash, N.M.; Yang, J. Driver Behavior Modeling Toward Autonomous Vehicles: Comprehensive Review. IEEE Access 2023, 11, 22788–22821. [Google Scholar] [CrossRef]
  7. Khanum, A.; Lee, C.Y.; Yang, C.S. Involvement of Deep Learning for Vision Sensor-Based Autonomous Driving Control: A Review. IEEE Sens. J. 2023, 23, 15321–15341. [Google Scholar] [CrossRef]
  8. Wei, S.; Zou, Y.; Zhang, X.; Zhang, T.; Li, X. An Integrated Longitudinal and Lateral Vehicle Following Control System with Radar and Vehicle-to-Vehicle Communication. IEEE Trans. Veh. Technol. 2019, 68, 1116–1127. [Google Scholar] [CrossRef]
  9. Thombare, S.S. The Future of Car Automation Field with Smart Driverless Technologies. In Computational Intelligence in Machine Learning; Kumar, A., Zurada, J.M., Gunjan, V.K., Balasubramanian, R., Eds.; Springer: Singapore, 2022; pp. 103–121. [Google Scholar] [CrossRef]
  10. Gao Zhenhai, F.A.; Jiang Liyong, S.B. Optimal preview trajectory decision model of lane-keeping system with driver behavior simulation and Artificial Potential Field. In Proceedings of the 2009 IEEE Intelligent Vehicles Symposium, Xi’an, China, 3–5 June 2009; pp. 797–801. [Google Scholar] [CrossRef]
  11. Salvucci, D.D.; Gray, R. A Two-Point Visual Control Model of Steering. Perception 2004, 33, 1233–1248. [Google Scholar] [CrossRef] [PubMed]
  12. Wang, Z.; Wang, Z.; Zhou, X.; Zhou, X.; Shen, H.; Shen, H.; Wang, J.; Wang, J. Algebraic Driver Steering Model Parameter Identification. J. Dyn. Syst. Meas. Control-Trans. ASME 2022, 144, 051006. [Google Scholar] [CrossRef]
  13. Wang, Z.; Zheng, R.; Nacpil, E.J.C.; Nakano, K. Modeling and Analysis of Driver Behaviour under Shared Control through Weighted Visual and Haptic Guidance. IET Intell. Transp. Syst. 2022, 16, 648–660. [Google Scholar] [CrossRef]
  14. Gordon, T.J.; Best, M.C.; Dixon, P.J. An Automated Driver Based on Convergent Vector Fields. Proc. Inst. Mech. Eng. Part D J. Automob. Eng. 2002, 216, 329–347. [Google Scholar] [CrossRef]
  15. Ekinci, S.; Izci, D.; Abualigah, L.; Zitar, R.A. A Modified Oppositional Chaotic Local Search Strategy Based Aquila Optimizer to Design an Effective Controller for Vehicle Cruise Control System. J. Bionic Eng. 2023, 20, 1828–1851. [Google Scholar] [CrossRef]
  16. Mouri, H.; Furusho, H. Automatic path tracking using linear quadratic control theory. In Proceedings of the Proceedings of Conference on Intelligent Transportation Systems, Boston, MA, USA, 12 November 1997; pp. 948–953. [Google Scholar] [CrossRef]
  17. Yu, R.; Guo, H.; Sun, Z.; Chen, H. MPC-Based Regional Path Tracking Controller Design for Autonomous Ground Vehicles. In Proceedings of the 2015 IEEE International Conference on Systems, Man, and Cybernetics, Hong Kong, China, 9–12 October 2015; pp. 2510–2515. [Google Scholar] [CrossRef]
  18. Vatankhah, R.; Etemadi, S.; Alasty, A.; Vossoughi, G. Adaptive Critic-Based Neuro-Fuzzy Controller in Multi-Agents: Distributed Behavioral Control and Path Tracking. Neurocomputing 2012, 88, 24–35. [Google Scholar] [CrossRef]
  19. Fernandez, S.; Ito, T. Driver Classification for Intelligent Transportation Systems Using Fuzzy Logic. In Proceedings of the 2016 IEEE 19th International Conference on Intelligent Transportation Systems (ITSC), Rio de Janeiro, Brazil, 1–4 November 2016; pp. 1212–1216. [Google Scholar] [CrossRef]
  20. Wang, W.; Xi, J.; Hedrick, J.K. A Learning-Based Personalized Driver Model Using Bounded Generalized Gaussian Mixture Models. IEEE Trans. Veh. Technol. 2019, 68, 11679–11690. [Google Scholar] [CrossRef]
  21. Wang, W.; Zhao, D.; Han, W.; Xi, J. A Learning-Based Approach for Lane Departure Warning Systems with a Personalized Driver Model. IEEE Trans. Veh. Technol. 2018, 67, 9145–9157. [Google Scholar] [CrossRef]
  22. Okamoto, K.; Tsiotras, P. Data-Driven Human Driver Lateral Control Models for Developing Haptic-Shared Control Advanced Driver Assist Systems. Robot. Auton. Syst. 2019, 114, 155–171. [Google Scholar] [CrossRef]
  23. Kukkala, V.K.; Kukkala, V.K.; Tunnell, J.A.; Tunnell, J.A.; Pasricha, S.; Pasricha, S.; Bradley, T.H.; Bradley, T.H. Advanced Driver-Assistance Systems: A Path Toward Autonomous Vehicles. IEEE Consum. Electron. Mag. 2018, 7, 18–25. [Google Scholar] [CrossRef]
  24. Hang, P.; Zhang, Y.; Lv, C. Brain-Inspired Modeling and Decision-Making for Human-Like Autonomous Driving in Mixed Traffic Environment. IEEE Trans. Intell. Transp. Syst. 2023, 24, 10420–10432. [Google Scholar] [CrossRef]
  25. Han, J.; Zhao, J.; Zhu, B.; Song, D. Adaptive Steering Torque Coupling Framework Considering Conflict Resolution for Human-Machine Shared Driving. IEEE Trans. Intell. Transp. Syst. 2022, 23, 10983–10995. [Google Scholar] [CrossRef]
  26. Mwaita, K.F.; Bhaumik, R.; Ahmed, A.; Sharma, A.; De Angeli, A.; Haller, M. Emotion-Aware In-Car Feedback: A Comparative Study. Multimodal Technol. Interact. 2024, 8, 54. [Google Scholar] [CrossRef]
  27. Filippini, C.; Spadolini, E.; Cardone, D.; Bianchi, D.; Preziuso, M.; Sciarretta, C.; del Cimmuto, V.; Lisciani, D.; Merla, A. Facilitating the Child–Robot Interaction by Endowing the Robot with the Capability of Understanding the Child Engagement: The Case of Mio Amico Robot. Int. J. Soc. Robot. 2021, 13, 677–689. [Google Scholar] [CrossRef]
  28. Tao, K.; Zheng, W. Structural Damage Location and Evaluation Model Inspired by Memory and Causal Reasoning of the Human Brain. Struct. Control Health Monit. 2018, 25, e2249. [Google Scholar] [CrossRef]
  29. Tao, K.; Zheng, W. An Anthropomorphic Fuzzy Model for the Time-Spatial Assessment of Sandstone Seepage Damage. Autom. Constr. 2020, 109, 102989. [Google Scholar] [CrossRef]
  30. Liu, J.; Dai, Q.; Guo, H.; Guo, J.; Chen, H. Human-Oriented Online Driving Authority Optimization for Driver-Automation Shared Steering Control. IEEE Trans. Intell. Veh. 2022, 7, 863–872. [Google Scholar] [CrossRef]
  31. Marcano, M.; Díaz, S.; Pérez, J.; Irigoyen, E. A Review of Shared Control for Automated Vehicles: Theory and Applications. IEEE Trans. Hum.-Mach. Syst. 2020, 50, 475–491. [Google Scholar] [CrossRef]
  32. El Hajjami, L.; Mellouli, E.M.; Berrada, M. Autonomous Vehicle Lateral Control for the Lane-change Maneuver. In Proceedings of the 6th International Conference on Wireless Technologies, Embedded, and Intelligent Systems (WITS 2020), Fez, Morocco, 14–16 October 2020; Bennani, S., Lakhrissi, Y., Khaissidi, G., Mansouri, A., Khamlichi, Y., Eds.; Springer: Singapore, 2022; pp. 285–295. [Google Scholar] [CrossRef]
  33. Zha, Y.; Deng, J.; Qiu, Y.; Zhang, K.; Wang, Y. A Survey of Intelligent Driving Vehicle Trajectory Tracking Based on Vehicle Dynamics. SAE Int. J. Veh. Dyn. Stab. NVH 2023, 7, 221–248. [Google Scholar] [CrossRef]
  34. Ataei, M.; Ataei, M.; Khajepour, A.; Khajepour, A.; Jeon, S.; Jeon, S. Development of a novel general reconfigurable vehicle dynamics model. Mech. Mach. Theory 2021, 156, 104147. [Google Scholar] [CrossRef]
  35. Dahmani, H.; Chadli, M.; Rabhi, A.; El Hajjaji, A. Road curvature estimation for vehicle lane departure detection using a robust Takagi–Sugeno fuzzy observer. Veh. Syst. Dyn. 2013, 51, 581–599. [Google Scholar] [CrossRef]
  36. Li, X.; Wang, Y.; Su, C.; Gong, X.; Huang, J.; Yang, D. Adaptive Authority Allocation Approach for Shared Steering Control System. IEEE Trans. Intell. Transp. Syst. 2022, 23, 19428–19439. [Google Scholar] [CrossRef]
  37. Wang, J.; Zhang, G.; Wang, R.; Schnelle, S.C.; Wang, J. A Gain-Scheduling Driver Assistance Trajectory-Following Algorithm Considering Different Driver Steering Characteristics. IEEE Trans. Intell. Transp. Syst. 2017, 18, 1097–1108. [Google Scholar] [CrossRef]
  38. Saleh, L.; Chevrel, P.; Claveau, F.; Lafay, J.F.; Mars, F. Shared Steering Control Between a Driver and an Automation: Stability in the Presence of Driver Behavior Uncertainty. IEEE Trans. Intell. Transp. Syst. 2013, 14, 974–983. [Google Scholar] [CrossRef]
  39. Lu, Y.; Zhang, J.; Yang, S.; Li, Z. Study on improvement of LuGre dynamical model and its application in vehicle handling dynamics. J. Mech. Sci. Technol. 2019, 33, 545–558. [Google Scholar] [CrossRef]
  40. Sentouh, C.; Chevrel, P.; Mars, F.; Claveau, F. A Sensorimotor Driver Model for Steering Control. In Proceedings of the 2009 IEEE International Conference on Systems, Man and Cybernetics, San Antonio, TX, USA, 11–14 October 2009; pp. 2462–2467. [Google Scholar] [CrossRef]
  41. Jiang, J.; Astolfi, A. Lateral Control of an Autonomous Vehicle. IEEE Trans. Intell. Veh. 2018, 3, 228–237. [Google Scholar] [CrossRef]
  42. Murre, J.M.J.; Murre, J.M.J.; Dros, J.; Dros, J. Replication and Analysis of Ebbinghaus’ Forgetting Curve. PLoS ONE 2015, 10, e0120644. [Google Scholar] [CrossRef] [PubMed]
  43. Raaijmakers, J.G.; Shiffrin, R.M. Search of Associative Memory. Psychol. Rev. 1981, 88, 93–134. [Google Scholar] [CrossRef]
Figure 1. Overall architecture of the Brain-Memory Driver Model.
Machines 13 00617 g001
Figure 2. The linear bicycle model used for vehicle lateral dynamics.
Machines 13 00617 g002
Figure 3. Schematic of the two-point preview driver model.
Machines 13 00617 g003
Figure 4. Control structure of the BMDM.
Machines 13 00617 g004
Figure 5. The three-stage memory mechanism inspiring the BMDM: (a) the Ebbinghaus forgetting curve, (b) conceptual memory stages, (c) the model’s data processing flowchart.
Machines 13 00617 g005
Figure 6. The laboratory-designed semi-physical driving simulation platform.
Machines 13 00617 g006
Figure 7. Schematic of the co-simulation platform.
Machines 13 00617 g007
Figure 8. Schematics of the four test routes, ordered by increasing complexity from (ad).
Machines 13 00617 g008
Figure 9. Data volume reduction across the memory stages for the four distinct test paths from (ad).
Machines 13 00617 g009
Figure 10. Lateral error performance of the BMDM, PDM, and HDM on the four test routes: (a) Path 1, (b) Path 2, (c) Path 3, and (d) Path 4.
Machines 13 00617 g010
Figure 11. Distribution of lateral errors for the HDM, PDM, and BMDM across the four test routes from (ad) illustrated via boxplots.
Machines 13 00617 g011
Table 1. Percentage of data volume reduction achieved by the memory mechanism for each test path.
PathIMSTMLTMTotal
121.86%9.09%11.60%42.55%
220.79%10.11%9.27%40.17%
316.83%9.42%9.15%35.40%
415.39%8.46%7.96%31.81%
Disclaimer/Publisher’s Note: The statements, opinions and data contained in all publications are solely those of the individual author(s) and contributor(s) and not of MDPI and/or the editor(s). MDPI and/or the editor(s) disclaim responsibility for any injury to people or property resulting from any ideas, methods, instructions or products referred to in the content.

