1. Introduction
The electric automotive brake joints is a key component that connects the brake master cylinder and brake caliper. It is located at both ends of the brake oil pipe and plays a crucial role in ensuring efficient and stable braking of the brake system. Laser welding and brazing are two common methods in the welding process of automotive brake joints. However, brazing has many limitations, such as low joint strength, poor heat resistance, and electrochemical corrosion problems caused by differences in the composition of the base material and brazing material, all of which can weaken the corrosion resistance of the joint. In addition, brazing requires high assembly accuracy; otherwise, there is a risk of deformation. Given the shortcomings of brazing, laser welding technology is usually preferred for welding automotive brake joints. Laser welding has good adaptability and superior performance, but in actual operation, due to improper welding methods, errors in operation processes, interference from production environmental factors, defects such as cracks, porosity, undercutting, and incomplete fusion may occur in the weld seam. These defects can reduce the strength of the joint and even lead to product failure, thereby affecting the production efficiency and product quality of automotive brake joints. Therefore, it is crucial to inspect and screen the welding quality.
The common methods for weld seam detection are mainly divided into two categories: destructive testing and non-destructive testing. Destructive testing wastes materials, is costly, and has a long cycle; therefore, it is less commonly used. The non-destructive testing methods widely used in industry currently include radiographic testing and ultrasonic testing. Radiographic testing uses radiation to penetrate metal materials and image them on film to evaluate welding quality. This method has high detection accuracy, but it takes a long time to evaluate and verify the results, and the cost of using equipment such as X-ray film is high. At the same time, radiation is harmful to the human body, and protective measures need to be taken. Ultrasonic testing detects defects through the propagation and reflection of ultrasonic waves in the workpiece. The detection accuracy is usually above 80%, and the detection speed is fast (generally within 1 s). However, the detection effect is not good for workpieces with complex shapes, requiring high surface smoothness and the use of coupling agents to ensure acoustic coupling. For coarse-grained castings and welds, it is difficult to judge due to chaotic reflection waves. In addition, ultrasonic testing also requires experienced inspectors to operate and judge the results. In contrast, machine-vision-based methods for detecting weld defects in automotive joints have certain advantages in terms of cost, efficiency, and ease of operation, and have high engineering value and practical significance.
The mandatory demand for “zero defects” in laser welding in the automotive manufacturing industry is continuously driving the upgrading of inspection technology. In the early years, Developed laser vision sensors and applied them to laser welding, which not only provided a foundation for the research of laser weld detection technology in machine vision, but also pioneered the use of visual technology to detect laser welds [
1,
2]. Peng and Jin [
3] used a CCD camera to capture laser welds on automotive manufacturing components and achieved weld quality inspection through visual image processing. Although the hardware conditions were not high at the time, resulting in low detection accuracy, this was a bold attempt to apply machine vision to industrial laser weld inspection. Chen [
4] proposed class activation mapping (CAM) to identify and determine defect areas and locate target objects. It integrates CAM with existing pixel spatial gradient visualization techniques to achieve multi-directional detection of welds. Xu [
5] has developed a detection system for different weld defects in the laser welding process of gas pipelines based on machine vision, which has attracted widespread attention from academia and industry. Zhang [
6] designed a three-dimensional visual sensing system for measuring the surface profile of laser welding melt pool. The system projects the dot matrix laser image onto the molten pool, reconstructs the three-dimensional shape of the molten pool surface based on the reflected image, and measures and controls the size of the welding molten pool online. Xu et al. [
7] has developed a laser weld seam detection system based on machine vision. The detection system is mainly used to measure the surface forming size and appearance defect detection of welds, and to take the center stripe of the weld seam. The feature detection algorithm is used to achieve defect recognition and detection. The measurement error of the system for detecting the forming size of welds is 0.08 mm. Huang [
8] utilized data obtained from the image processing module to adaptively adjust the position of the welding torch, achieving non-contact weld seam tracking, which is well suited for measuring the geometric features of welds, weld seam tracking, and 3D contour production. Chu and Wang [
9] used the centroid method to extract the centerline of structured light generated by laser vision sensors for automated size measurement and defect detection after welding. The early developed laser vision sensor was used for laser welding, pioneering the method of visual technology for detecting welds and laying the foundation for subsequent technologies. Related research continues to deepen, integrating class activation mapping (CAM) with pixel space gradient visualization technology for identifying and determining weld defect areas, using the Gaussian fitting method to extract the center of laser stripes and detect the roughness of surface defects in welds. With the development of technology, various detection systems and technologies have emerged, such as machine-vision-based gas pipeline laser welding defect detection system, a 3D vision sensing system for measuring the surface contour of the molten pool, a feature detection algorithm for measuring the forming size of the weld surface and detecting appearance defects, non-contact weld seam tracking using image processing data, and the centroid method for extracting structured light centerlines for size measurement and defect detection. These efforts focus on utilizing advanced visual technology and image-processing algorithms to achieve precise detection, recognition, and measurement of surface defects in laser welding seams, promoting the development of laser welding seam detection technology towards automation, intelligence, and high precision. Moreover, many countries have matured their technologies and achieved commercial production.
In 2019, Bacioiua et al. [
10] utilized the latest machine learning research results to train a model to recognize the appearance features of the welding pool and its surrounding area, in order to achieve automatic classification of defects in SS304 TIG welding process. In the same year, The team adopted the adaptive cascaded AdaBoost algorithm for binary classification to extract real defects from a large number of potential defects. This algorithm improves the True Positive Rate (TPR) of detecting welding defects by introducing a penalty term to achieve an automatic welding defect detection system. Sun et al. [
11] used a Gaussian mixture model-based background subtraction method to extract feature regions of welding defects, and extracted defect regions to achieve detection and classification of welding defects in thin-walled metal cans. He et al. [
12] proposed a method that combines a top-down visual attention model and an exponentially weighted moving average (EWMA) control chart to extract the welding seam contour during the intelligent robot welding process of thick steel plates, and perform fault detection and diagnosis (FDD). Dong and Sun [
13] uses multiple edge detection algorithms to process weld seam images in order to improve the accuracy of edge detection. By applying automatic threshold selection methods to detect image edges, a reasonable threshold can be obtained to improve the defect recognition accuracy of digital images of pipeline welds. Xia et al. [
14] developed an advanced convolutional neural network (Resnet) to identify different welding states, including good welding, incomplete penetration, burn through, misalignment, etc. In 2020, Pan et al. [
15] proposed a transfer learning model to solve the problem of welding defect detection by adding a new fully connected layer (FC-128) and a Softmax classifier to the traditional Mobile-Net model. Wang and Shen [
16] designed a specialized module to predict the distance field between the inner and outer boundaries of the welding area. This module is used to restore the details that are lost due to hierarchical and multi-layer convolution, and solve the image segmentation problem in radiographic inspection of water-cooled tube welding areas. Tang et al. [
17] used a pre-trained HMM to establish the relationship between keyhole geometry and welding quality defects, which effectively evaluated the quality of stainless steel 304 fiber laser welding. Zhu et al. [
18] proposed a lightweight multi-scale attention semantic segmentation algorithm that can accurately evaluate the experimental evaluation method for detecting laser welding defects on power battery safety valves. Wang et al. [
19] combined artificial intelligence image recognition technology to develop an automatic detection algorithm based on Mask R-CNN, which can automatically detect and identify common defects in building steel structure welds with optimal parameter configuration. Parameshwaran et al. [
20] proposed a shape matching algorithm to achieve reliable and accurate seam tracking process that is sensitive to groove shape, and to track welding seams. Ma et al. [
21] utilized eight feature parameters extracted from weld seam feature points to monitor and classify welding defects generated during gas metal arc welding (GMAW) of galvanized steel. He et al. [
22] used the Mask R-CNN model to extract features from welding seam images, and adjusted the loss function to solve the problem of identifying and locating welding seams in response to changes in the network structure of Mask R-CNN. Deng et al. [
23] utilized deep convolutional neural networks (CNN) for feature extraction and introduces transfer learning (TL) techniques for defect detection and industrial laser welding defect detection and image defect recognition on datasets. Chen et al. [
24] proposed an image processing algorithm based on the Mask RCNN model to accurately identify the centerline of the weld seam in welding images and detect weld seam gap deviation. Qin et al. [
25] used a convolutional neural network-based object detection method (Faster R-CNN) to train and recognize typical defects in TOFD (Time of Flight Diffraction) welding seam images. Yang et al. [
26] proposed a welding defect recognition algorithm that combines support vector machine (SVM) classifier and Dempster–Shafer evidence theory to achieve effective feature representation for welding defect recognition. Chen et al. [
27] applied a Faster R-CNN convolutional neural network for welding defect detection to obtain more accurate defect localization information and improve the performance of welding ultrasonic spectrum defect detection. In recent years, neural network technology has been widely applied in the field of welding defect detection to promote intelligent detection. Researchers trained fully connected neural networks (FCN) and convolutional neural networks (CNN) to recognize welding pools and their surrounding appearance features, automatically classifying good and defective welding. The transfer learning model effectively solves the welding defect detection problem by adding a new fully connected layer (FC-128) and a Soft-max classifier to the traditional Mobile-Net model. In addition, the regional proposal network (RPN) incorporates a neural network system with tilt parameters to adapt to complex environments and achieve accurate and rapid detection of welds. After training, the VGG16 CNN model is used for real-time defect detection in narrow overlap welding. A deep convolutional neural network (CNN) combined with transfer learning (TL) technology is used for industrial laser welding defect detection and image defect recognition. The Faster R-CNN convolutional neural network is applied in welding defect detection to obtain more accurate defect localization information and improve the performance of welding ultrasonic spectrum defect detection. Object detection methods based on convolutional neural networks, such as Faster R-CNN, are used to train and recognize typical defects in TOFD weld seam images. These studies promote the development of welding defect detection towards automation, intelligence, and high precision, helping to improve welding quality.
In 2022, Buongiorno et al. [
28] utilized traditional machine learning algorithms and deep learning architectures to process extracted features, and constructed a classification model for welding defect detection to achieve real-time detection of laser welding defects. Li et al. [
29] utilized a Mask R-CNN deep learning model combined with image processing technology to achieve high-precision weld seam tracking. Liu et al. [
30] used a pre-trained Faster R-CNN two-stage object detection algorithm to iteratively train and test the model parameters to achieve object detection in the weld area. Liu et al. [
31] constructed a restoration and extraction network (REN) based on the CGAN principle to restore weld seam feature information in noise-contaminated weld seam images, and implemented a weld seam tracking system for robot multi-layer and multi-pass MAG welding. Li et al. [
32] improved the Otsu algorithm by calculating the optimal center calculation threshold for each column pixel of the laser stripe within a finite length, improving the resistance to arc light and splash noise to achieve robot welding seam recognition based on line-structured laser (LSL) vision sensors. In April 2023, Hong et al. [
33] applied Kalman filter denoising processing to achieve real-time quality monitoring of ultra-thin plate edge welding. Da Rocha et al. [
34] explored various machine vision technologies, including image processing algorithms, sensors, and tracking methods, to improve the welding accuracy and reliability of machine vision systems. In recent years, research in the field of welding defect detection has been continuously advancing, with a focus on improving the accuracy and efficiency of detection. Researchers use traditional machine learning algorithms and deep learning architectures to process extracted features and construct classification models to achieve real-time detection of laser welding defects. In the same year, research combined Mask R-CNN deep learning model with image-processing technology to achieve high-precision weld seam tracking. In addition, the pre-trained Faster R-CNN two-stage object detection algorithm optimizes model parameters through iterative training and testing, thereby achieving object detection in the weld area. A restoration and extraction network (REN) based on the CGAN principle is constructed to restore feature information in weld seam images contaminated by noise, thereby realizing a weld seam tracking system during the welding process. There is also an improved Otsu algorithm that improves the resistance to arc light and splash noise by calculating the optimal center calculation threshold within a finite length of each column pixel of the laser stripe. Research has applied Kalman filter denoising processing to achieve real-time quality monitoring of ultra-thin plate edge welding [
35]. Machine vision technology has been extensively explored in improving welding accuracy and reliability, including research on image-processing algorithms, sensors, and tracking methods. These works mainly revolve around visual technology, improving the accuracy and real-time performance of welding defect detection by constructing and optimizing models.
In this research context, focusing on the analysis of laser welding seams, this study focuses on the visual defect detection method of laser welding seams for automotive brake joints. A visual inspection system was designed based on the characteristics of laser weld seam images. The system software algorithm design meets the requirements of image processing, covering the pre-processing of weld seam images and analysis of image defect features, accurately extracting defect feature vectors. At the same time, high-performance cascaded classifiers are designed, classifier training is completed, and defect recognition and classification is achieved. Ultimately, the system can effectively detect and analyze laser welding defects in automotive brake joints, which have been experimentally verified and provide strong support for improving welding quality.
The specific research content and chapter arrangement are as follows: the Introduction introduces the research background and significance of the subject, summarizes the main detection methods of laser welds at present, and summarizes the advantages and disadvantages of each method. The research status and application of machine vision weld defect detection methods at home and abroad are described.
Section 2 introduces the common defect types of laser weld of automobile brake joints, and introduces the form and characteristics of common weld defects of automobile brake joints.
Section 3 introduces the analysis of the collected weld images and studies the algorithm of weld defect image processing. A cascade classifier for detection and classification of weld defects is designed, and its detection effect is verified by experiments.
Section 4 mainly introduces how to present the defects after detection and identification in real time, classify and count the defects, and complete the analysis of experimental results.
Section 5 is the conclusion of the paper.
3. Weld Defect Detection Methods
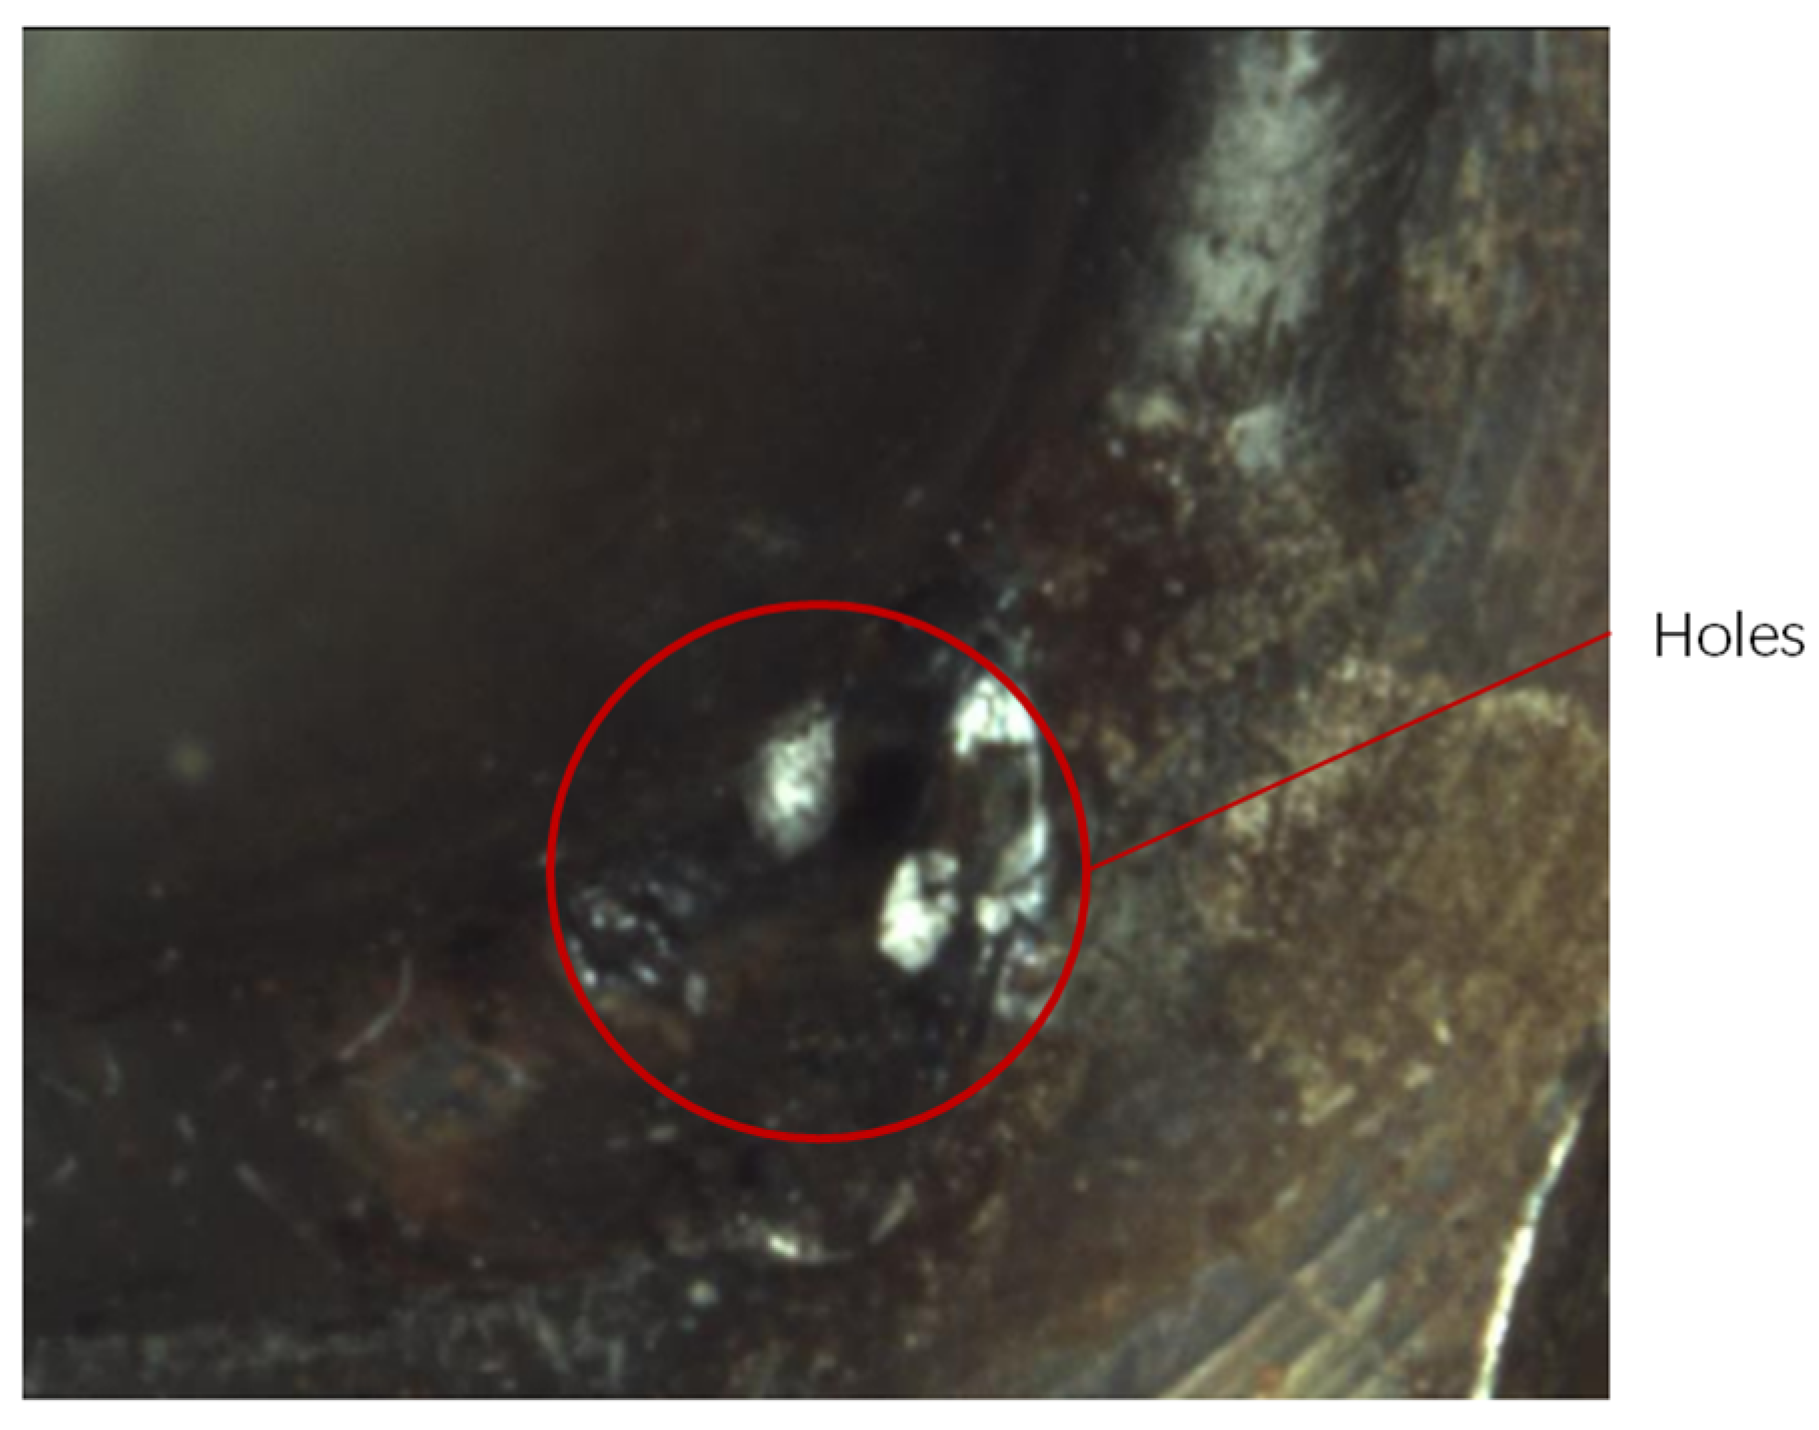
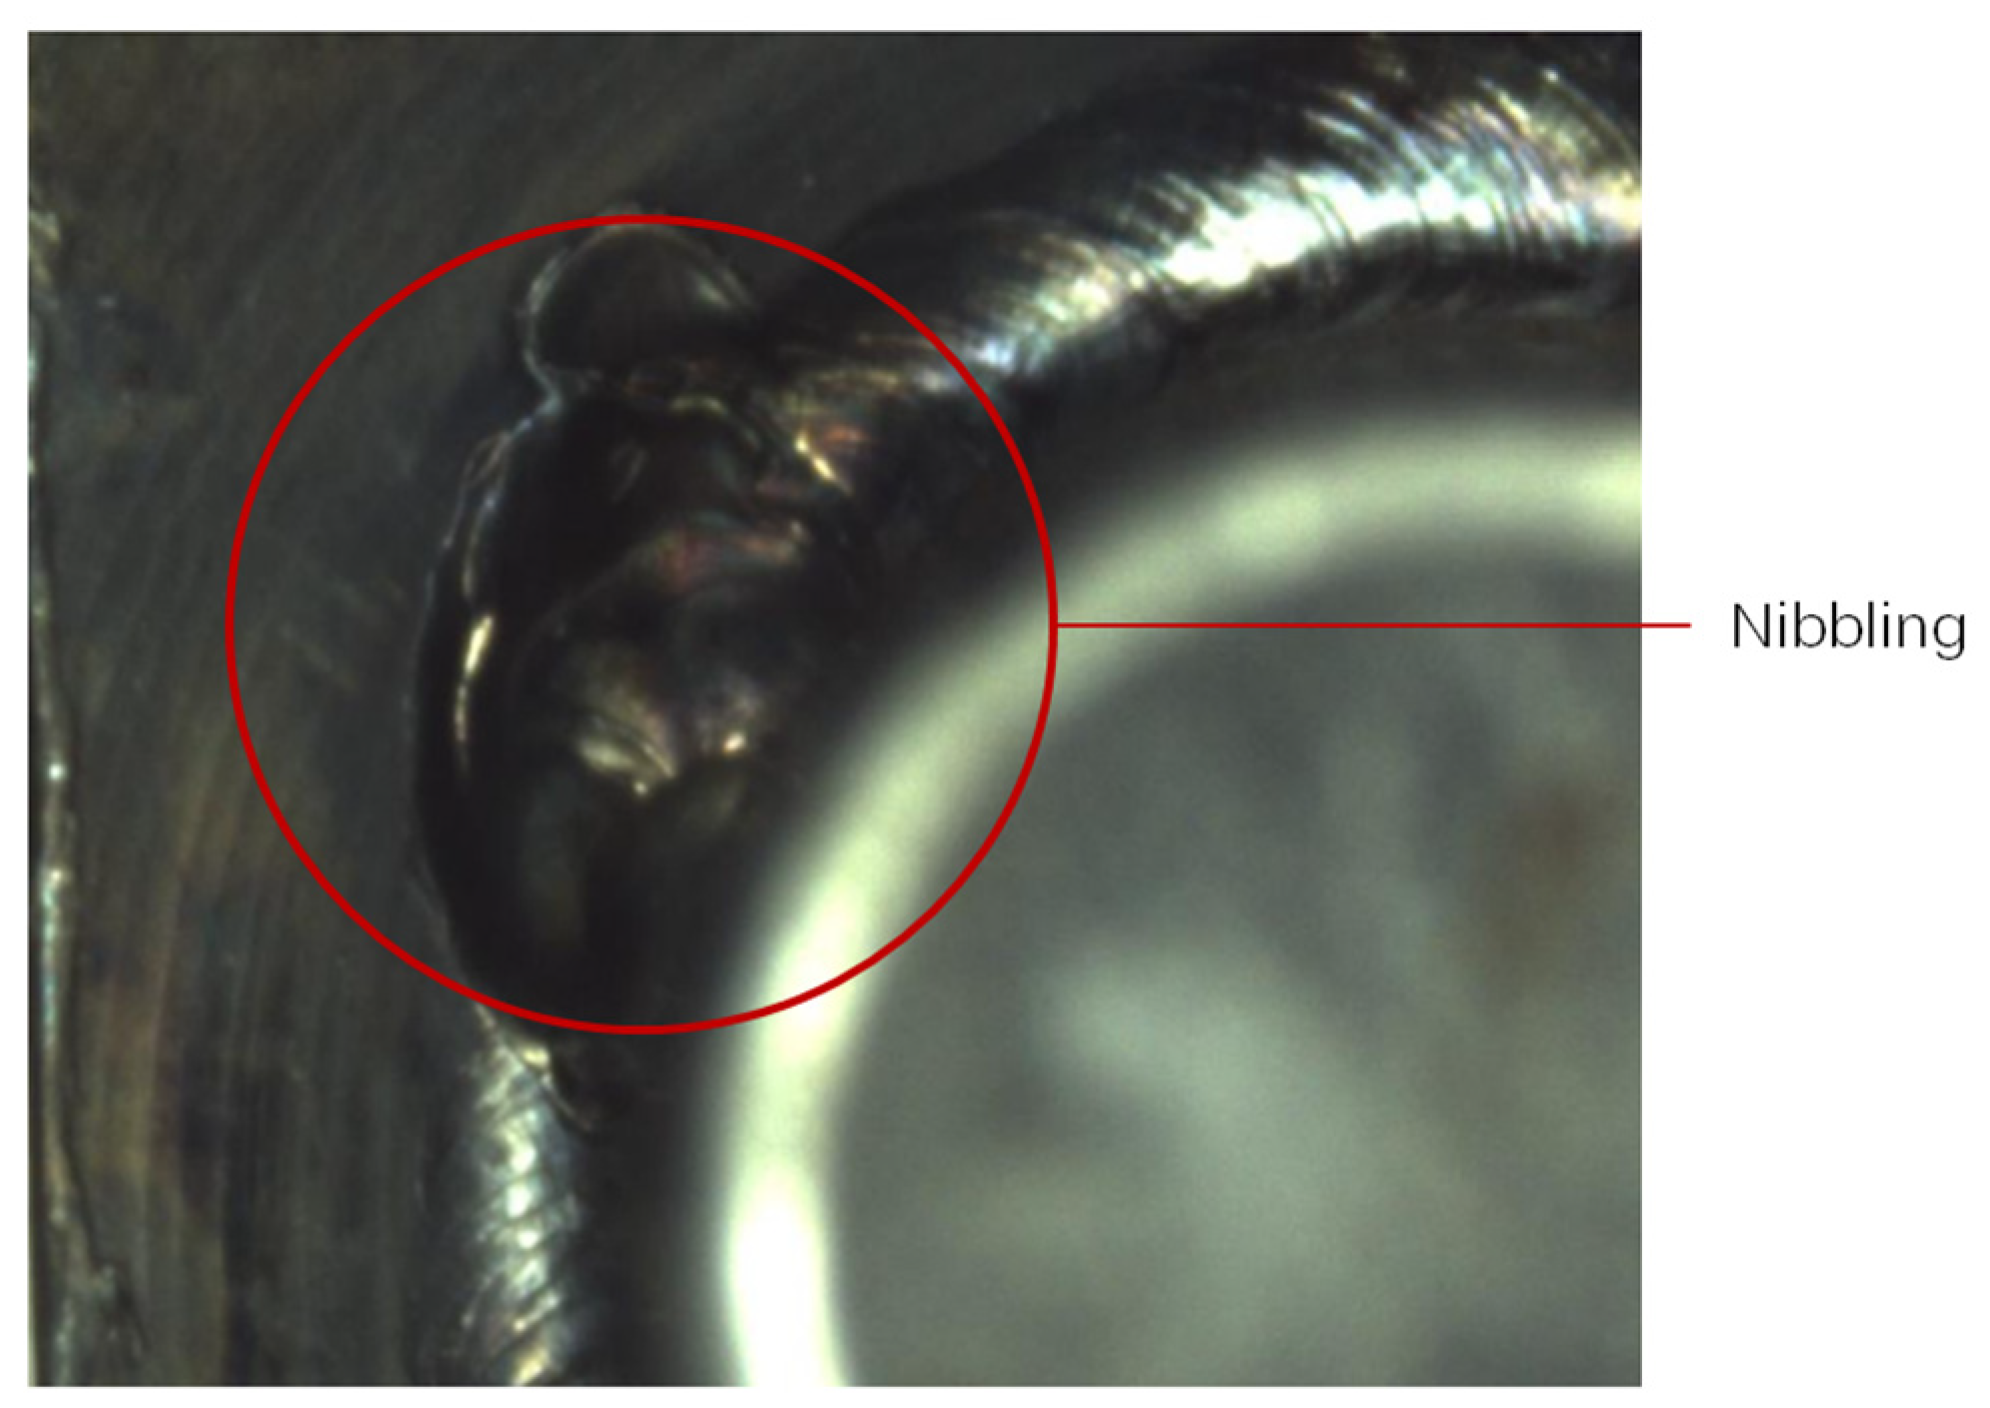
Machine vision inspection technology is used to identify common defects in laser-welded automotive brake joint welds, such as pits, holes, and bottom cuts, and to achieve comprehensive inspection of the entire workpiece. In this process, image-processing algorithms for laser welds of automotive brake joints are studied to detect and classify defect features. Through this method, we can improve the efficiency of automobile brake joint welding quality inspection, and then improve the production efficiency of enterprises.
In the process of image acquisition of laser weld of automobile brake joints, it is affected by the working light environment and camera performance. The image-smoothing technology is used to effectively remove the noise in the image, and the image contrast enhancement method is used to process the features of the interesting region in the image to obtain a clearer image. To improve the accuracy, edge detection technology is used to obtain the characteristics of the weld surface, and the contour detection technology is used to obtain the surface defect profile.
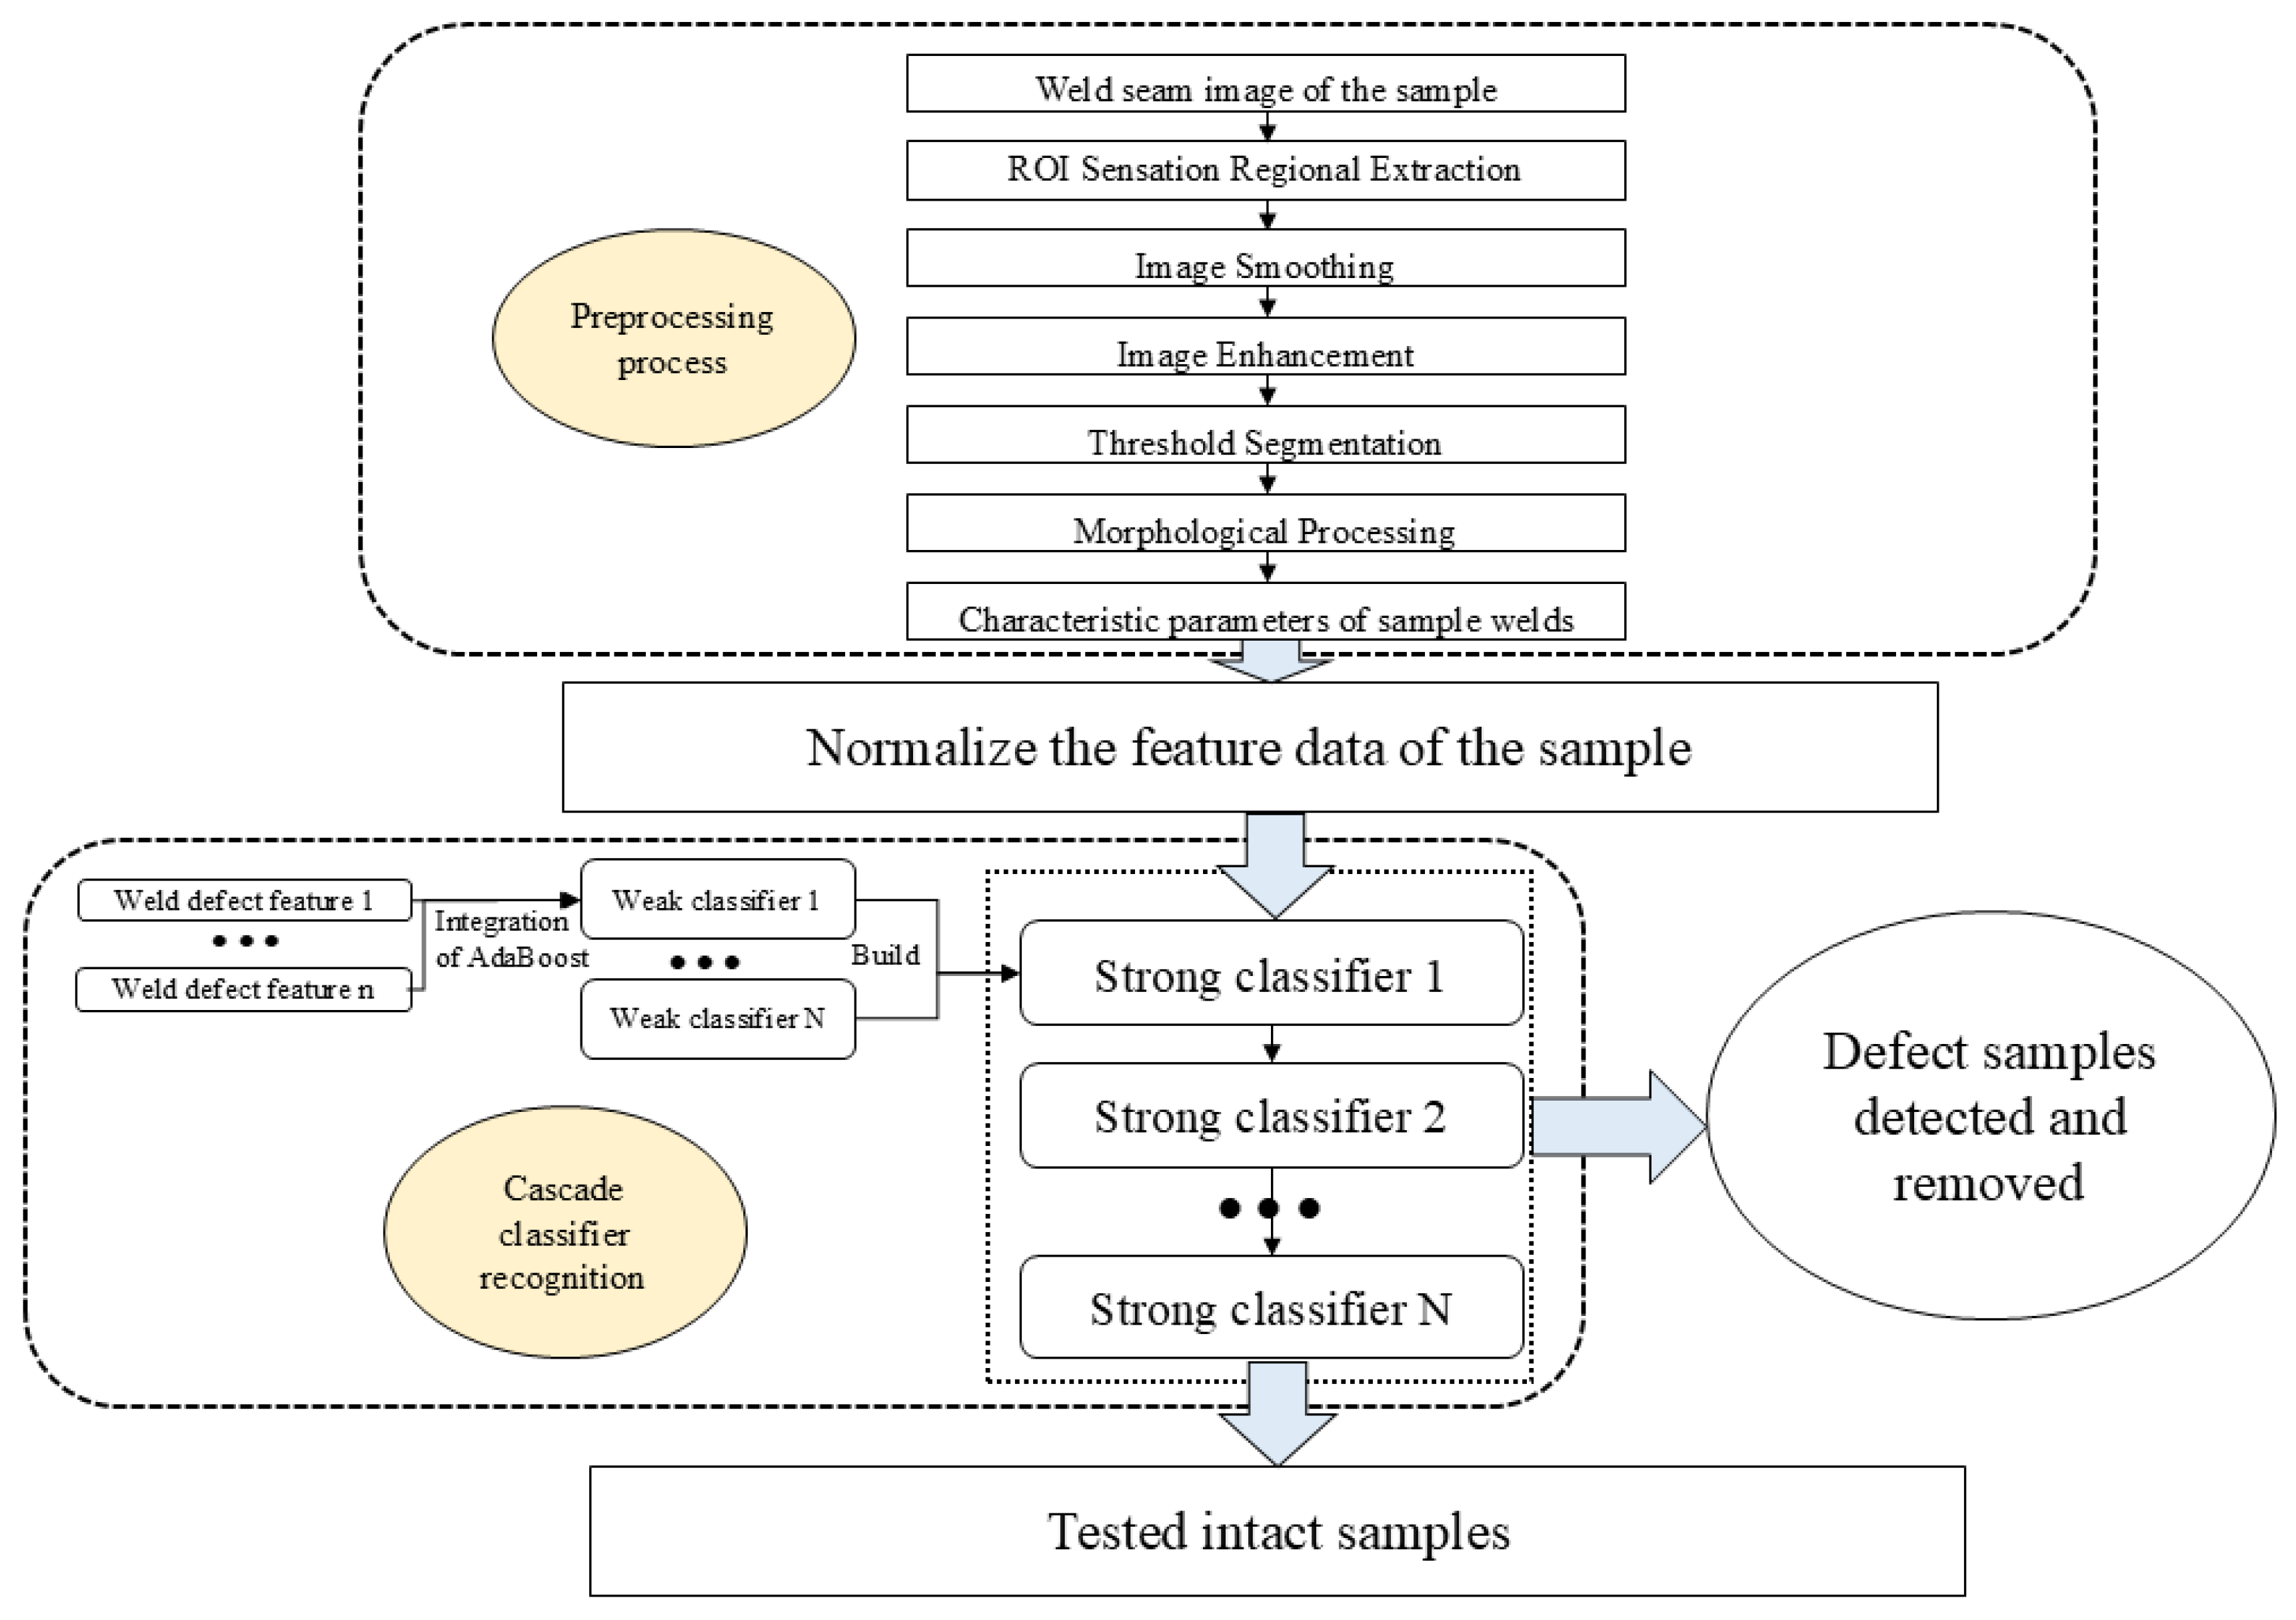
Figure 6 shows a series of processing procedures for weld seam images. Firstly, the captured weld seam samples are preprocessed through ROI region extraction, image smoothing, image enhancement, threshold segmentation, and morphological processing to obtain the corresponding defect feature parameters. After normalizing the obtained defect parameters relative to the weld seam, the cascaded classifier is adapted to classify and screen the processed weld defect parameters, remove defect samples from the samples, and finally retain intact weld samples. The arrows in the figure represent the detection and processing flow of weld seam images. The dots in the figure represent the omission of a large number of classifiers.
Figure 7 shows the original image of the weld seam of the car brake joint obtained.
3.1. Image Processing Flow
- (1)
ROI Interested Area Extraction
ROI (region of interest) is a technique for extracting regions of interest. In the process of ROI extraction, the target object is positioned as the region of interest, and the high fidelity of the content of the target object is ensured by removing background interference [
38].
ROI extraction technology is used to reduce the redundancy of subsequent image data for the weld seam images of the left and right halves of the car brake joint. Due to the semi-circular shape of the weld detection area, the least squares method was used to obtain the center and radius of the inner and outer circles of the weld. By using the semi-circular ROI extraction algorithm, the weld seam and end-face regions in the left and right half circle weld seam images can be separated, thereby accurately extracting the weld seam region of the car brake joint.
Figure 8 shows the weld seam image after extracting the ROI.
- (2)
Image-Smoothing Processing
On the premise of preserving the details and features of the original image, image filtering can suppress the noise generated during image imaging by smoothing processing.
In order to obtain the true feature information of the weld seam image, image filtering is used to remove noise from the extracted image of the sensitive area. Image filtering is divided into linear rate wave and nonlinear filtering, and image-filtering algorithms include median filtering, Gaussian filtering, and mean filtering.
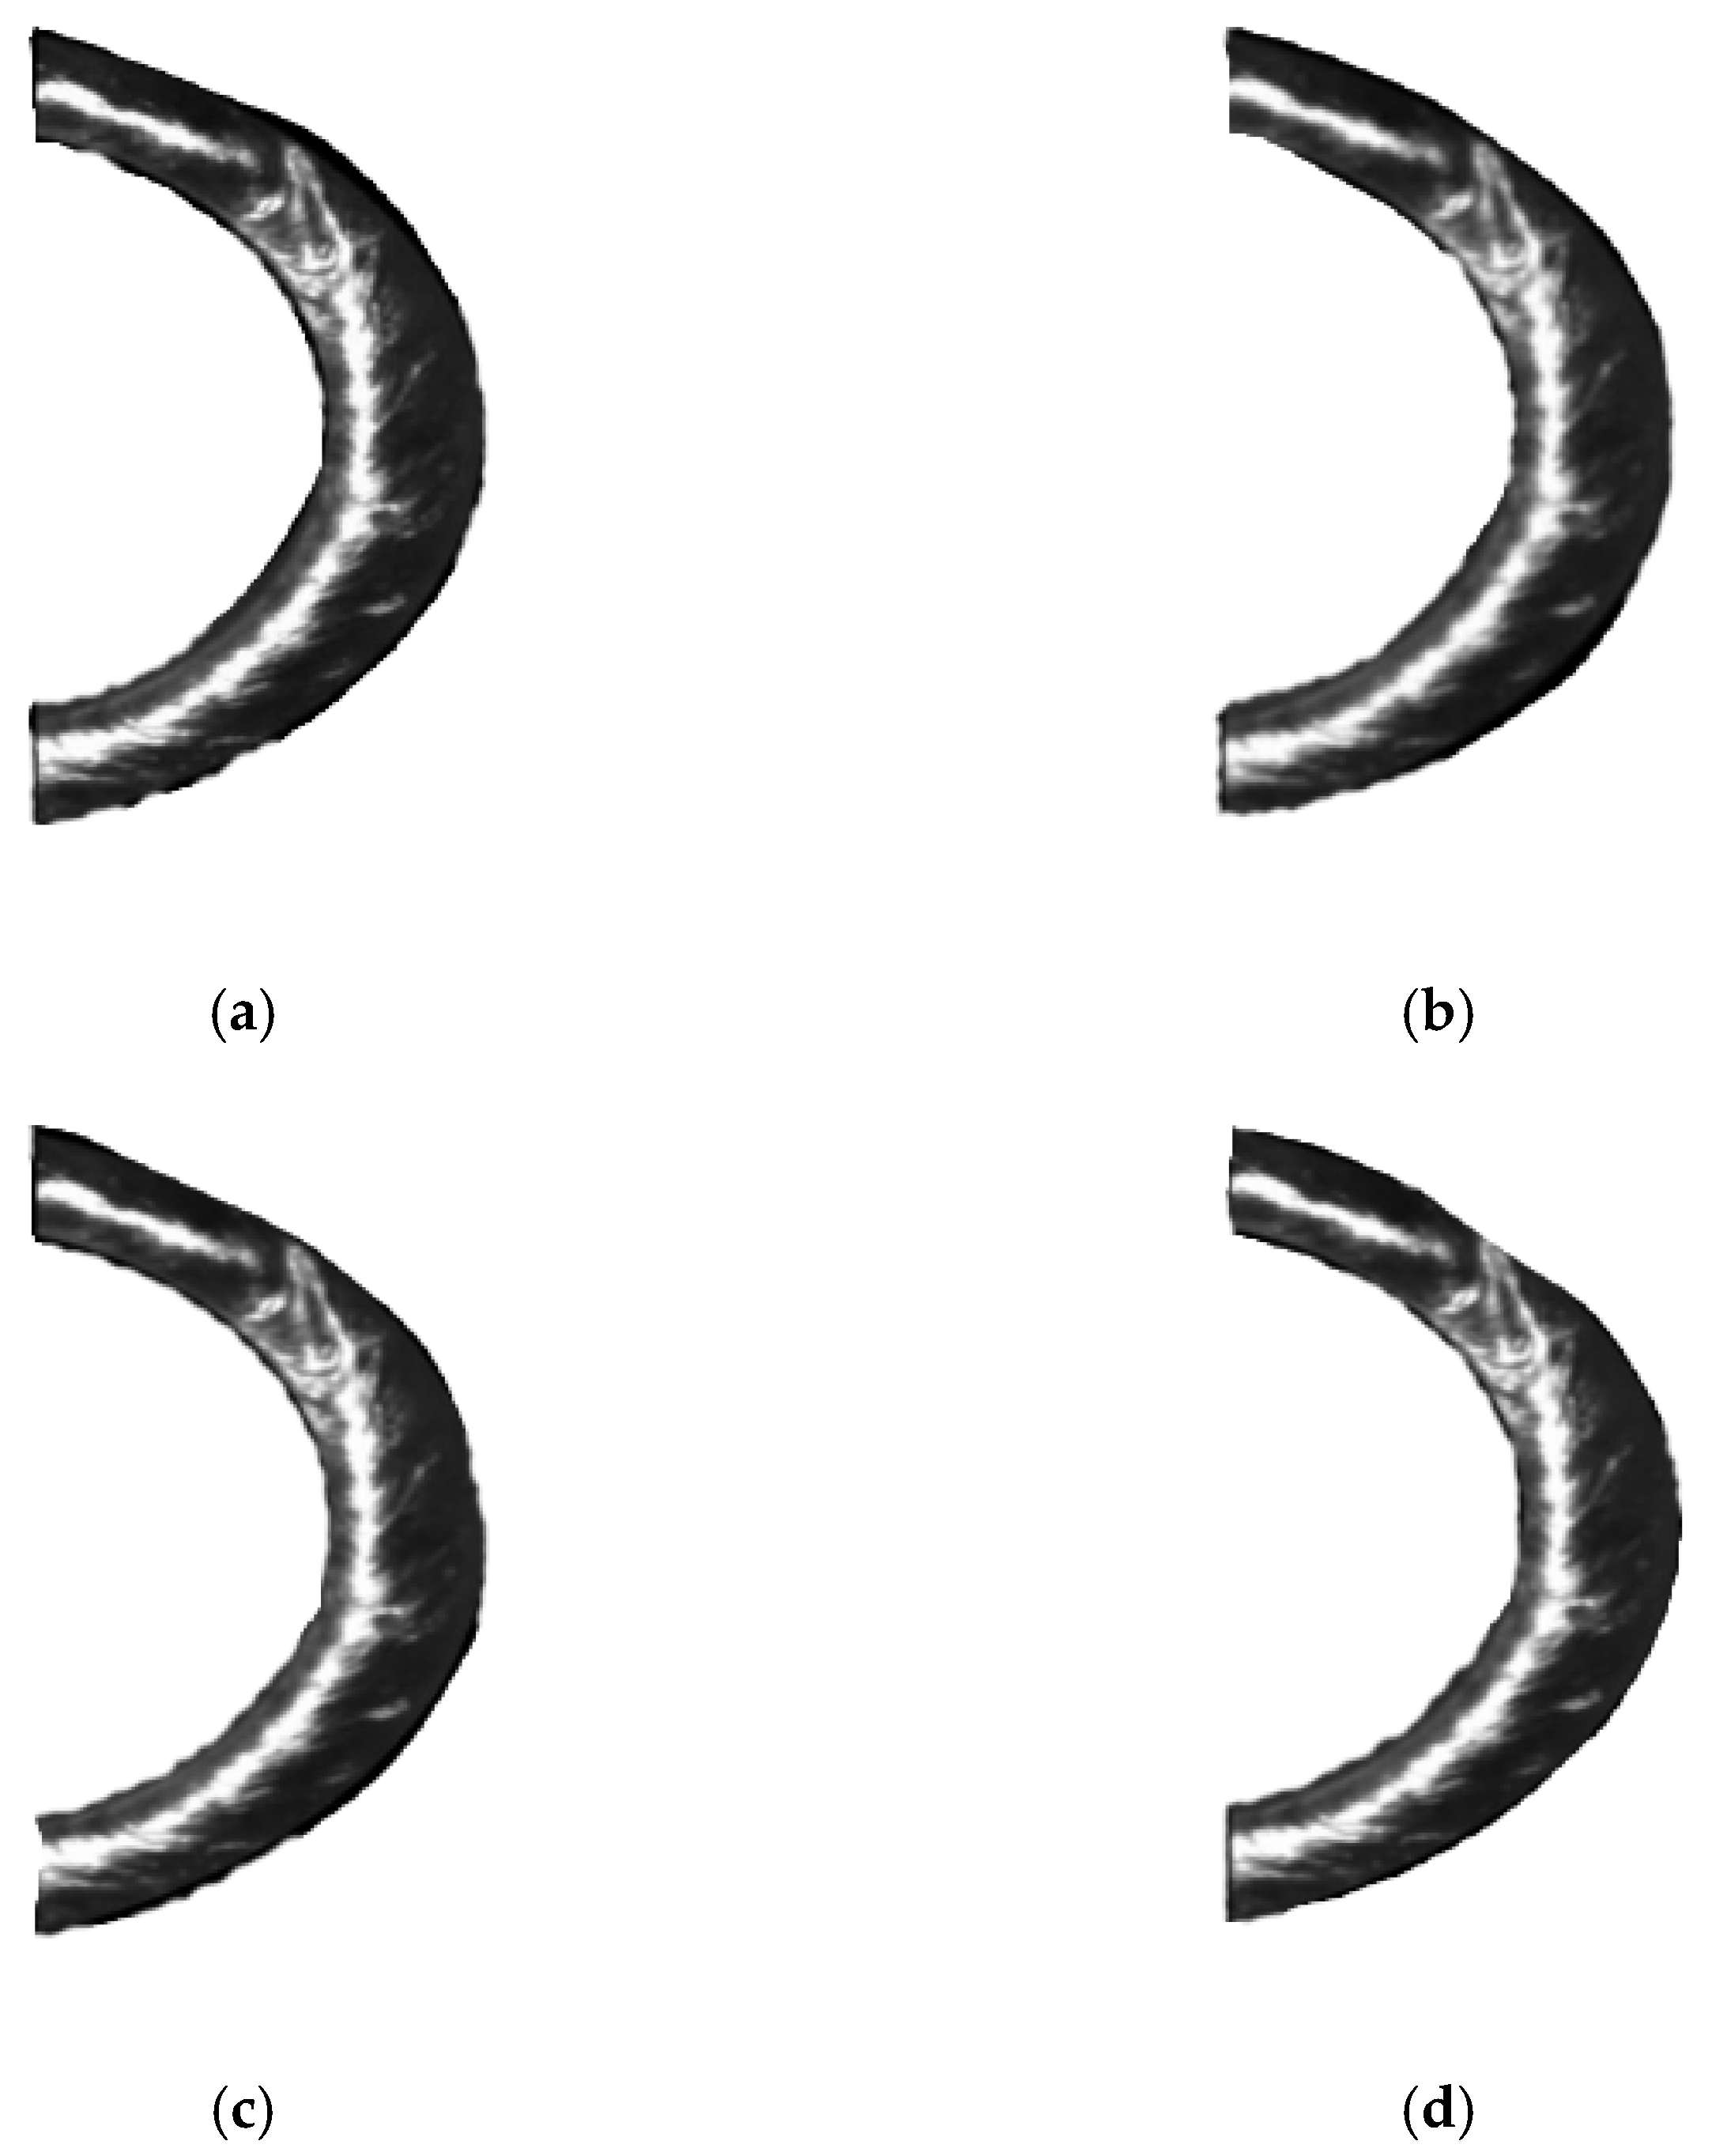
Figure 9 can be seen that a comparison was made between the three filtered weld seam images. Among the three types of filtering, the median filtering has the best effect, which not only eliminates the salt and pepper noise in the weld seam image, but also improves the image contrast, making the image surface smoother and allowing more details to be seen. Meanwhile, the edge information of the weld seam image has not been eliminated and still maintains good resolution and clarity. Therefore, the median filtering method was chosen to process the image.
In simple terms, median filtering is the process of scanning a box of odd-numbered points in an area around a target pixel, using the median value of all pixels in the scanning box to replace the pixel value of that point. If it is a scanning box with even points, the average of the two middle values is used to represent the value of the pixel at this position. This intermediate value filtering has a good filtering effect on pulse noise, and can effectively preserve the edge and defect features of the image.
The following intermediate value
is obtained from the
dataset sorted in the following order of magnitude:
If the input data is
, let
, The intermediate value obtained is the result of median filtering processing, and the intermediate value
is obtained as follows:
- (3)
Image Enhancement Processing
Due to various reasons, the weld seam image after image-smoothing processing has the disadvantages of insufficient contrast and difficulty in distinguishing details. Therefore, we continued to choose the method of image gray-scale transformation to improve the quality of the weld seam image, expanding the original gray-scale range to a more suitable gray-scale range. Nonlinear gray-scale transformations include exponential transformation functions, power transformation functions, and logarithmic transformation functions to enhance images. Linear gray-scale transformation relies on efficiency, controllability, and structural fidelity. It can improve the contrast between defects and background at a millisecond rate, providing low-noise and high-fidelity input for subsequent algorithms. Therefore, we choose the linear gray-scale algorithm to process the smoothed weld seam image.
where
is the slope of the standard linear transformation and
is the intercept of the standard linear transformation function on the
axis. In the gray-scale transformation, when
, the output image contrast will increase; when
, the output image contrast will decrease; when
and
, the whole image linkage degree changes with the change in
; when
, the whole image brightness of the high region will become darker, and the whole image brightness of the dark region will become brighter. The linear gray-scale enhancement effect of the weld seam image is shown in
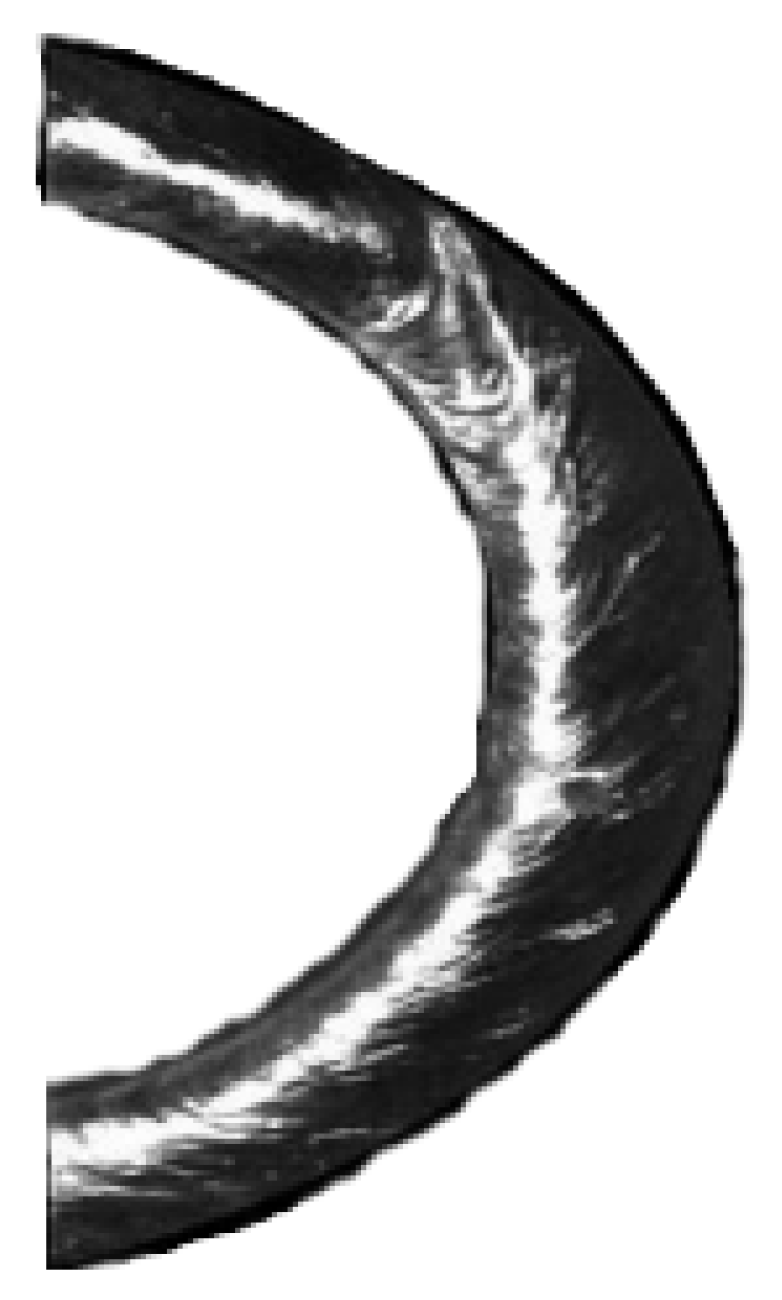
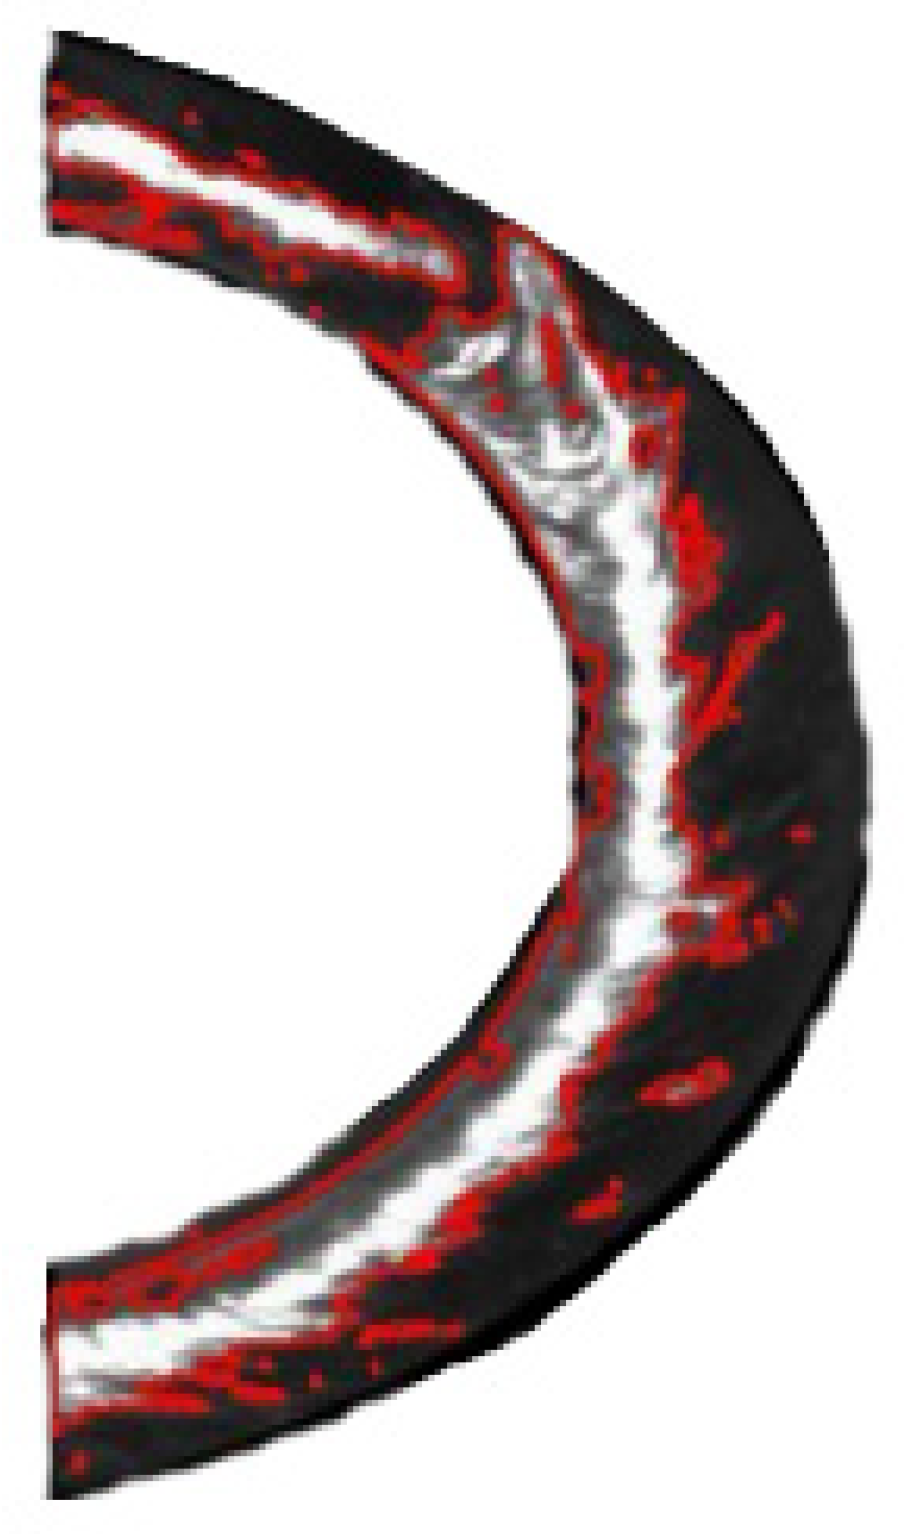
Figure 10. The highlight area in the processed weld seam image is shown in
Figure 11.
- (4)
Threshold Segmentation Processing
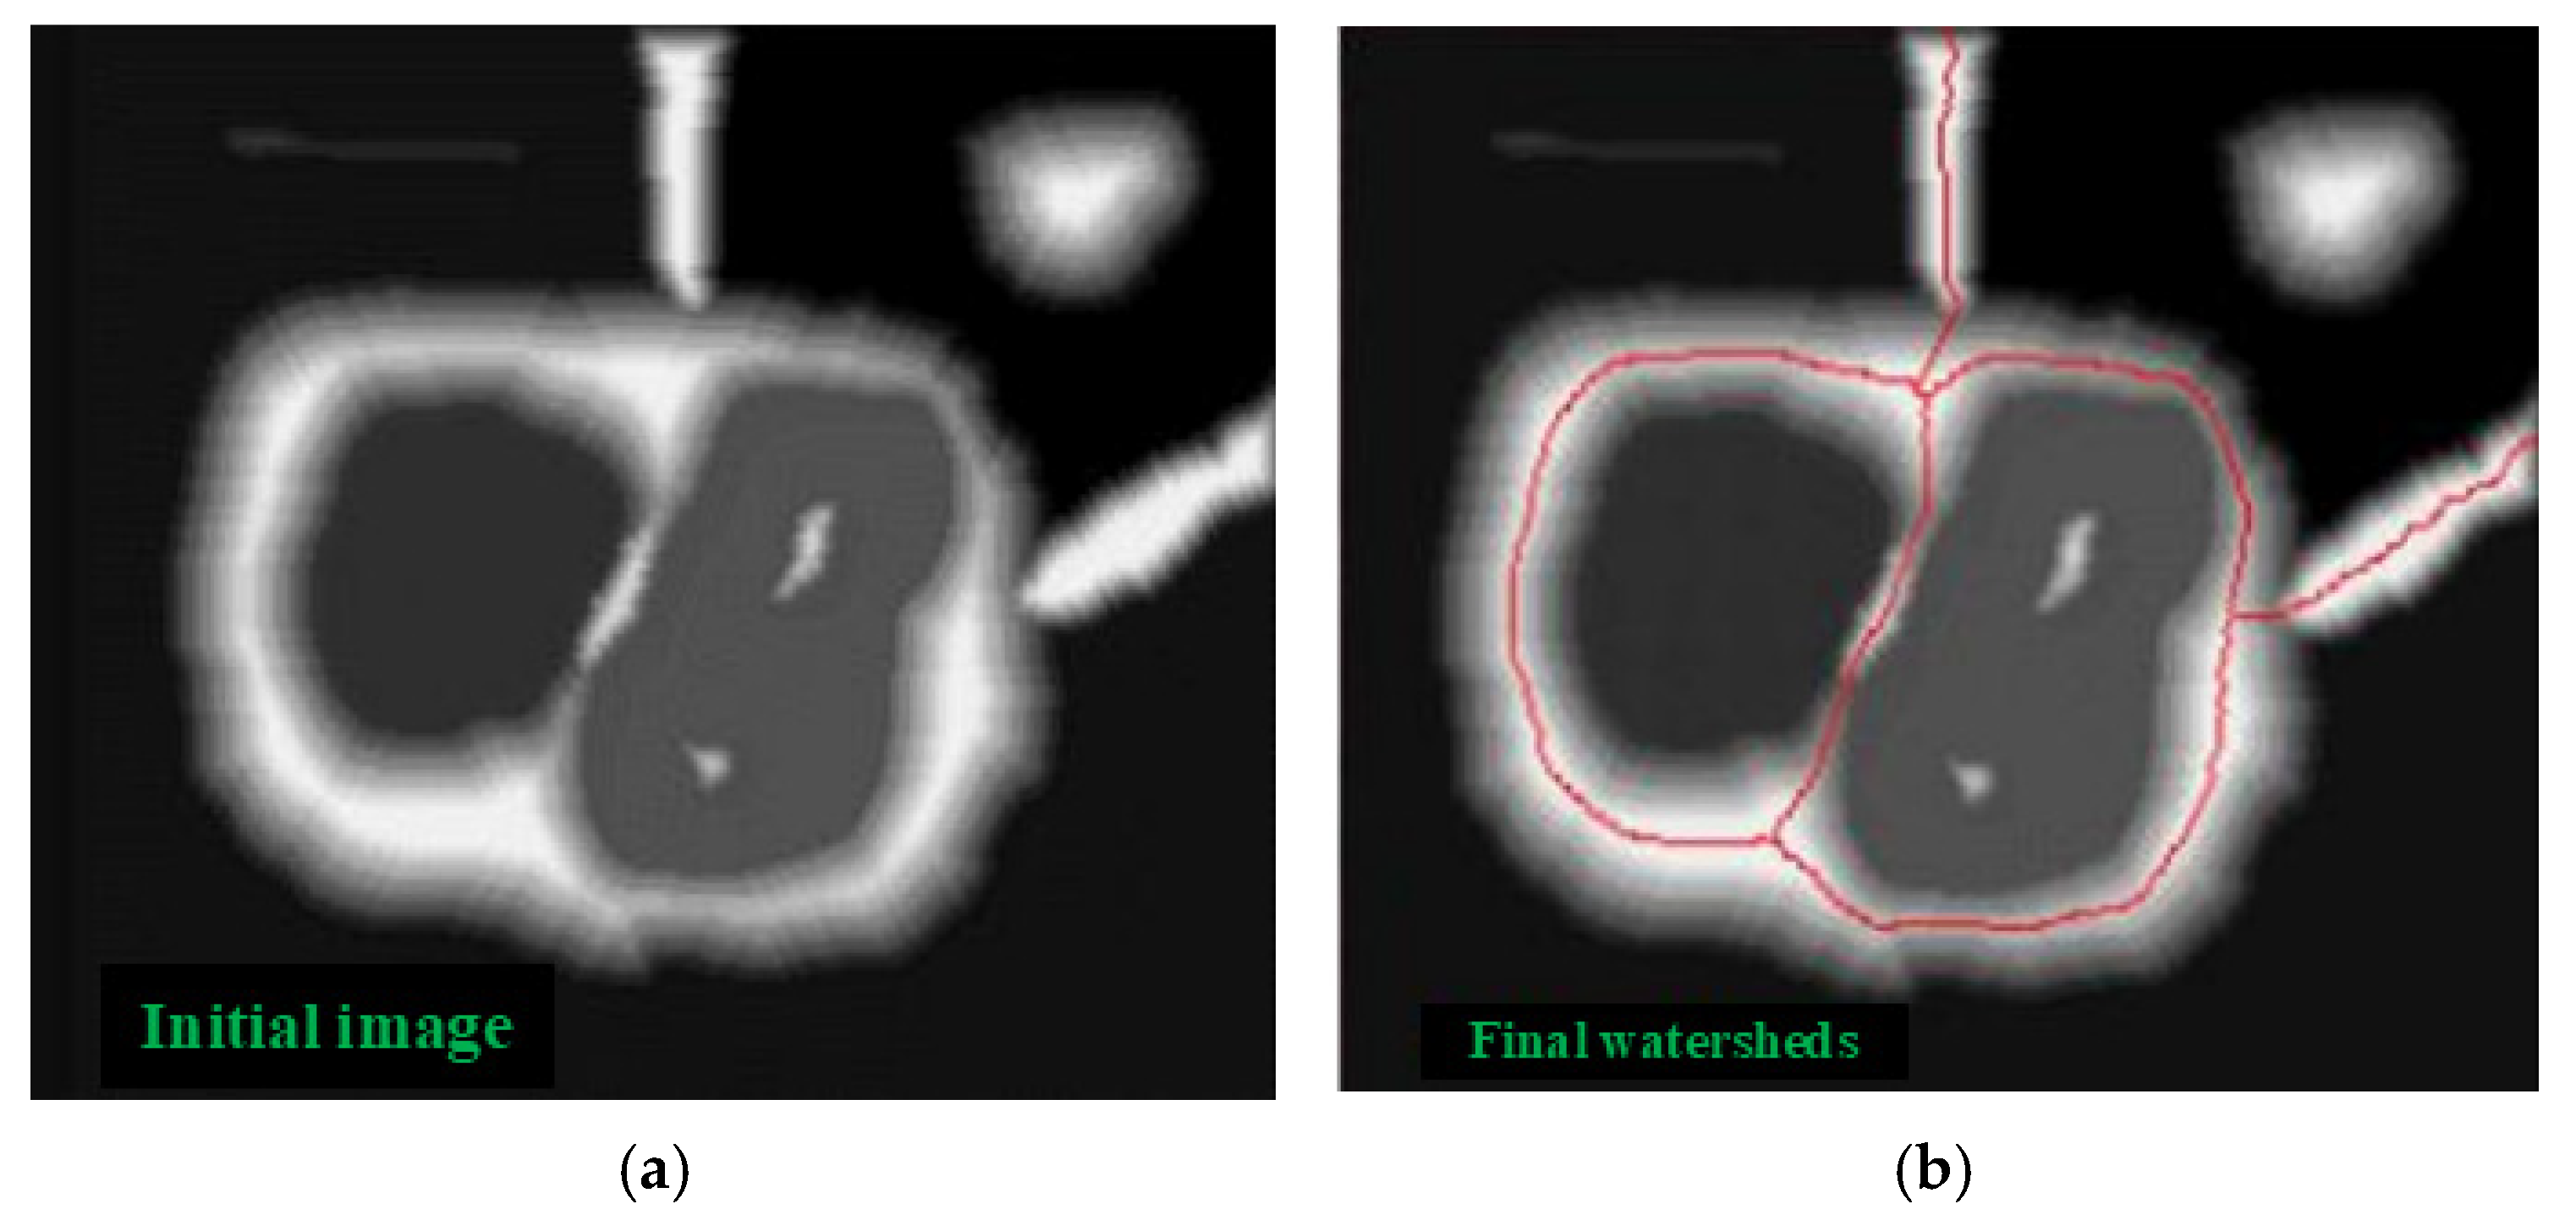
When using machine vision detection technology to analyze laser weld images of automotive brake joints after image enhancement, there are problems such as overlapping gray distribution defect areas and complete areas, as well as overlapping gray values between defects and noise, which make defect extraction difficult. To solve this problem, the watershed algorithm was introduced, which can accurately partition weak boundary regions in the image, thereby obtaining connectivity and closed contours of the regions. By applying the watershed algorithm to the weld seam image after removing the highlight area, we can accurately segment the defect area.
The watershed algorithm was introduced, which is able to accurately divide the weak boundary regions in the image to obtain the connectivity and closure profiles of the regions. By applying the watershed algorithm to the weld image after removing the highlight area, we can segment the defect area accurately [
39]. The image after removing the highlight area from the weld seam image segmentation is shown in
Figure 12.
The calculation of the watershed is a process of iterative labeling, and the result of the watershed calculation is the image after the input image gradient calculation. The regional boundary point in the gradient image is the watershed, which represents the maximum value point of the input image and can reflect the edge information of the image. The formula for calculating watershed is as follows:
where
denotes the input image,
denotes the gradient operation, and
is the output image.
We continue to use the watershed algorithm to segment the weld seam image on the weld seam image after removing the highlight area, separating the defect area from the interference area. The first step is to sequentially scan the gradient layer of the weld seam image to obtain pixel points, and sort them in ascending order of their gradient values; the second step is to determine and label the pixels in the image in a first-in, first-out order based on the gray-scale values obtained from scanning. Finally, the pixels in the minimum gradient influence area are obtained, and the edge contour of the image area is drawn to form a watershed by calculating the minimum pixel points, thus achieving image watershed segmentation.
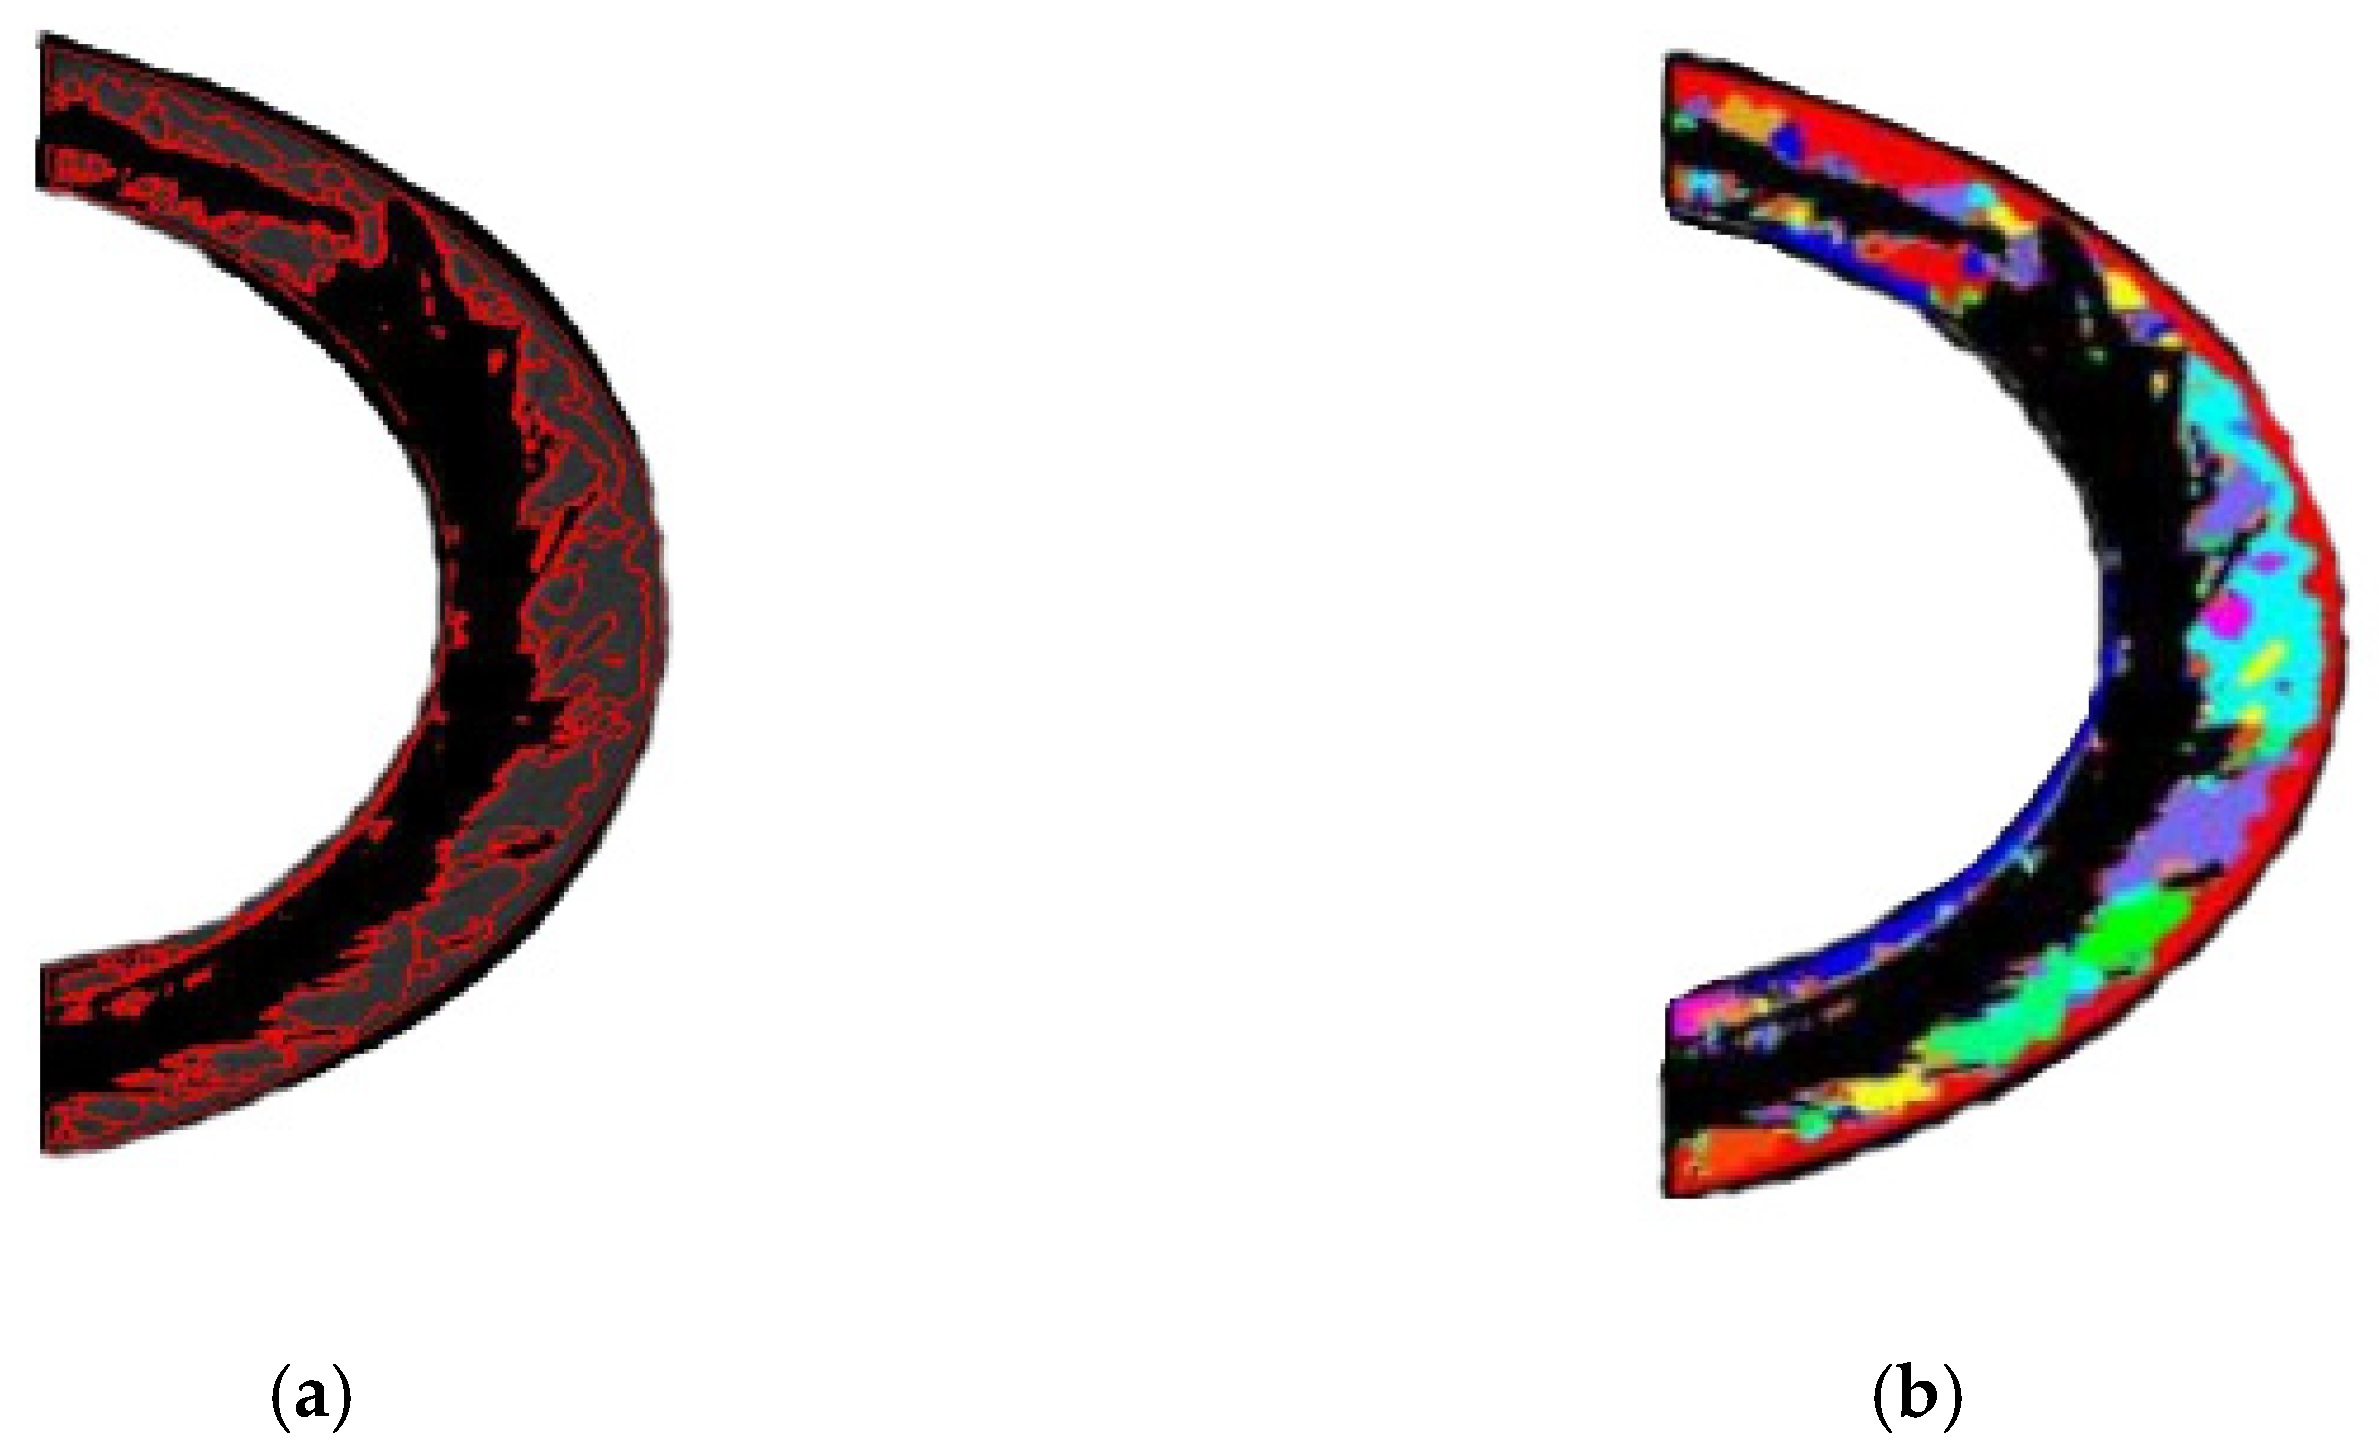
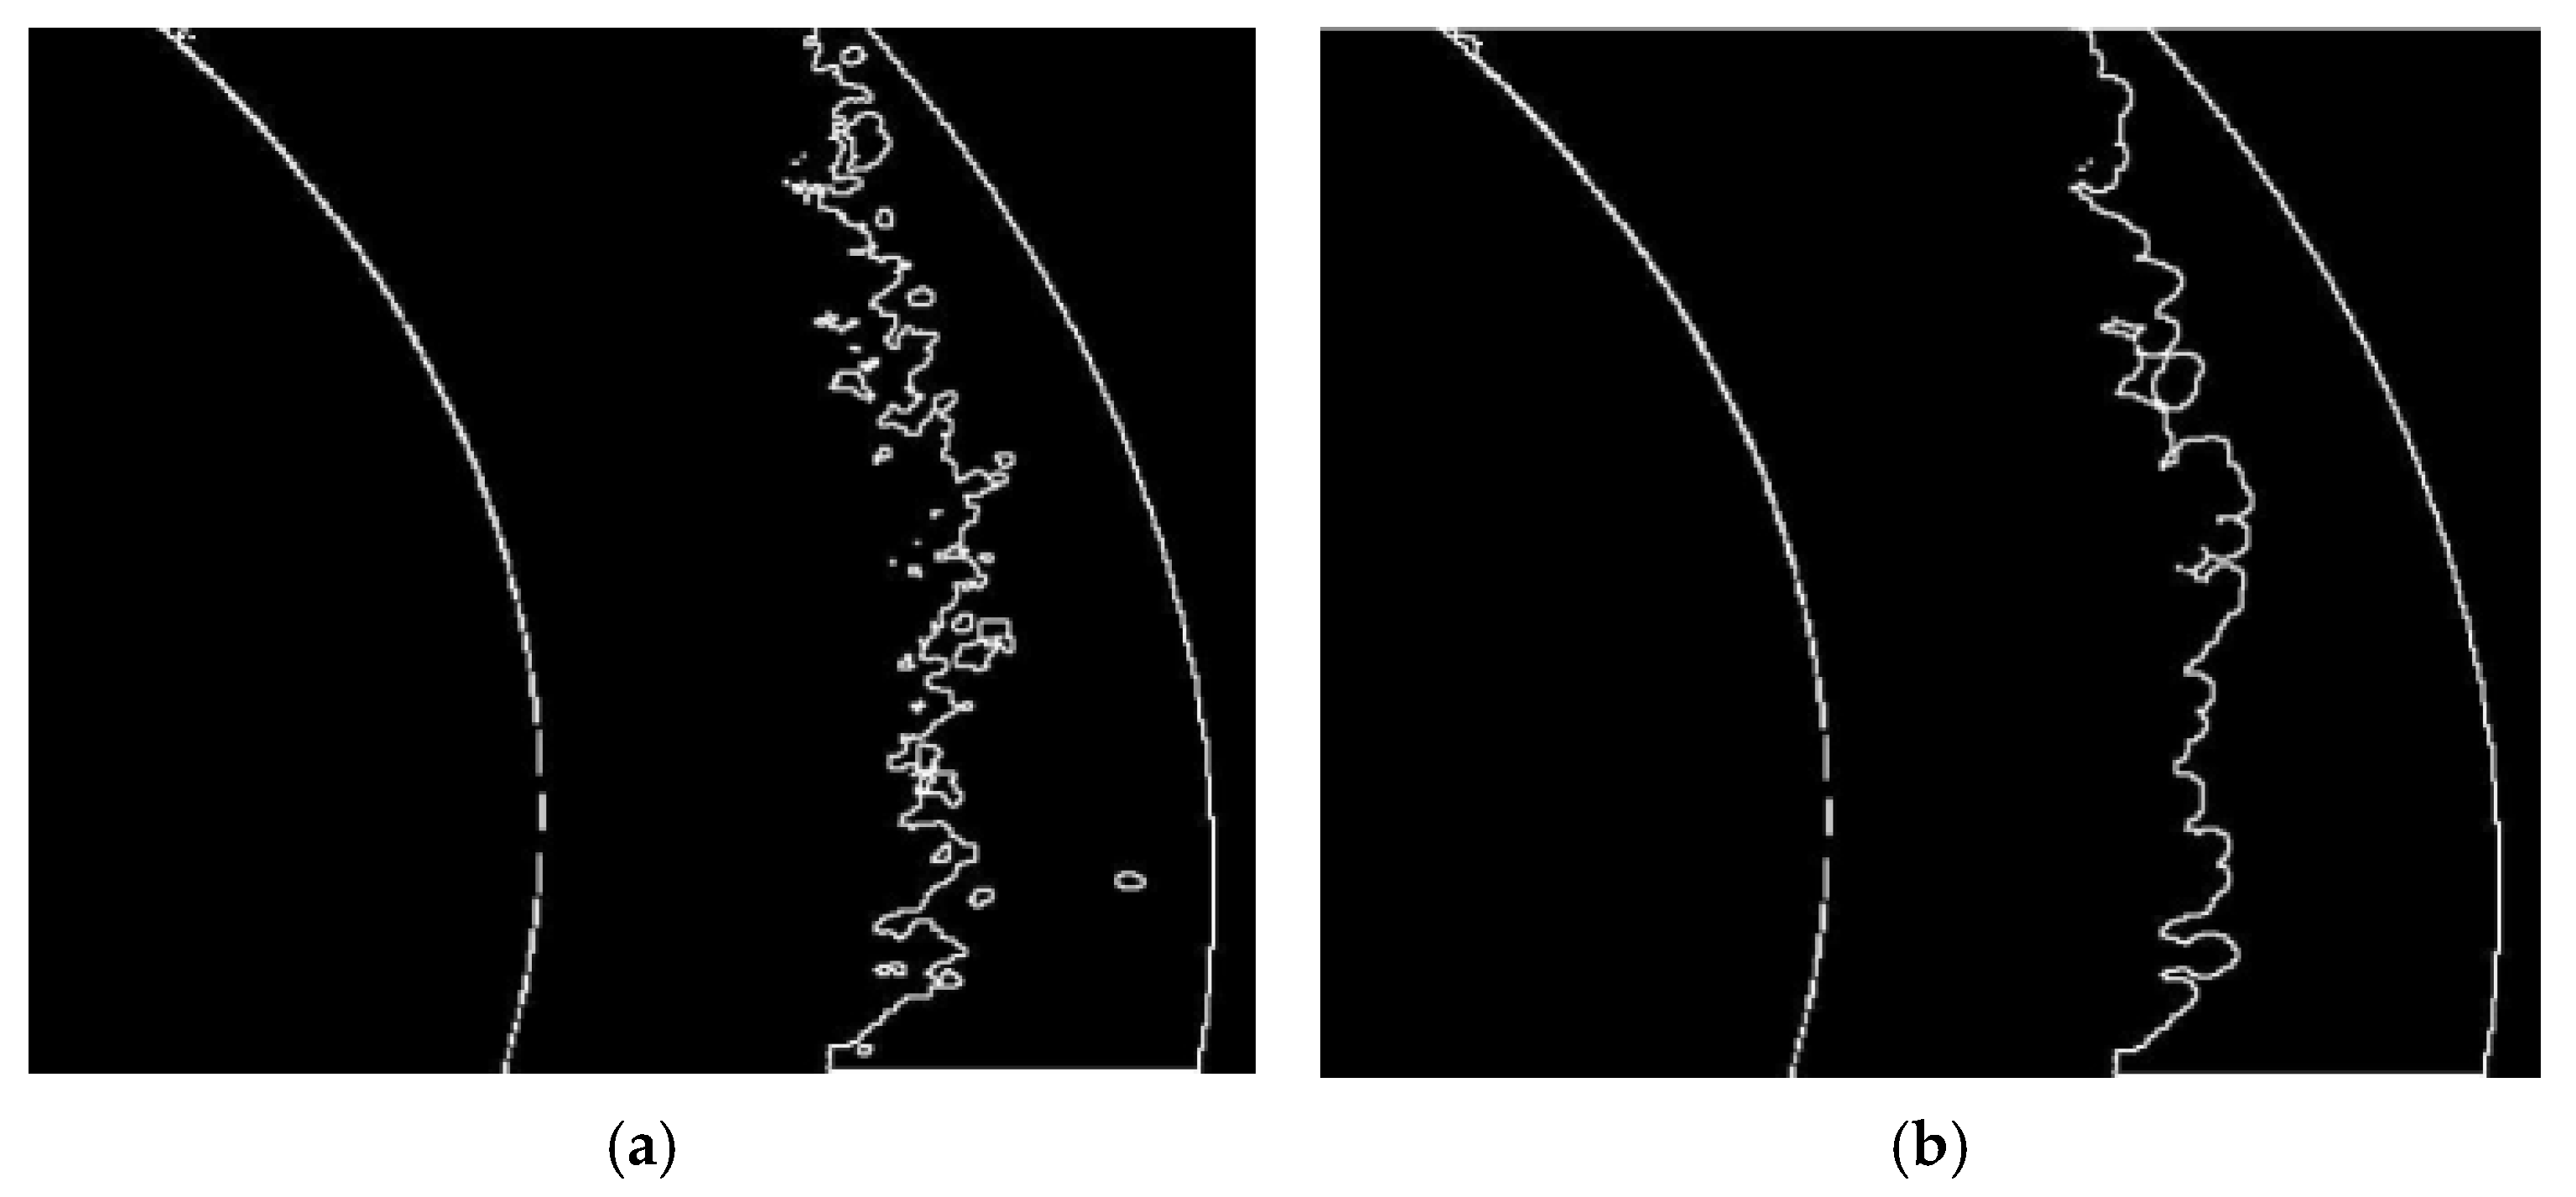
Figure 13 shows the weld image obtained after dividing the watershed.
Figure 13a Outlines the edge contour of each region of the weld image, and accurately obtains the connectivity and closure contour of the region. In
Figure 13b, different colors are used to identify each closed area after segmentation. It can be seen that after segmentation by the watershed algorithm, the weld is divided into several continuously closed areas. After watershed segmentation, the edge characteristics of weld images are well preserved, which solves the overlapping of some regions, and provides a good condition for the subsequent analysis and extraction of defect region features of weld images.
Figure 14 shows the weld seam image after watershed threshold separation processing on the enhanced image.
- (5)
Morphological Processing
Morphological processing is performed on the segmented weld seam images, and the shapes corresponding to the main morphological structures of weld defects are measured and extracted. Expansion and corrosion treatment methods are used separately.
a. Expansion Processing
The input image
is defined by the structure element
expansion, as follows:
where
,
are the definition domains of the input image
and structure elements, respectively.
The meaning of the image expansion operation is to translate each point of image in the opposite direction by , then add the translated image to and take all the values in to obtain the maximum result. It is equivalent to mapping the structural elements with respect to their own references, using the mapped structural element as a template to move and scan the image, and adding the pixel values in the area covered by the template with the corresponding values of to obtain the maximum value as the value of the current pixel point.
the image, the structure element
and the structure element do the mapping about the origin of the structure element
. After mapping, the structure element
translates to a position on the image with the scanned input image after the expansion process structure. As a result of numerical summation and maximization, the value of the expanded image is larger and the image is brighter than before the expansion.
Figure 15 shows the effect image after dilation morphology processing.
b. Corrosion Processing
The input image
is defined by the corrosion of the structure element
:
It is similar to the expansion process, the structuring element scans through the input image and subtracts
from
to obtain the minimum of the desired values and the value of the target pixel. The corroded image is darker due to numerical subtraction and minimization.
Figure 16 shows the effect image after corrosion morphology processing.
3.2. Feature Extraction Normalization and Classifier
- (1)
Feature Normalization
In the field of machine vision, the detection system realizes the recognition of defects by extracting the features of image defect content information and training these feature parameters. Image feature extraction refers to the process of obtaining data and information parameters that can represent or describe the target from the image.
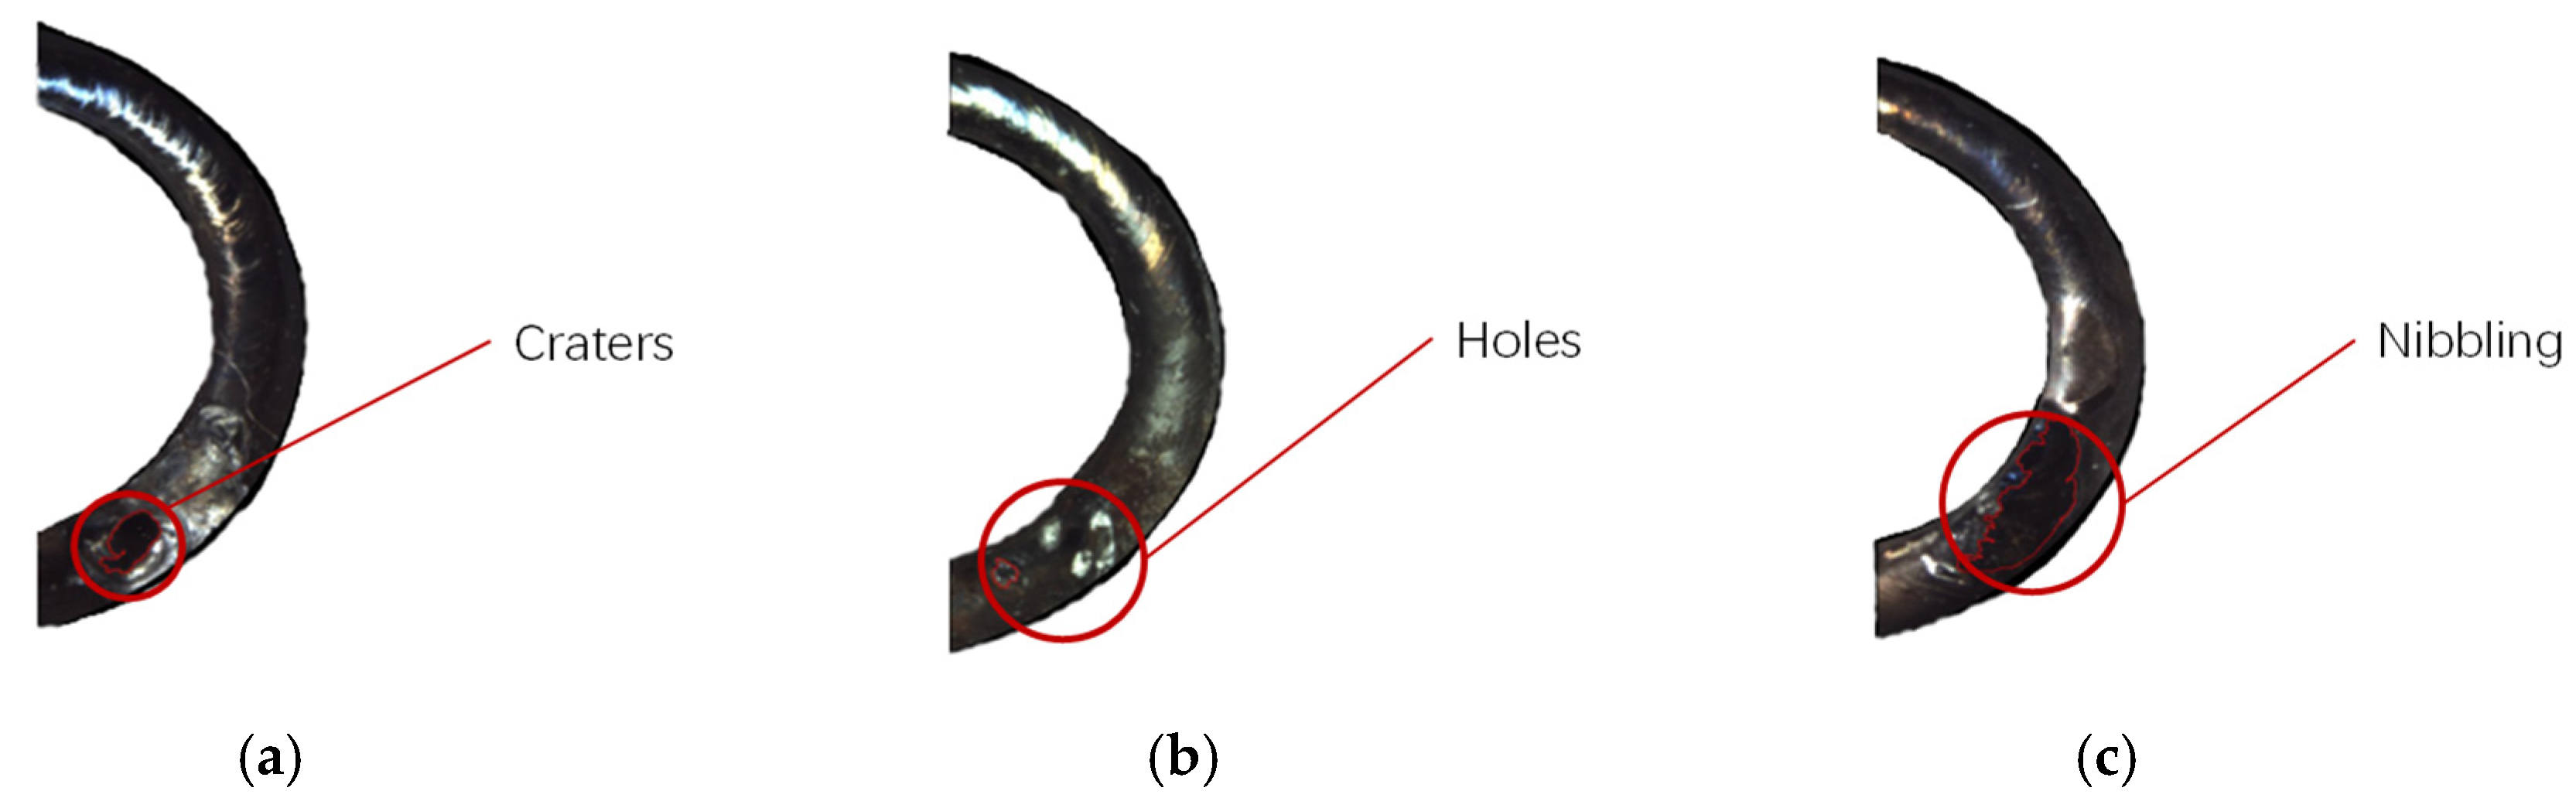
After image segmentation, an image sample is selected for three kinds of weld defects such as craters, holes, nibbling, and the contour of the defect area is collected. Then defect feature extraction is carried out according to the nine feature vectors of the above three features, and the defect image sample is calculated by the feature formula above to complete the extraction of the feature vector parameters.
Figure 17 shows the defects detected after a series of processing.
Table 1 shows the extracted feature vector parameters.
At the same time, there are significant differences between different feature vector parameters with the same feature category, and there are also large differences between the same feature vector parameters with different defect categories. If these different feature parameters are combined into feature vectors as the input of the classifier, the information distribution will be uneven, which will affect the data analysis results. The feature parameters of larger values take a larger proportion in the feature vector, while those of smaller values are easy to be ignored, thus affecting the learning speed and classification accuracy of the subsequent classifiers. Therefore, in order to ensure the consistency and certainty of the feature data of each defect, this paper adopts data normalization processing for the feature vector parameters to make the feature parameters have a stronger correlation, so as to improve the learning and classification efficiency of the classifier. Maximum–minimum normalization is a commonly used data normalization method, which compresses and expands the data series by dividing the maximum and minimum values. This method maps the original data to the standard data distribution with a mean of 0 and a variance of 1, which improves the accuracy of data processing and is a common data processing method [
40].
Let the minimum value of attribute
be
and the maximum value be
, and map an original value
of
to the value
in the interval [0, 1] using the highest value normalization, then
is the normalized value, and the normalization formula is as follows.
It can be seen from
Table 2 that after the maximum and minimum standardization treatment, the characteristic parameters of each defect in the weld are in the same order of magnitude and the range of value changes is small.
It can be seen that the contrast between the feature parameters of various defect images is higher, and the topological structure of the feature vector in the feature space is not changed. It shows that the normalization of weld defect characteristic parameters guarantees the validity of data. At the same time, it also improves the operation speed for the subsequent identification of defect types of weld images by feature vector.
- (2)
Cascade Classifier
A laser welding seam defect recognition and classification method for automotive brake joints based on cascade classifiers and the AdaBoost algorithm is proposed. A cascaded classifier is a strong classifier structure that filters non target regions layer by layer through multi-level concatenation, achieving efficient and accurate object detection. This classifier combines AdaBoost’s ensemble learning capability with the fast exclusion mechanism of a cascaded architecture. Each classifier layer is responsible for filtering out a large number of easily recognizable negative samples, allowing only suspicious areas to pass to the next layer. The deeper the classifier design, the more complex it is for identifying finer features.
A weak classifier is designed based on the extracted defect feature vectors, and AdaBoost’s ensemble process is used to repeatedly adjust sample weights, forcing the classifier to focus on “difficult samples” that are difficult to distinguish. Each iteration selects the optimal weak classifier and assigns weights, and then constructs a strong classifier based on a series of weak classifiers. Afterwards, a cascaded classifier is formed based on multiple strong classifiers to form a recognizer capable of detecting normal and defective laser weld samples of automotive brake joints. The first three layers of the cascaded classifier are mainly used to filter uniform backgrounds and untextured areas, quickly eliminating more than 90% of the unaffected areas. The middle three layers mainly detect obvious defects and perform rough classification of the main areas. The last three layers are used to identify subtle defects, perform high-precision discrimination, and ultimately detect and screen out defect detection results.
Figure 18 shows the structure diagram of a cascaded classifier.
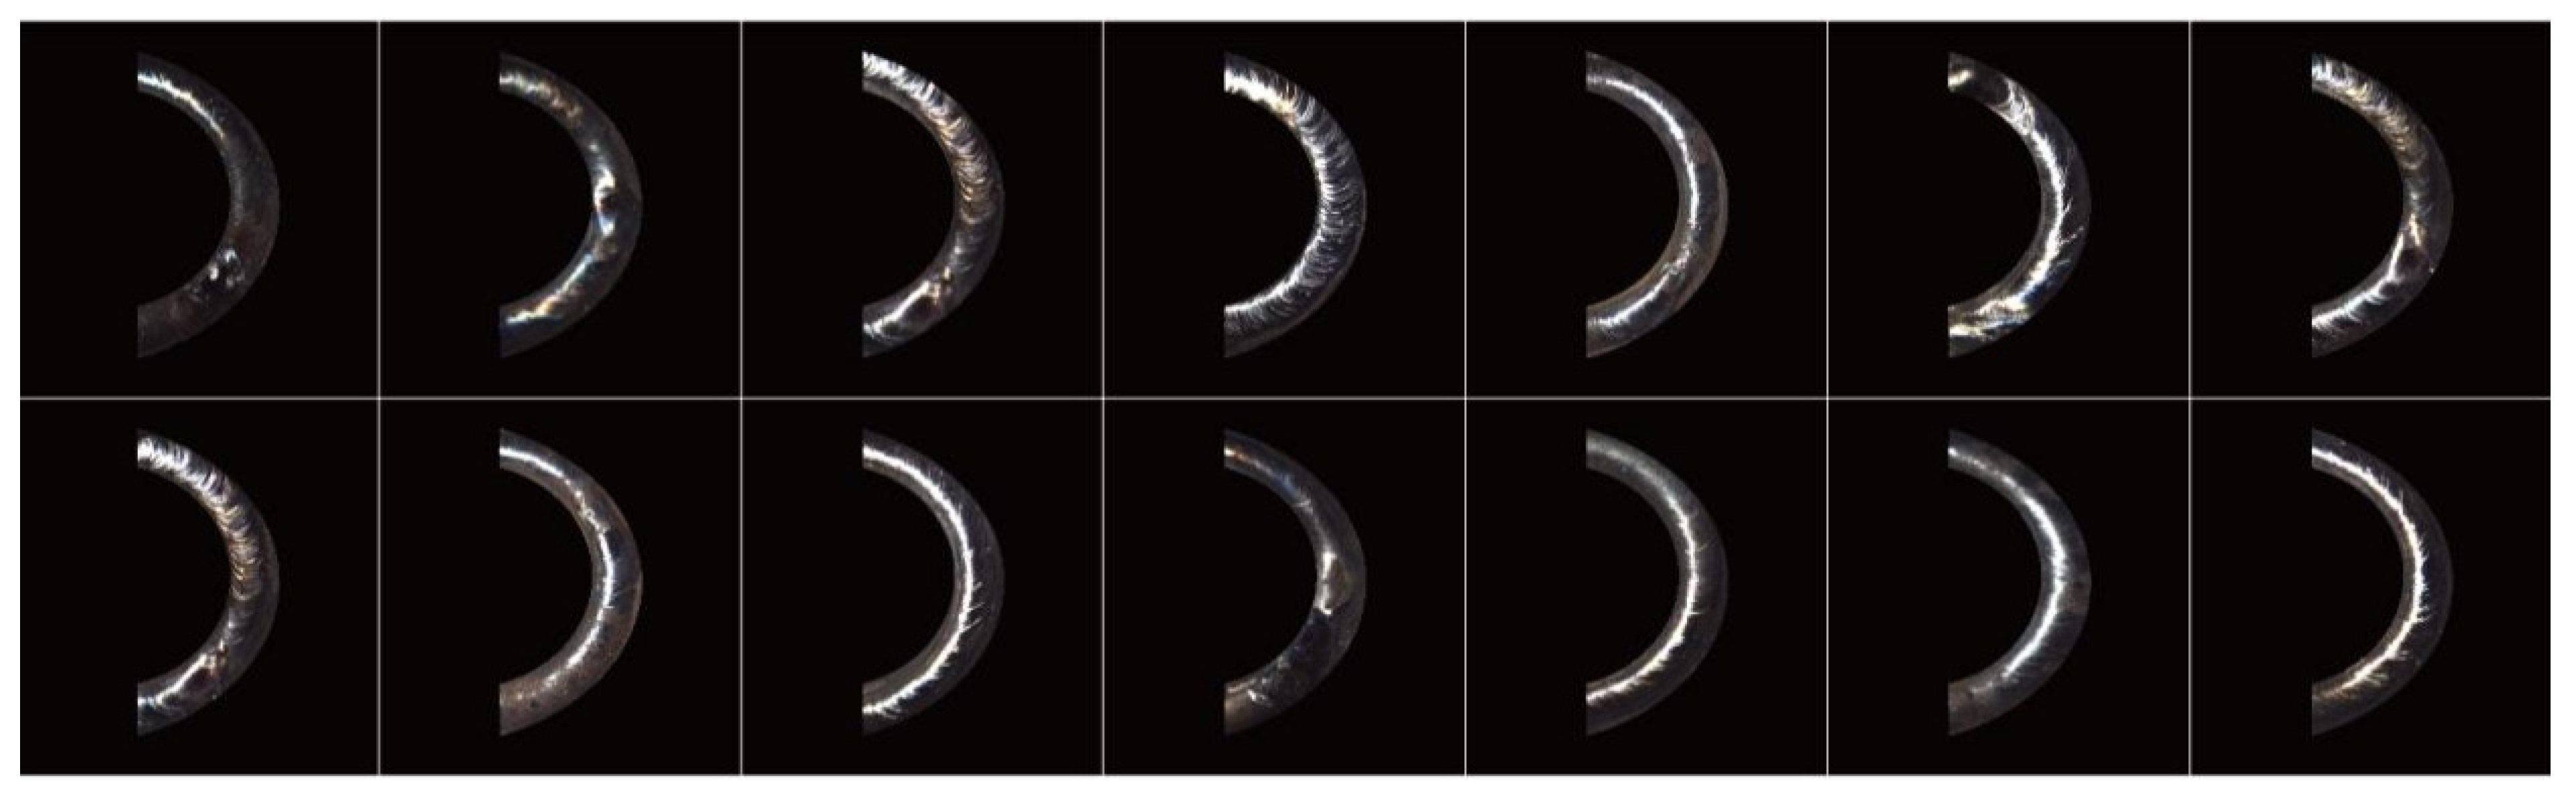
a. Positive Sample Set
The positive sample is an image containing the tested object. Due to the presence of a large amount of background in the actual laser weld seam image of the car brake joint captured by the camera, the image samples in the training set are extracted from the weld seam using a semi-circular ROI extraction algorithm to obtain positive samples, which are then normalized to unify the extracted positive sample images to the same scale. This algorithm uses a normalized image of 40 pixels by 40 pixels as the positive training sample image. The capacity of the positive sample set is 80 images, and the aspect ratio of the rectangular boxes obtained by image capture is 2:1. The positive sample set of some weld seam images is shown in
Figure 19.
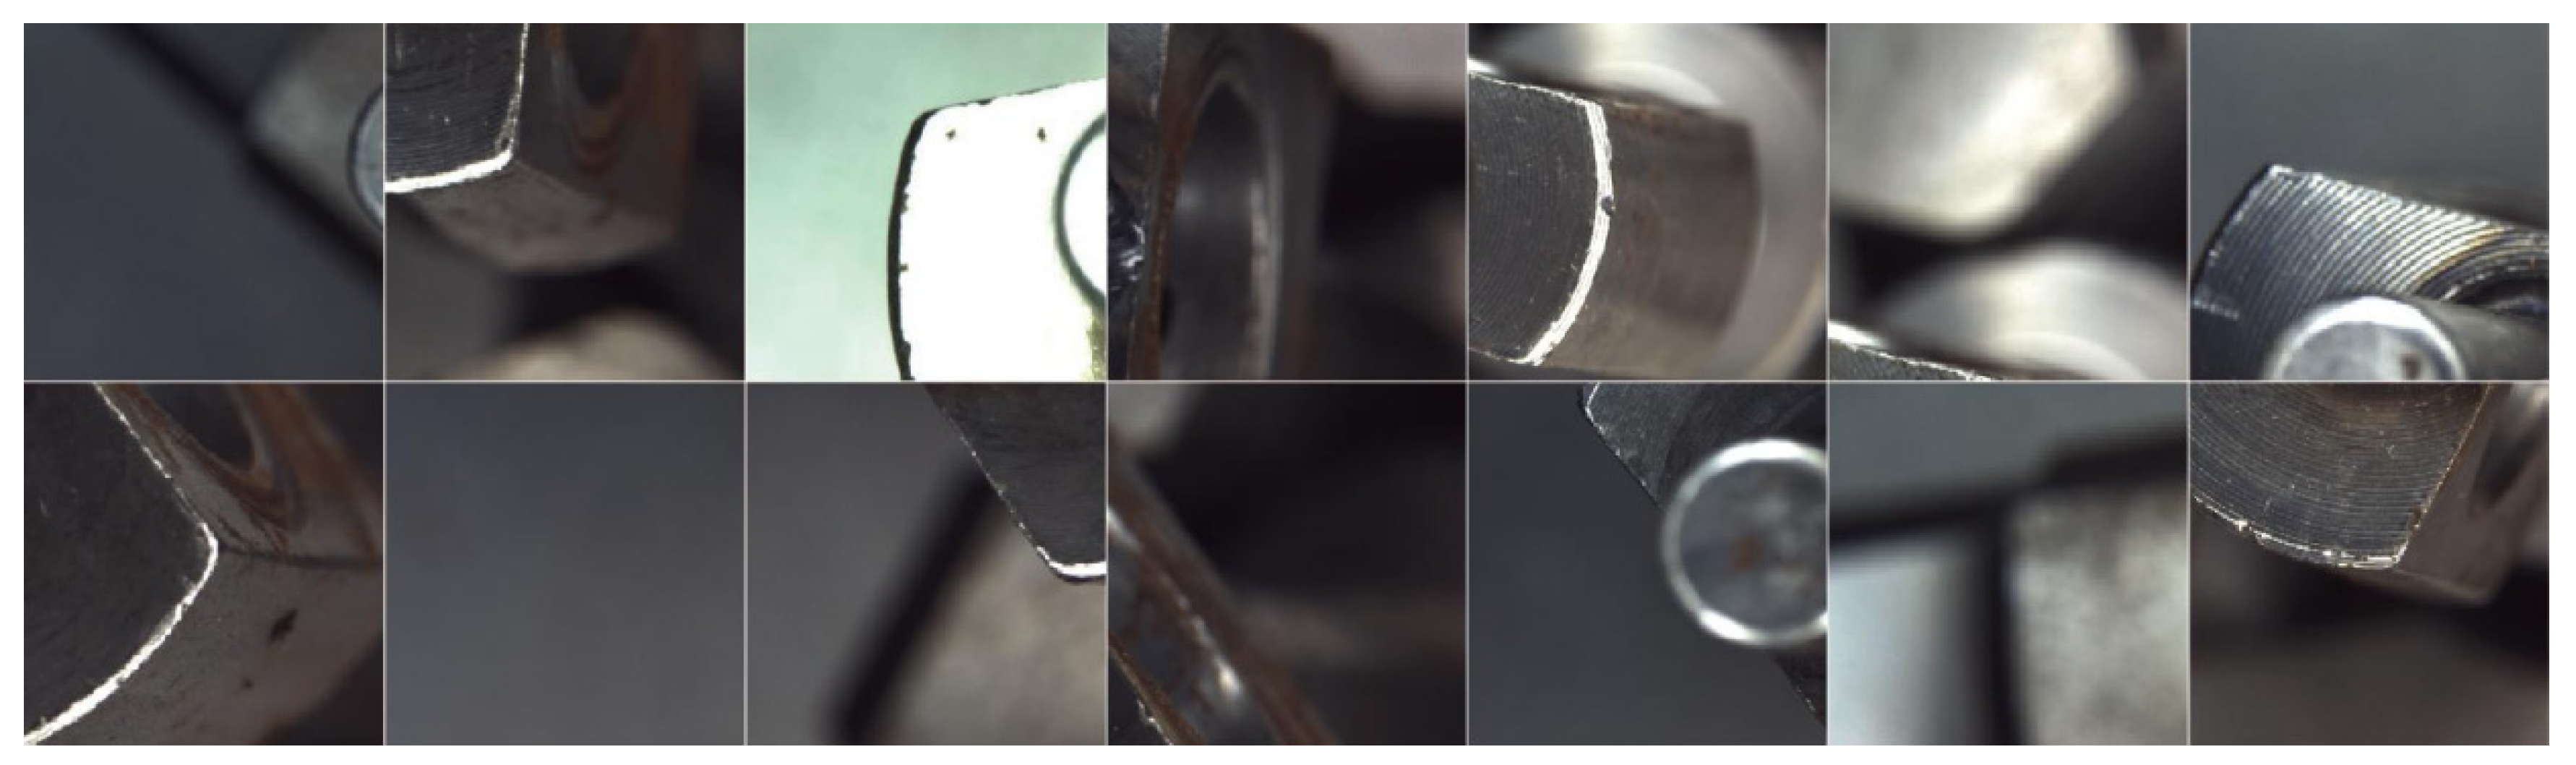
b. Negative Sample Set
Negative samples are obtained by randomly cropping the background area in the weld seam image samples, using a normalized image of 40 pixels by 40 pixels. The aspect ratio of the rectangular boxes obtained by cropping negative samples is 2:1. The negative sample set has a capacity of 220 images, mainly including positioning points, square sleeves, convex platforms, and other objects in the facility environment.
Figure 20 shows some negative samples of weld seam images.
c. Generate Descriptive Files
A CreateSamples command was used to generate a positive sample description file pos.txt from positive sample data and a negative sample description file neg.txt from negative sample data, which was easy to access at any time during training. In addition, the positive sample also generates a vector description file.
d. Training Cascade Classifiers
The operators opencv createssamples and opencv traincascade were used to train the classifier, and a file was obtained for the program to call. It contains some important parameters, such as the number of stages, training size, maximum false detection rate, and feature type [
41]. The number of stages is the number of cascades of the integrated strong classifier, so the training series is set to nine according to the number of existing feature vectors, the maximum false detection rate of each layer of the classifier is set to 0.5% and the minimum detection rate is set to 0.995% according to the detection needs, and the maximum false detection rate of the cascade classifier is set to 0.3%, and the corresponding information is recorded in the strong separator structure. Finally, the final cascade classifier is obtained by concatenating the calculated strong classifiers.
4. Test Results and Analysis
The test samples in this paper are three kinds of defect images of laser welding seam of automobile brake joint, such as craters, holes, and nibbling, and the detection effect of cascade classifier on weld defect detection is presented, respectively. During the implementation of the training algorithm, each image is detected separately. After the defects are detected, the original image and defect area are superimposed and the defects are framed with a rectangular box to make the defects display intuitively. As can be seen from the figure, for the detection of each laser weld image, the defects of the weld can be accurately located and the results displayed.
- (1)
The Influence of Training Frequency on the Results of Cascaded Classifiers
Two indexes, accuracy and recall rate are used to evaluate the algorithm performance of the cascade classifier. In order to analyze and verify the training effect of the cascade classifier, this paper conducts comparative experiments with different training times.
By adjusting the training frequency, the effectiveness of the cascaded classifier training is reflected based on the detection rate and false alarm rate of the test results. The tests were conducted using 50, 500, and 1000 training iterations, with the entire training set used as the training sample. The training comparison results are shown in
Table 3. According to
Table 3, after reaching a certain number of training iterations, the improvement effect on the detection results is relatively small, Therefore, under a certain amount of training, the laser welding seam defect recognition algorithm for automotive brake joints based on cascade classifiers can effectively detect and recognize defects, with good accuracy and stability. At the same time, it can cope with automated industrial environments and meet industrial testing requirements.
- (2)
Detection Time
The real-time performance of the recognition algorithm has an important impact on the efficiency of the laser weld defect detection system of automobile brake joint, so it is necessary to analyze the speed of the recognition and classification algorithm of weld defect based on the cascade classifier. The cascade classifier algorithm is used to detect 20 test sample images, respectively, and the test result speed reflects the effect of the cascade classifier training.
Table 4 shows the time spent results of the algorithm acting on the test sample pictures. It can be seen from the results that the time consuming of each sample picture is different, ranging from 0.17 s to 0.38 s, and the average time consuming is 0.24 s. For the detection speed of the system required by industrial automation, the recognition speed is lower than 0.3 s, and the cascade classifier in this paper meets the requirement of the vision sensor for algorithm speed.
- (3)
Test Results
For the defect detection and image classification of 200 laser welding seam images of automotive brake joints. the detection performance of the system is tested using indicators such as detection rate, false negative rate, and false positive rate.
Table 5 shows the detection results of the test samples, and
Table 6 shows the detection results of each defect category.
Figure 21 shows the detection image of the sample,
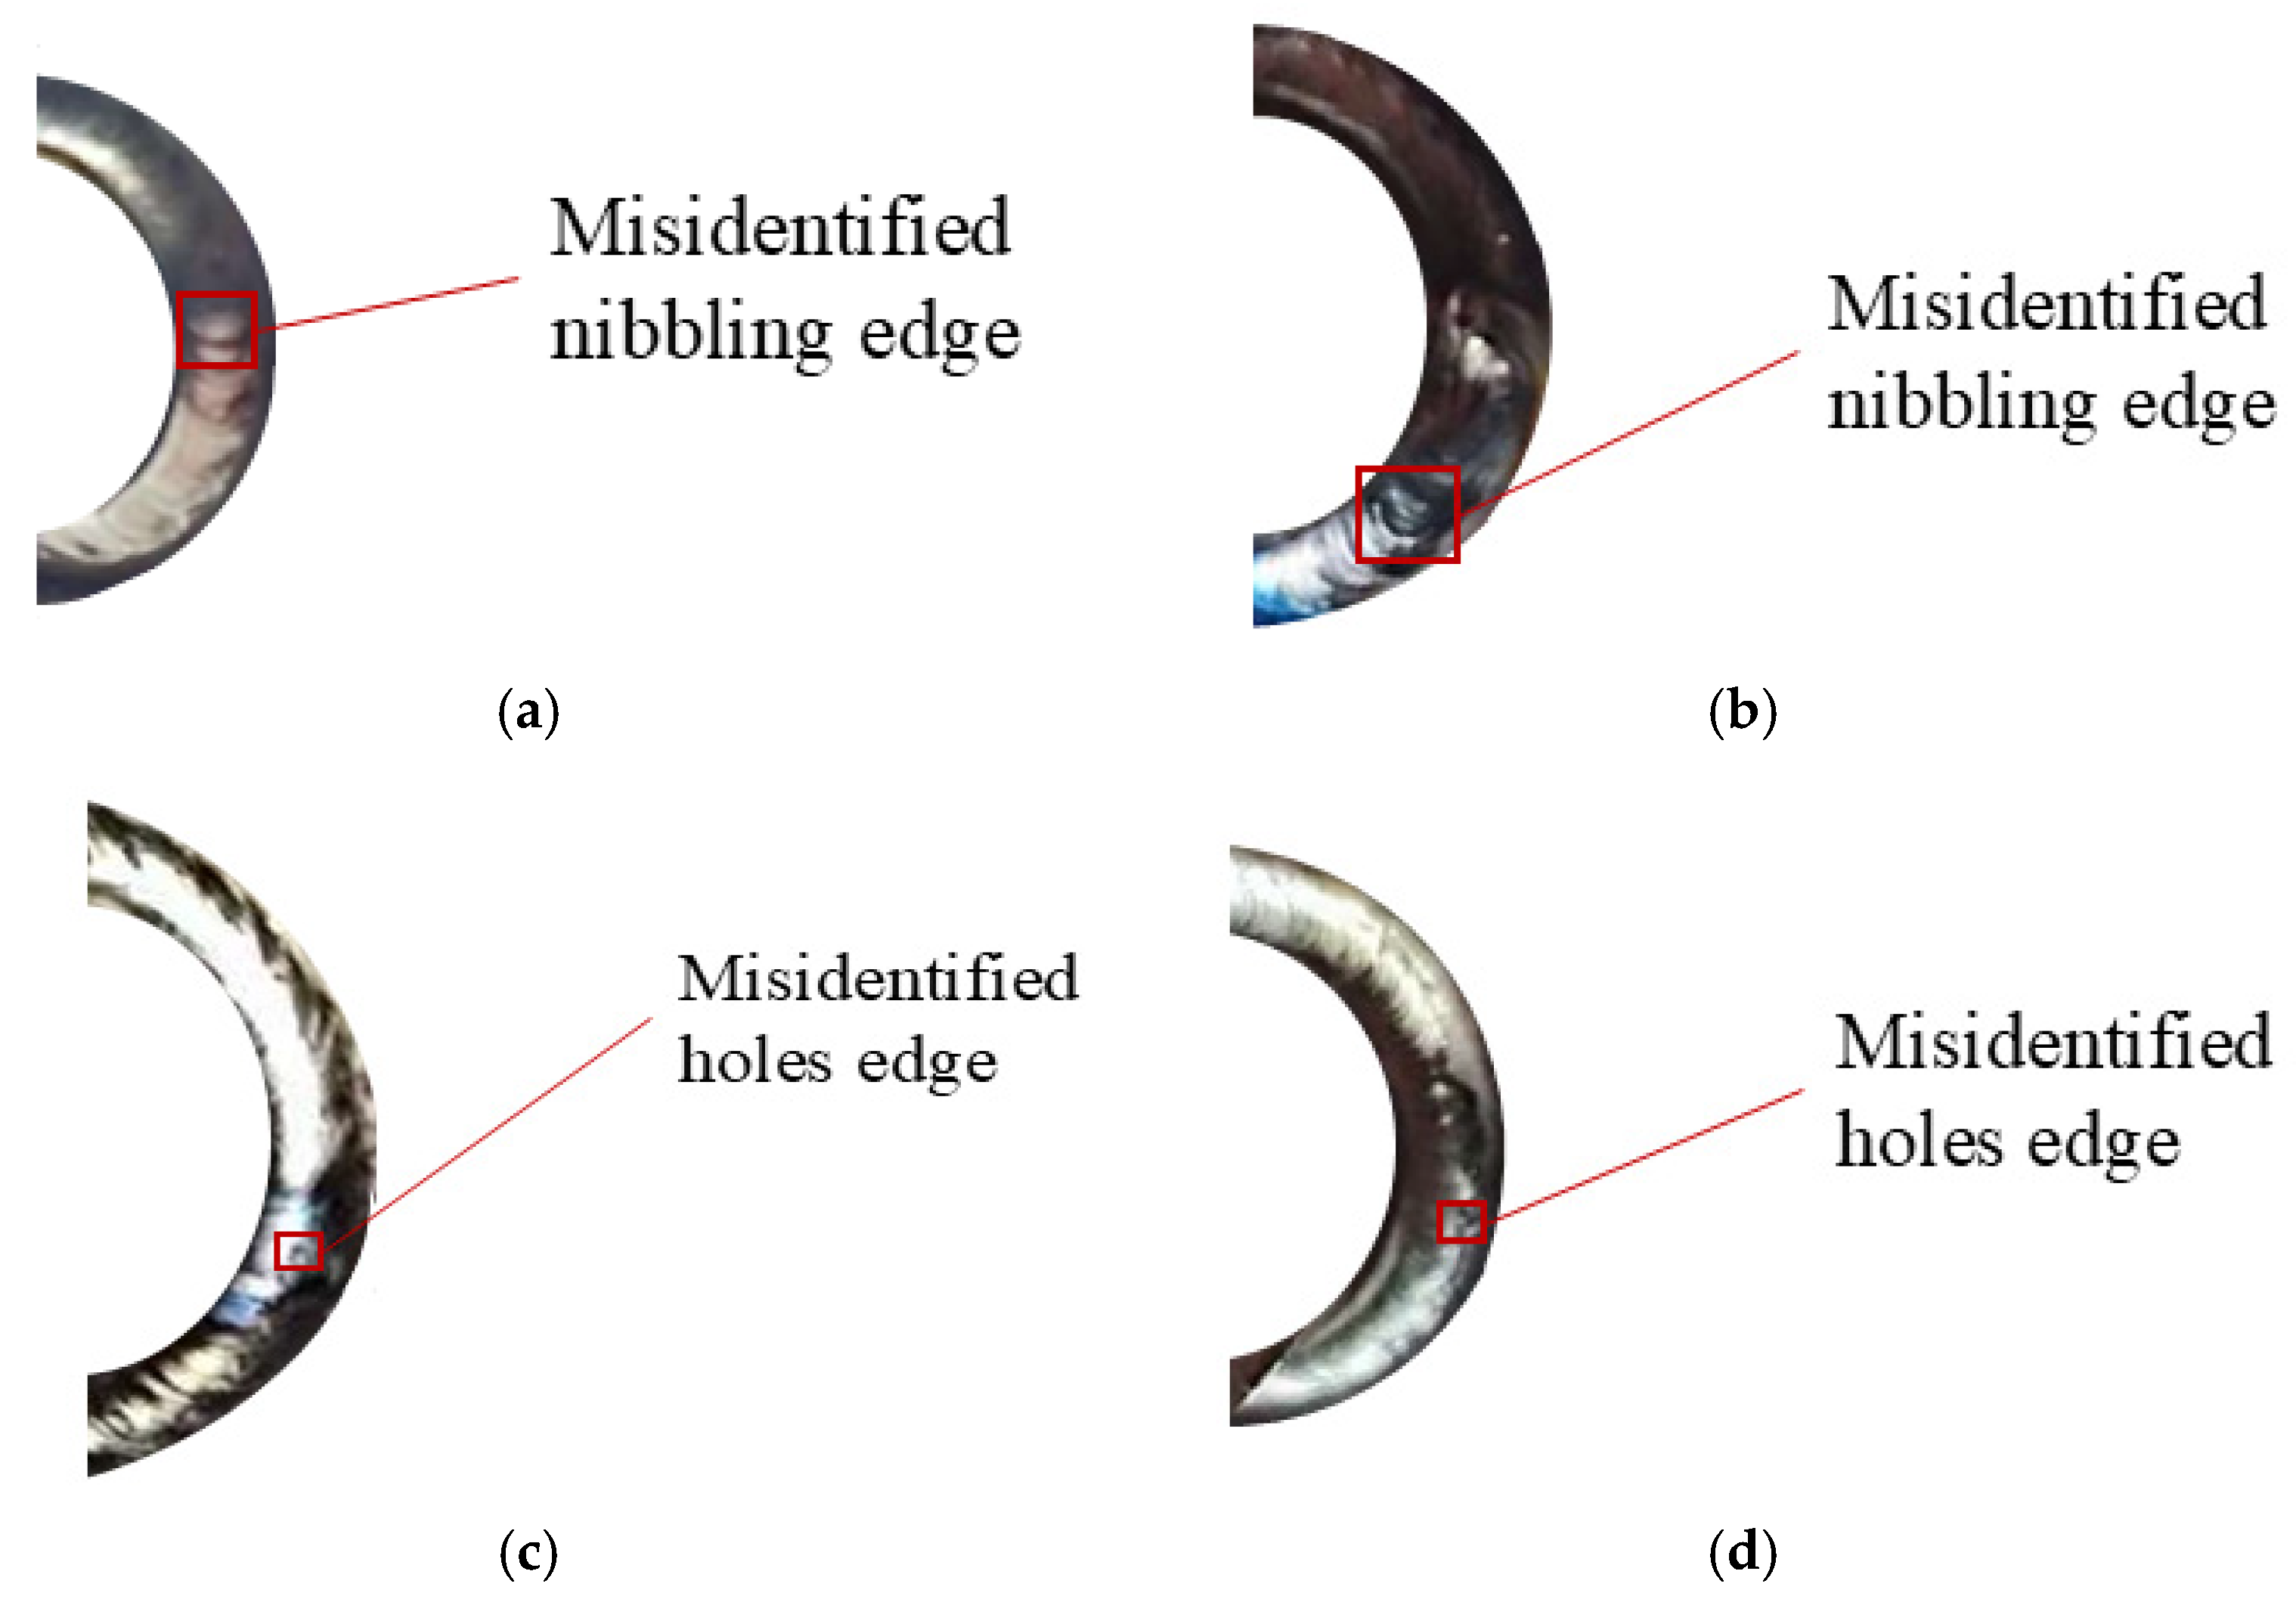
Figure 22 shows the image of detecting normal samples as defects incorrectly, and
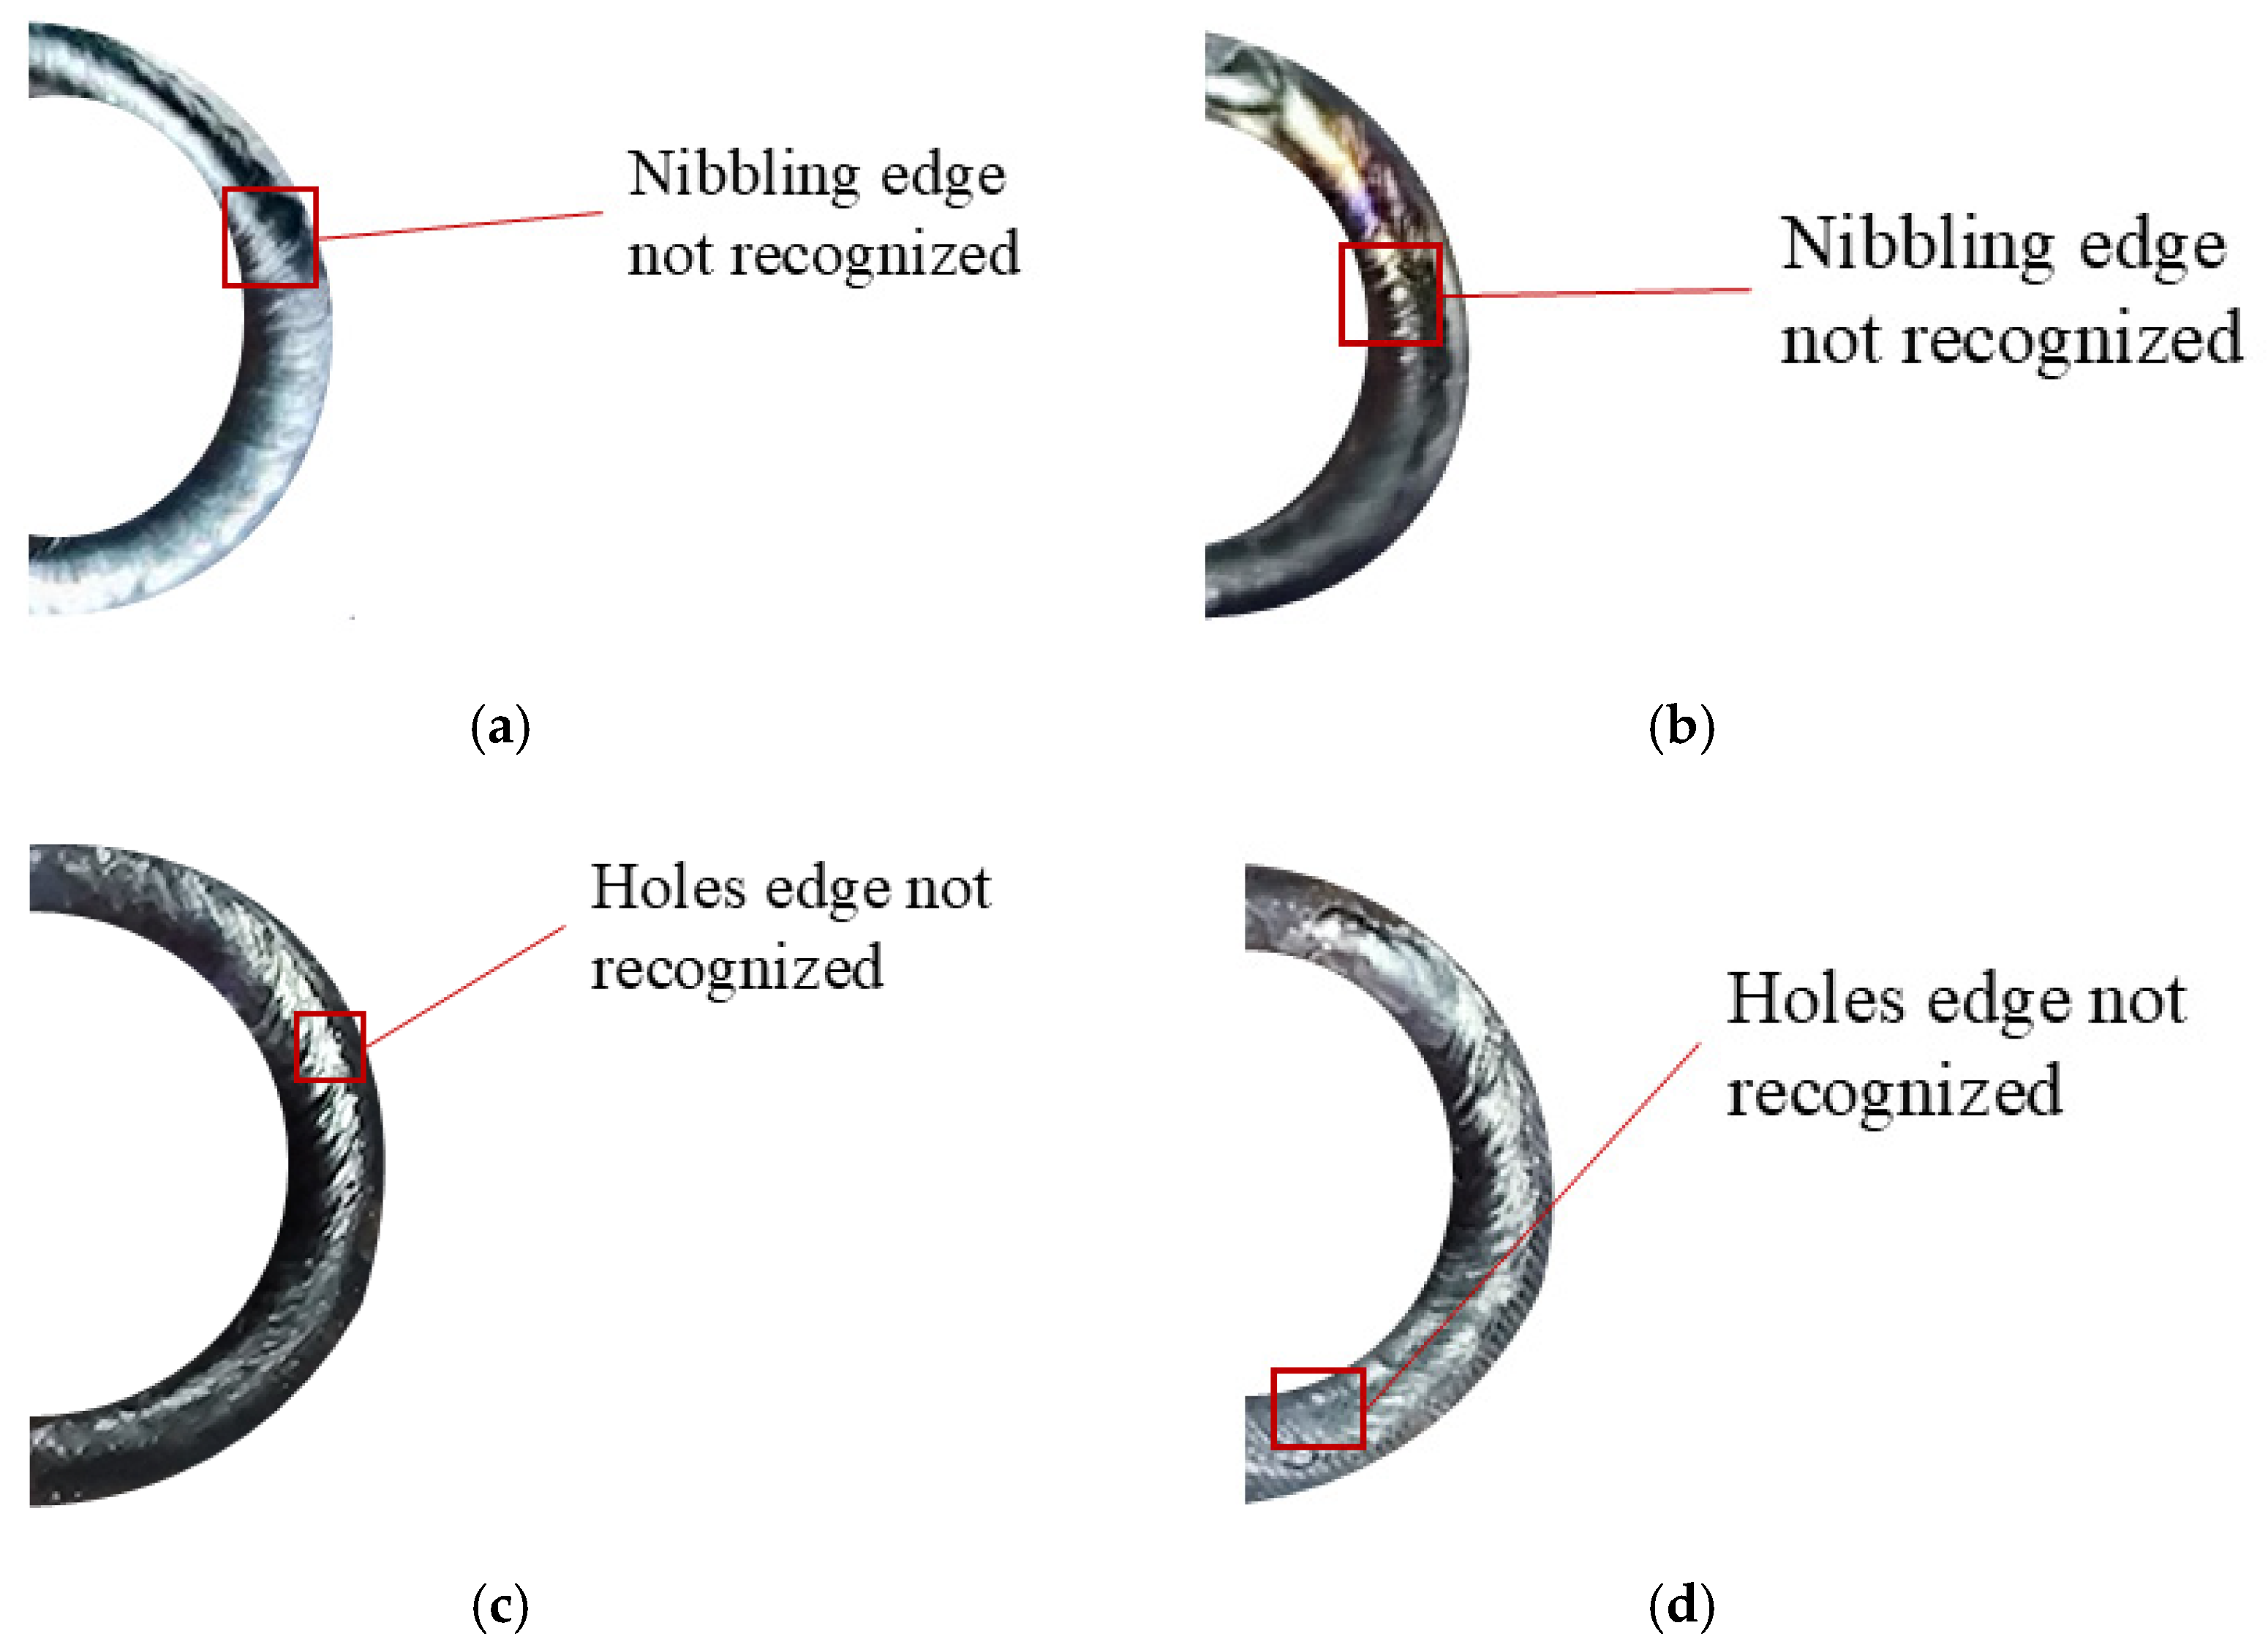
Figure 23 shows the image of missing defect samples for detection.
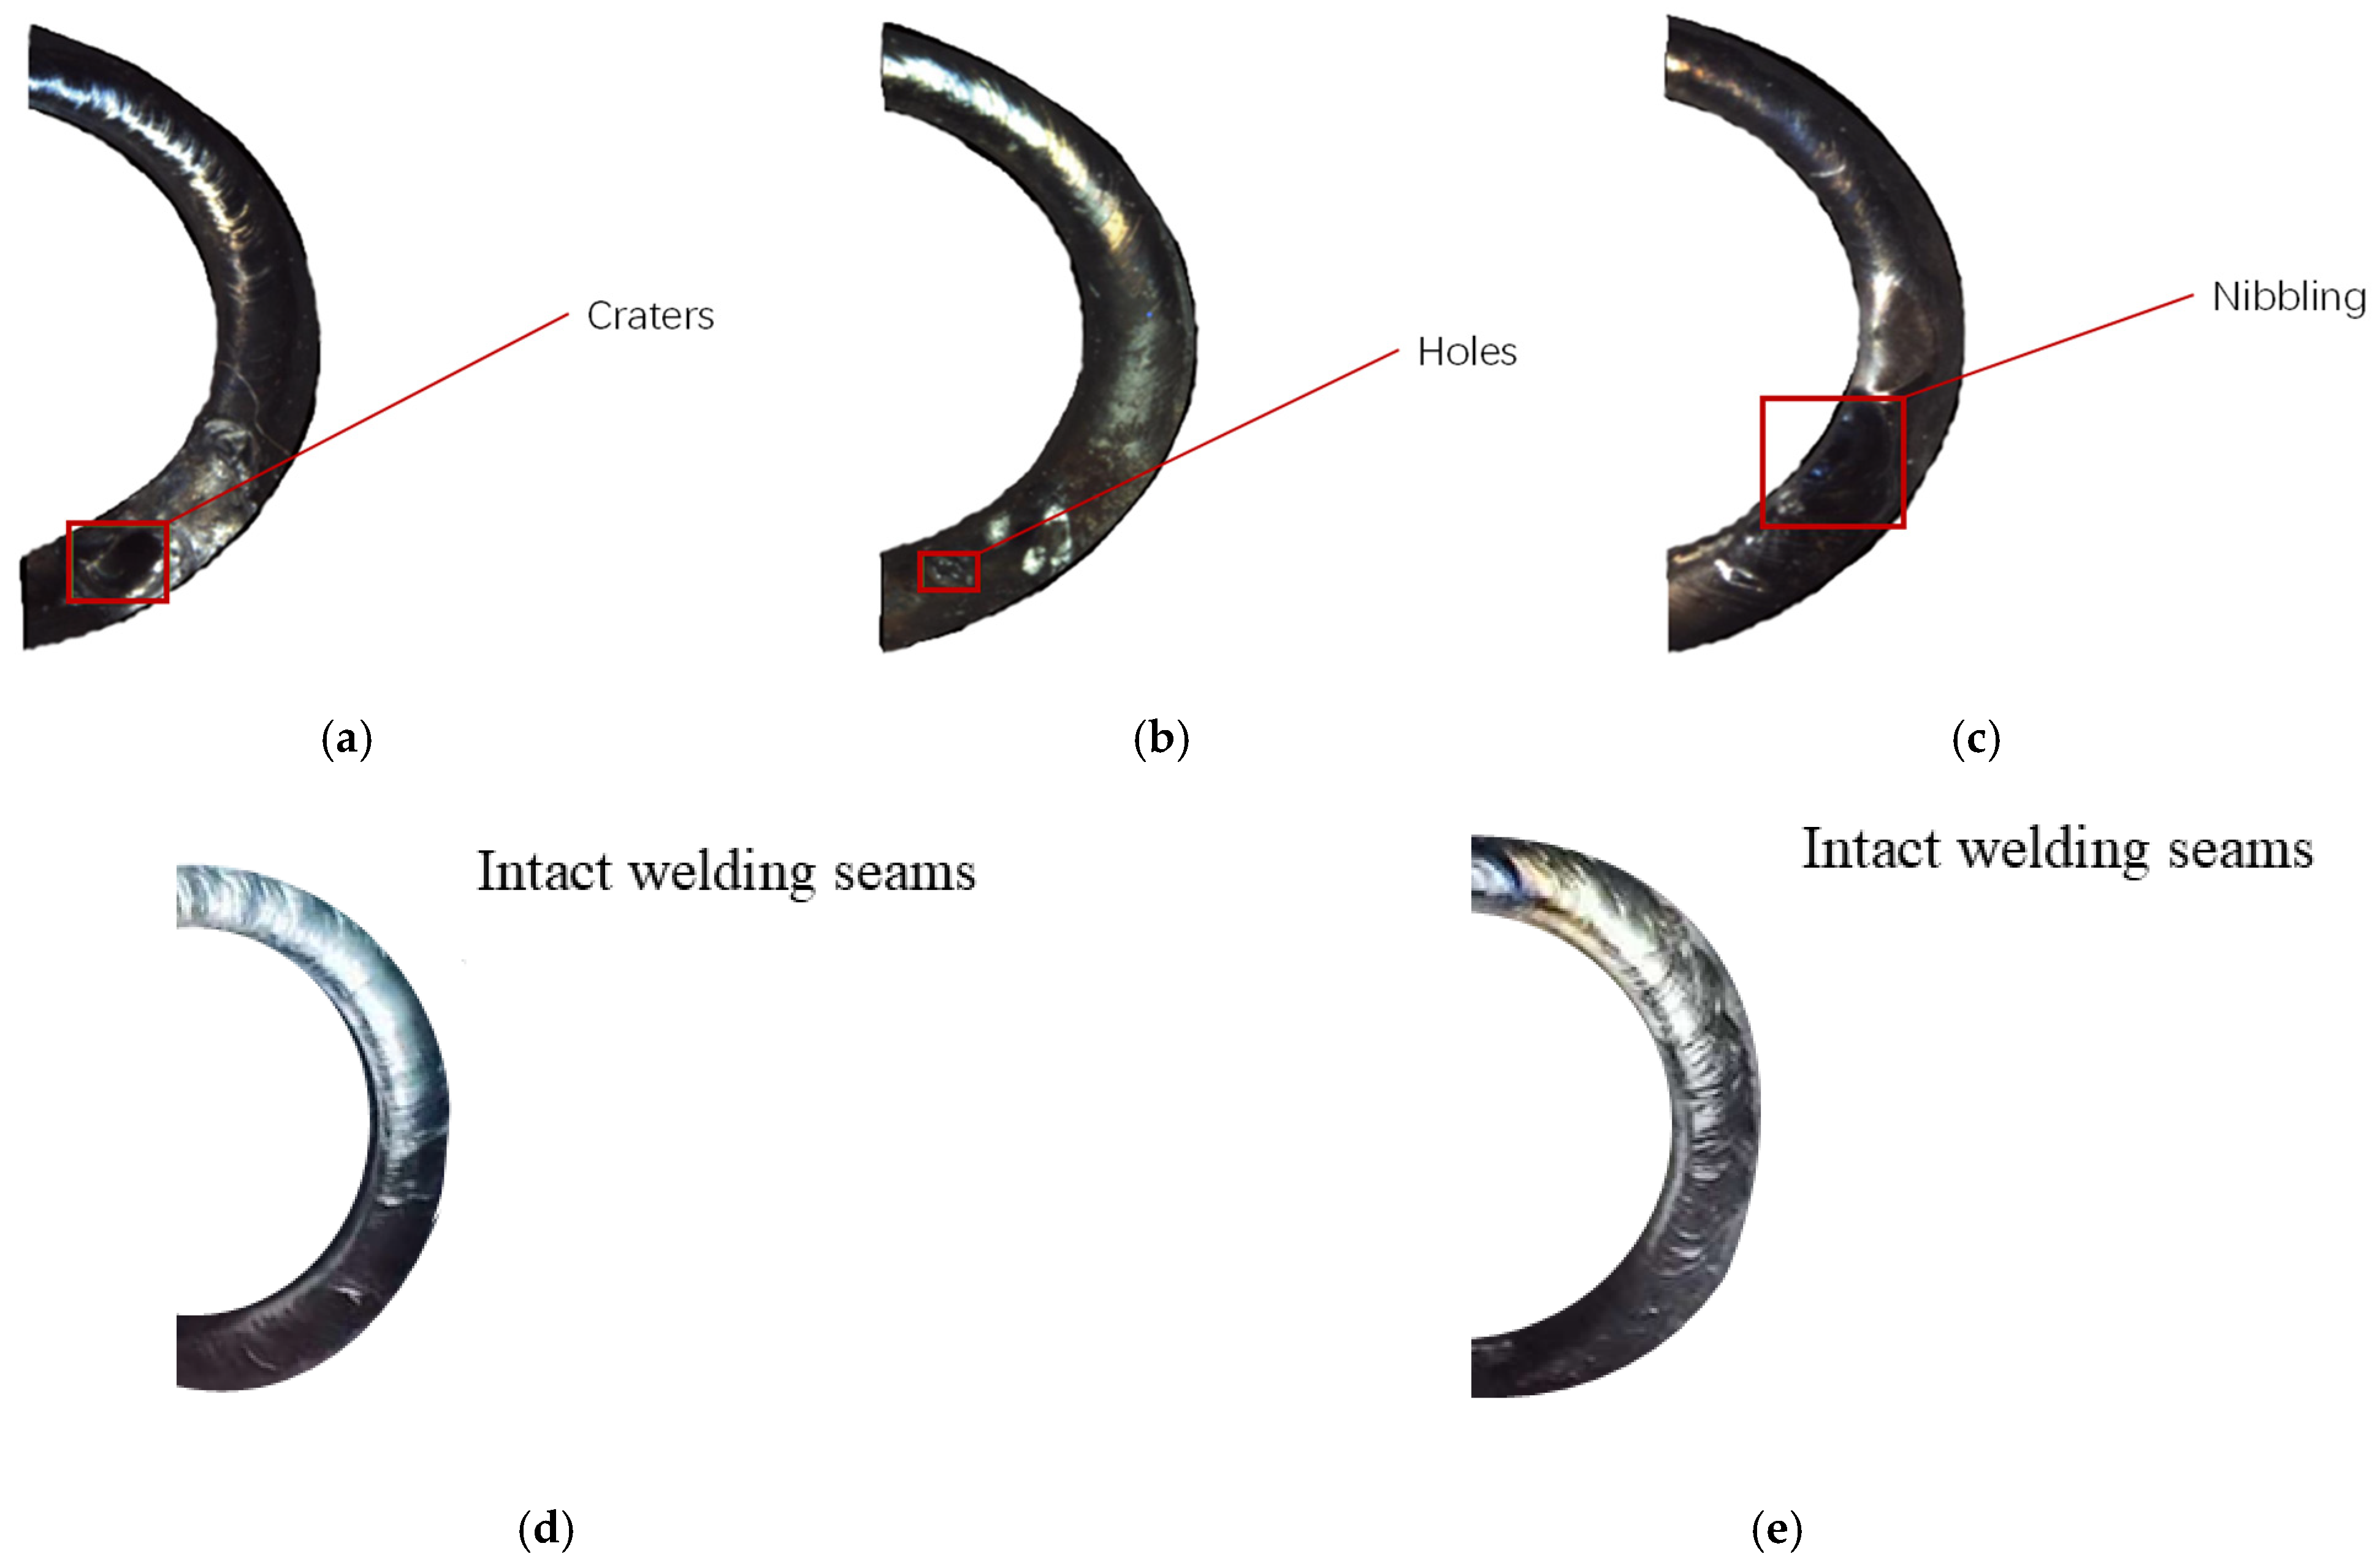
Based on the analysis in the table above, the laser welding seam defect detection and classification system for this automobile brake joint can accurately identify and distinguish welding seam defects. The system generally has a high detection accuracy for craters defects, but a relatively low detection accuracy for undercut defects. The average classification accuracy of the system for three types of weld defects in this article reaches over 90%, with a detection and recognition rate of 100% for crater defects, Due to the unclear characteristics of nibbling defects, the accuracy of detection and classification is generally not high. However, the recognition rate of our method in this paper has also reached 92.6%, and the overall missed detection rate is less than 3%, with both the missed detection rate and false detection rate for craters defects being 0%. The main reasons for false positives are insufficient clarity of the weld seam image, obstruction by dust during the welding process, or some new defects. The main reasons for missed detections are false positives caused by specific textures or lighting conditions of the weld seam. In addition, the detection time for each image is less than 0.3 s. Through experiments, it has been proven that the machine-vision-based laser welding seam defect detection and classification system for automotive brake joints designed in this way has high detection accuracy and efficiency, and is suitable for practical engineering to have stable and reliable defect judgment ability for both defects and normal welding seam images.
Based on the impact of training frequency on the cascade classifier, the detection time and results can be obtained. The machine-vision-based laser weld defect detection system for automotive brake joints developed in this study reached performance saturation after 500 training sessions. By using a cascade classifier algorithm, efficient detection with an average single image time of only 0.24 s is achieved, meeting the strict cycle requirements of less than 0.3 s in industry. The average classification accuracy for three types of defects, namely craters, holes, and nibbling is over 90%, with a 100% recognition rate for pit defects and zero missed or false detections, and a 92.6% recognition rate for undercutting defects. The overall missed detection rate of the system is less than 3%; compared to infrared detection, which takes 0.5–2 s to detect each sample, the recognition rate of surface craters is only about 85%, and the missed detection rate is about 10%. Ultrasonic detection takes 1–5 s to detect each sample, with an accuracy rate of 80–88% and a missed detection rate of 5–8%. This breakthrough not only improves the detection speed by 4–8 times, but also relies on non-contact optical acquisition intelligent algorithms to completely avoid the thermal interference and coupling agent pollution problems of infrared and ultrasonic methods, while significantly reducing hardware costs and operation and maintenance investment. The visual inspection system based on cascaded classifiers surpasses infrared and ultrasonic methods in terms of efficiency, economy, and surface defect recognition accuracy, becoming the preferred solution for online quality inspection of automotive component welds. In the future, multimodal sensing fusion can further break through the bottleneck of deep defect detection and build a comprehensive industrial quality inspection.
5. Conclusions
According to the quality requirements of an automobile parts manufacturer for an electric automobile brake joint, there are three kinds of defects which easily appear in the laser weld of joints, such as craters, holes, and nibbling. Based on the analysis of corresponding research results at home and abroad, machine vision technology is used to conduct research on the detection and classification methods of weld defects. The system design was completed through image-processing operations and the construction of cascaded classifiers, and the image detection algorithm was validated by combining actual defect samples. The design of an image defect detection and classification system performs image processing operations on the collected images to segment the defect areas in the weld seam. A nine-dimensional weld defect feature vector was constructed for the defect area, and corresponding feature parameters were extracted; then, the extracted feature parameters to the maximum and minimum values are standardized, and data normalization processing is performed, using them as inputs for the classifier. A cascaded classifier based on AdaBoost algorithm for training laser welding seam images of automotive brake joints was researched and designed, achieving defect detection and classification.
The feasibility of the laser welding seam defect detection and classification system for automotive brake joints in this article was verified through experiments. The welding seam images captured on site were used for testing, and the experimental results showed that the defect detection rate of this method reached 97%, with an average detection time of 0.24 s per image. Compared with infrared and ultrasonic detection methods, this system has significant advantages in improving detection speed by four to eight times, and defect recognition accuracy on non-contact, low-cost surfaces, and industrial adaptability. Infrared detection relies on thermal diffusion imaging, with a detection time between 0.5 and 2 s. The recognition rate of surface pits is only about 85%, and the missed detection rate is about 10%. Ultrasonic testing relies on high-frequency sound waves, with a detection time between 1 and 5 s. The recognition rate of biting defects is about 70%, and the missed detection rate is 5–8%. Additionally, coupling agents are required, resulting in higher equipment costs. This experimental result validates the effectiveness of the selected features and the performance of Adaboost algorithm in weld defect recognition, and the recognition results meet the design requirements. Moreover, this method has good stability and can effectively improve detection efficiency.
In the research, machine vision technology was used to detect and classify laser weld defects in automotive brake joints. A set of laser weld defect detection system for automotive brake joints was designed, and the corresponding software algorithm deployment was studied and analyzed to achieve intelligent weld defect detection. However, the core limitation of the detection method is that it is only applicable to surface defect recognition (with a bite recognition rate of 92.6% lower than 100% for dents), cannot detect internal defects, and is susceptible to strong reflection and oil pollution interference. The performance of the model is highly dependent on the quality and diversity of the training data, especially when dealing with complex operating conditions and new types of defects, which may require additional data collection and annotation. In future work, the combination of infrared thermal imaging and ultrasonic flaw detection technology can be integrated to enhance the detection capability of internal defects and achieve comprehensive detection of surface and deep defects; develop image-processing algorithms based on dynamic lighting compensation to reduce the impact of environmental interference on detection accuracy; and based on the detection, further research on defecSut cause analysis and predictive maintenance can be carried out by combining welding process parameters.


