Abstract
Flying wing Unmanned Aerial Vehicles (UAVs) are an interesting flight configuration, considering its benefits over aerodynamic, structural and added stealth aspects. The existing configurations are thoroughly studied from the literature survey and useful observations with respect to design and analysis are obtained. The proposed design method includes distinct calculations of the UAV and modelling using 3D experience. The created innovative models are simulated with the help of computational fluid dynamics techniques in ANSYS Fluent to obtain the aerodynamic parameters such as forces, pressure and velocity. The optimization process continues to add more desired modifications to the model, to finalize the best design of flying wing frame for the chosen application and mission profile. In total, nine models are developed starting with the base model, then leading to the conventional, advanced and nature inspired configurations such as the falcon and dragonfly models, as it has an added advantage of producing high maneuverability and lift. Following this, fluid structure interaction analysis has been performed for the best performing configurations, resulting in the determination of variations in the structural behavior with the imposition of advanced composite materials, namely, boron, Kevlar, glass and carbon fiber-reinforced polymers. In addition to this, a hybrid material is designed by combining two composites that resulted in superior material performance when imposed. Control dynamic study is performed for the maneuvers planned as per mission profile, to ensure stability during flight. All the resulting parameters obtained are compared with one another to choose the best frame of the flying wing body, along with the optimum material to be utilized for future analysis and development.
1. Introduction
Commonly known as a “drone”, an Unmanned Aerial Vehicle (UAV) is an aircraft that functions without a human pilot, crew, or passengers. UAVs can operate independently with onboard systems or be remotely controlled by a human operator. They are frequently a component of a larger Unmanned Aircraft System (UAS), which consists of the UAV, a control system located on the ground, and channels between the two used for communication purposes. Contemporary UAVs range in size and capability from tiny hand-launched drones to massive aircraft that are on comparable levels with traditional airplanes. They are employed in combat operations, surveillance, and reconnaissance and may be equipped with sensors, cameras, or weaponry. UAVs are mostly of two categories, namely multirotor and fixed-wing UAVs that differ in design with respect to their choice of application.
Flying wing configured Unmanned Aerial Vehicle (UAV) is an interesting configuration of unmanned flying vehicles that do not have a definite fuselage and consist of only the wing structure, integrated with additional components to perform maneuvers and other usual operations that are performed by any UAV. In particular to this study, the aerodynamic aspects of the drone are comparatively high, as there is no definite fuselage structure and the entire body being the wing, is capable of generating lift, maximizing the lift-to-drag ratio (L/D). Due to this proven advantage of a flying wing configuration, an optimum frame design and analysis is carried out for the drone, where in this case the main wing is the major component of overall UAV. The frame analysis includes fluid flow, structural and control analysis that contributes to the maximum parameters enhancement, and efficiency improvement for an intended operation of being a missile launcher.
The layout of the paper is such that it gives the basic details and overall definitions of the chosen topic with the existing proposed configurations and techniques from the literature survey that was conducted. It deals with detailed research and noted points about published titles related to flying wing design and analysis. The methodology shows the design calculations, modelling and computational simulations information regarding the topic. The results and discussion section reveals the obtained aerodynamic data, contours, etc., and their comparison with one another. Also, a material study is performed over the chosen configurations in order to determine its performance variation while bringing a change to the imposed material. A hybrid material is designed to incorporate the needed change over structural capacity of the UAV. Finally, the overall facts and learnings from the research are concluded and also lists future works, which include a complete development of a drone inclusive of fabrication and testing.
Literature Survey
Chung, P. H. et al. (2019) proposed an electric powered flying wing UAV. The flight performance requirements for the UAV are defined, for which the required parameters are calculated, and modelling is done. From the obtained ranges, a swept back wing with a practical dihedral angle and a V-shaped tail in the rear end of the UAV are implemented. The fabricated UAV is tested in real-time flight for the pre-determined mission profile and is evaluated for the design, manufacturing and testing techniques [1].
Dagur R. et al. (2018) have designed a pair of Sharklets winglets to be fitted on either ends of main wings for surveillance and reconnaissance, as it is portable and possesses increased endurance for highly improved performance. The model is designed with and without winglets for five different AoAs and solved in computational fluid dynamics (CFD) simulations [2].
Bliamis, C. et al. (2021) analyzed the importance of stability control for a tailless configuration such as the flying wing. MPU RX-4 is the model to be tested, with slight modifications, as it has the tendency to perform in both conventional flight and vertical hovering. The configuration contains canards and a triple-fin landing system. The CFD simulations are carried out with the imposition of a pressure-based solver, in a Low–Reynolds Spalart–Allmaras turbulence model [3].
Li et al. (2017) created a flying wing UAV with a vector rudder. They examined a nonlinear design method and validated it during flight. The manipulation of flight control of flying wings has to deal with the problems of nonlinearity, unsteadiness, and strong coupling. Robust control compensators are used in the design for flying performance that shows the effectiveness of the suggested control method [4].
Winter et al. (2019) developed a study and validation method for determining quasi-static and dynamic stability as well as the behavior of an iced flying wing at low Reynolds numbers. To produce time-dependent forces and moments, they used the ALE approach of FENSAP which solves the unsteady compressible Reynolds Averaged Navier Stokes (RANS) equations and with the k-ω-SST model, turbulence is captured [5].
Tri Kuntoro Priyambodo et al. (2020) created a control system model developed with Linear Quadratic Regulator (LQR) methodologies and PID control techniques in waypoint missions. The airplane, with elevator and aileron, may move unsteadily due to a degree of steady state error and multiple overshoots put on by external disturbances, which are minimized by the LQR control approach. This system uses sensors, such as gyroscope and an accelerometer, to produce data of roll and pitch angles [6].
Yibo Li et al. (2013) worked on the flying wing UAV’s longitudinal static and dynamic properties with a strong robustness and good stability margin. It increases the range of the flight envelope, reduces radar cross section and increases L/D ratio. Here, the two split-drag rudders can be found enough away from the symmetry plane on the tail edge, near to the tip on the wing. The LQR simulation results show that the flying wing UAV’s longitudinal control rules allows the UAV to achieve good longitudinal flying quality [7].
Carlson et al. (2014) worked on creating a fully autonomous aircraft with the best qualities of combined fixed-wing and multirotor configurations. The author decided that an aircraft’s weight of 1 kg with 150 g of payload, would be the maximum allowable wing loading of 65 , with MH45 airfoil due to better (coefficient of lift). The rotors were sized based on the expected thrust efficiency in hovering and the center of gravity (CG) of the wing planform [8].
Vasile et al. (2016) presented CFD imposed numerical methods, and algorithms for fluid flow analysis. The basis of CFD modeling is the solution of many differential equations. The profile’s aerodynamic behavior with different incidence angles are identified from CFD analysis. The two most used meshing techniques are finite volume and finite element. The final outcome shows that mesh quality and turbulence model affect the flow over the flying wing’s surface nature and carrying capacity [9].
Ma, Z. Y et al. (2019) suggested a control strategy that solves the unswept flying wing UAV on-ground lateral direction control problem by using differential propeller thrust instead of a rudder, steering or braking system. The unswept flying wing has a more condensed structure and increases aerodynamic efficiency due to its high aspect ratio wing with constant chord. This study shows the high control efficiency and robustness of the system [10].
Stavros Kapsalis et al. (2023) investigated the advantages of the tailless configuration over a traditional tail-and-wing configuration. They employ the Design of Experiments (DOE) method using the Taguchi technique. This approach achieves excellent quality at a low cost by maximizing robustness, making them immune to the influence of unpredictable events. CFD is preferred over low-fidelity panel methods and semi-statistical methods. The L/D ratio and the moment coefficient are evaluated [11].
Yaakob Mansor et al. (2019) discuss the model of a fixed wing UAV platform with customizable configuration. A winglet and vertical stabilizer are added to the design of a fixed-wing UAV to help with stability issues. They use the Zimmerman wing design, which combines a high wing configuration for stable flight. [12].
Kelei Wang et al. (2022) examined a hand-launched solar-powered UAV wing arrangement. The 3D RANS equations and the kT-kL-ω transition model are used. The Multiple-rotating Reference Frame (MRF) approach is utilized to evaluate the propeller’s performance. A bionic structure, like a flying bird with two tractor propellers, is utilized to achieve environmental friendliness. The results of maximum L/D ratio and lift generation are necessary to satisfy the need for long endurance [13].
Ki-joon Kim et al. (2014) examined the impact of asymmetric wing damage on the flying wing single motor UAV’s flight dynamic characteristics. A circulation-type subsonic wind tunnel was used, which revealed variations in weight, CG, and moment of inertia. The effects of the vertical tail and rudder were less severe comparatively. As a result, the elevator excitation had the greatest impact on the roll and pitch axes [14].
Oscar Ulises Espinosa Barcenas et al. (2022) proposed a conceptual design of a flying wing UAV. The mission profile of the UAV is to trim the UAV in particular circumstances of maneuvering. Iterative process is implemented to test the specifications and geometrical data of the three models chosen. From the continuous process of optimization, the best of the three designs is finalized. Finally, the advantages and drawbacks of the design are discussed [15].
Movva Srilakshmi Sai et al. (2020) analyzed the shape of the wings before adding a payload attachment for aerial mapping. The flying wing is selected due to its excellent structural and aerodynamic efficiency, which makes it more environmental friendly and fuel-efficient. The wing’s design was calculated by sweeping the airfoil section [16].
A.A. Alsahlani et al. (2017) used a design and optimization approach for investigating the aerodynamics and structural impact for a solar-powered flying wing HALE (High Altitude Long Endurance) UAV. The aerodynamic design, stability, and control of the UAV are subjected to severe requirements in the low Reynolds number of high-altitude flight. The suggested design is with high aspect ratio and swept wings [17].
Yusoff et al. (2008) designed the flying wing UAV’s airfoil. Small UAVs may fly at low Reynolds numbers, thereby improving their performance by enabling the fuselage, wings, and tail to use laminar flow technology. A combination of control surfaces located on the trailing edge of the wing are used for movement. At the end of the simulation, the authors decide that Ne334 is a better design that beats the Eppler 334’s original airfoil geometry [18].
Ferrell Peter et al. (2013) focused on vertical take-off and landing (VTOL) hybrids. A flying vehicle with lifting surfaces for forward flight and the ability to nose up with stability and maneuvering control the main propulsion rotors is a way of dealing with this problem. VTOL is done by using its winglets and pylons for balance. The control algorithm will include a navigation algorithm that has been created [19].
Manikandan Prabhu et al. (2022) proposed a flying wing UAV that is applied in extremely low temperature environments. The propellers, airfoil, flying wing body etc. are calculated and designed. CFD simulations are executed to determine the aerodynamic parameters, and Fluid Structure Interaction (FSI) simulations are then performed. GFRP-FR-4 composite was found to be the best performing material due to low thermal stress [20].
Standridge et al. (2018) developed a UAV to provide medical packages, photograph regions for environmental evaluation. The aircraft airdrops the cargo and returns to its base empty, utilizing a central distribution model. An experimental method is designed that optimizes the aerodynamic performance in several variables is done. Given certain building limitations, a new wing geometry is generated to get the highest range possible [21].
Carsten M. Liersch et al. (2020) have developed a flying wing UCAV (Unmanned Combat Aerial Vehicle) model with a larger sweep angle. In this process of conceptual design phase, the aircraft systems are also developed on the basis of existing data. The aerodynamics is studied, which includes the selection of appropriate airfoil based on its performance and aerodynamic output. The final model is discussed, including all the critical aspects of UCAV [22].
Hassan Aleisa et al. (2023) have developed a flying wing UCAV, specially designed for military applications. The stability concerns in these flying wing UCAVs are solved by re-designing the leading edge of the wing, including parameters, like sweep angle, wing planform, etc. Design calculations are performed and finetuned for better performance characteristics [23].
Pengtao Shi et al. (2020) conducted a body freedom flutter wind tunnel test on a full span flying wing flutter model. The aerodynamic performance of the high aspect ratio flexible flying wing is evaluated. The UAV is made of composite carbon fiber material. The two sets of control surfaces near the tip of the wing, acting as stabilizer surfaces, are located inside the flaps and outside the ailerons [24].
Noureldein A. Ibrahim et al. (2023) presented the Pixhawk 4 (PX4) system to be used as an onboard instrument for data recording to measure parameters of four steps of flight testing which are planning, executing, analyzing, and reporting. The UAV is a configuration with a pusher propulsion system that consists of a wing, body, two winglets, and elevon as a control surface [25].
Mitridis et al. (2021) designed a mechanism allowing a VTOL fixed-wing UAV to switch from vertical to horizontal flight by changing the thrust vector. Three electric motors are used for both flying phases. The hybrid carbon composite construction is used as the basis for the canard. The most important part of both planned mechanisms is examined using finite element analysis (FEA) techniques [26].
Raghavan et al. (2010) designed a flight control law for a flexible, high aspect-ratio flying wing aimed for HALE missions. The control system’s goal is to follow a set route on the ground while keeping the aircraft at the designated height and speed. It is demonstrated that the controller may handle an unexpected shift in the external loading [27]. The literature survey process has resulted in notable points that are considered for further design process of the flying wing UAV.
2. Methodologies
2.1. Proposed Methodology—Innovative Flying Wing UAV
2.1.1. Payload Weight Estimation
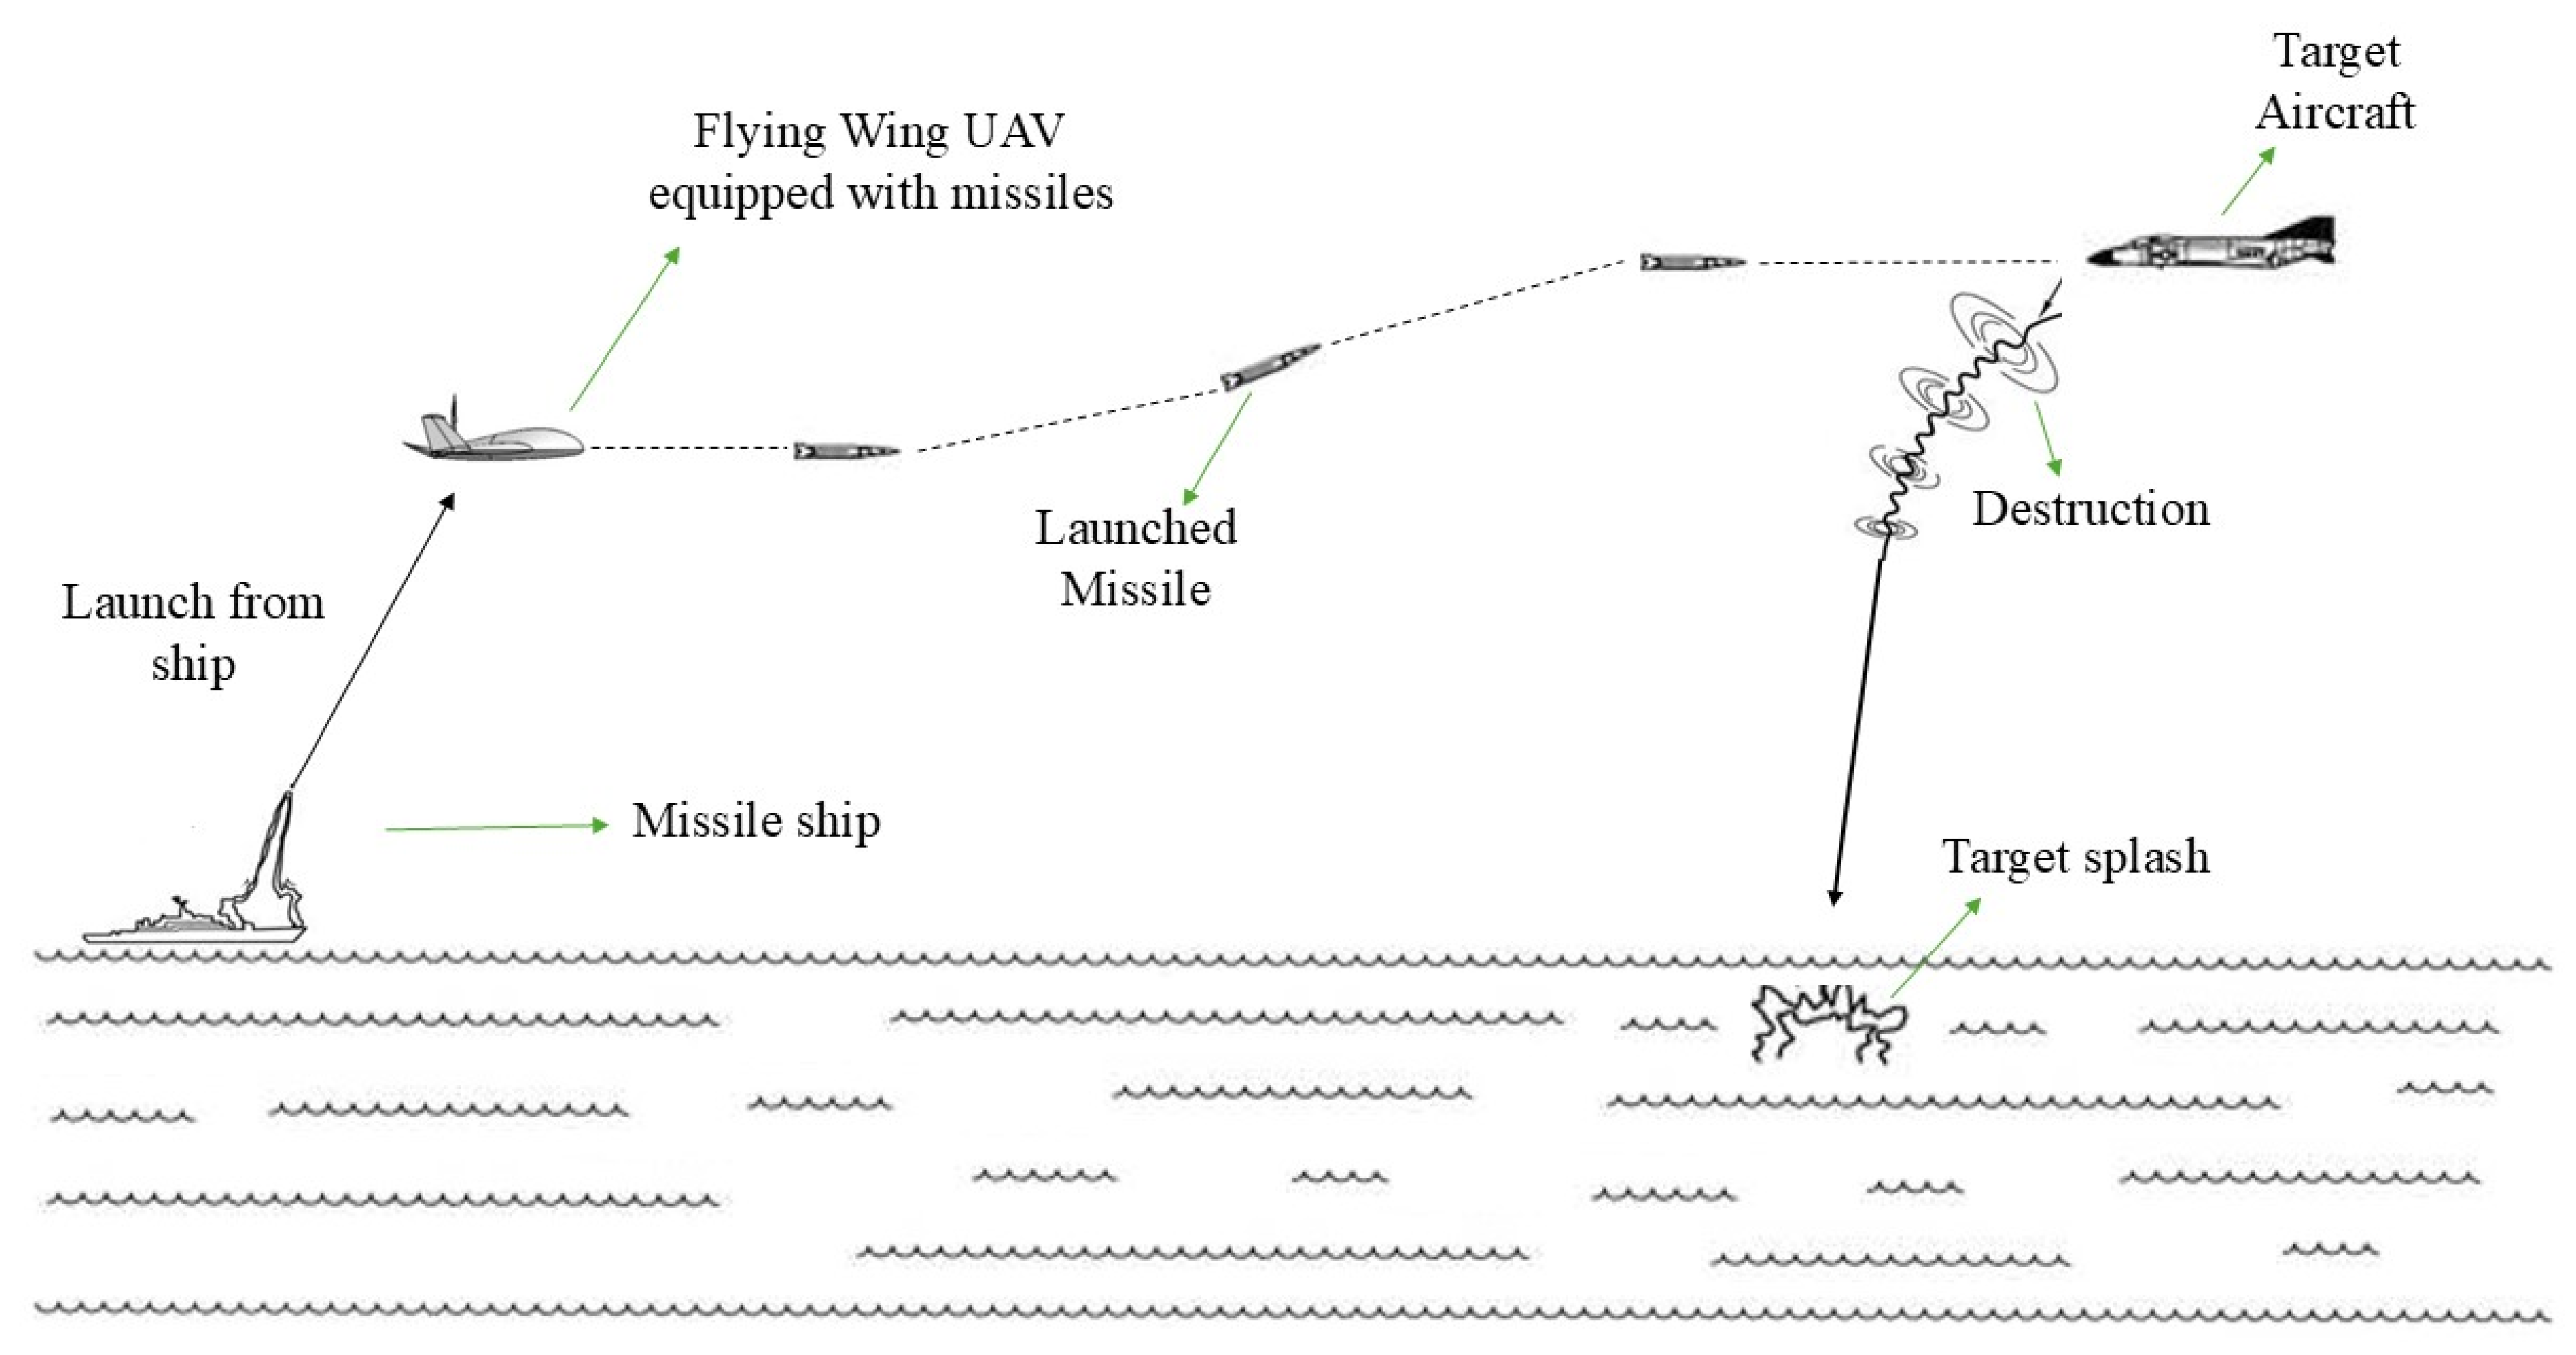
The flying wing body is meant to be a strong and efficient missile launcher in ocean-based zones such as cruise ships serving as a launching platform. The UAV would take off and launch the air-to-air missiles on the opponent aircrafts for safety and defense purposes. This mission profile is revealed in Figure 1.

Figure 1.
Mission profile of the developed flying wing UAV model equipped with missiles.
The flying wing UAV is designed to engage in counterattacks against hostile aircraft by releasing missiles while in midair. When traveling over bodies of water, where dangerous attacks against people are likely to occur due to air-way vehicles such as fighter or bomber aircraft, UAVs that can attack their adversaries, or even missiles fired at the individual, it is very advantageous for navy agents and other individuals who are at risk. Considering this application, a thorough study about the existing missiles, their launching mechanisms, and other secondary payloads or mechanisms necessary for executing the mission is examined, from which the best options are chosen. The technical specifications of the payloads are listed in Table 1.

Table 1.
Technical information of the chosen payloads and its subcomponents.
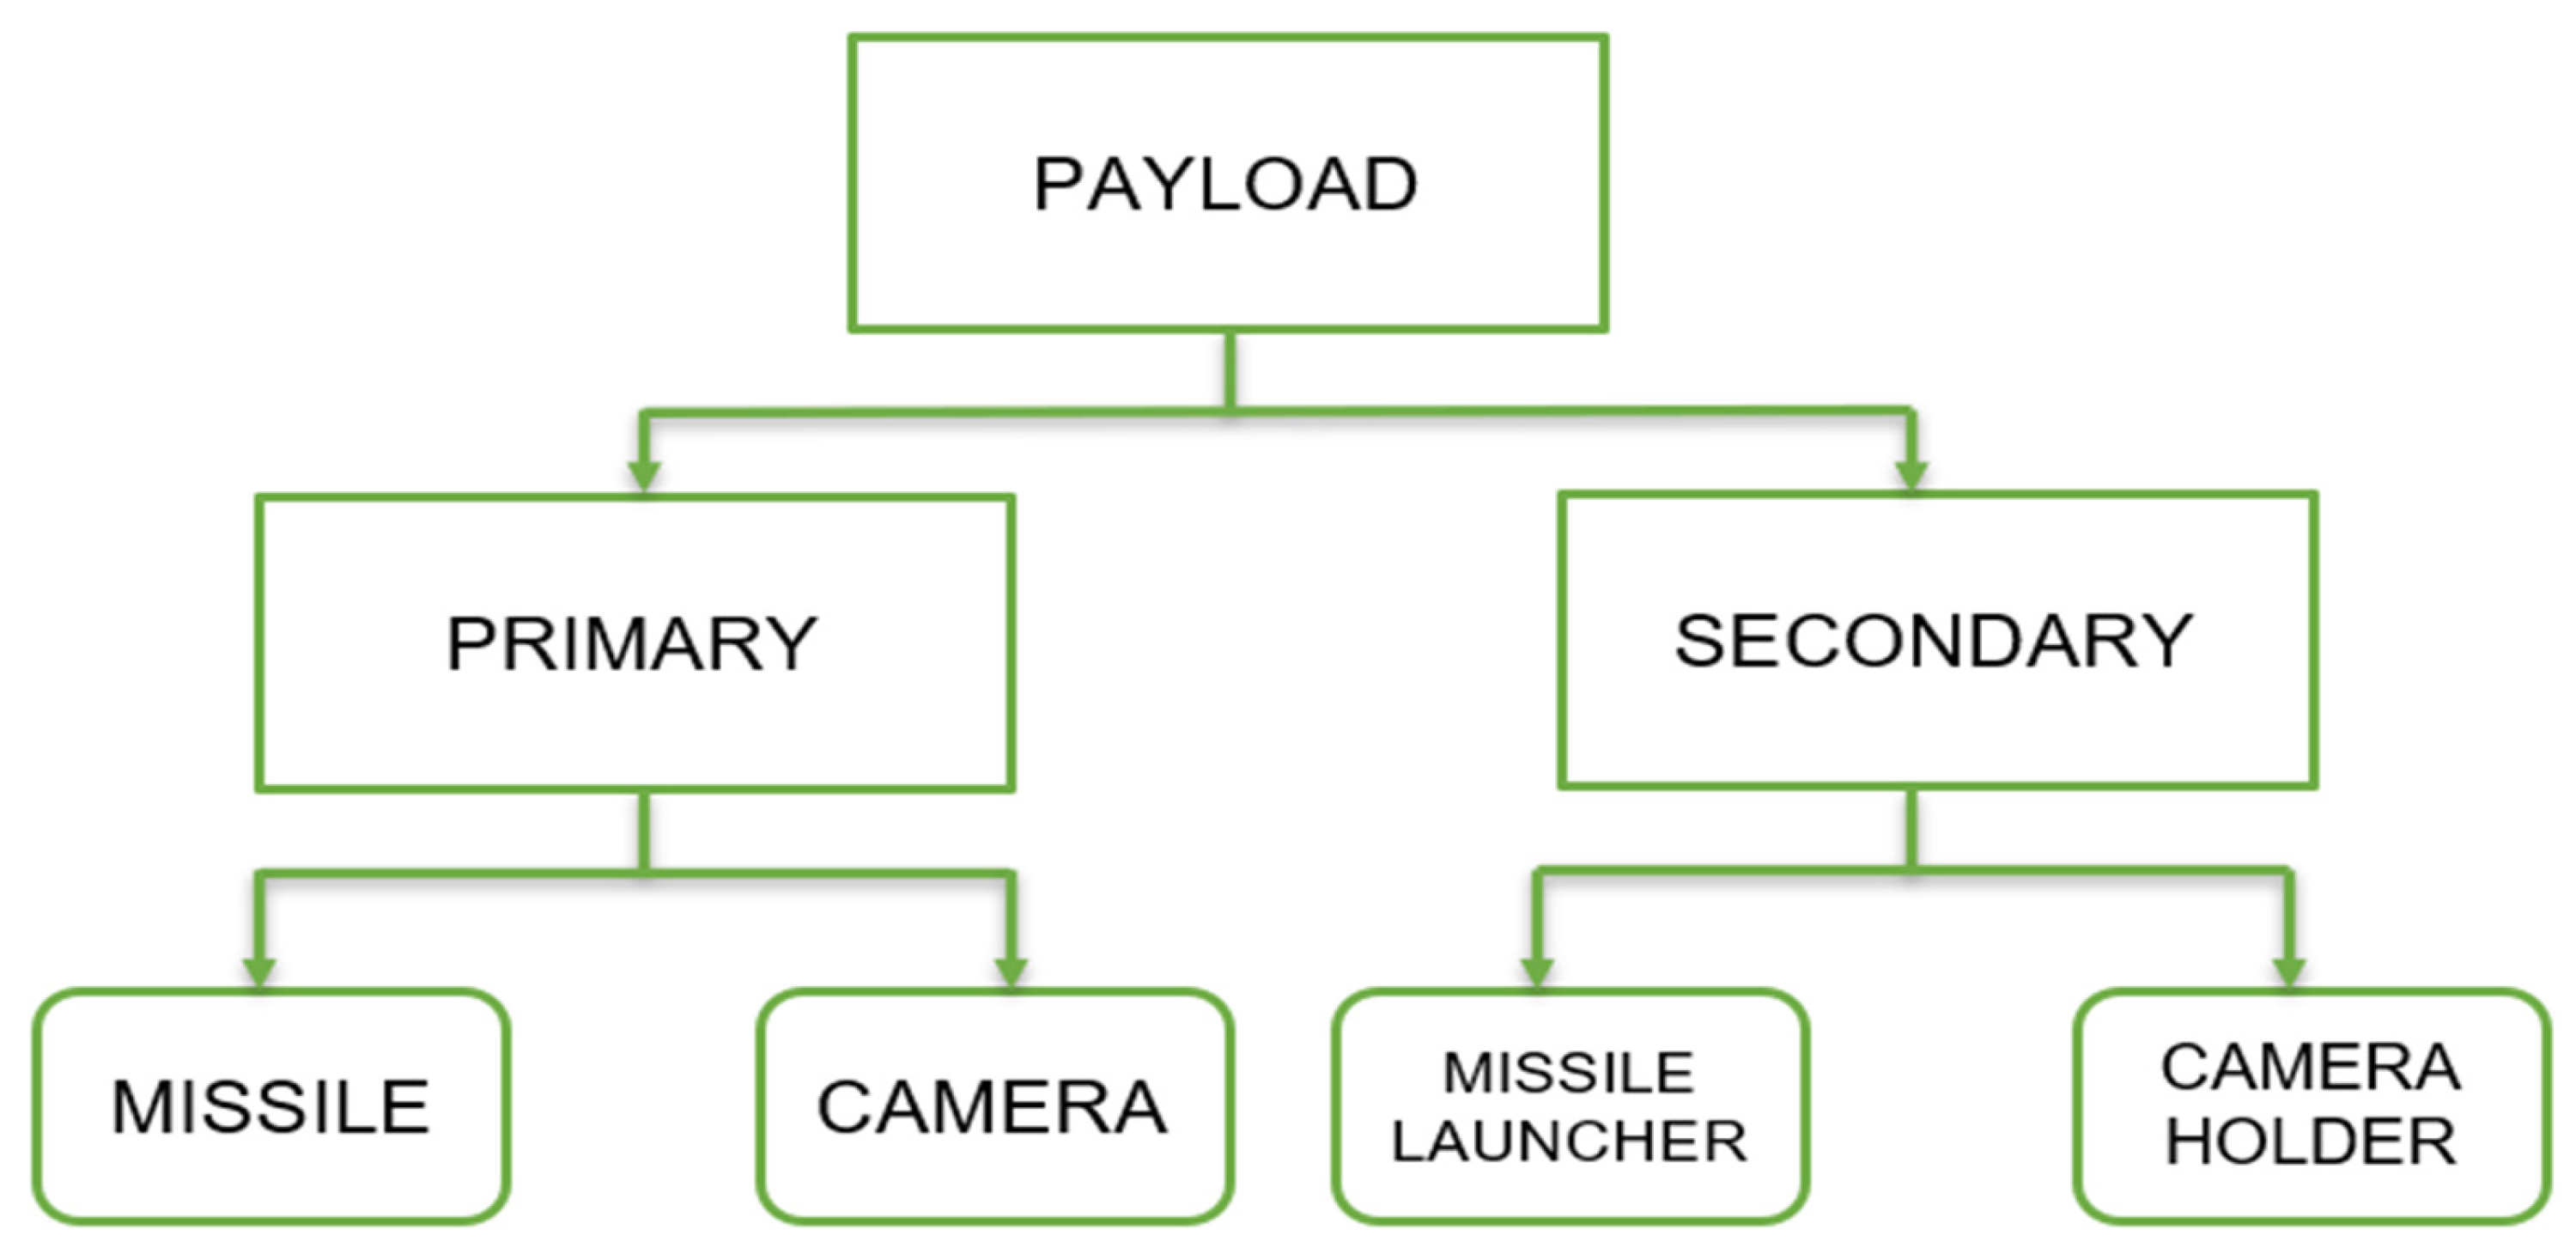
Therefore, summing up all the weight values, the total estimated payload weight is 8.522 kg. The flowchart showing the payload categories is shown in Figure 2.

Figure 2.
Flowchart of the payloads’ categorization.
2.1.2. Design of Flying Wing Body
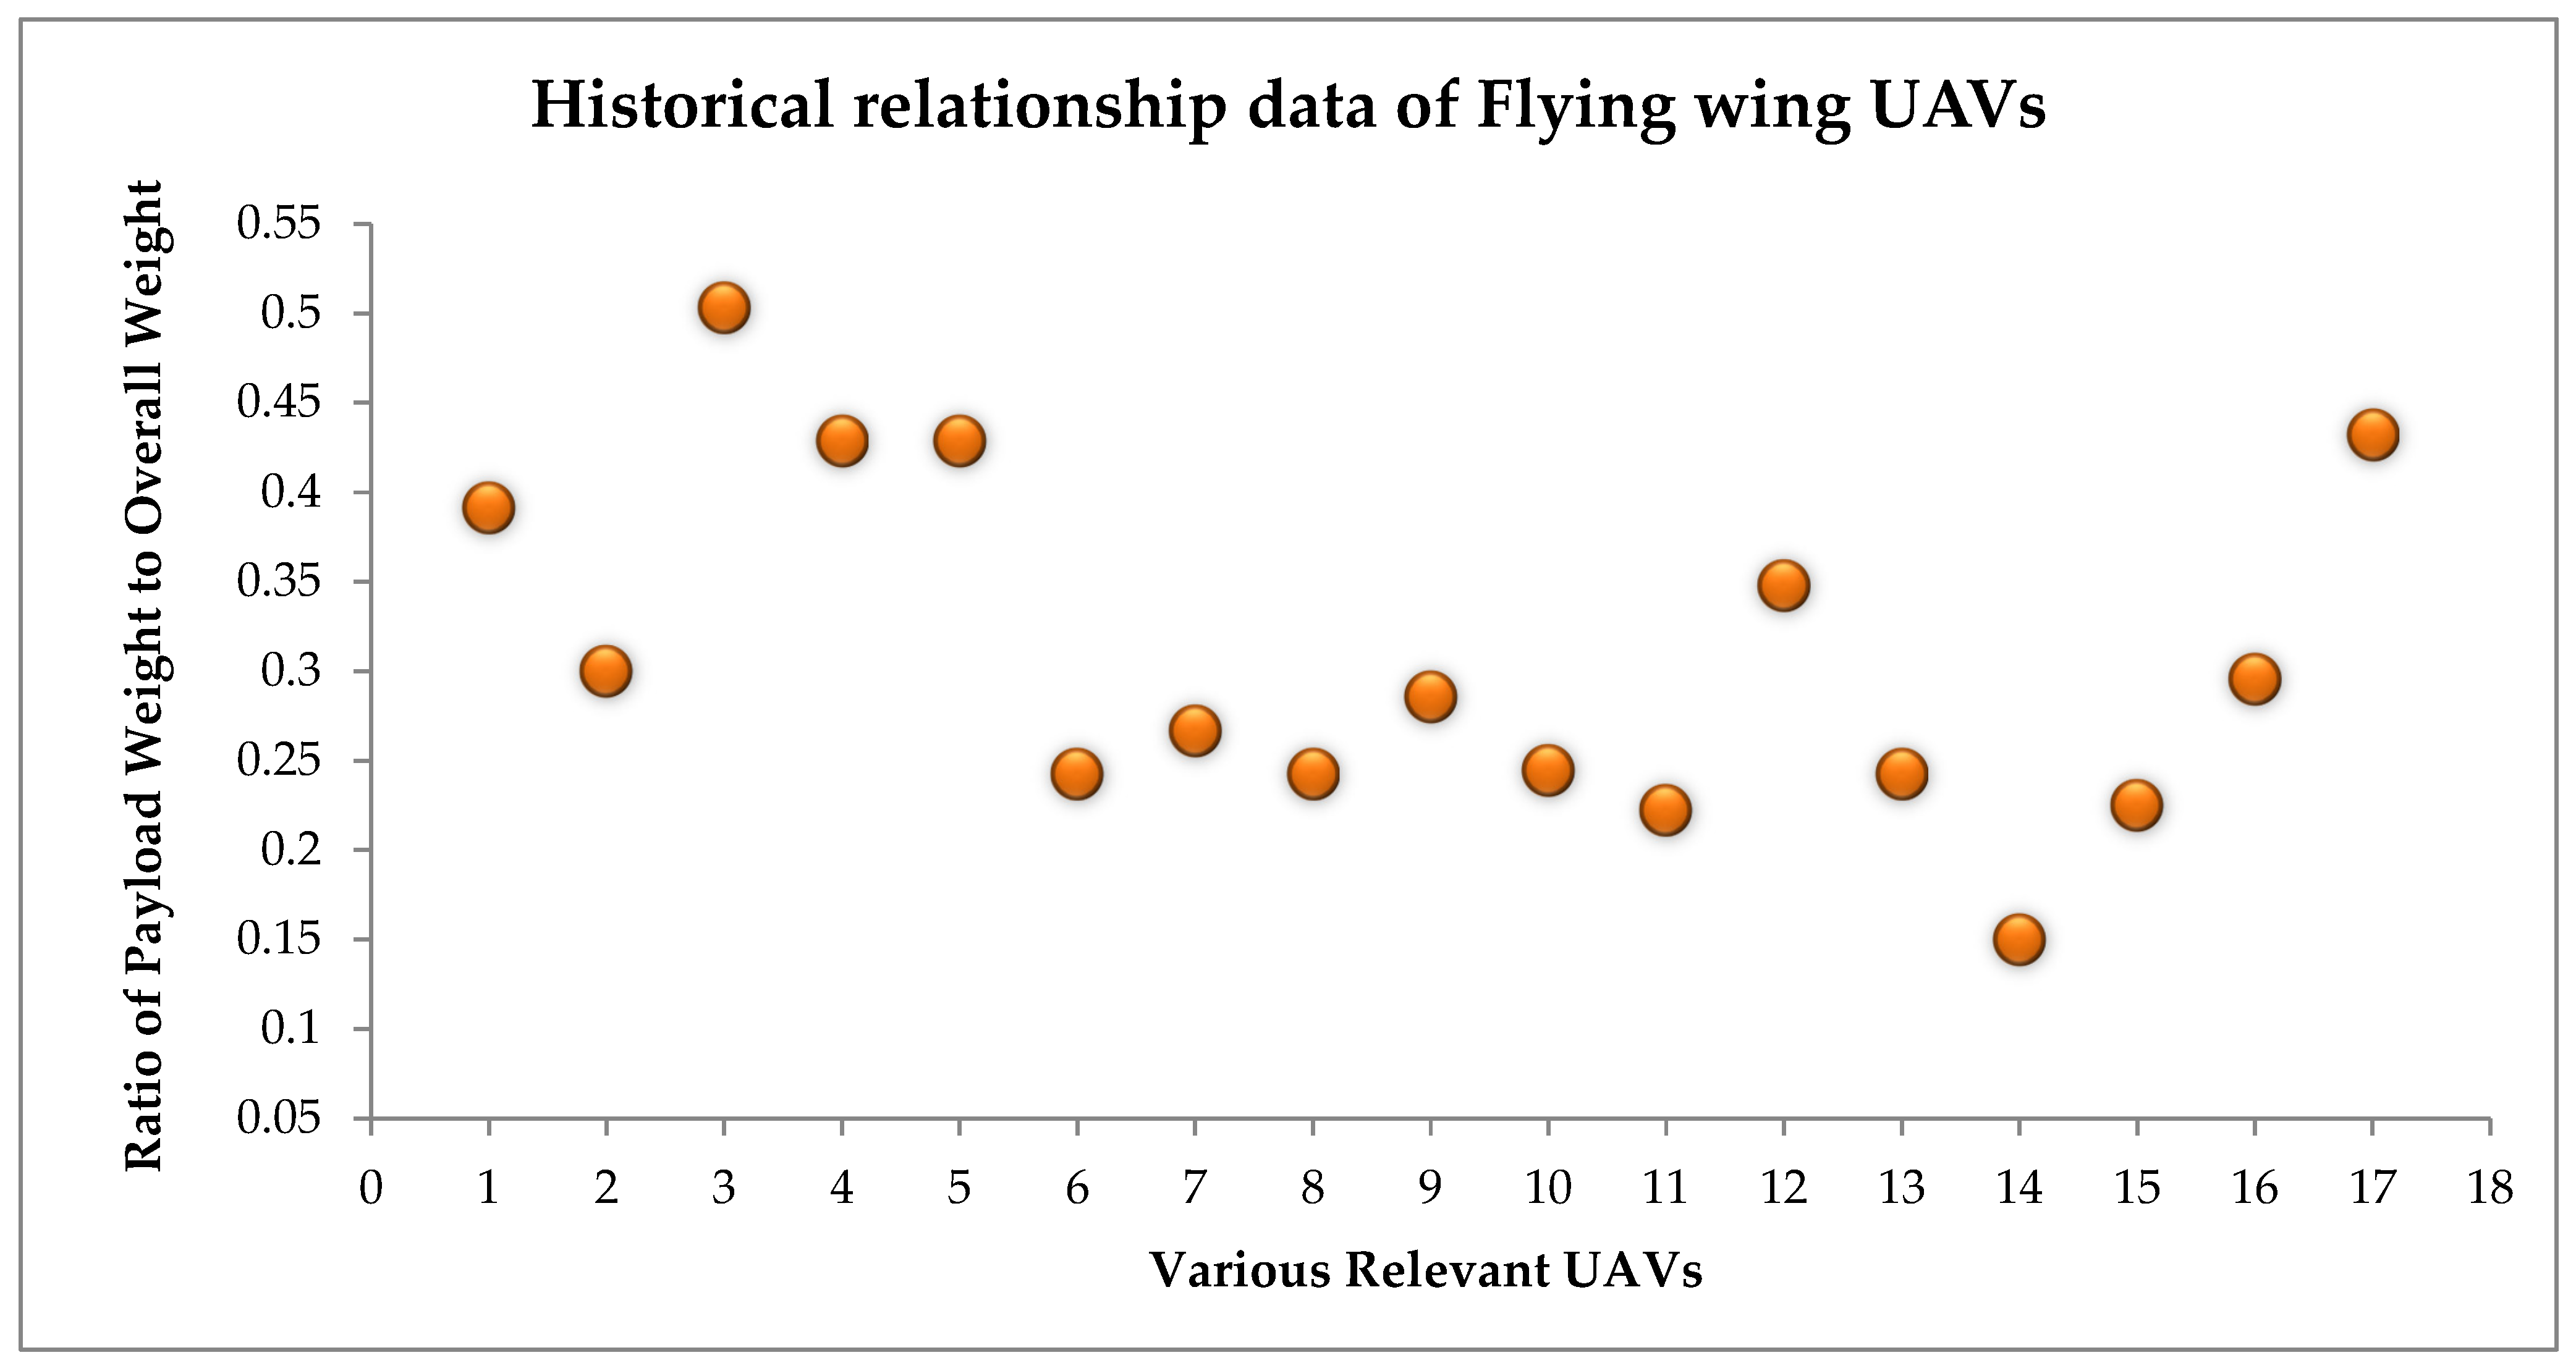
Payload weight is determined to be 8.5 kgs approximately. From the historical relationship in Figure 3, as referred from [28,29], the derivation between payload weight () and overall takeoff weight () of the flying wing UAV is derived, which is given below in Equation (1).

Figure 3.
Historical relationships of advanced flying wing UAVs.
Generally, the assessment for wing loading (W/S) is higher than 100 for high loading UAVs; the assessment for W/S changes from 50 to 100 in the case of medium loading UAVs; and, finally, the assessment for W/S is lower than 50 for low loading UAVs. In this work, the W/S is obtained as 30 . Using the relation in Equation (2) [28,29],
The aspect ratio (AR) is assumed as 8, thus, from Equation (3),
where the value of “ƞ” is taken as 0.7, then using Equation (4),
The relationship between wingspan, chord length, and wing area is given in Equation (5) as
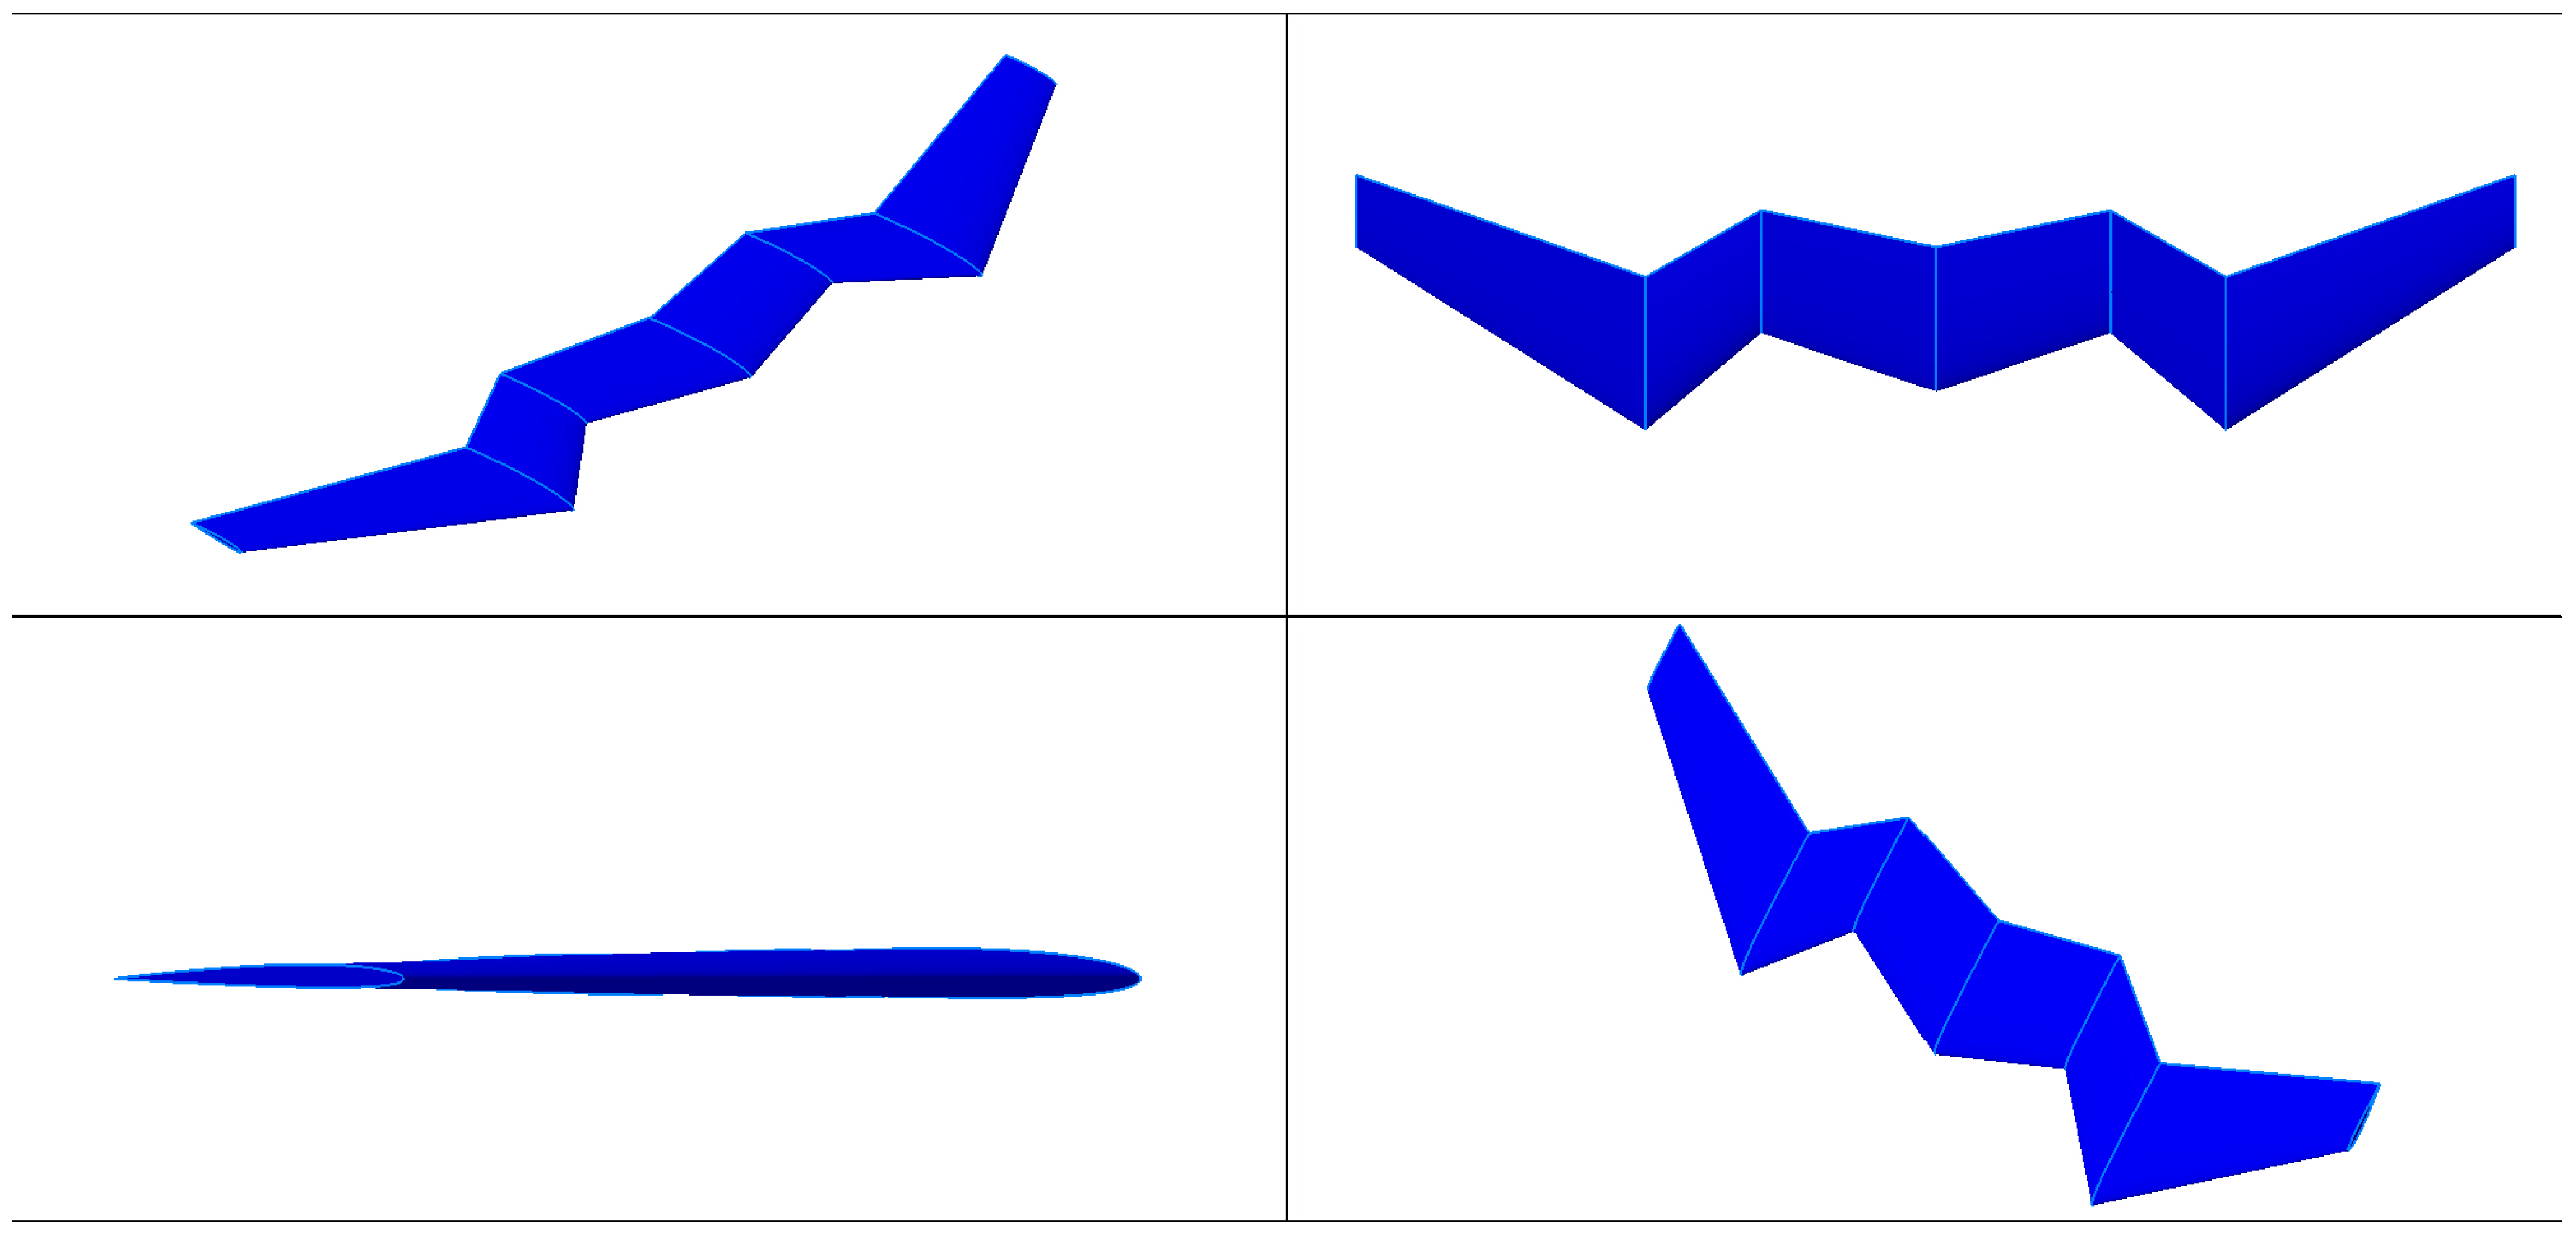
Using the obtained parameters, the overall shape of the flying wing is determined to be either with a constant taper ratio, or with changing taper ratio. The varying taper ratio model was initially developed from the inspiration of a Falcon, considering its added advantage of high maneuverability from its slender body, pointed wings and notched beaks. From this bird, a triple cupped profile with three-pointed wing structures is derived and developed. It is later developed into optimized models based on its resulting computational data. The constant taper ratio model is inspired by a dragonfly, known as an aerodynamic insect with high lift generating capabilities [28,29].
2.1.3. Falcon-Inspired Configuration
The span-wise chord estimations formula for the flying wing is mentioned in Equation (6).
By substituting the known values in Equation (6), the chord length calculations for the Falcon-inspired configuration are shown in Table 2.
Table 2.
Chord length calculations for Falcon-inspired configurations.
The sweep angle of the flying wing of this UAV is revealed in Equation (7), which comprises of root chord of the flying wing, tip chord of the flying wing and half of the wingspan [28,29].
2.1.4. Dragonfly-Inspired Configuration
The span-wise chord estimations of the flying wing are mentioned in Table 3 for the dragonfly-inspired configuration.
Table 3.
Chord length calculations for Dragonfly-inspired configuration.
The sweep angle of the flying wing of this UAV is revealed in Equation (7), which comprises the root chord and tip chord of the flying wing along with half of the wingspan. Here, the angle changes after 60% of the span.
Finally, the computed parameters used for the design process are listed in Table 4. These data are further used for the design of the flying wing body, done using 3D EXPERIENCE. Following the design of falcon and dragonfly inspired body, the computational study is done to derive the aerodynamic resulting parameters after which the designs are further optimized [28,29].
Table 4.
Obtained design data for the flying wing body development.
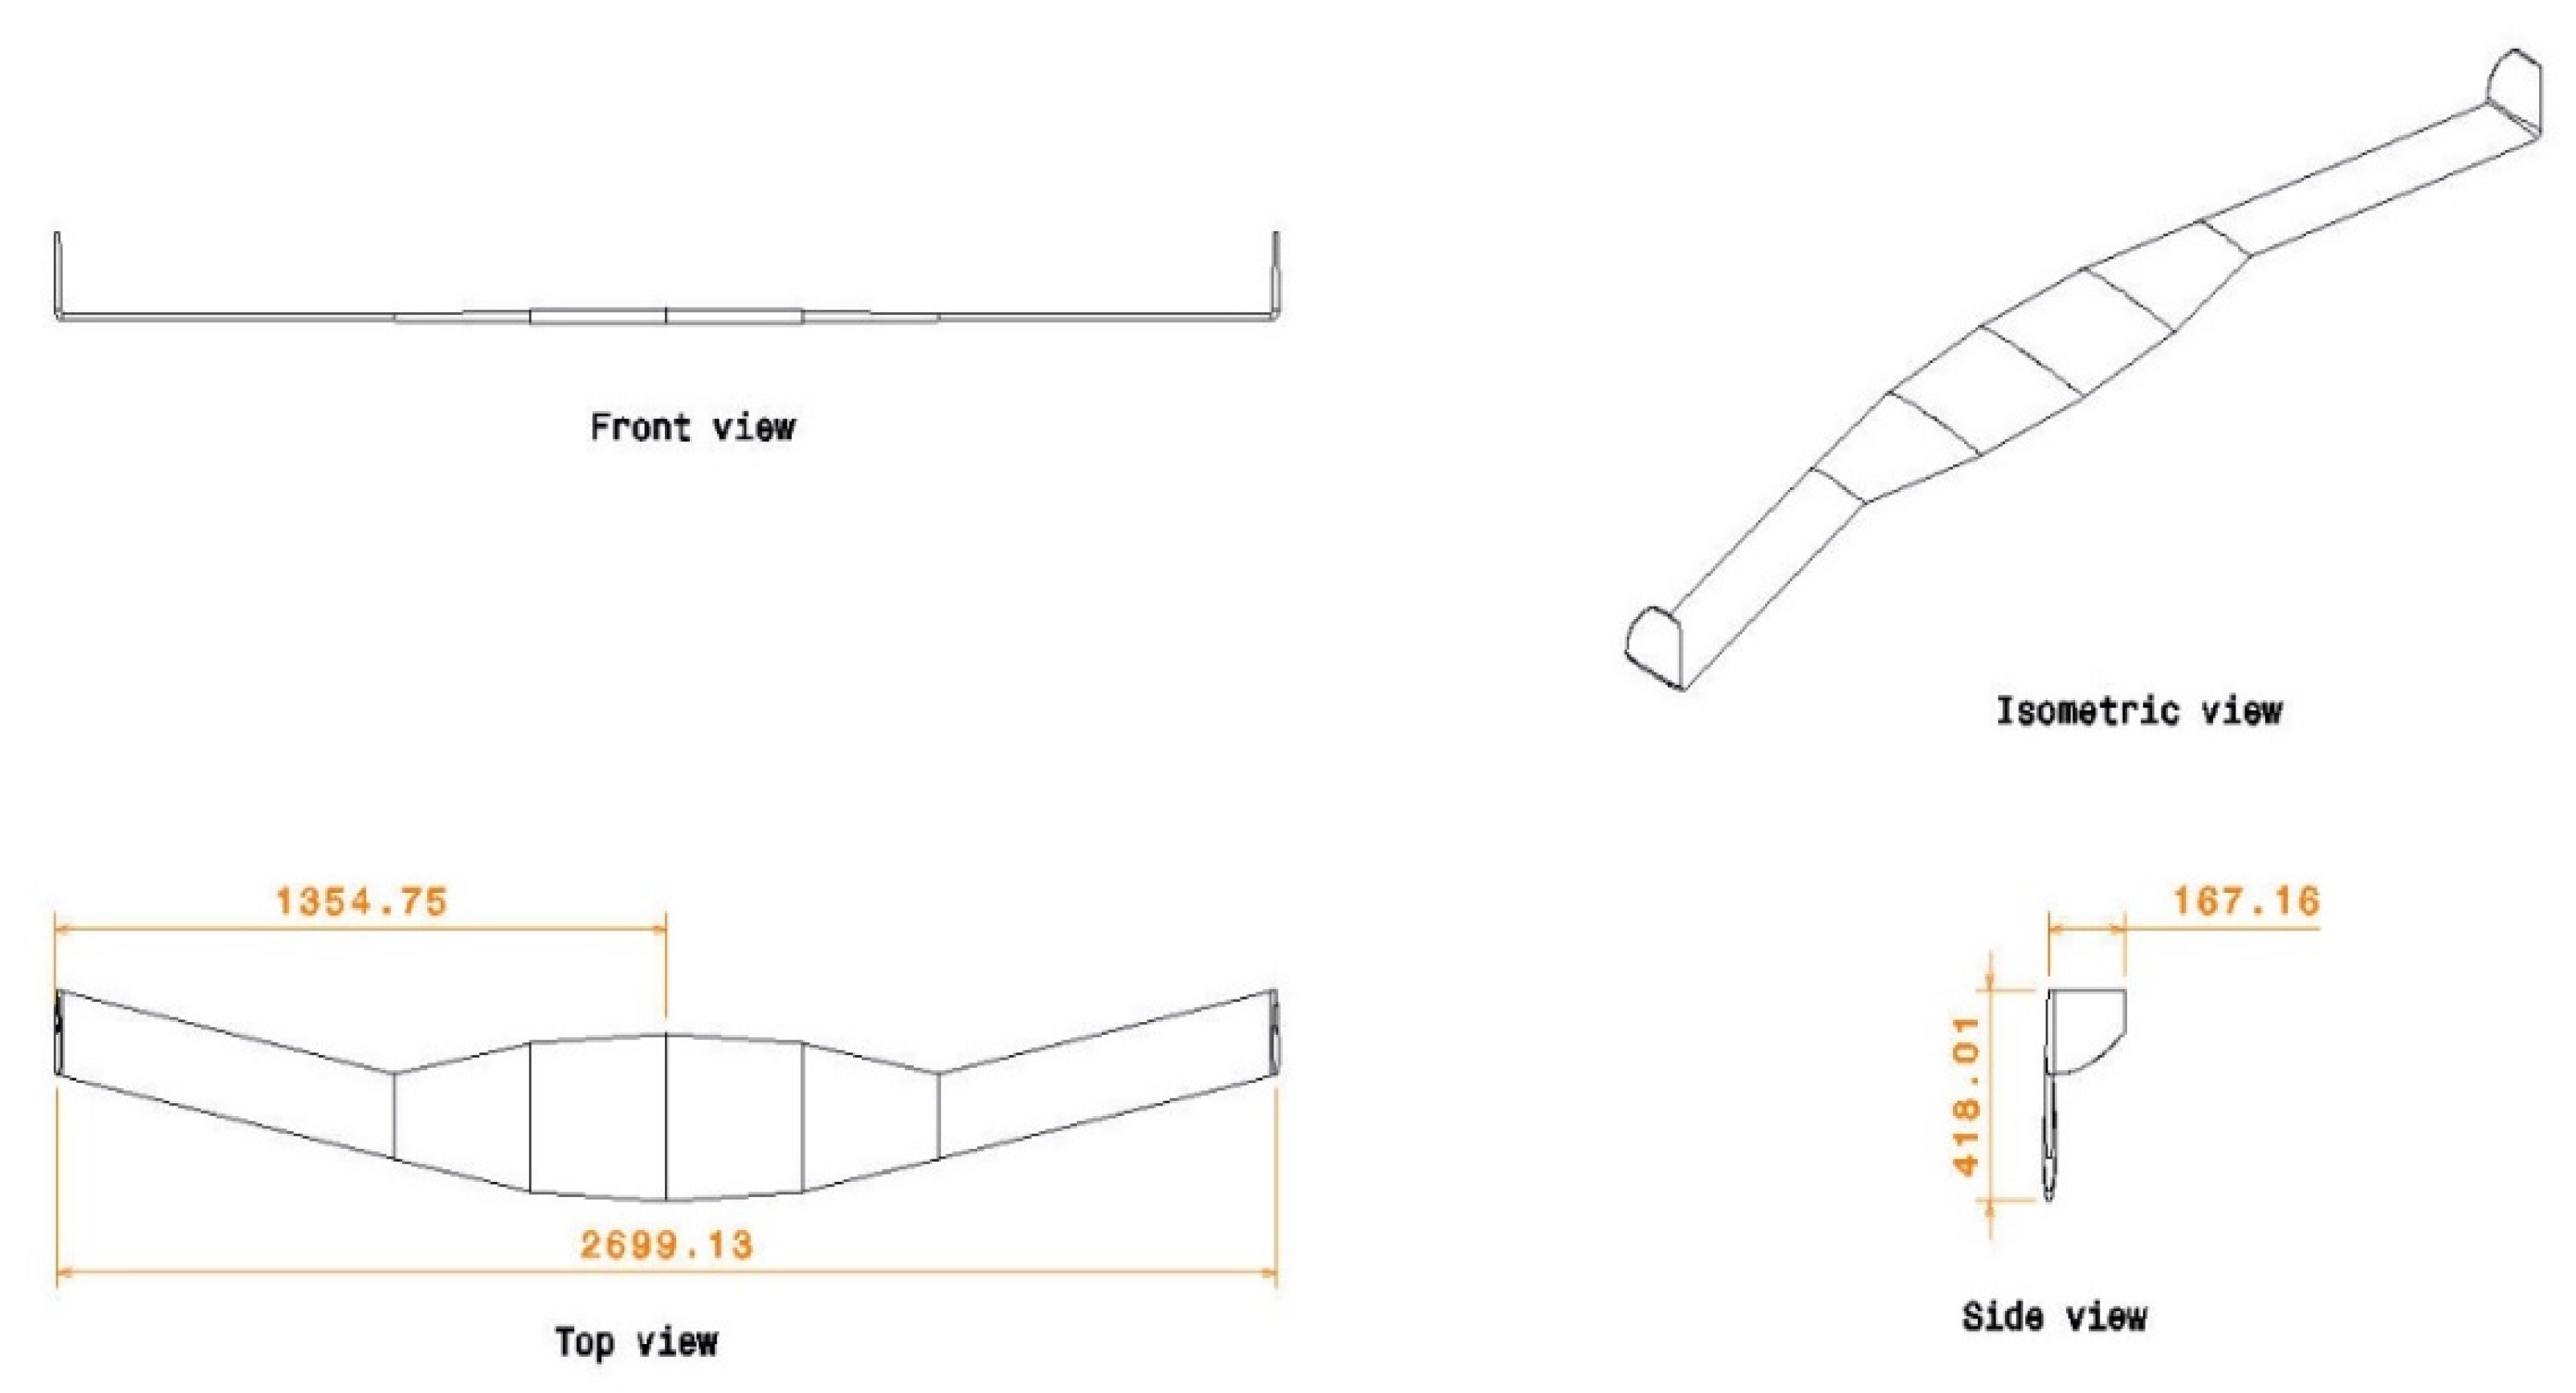
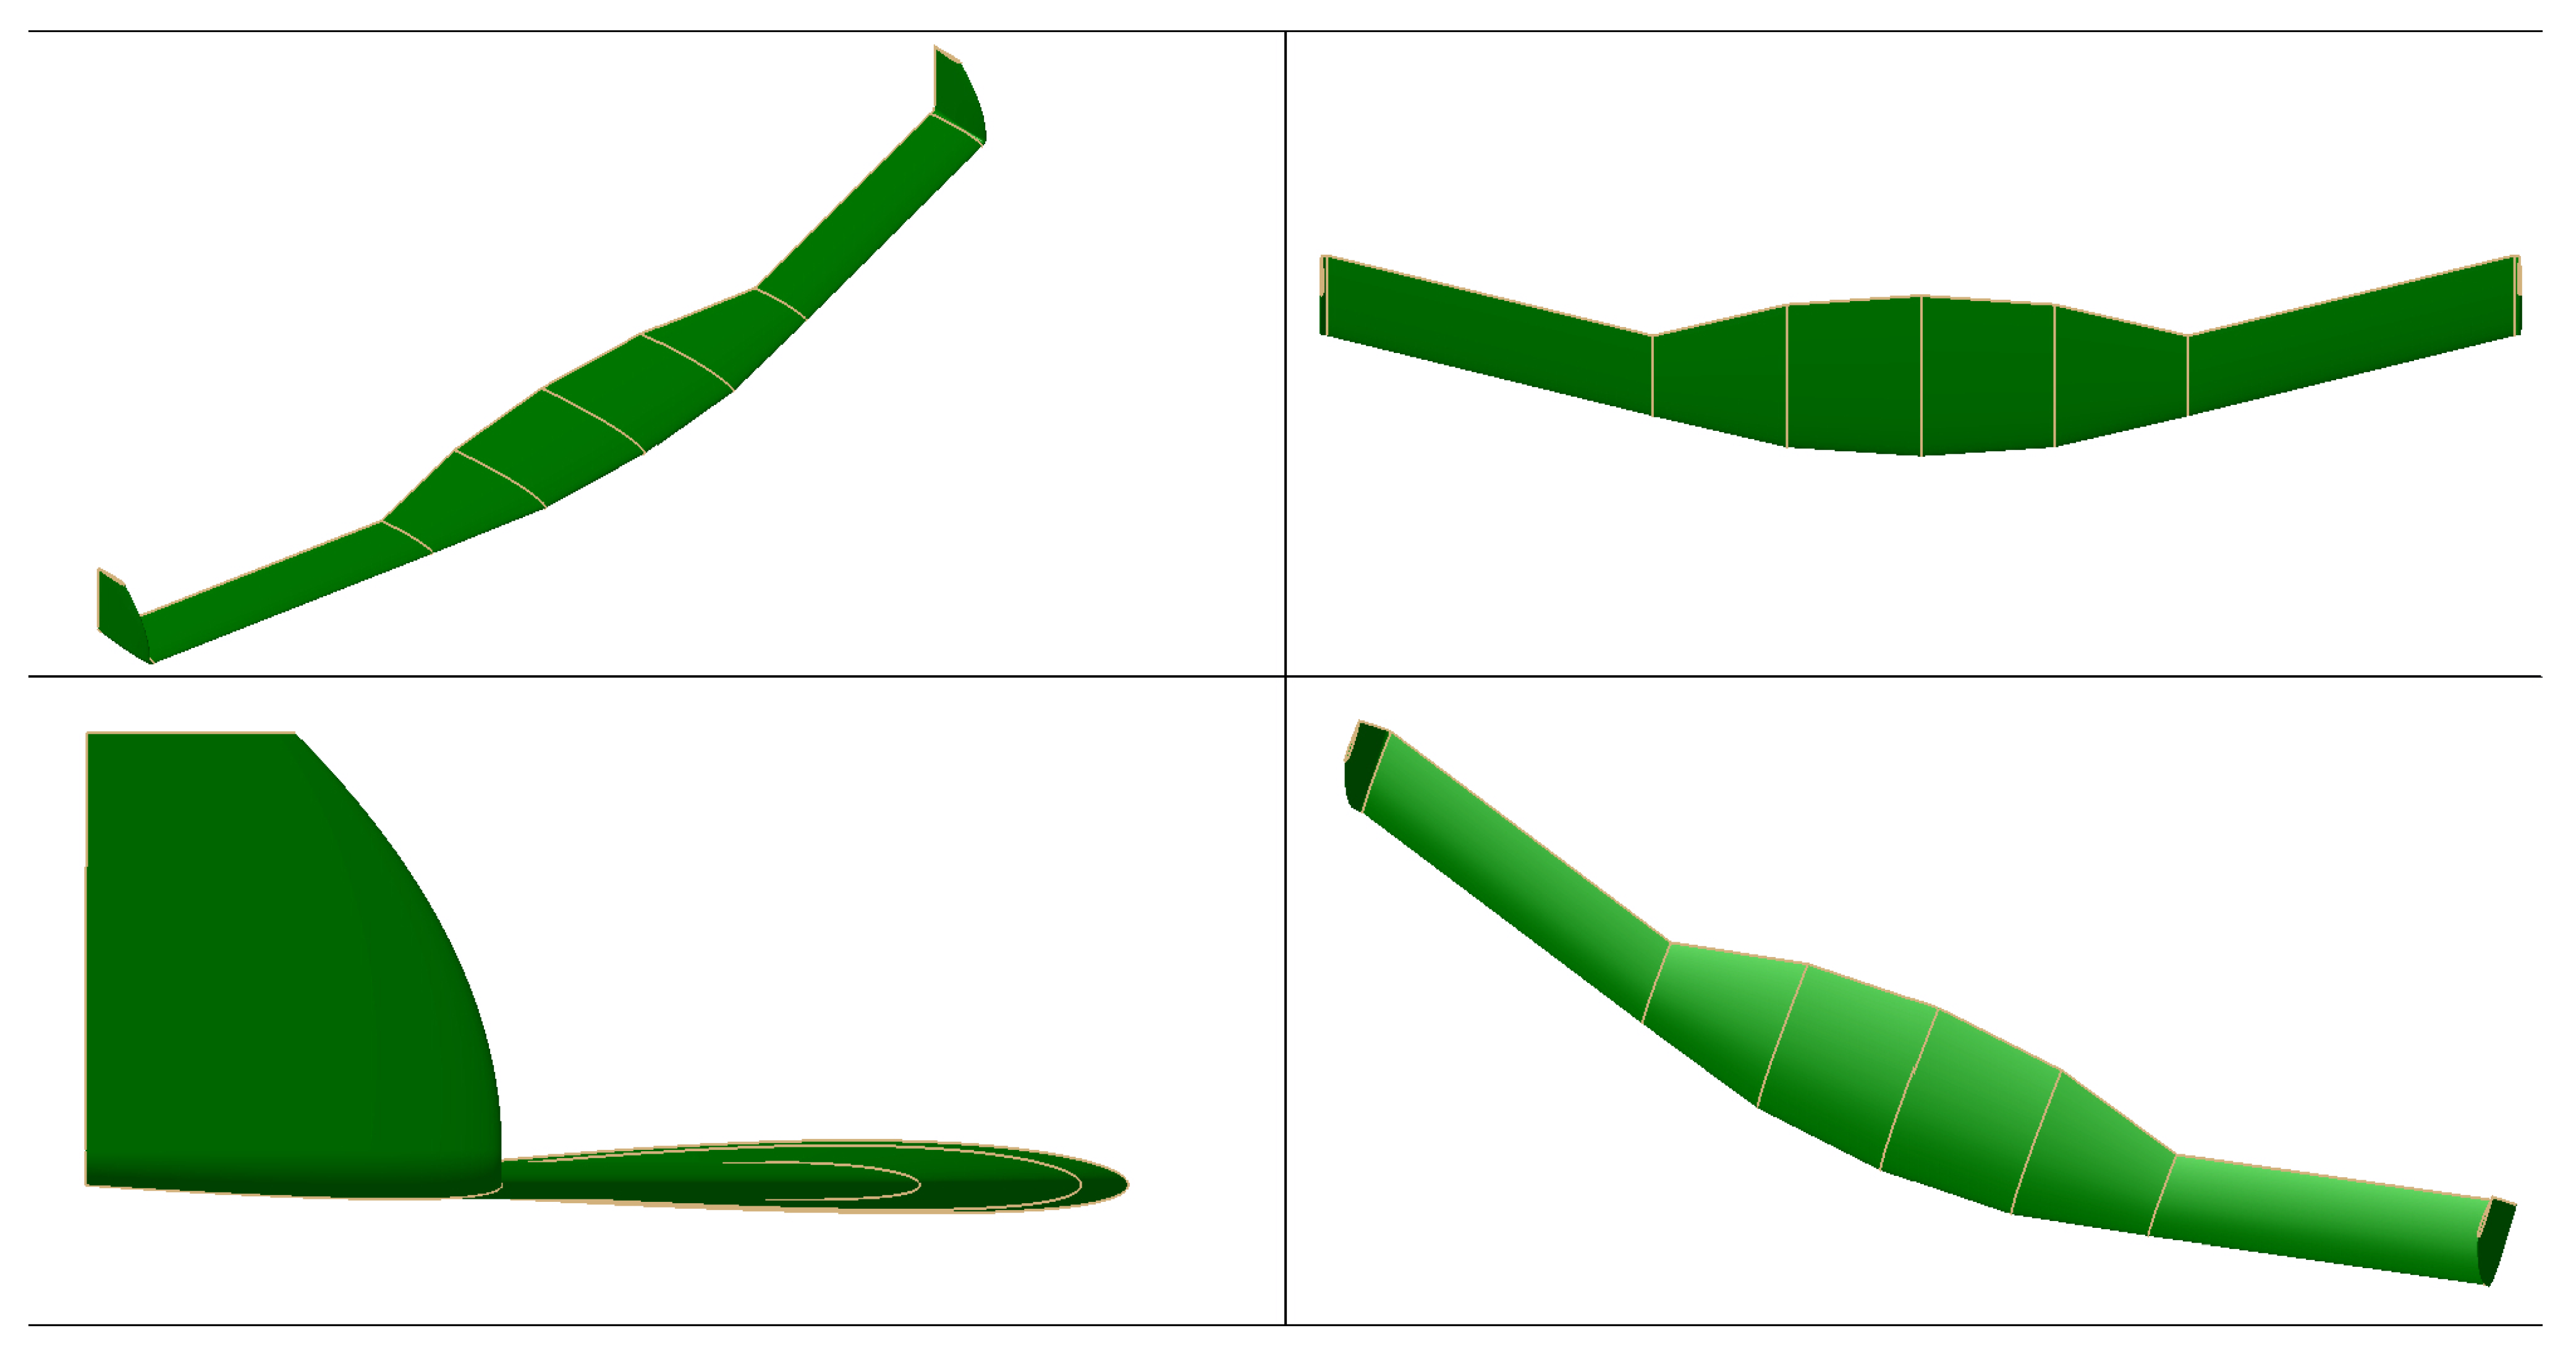
Totally, nine designs are developed from these calculations and optimization processes. The models are revealed in Figure 4, Figure 5, Figure 6, Figure 7, Figure 8, Figure 9, Figure 10, Figure 11, Figure 12, Figure 13, Figure 14, Figure 15, Figure 16, Figure 17, Figure 18, Figure 19, Figure 20 and Figure 21.

Figure 4.
Geometrical measurements of the flying wing UAV Base.

Figure 5.
Typical representation of various views of flying wing UAV Base.
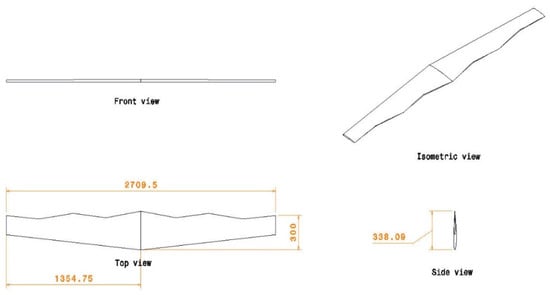
Figure 6.
Geometrical measurements of the flying wing UAV-CP-1.

Figure 7.
Typical representation of various views of flying wing UAV-CP-1.

Figure 8.
Geometrical measurements of the flying wing UAV-CP-2.
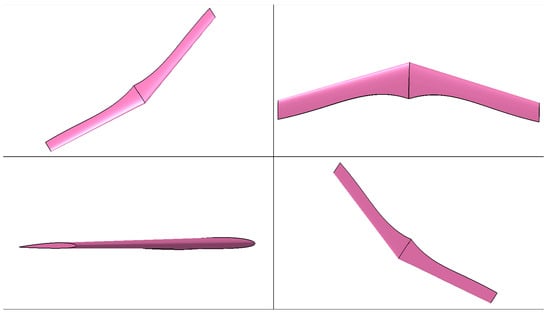
Figure 9.
Typical representation of various views of flying wing UAV-CP-2.
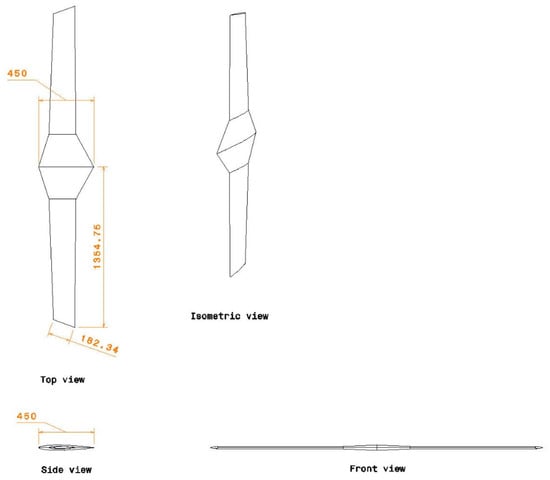
Figure 10.
Geometrical measurements of the flying wing UAV-CP-3.

Figure 11.
Typical representation of various views of flying wing UAV-CP-3.

Figure 12.
Geometrical measurements of the flying wing UAV-AP-1.

Figure 13.
Typical representation of various views of flying wing UAV-AP-1.
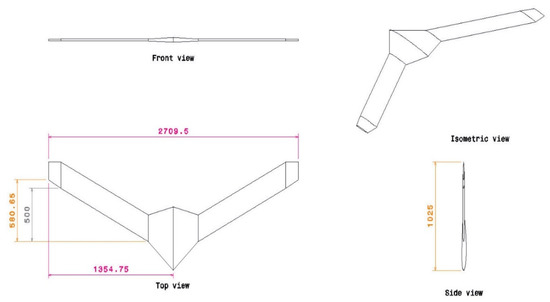
Figure 14.
Geometrical measurements of the flying wing UAV-AP-2.
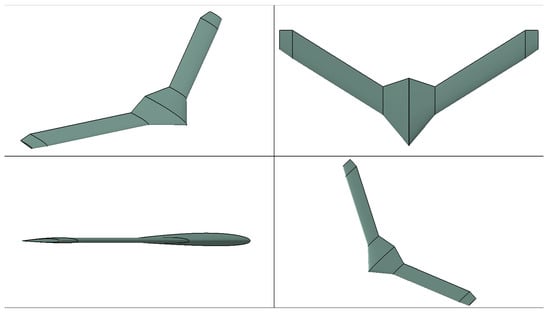
Figure 15.
Typical representation of various views of flying wing UAV-AP-2.
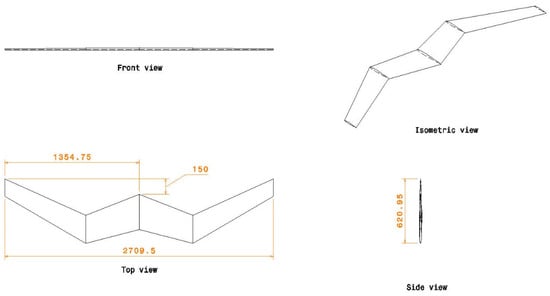
Figure 16.
Geometrical measurements of the flying wing UAV-NIP-1.

Figure 17.
Typical representation of various views of flying wing UAV-NIP-1.
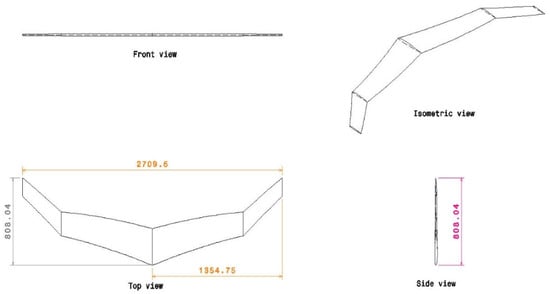
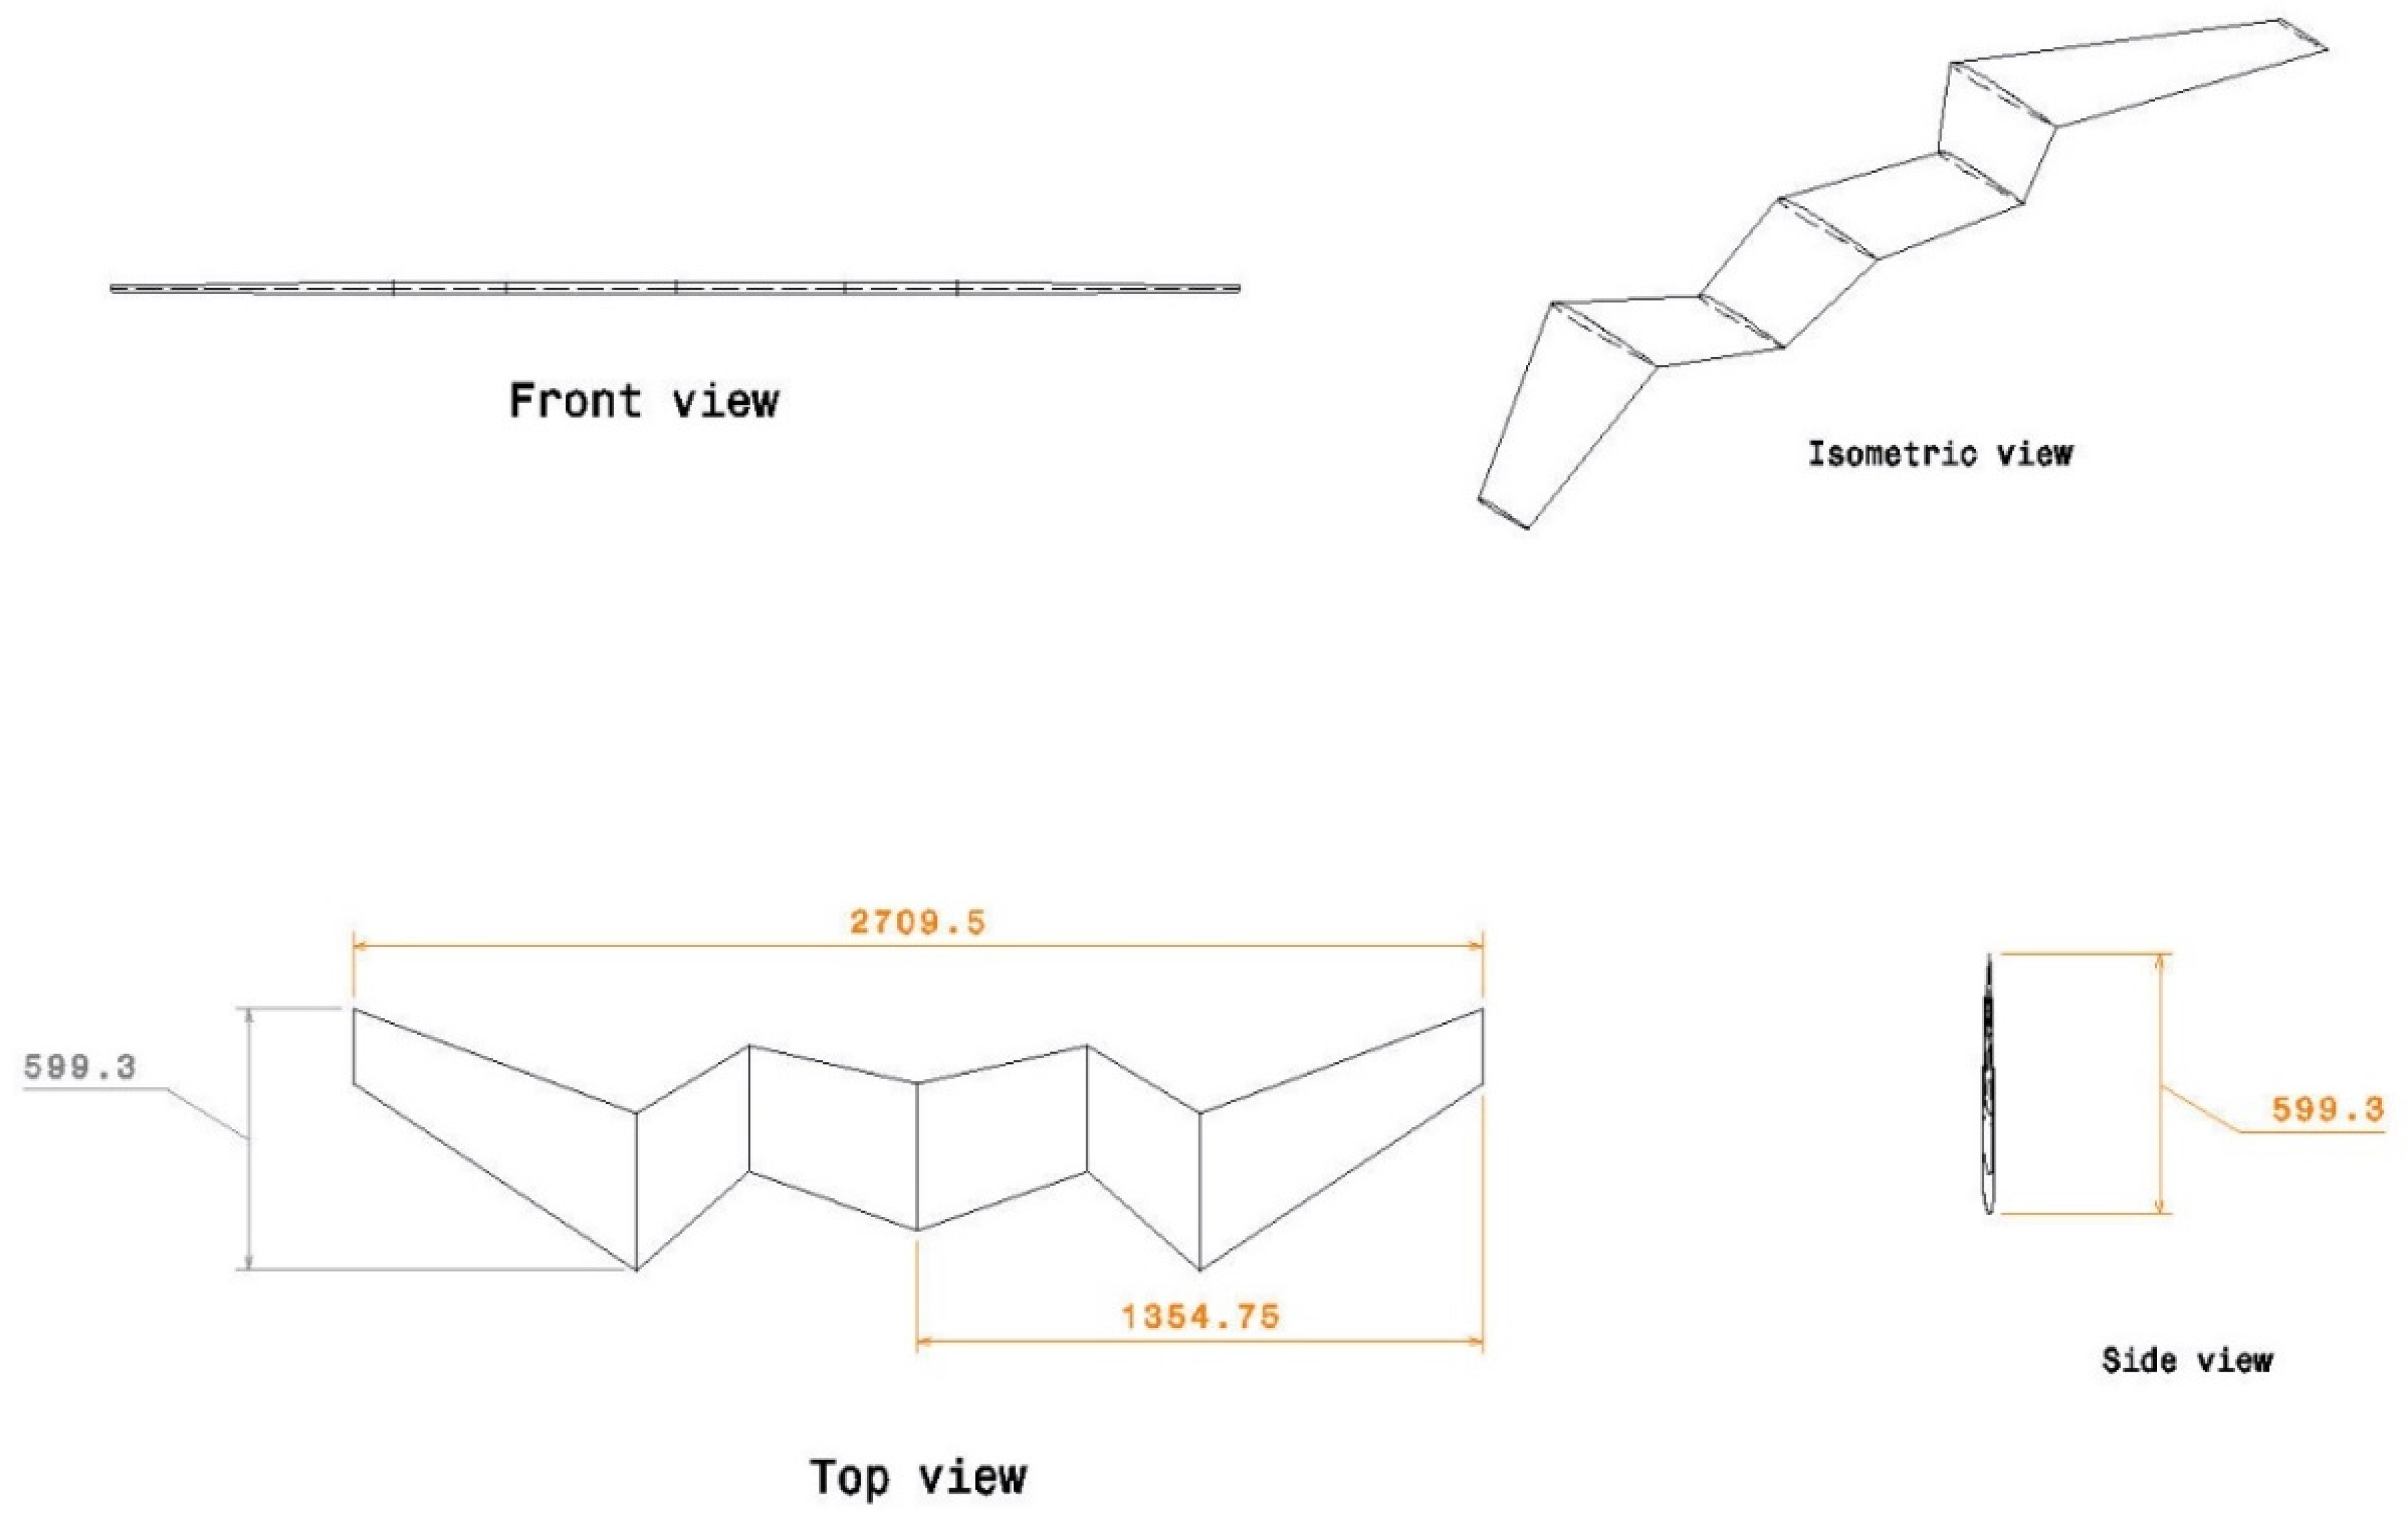
Figure 18.
Geometrical measurements of the flying wing UAV-NIP-2.

Figure 19.
Typical representation of various views of flying wing UAV-NIP-2.

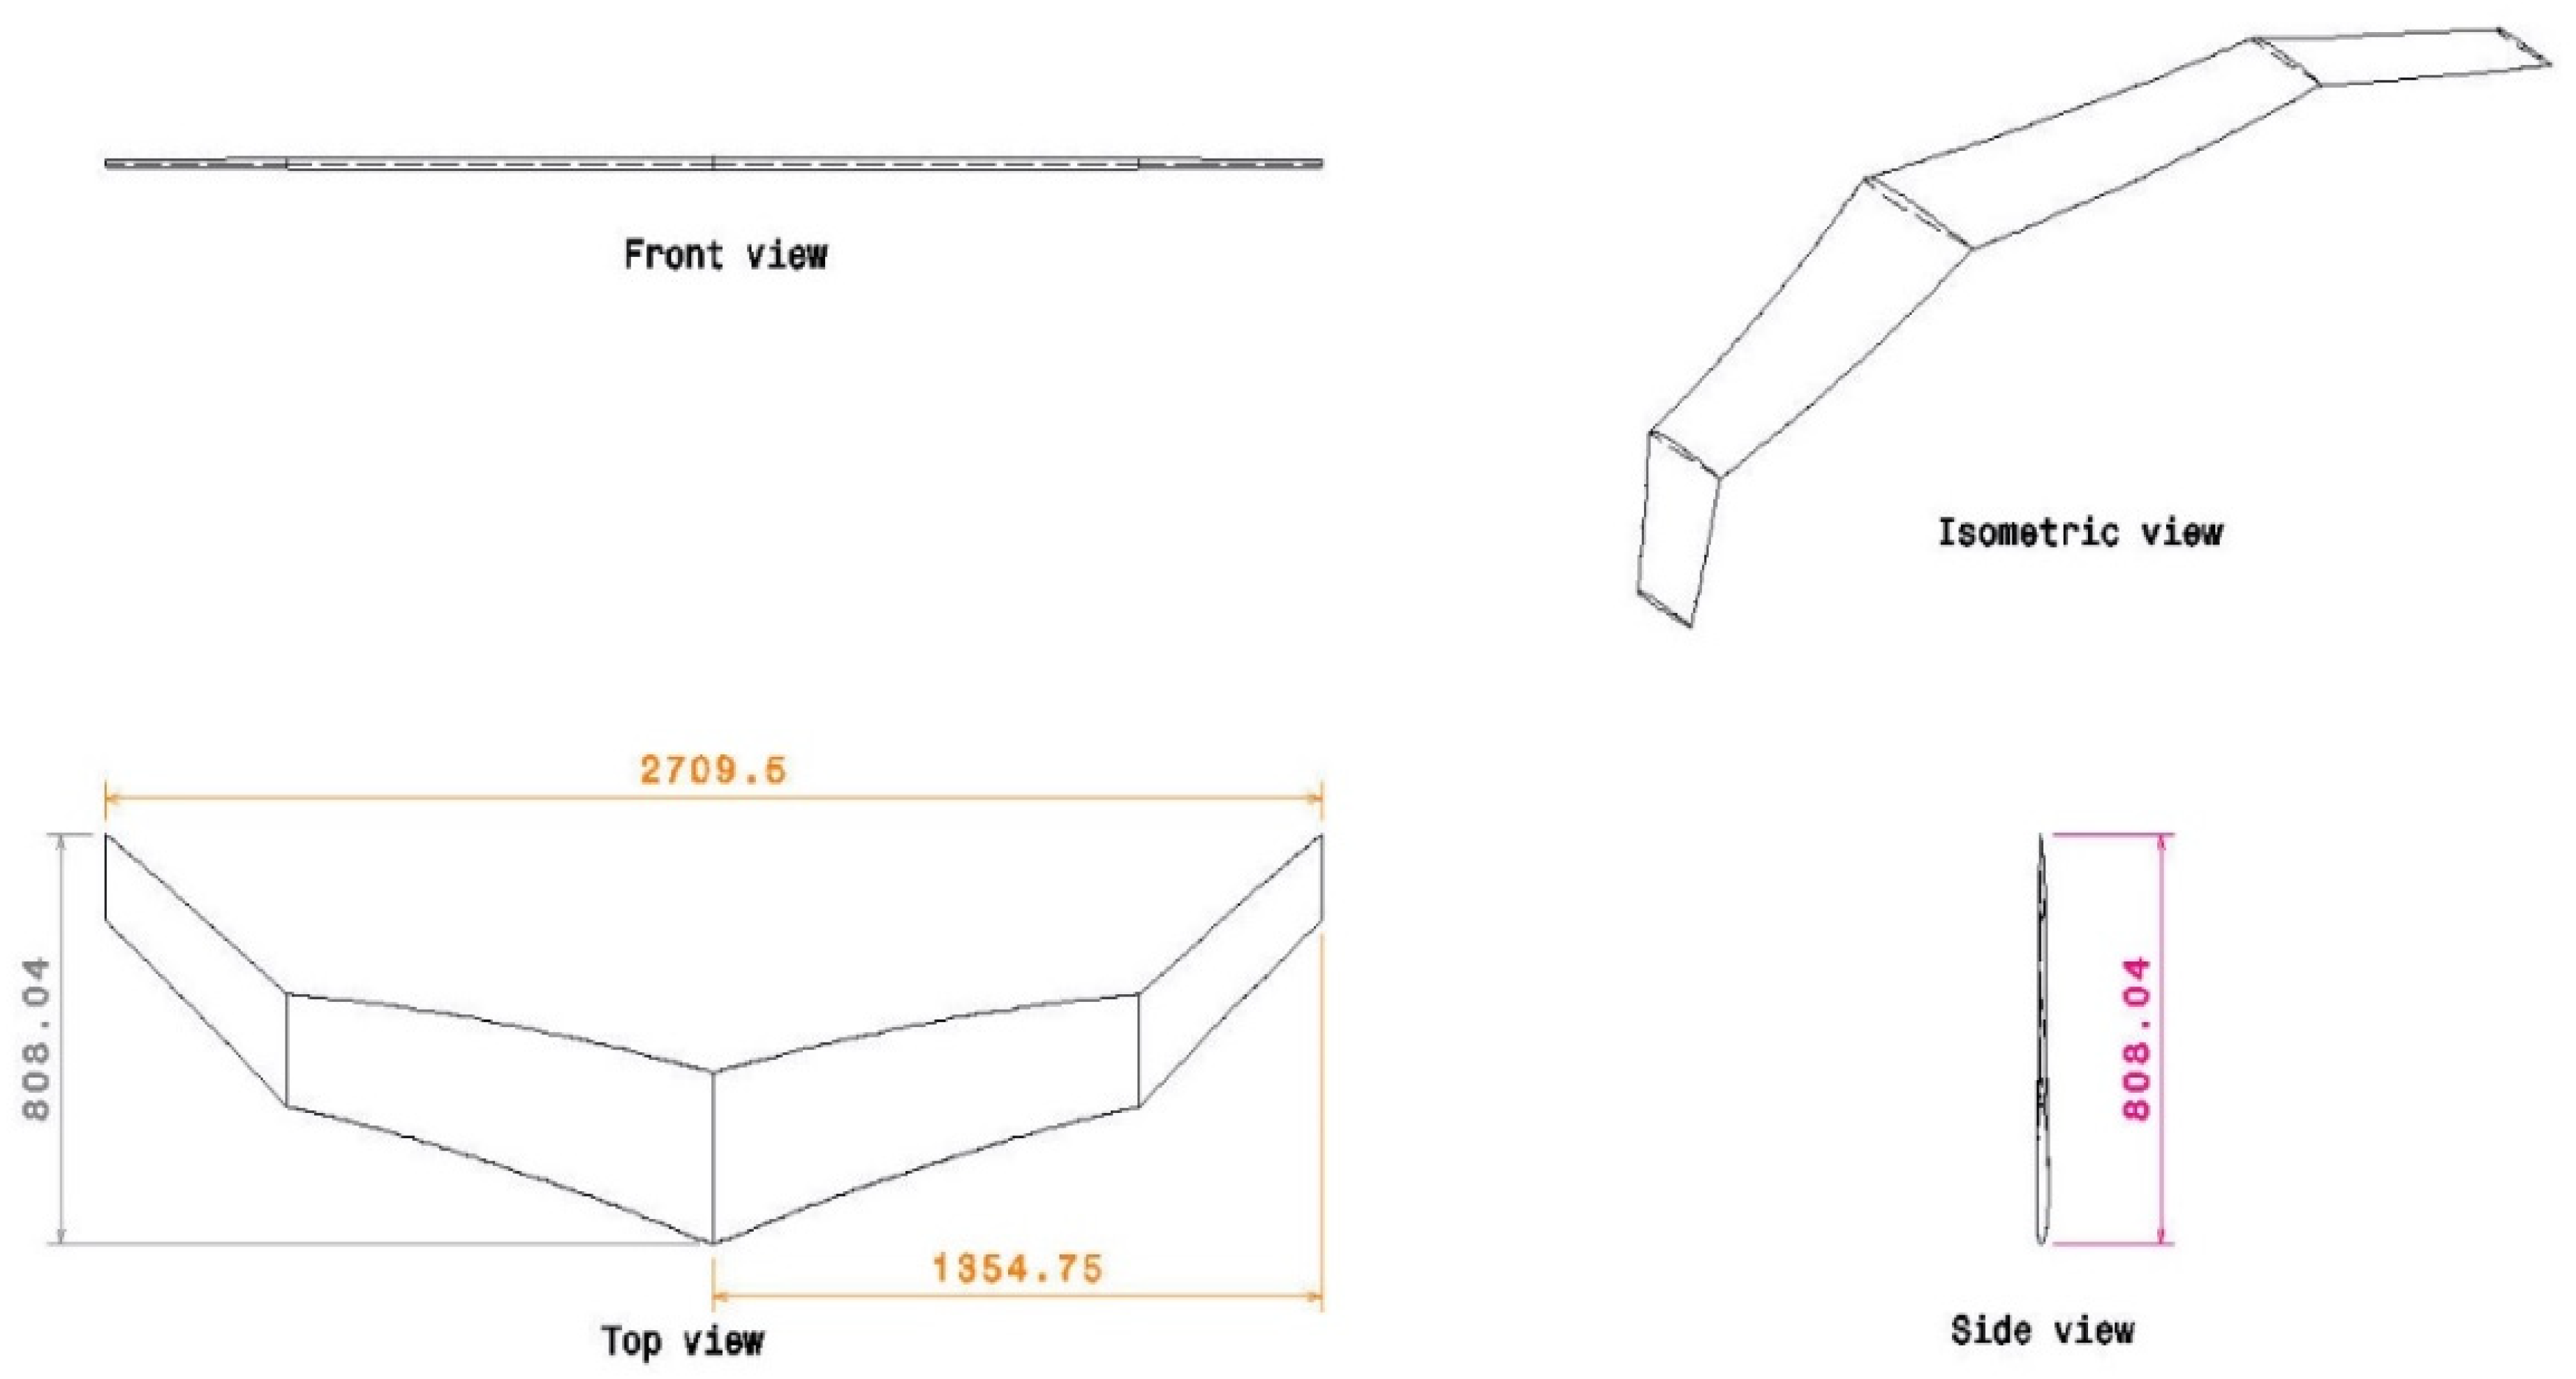
Figure 20.
Geometrical measurements of the flying wing UAV-NIP-3.

Figure 21.
Typical representation of various views of flying wing UAV-NIP-3.
2.1.5. Base Model
2.1.6. Conventional Proposals
2.1.7. Advanced Proposals
2.1.8. Nature Inspired Proposals
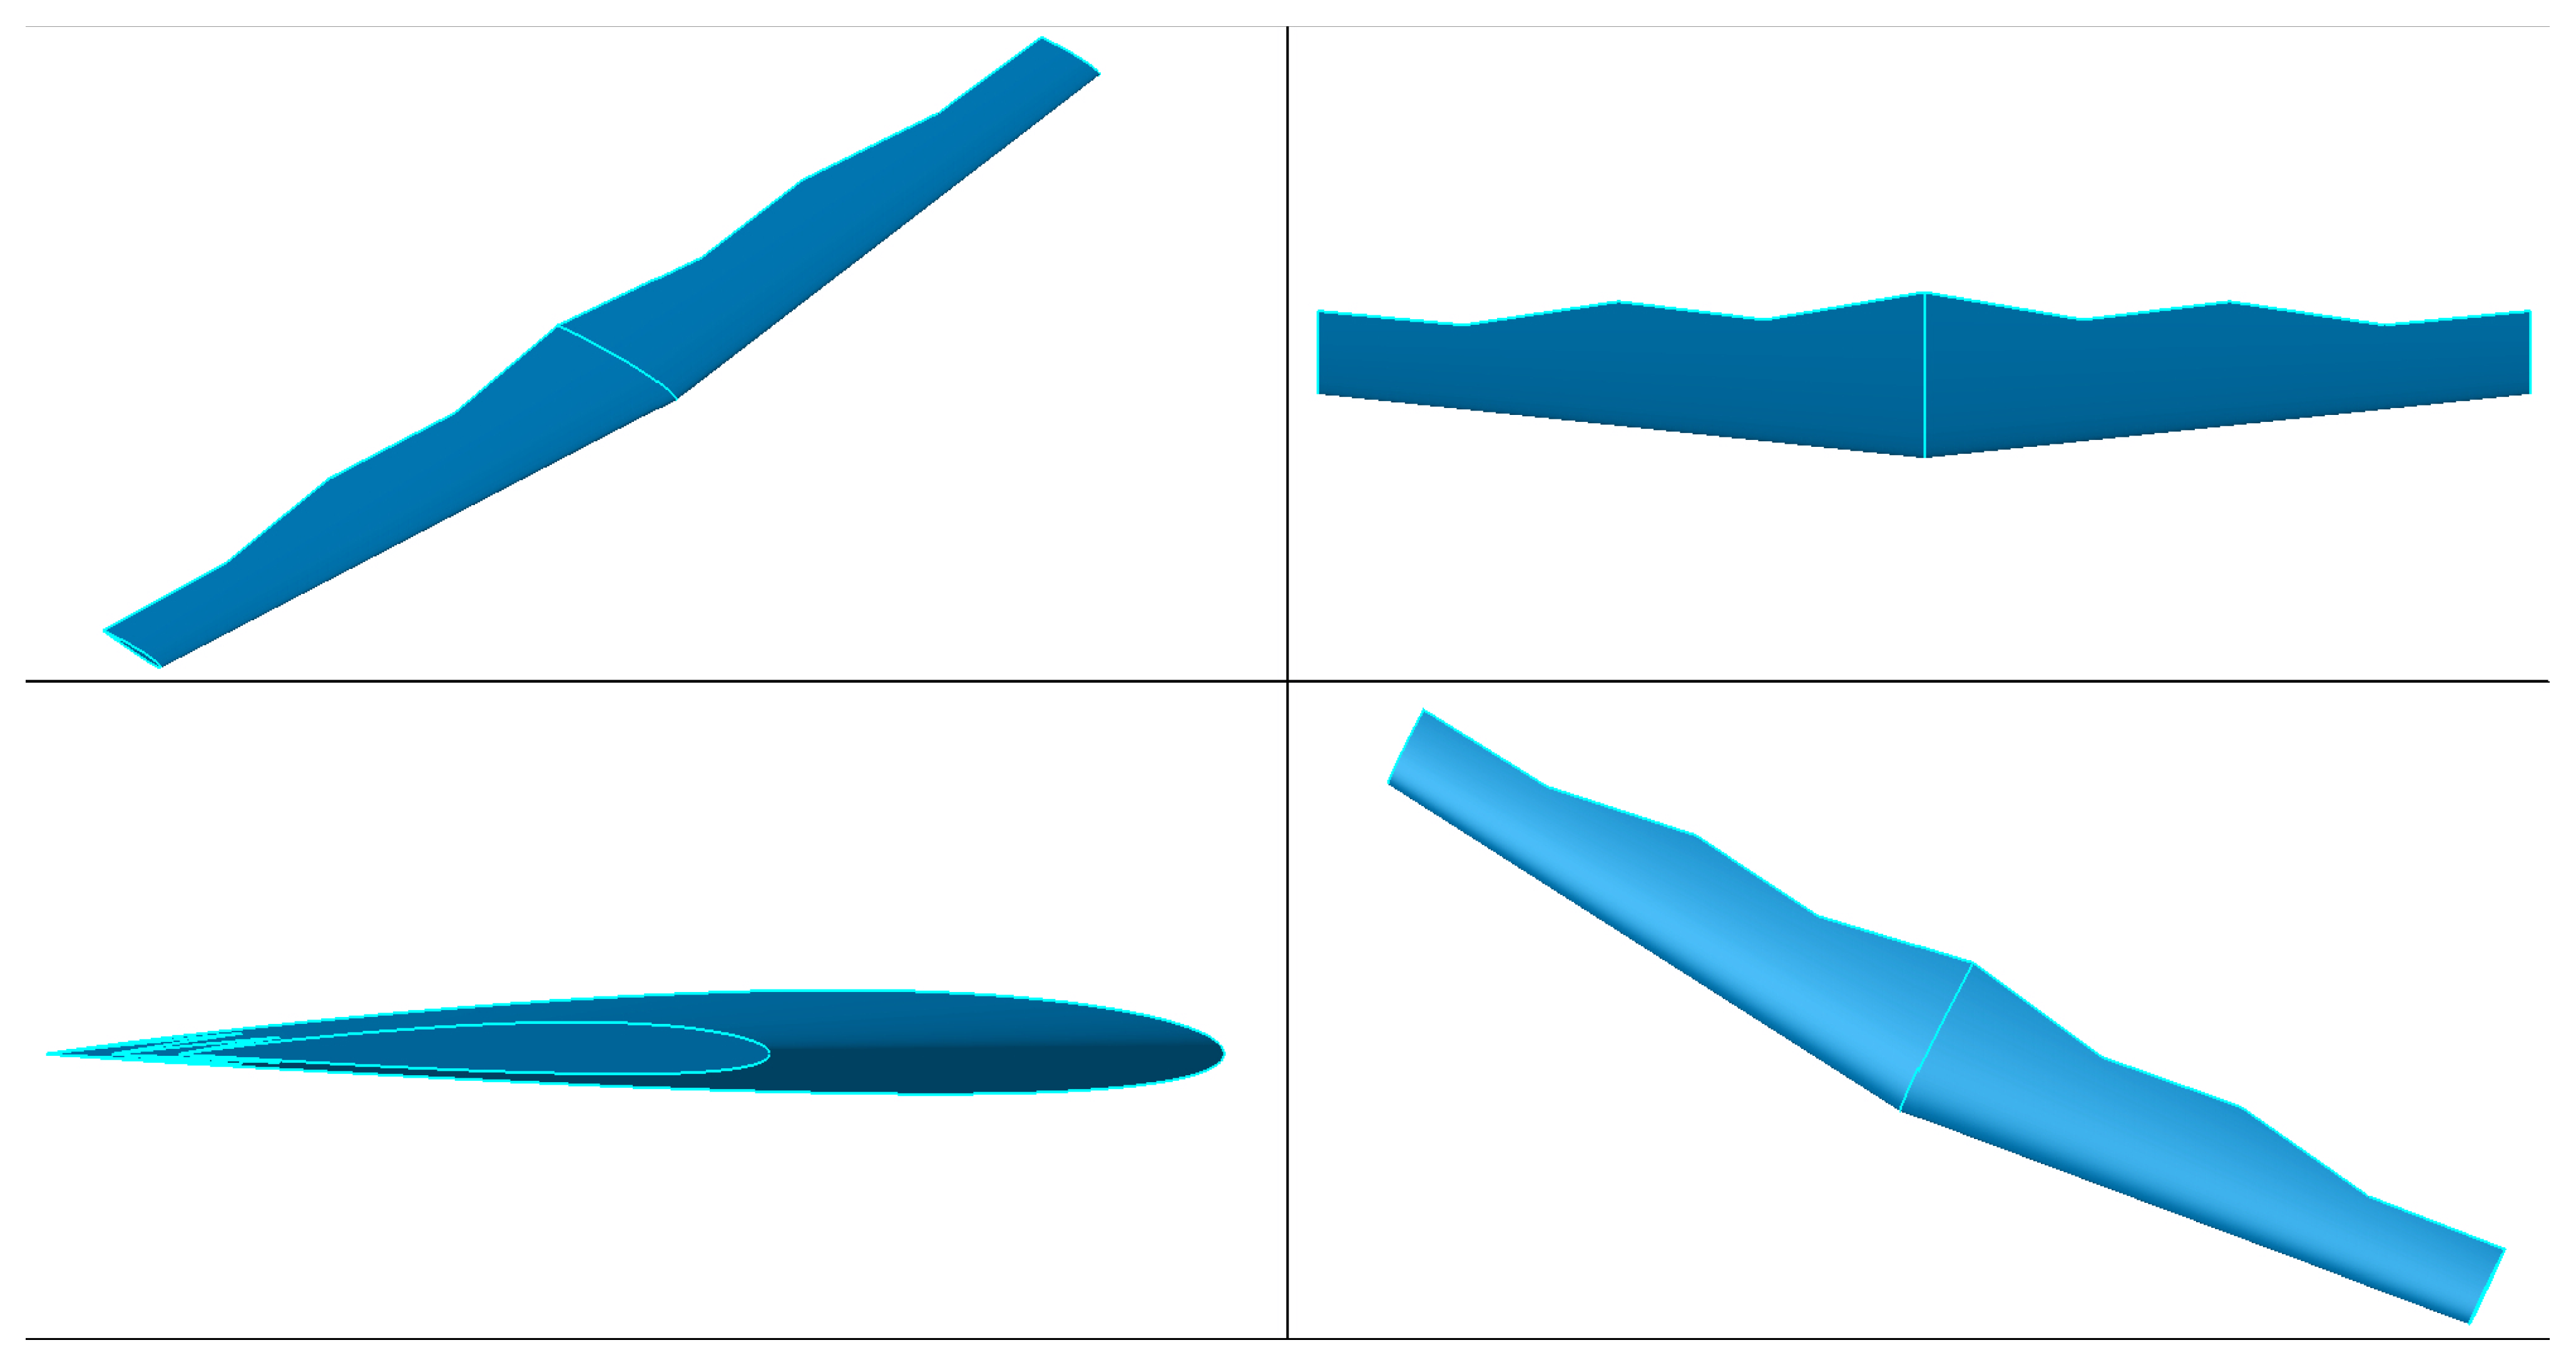
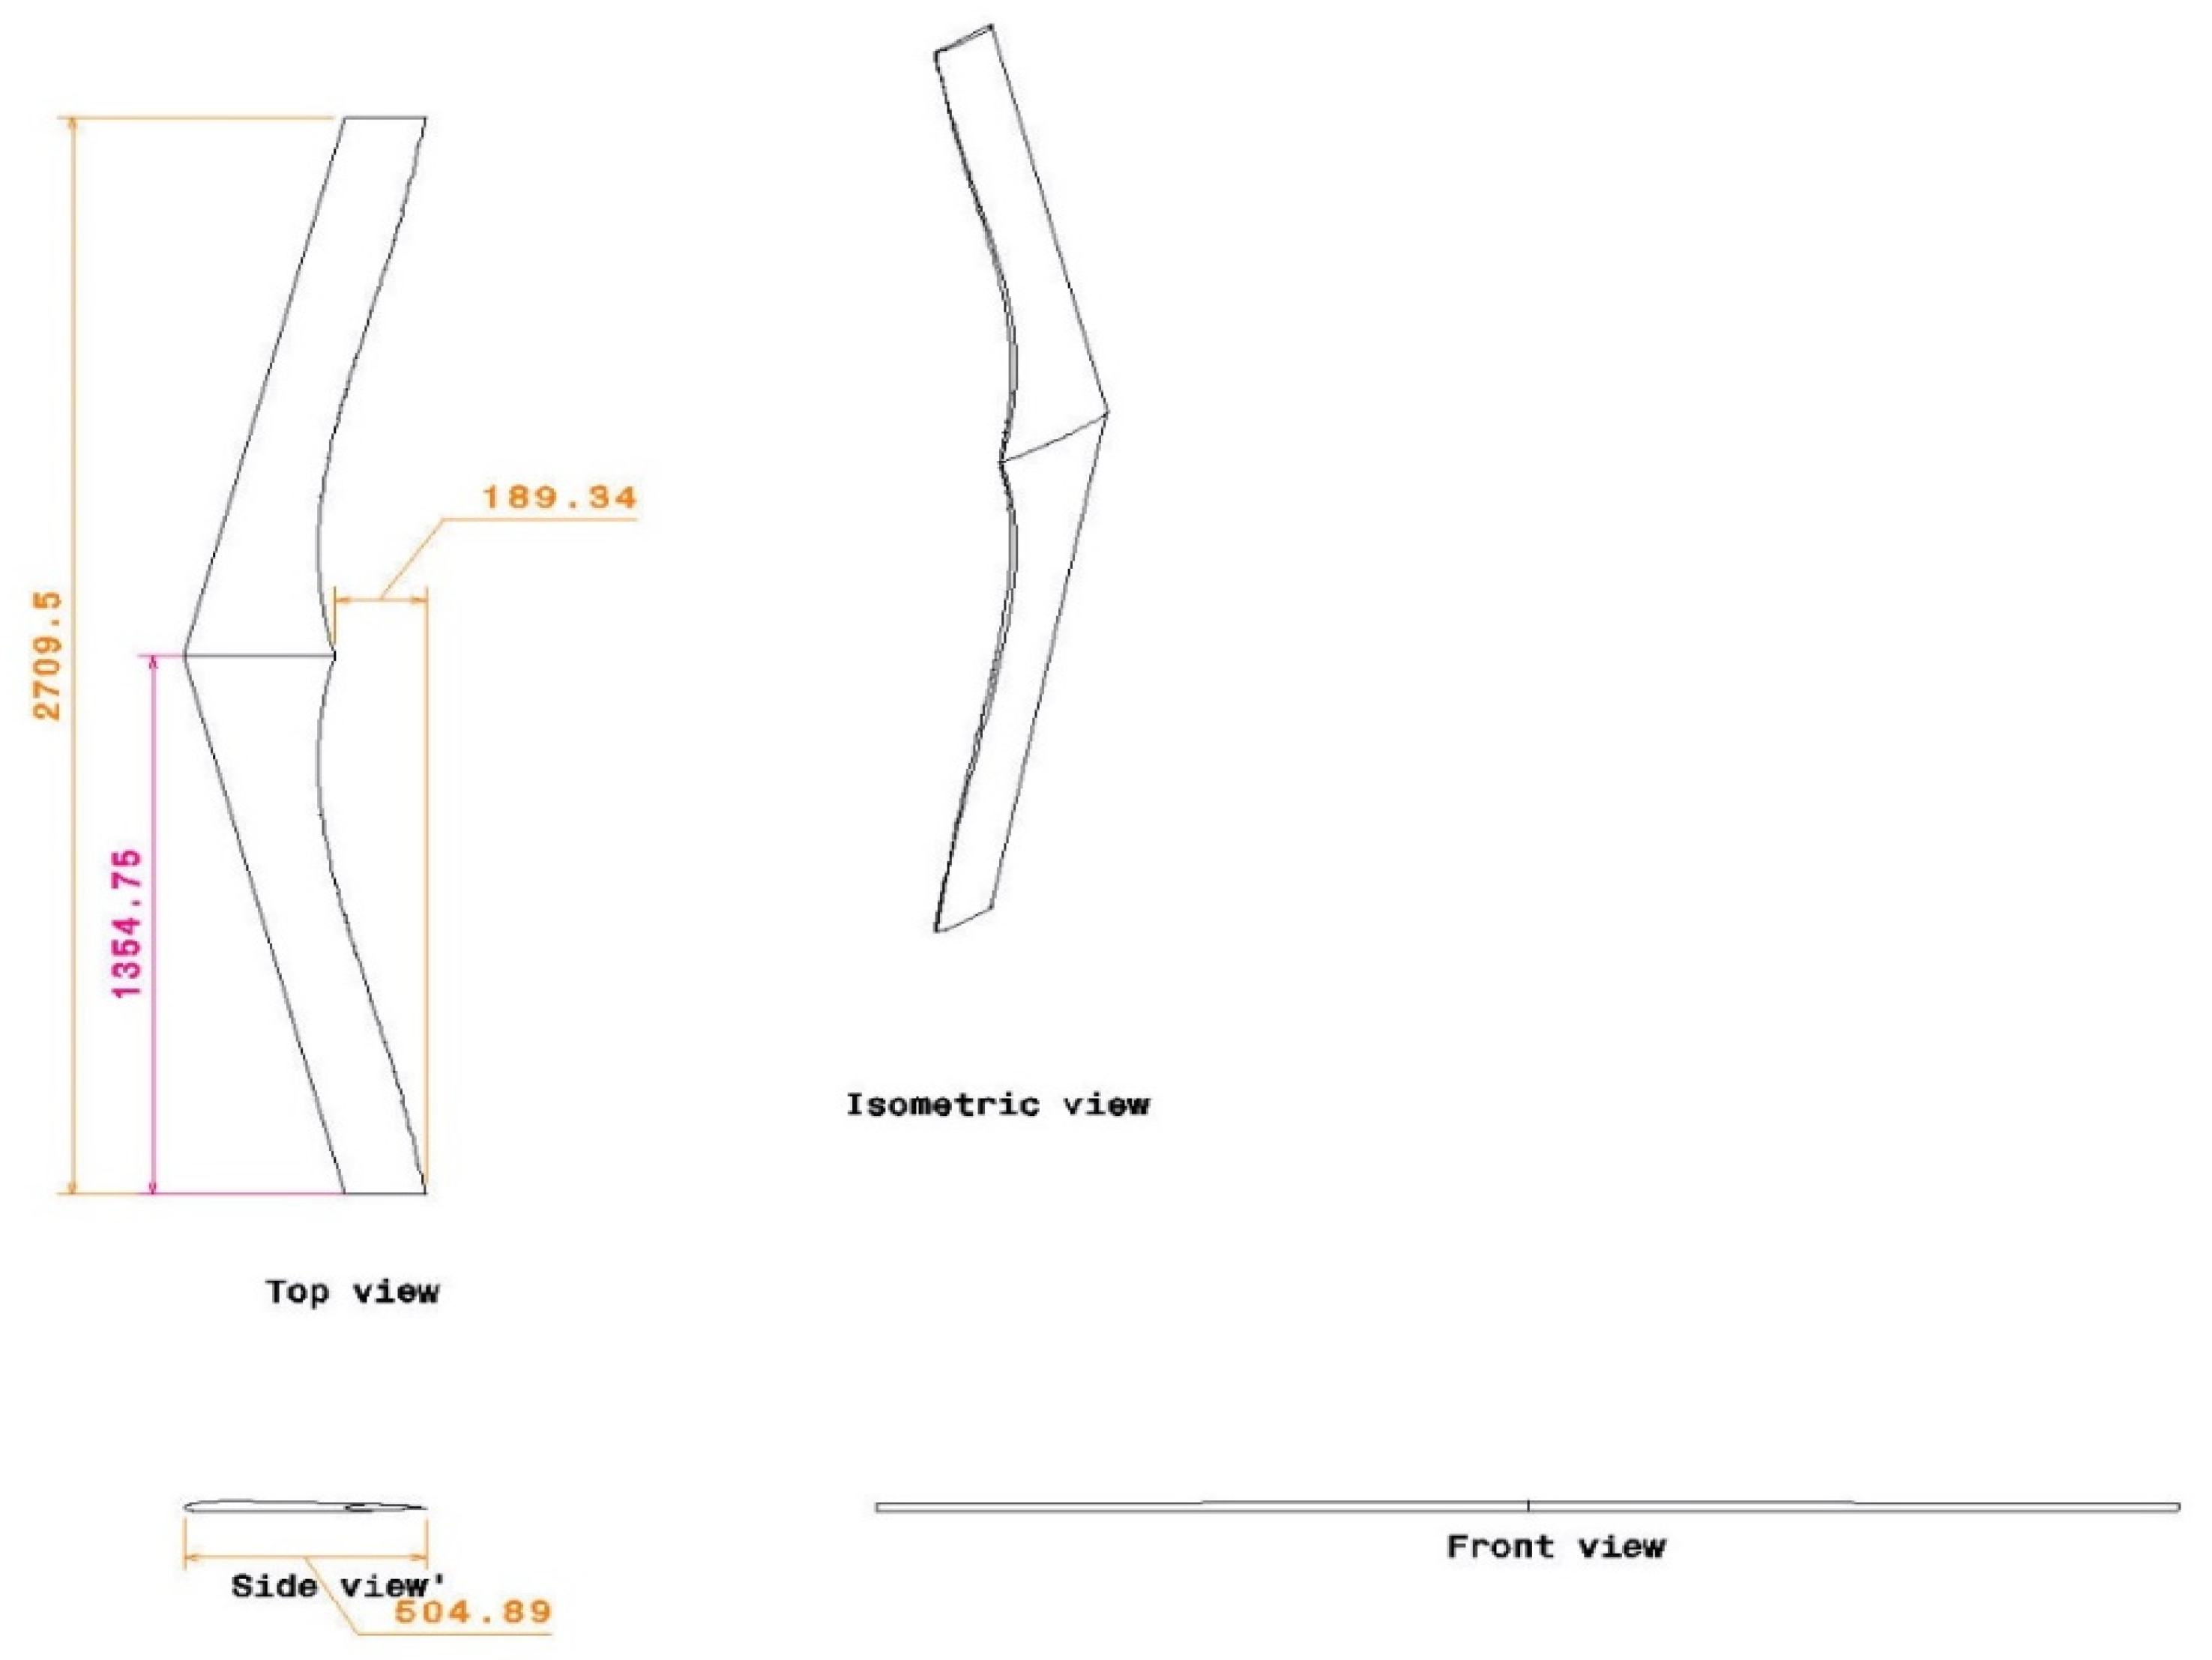
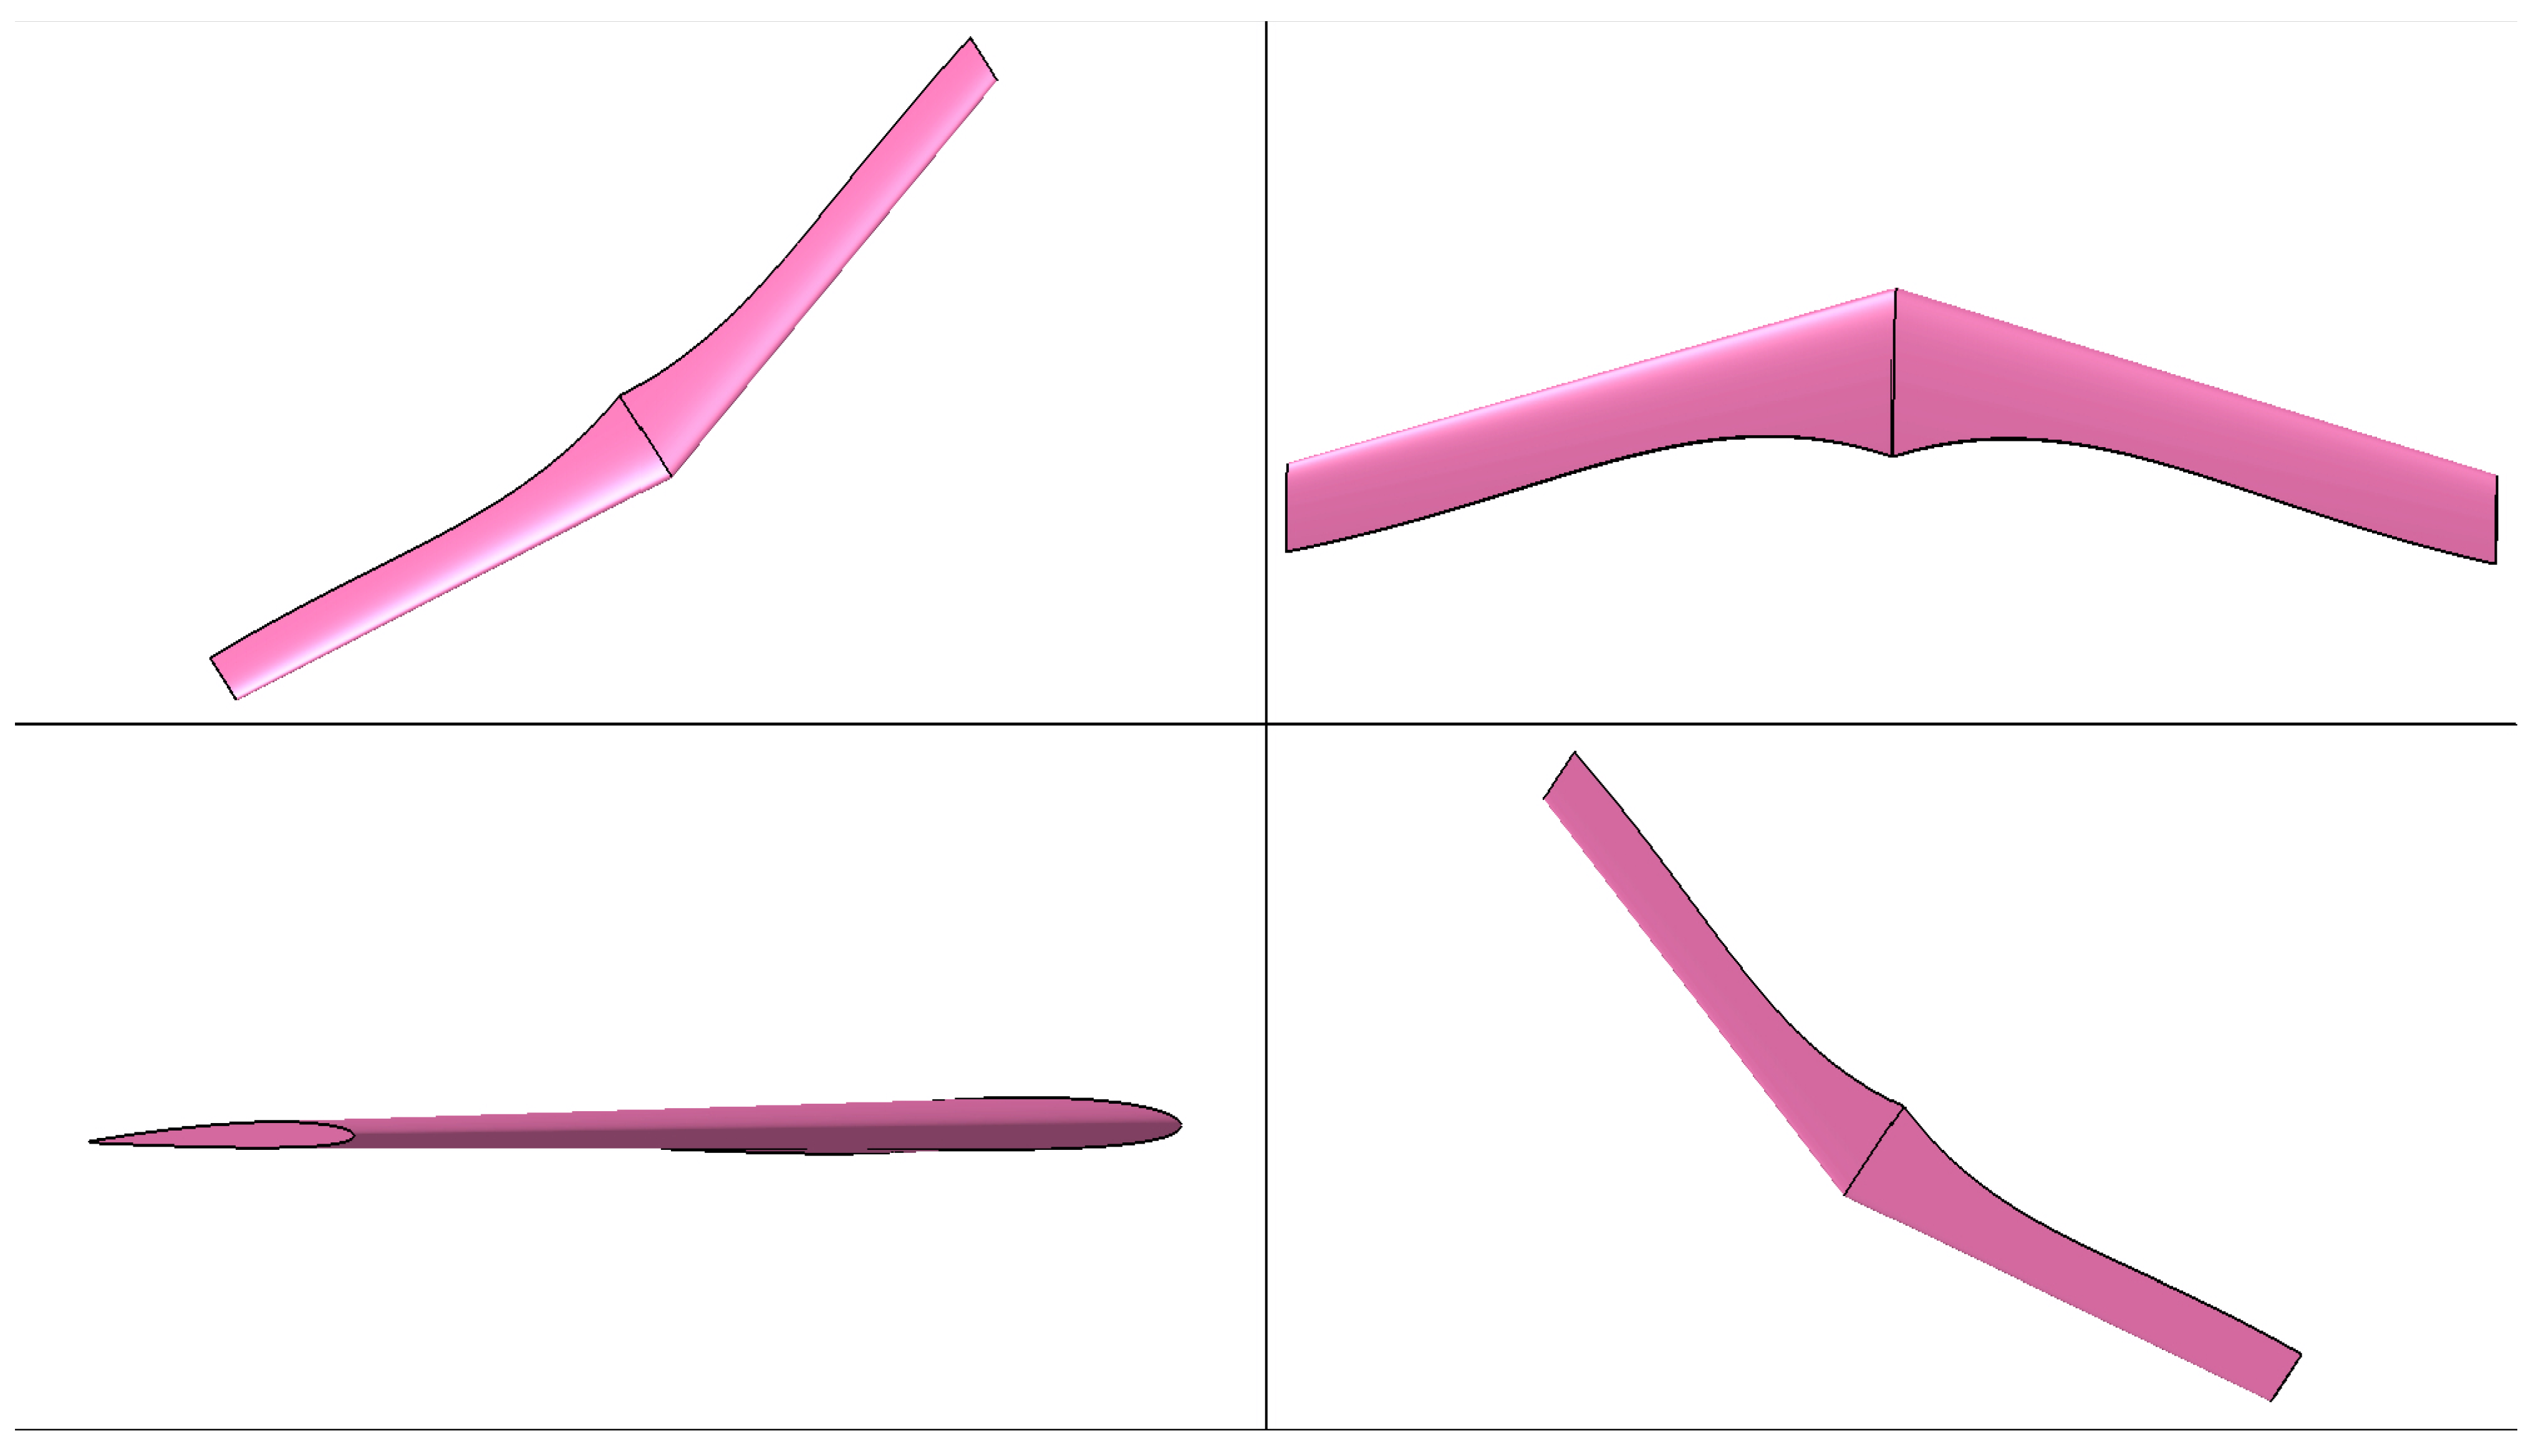
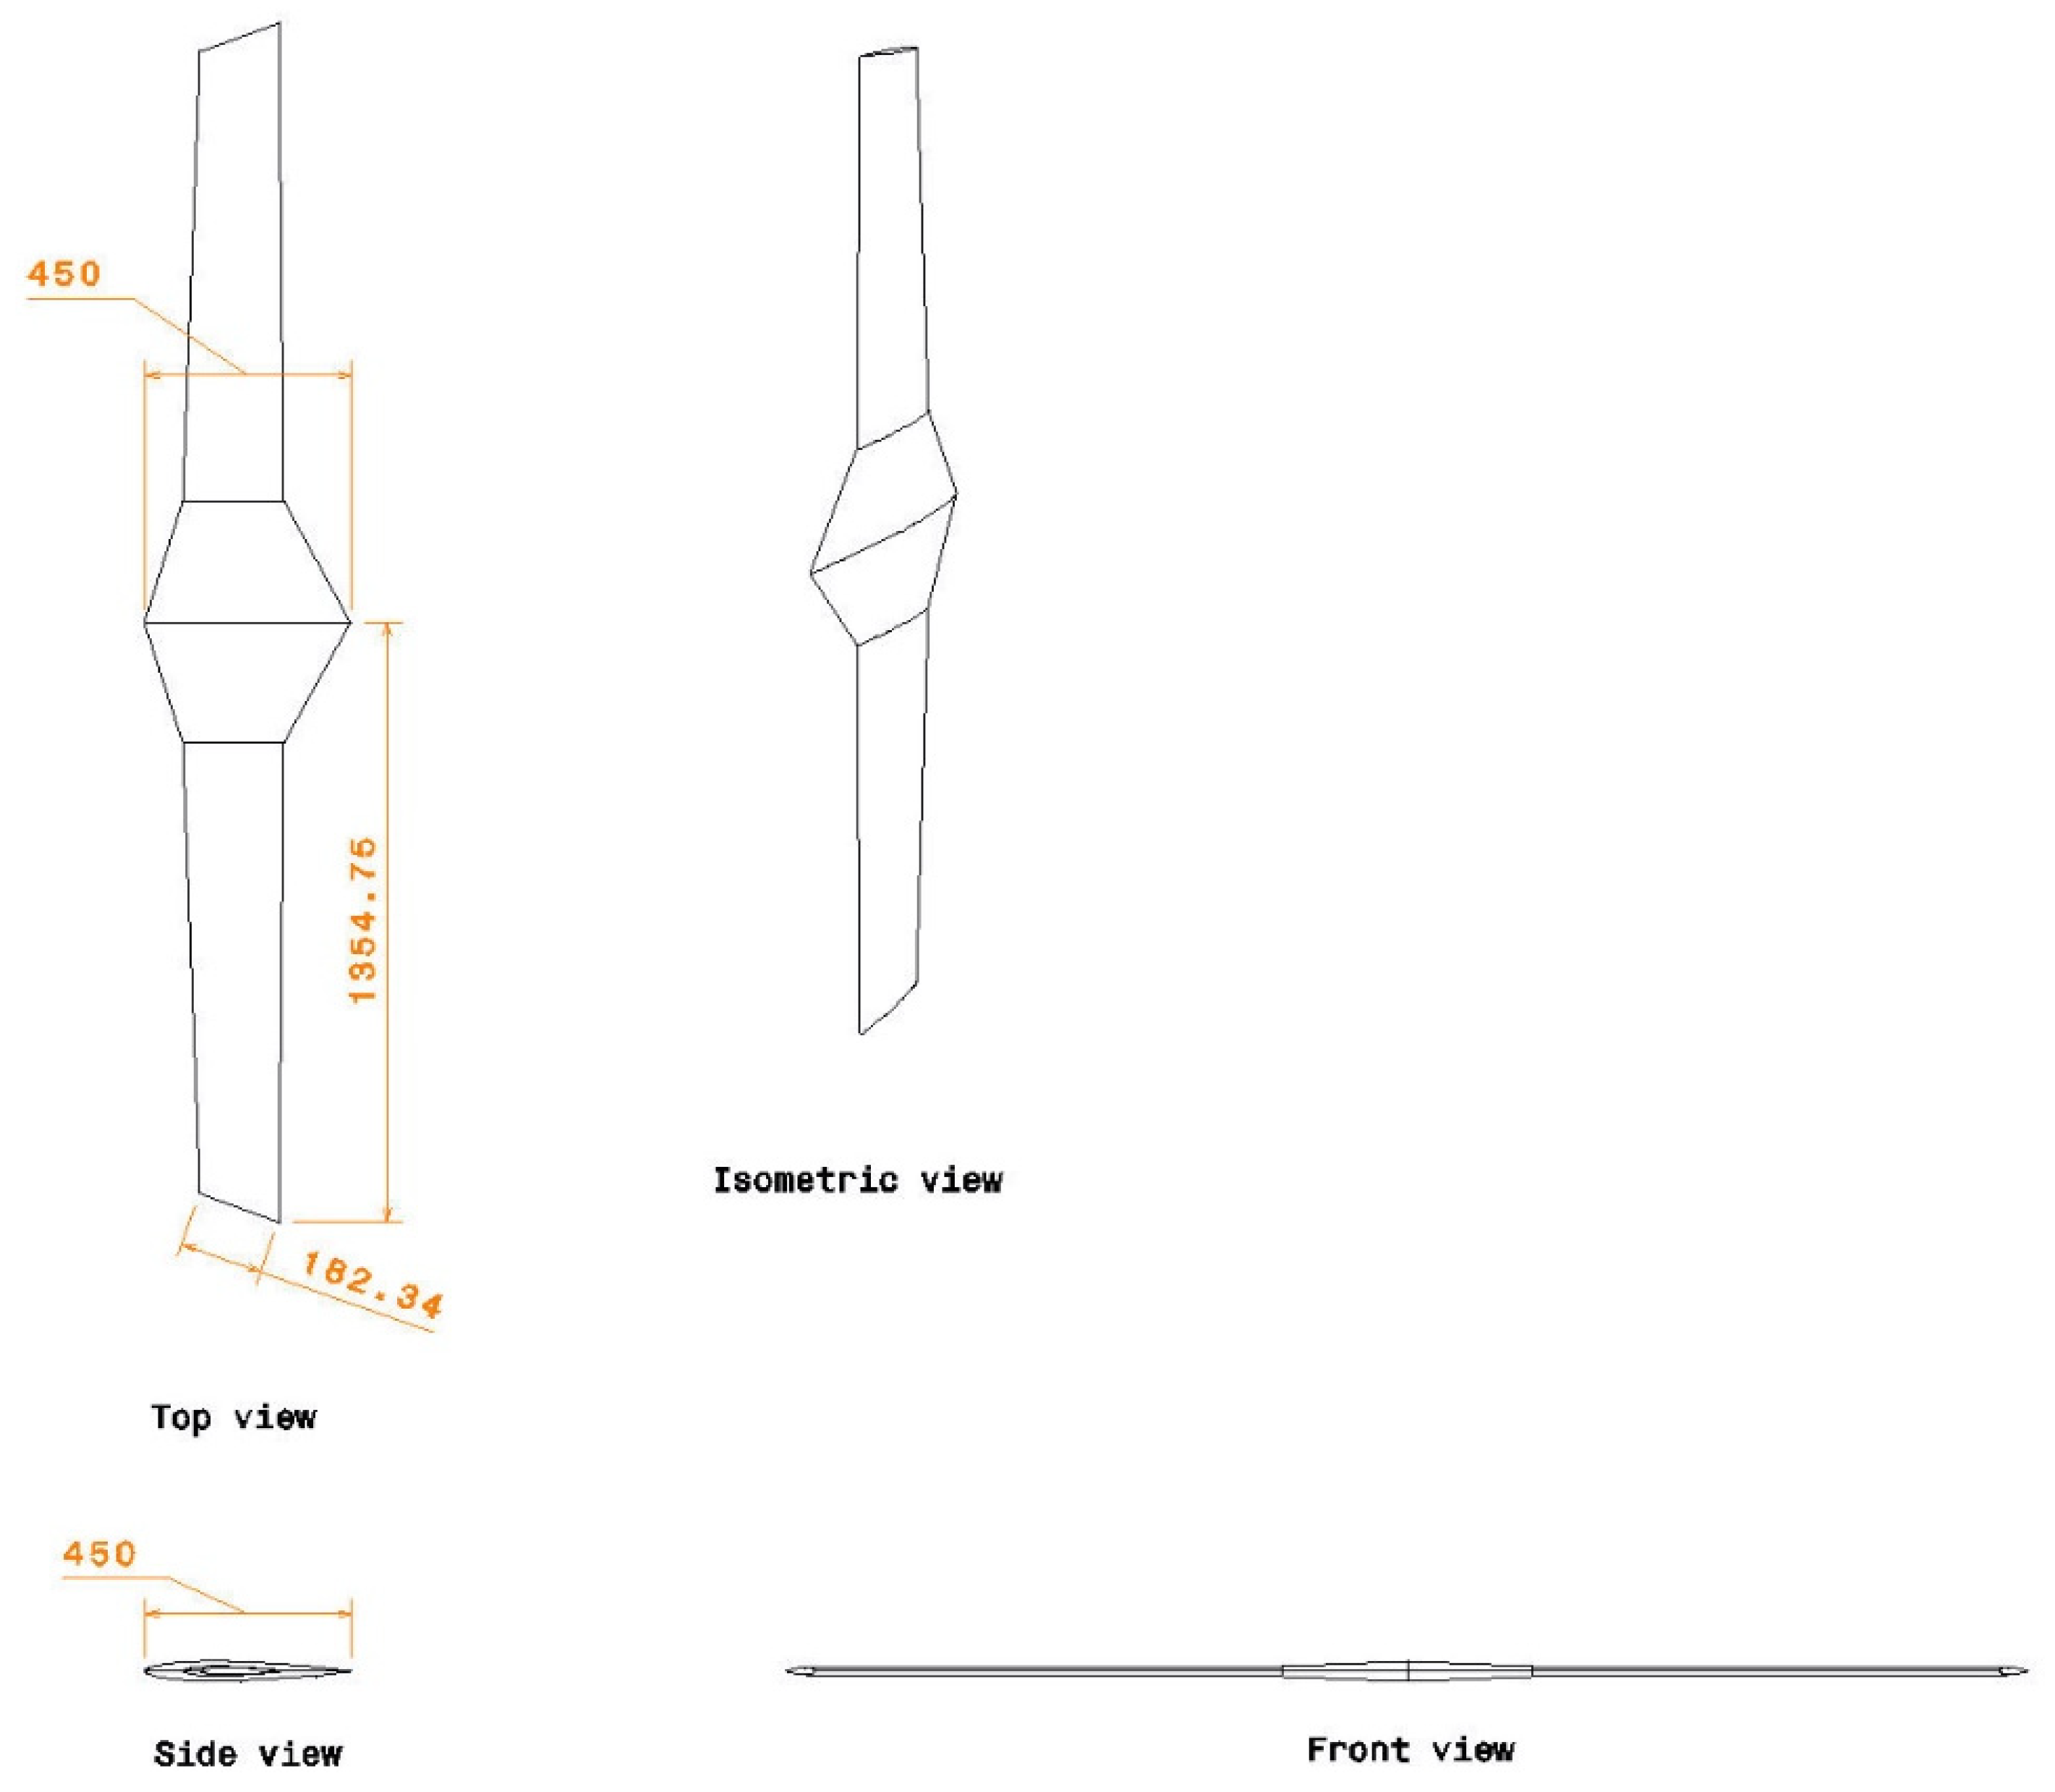
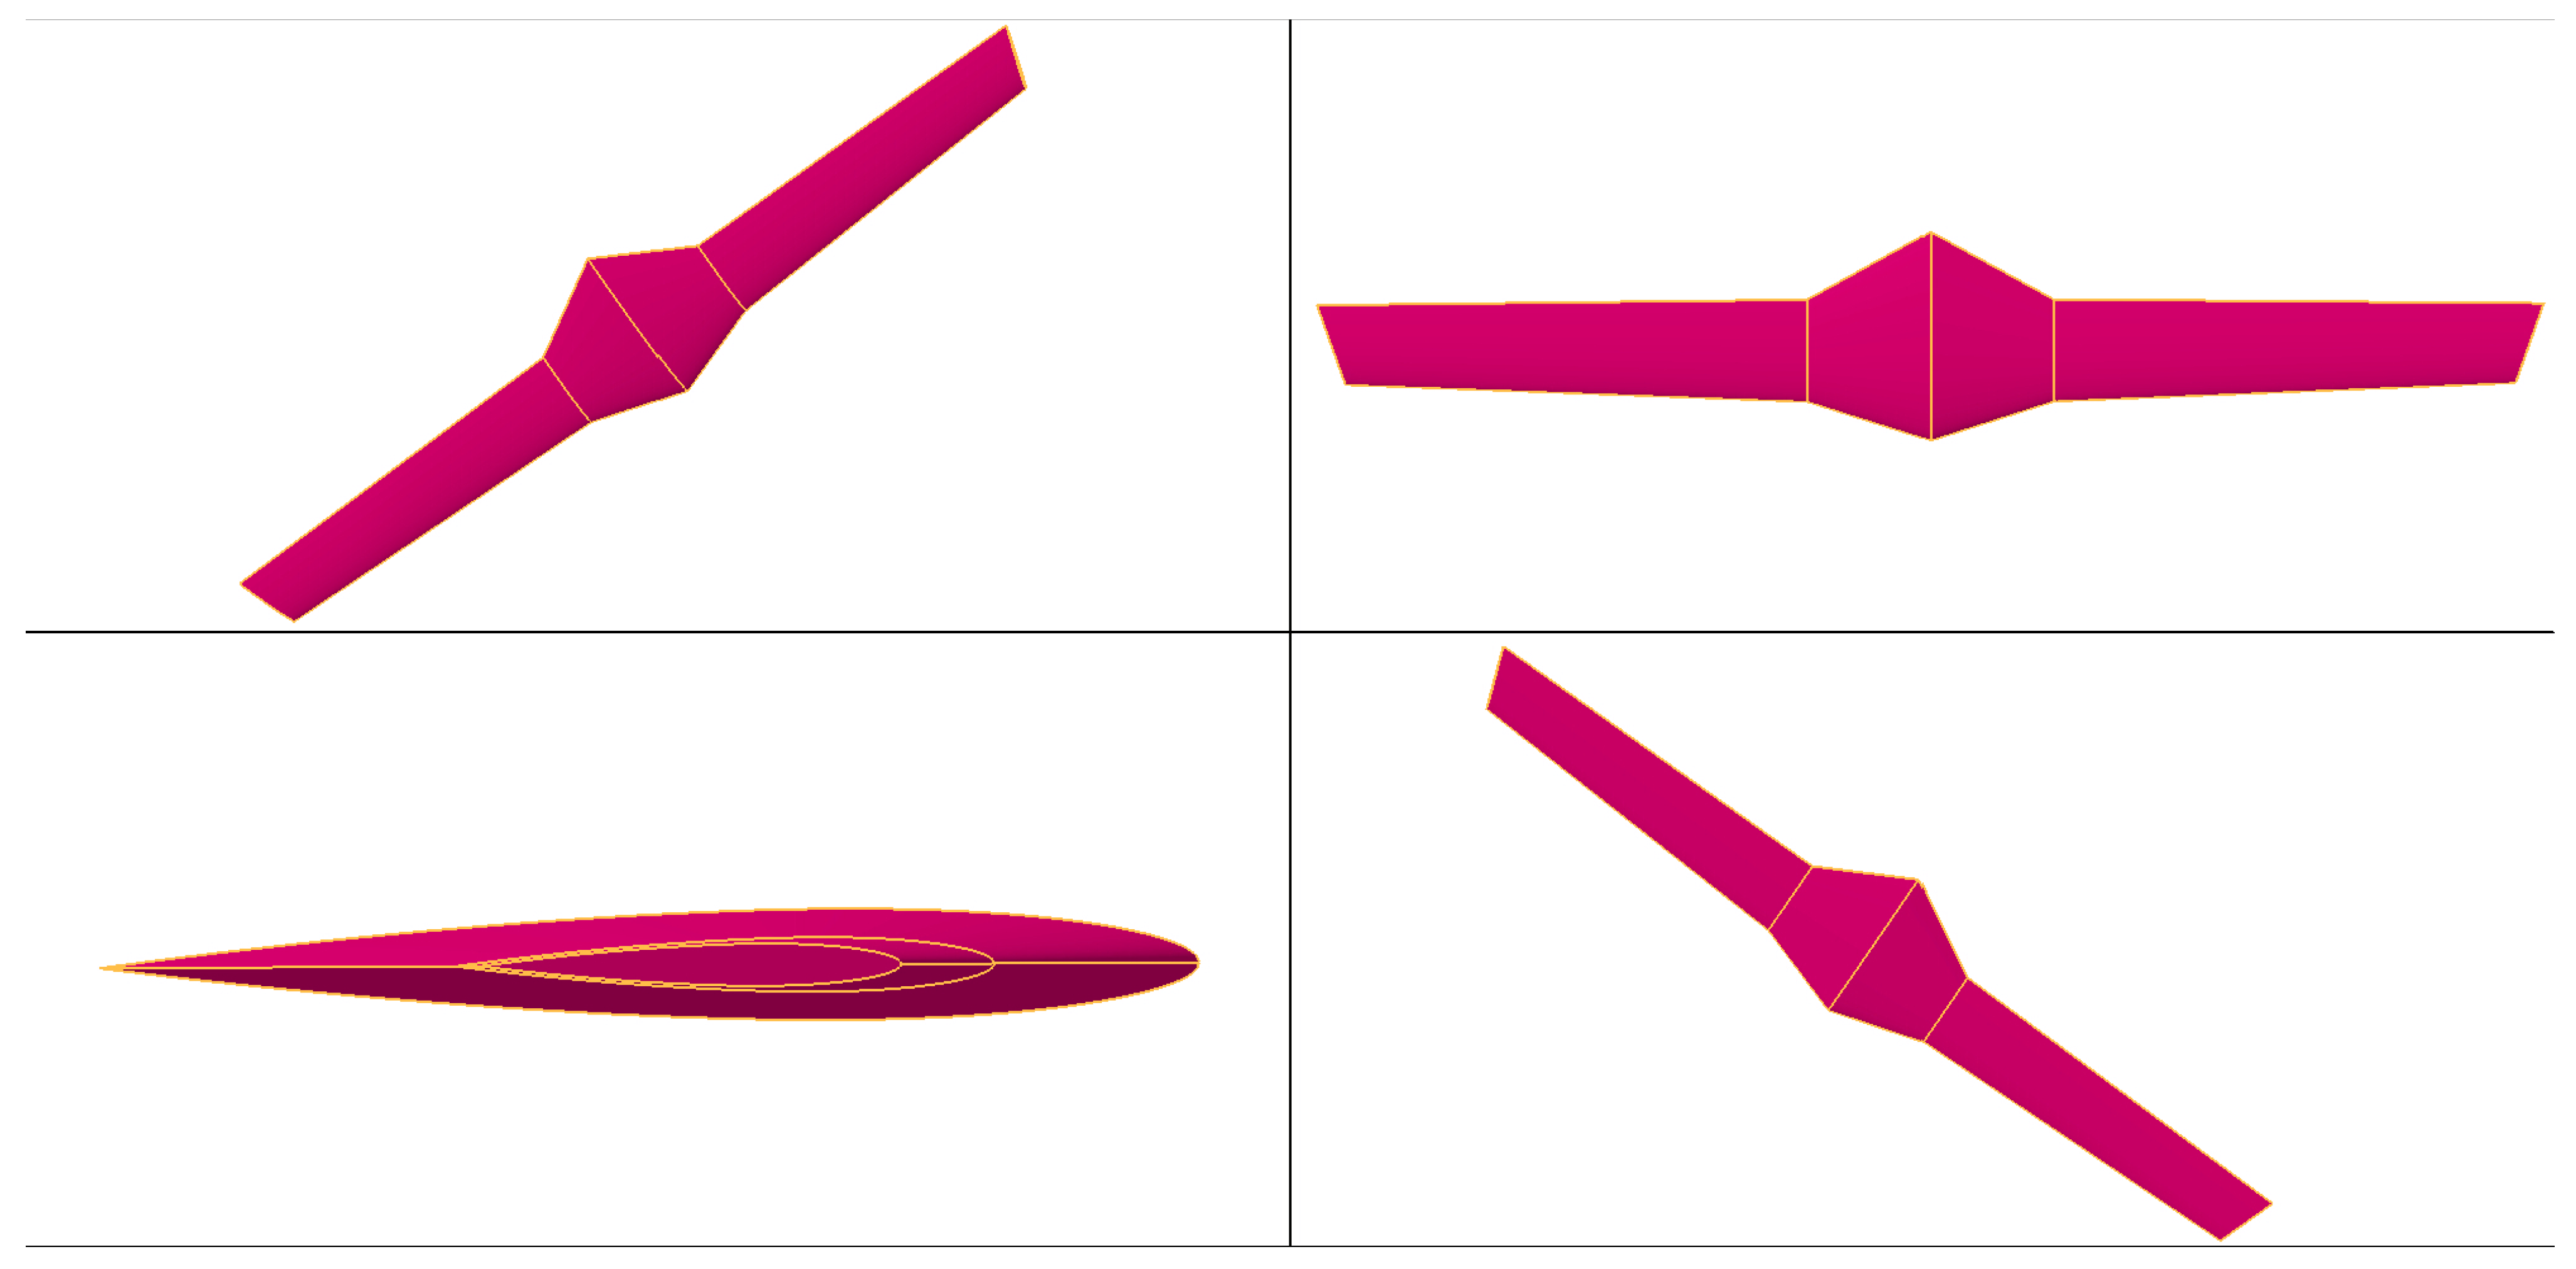
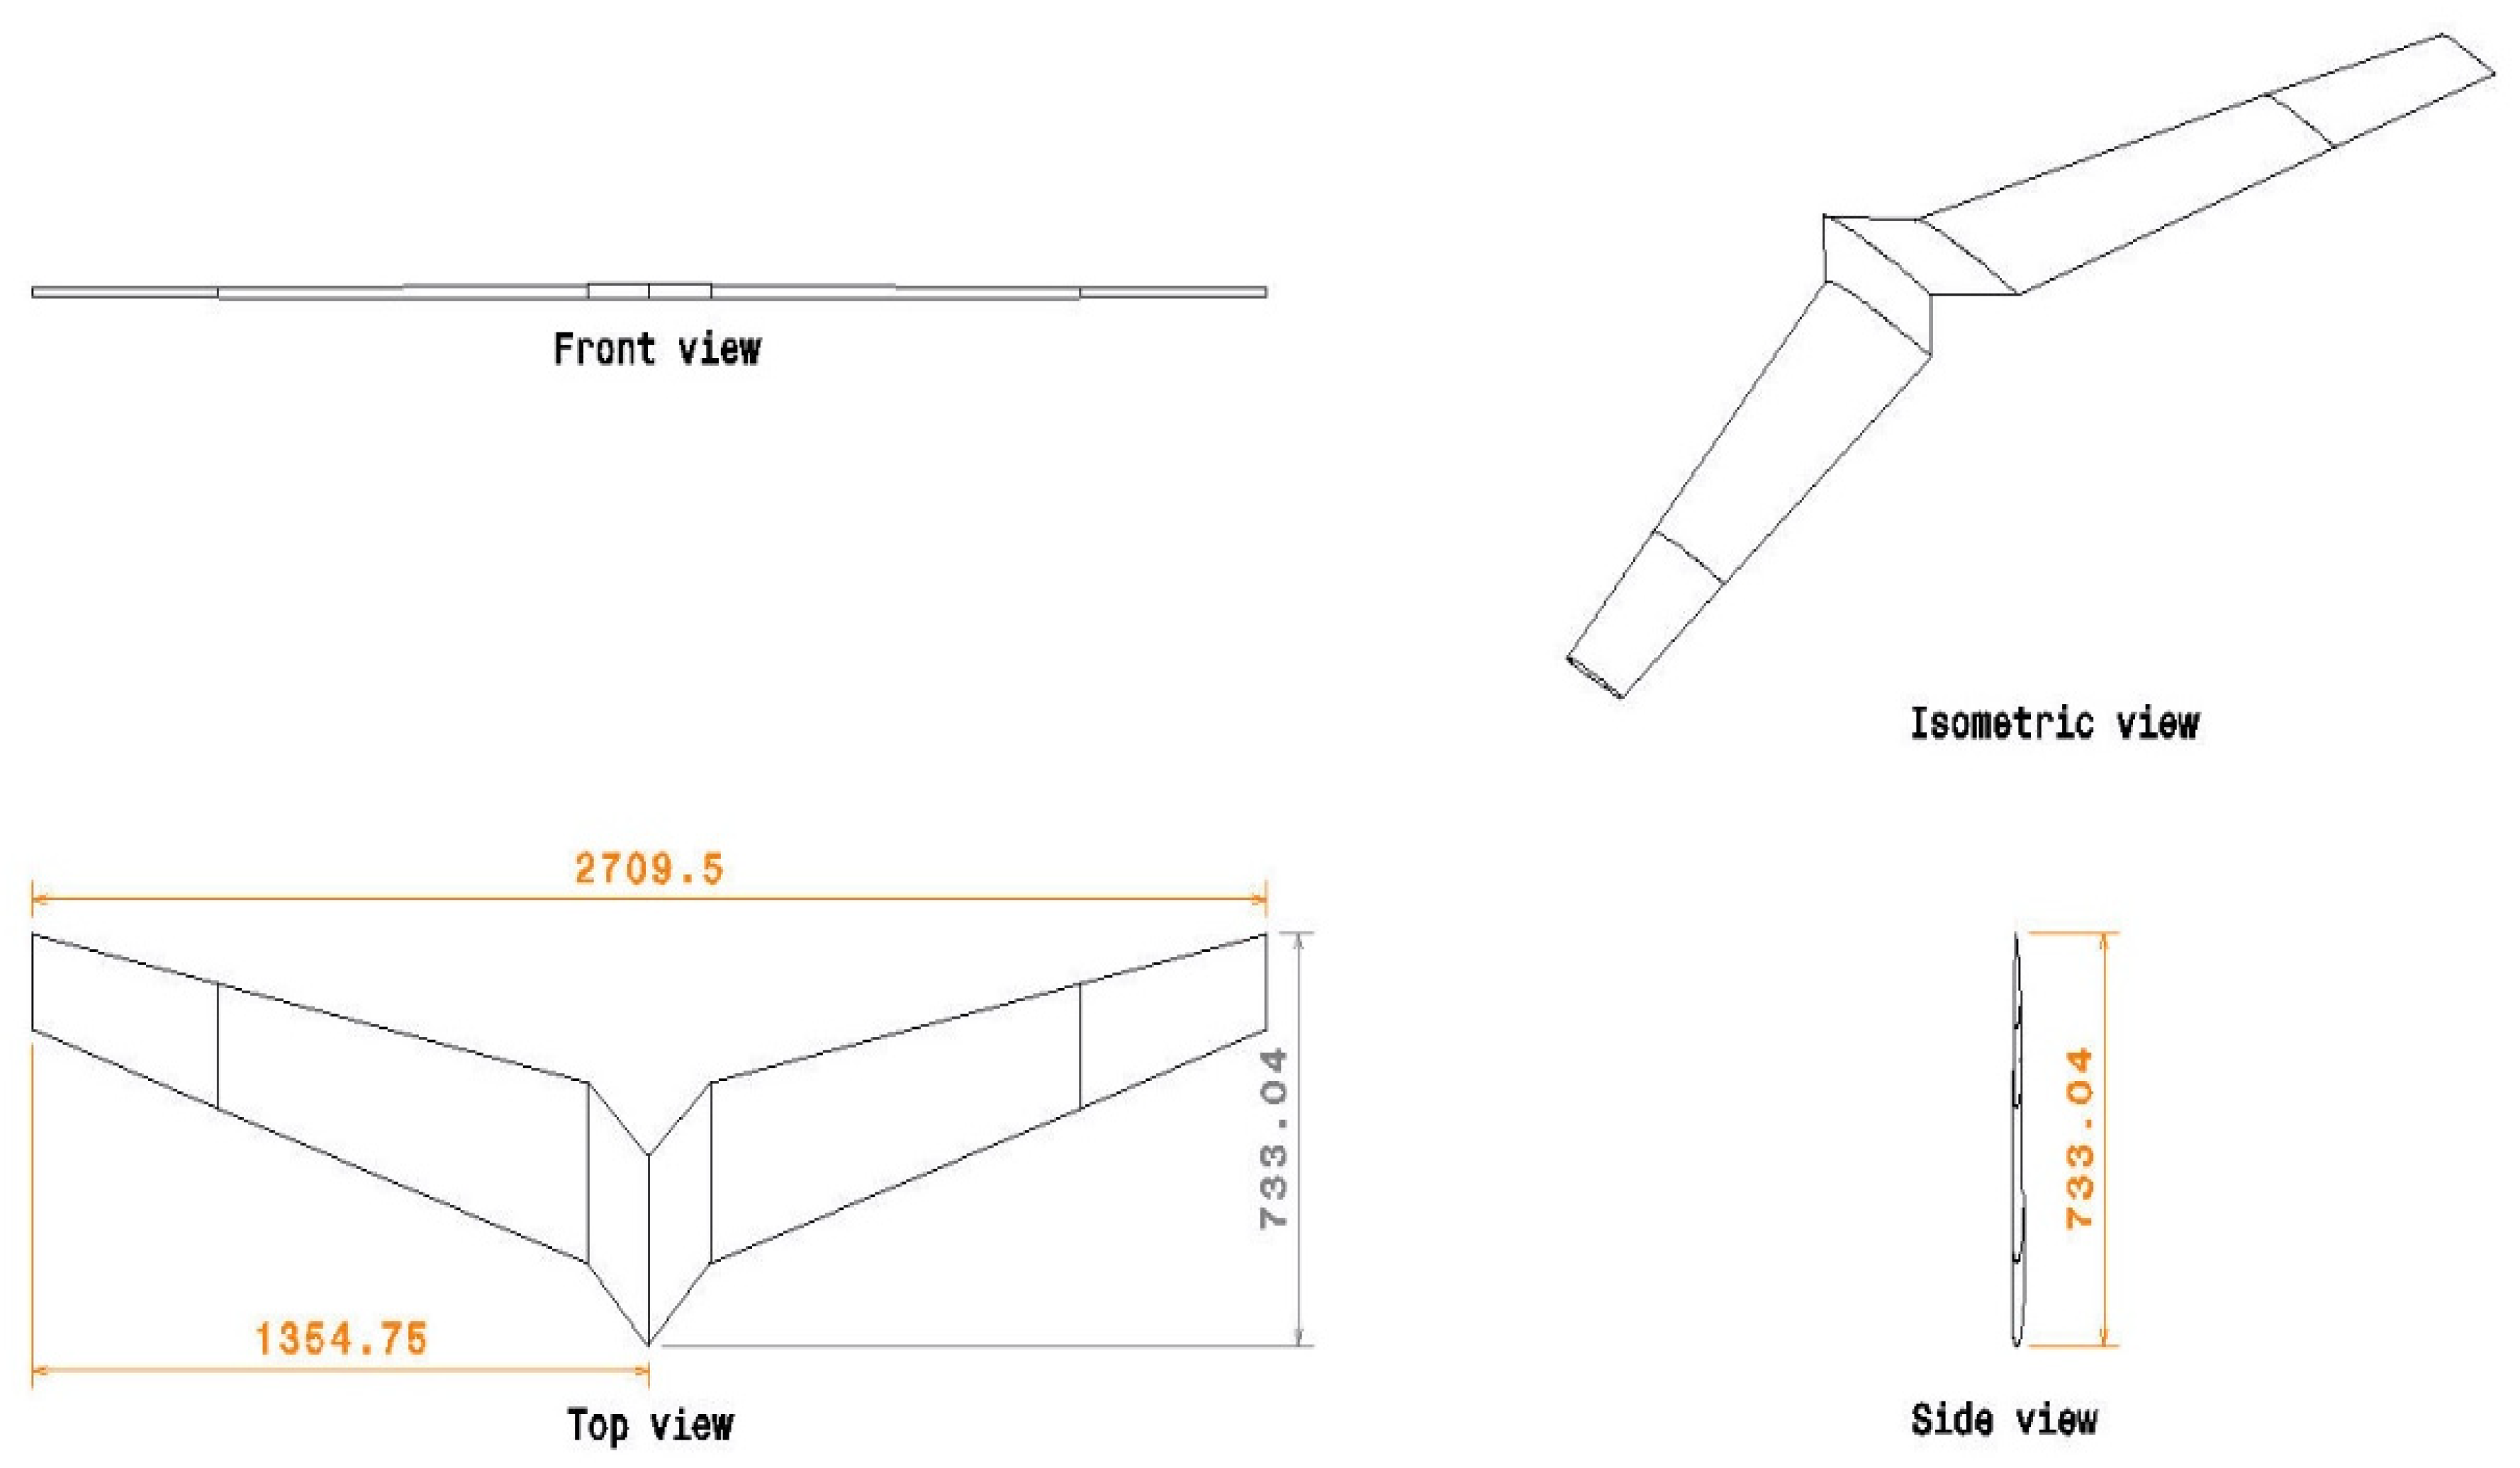
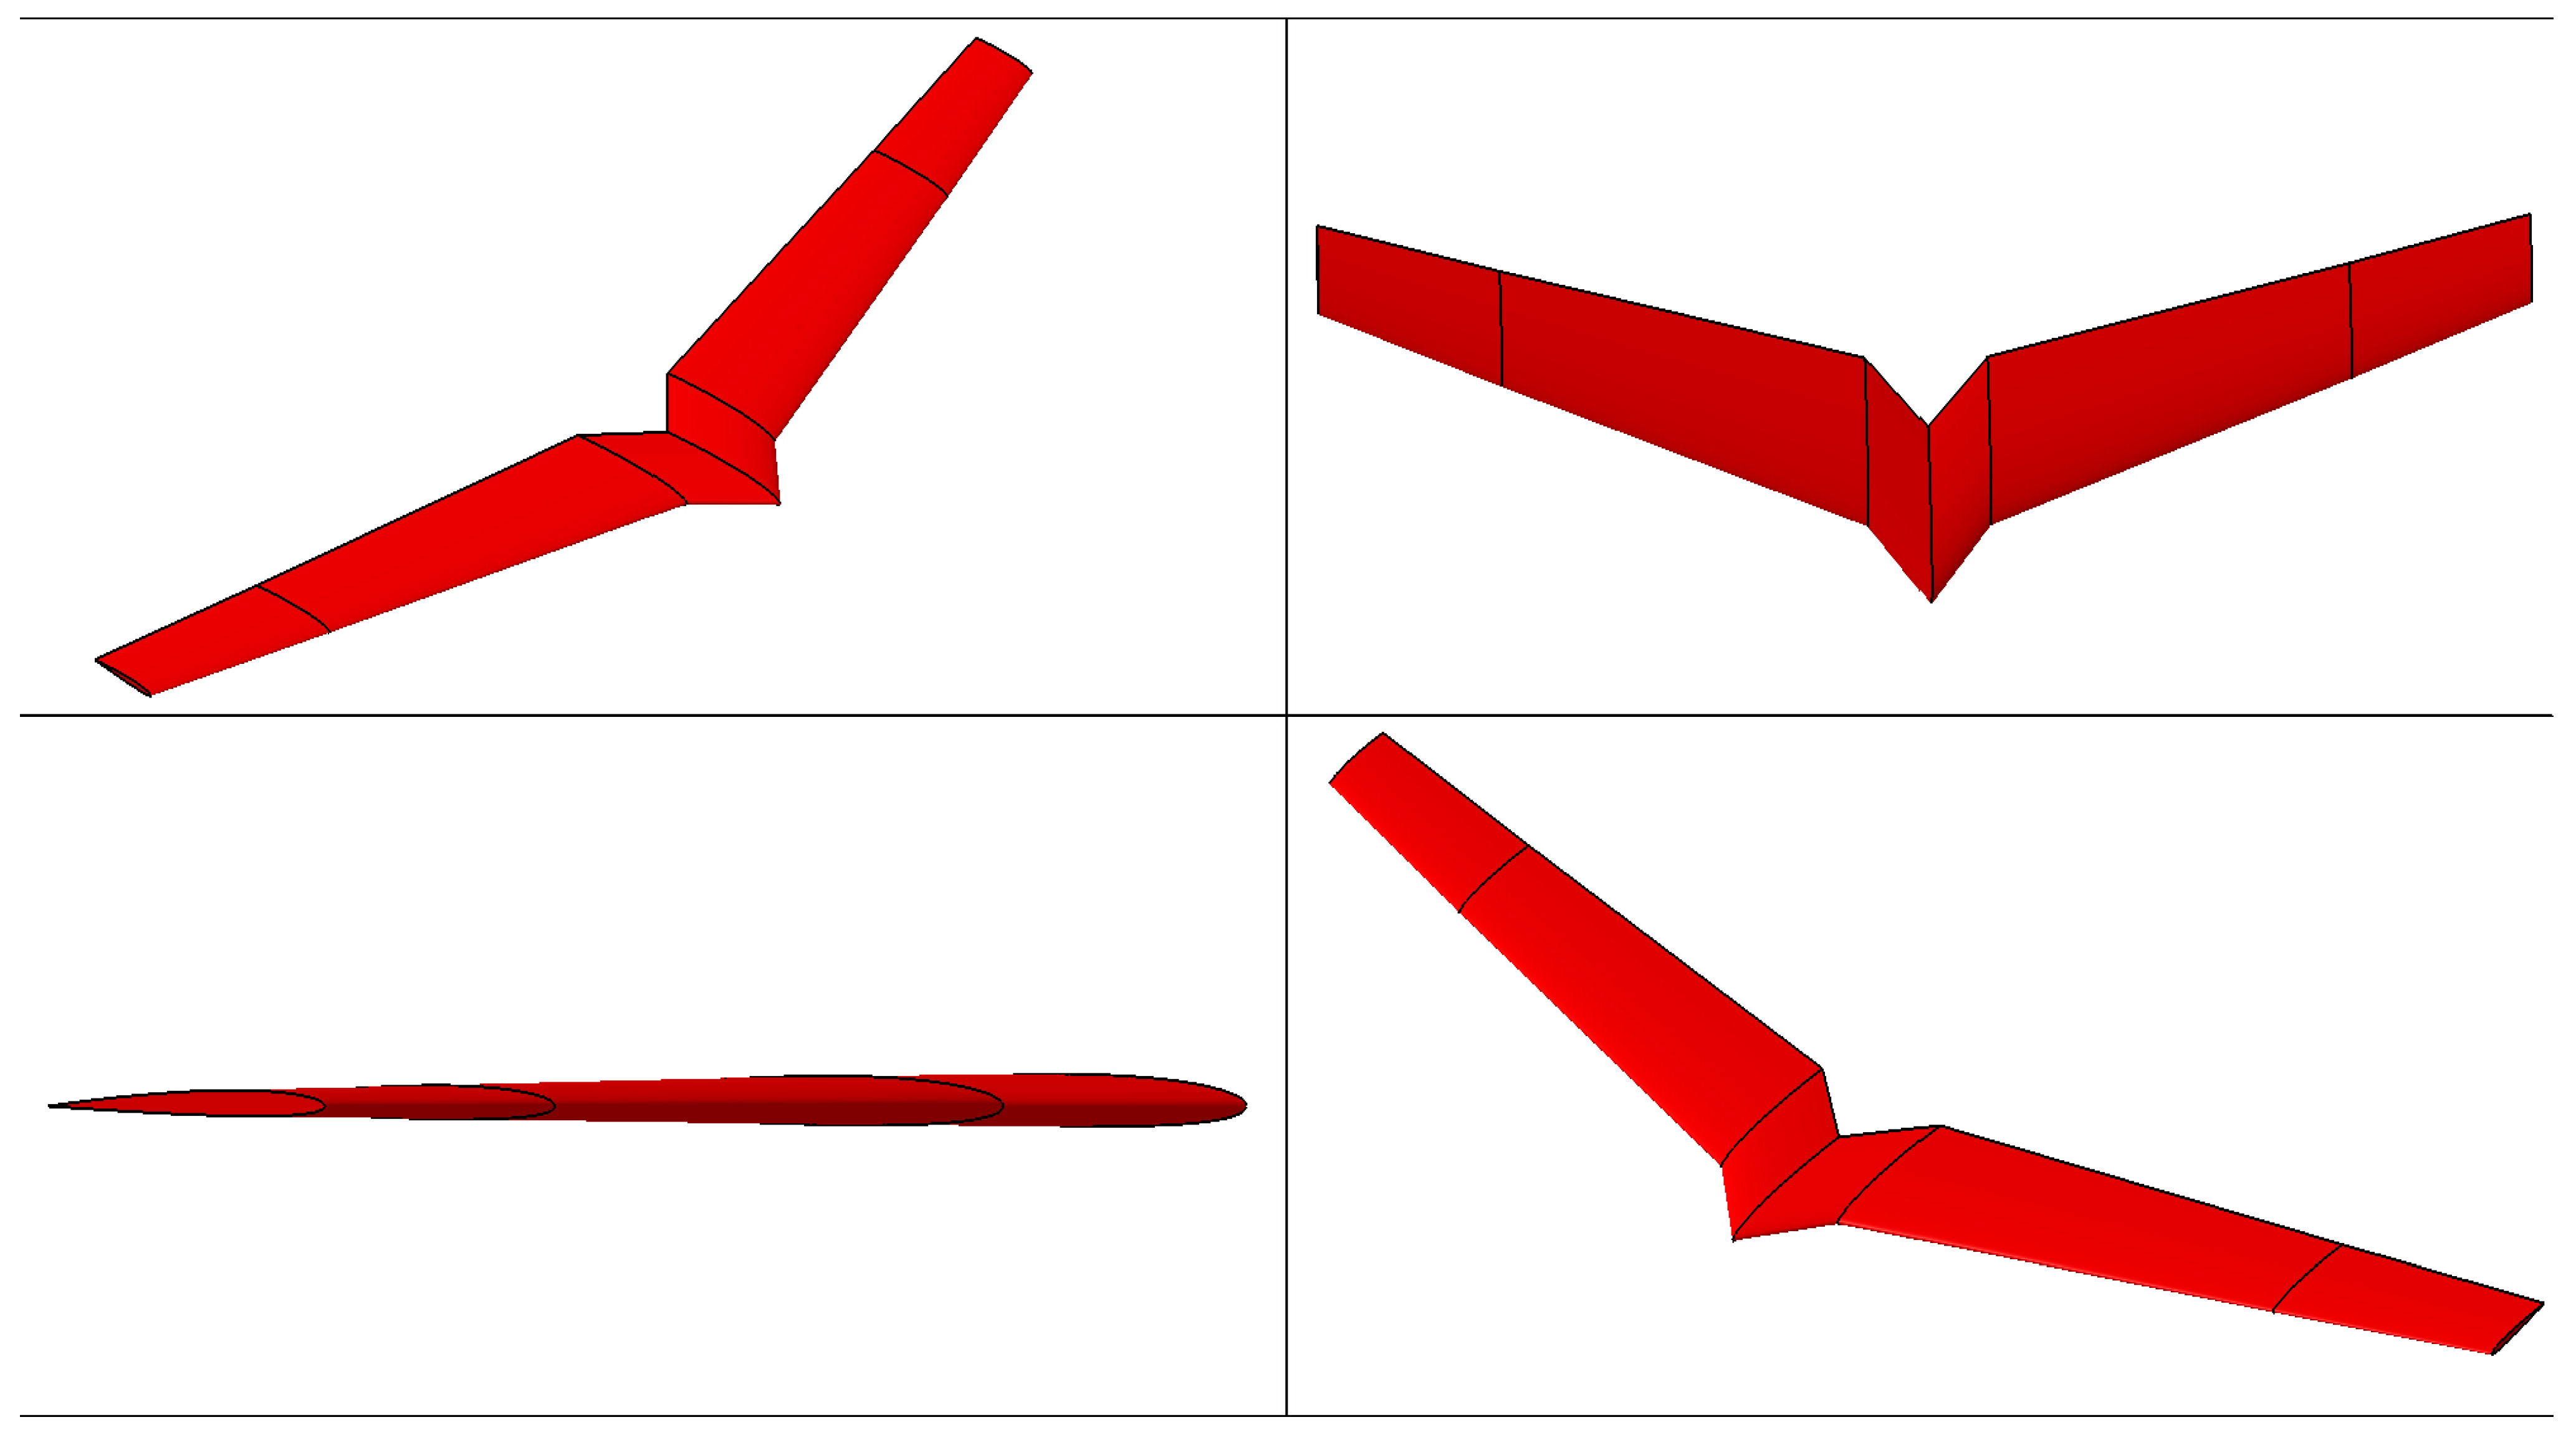
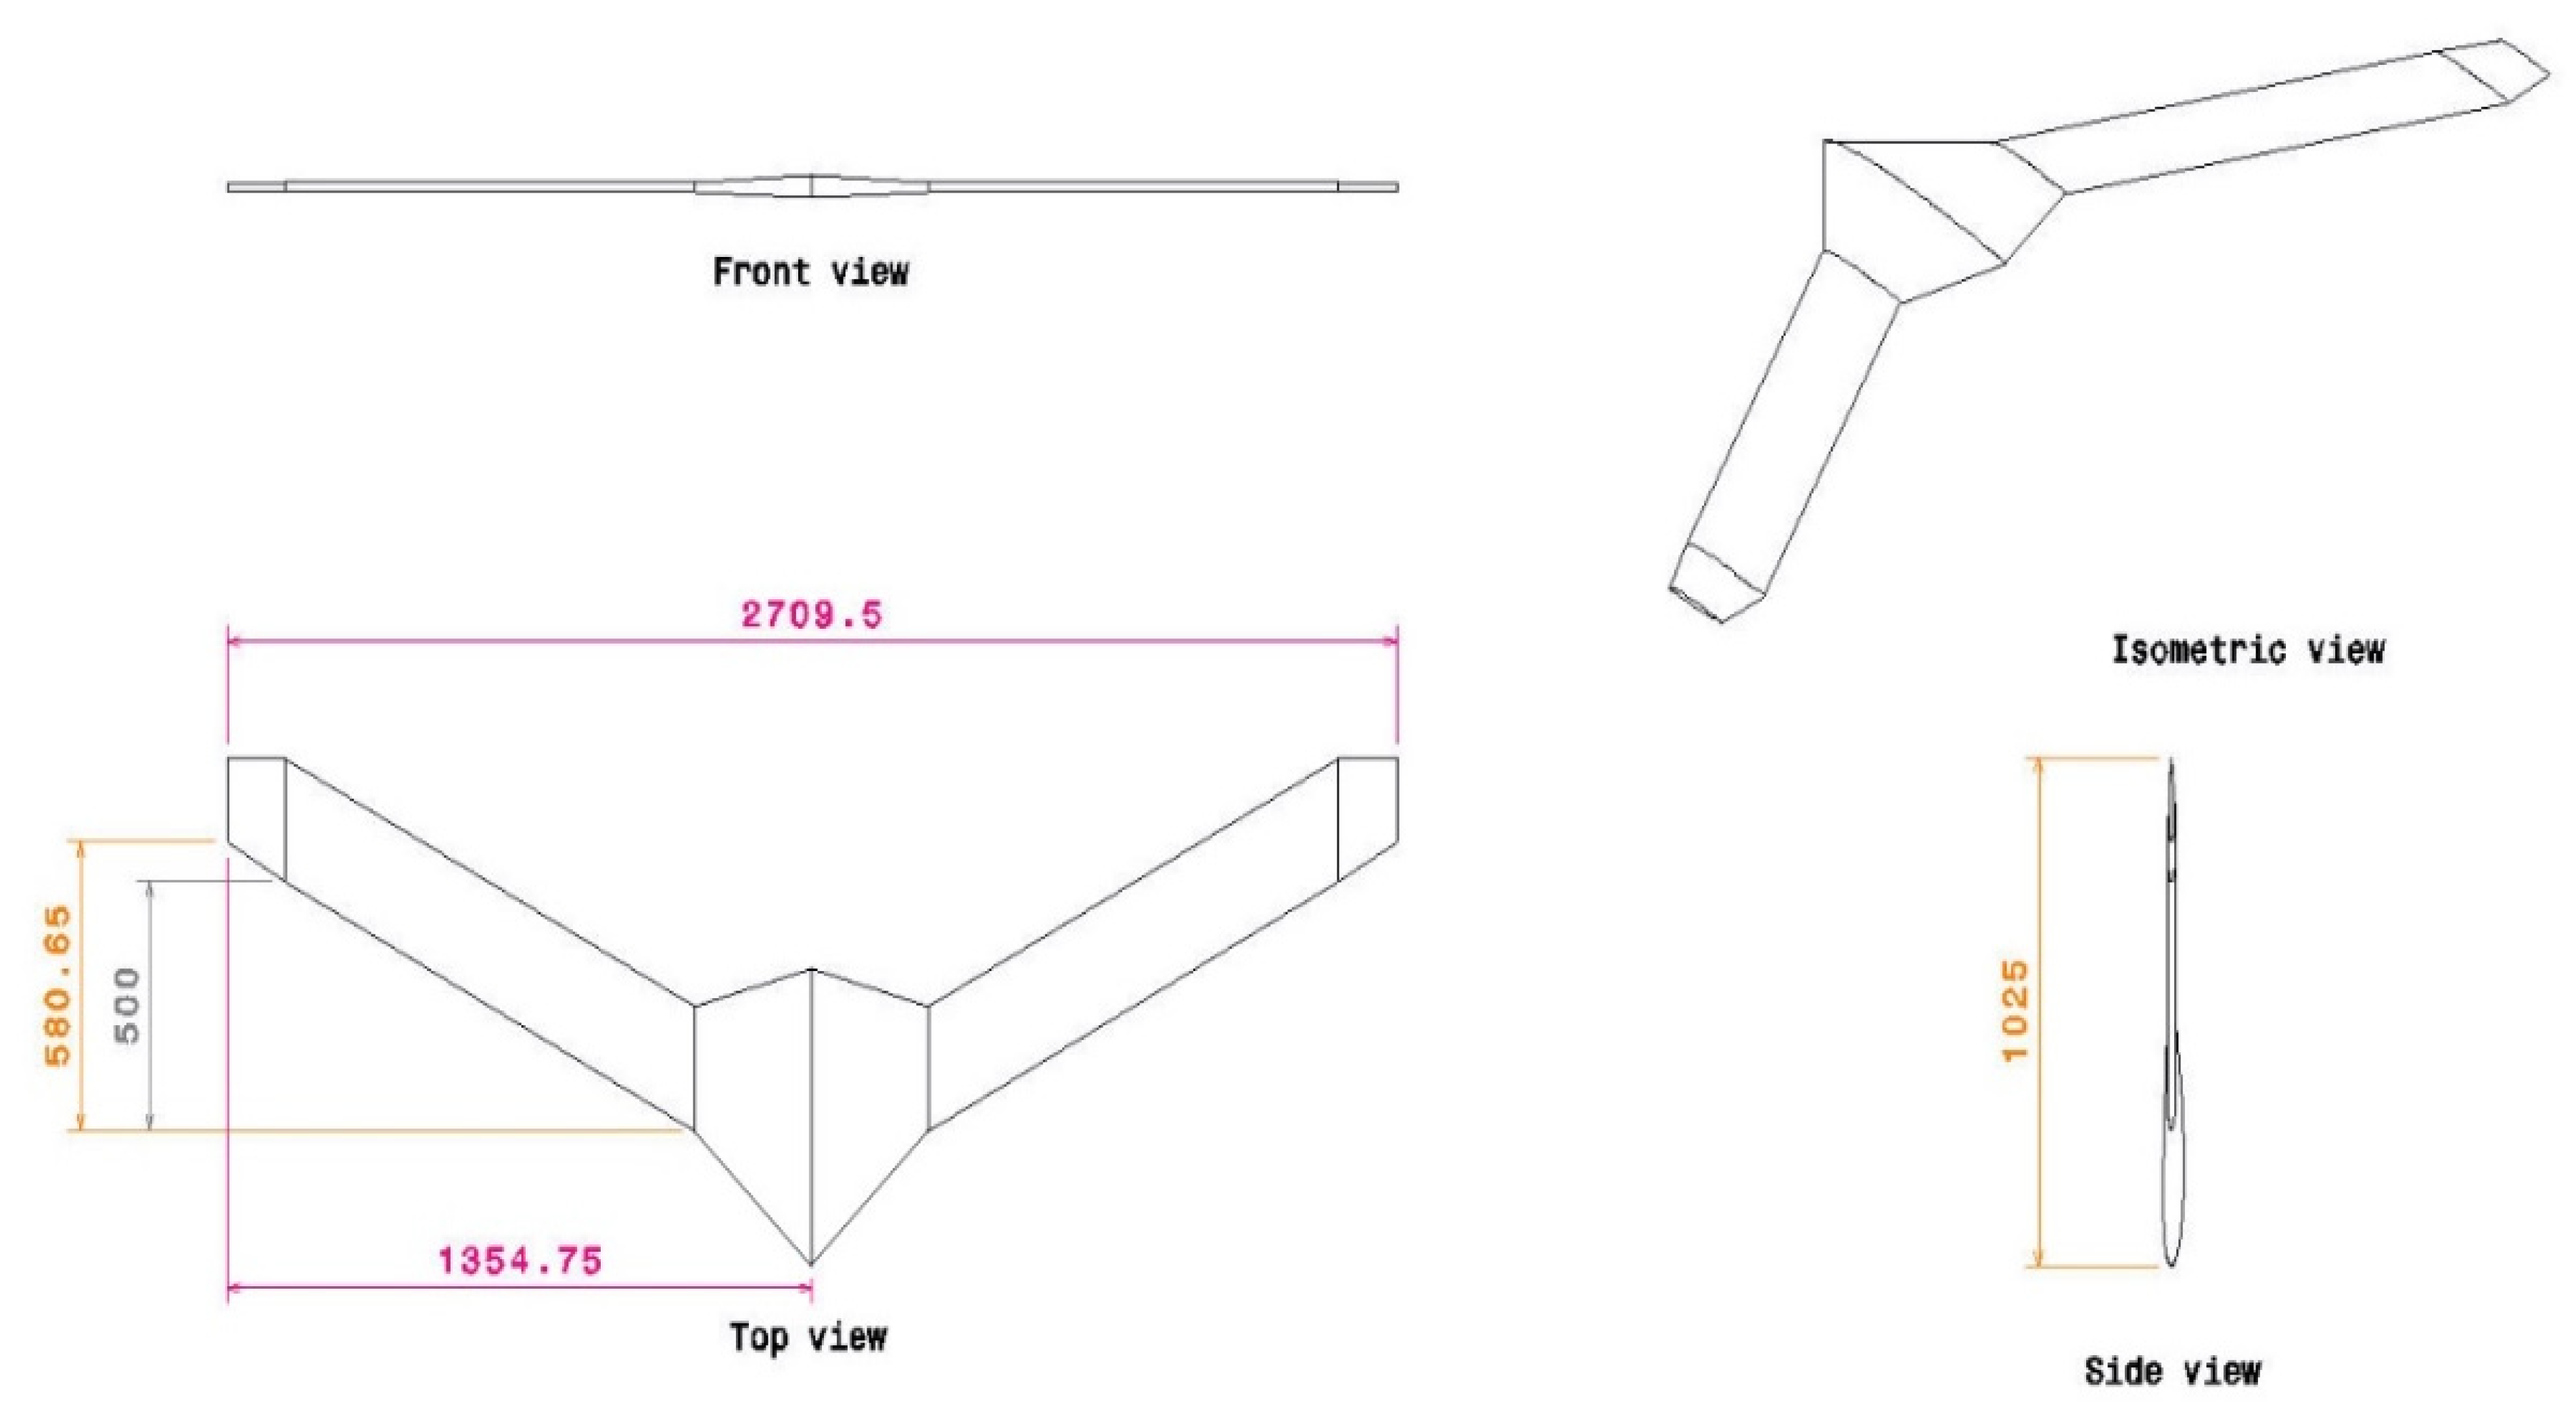
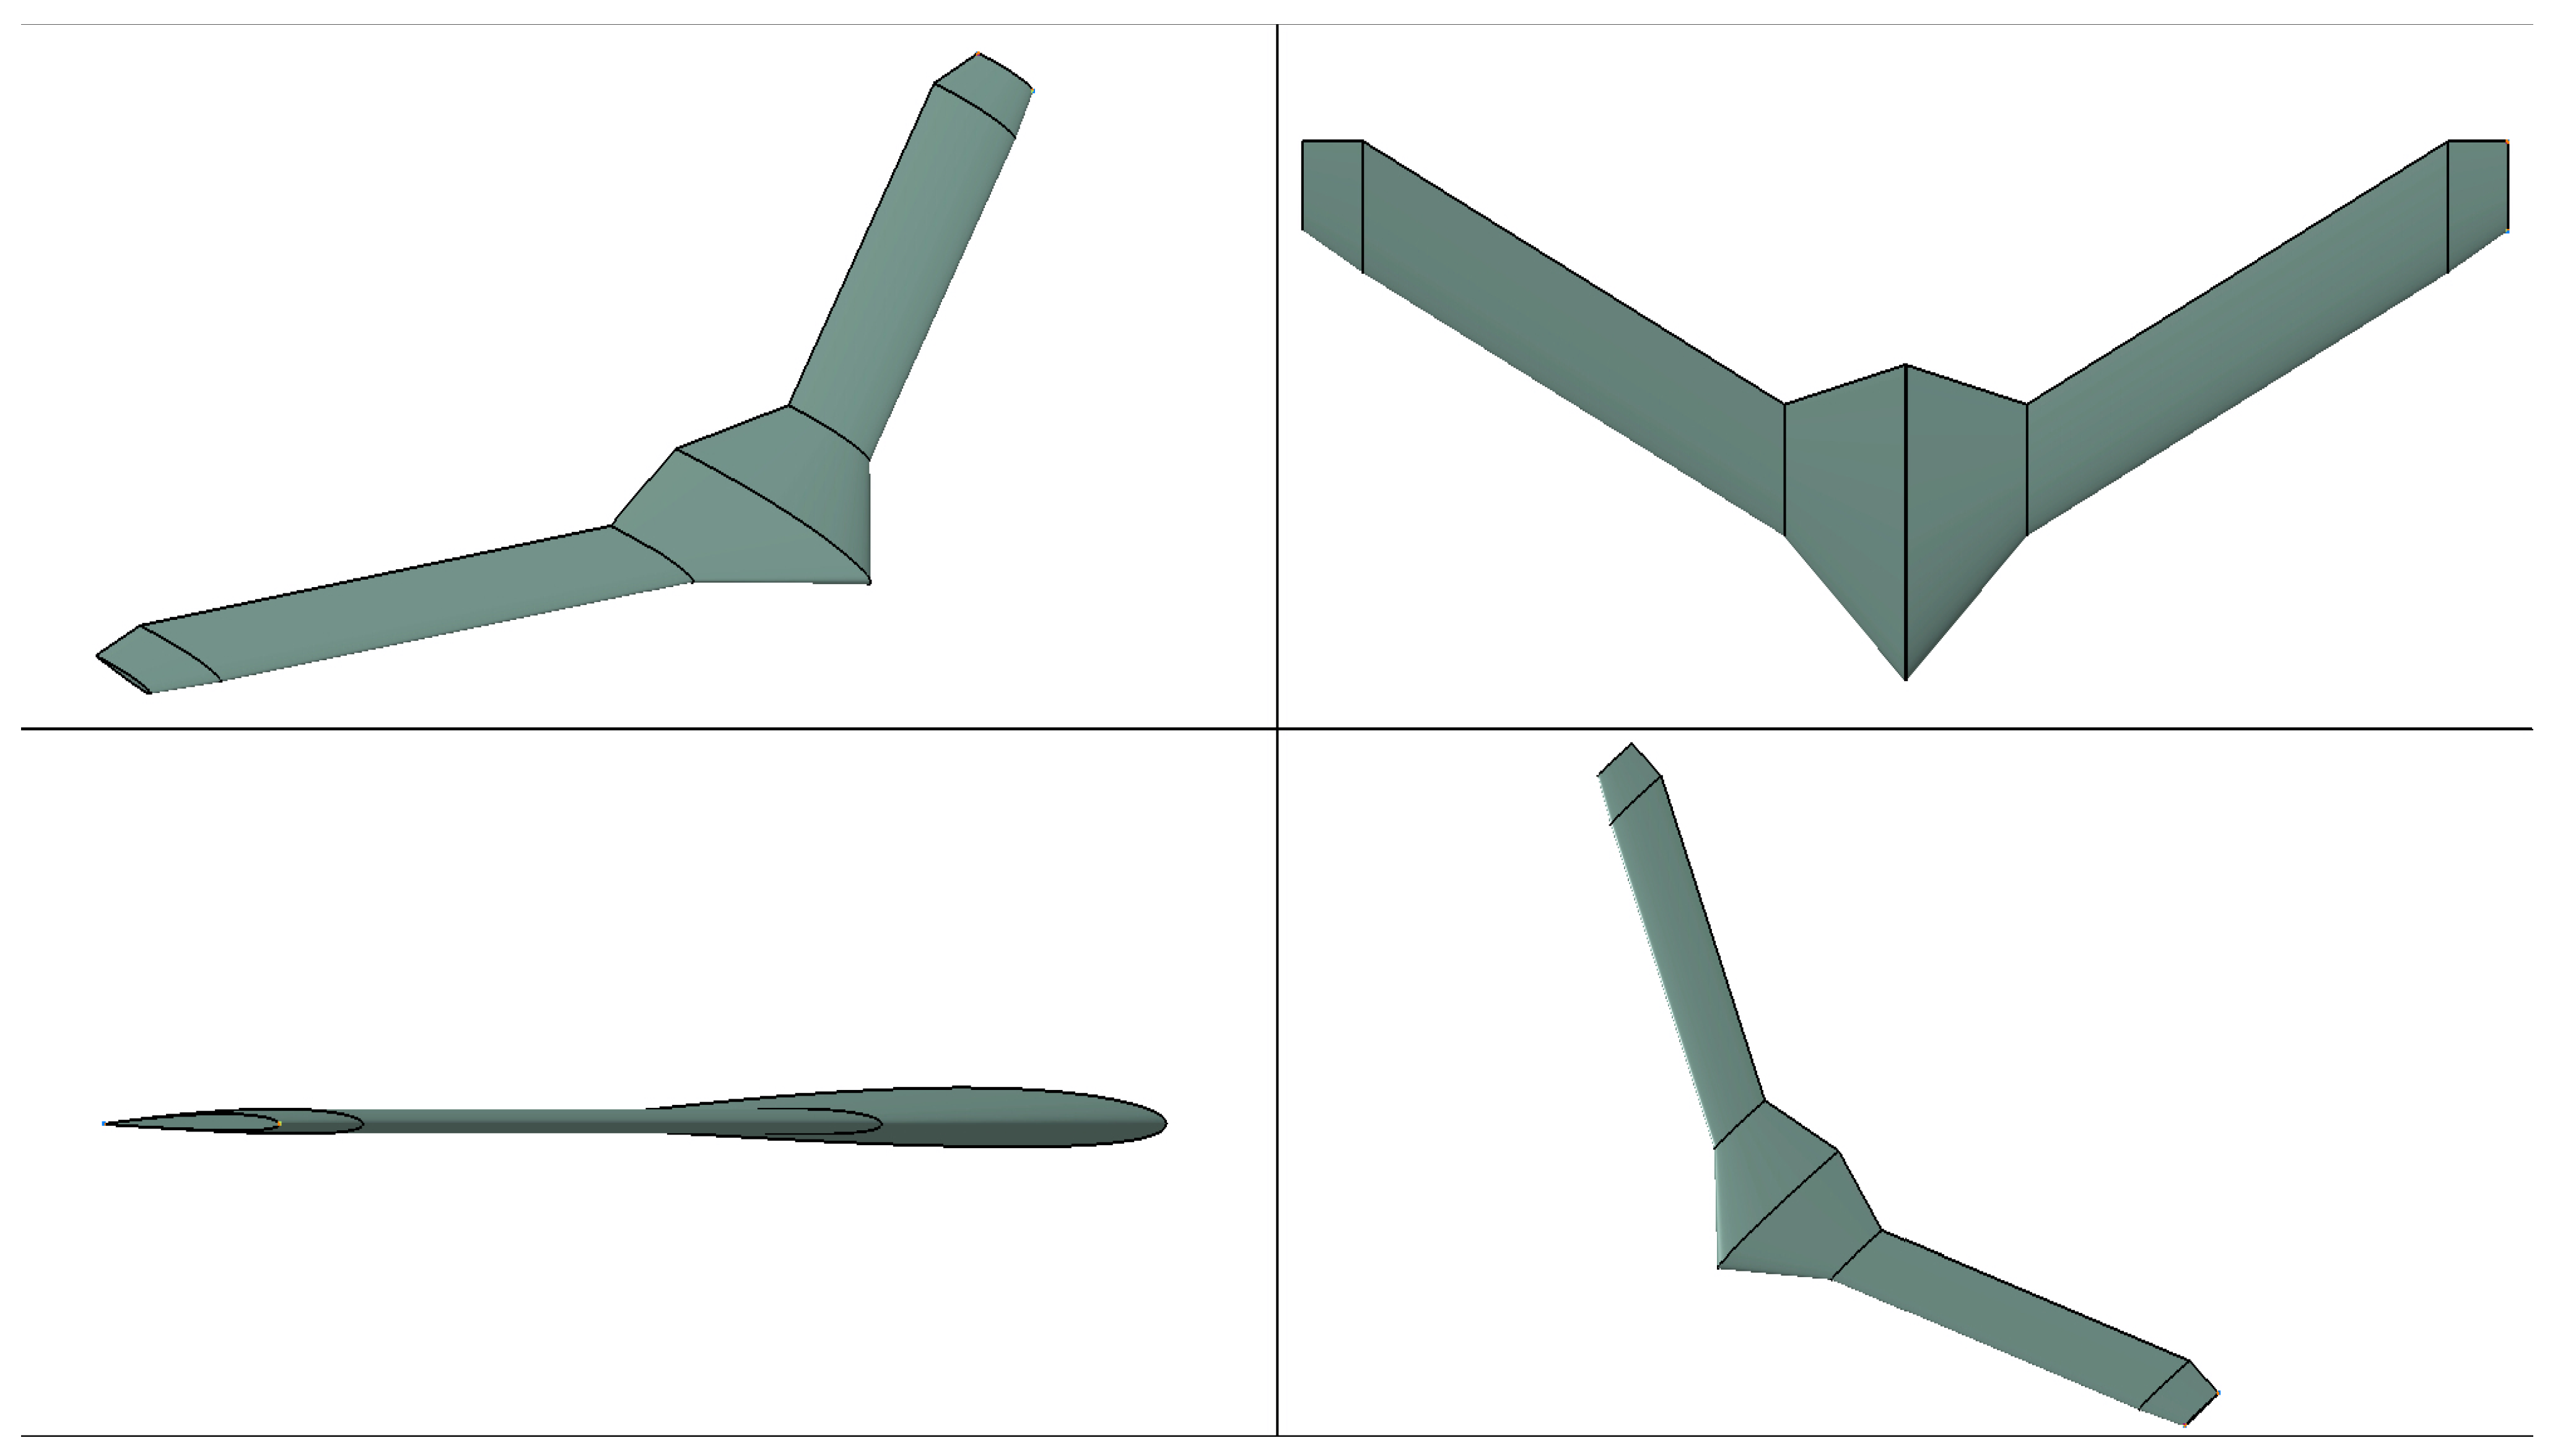
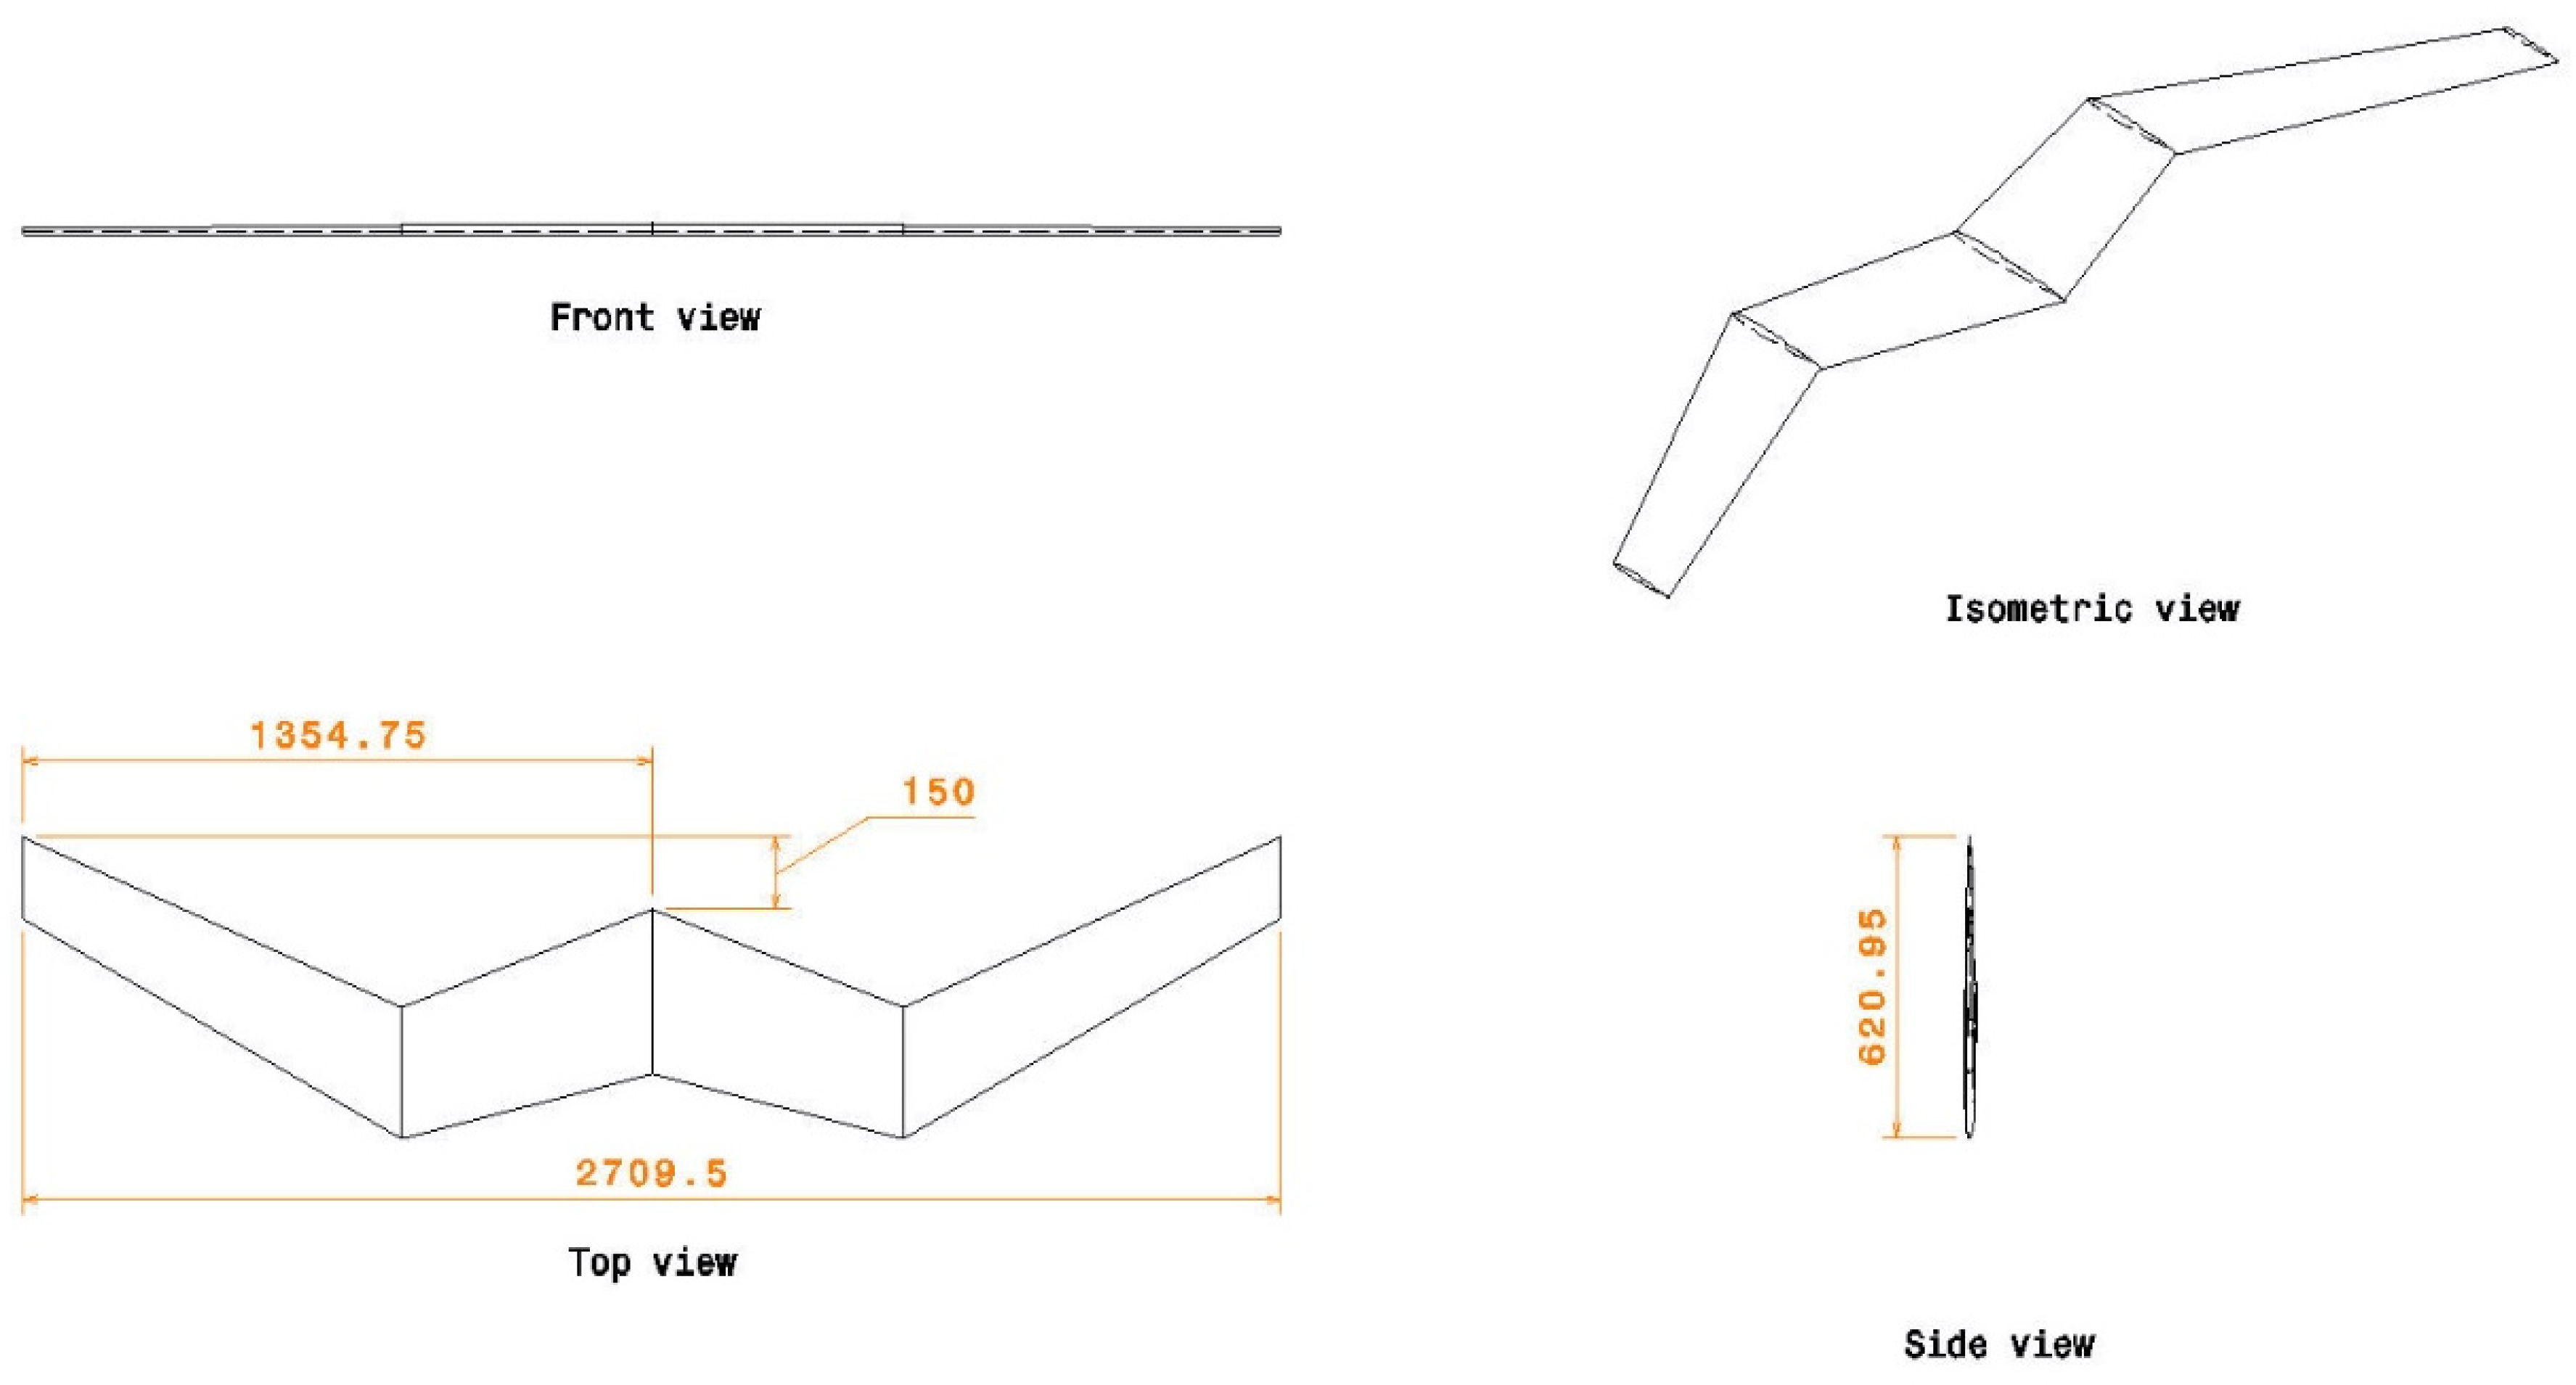
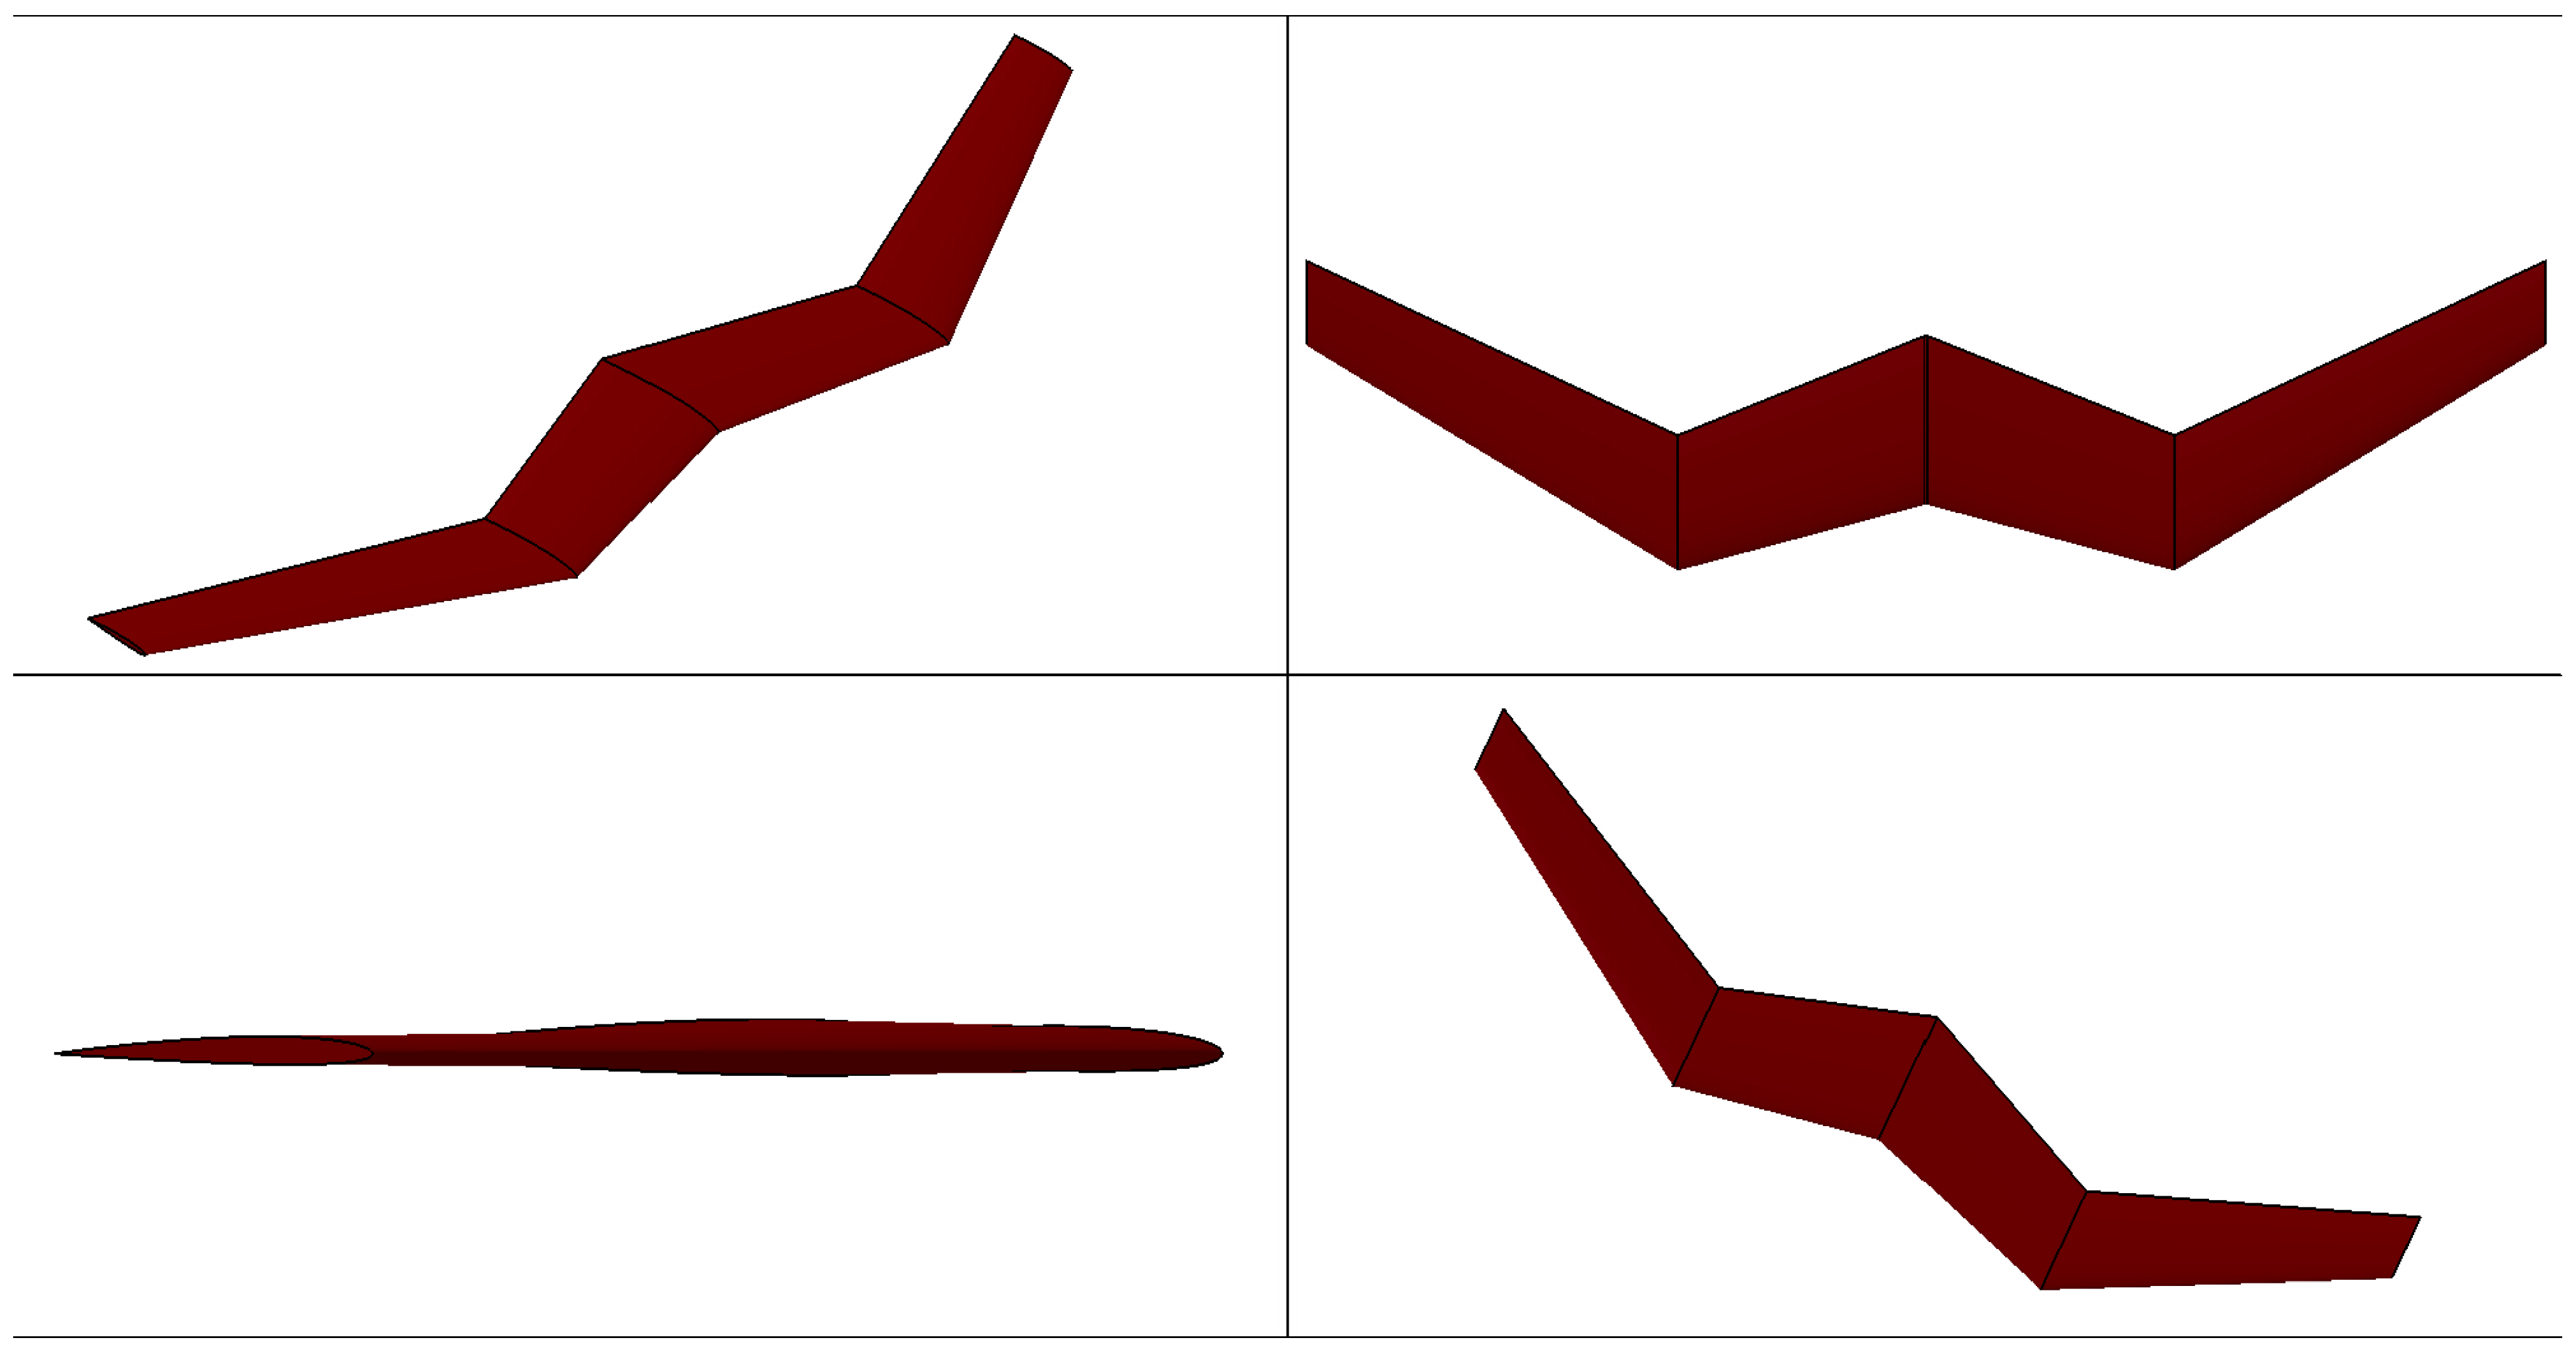
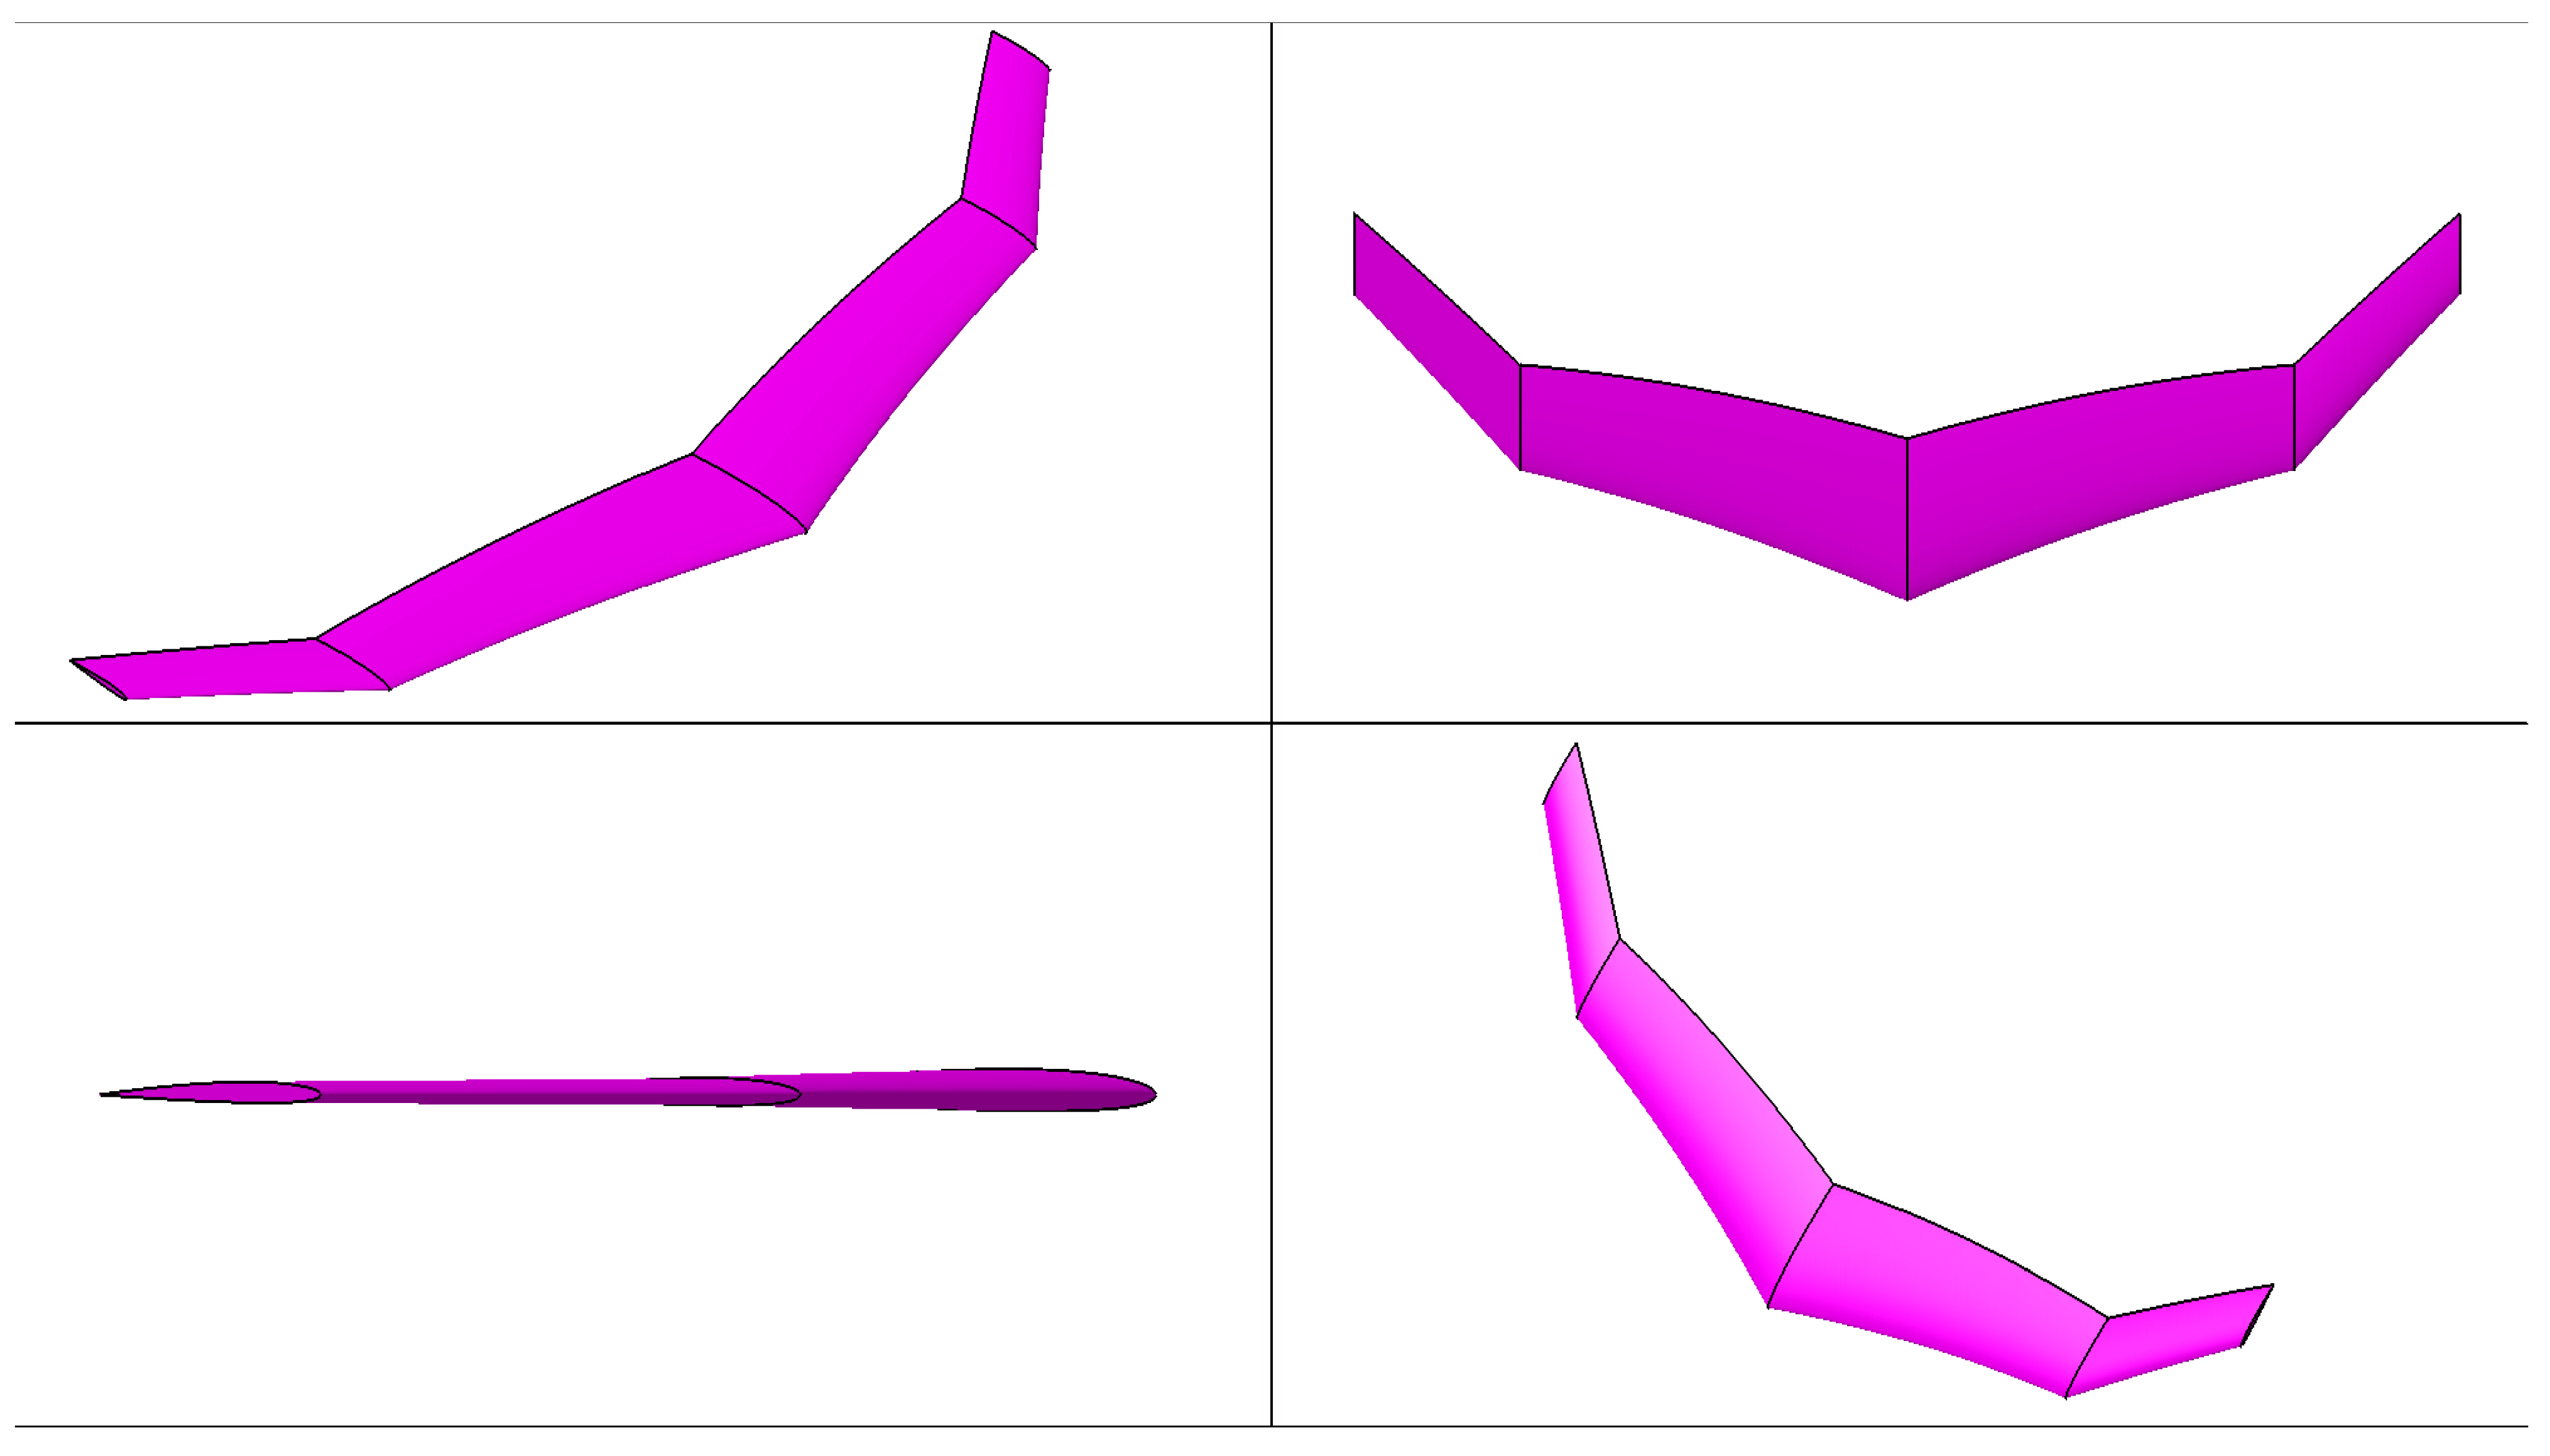
Apart from the created models, three Nature Inspired Proposals (NIP) are revealed, where flying wing UAV-NIP-1 and flying wing UAV NIP-3 are made from Falcon bird configuration and flying wing UAV-NIP-2 is developed from Dragonfly configuration. The images of the models are shown in Figure 16, Figure 17, Figure 18, Figure 19, Figure 20 and Figure 21.
2.2. Imposed Methodology—Advanced Computational Simulations
2.2.1. Computational Model and Solver Description
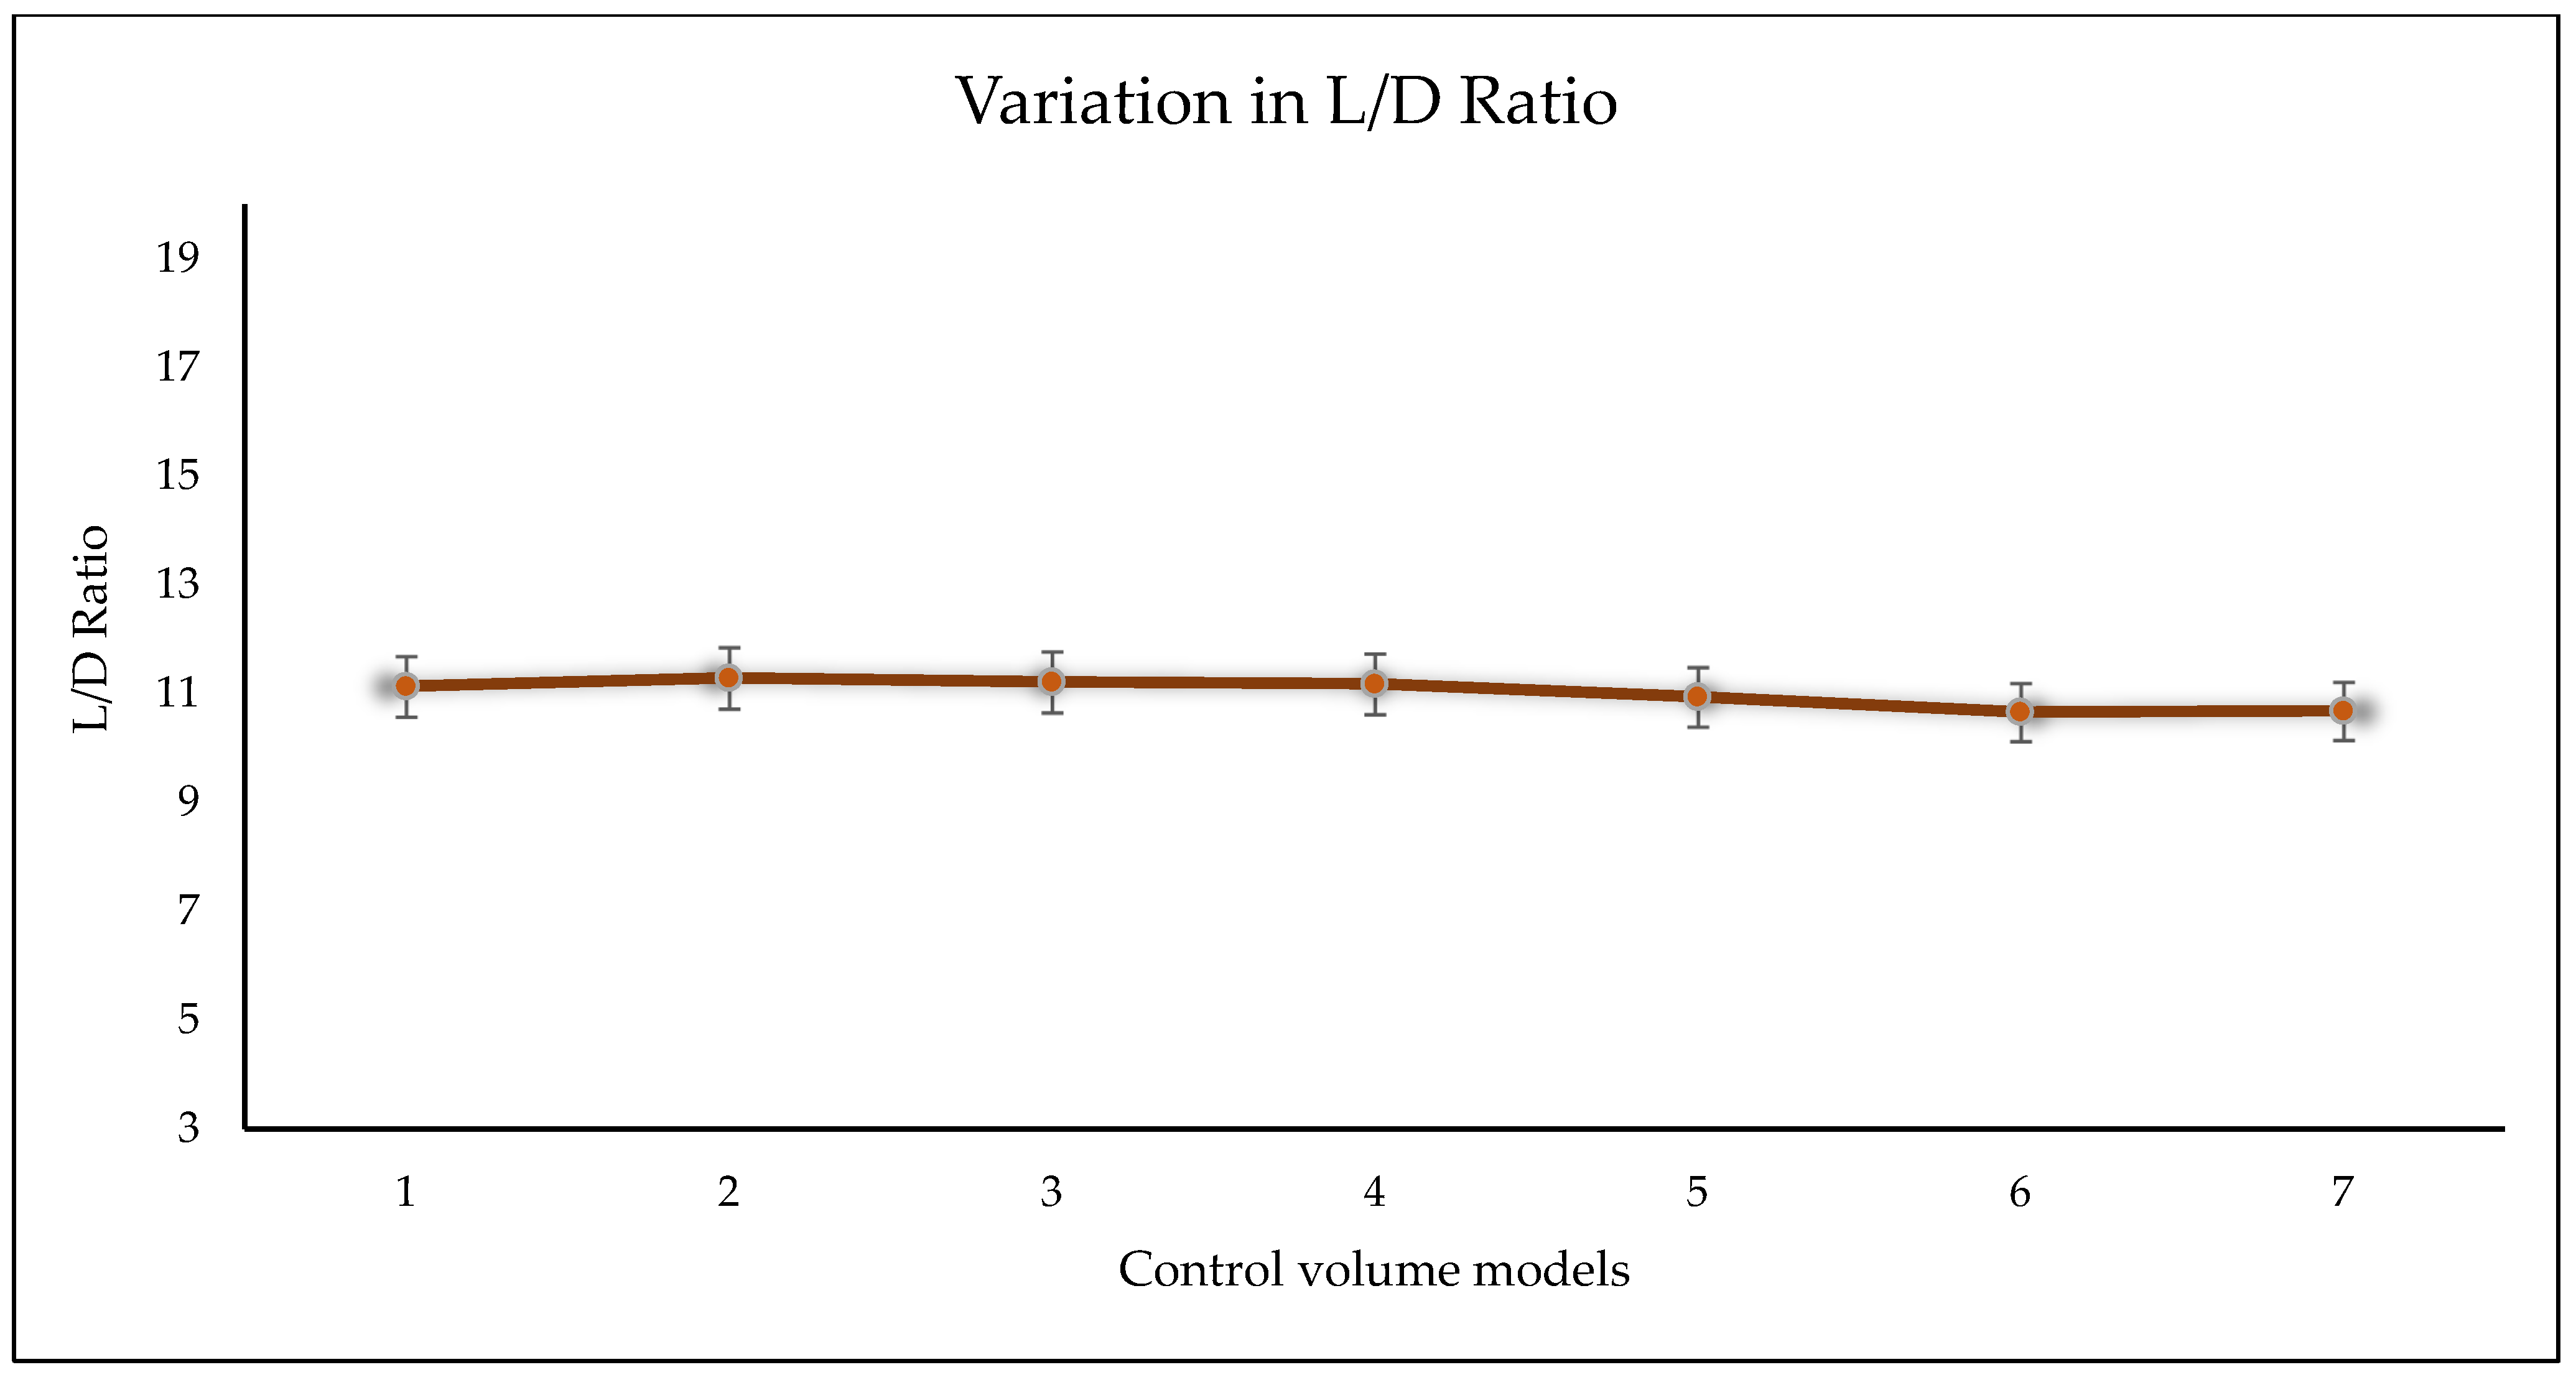
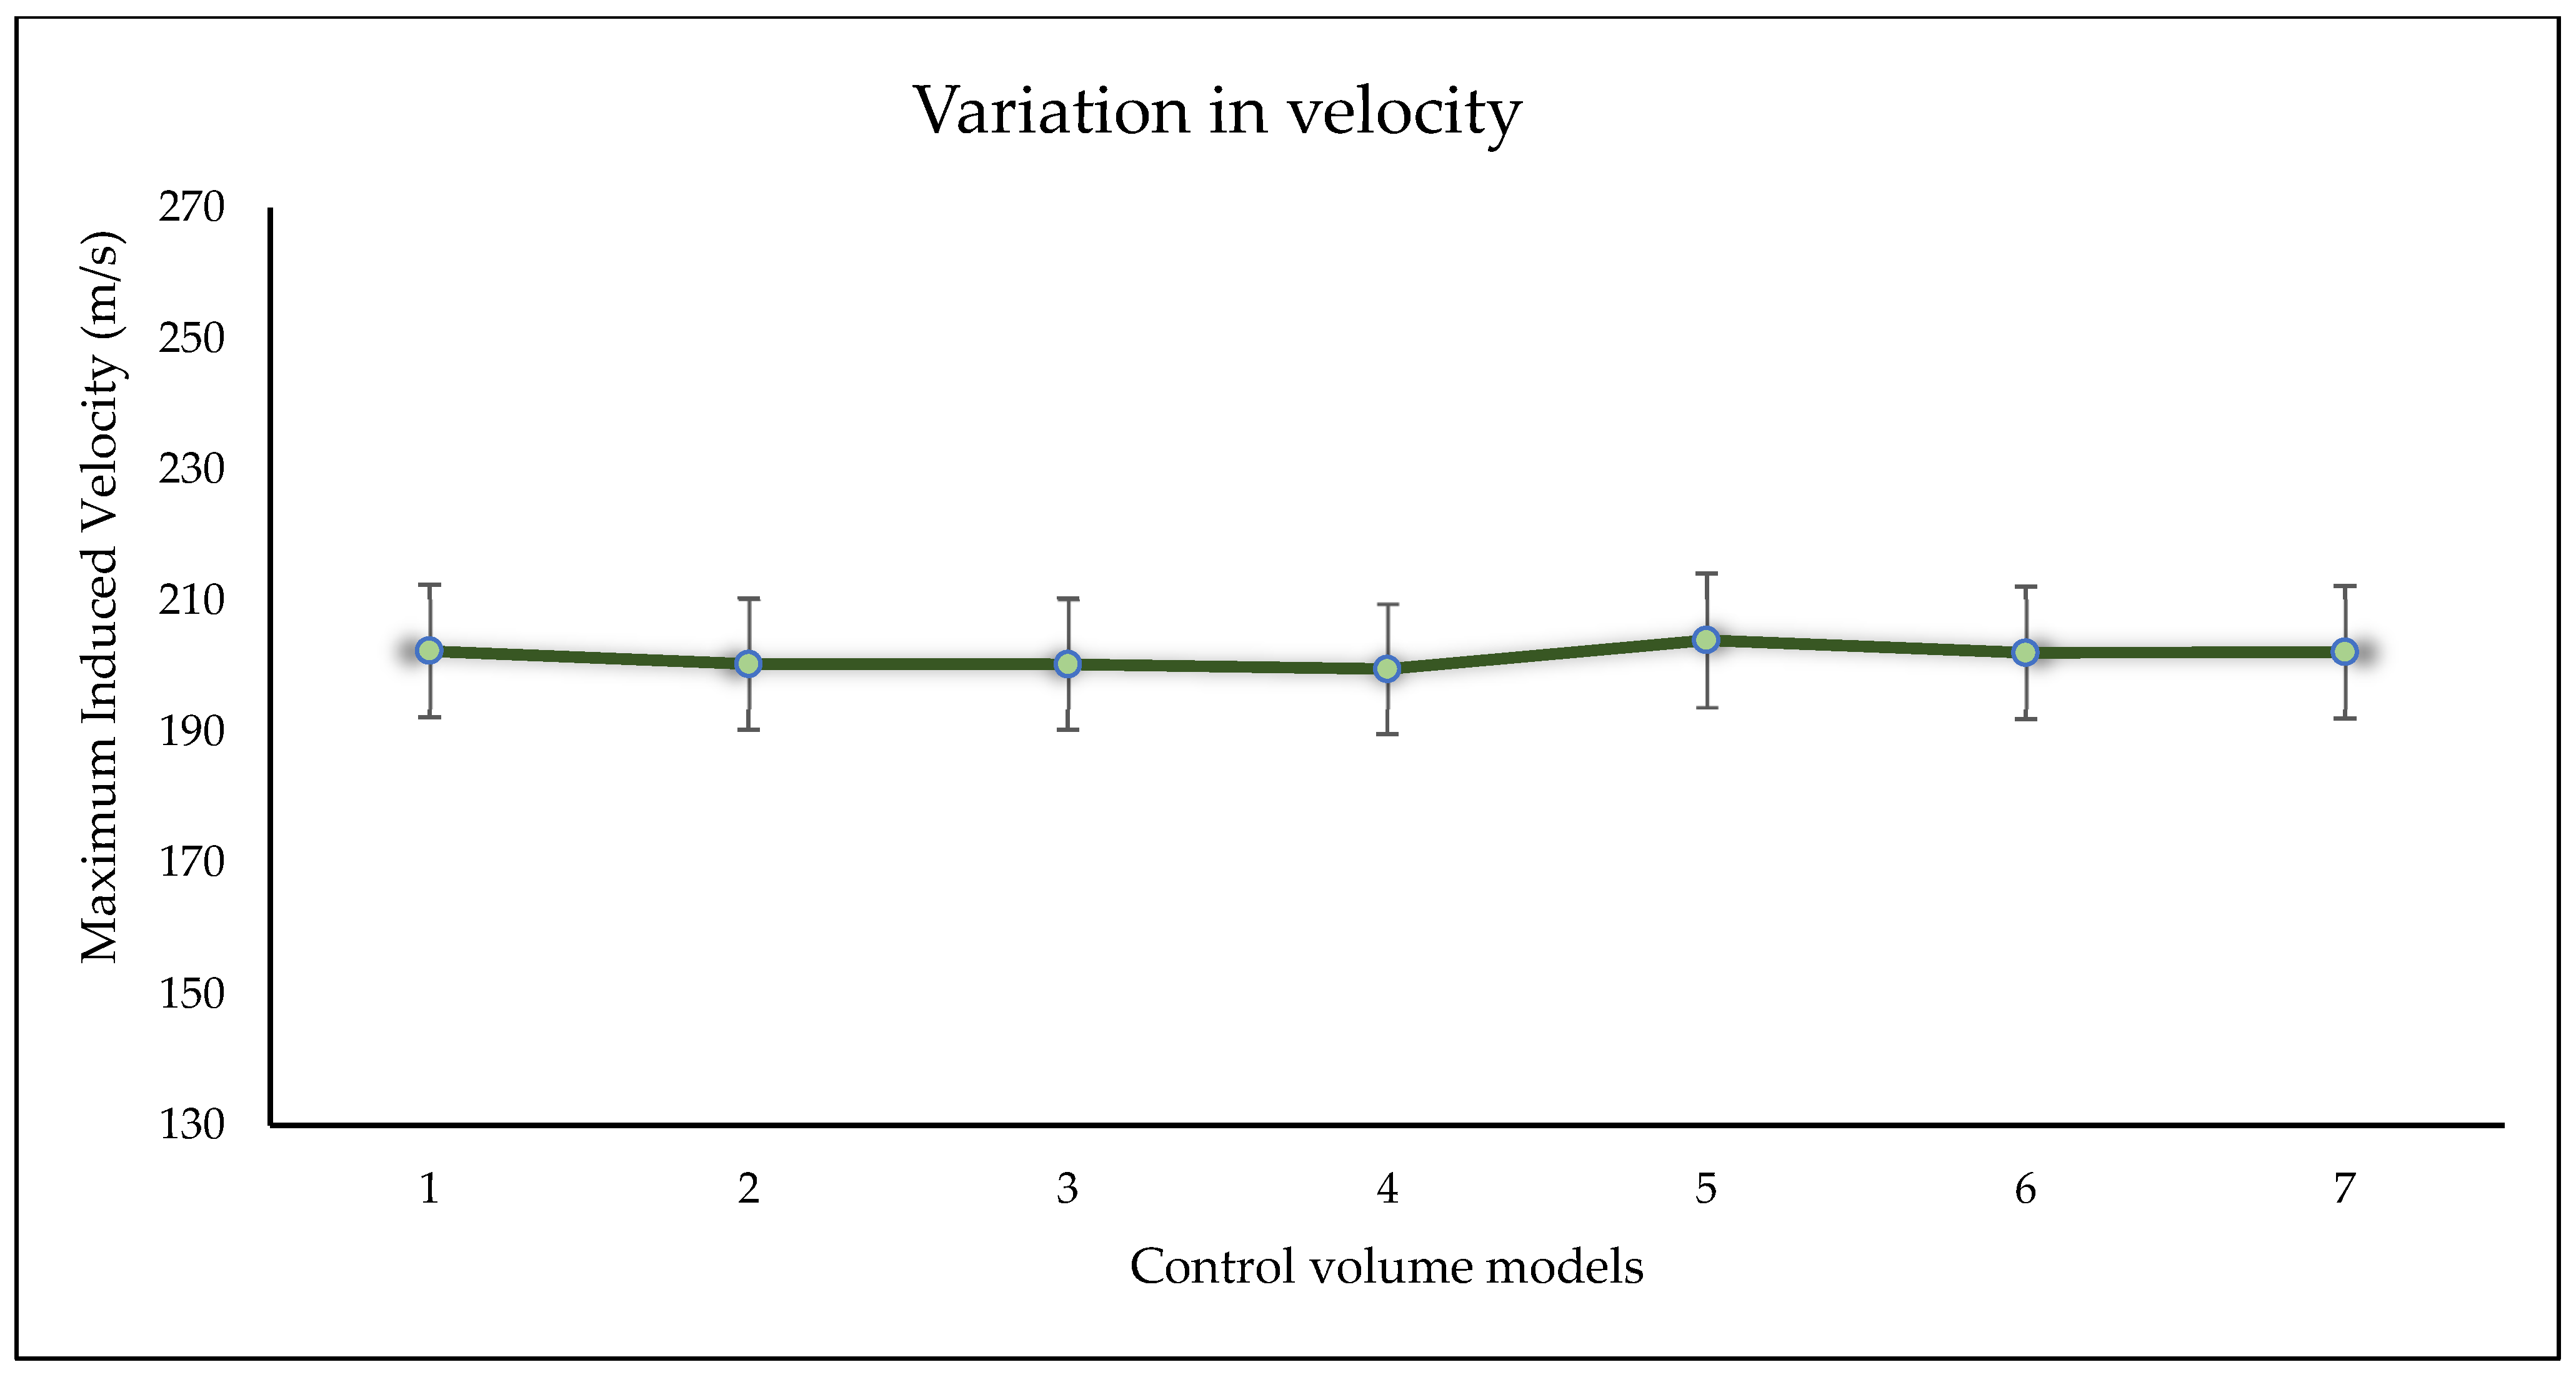
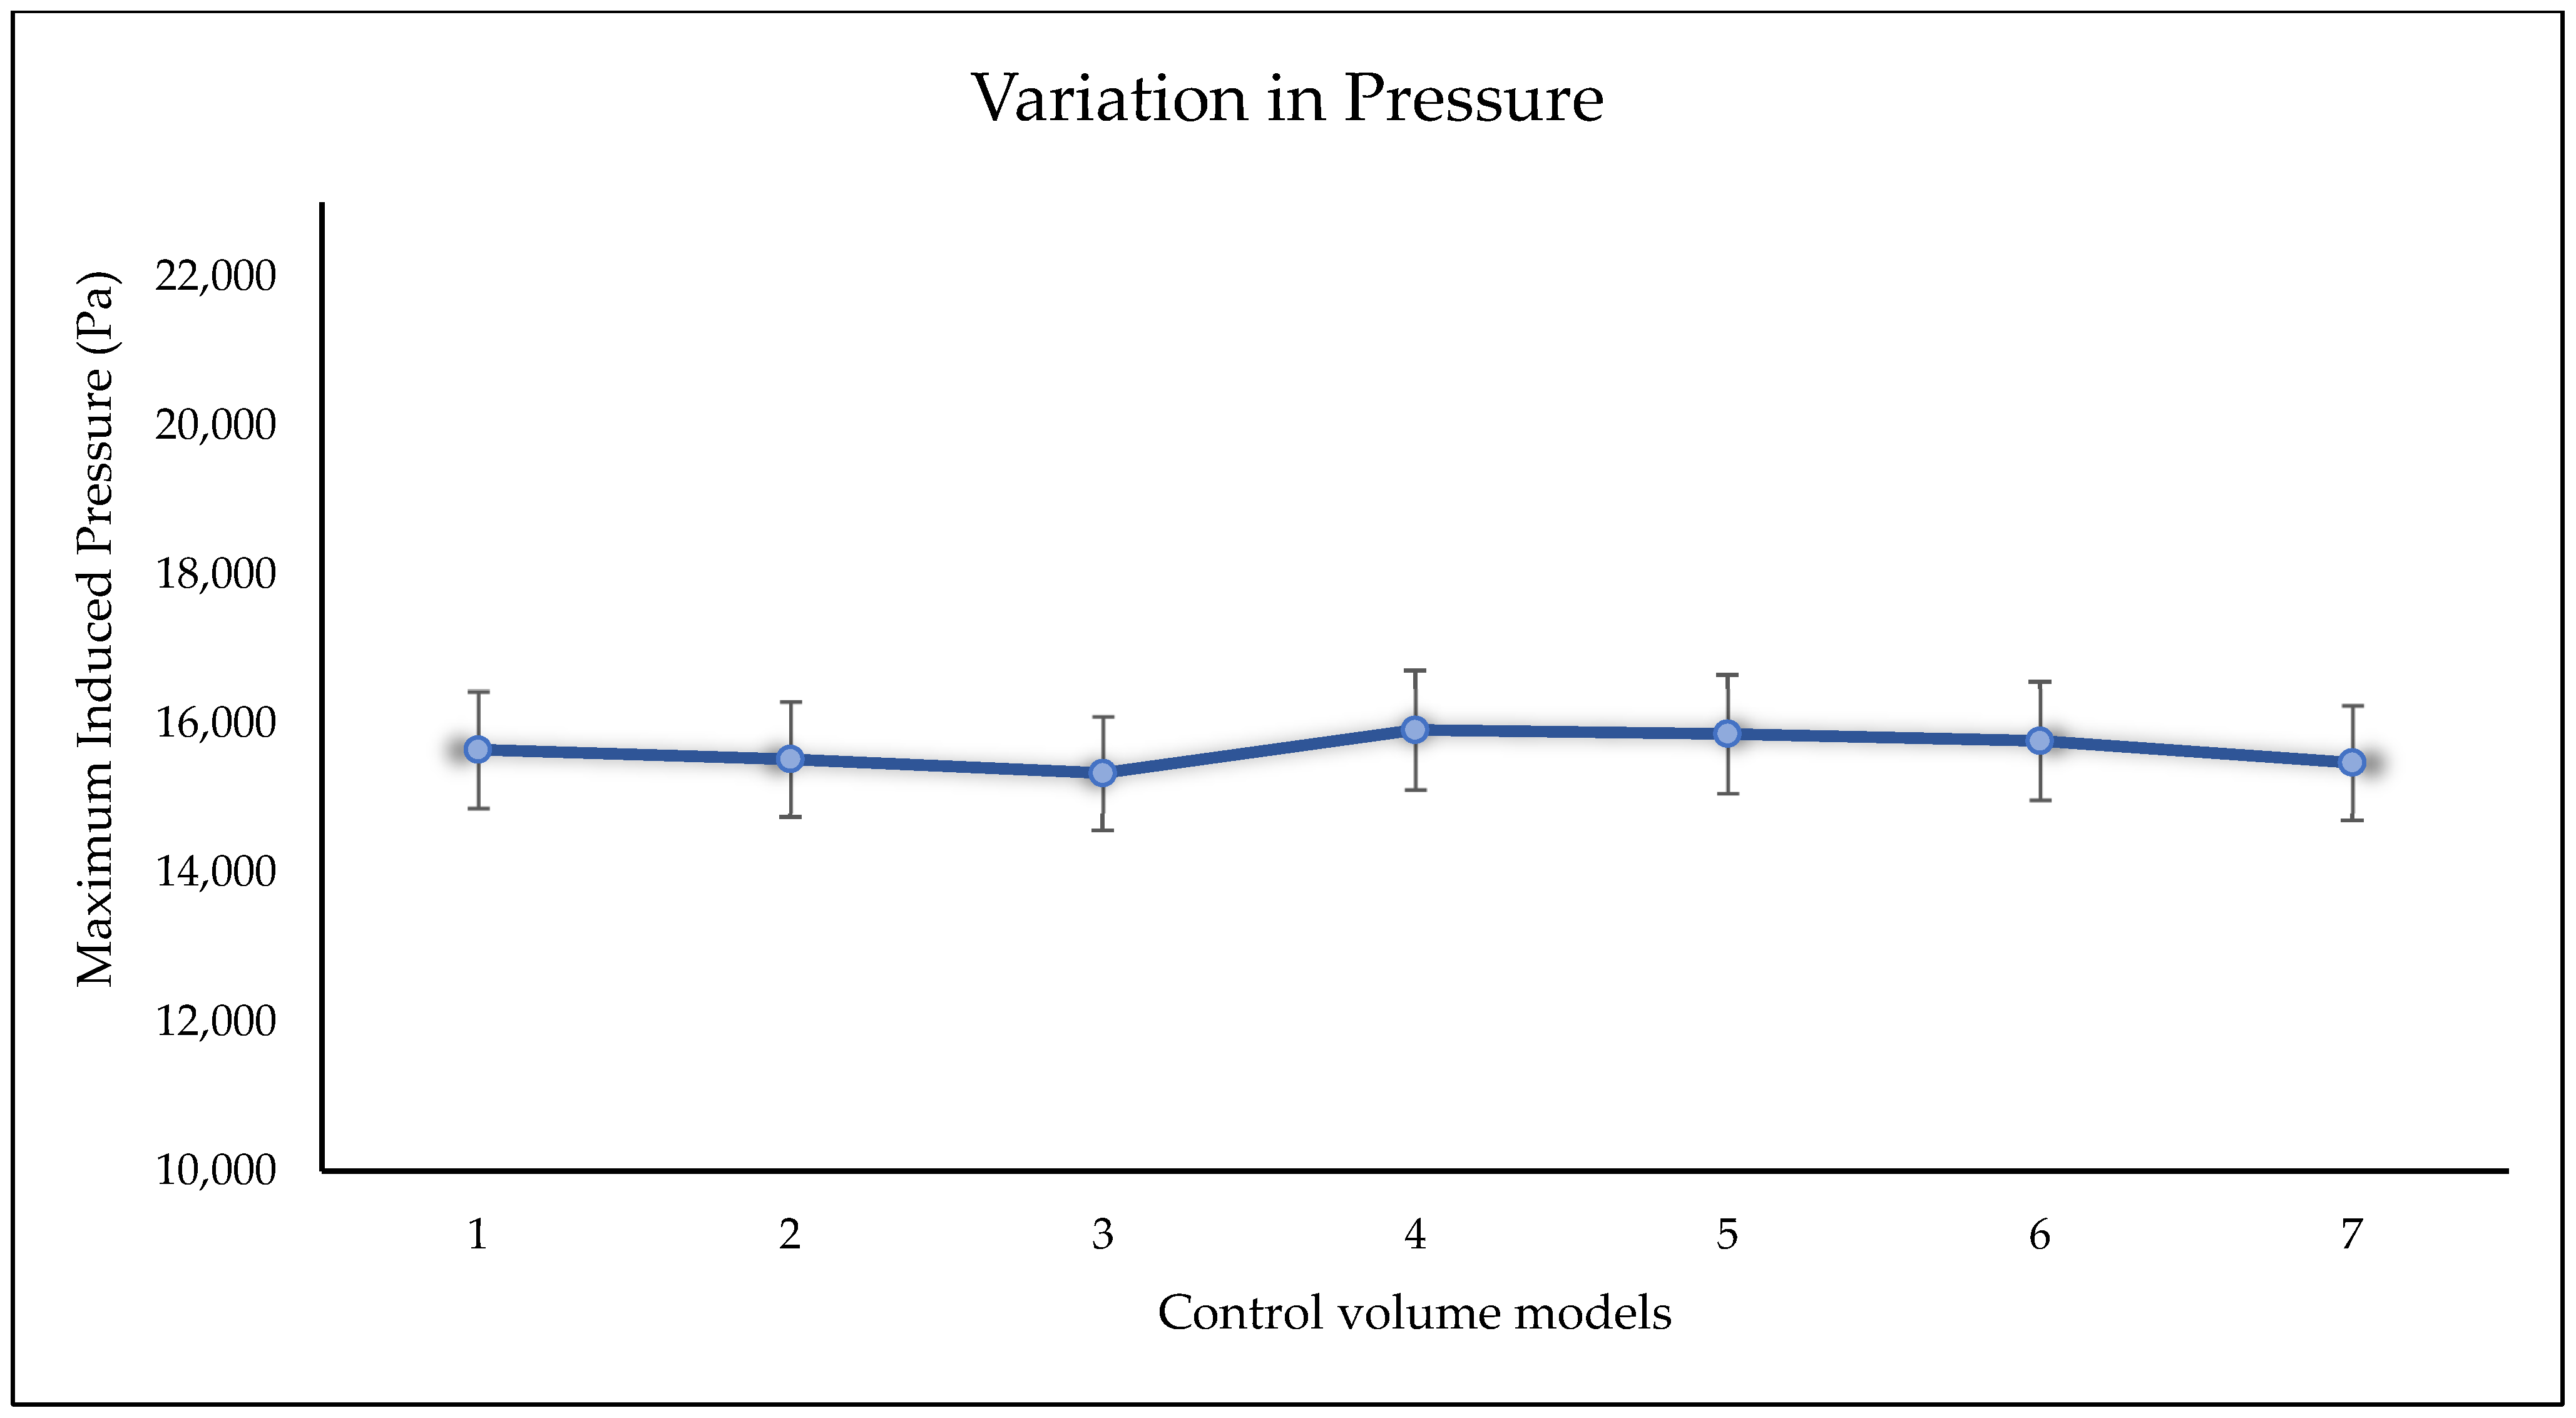
CFD simulations are performed using ANSYS 2023 R2 Fluent to evaluate aerodynamic performance. An enclosure is created in order to make a confined and required amount of space for the fluid flow analysis to occur, known as a control volume. For this particular case, a velocity inlet is provided with 171.5 m/s, as the intended working speed of the UAV is 0.5 Mach. The dimensions of the control volume are of radius and positive direction length of 2 m, and a backward direction length of 4 m, considering the overall 2.7 m span of the flying wing body. In order to prove the reliability of the control volume created, a control volume sensitivity test is conducted, for which the results are shown in Table 5. The analysis shows negligible variation, and, henceforth, the second control volume model of 2 m frontal distance and 4 m rear end distance is chosen for it to be large enough and also to produce accurate and reliable results. The sensitivity test results are plotted in Figure 22, Figure 23 and Figure 24 for the three parameters chosen, namely pressure, velocity and L/D ratio.
Table 5.
Aerodynamic magnitudes obtained for different CV dimensions.

Figure 22.
L/D ratio variations in different CV models.

Figure 23.
Velocity variations in different CV models.
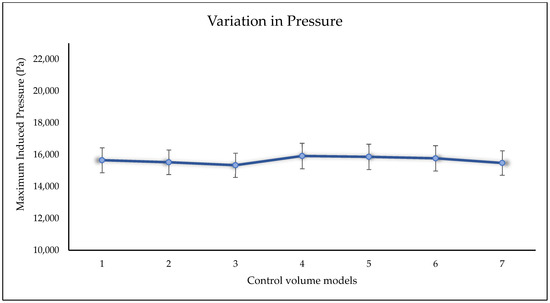
Figure 24.
Pressure variations in different CV models.
In addition to CFD analysis, FSI analysis involves a one-way coupling approach that imposes the pressure loads from the fluid flow analysis to the structural analysis. Fixed supports are provided to the respective locations and different materials are imposed. The enclosure is excluded, retaining the model only for this analysis. Further hybrid material design is performed that enhances material performance using Material Designer solver in ANSYS Workbench 2023.
2.2.2. Discretization
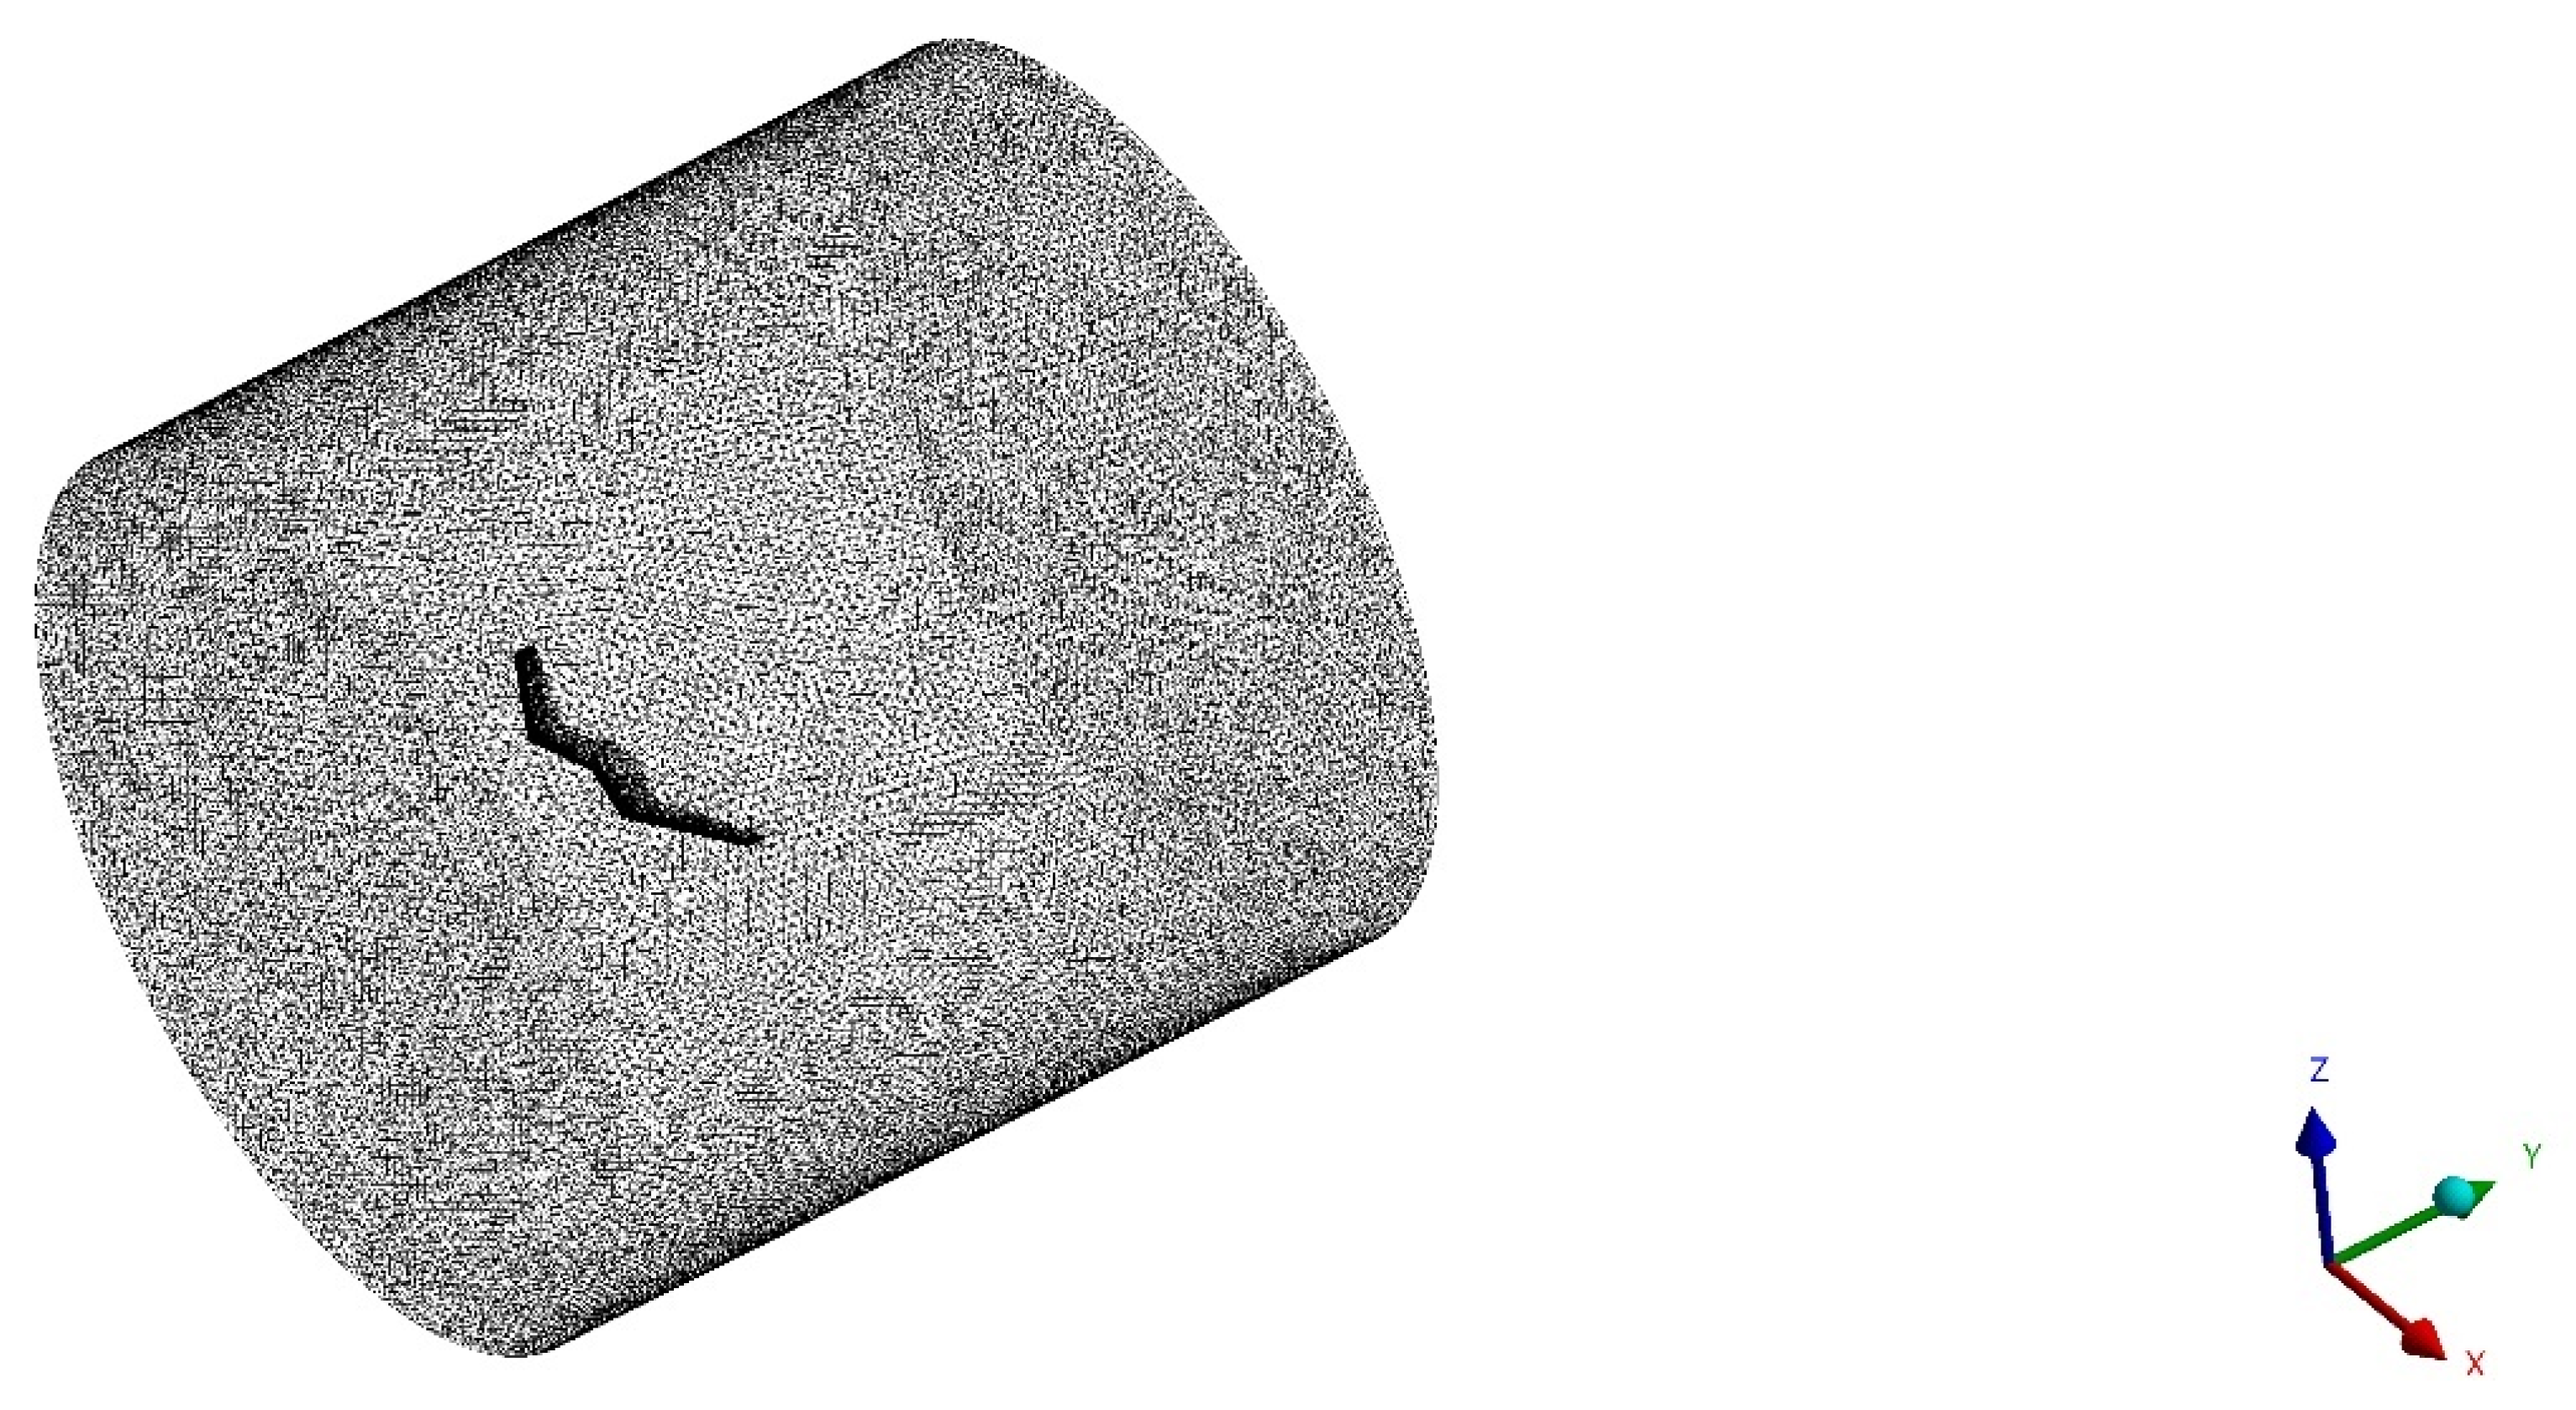
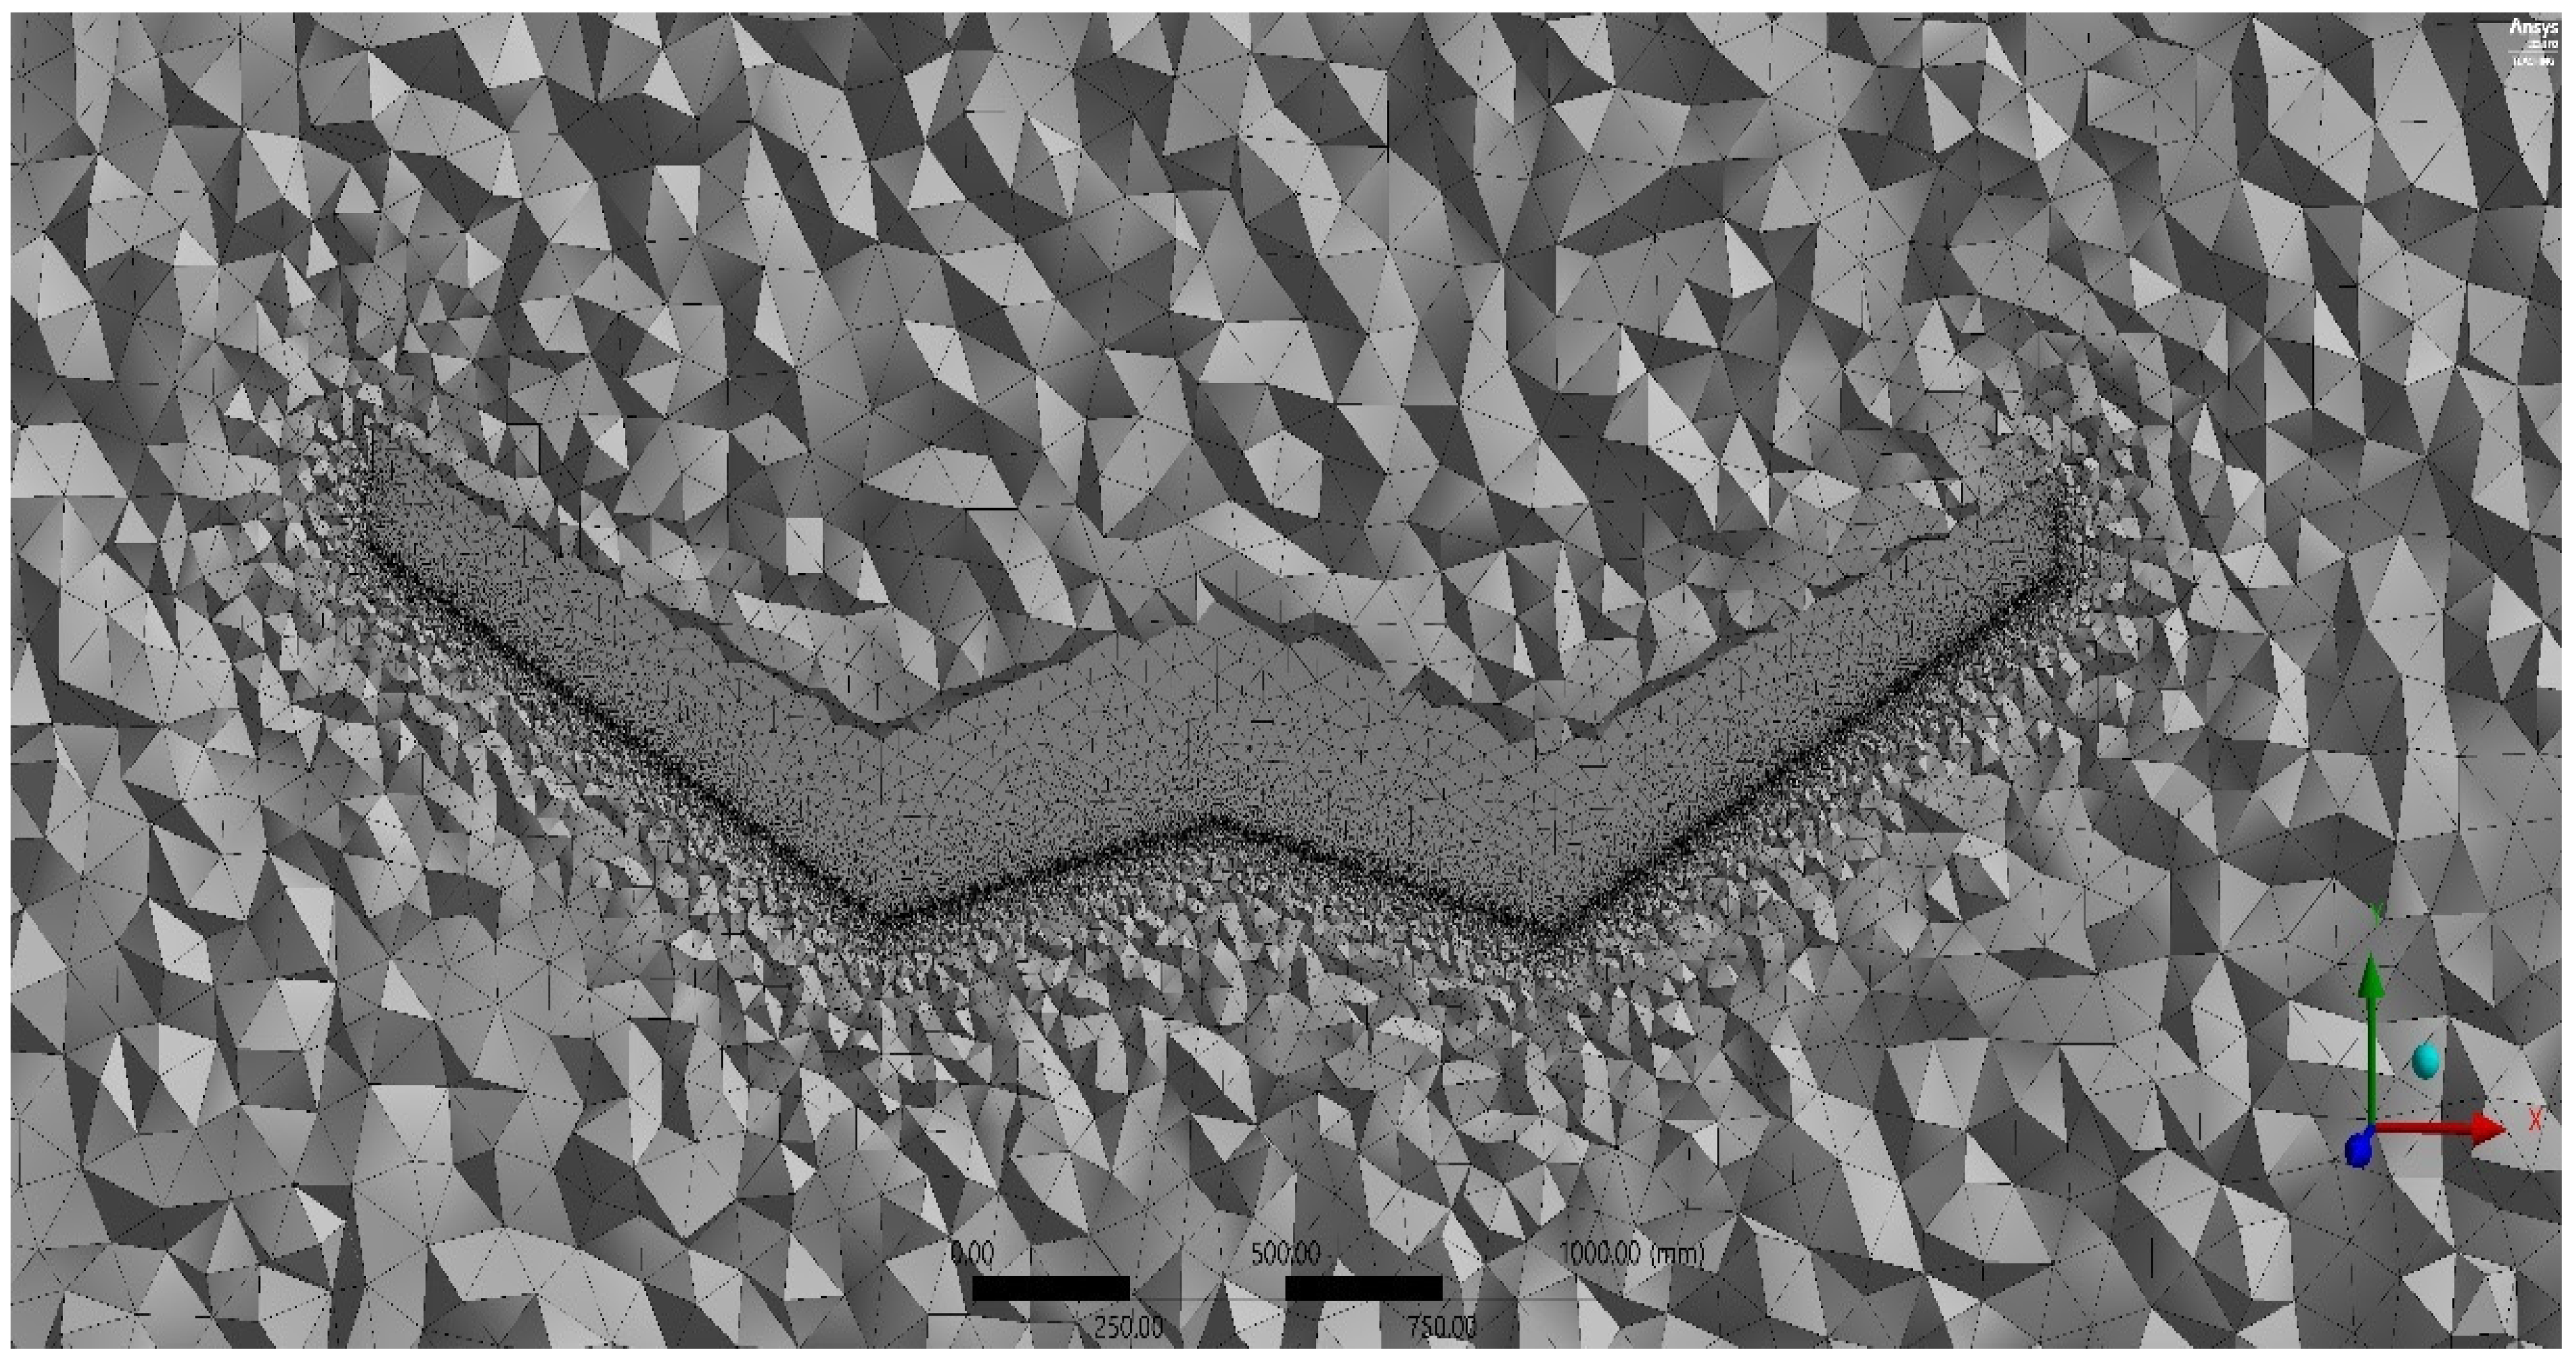
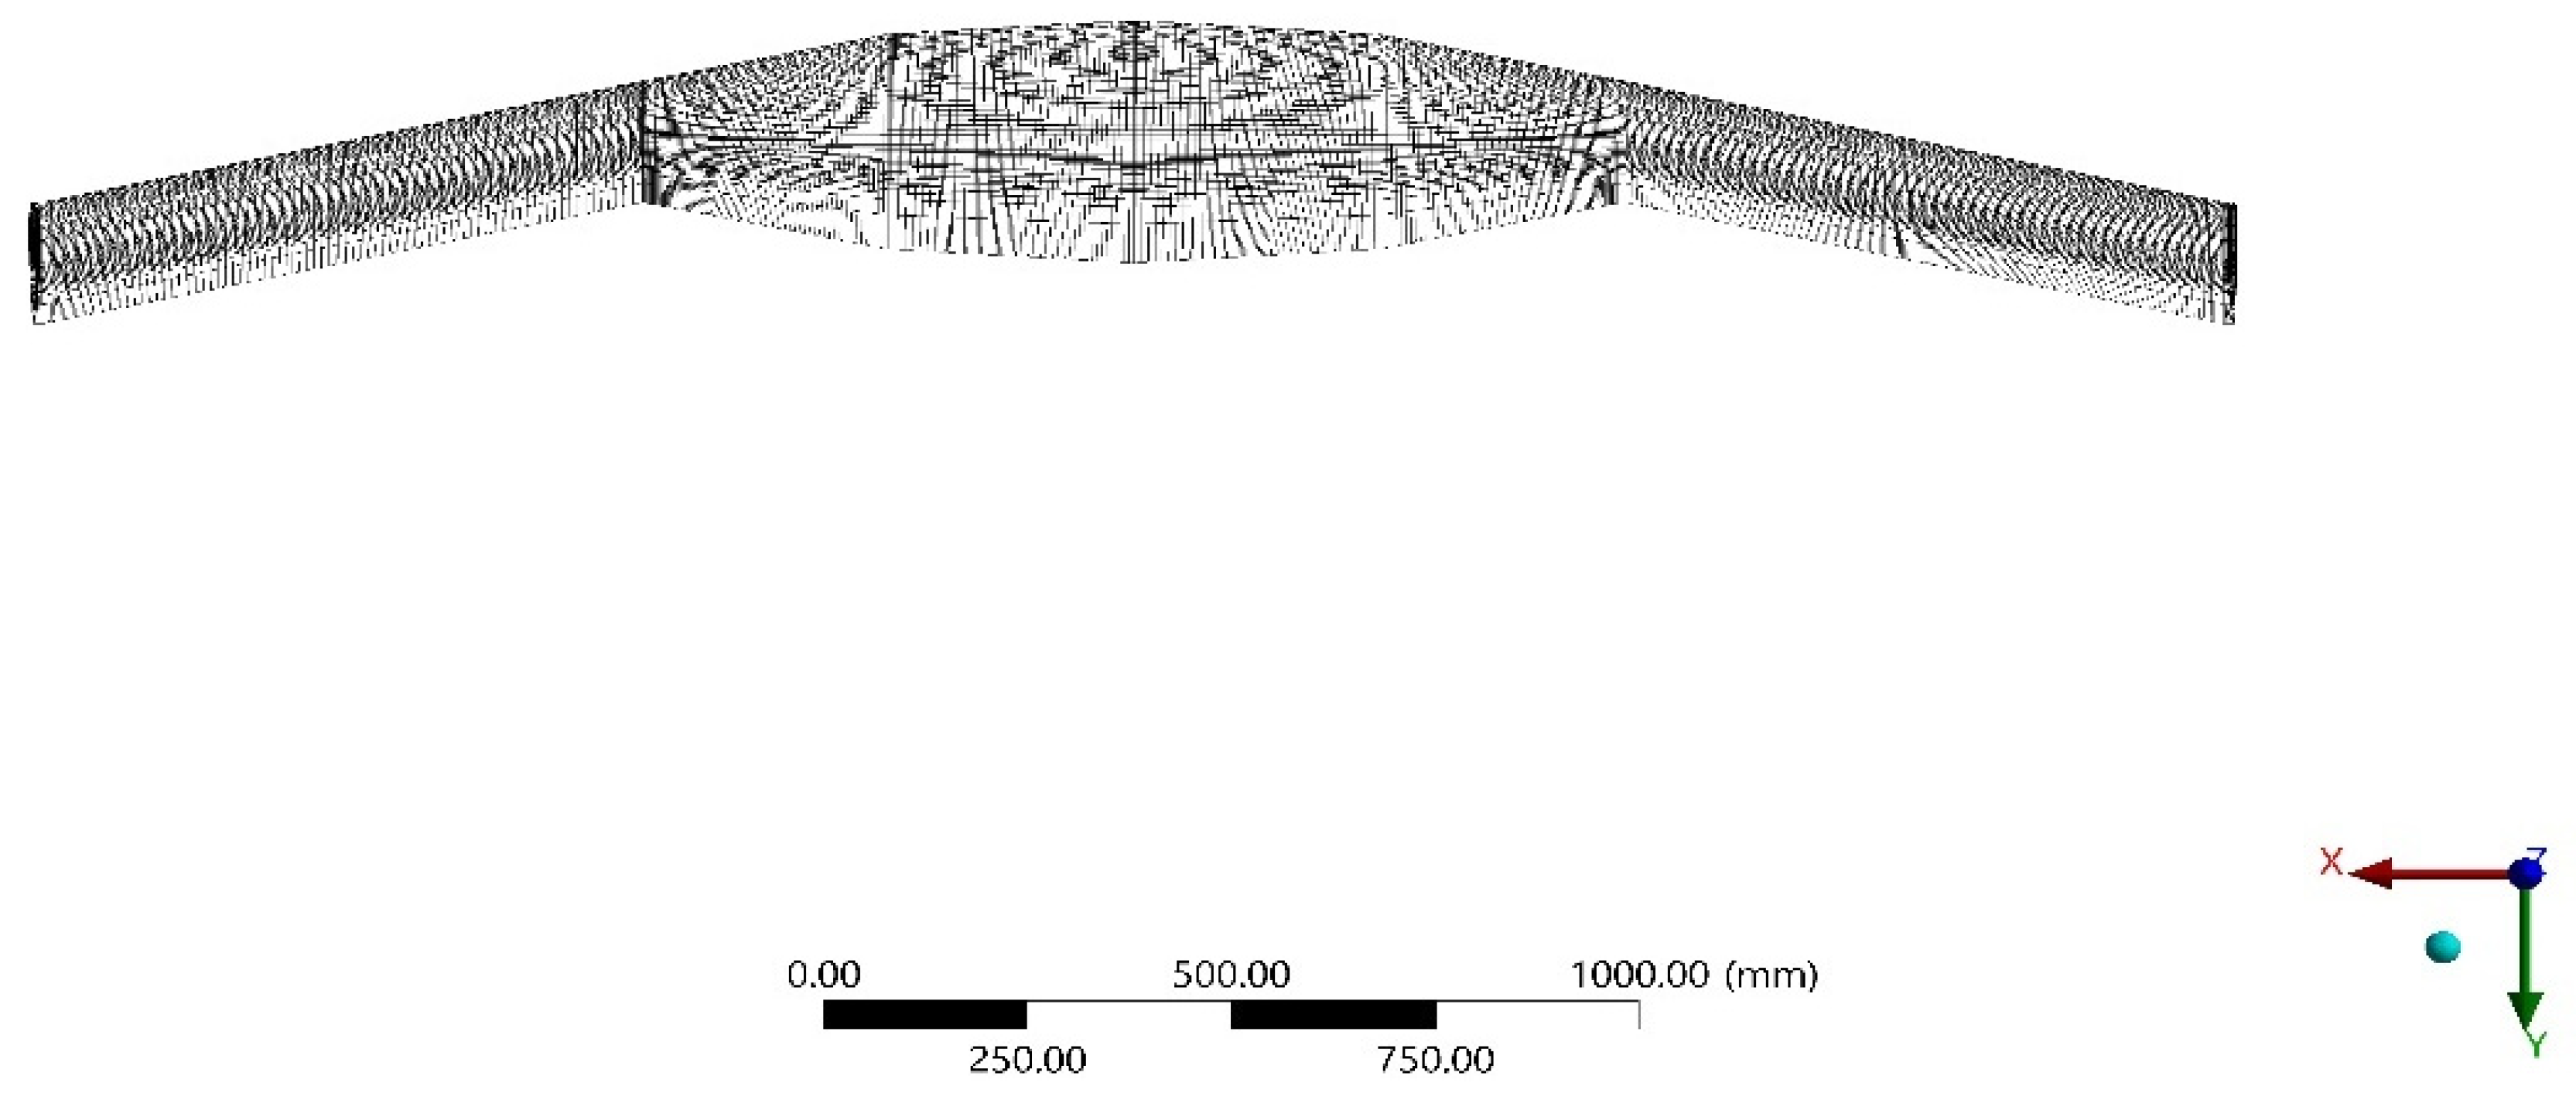
The control volume created along with the model of the flying wing body has to undergo the process of discretization. The imposed governing equations will be applied to all the created nodes. According to the finite volume method approach, the computational process occurs, resulting in playing a significant role in achieving convergence making the node formation process a critical one for obtaining accurate results. Wireframe-based projection of the discretized control volume along with the model is shown in Figure 25. The internal formation of the mesh is shown in Figure 26. The typical number of elements of the simulations are about 2,500,000 to 3,000,000 with enabled proximity and curvature settings considering the model’s nature.

Figure 25.
Isometric view of the discretized control volume.
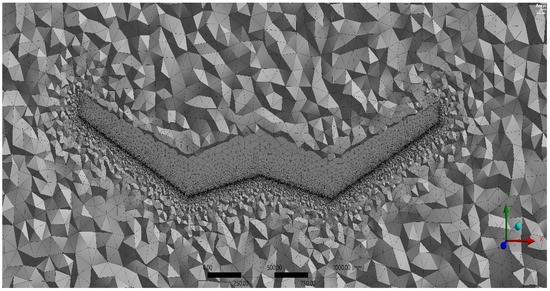
Figure 26.
Internal view of mesh in the cut section of the control volume.
The discretized model utilized for the structural analysis is shown in Figure 27. In this case, the enclosure is removed while the flying wing UAV model is meshed to impose the material behavior and parameters into the configuration. The typical number of elements varies from 32,000 to 72,000 for all the proposed models.

Figure 27.
Mesh formation in Base flying wing UAV—Static structural solver.
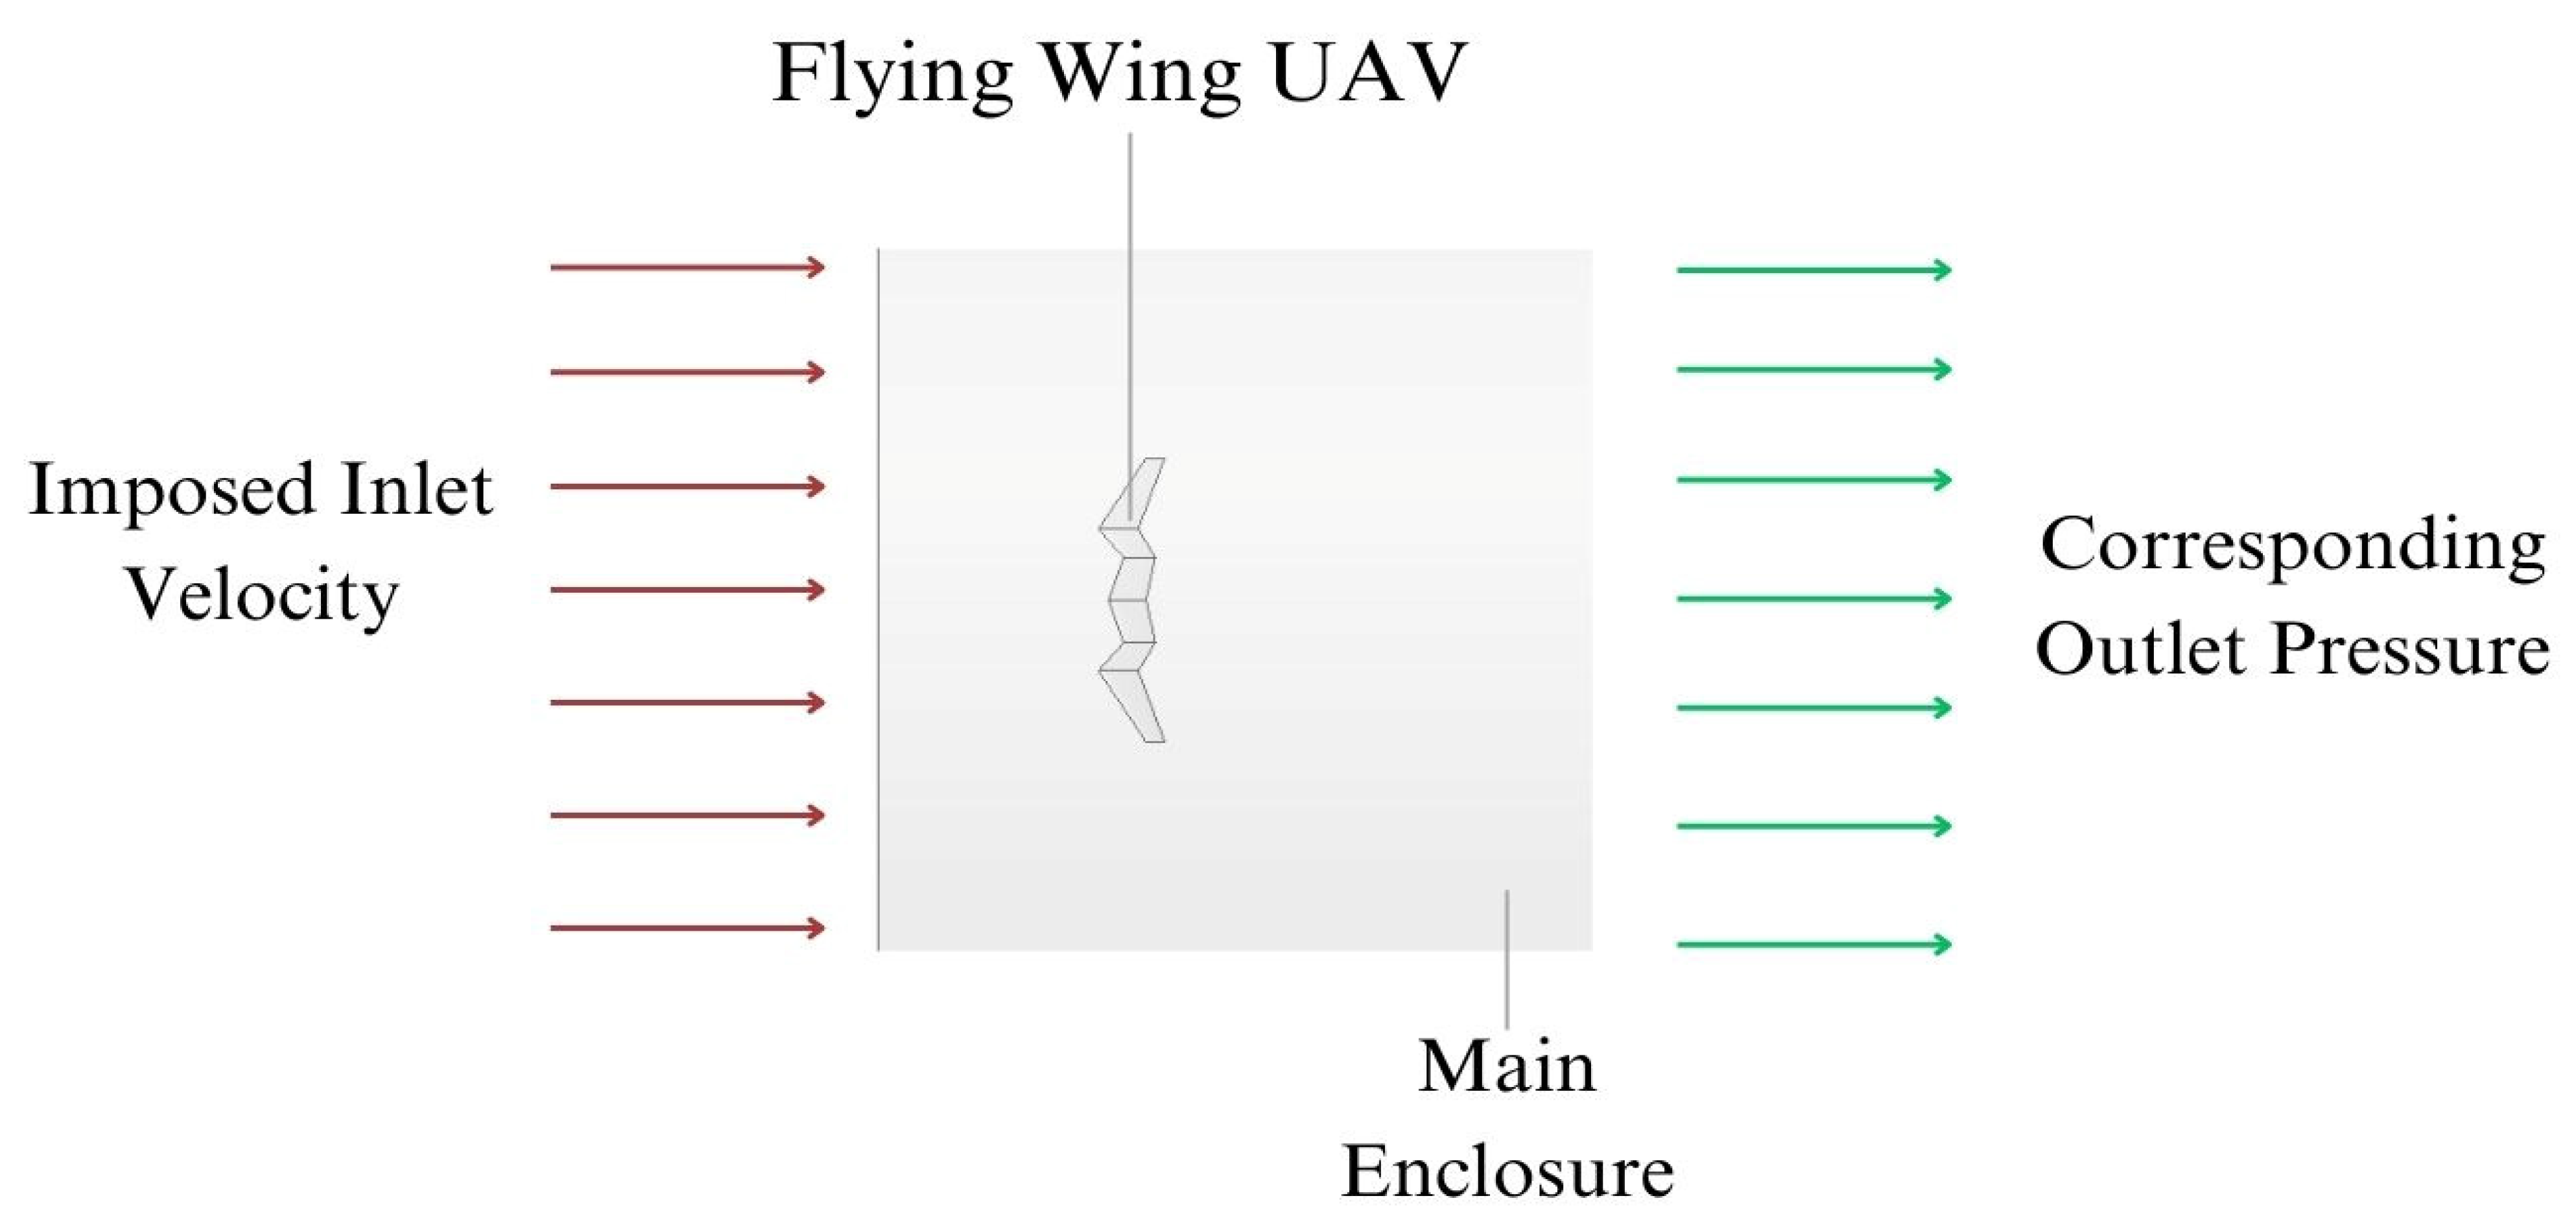
2.2.3. Boundary Conditions
The defined control volume, following the process of discretization, is provided with the boundary conditions that are crucially necessary for the fluid flow analysis as it has the needed velocity and pressure parameters, depending on the aerodynamic significance of the working environment of the flying wing. The boundary conditions incorporated depending on the respective environmental conditions imposed are given in Table 6. Figure 28 illustrates the control volume and imposed boundary conditions.
Table 6.
List of imposed boundary conditions.
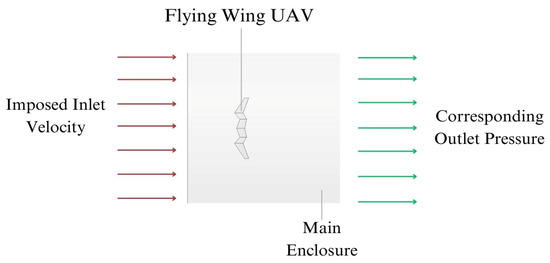
Figure 28.
Boundary conditions and naming of the enclosure.
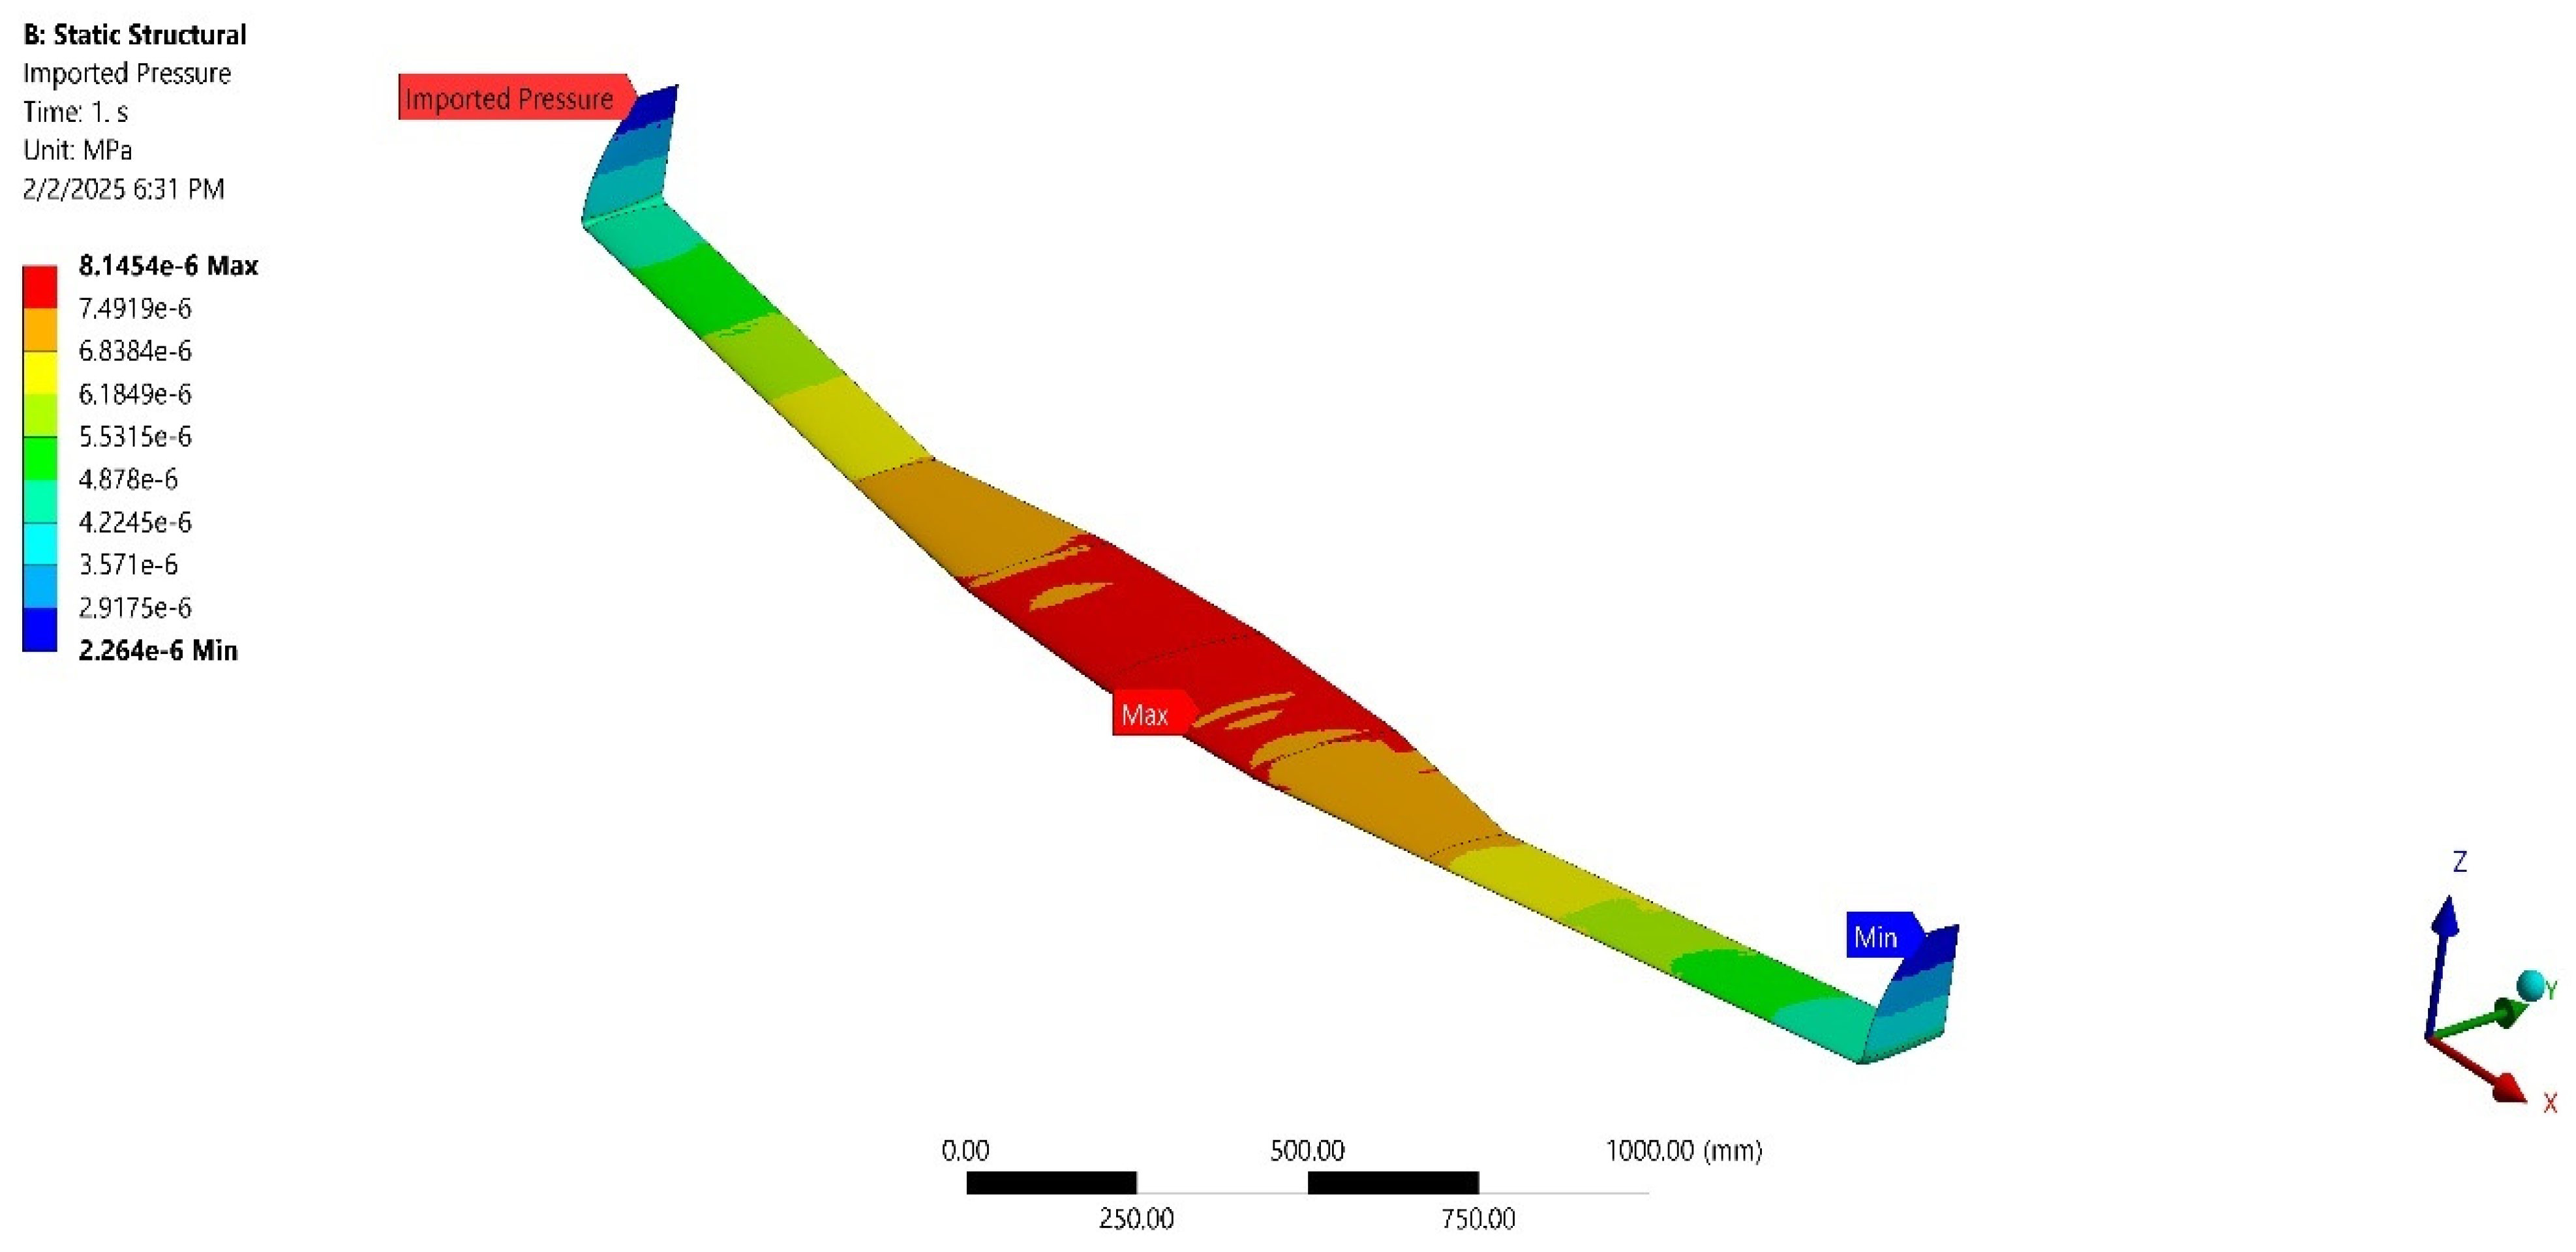
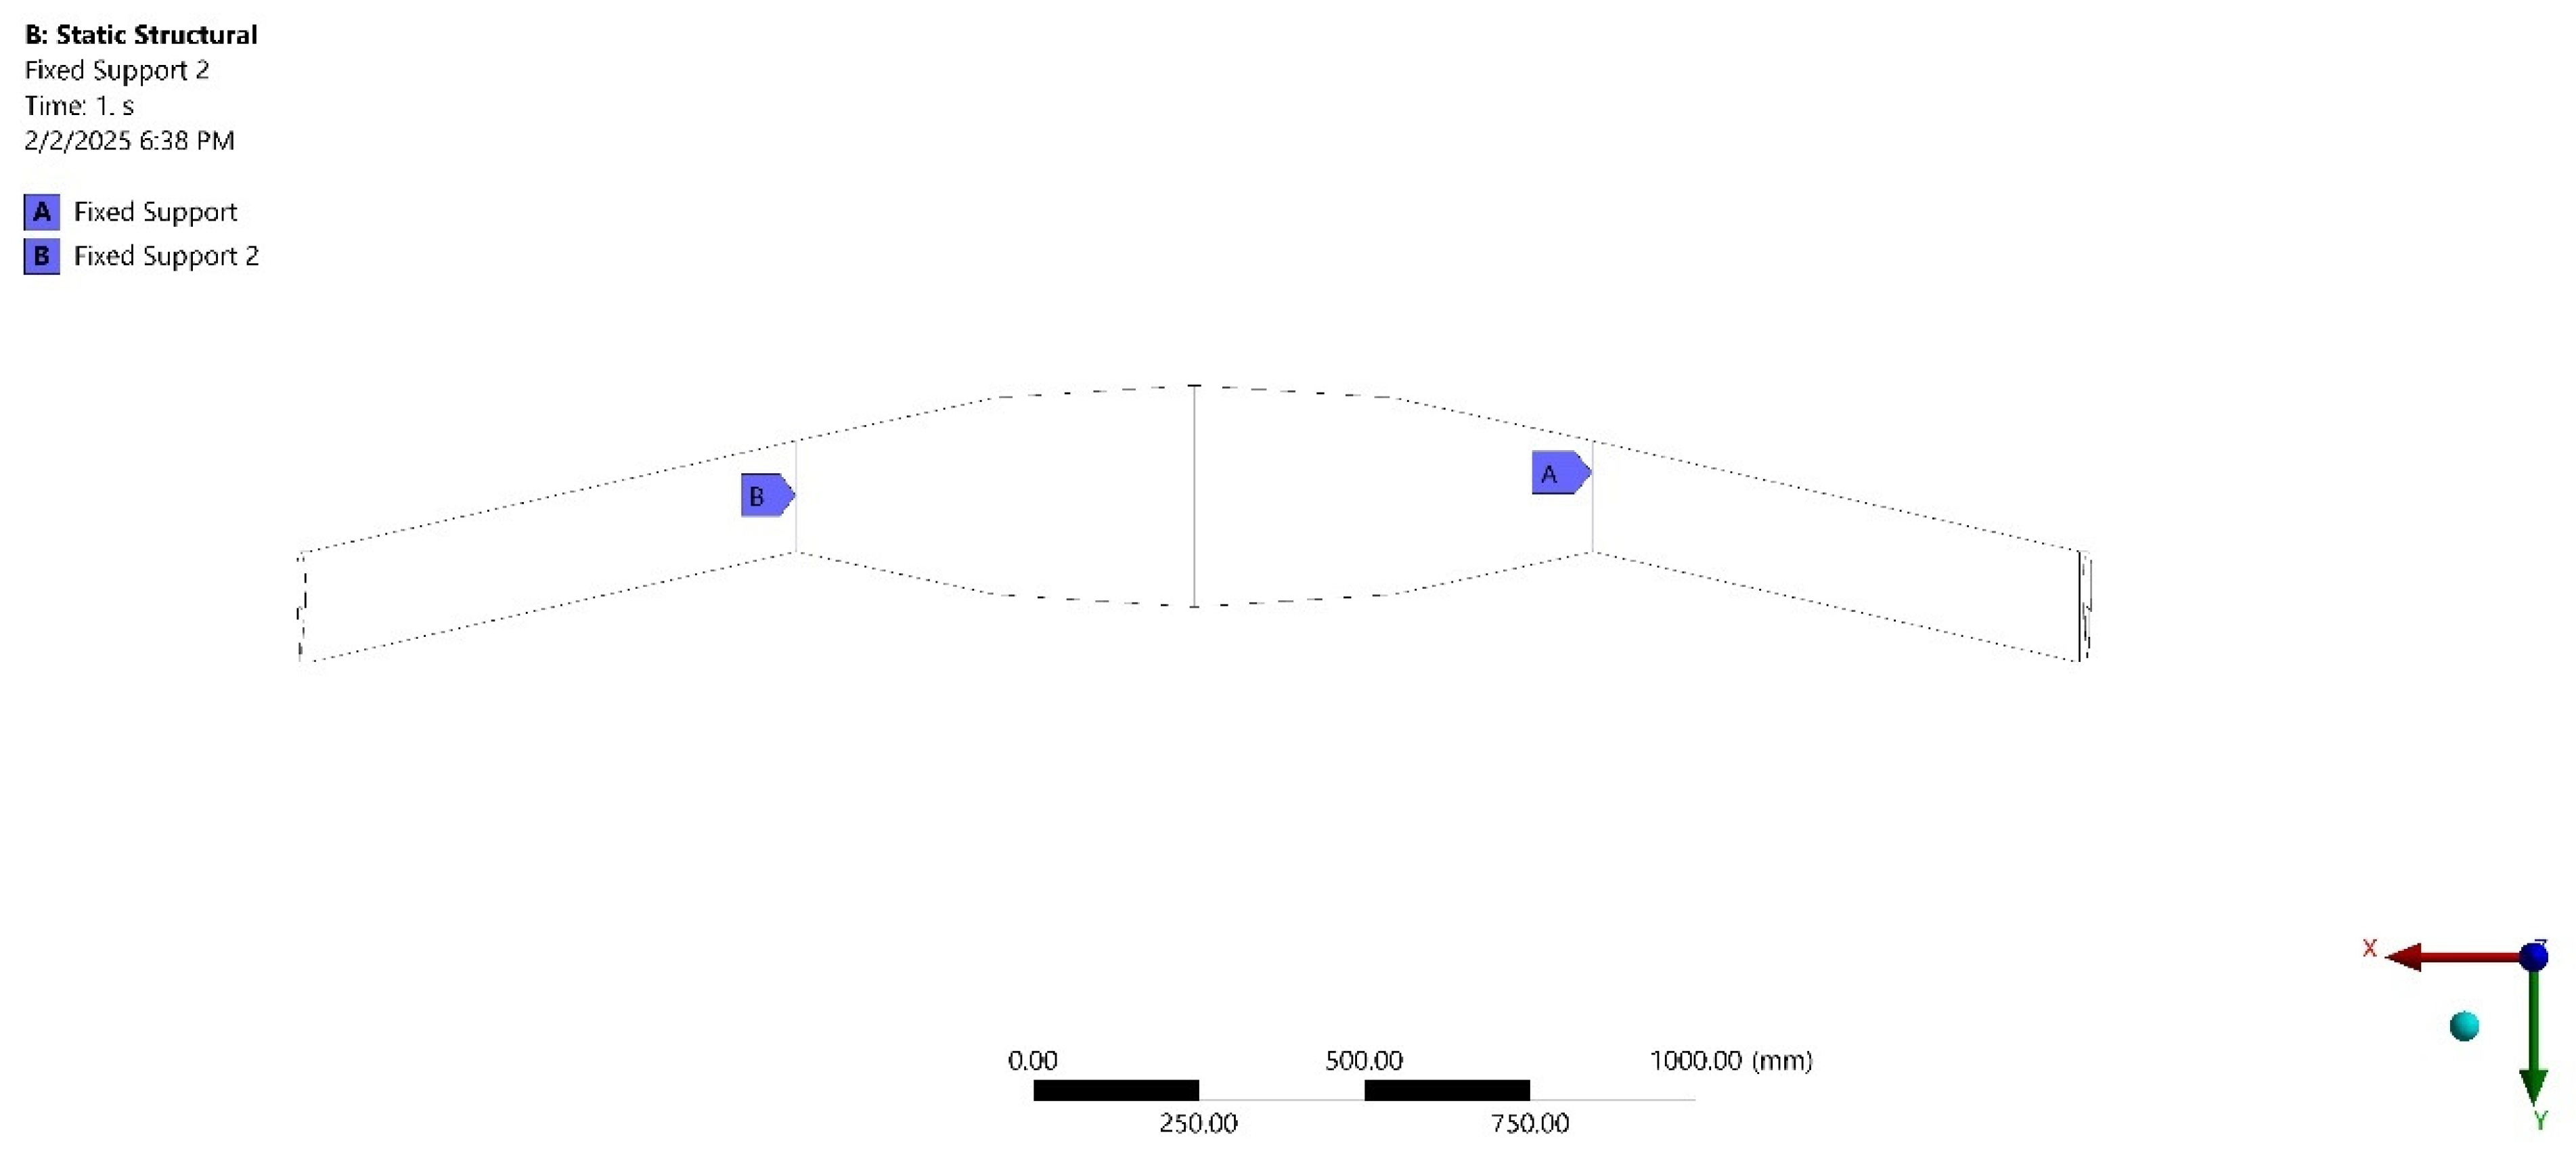
The pressure loadings from the CFD analysis are imported for structural analysis, which is shown in Figure 29, while the supports provided are shown in Figure 30.
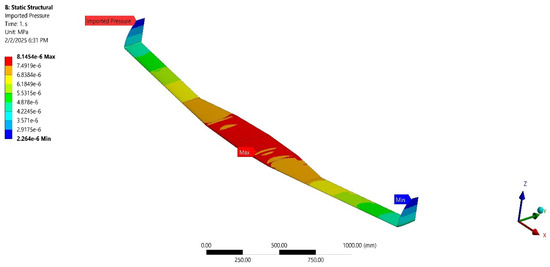
Figure 29.
Imported pressure over Base flying wing UAV—Static structural analysis.
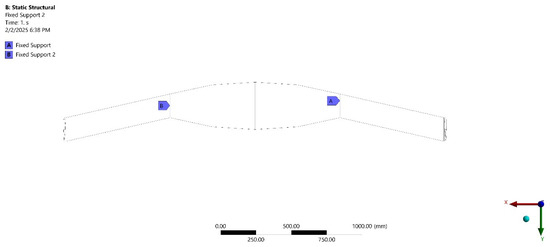
Figure 30.
Fixed supports provided to Base flying wing UAV—Static structural analysis.
2.2.4. Grid Independence Study
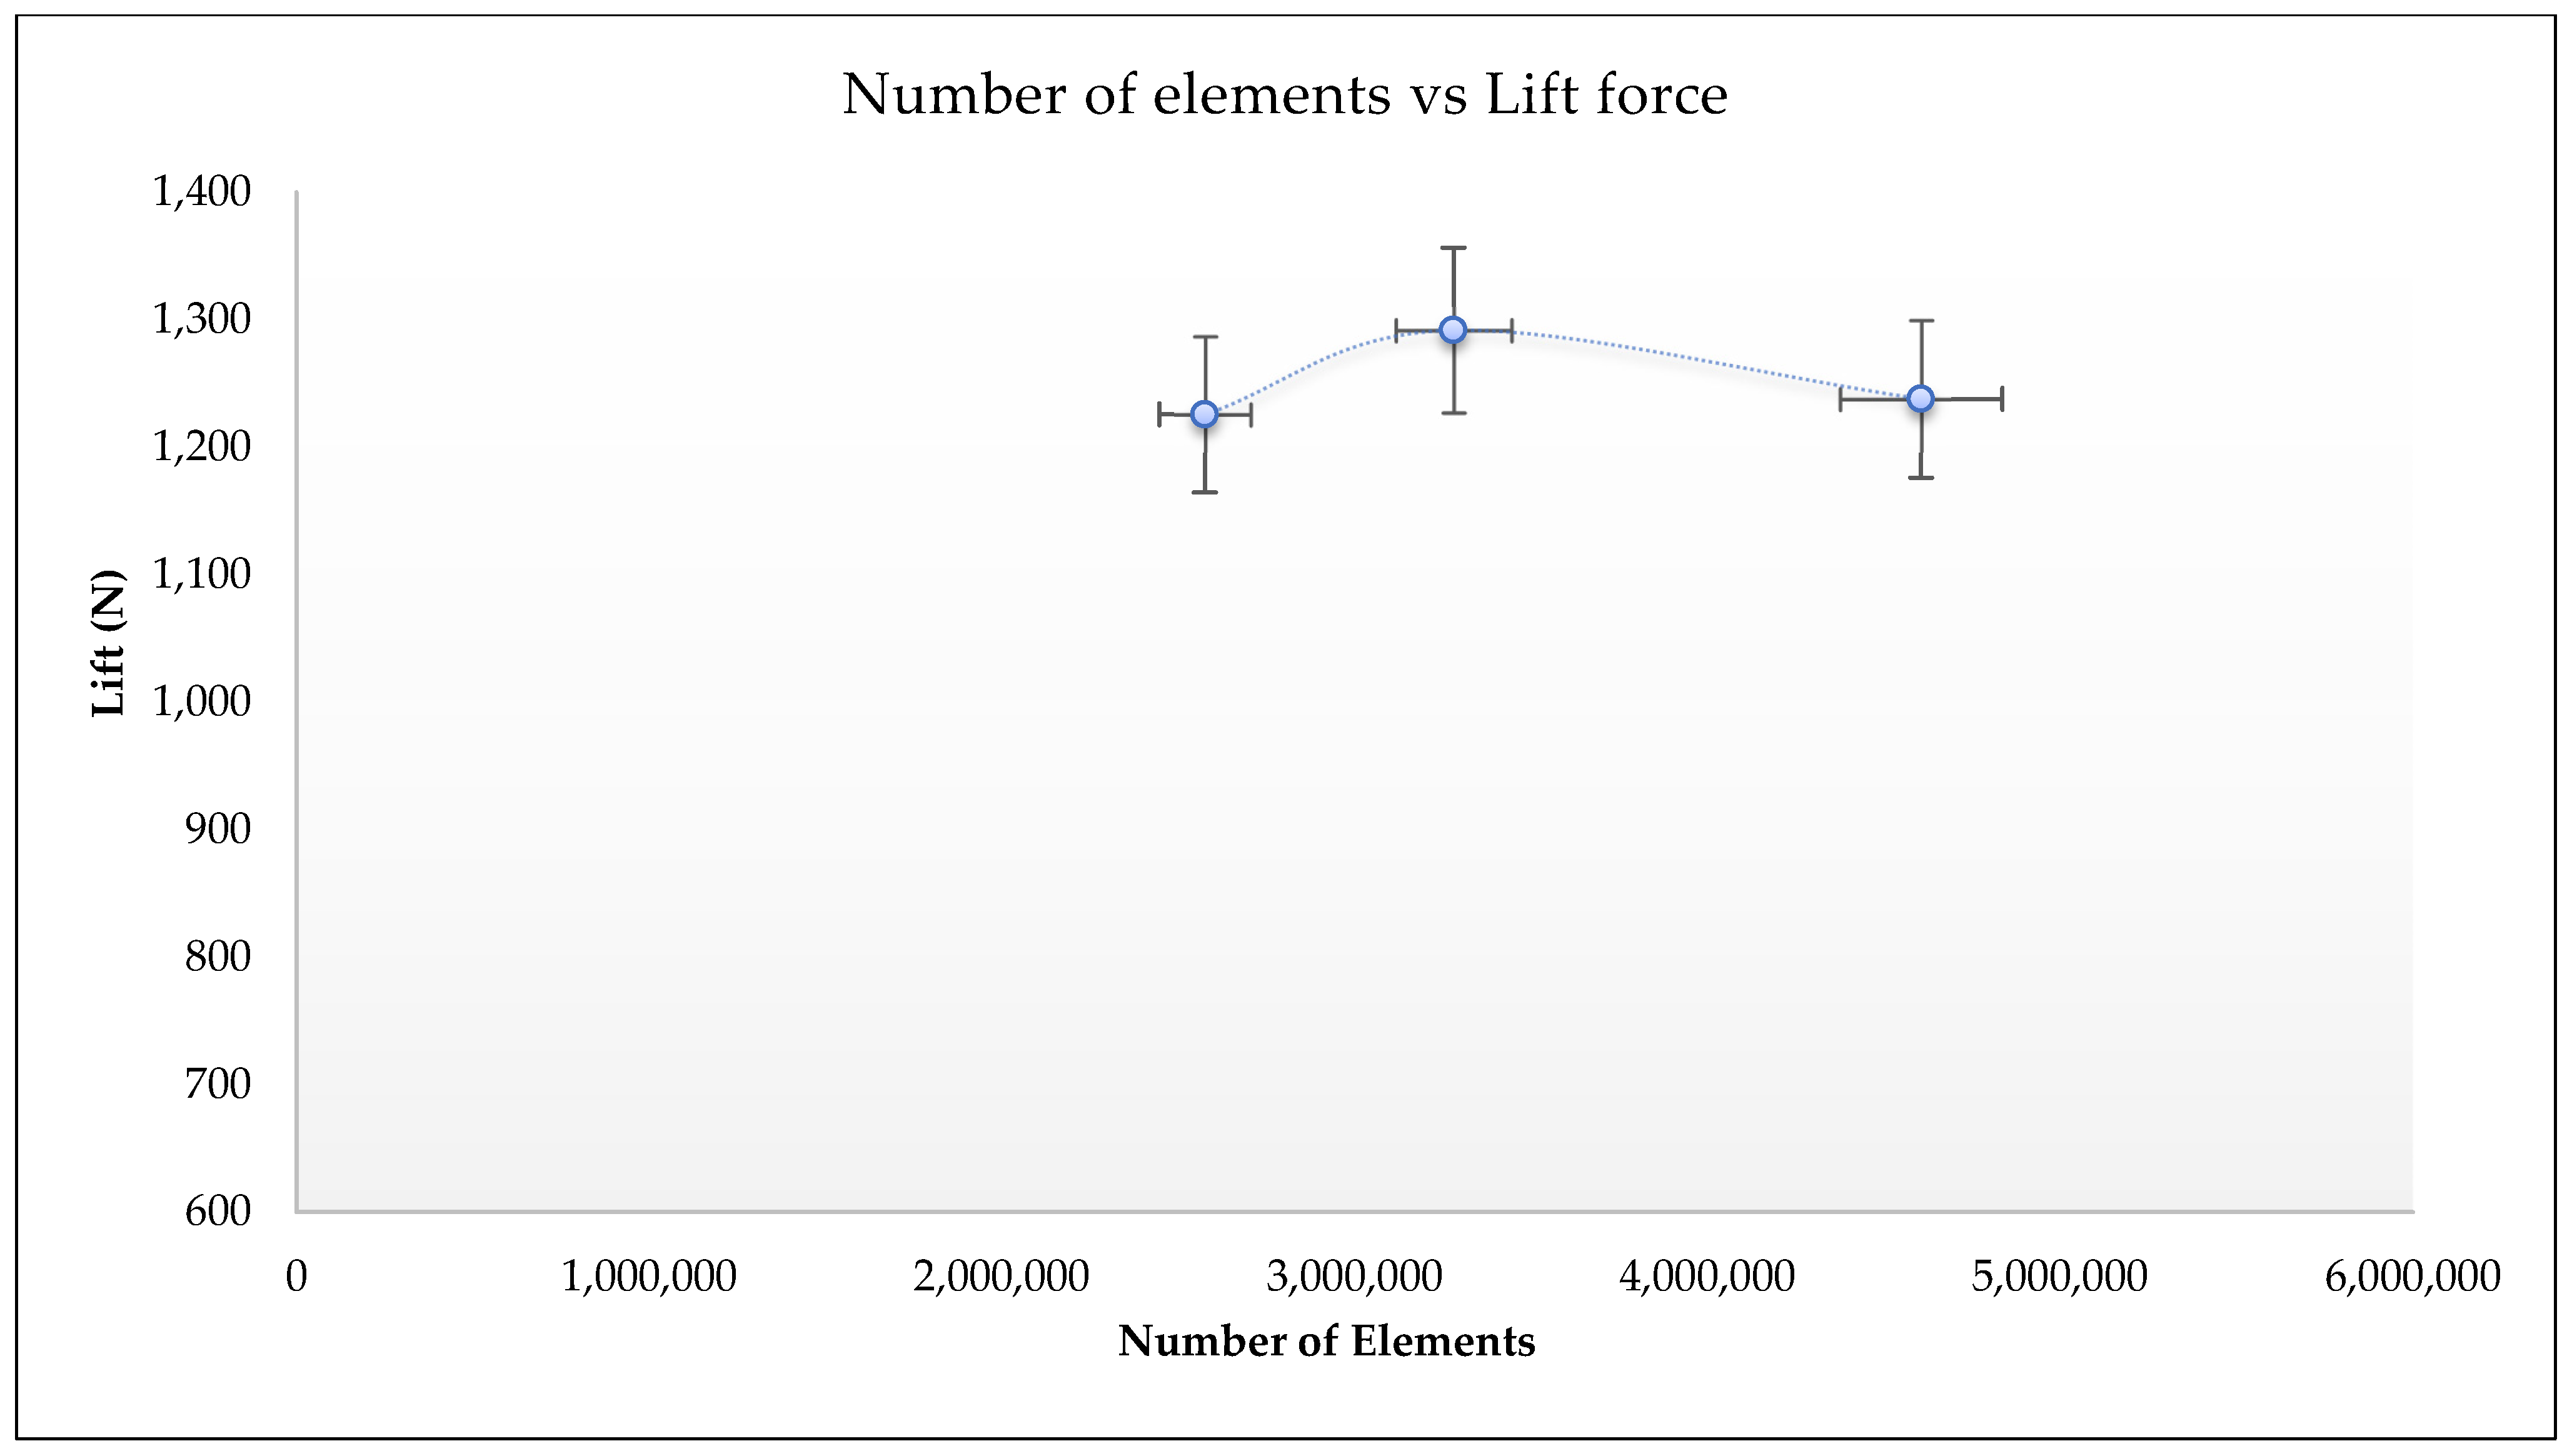
For the developed model of the falcon-inspired flying wing body (NIP-3), the grid sensitivity test is performed to analyze the variation in resulting parameters when changing the mesh details. The objective of this study is to choose the lowest possible number of elements for the mesh process, while maintaining no compromise to the aerodynamic values obtained. For this, three cases of grid study are performed, with 25,75,282, 32,79,982 and 46,05,827 numbers of elements, respectively. The pressure and velocity contours of the first, second and third cases are revealed in Figure 31, Figure 32 and Figure 33. For these cases, the respective Lift and Drag values are plotted and shown in Figure 34 and Figure 35.

Figure 31.
Pressure contour on flying wing UAV-NIP-3—Case-1.
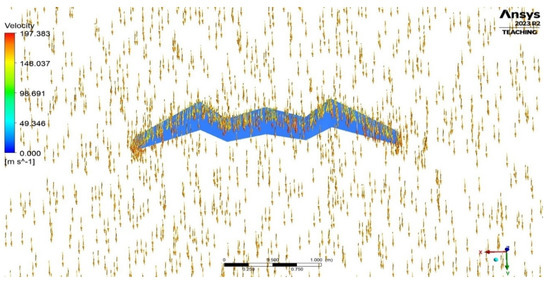
Figure 32.
Velocity vector on flying wing UAV-NIP-3—Case-2.

Figure 33.
Pressure contour around flying wing UAV-NIP-3—Case-3.

Figure 34.
Graphical representation of Lift produced for various number of elements.
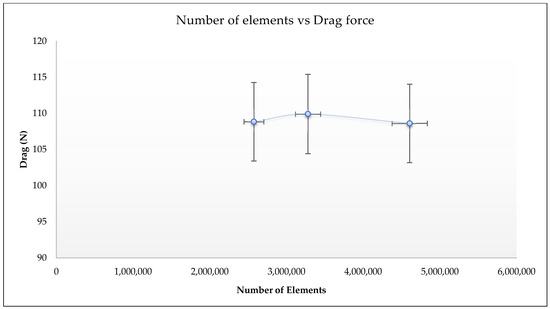
Figure 35.
Graphical representation of Drag variations for various number of elements.
Case-1 with a lesser number of elements is proven to be both reliable and easier to simulate in terms of less computational time taken comparatively. So, 25,00,000 elements are approximately taken as the optimum number of elements for the meshing process and are used for the rest of the simulations carried out.
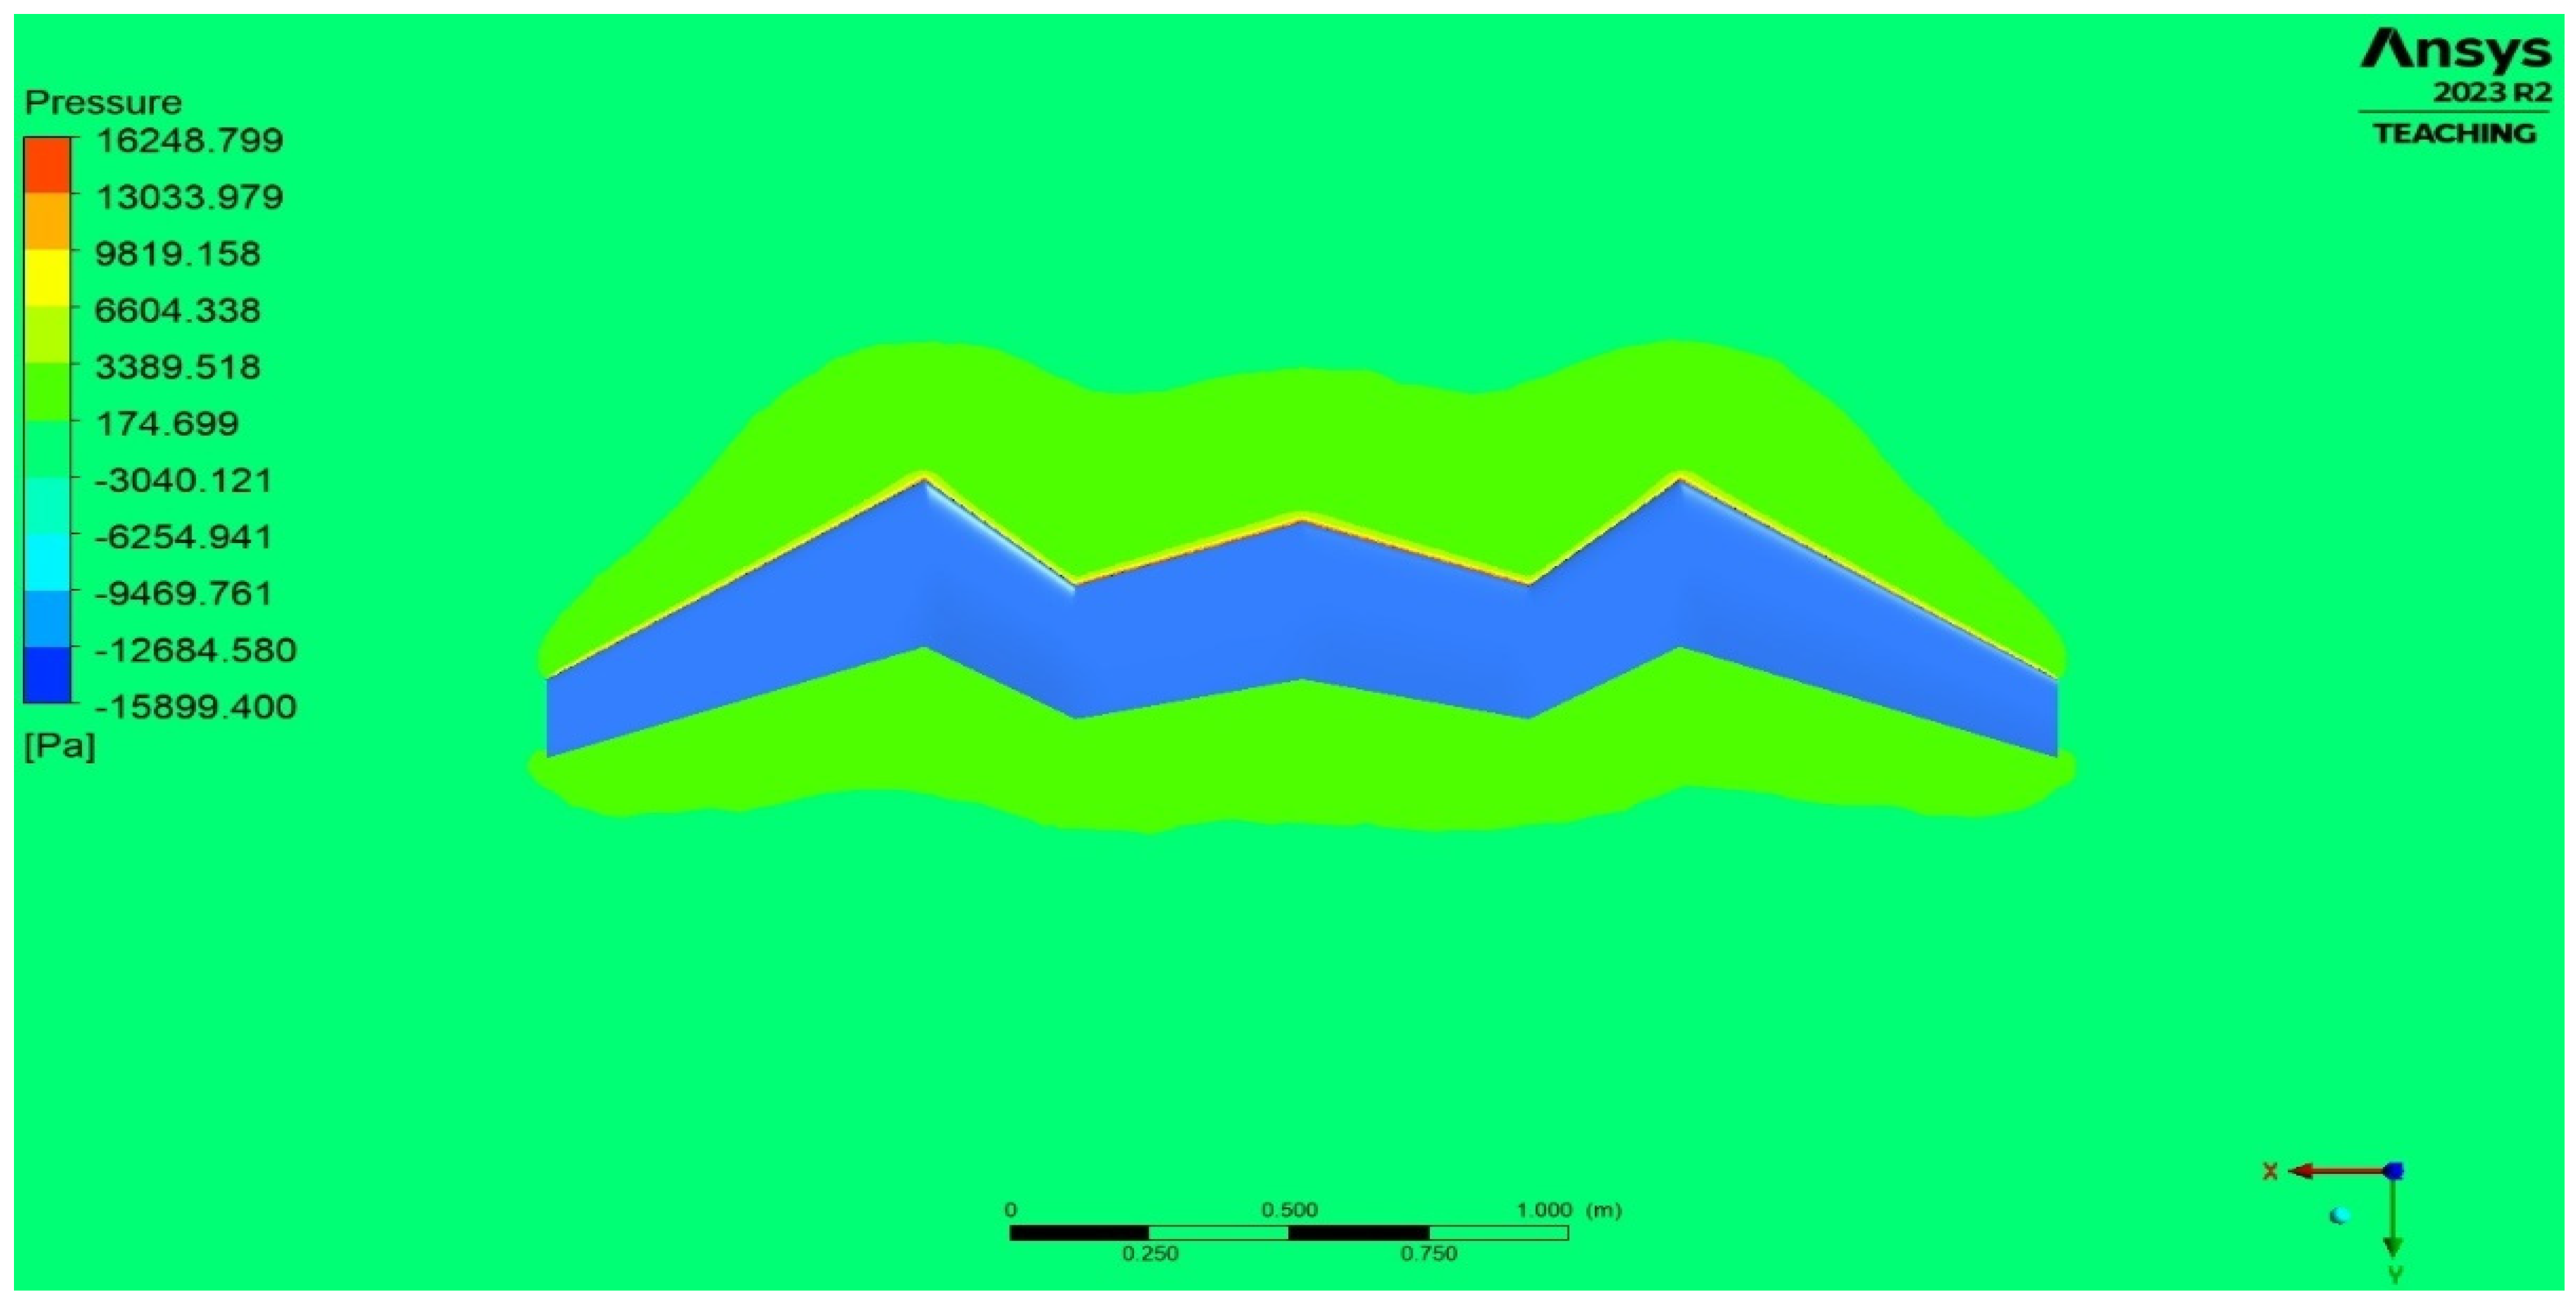
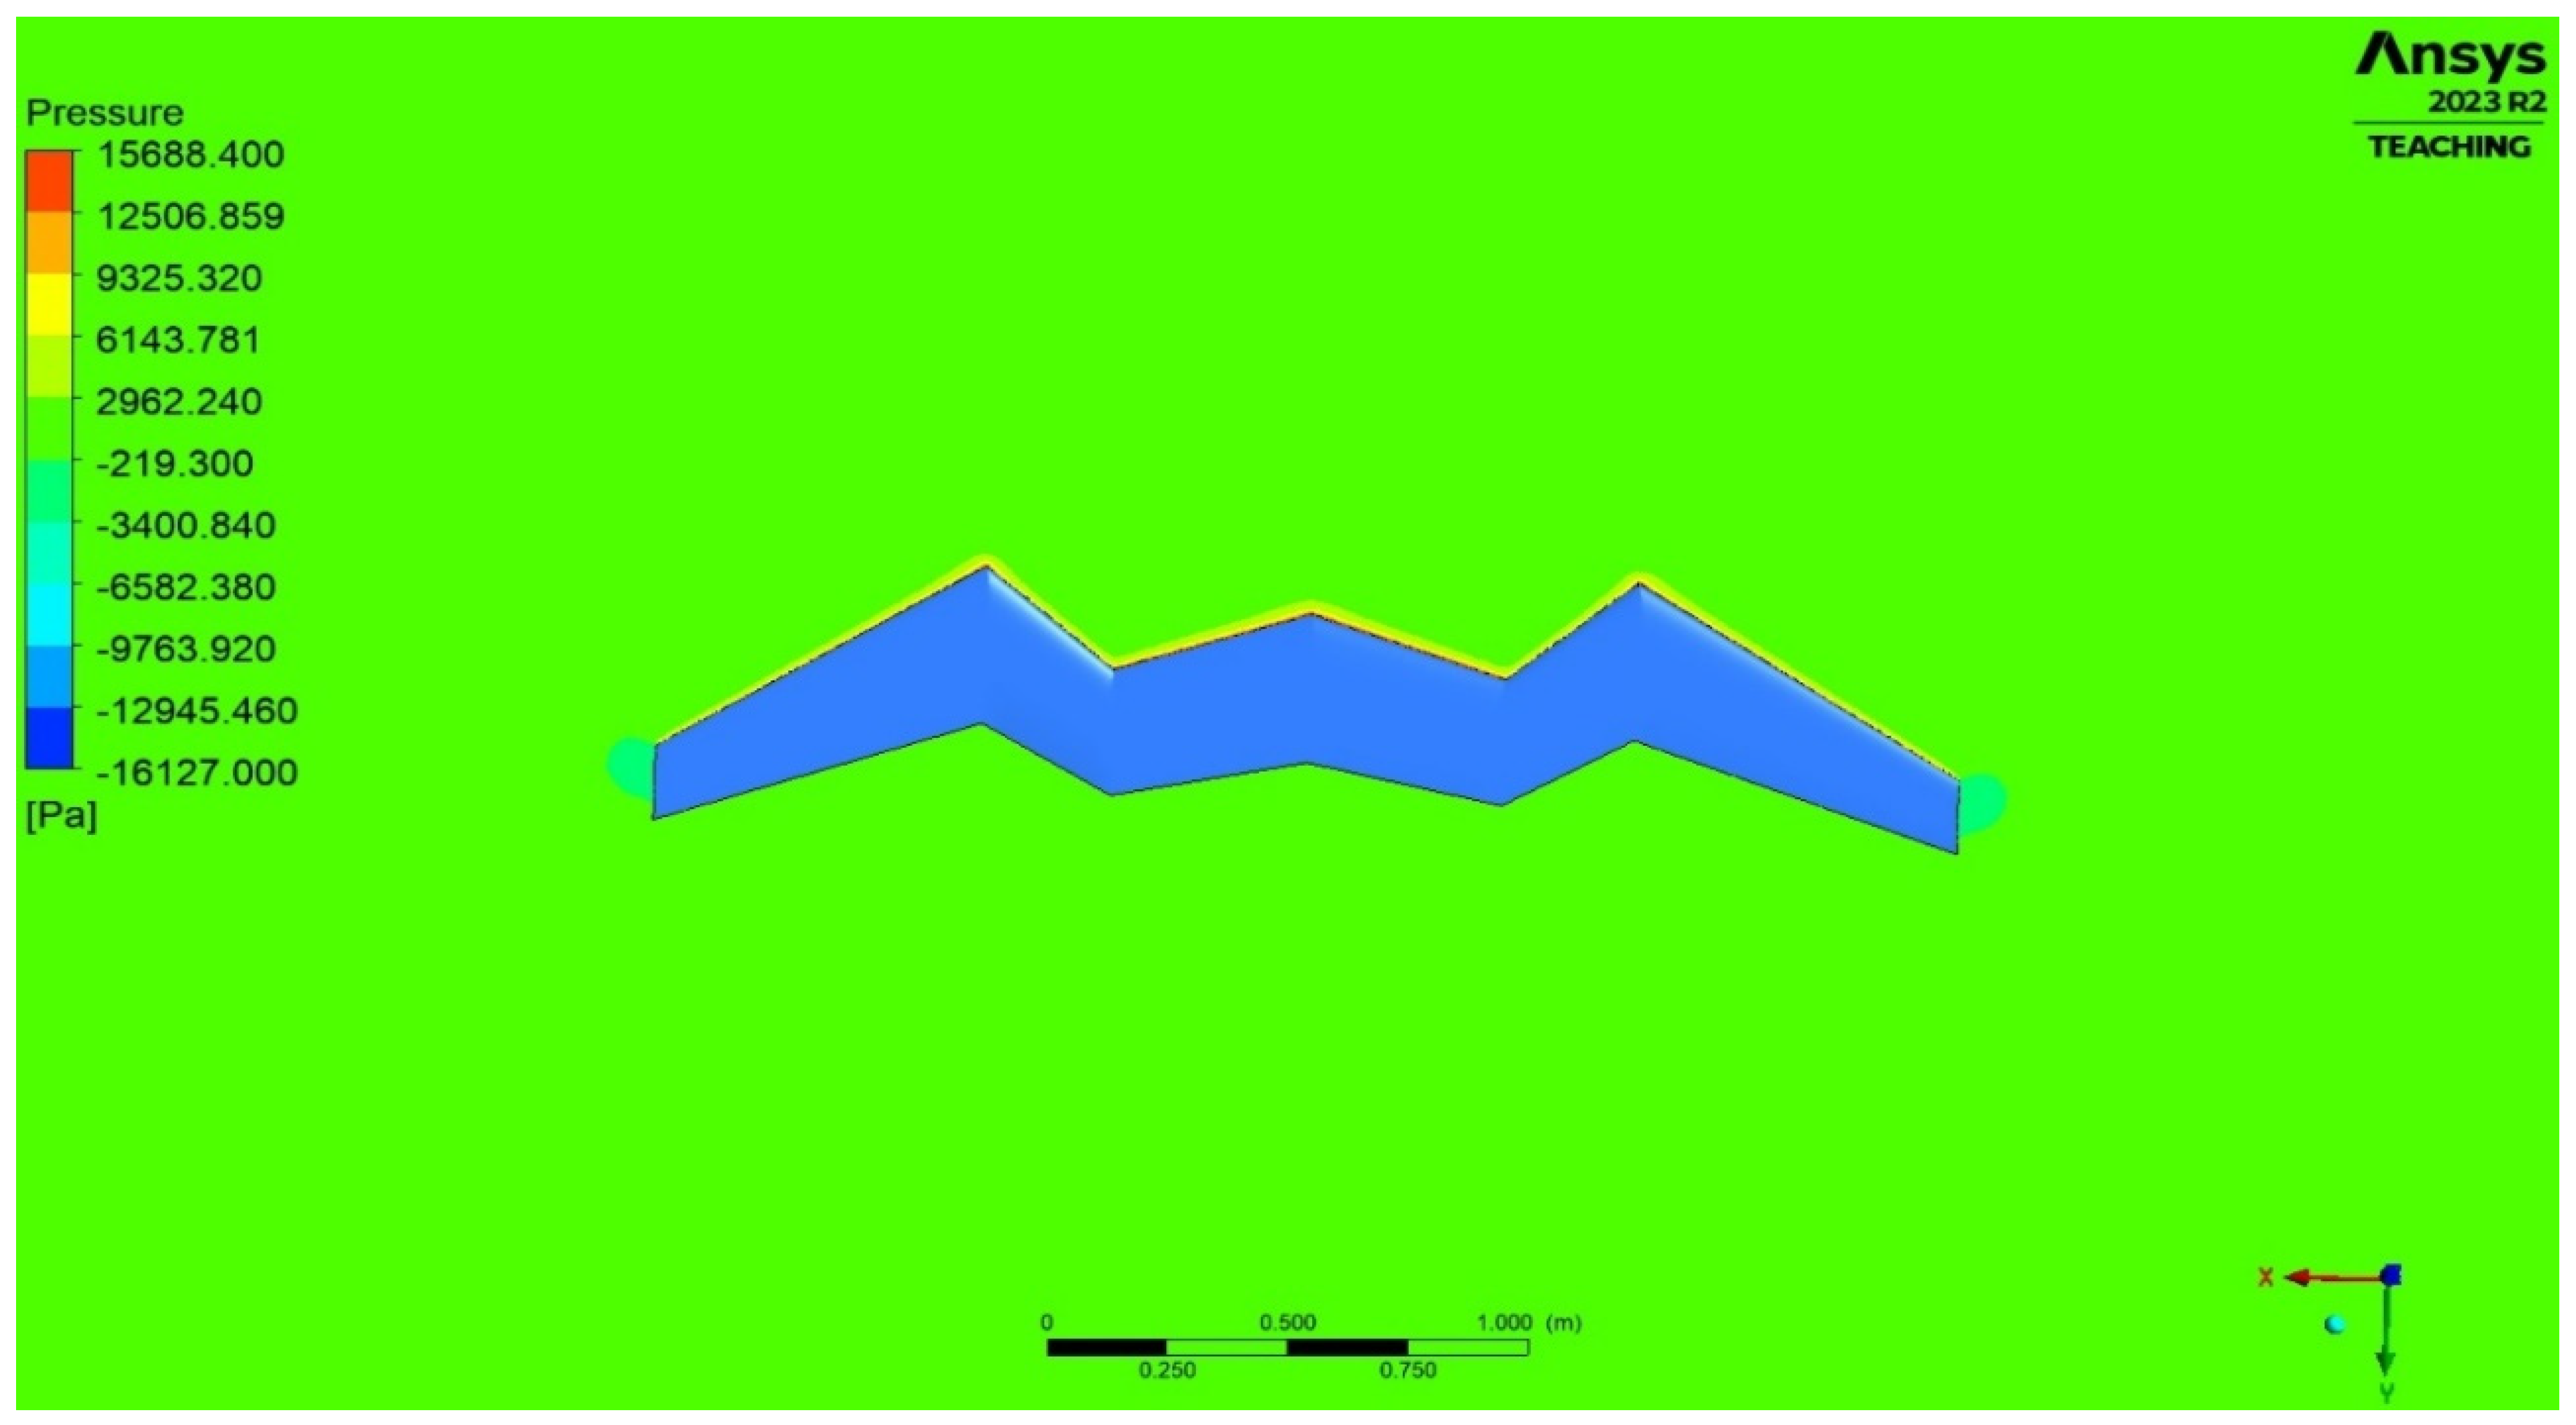
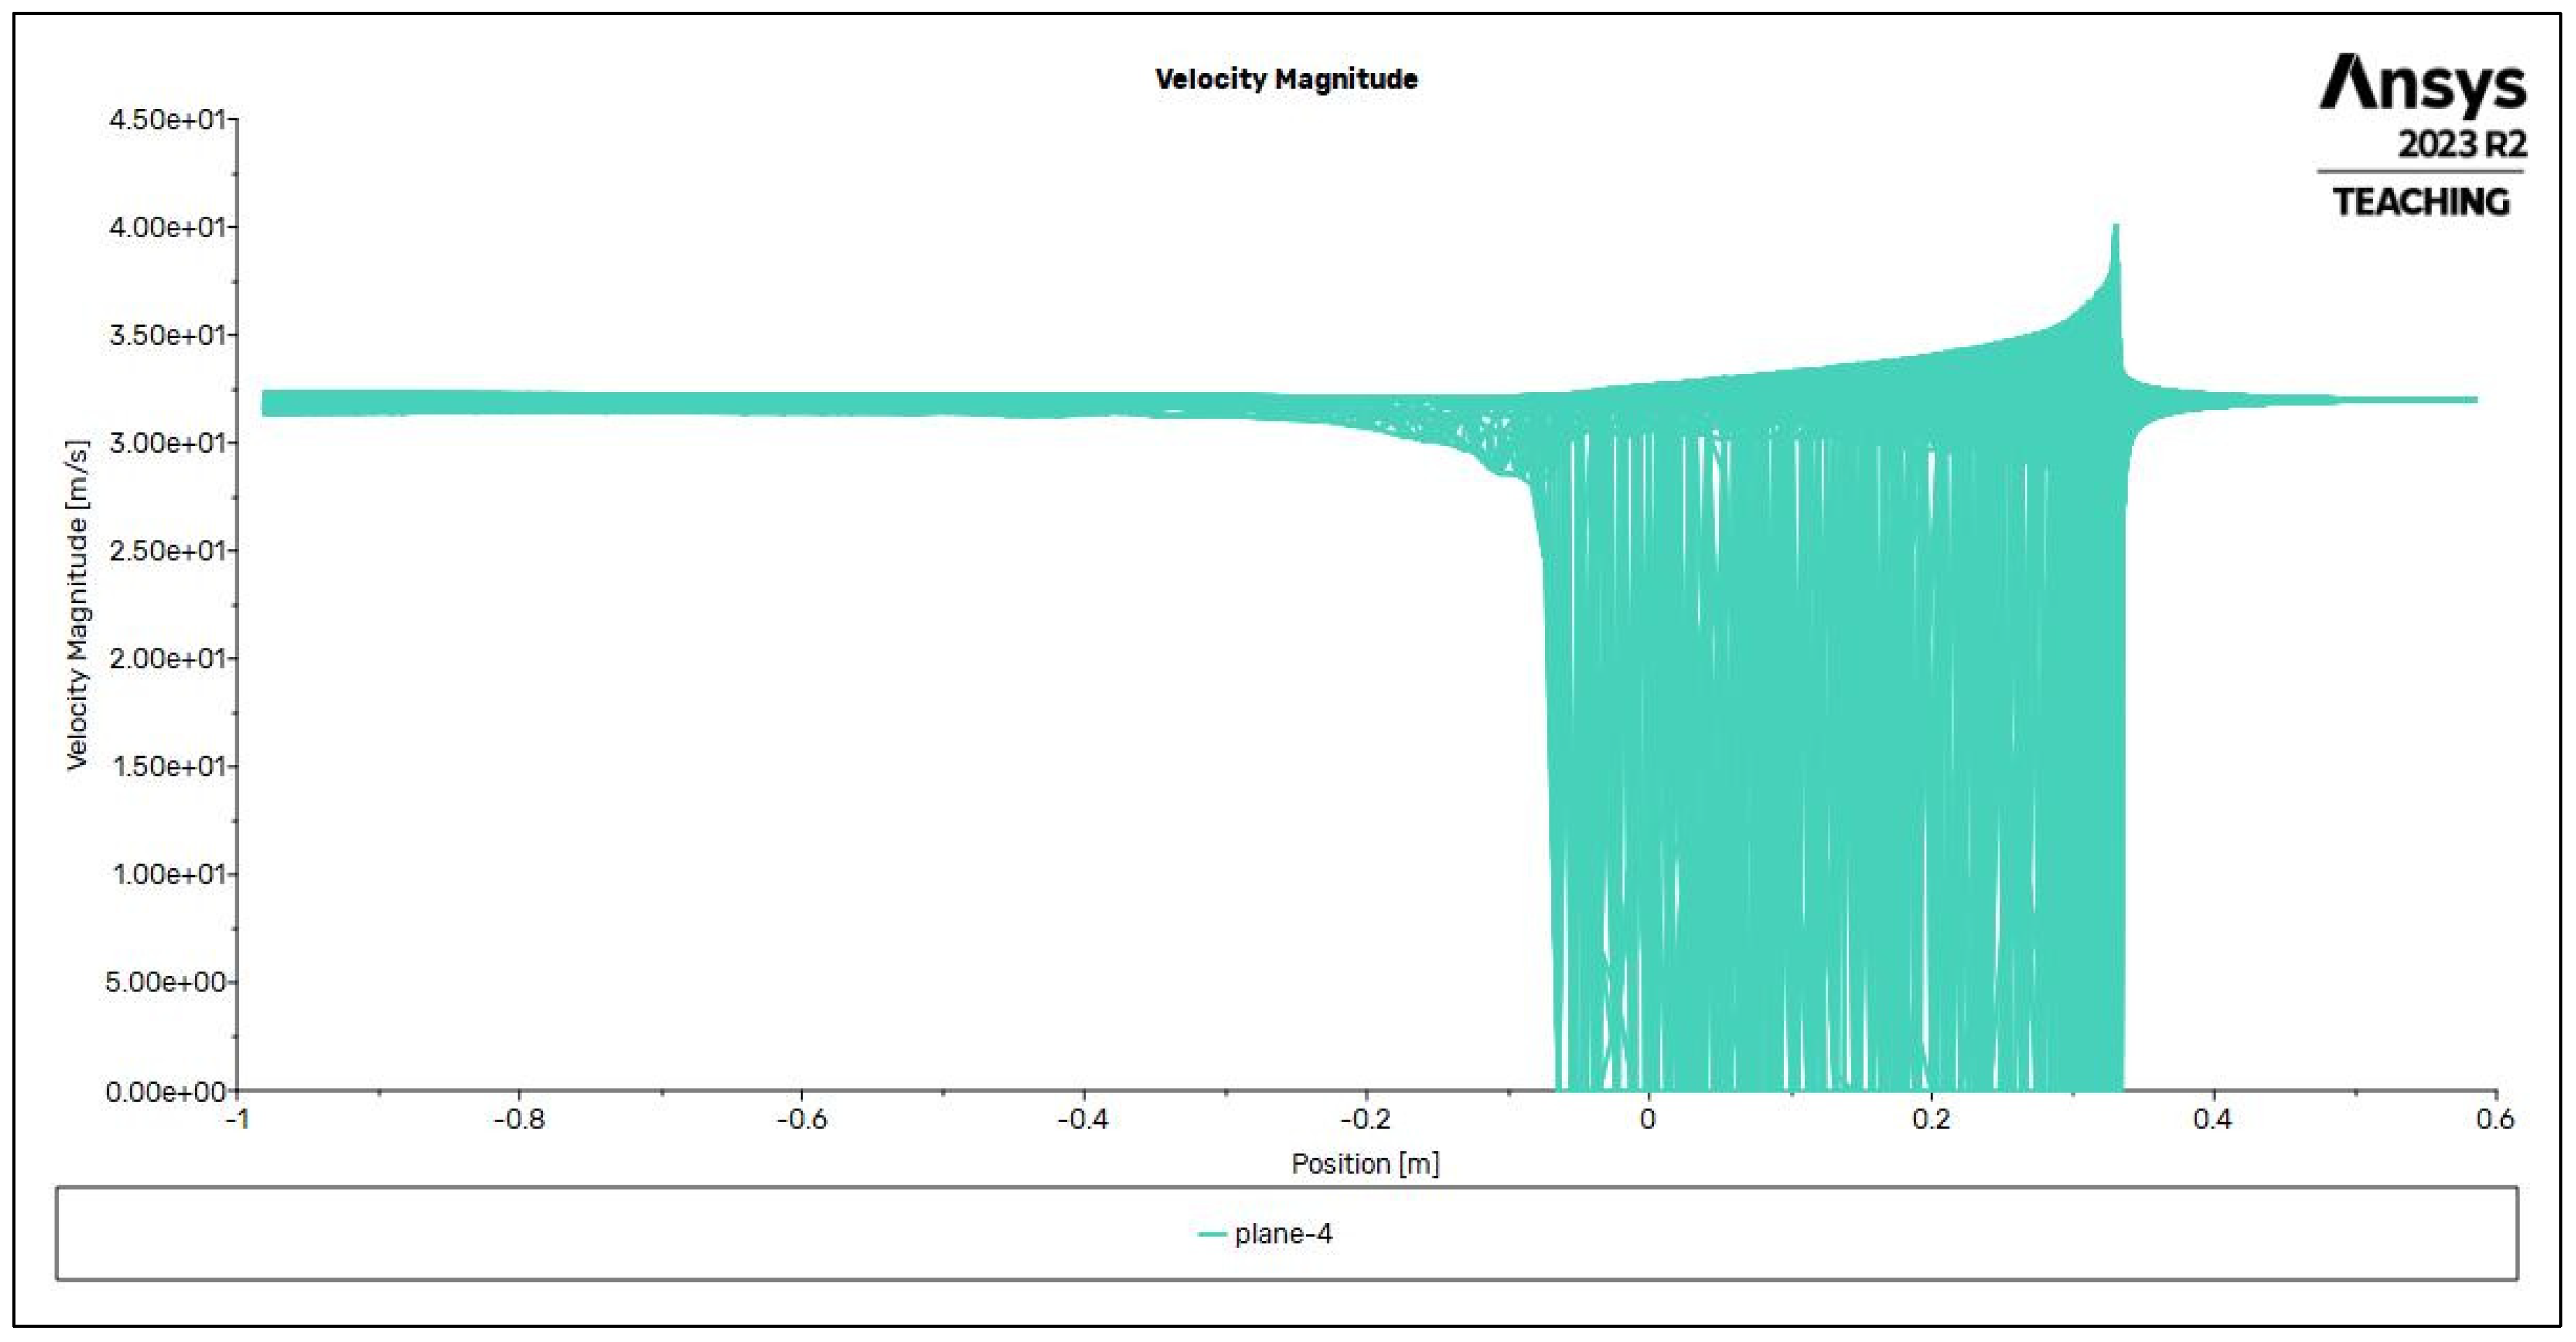
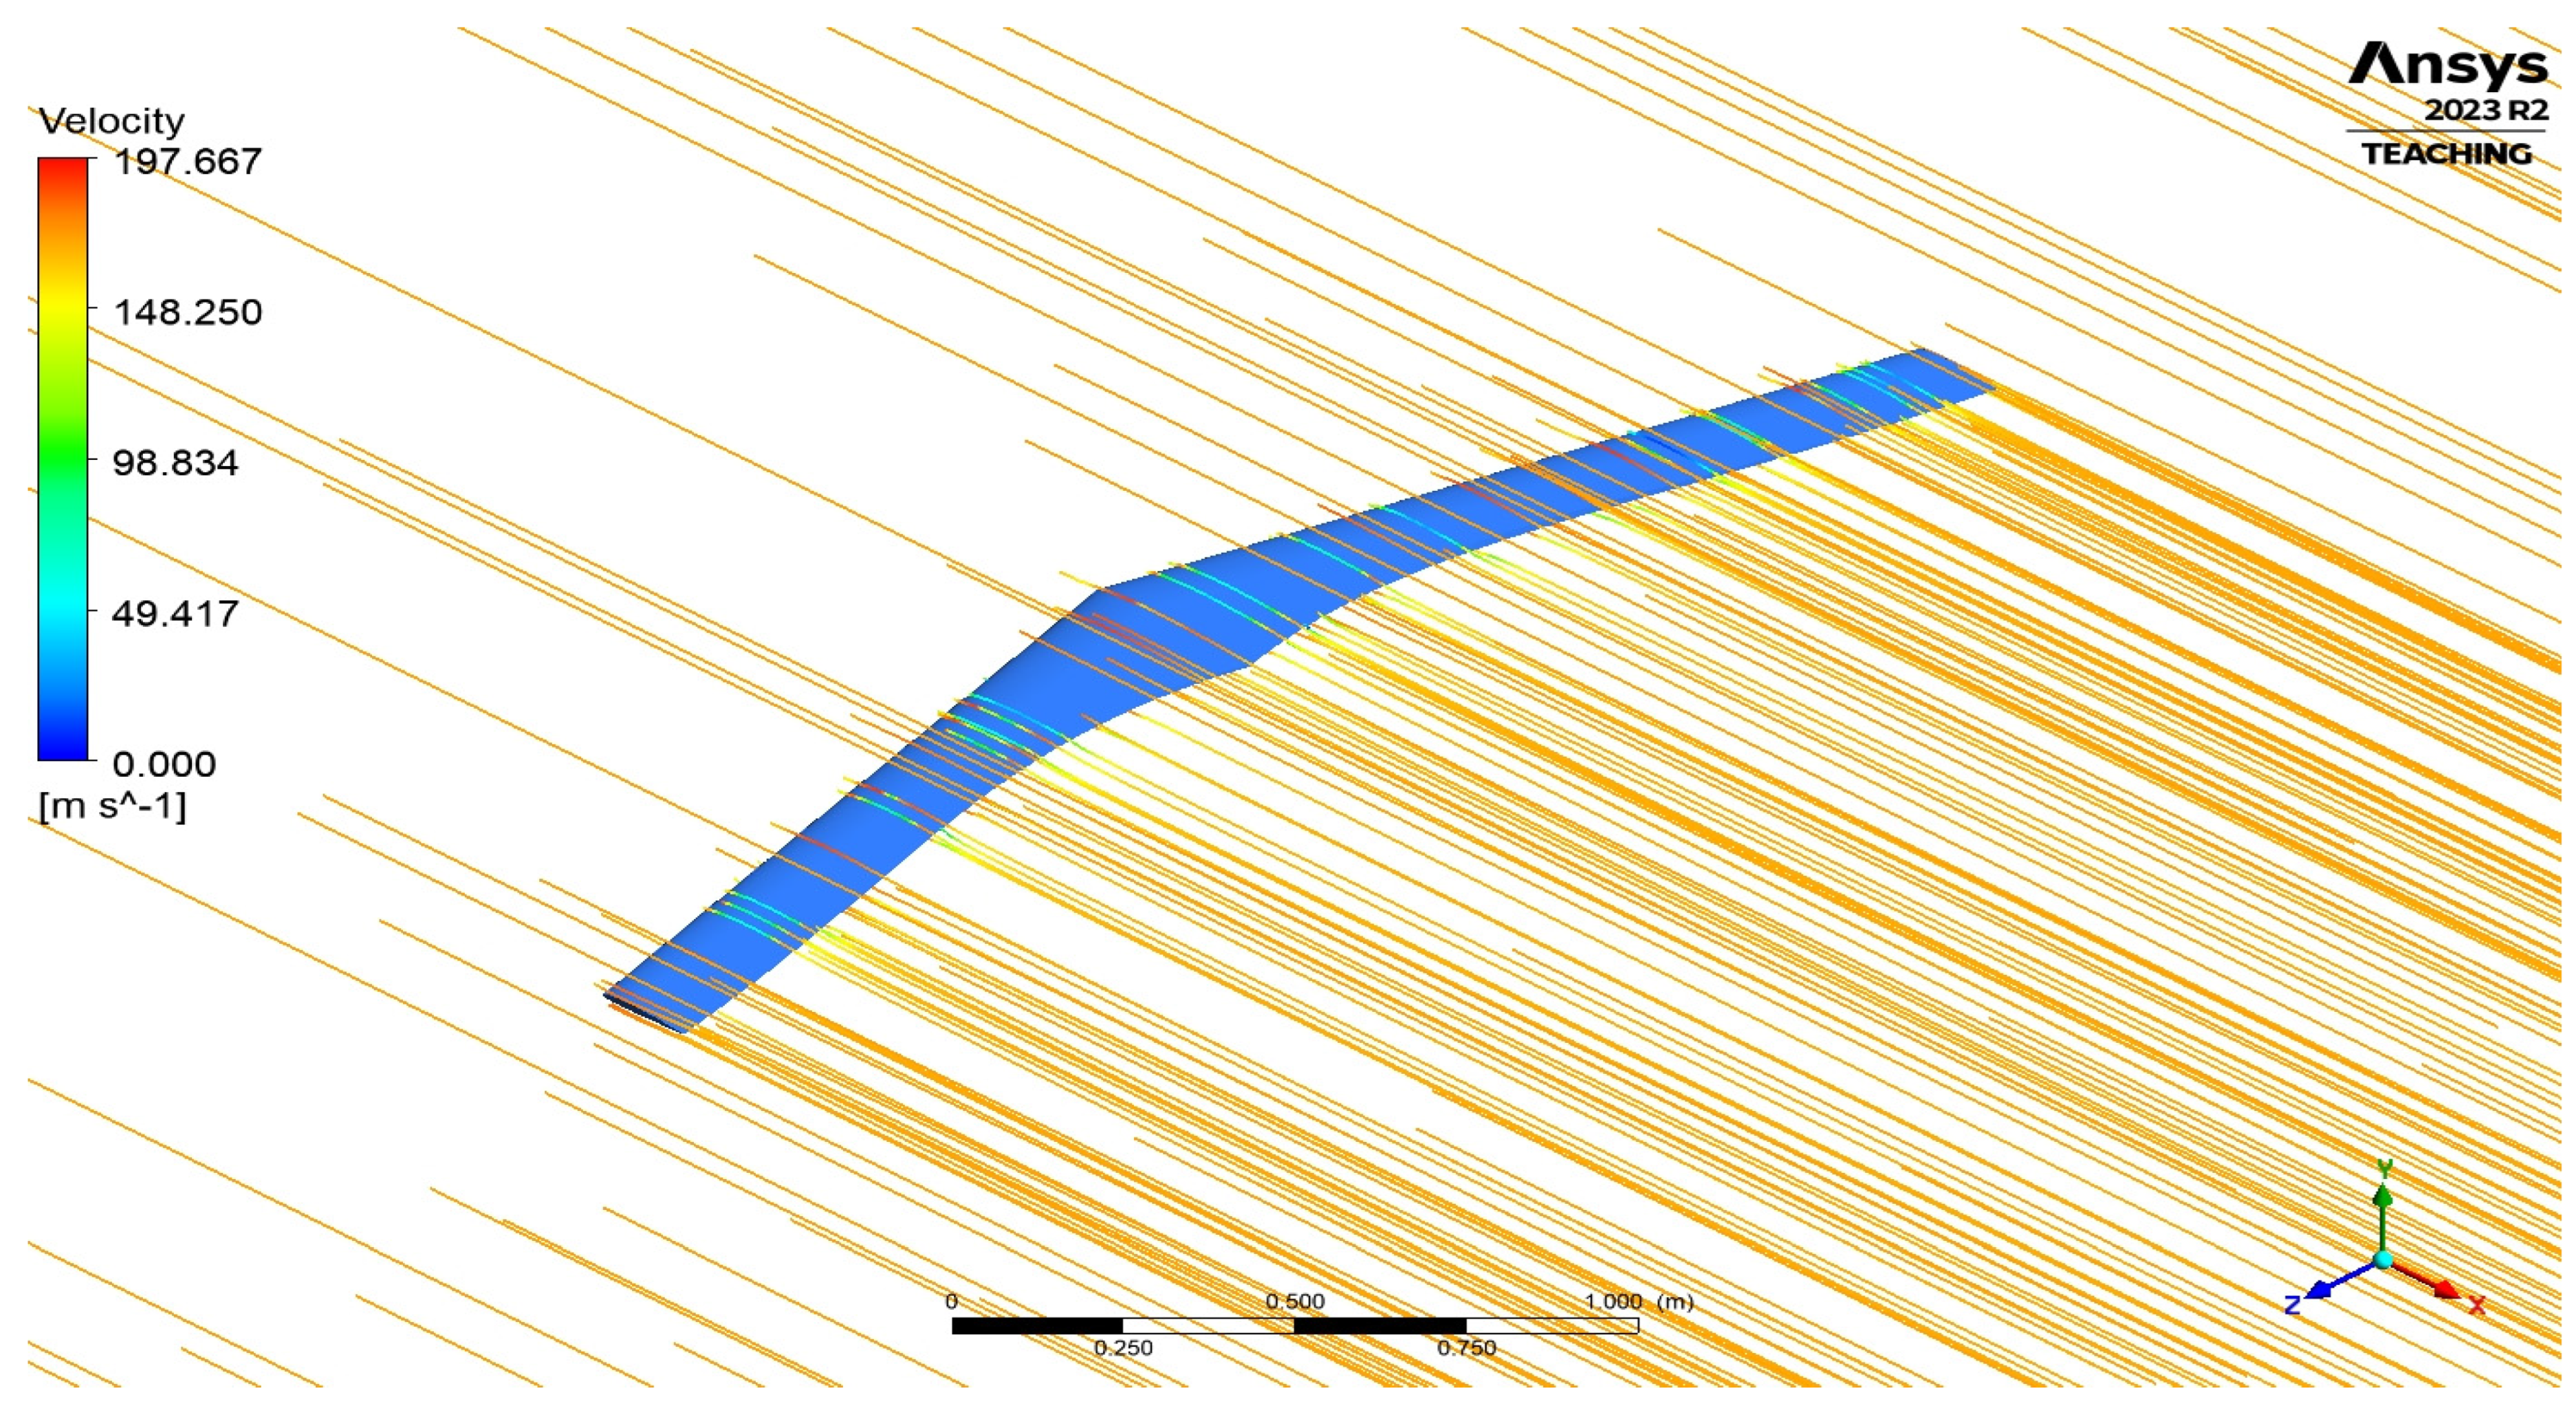
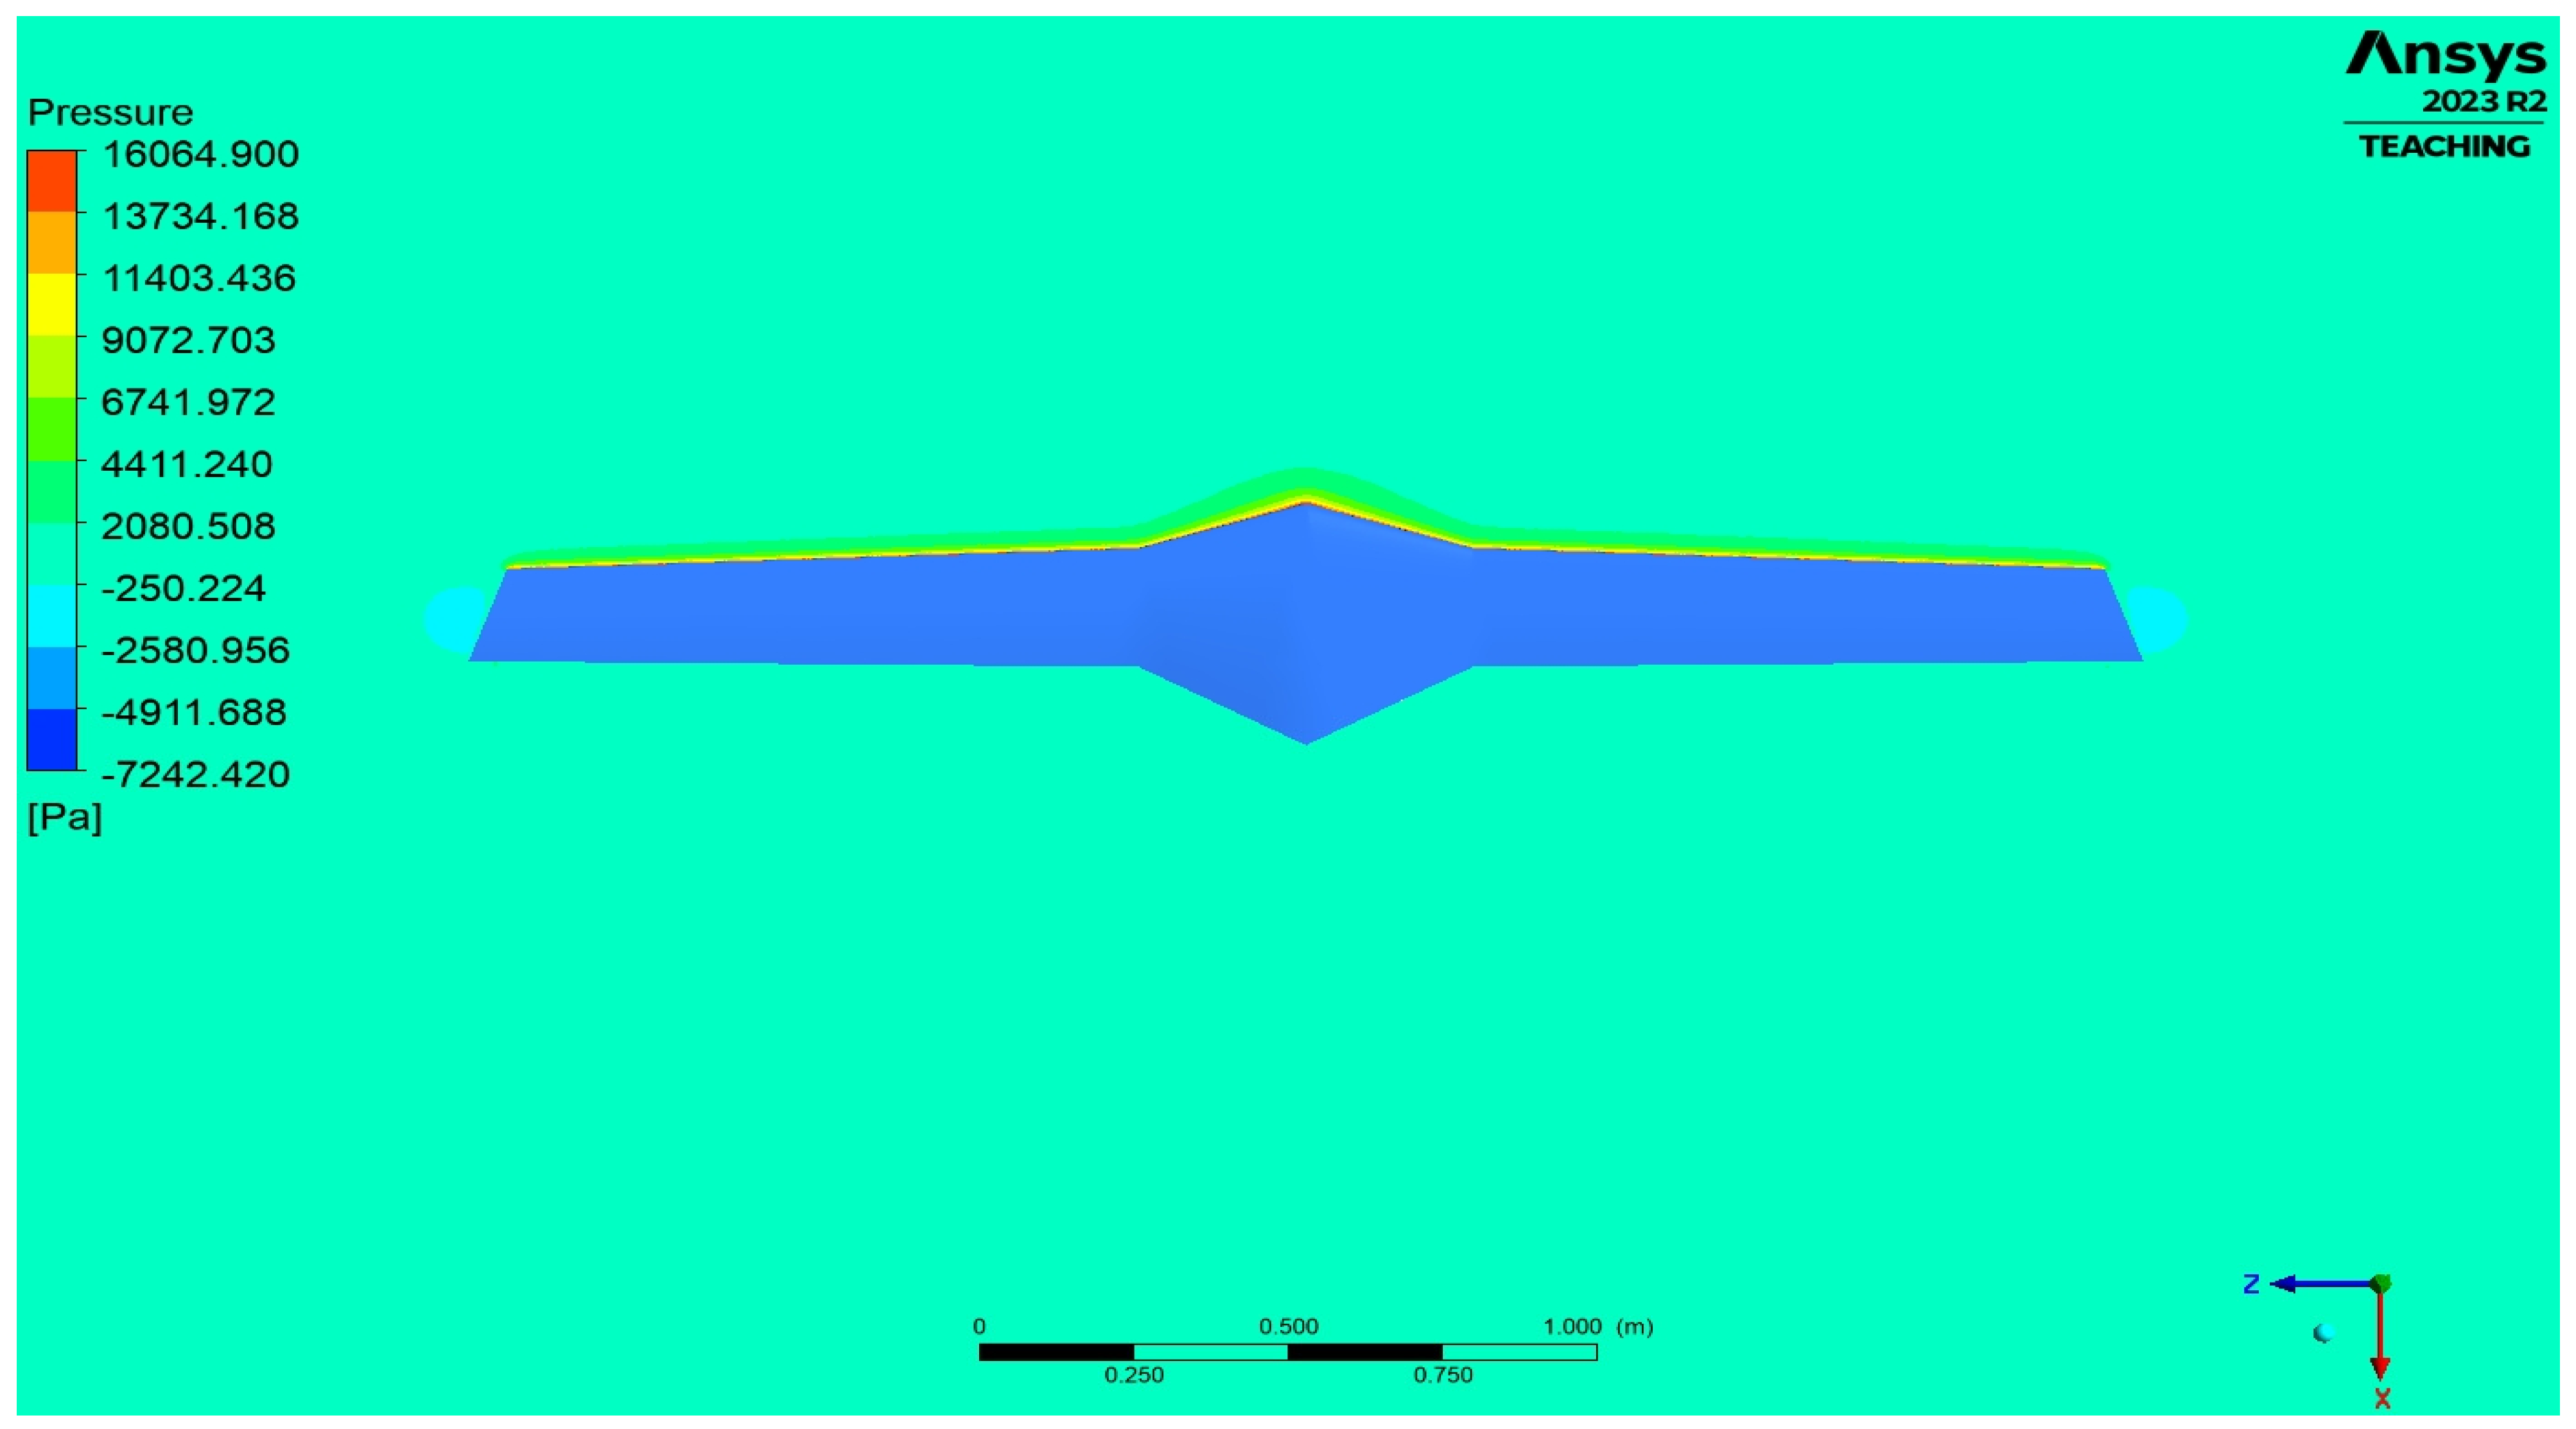
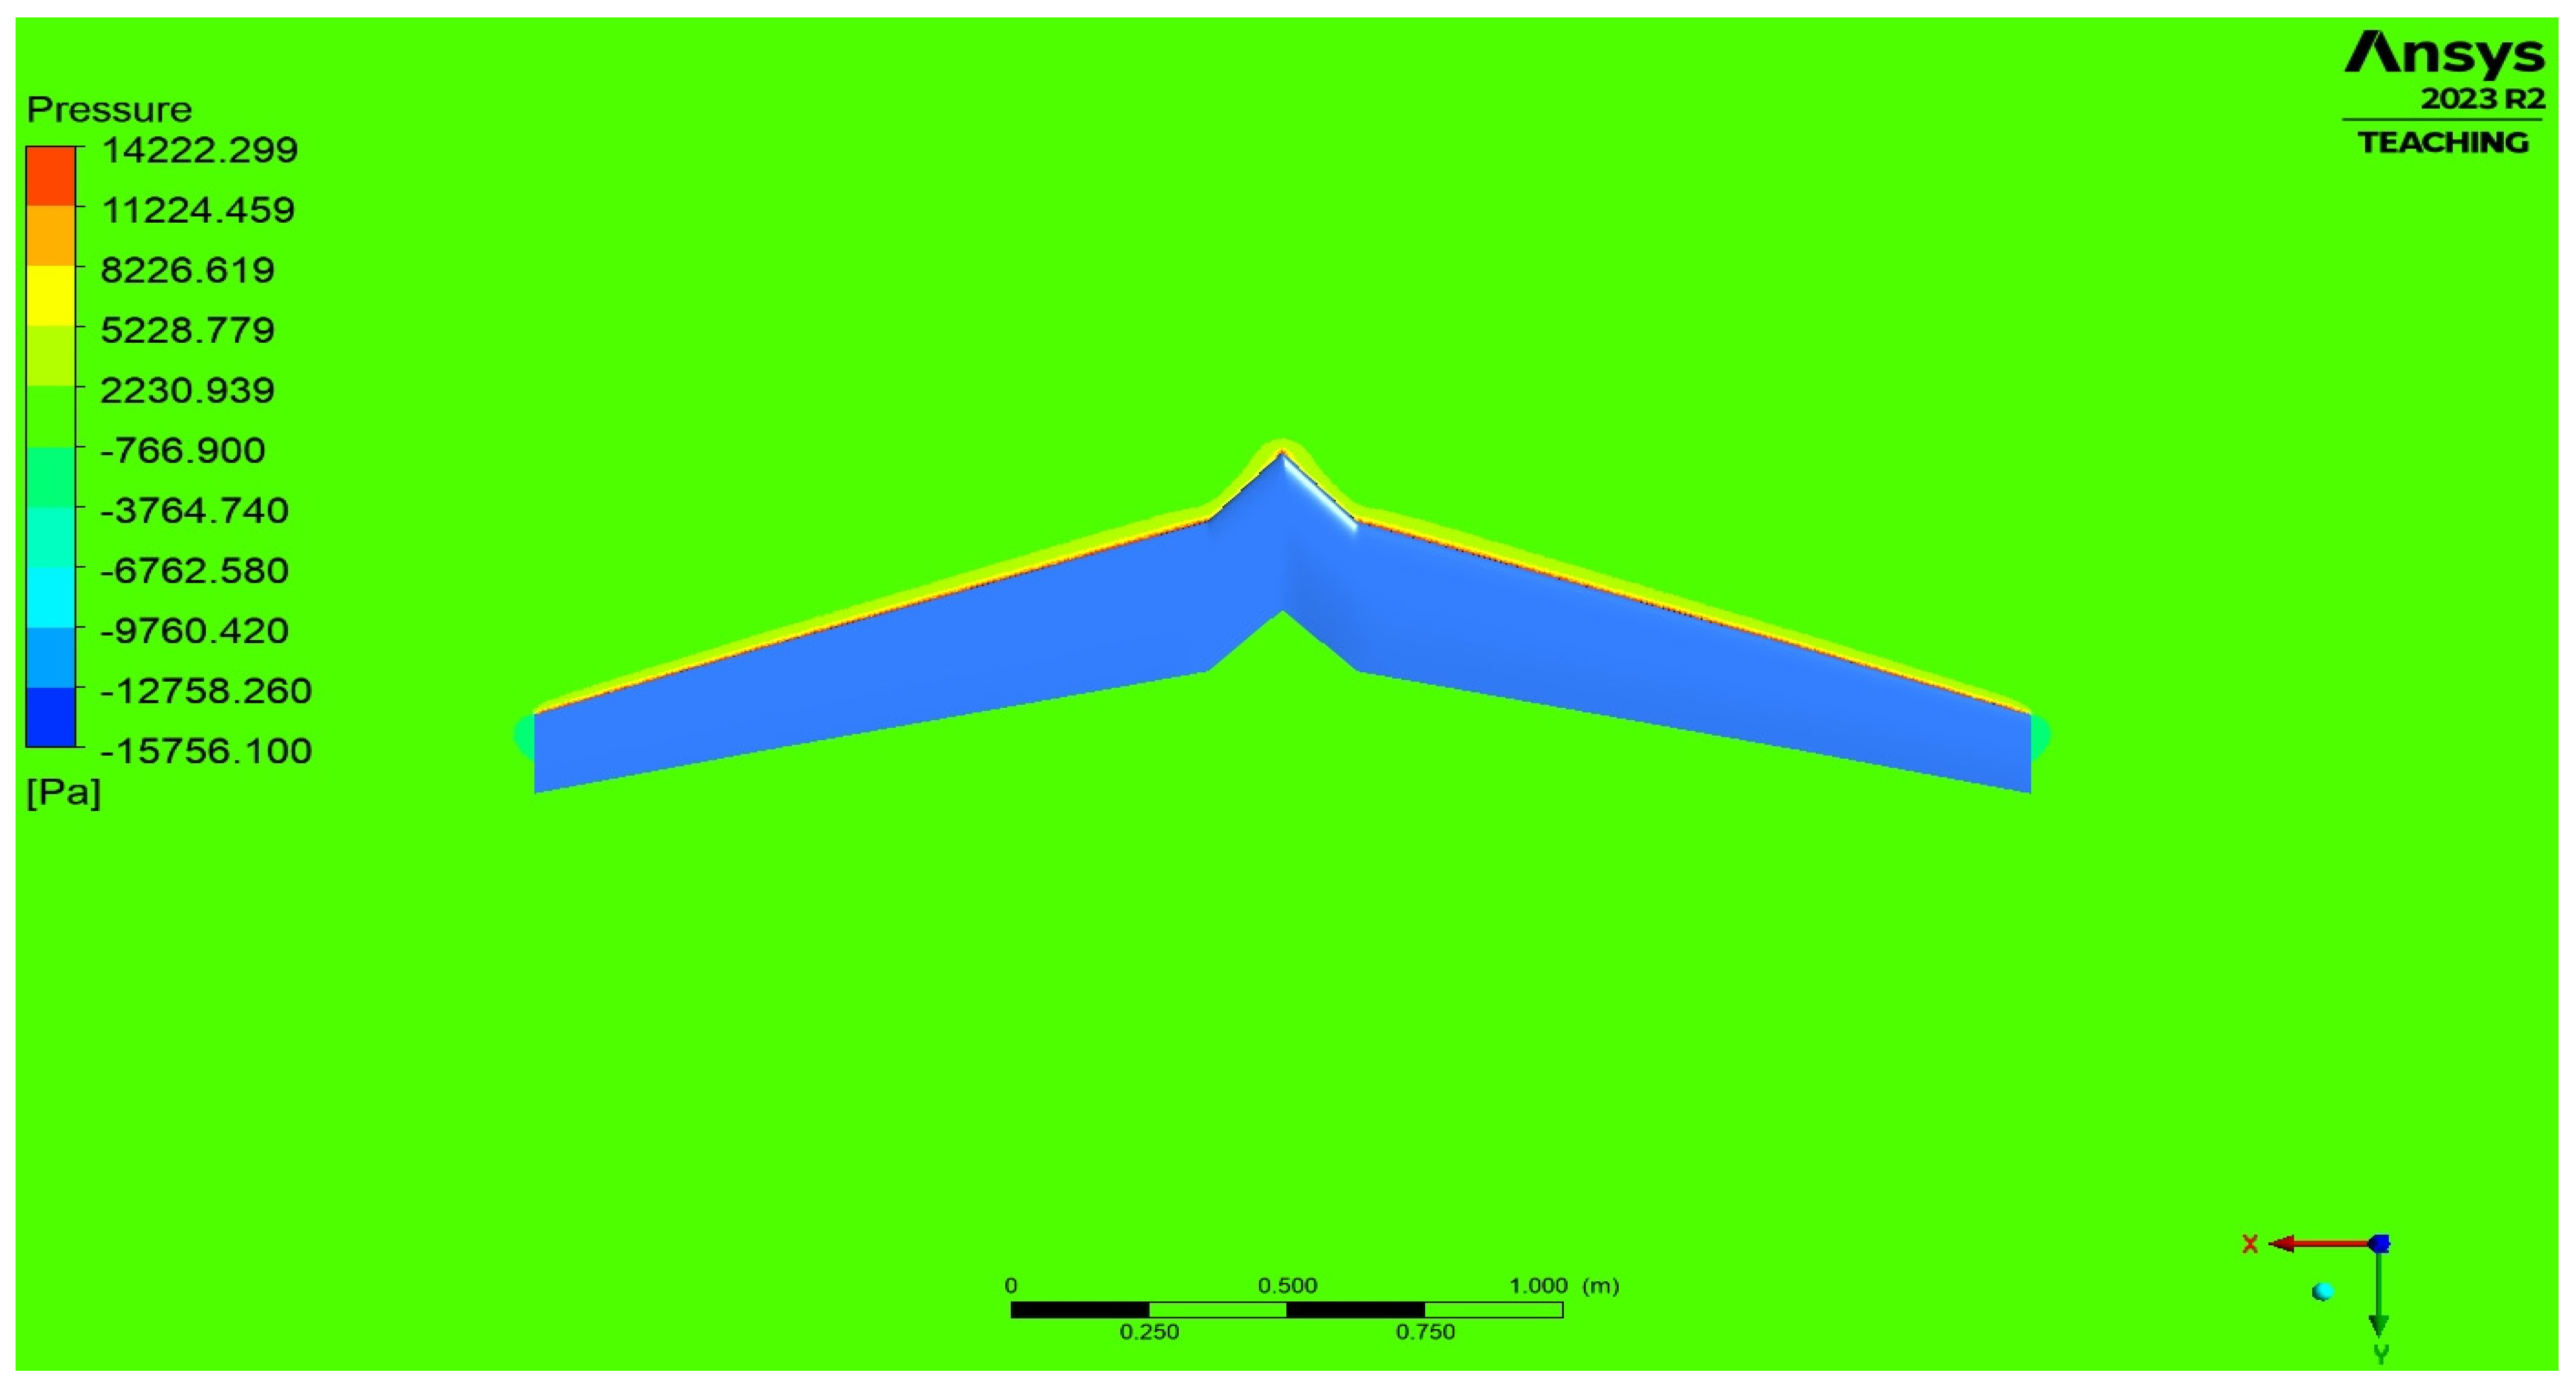
2.2.5. Experimental Validation
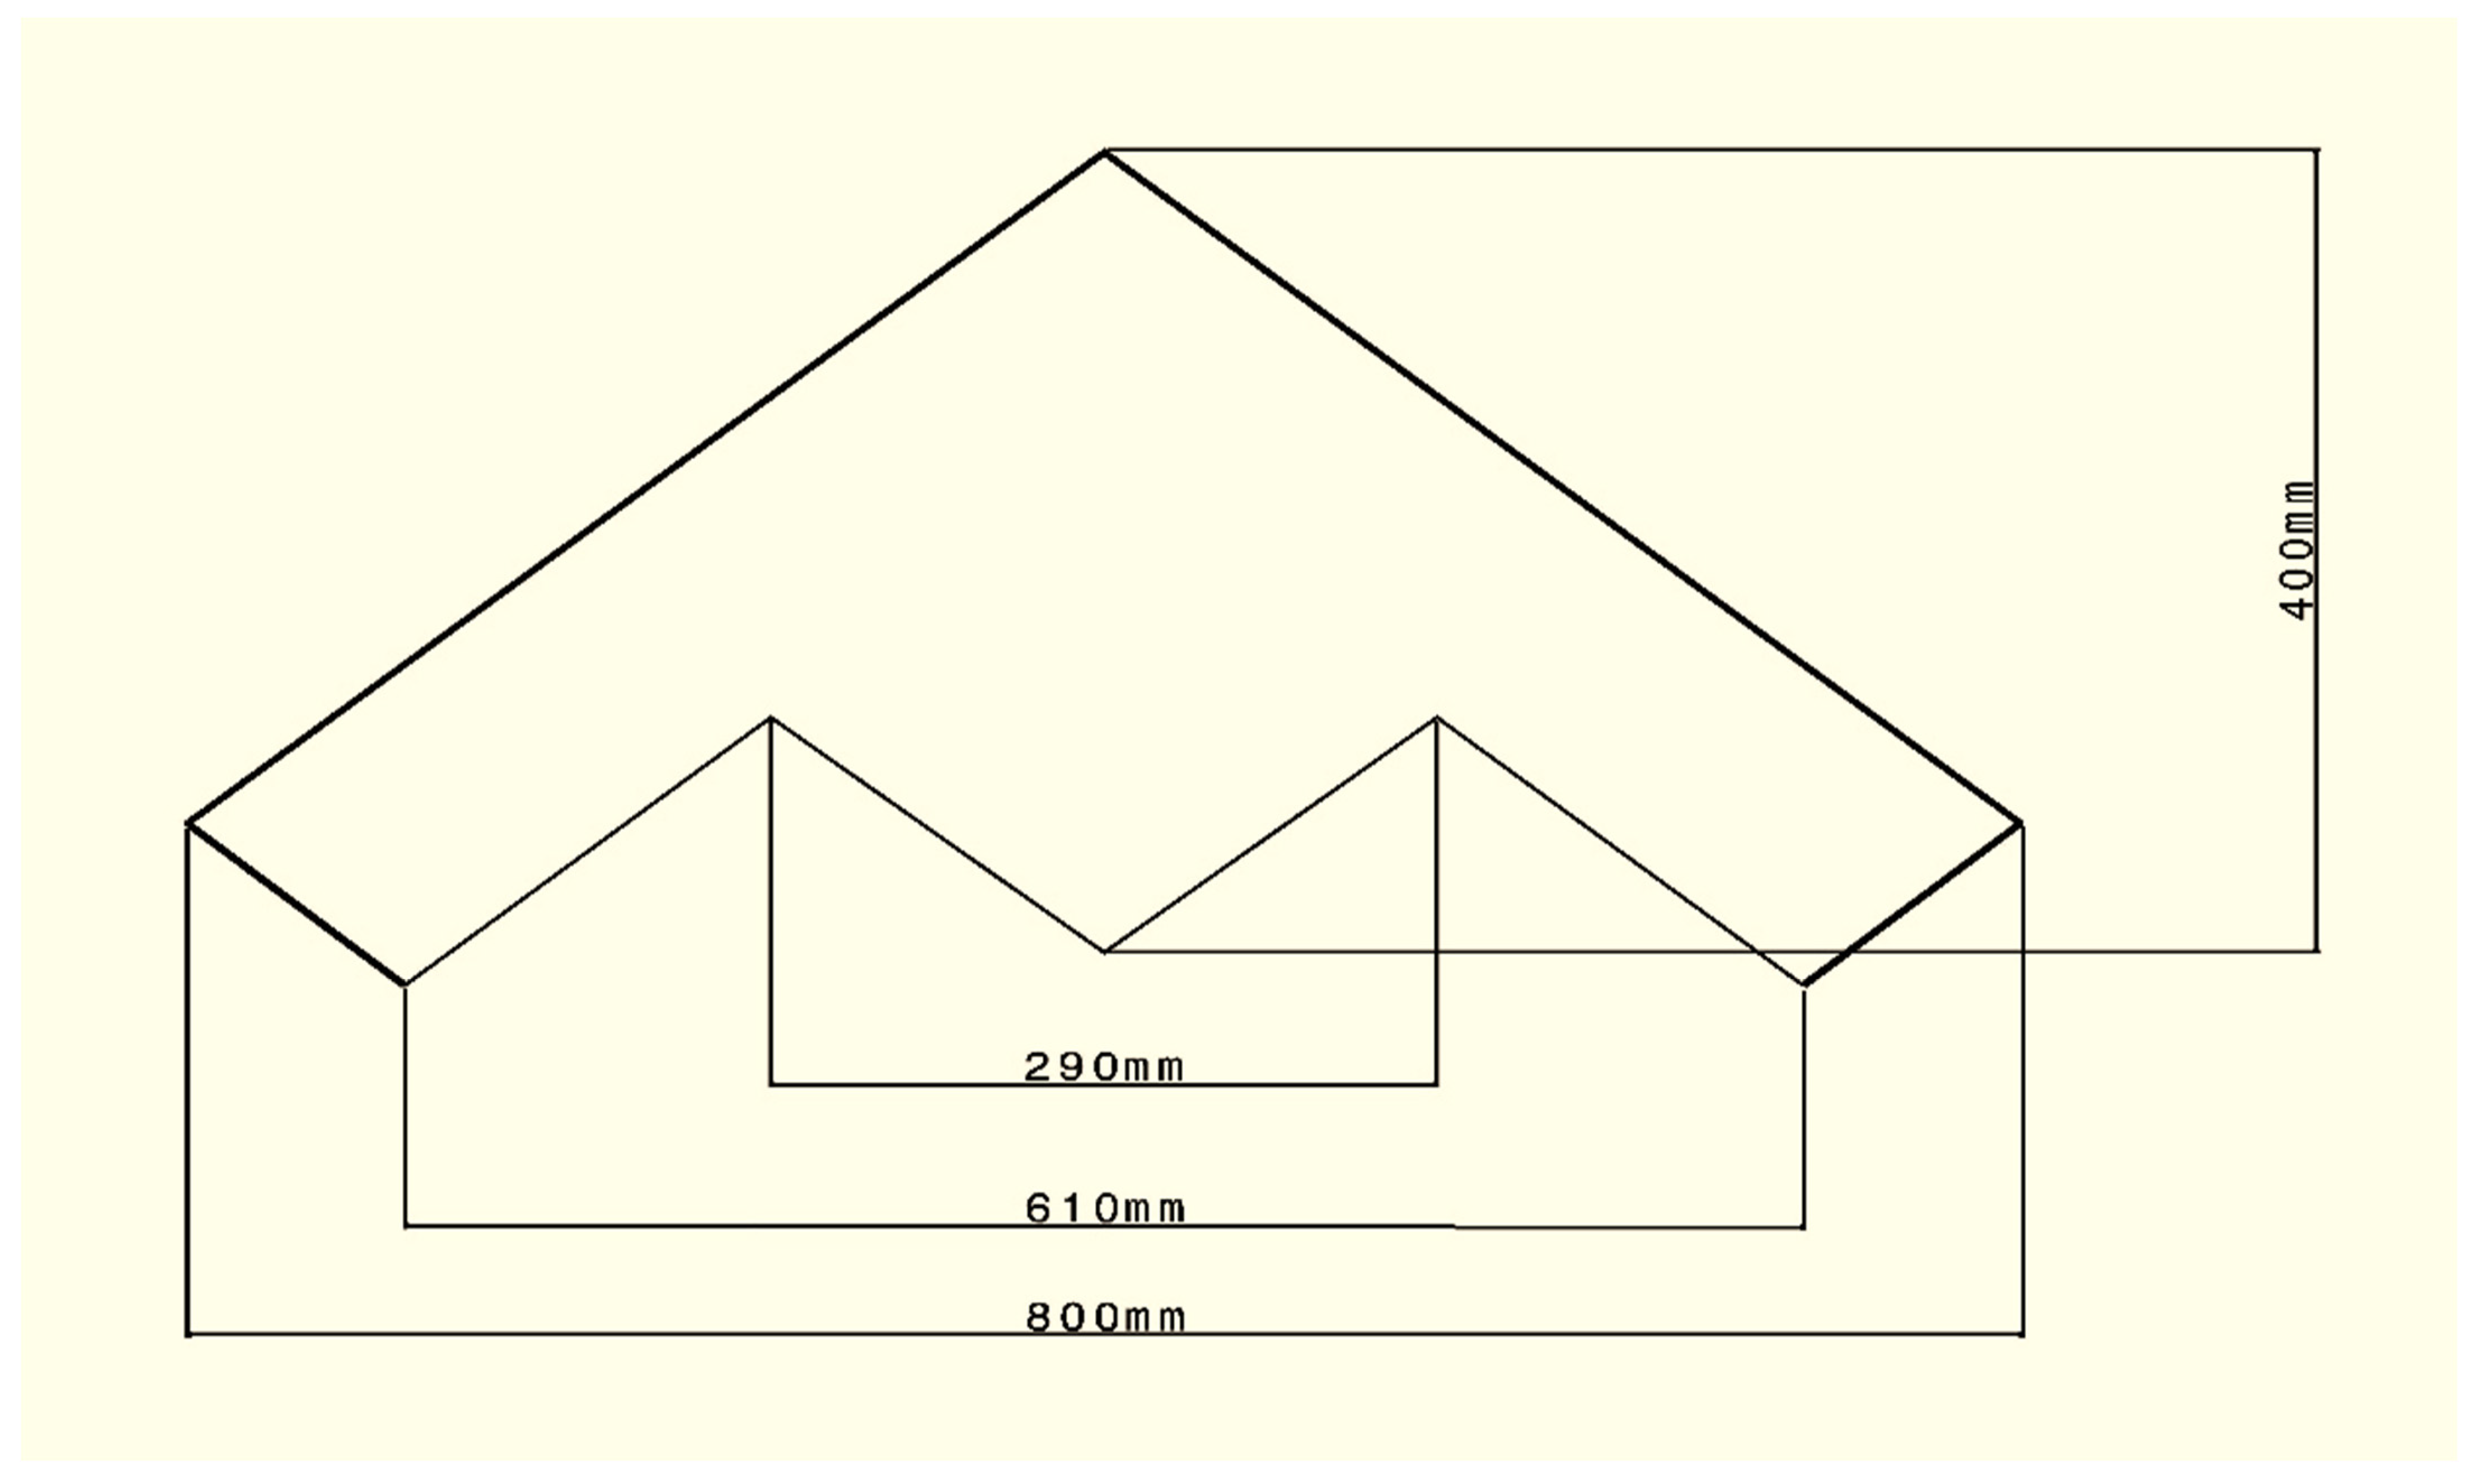
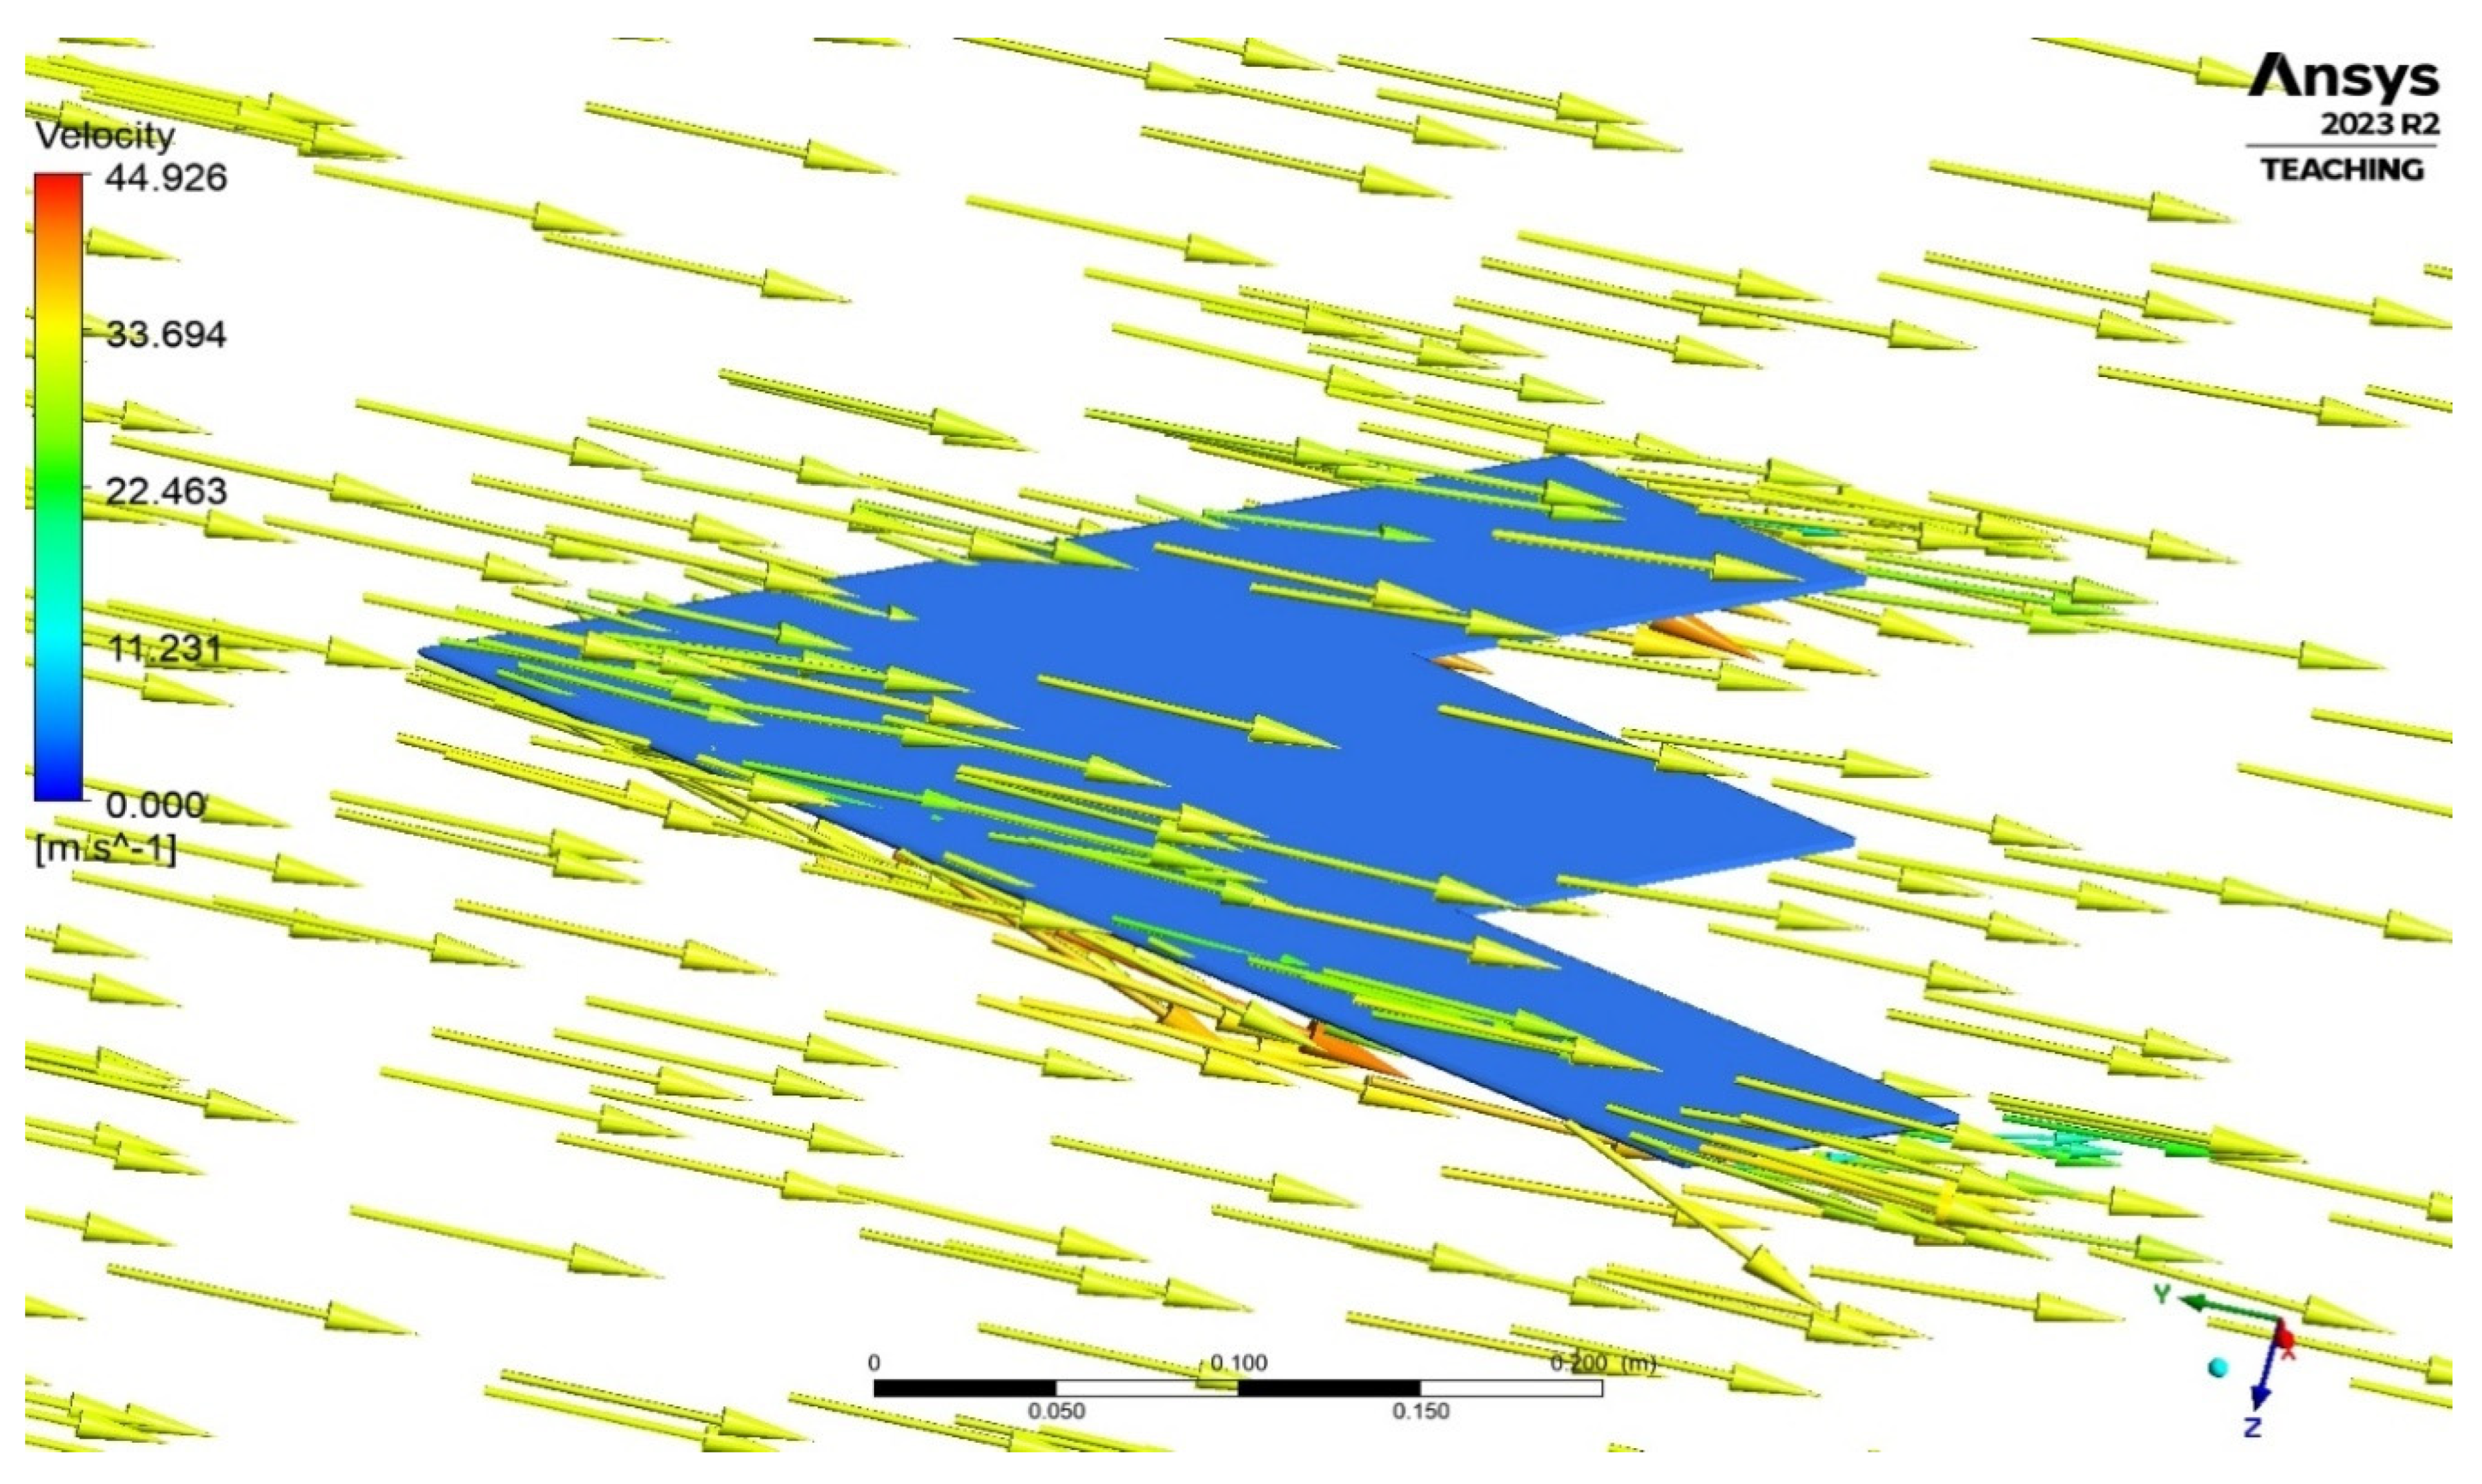
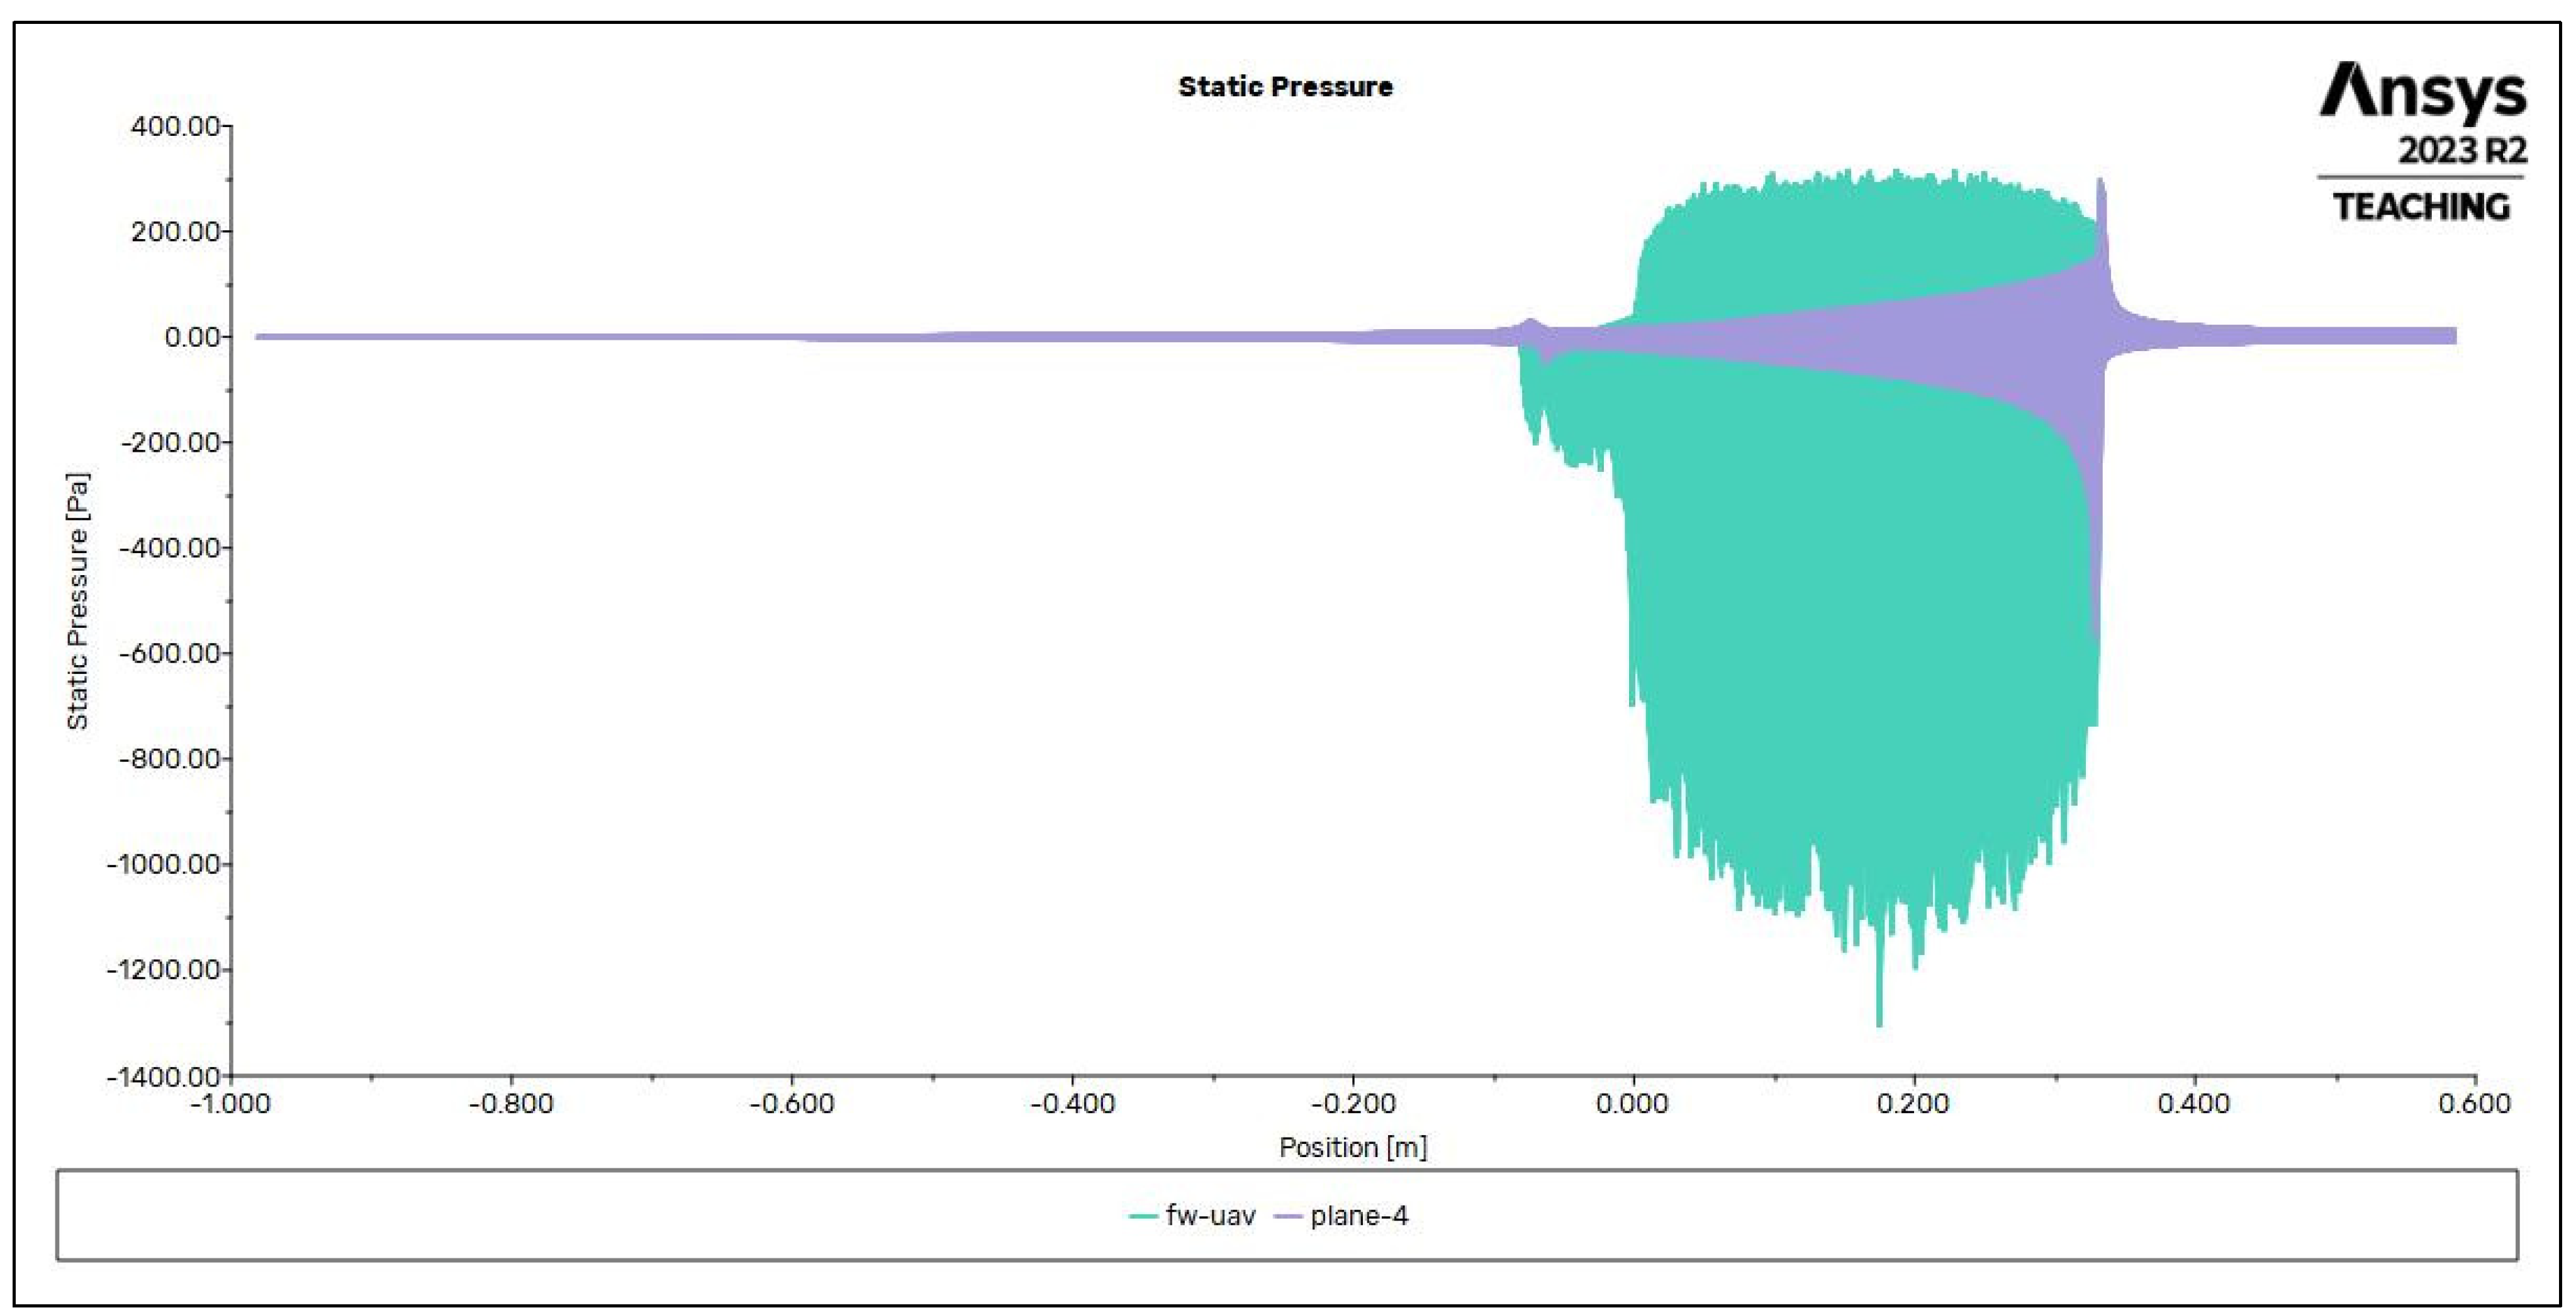
Apart from the computational simulations, these are also compared with the experimental conditions to determine accuracy and reliability through the process of validation. For this purpose, an experimental model from [28] has been developed computationally to prove its resulting variables. The design of the model to be considered for the validation experiment is shown in Figure 36 with its dimensions. It is then simulated under the same conditions using CFD techniques, for which the results of pressure contour and velocity vector over the model are seen in Figure 37 and Figure 38. These images reveal the variation in fluid velocity when imposed over the validation model. From the figures displayed, the maximum induced velocity magnitude is obtained for any possible further considerations. Figure 39 and Figure 40 shows the variations in static pressure and velocity along the change of positions in the model. These graphical representations act as the positional variation display of pressure and velocity over the model considered for experimental validation. The accuracy of magnitude variation in different parts of geometry can be observed; for instance, the geometrical difference in the trailing edge is exhibited as a noticeably large pressure and velocity deviation.
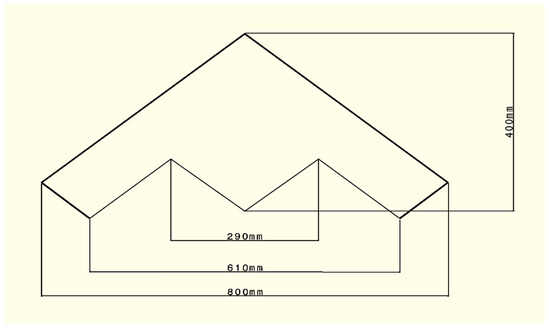
Figure 36.
Dimensions of the validation model.
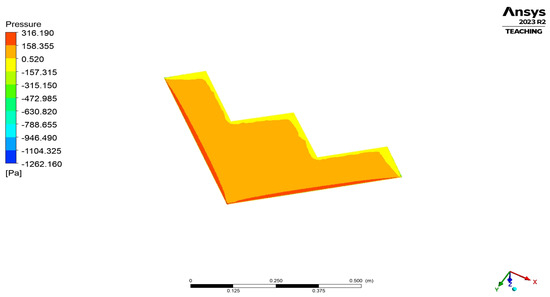
Figure 37.
Pressure contour on the validation model.
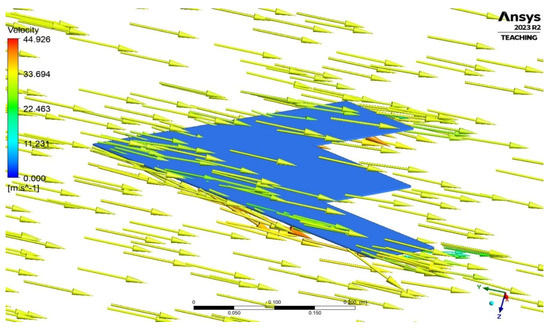
Figure 38.
Velocity vector on the validation model.
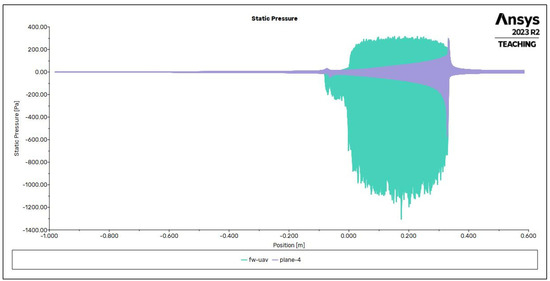
Figure 39.
Static pressure variation along the flying wing UAV model.
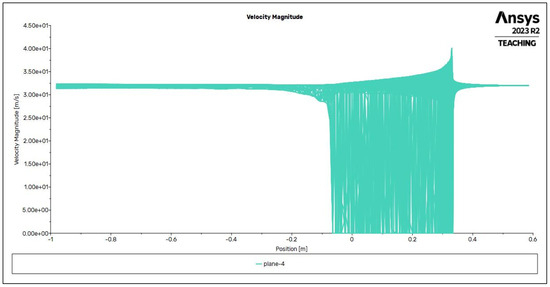
Figure 40.
Velocity variation along the flying wing UAV model.
The validation of the computational model is done with the help of the experimental data [28]; the model is simulated for the derived boundary condition at 0° and 5° AoA. The result is then compared with the experimental value, in which the wind tunnel setup had been used to test the flying wing configuration for its resulting value. The enclosure dimensions and other settings imposed were related to the experiment conducted, which includes the wind tunnel test section dimensions imposed to the control volume for the CFD simulations. The value was obtained as the major solution, along with pressure and velocity. The computationally obtained is compared with the experiment, as seen in Table 7, has resulted in a 5.737% and a 8.889% deviation, respectively, for 0° and 5° cases, from the experimental data. Considering the real-time disturbances and effects to the experiment, this percentage error is negligible and also an acceptable one. From this, the CFD simulations have proven to be legible and reliable as a result of this study.
Table 7.
variation compared in the validation study.
3. Results and Discussion
The computational model is simulated under CFD techniques. The derived aerodynamic parameters such as the maximum induced pressure, velocity and the aerodynamic forces acting because of the advanced analysis for all the nine developed configurations of the flying wing body.
3.1. CFD Simulations
3.1.1. Flying Wing UAV Base
The flying wing UAV Base model is simulated using the imposed boundary conditions as chosen for the respective environmental situation for its application. Its respective pressure and velocity contours are given in Figure 41 and Figure 42.
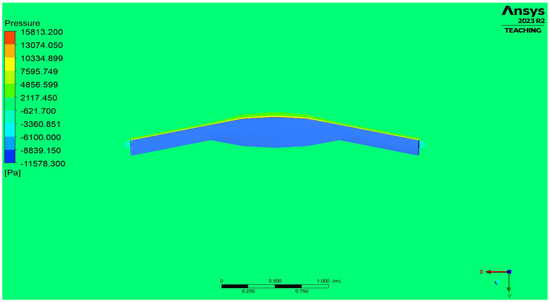
Figure 41.
Pressure distribution around flying wing UAV Base model.
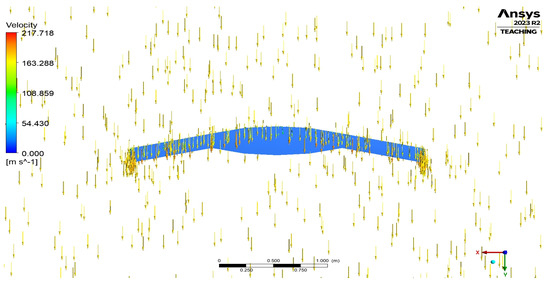
Figure 42.
Velocity vector around flying wing UAV Base model.
3.1.2. Flying Wing UAV-CP-1
The flying wing UAV-CP-1 model has a trailing edge modification, whose computational simulation results are shown with pressure and velocity variations in Figure 43 and Figure 44.
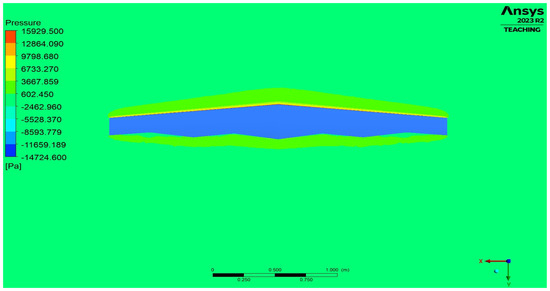
Figure 43.
Pressure distribution around flying wing UAV-CP-1.
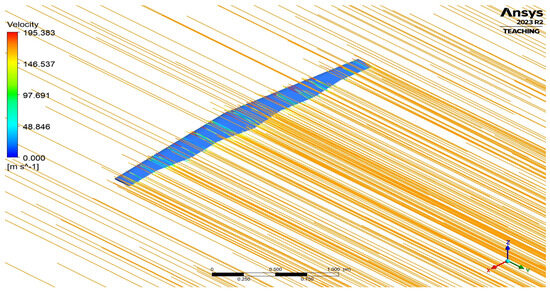
Figure 44.
Velocity streamline around flying wing UAV-CP-1.
3.1.3. Flying Wing UAV-CP-2
The flying wing UAV-CP-2 model has a curved and pointed trailing edge, whose computational executions result in the pressure and velocity variations which are revealed in Figure 45 and Figure 46.
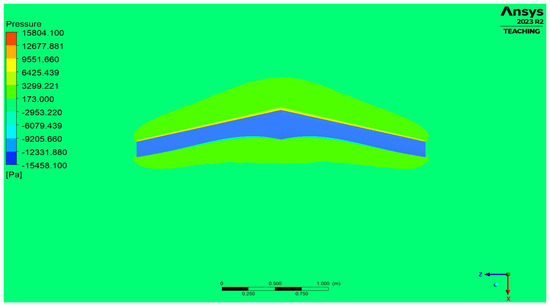
Figure 45.
Pressure distribution around flying wing UAV-CP-2.
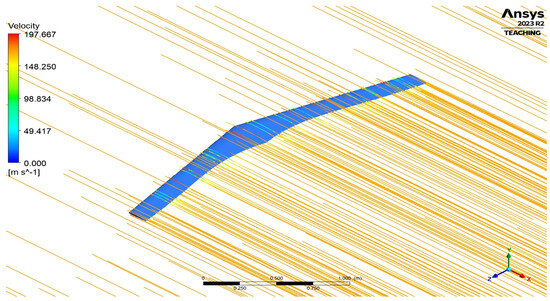
Figure 46.
Velocity streamline around flying wing UAV-CP-2.
3.1.4. Flying Wing UAV-CP-3
The flying wing UAV-CP-3 model has a leading edge and trailing edge modification, whose computational simulations are executed for which the pressure and velocity variations are displayed in Figure 47 and Figure 48.

Figure 47.
Pressure distribution around flying wing UAV-CP-3.
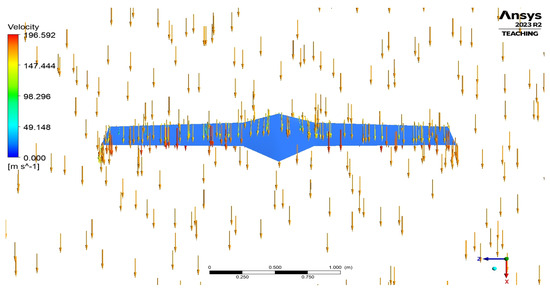
Figure 48.
Velocity vector around flying wing UAV-CP-3.
3.1.5. Flying Wing UAV-AP-1
The pressure and velocity variations over the flying wing UAV-AP-1 body are shown in Figure 49 and Figure 50. This model is modified to have a pointed leading-edge configuration.

Figure 49.
Pressure distribution around flying wing UAV-AP-1.

Figure 50.
Velocity streamline around flying wing UAV-AP-1.
3.1.6. Flying Wing UAV-AP-2
The flying wing UAV-AP-2 model is a pointed nose configuration with an altered wingtip and a V-shaped rear end. This model’s resulting computational outcomes, including the pressure and velocity variations, are shown in Figure 51 and Figure 52.

Figure 51.
Pressure distribution around flying wing UAV-AP-2.

Figure 52.
Velocity streamline around flying wing UAV-AP-2.
3.1.7. Flying Wing UAV-NIP-1
The flying wing UAV-NIP-1 model is a modified version from the initial falcon model, with just two pointed leading edges, also known as a double-cupped configuration. This model is simulated, and its pressure and velocity variations are revealed in Figure 53 and Figure 54.

Figure 53.
Pressure distribution around flying wing UAV-NIP-1.

Figure 54.
Velocity vector around flying wing UAV-NIP-1.
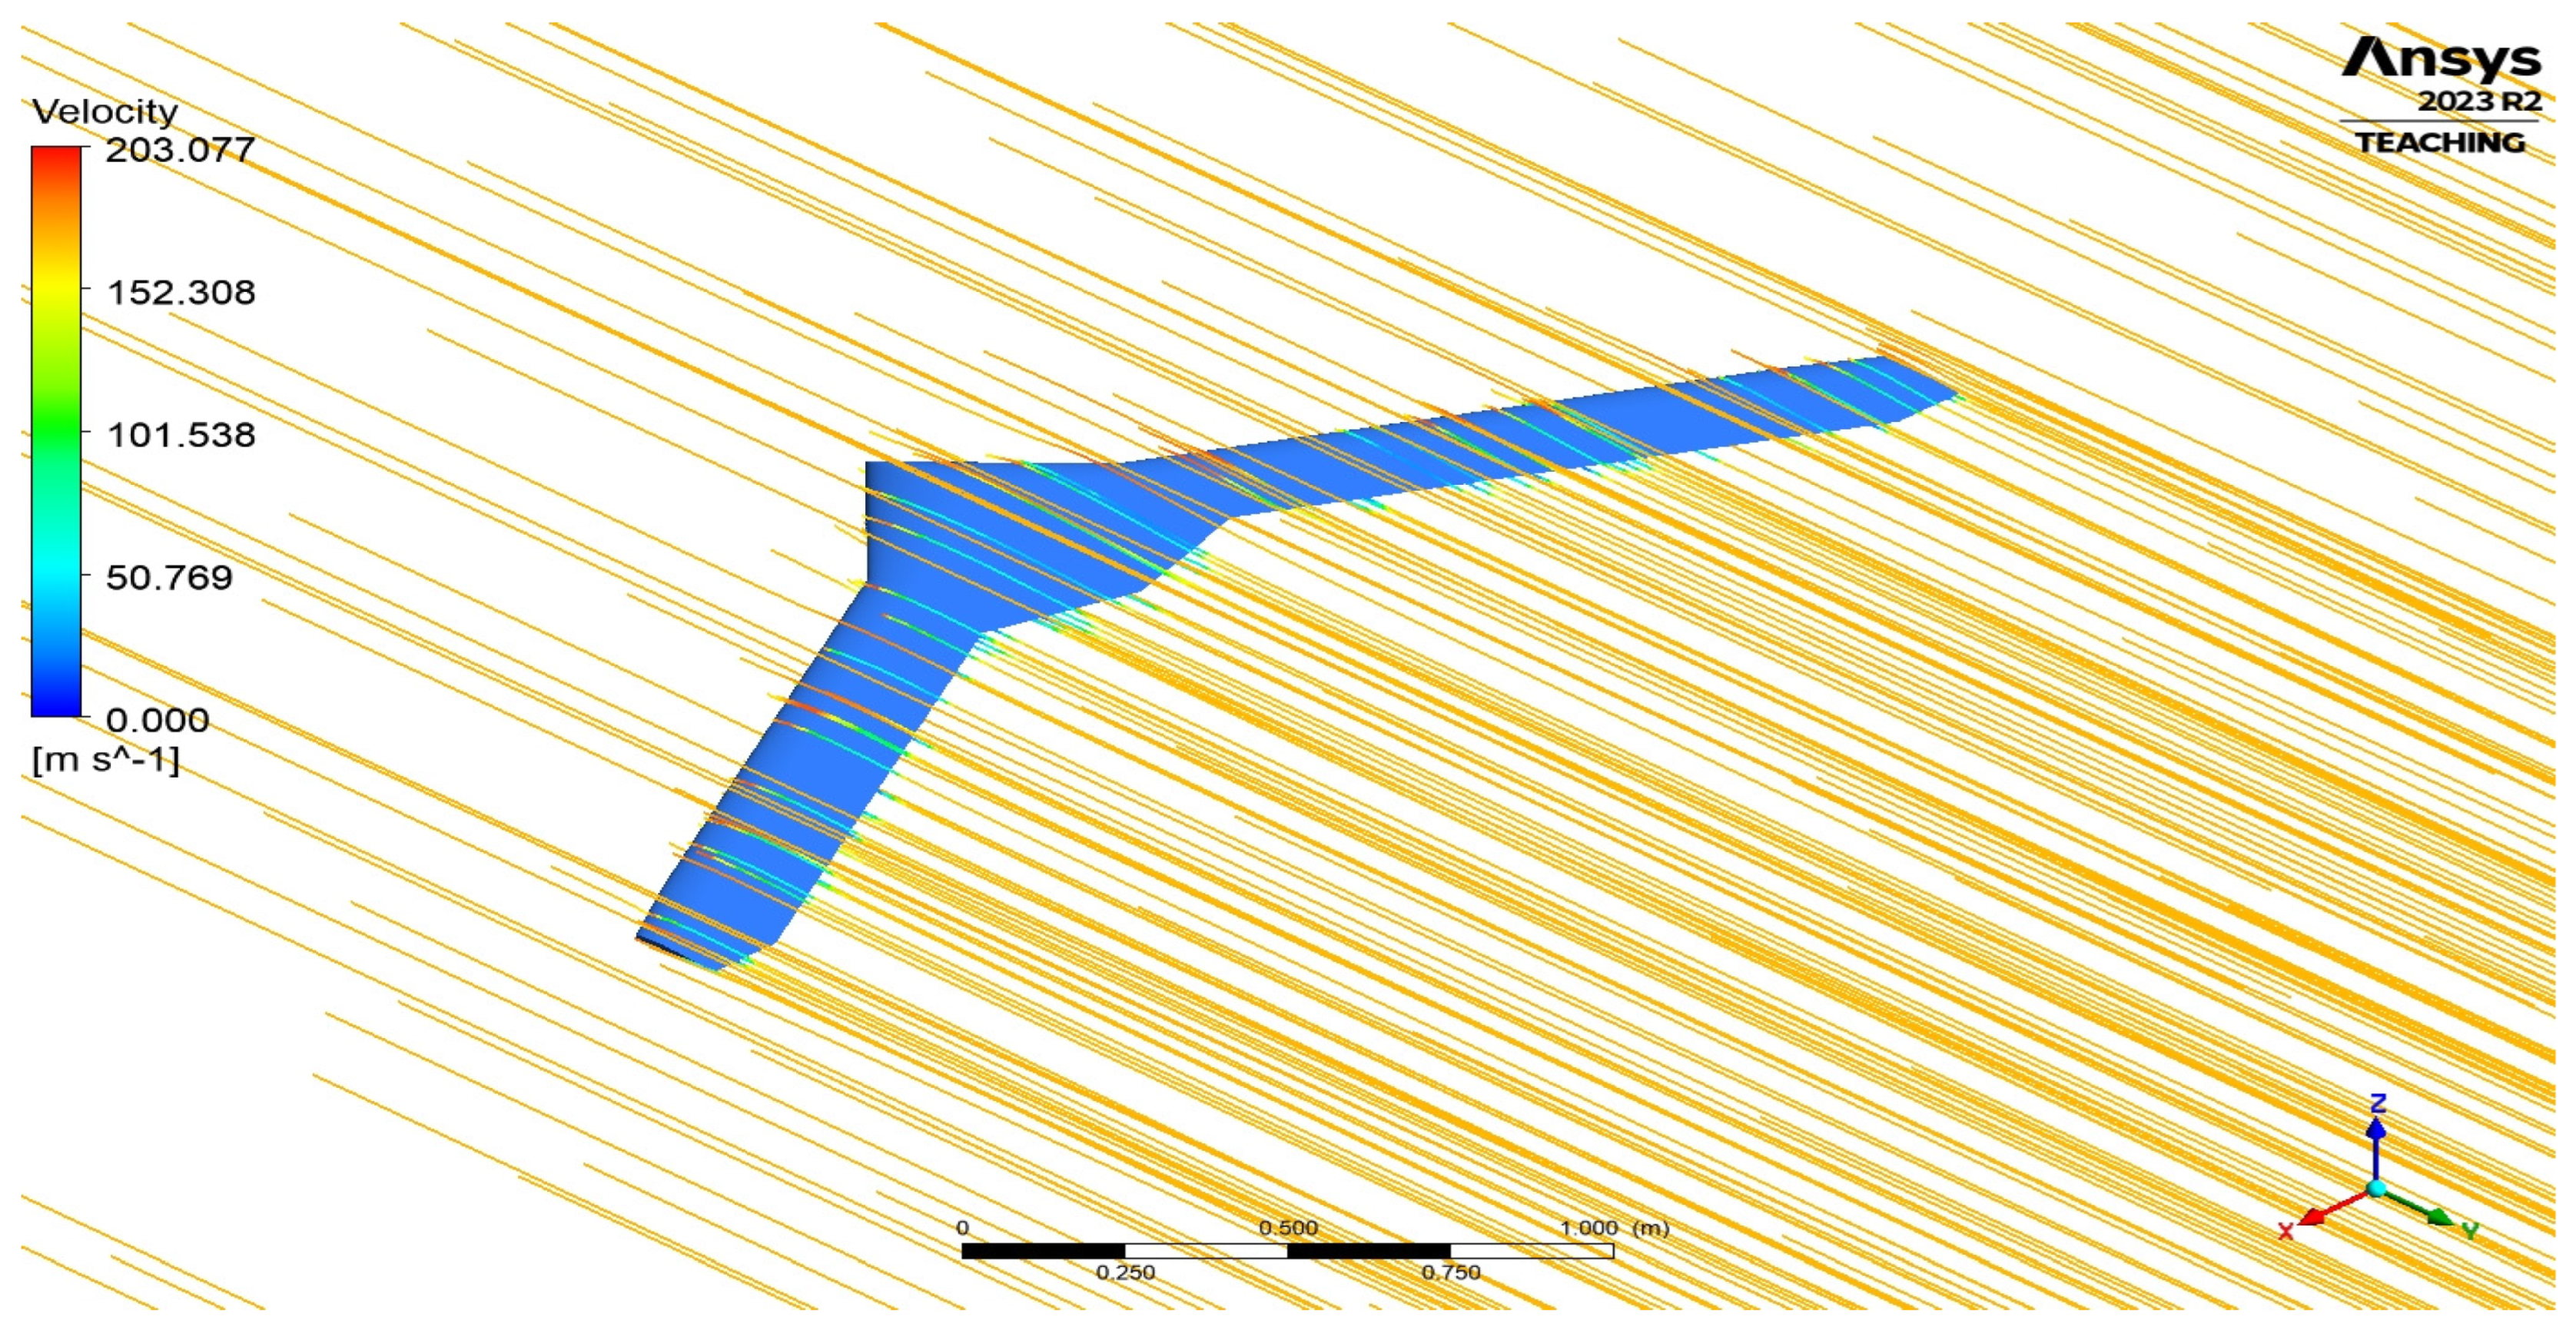
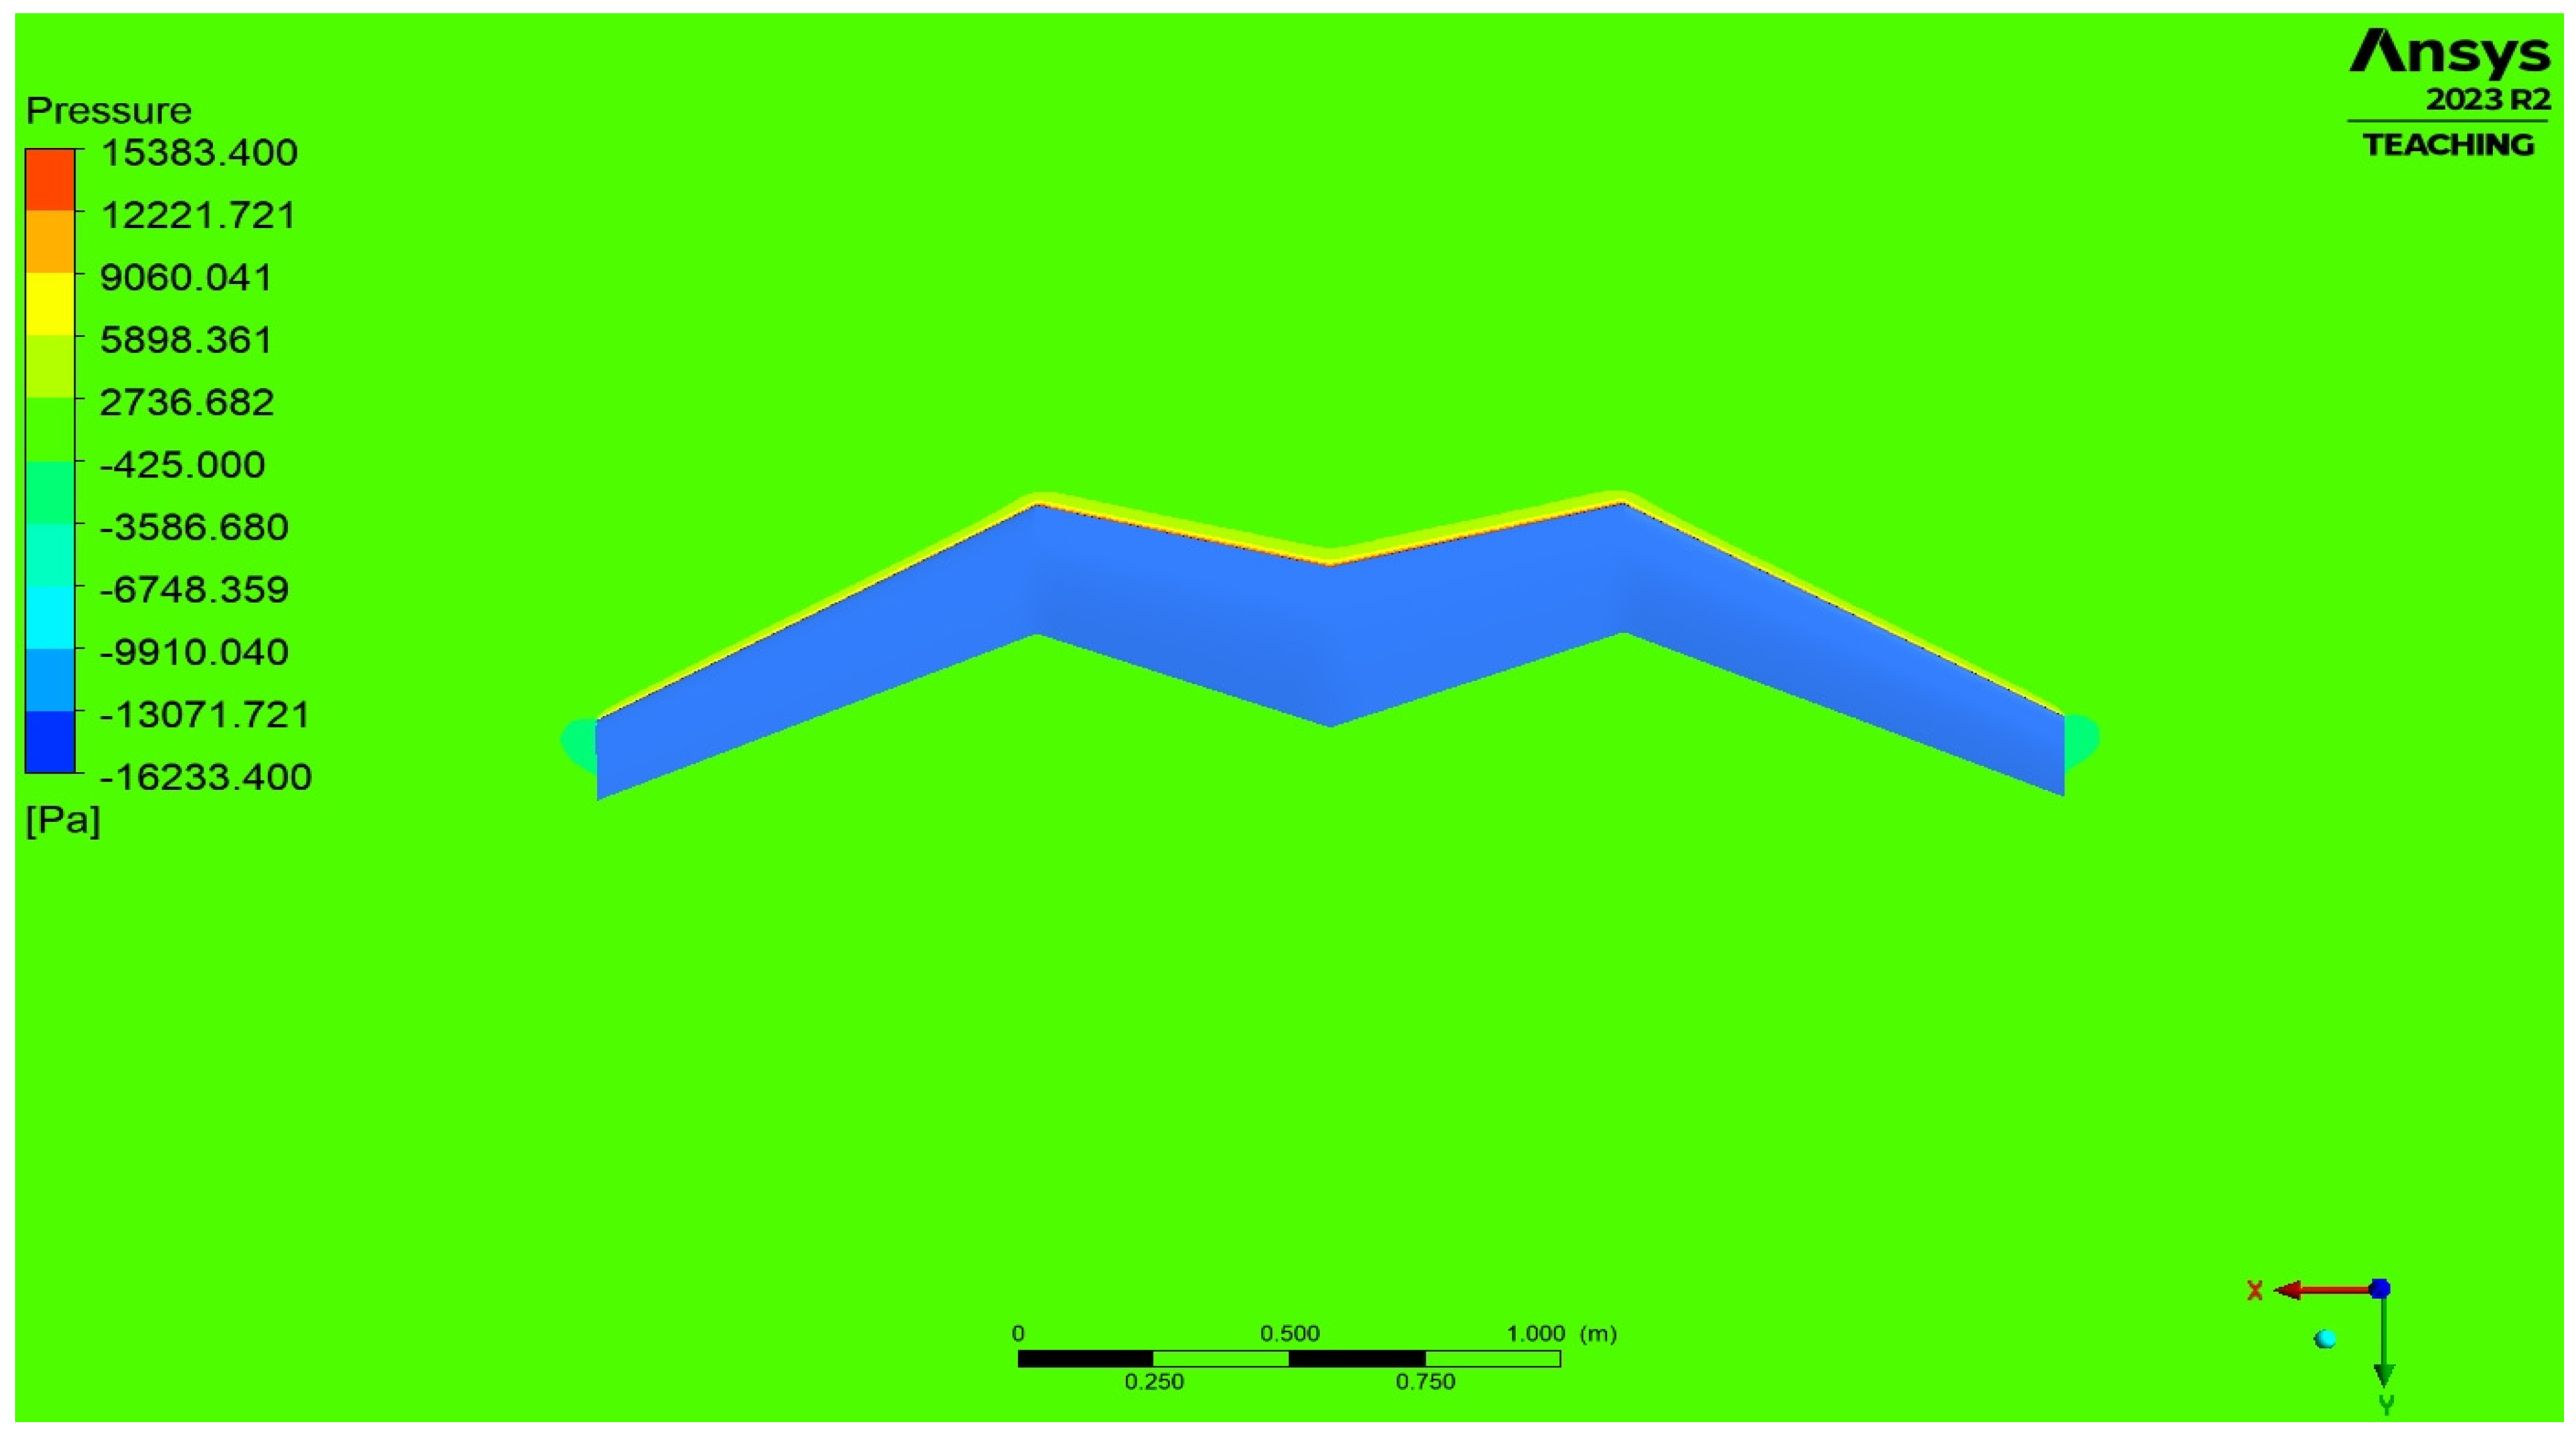
3.1.8. Flying Wing UAV-NIP-2
Computational simulations are executed over the flying wing UAV-NIP-2 model and its aerodynamic results including pressure and velocity are shown in Figure 55 and Figure 56.
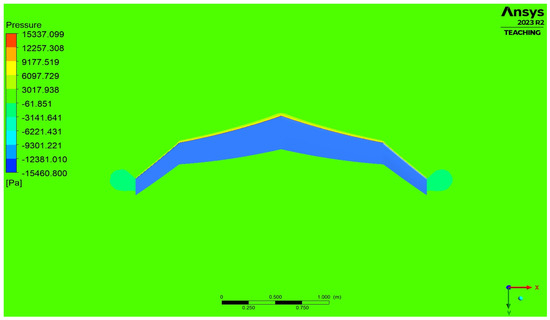
Figure 55.
Pressure distribution around flying wing UAV-NIP-2.
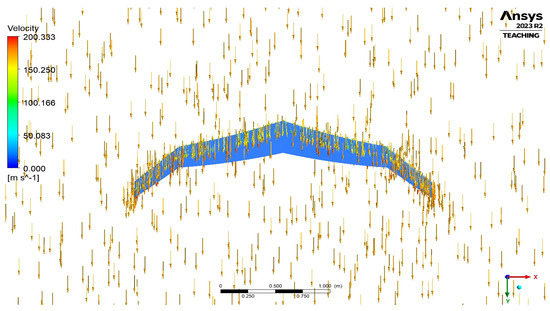
Figure 56.
Velocity vector around flying wing UAV-NIP-2.
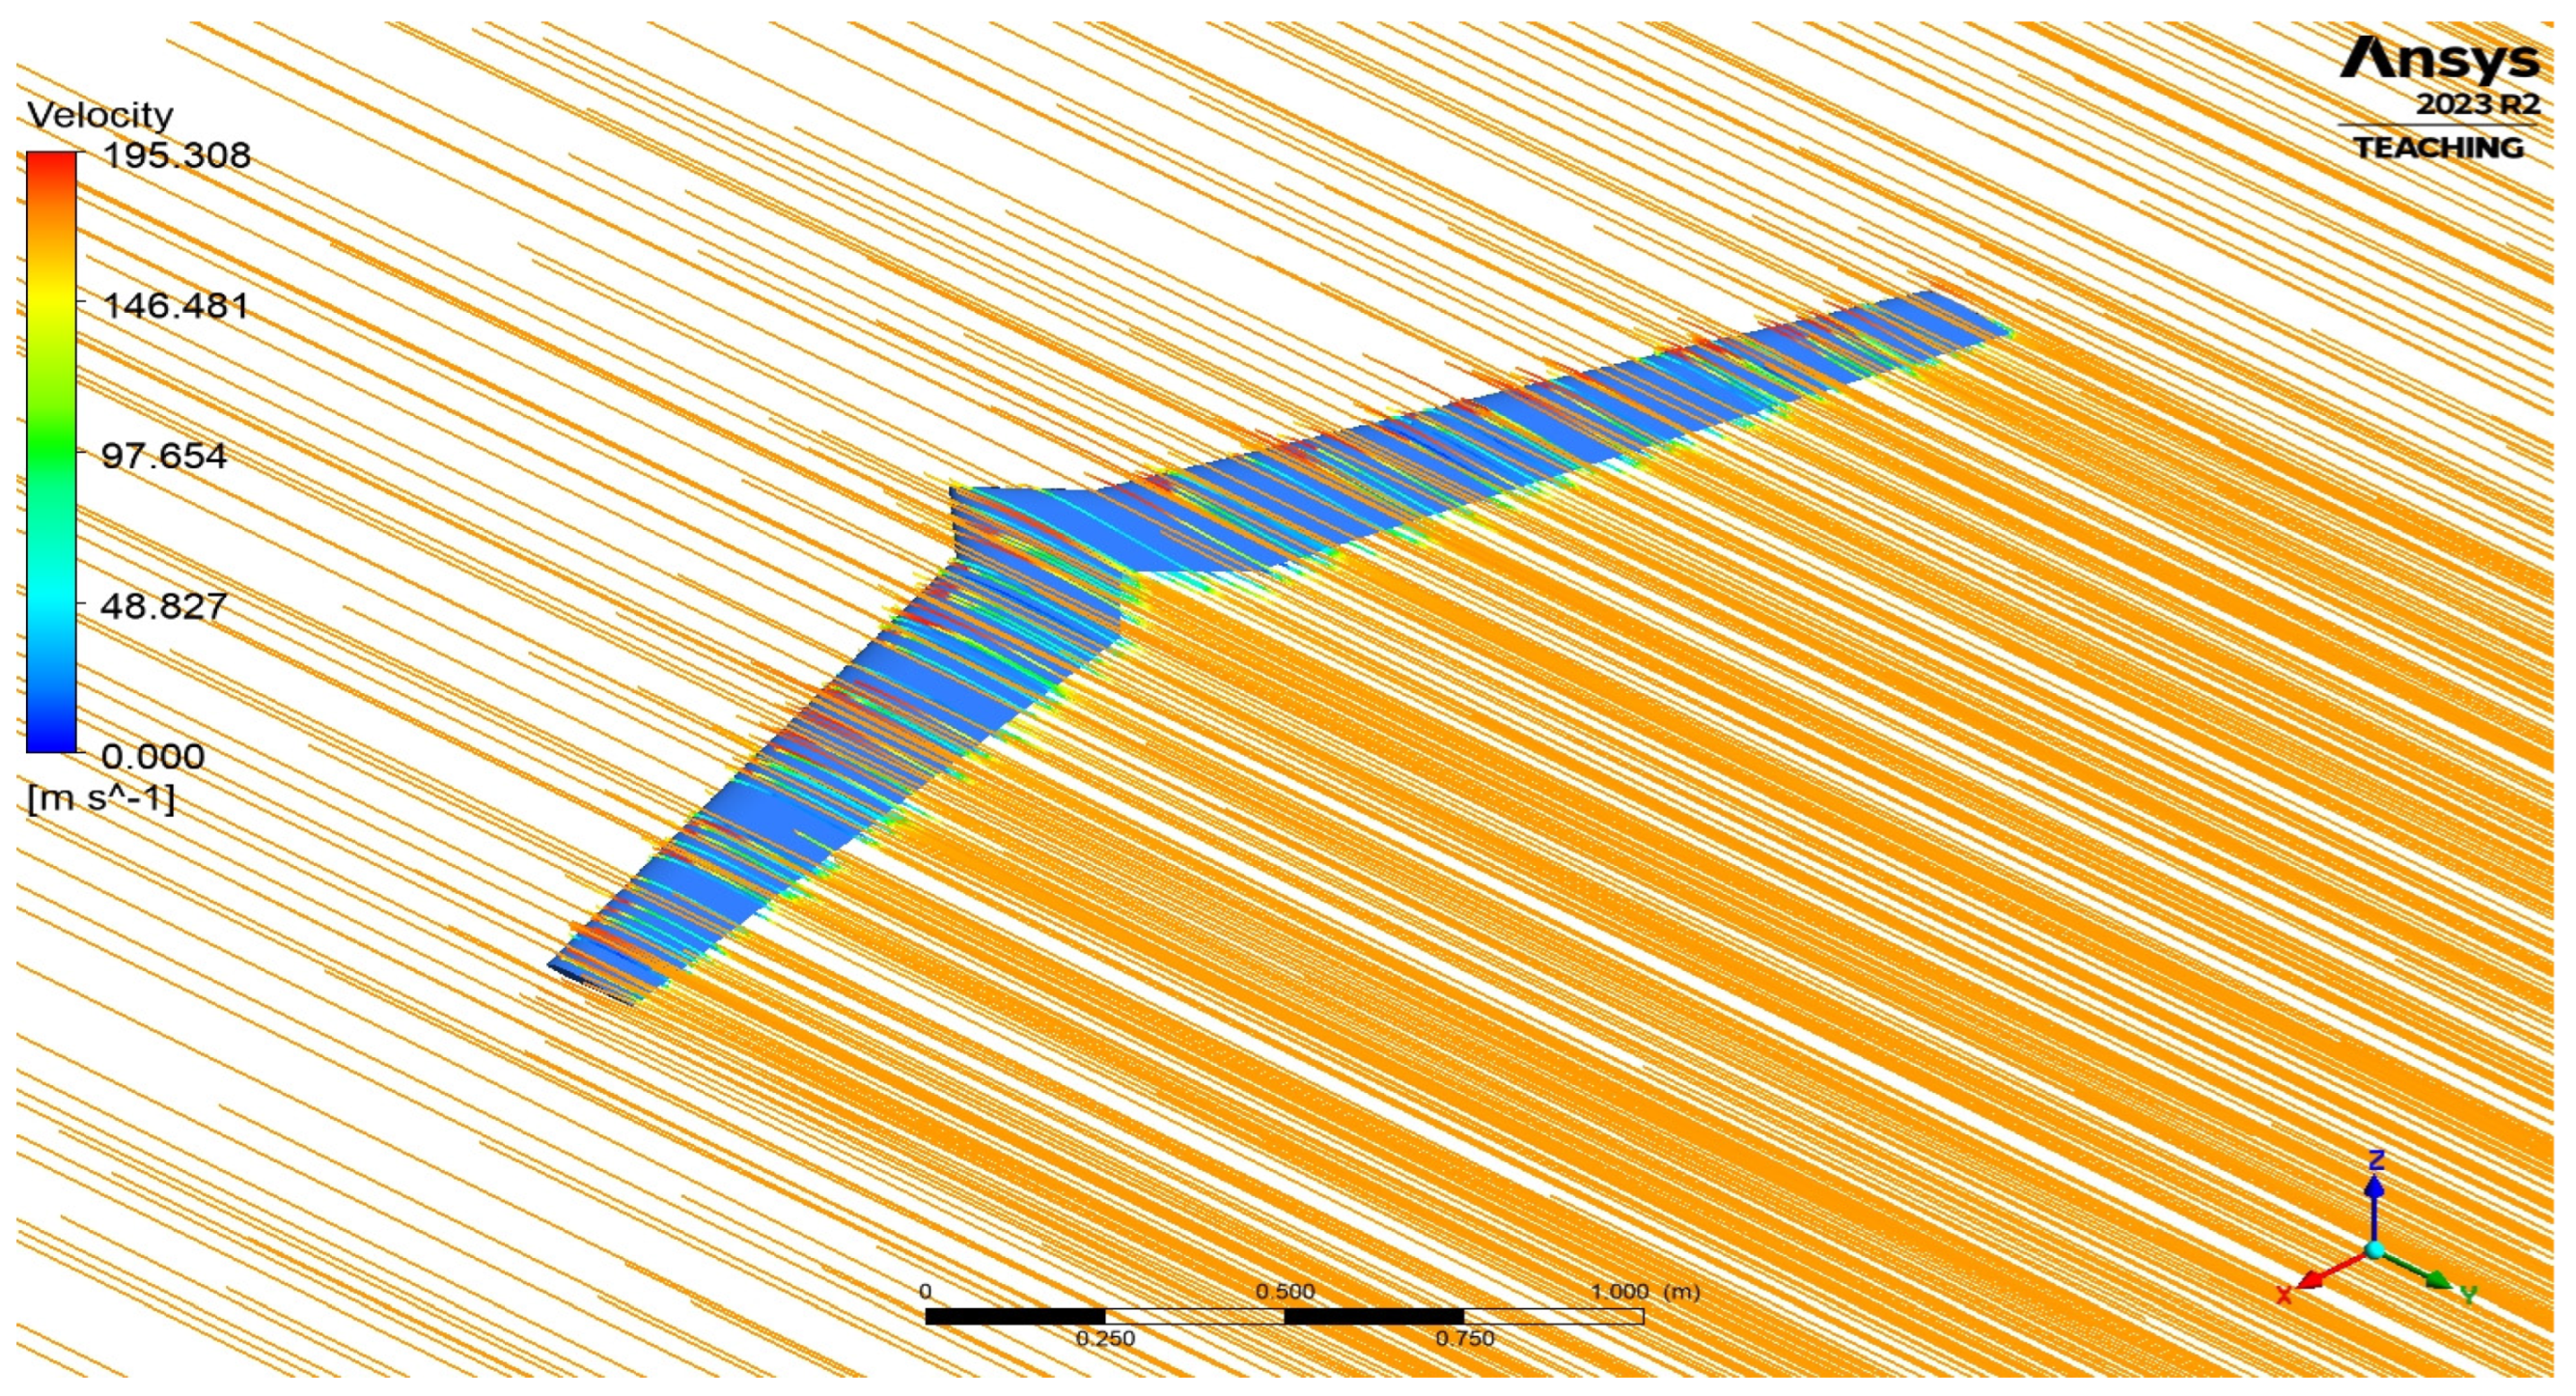
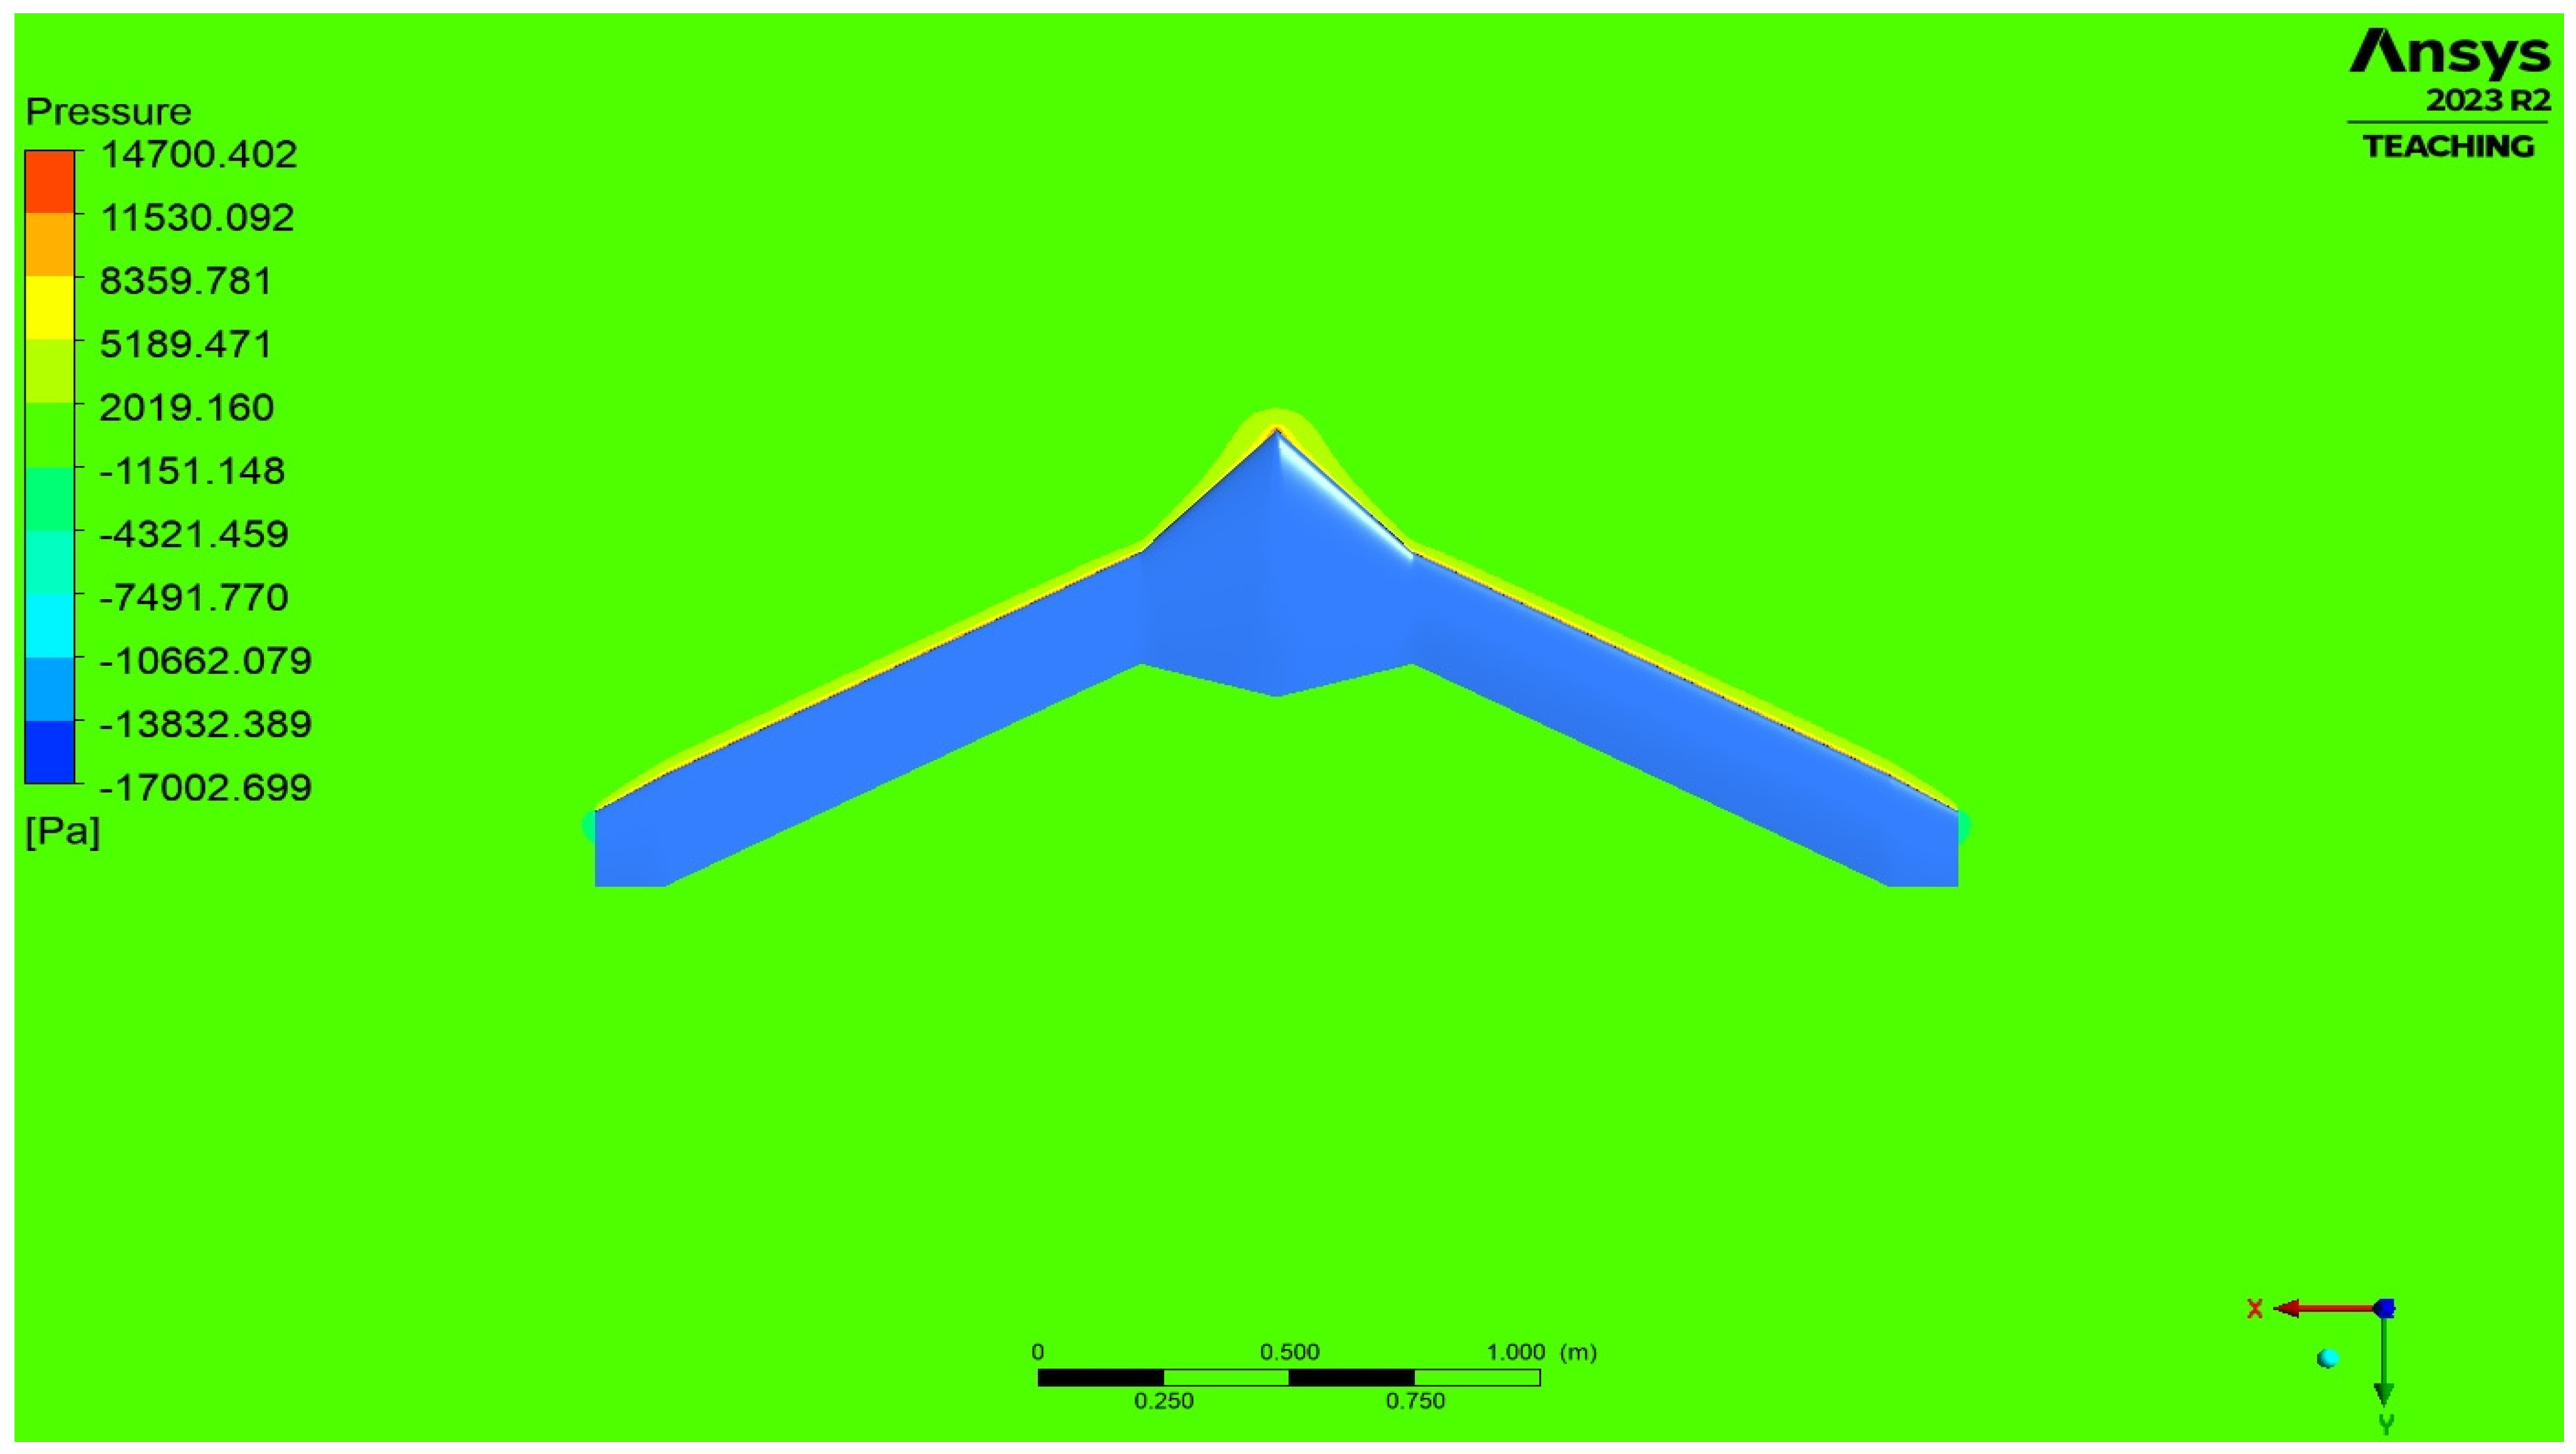
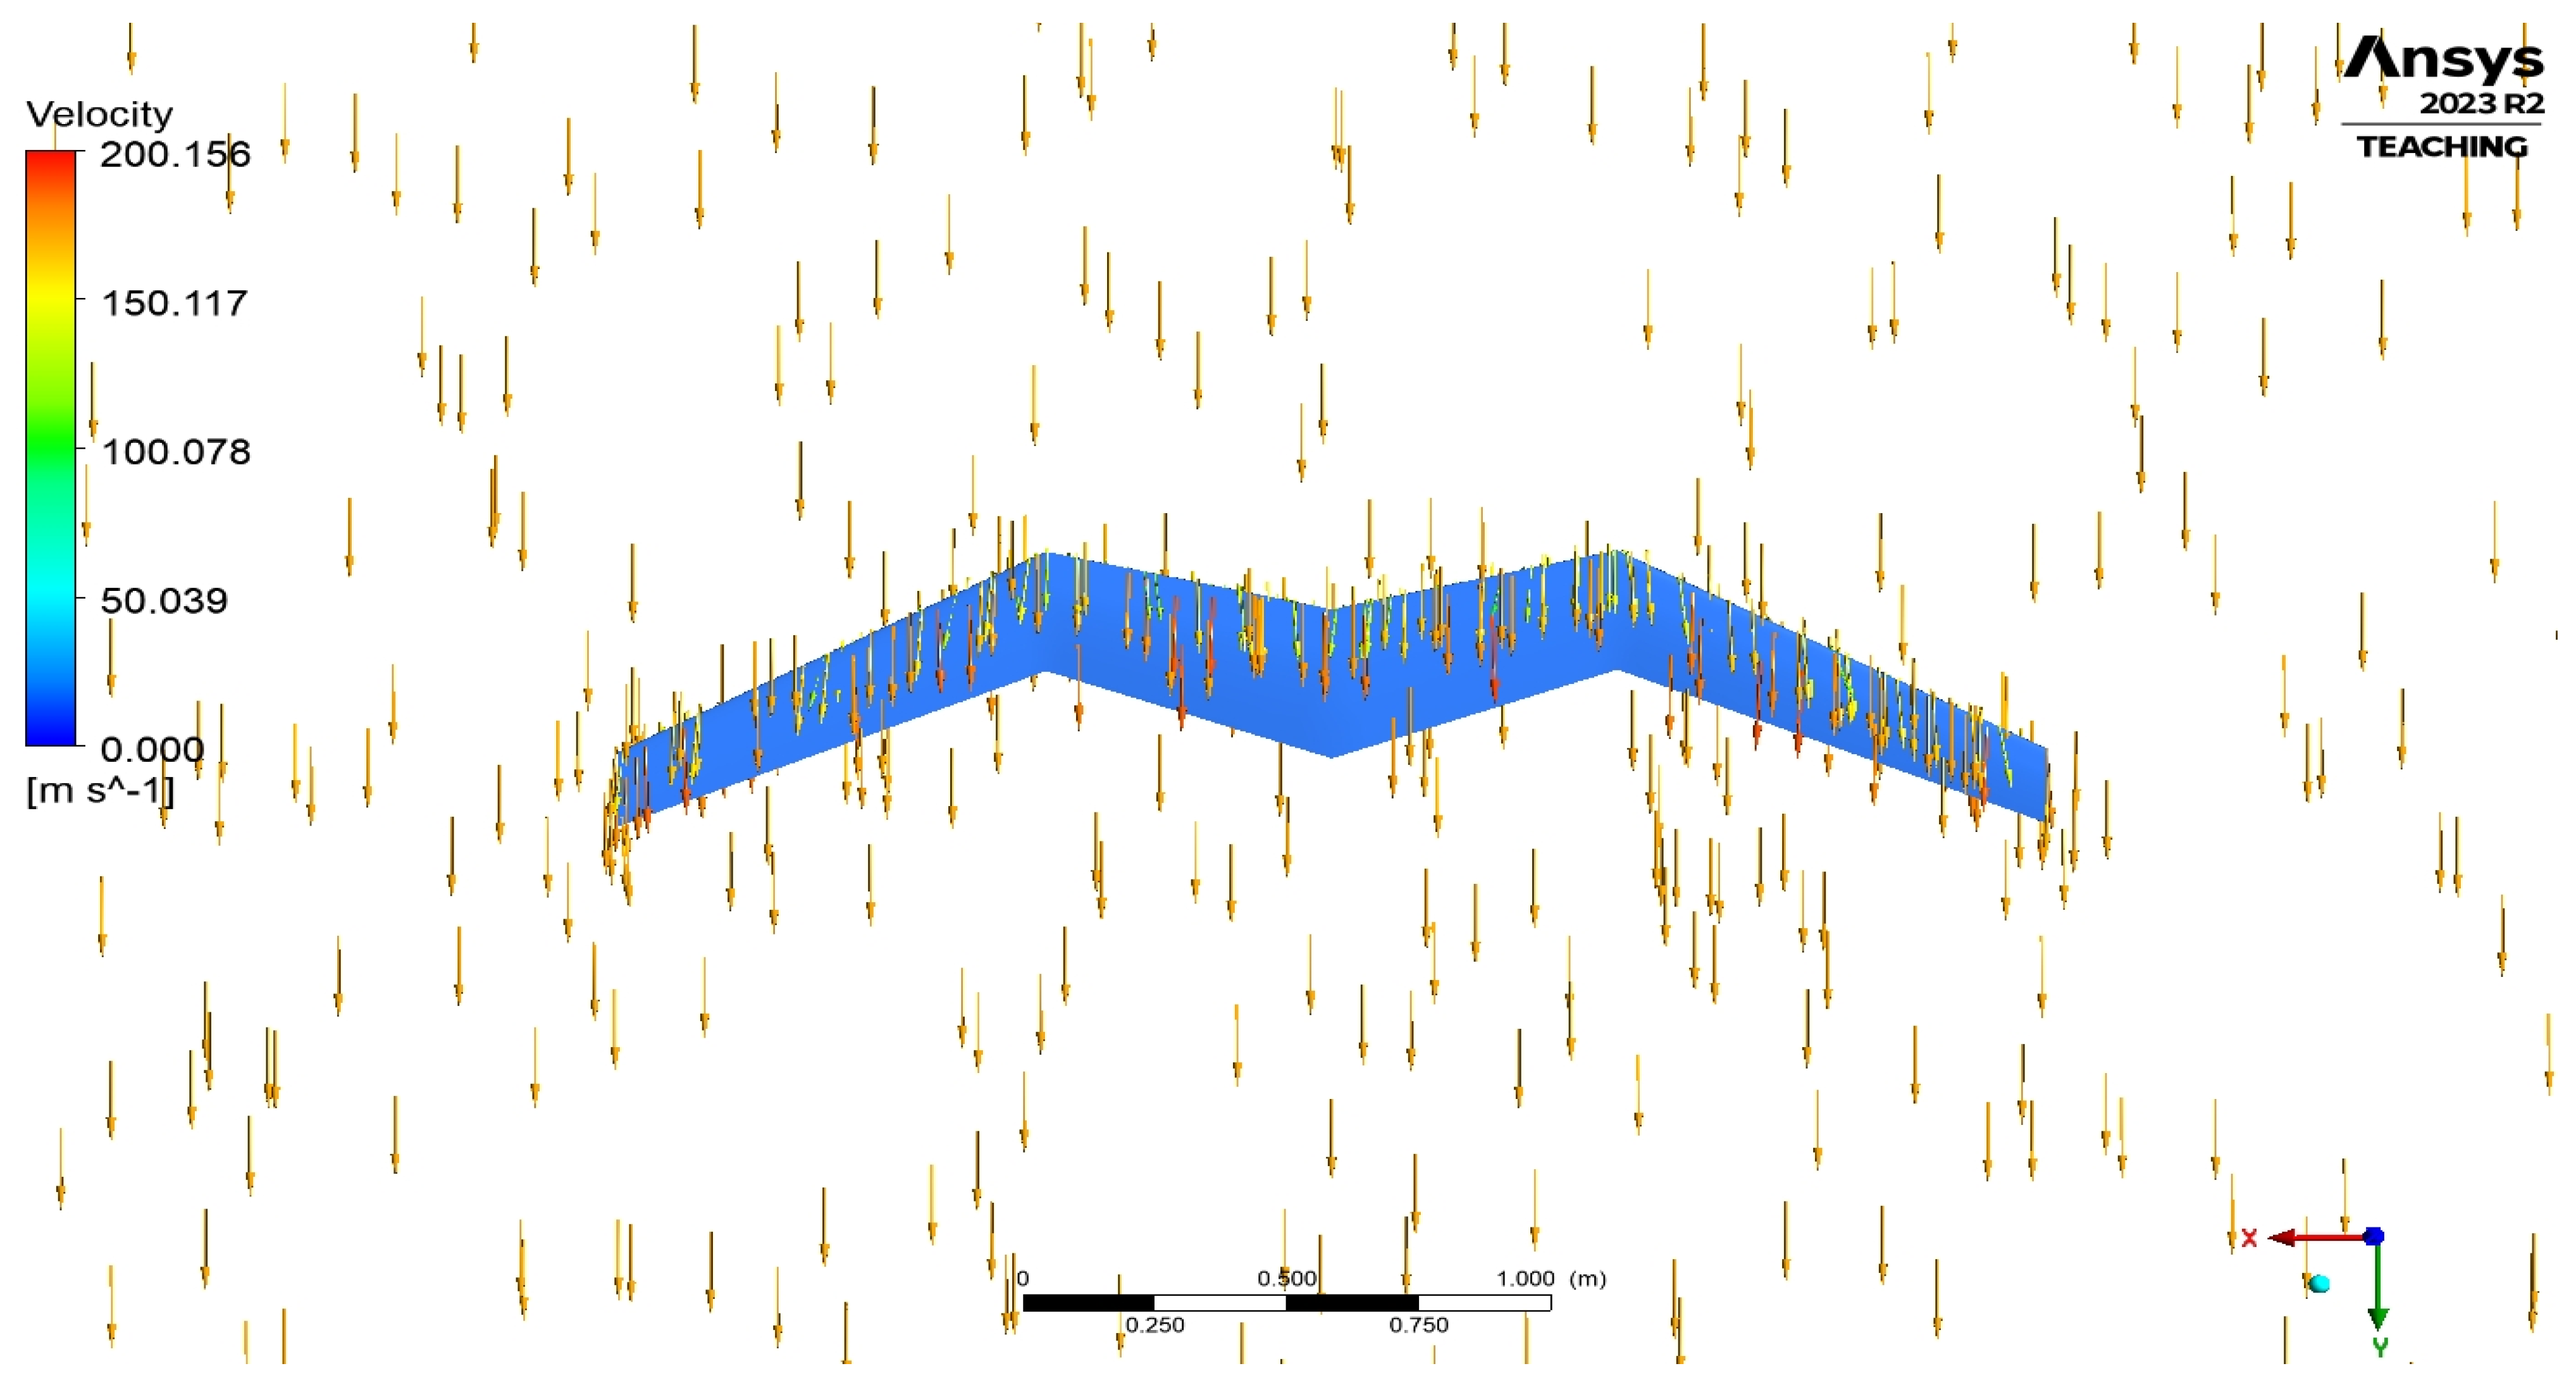
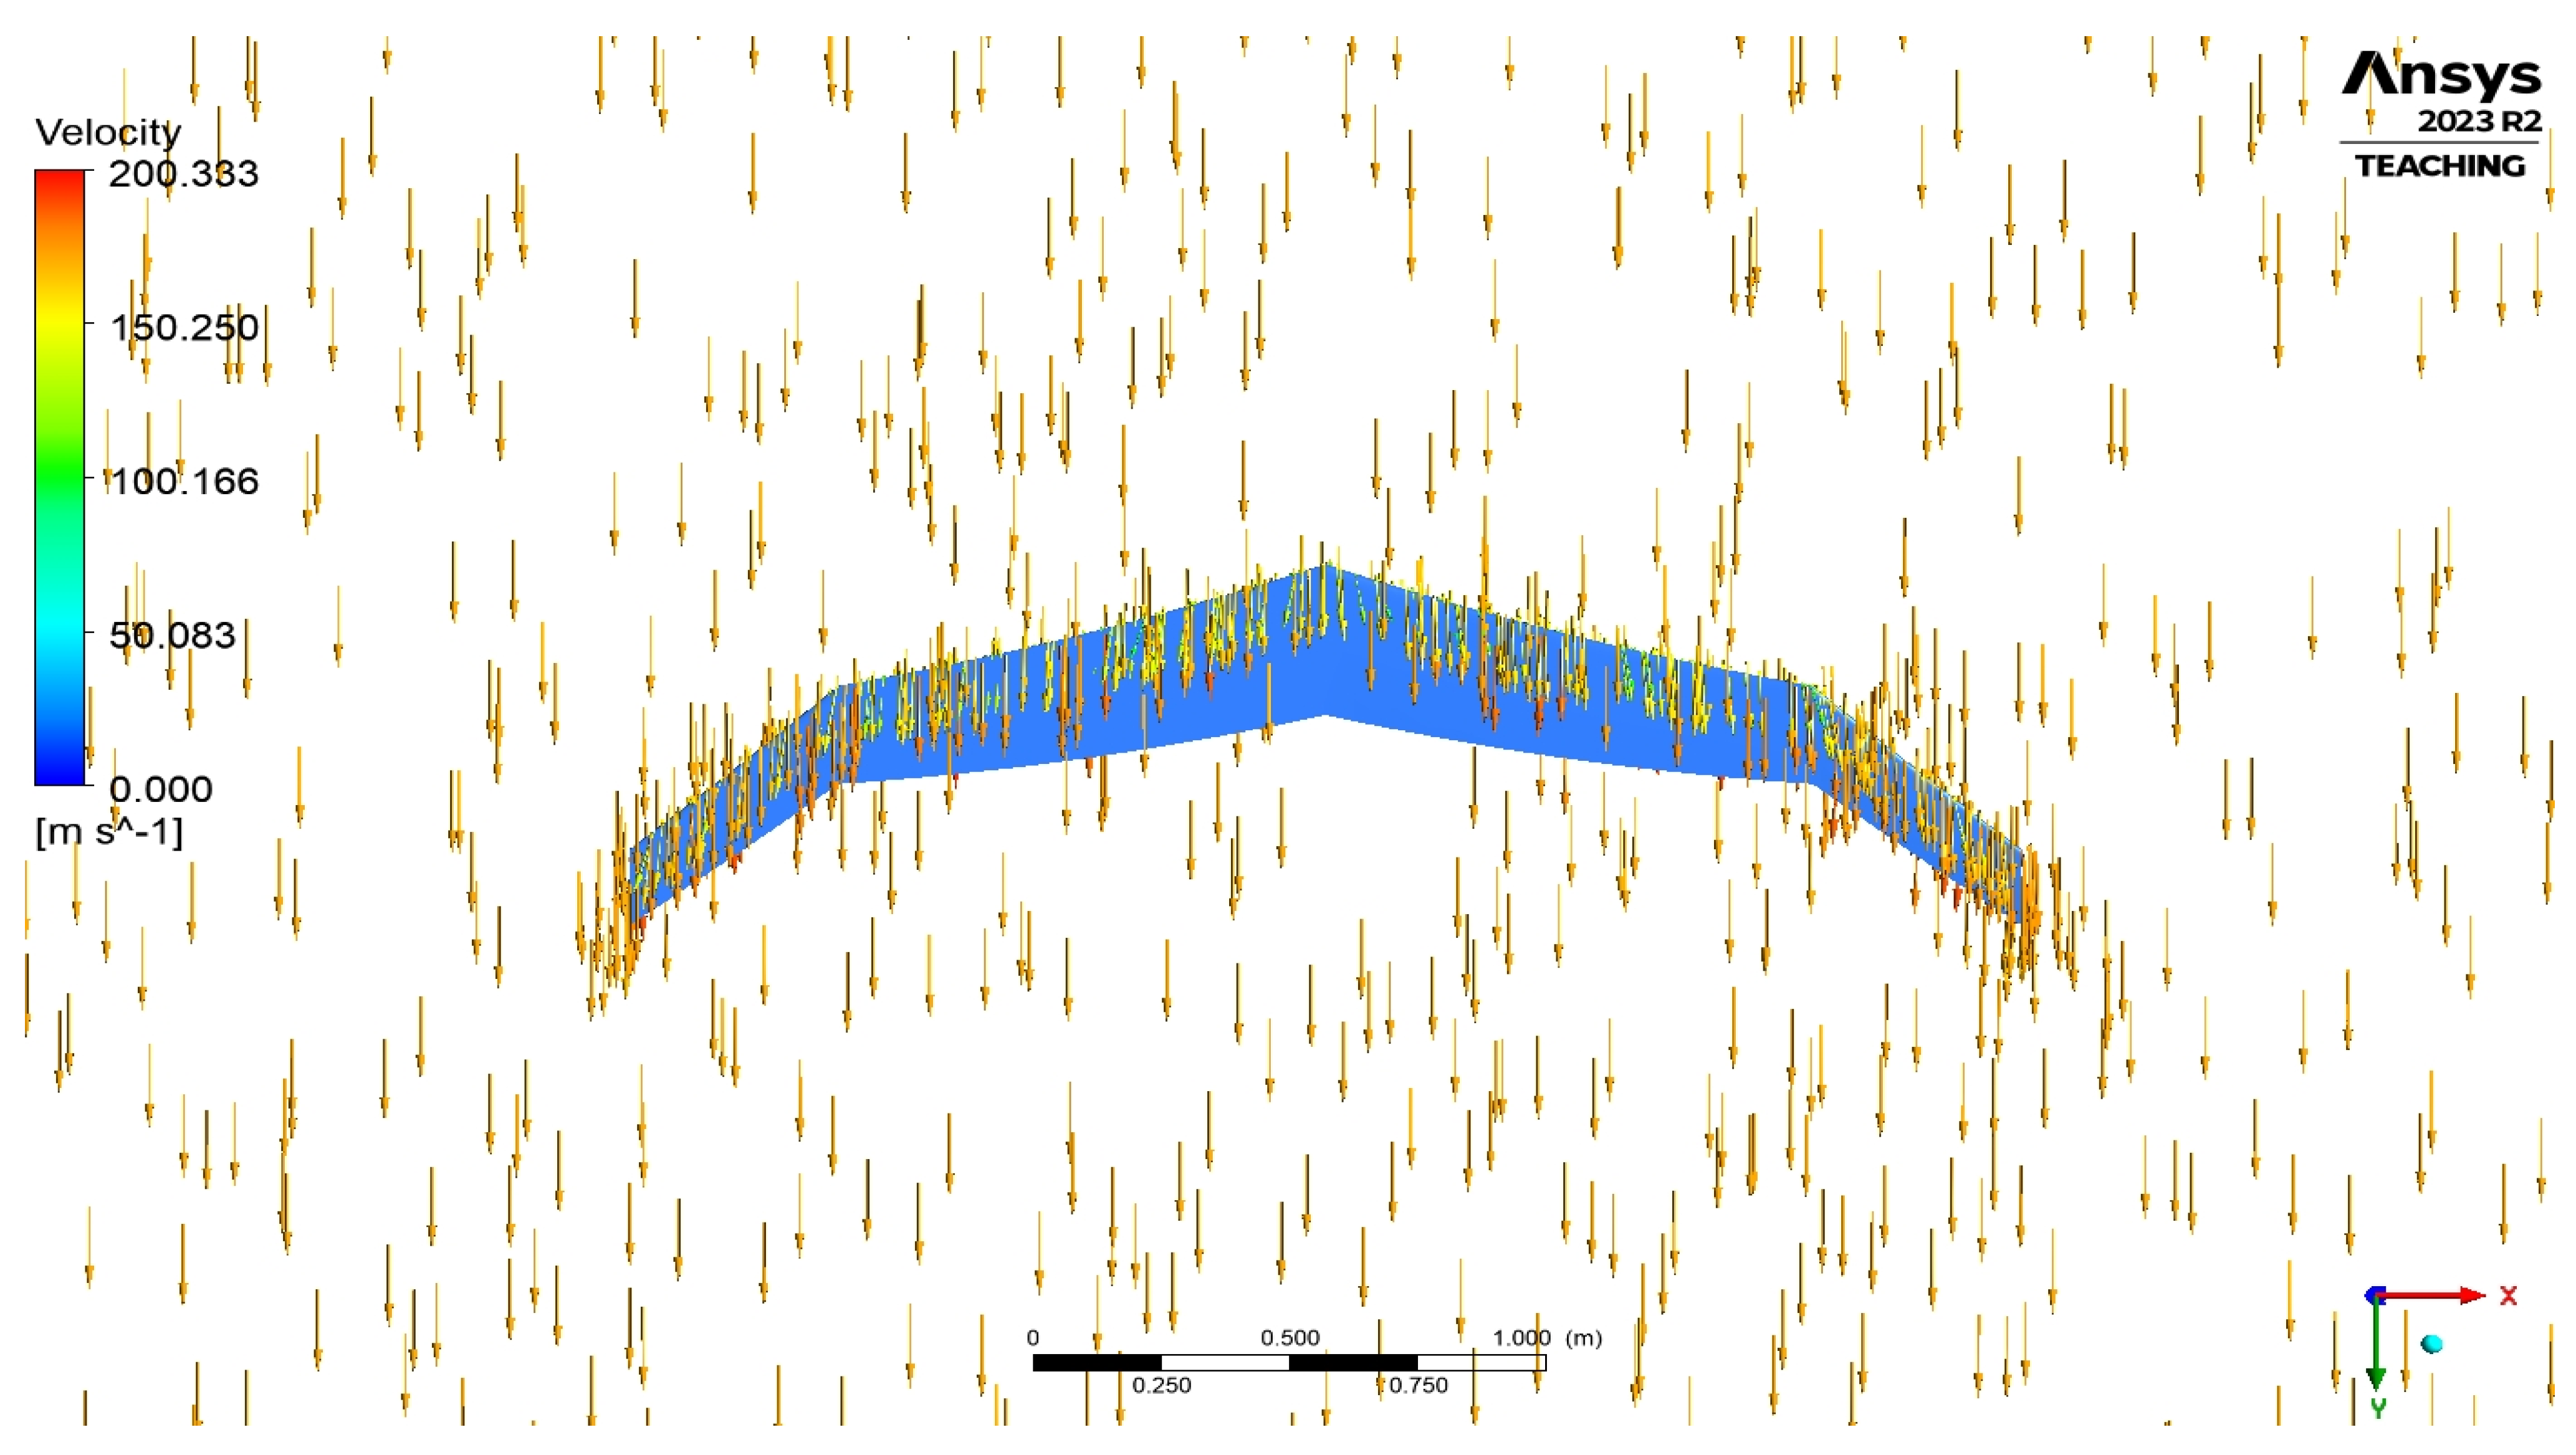
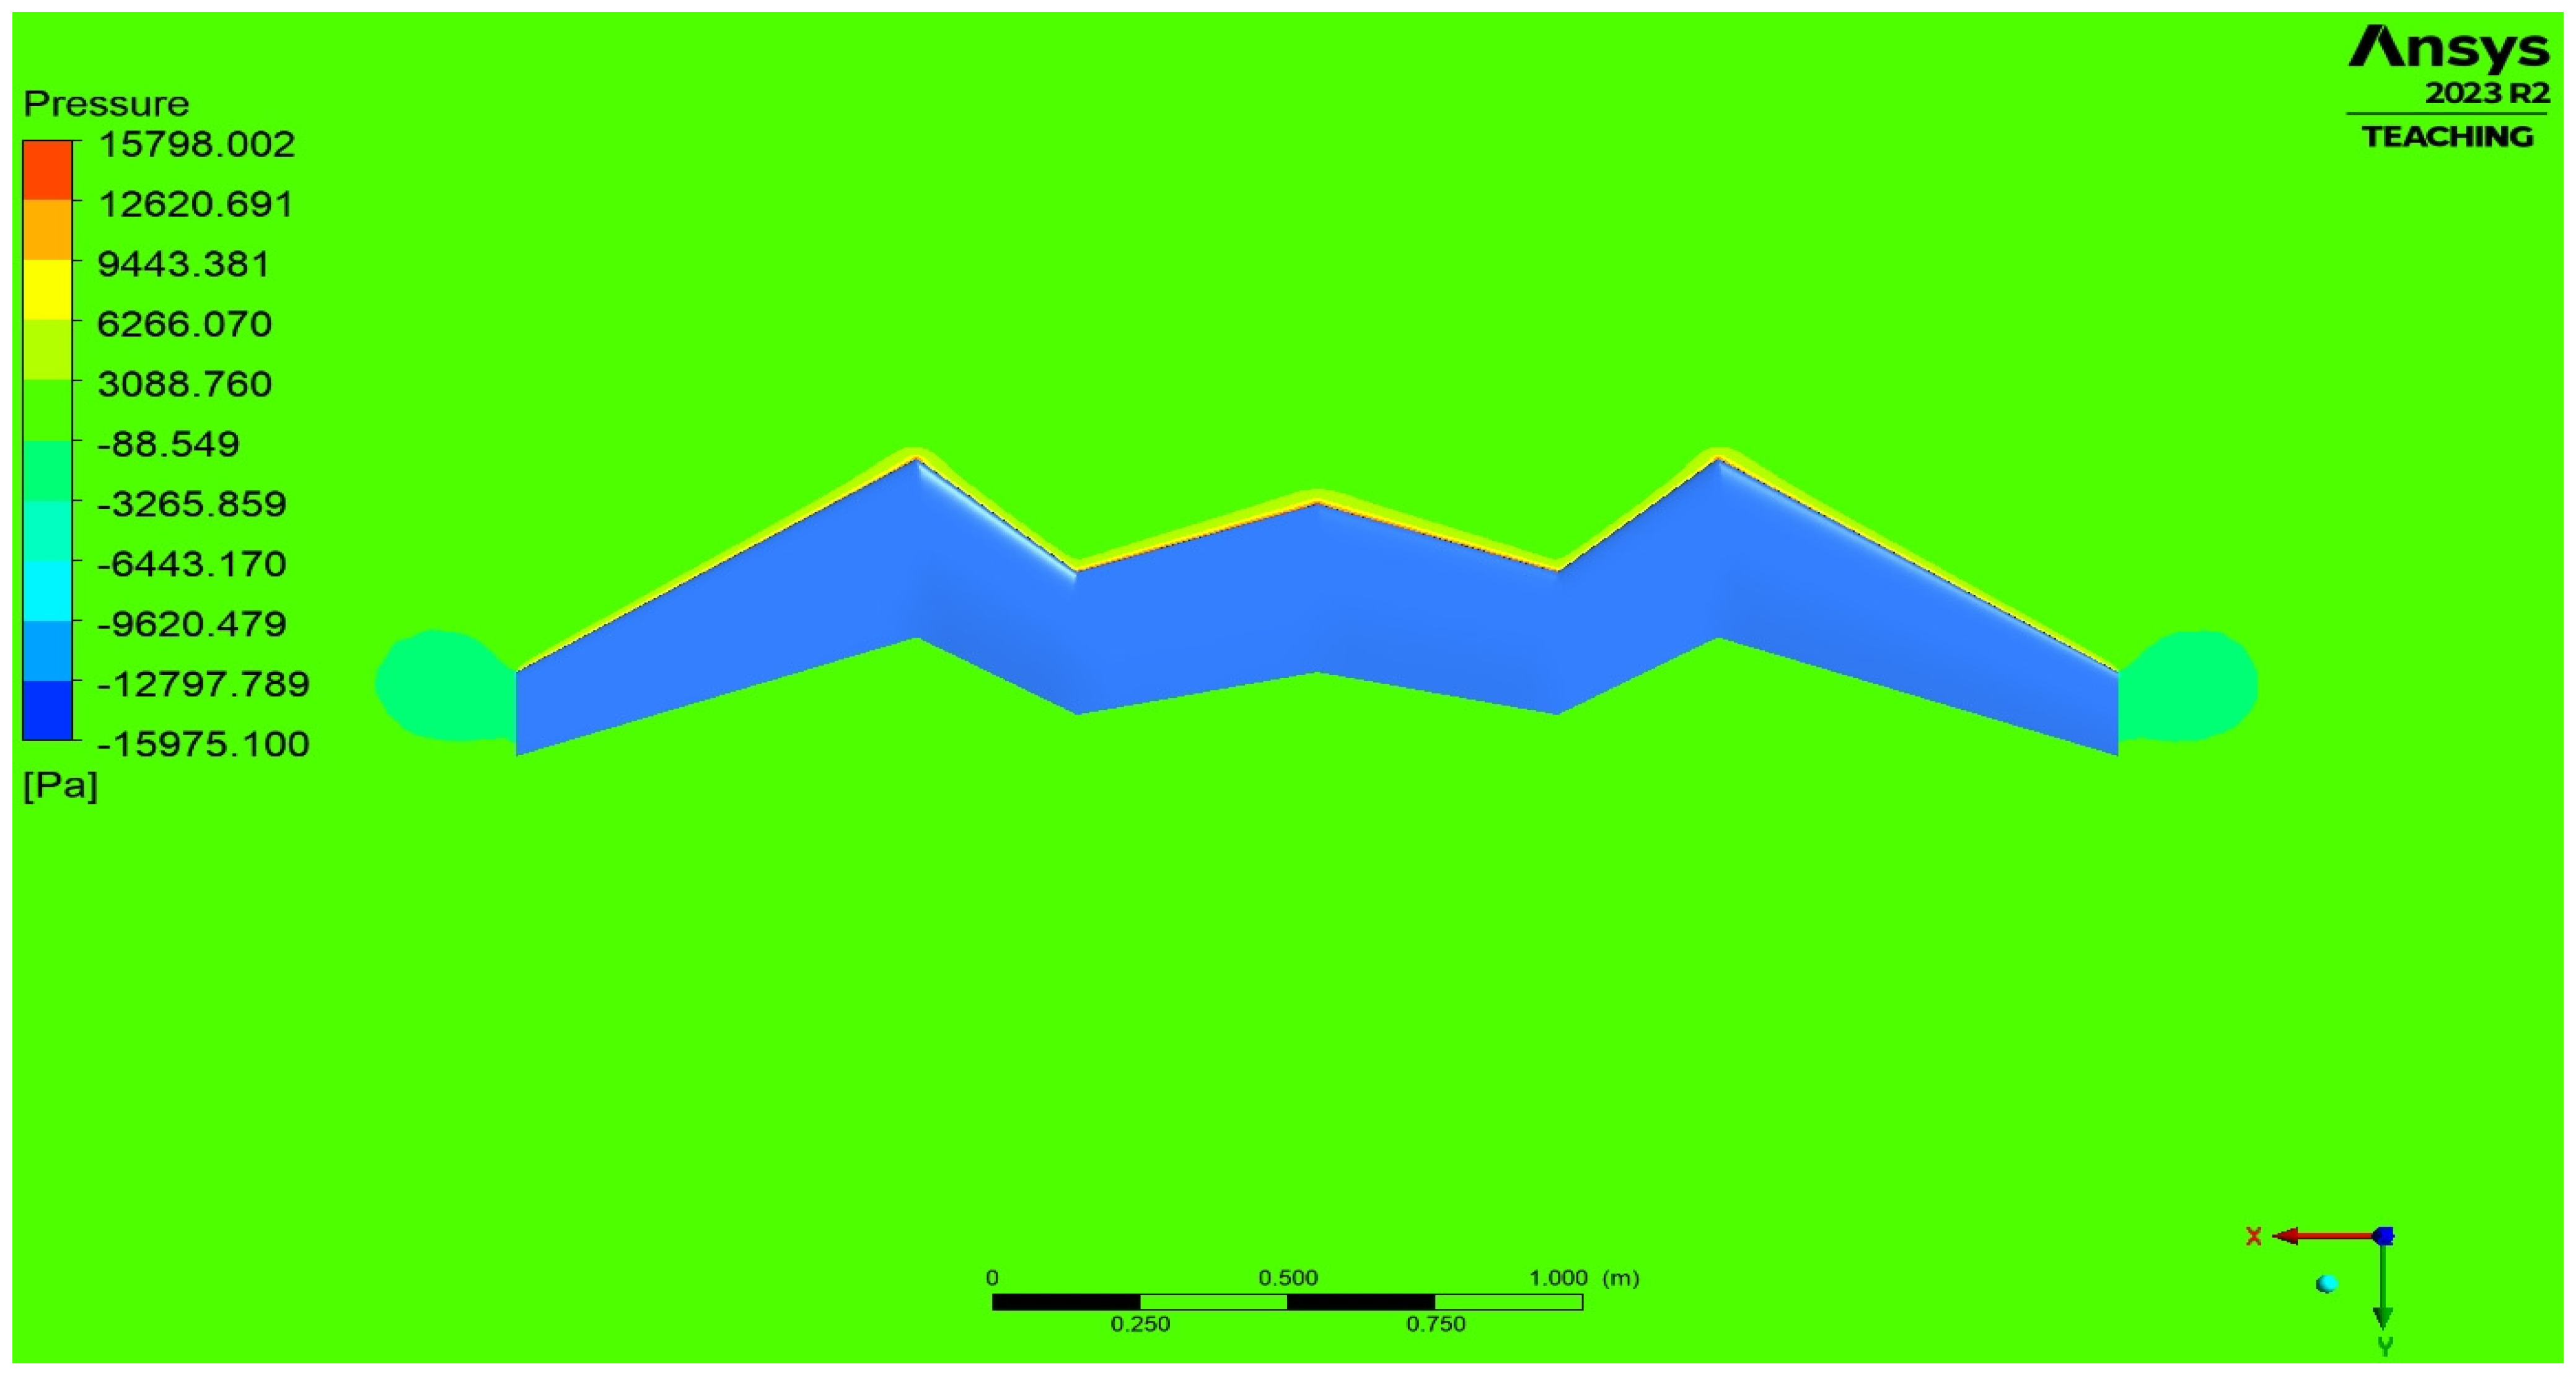
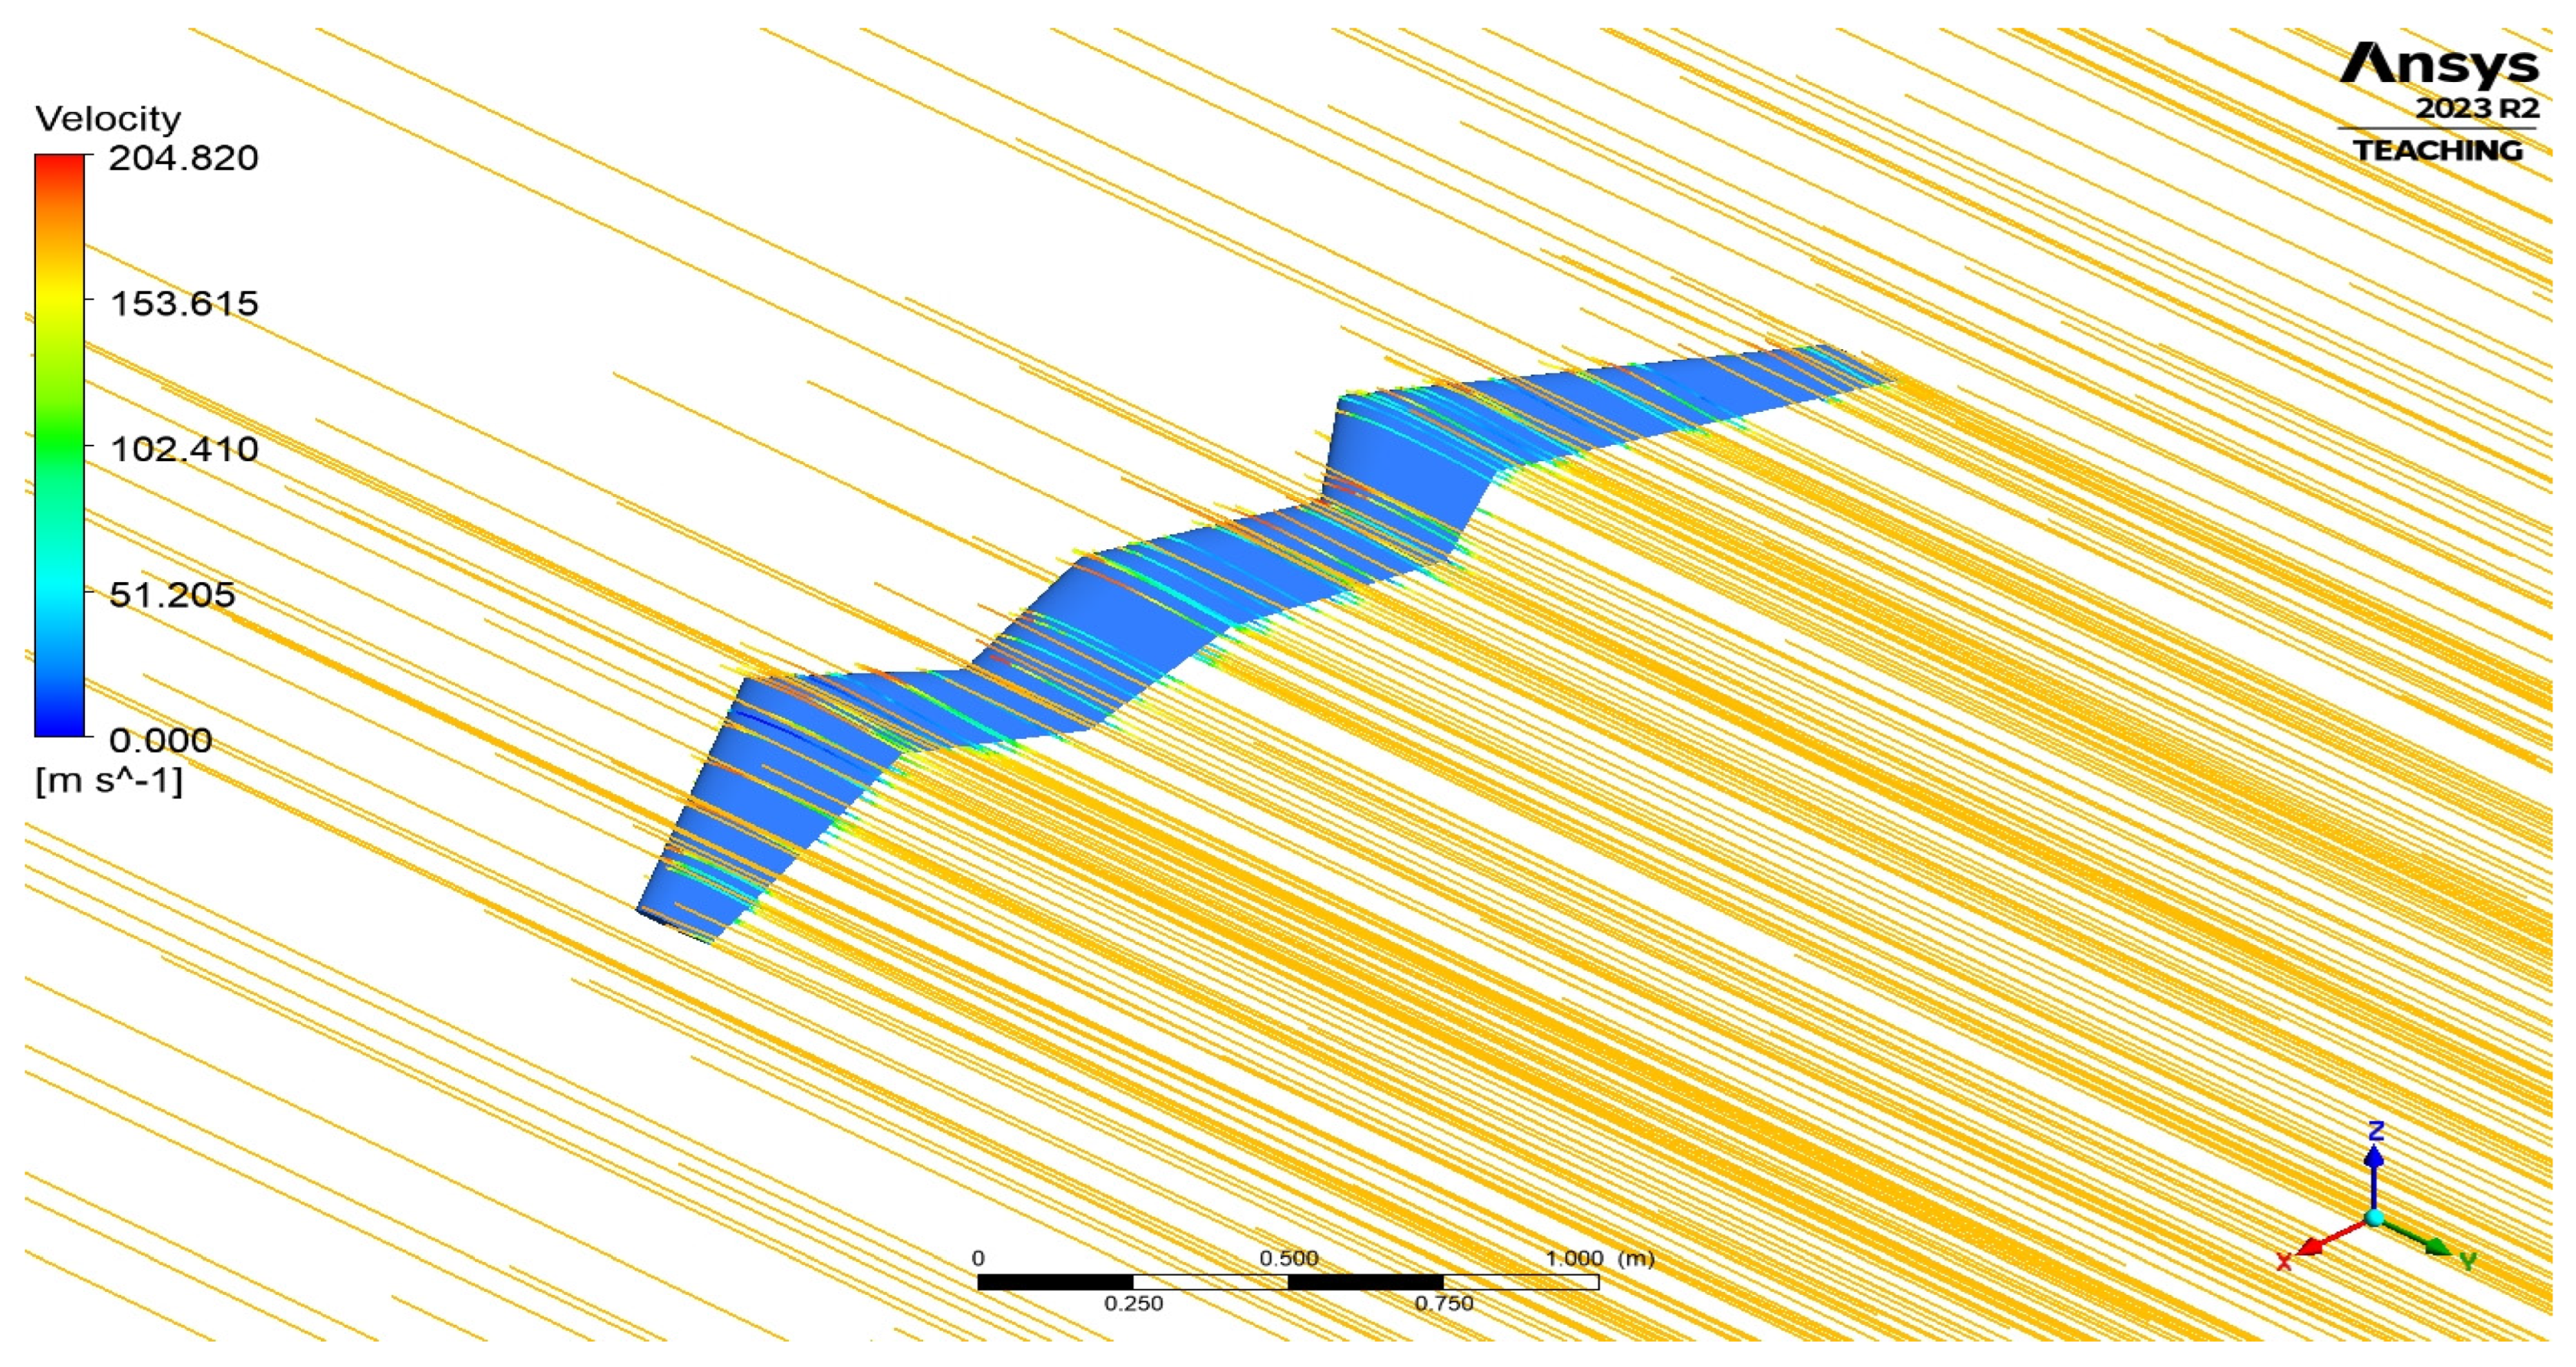
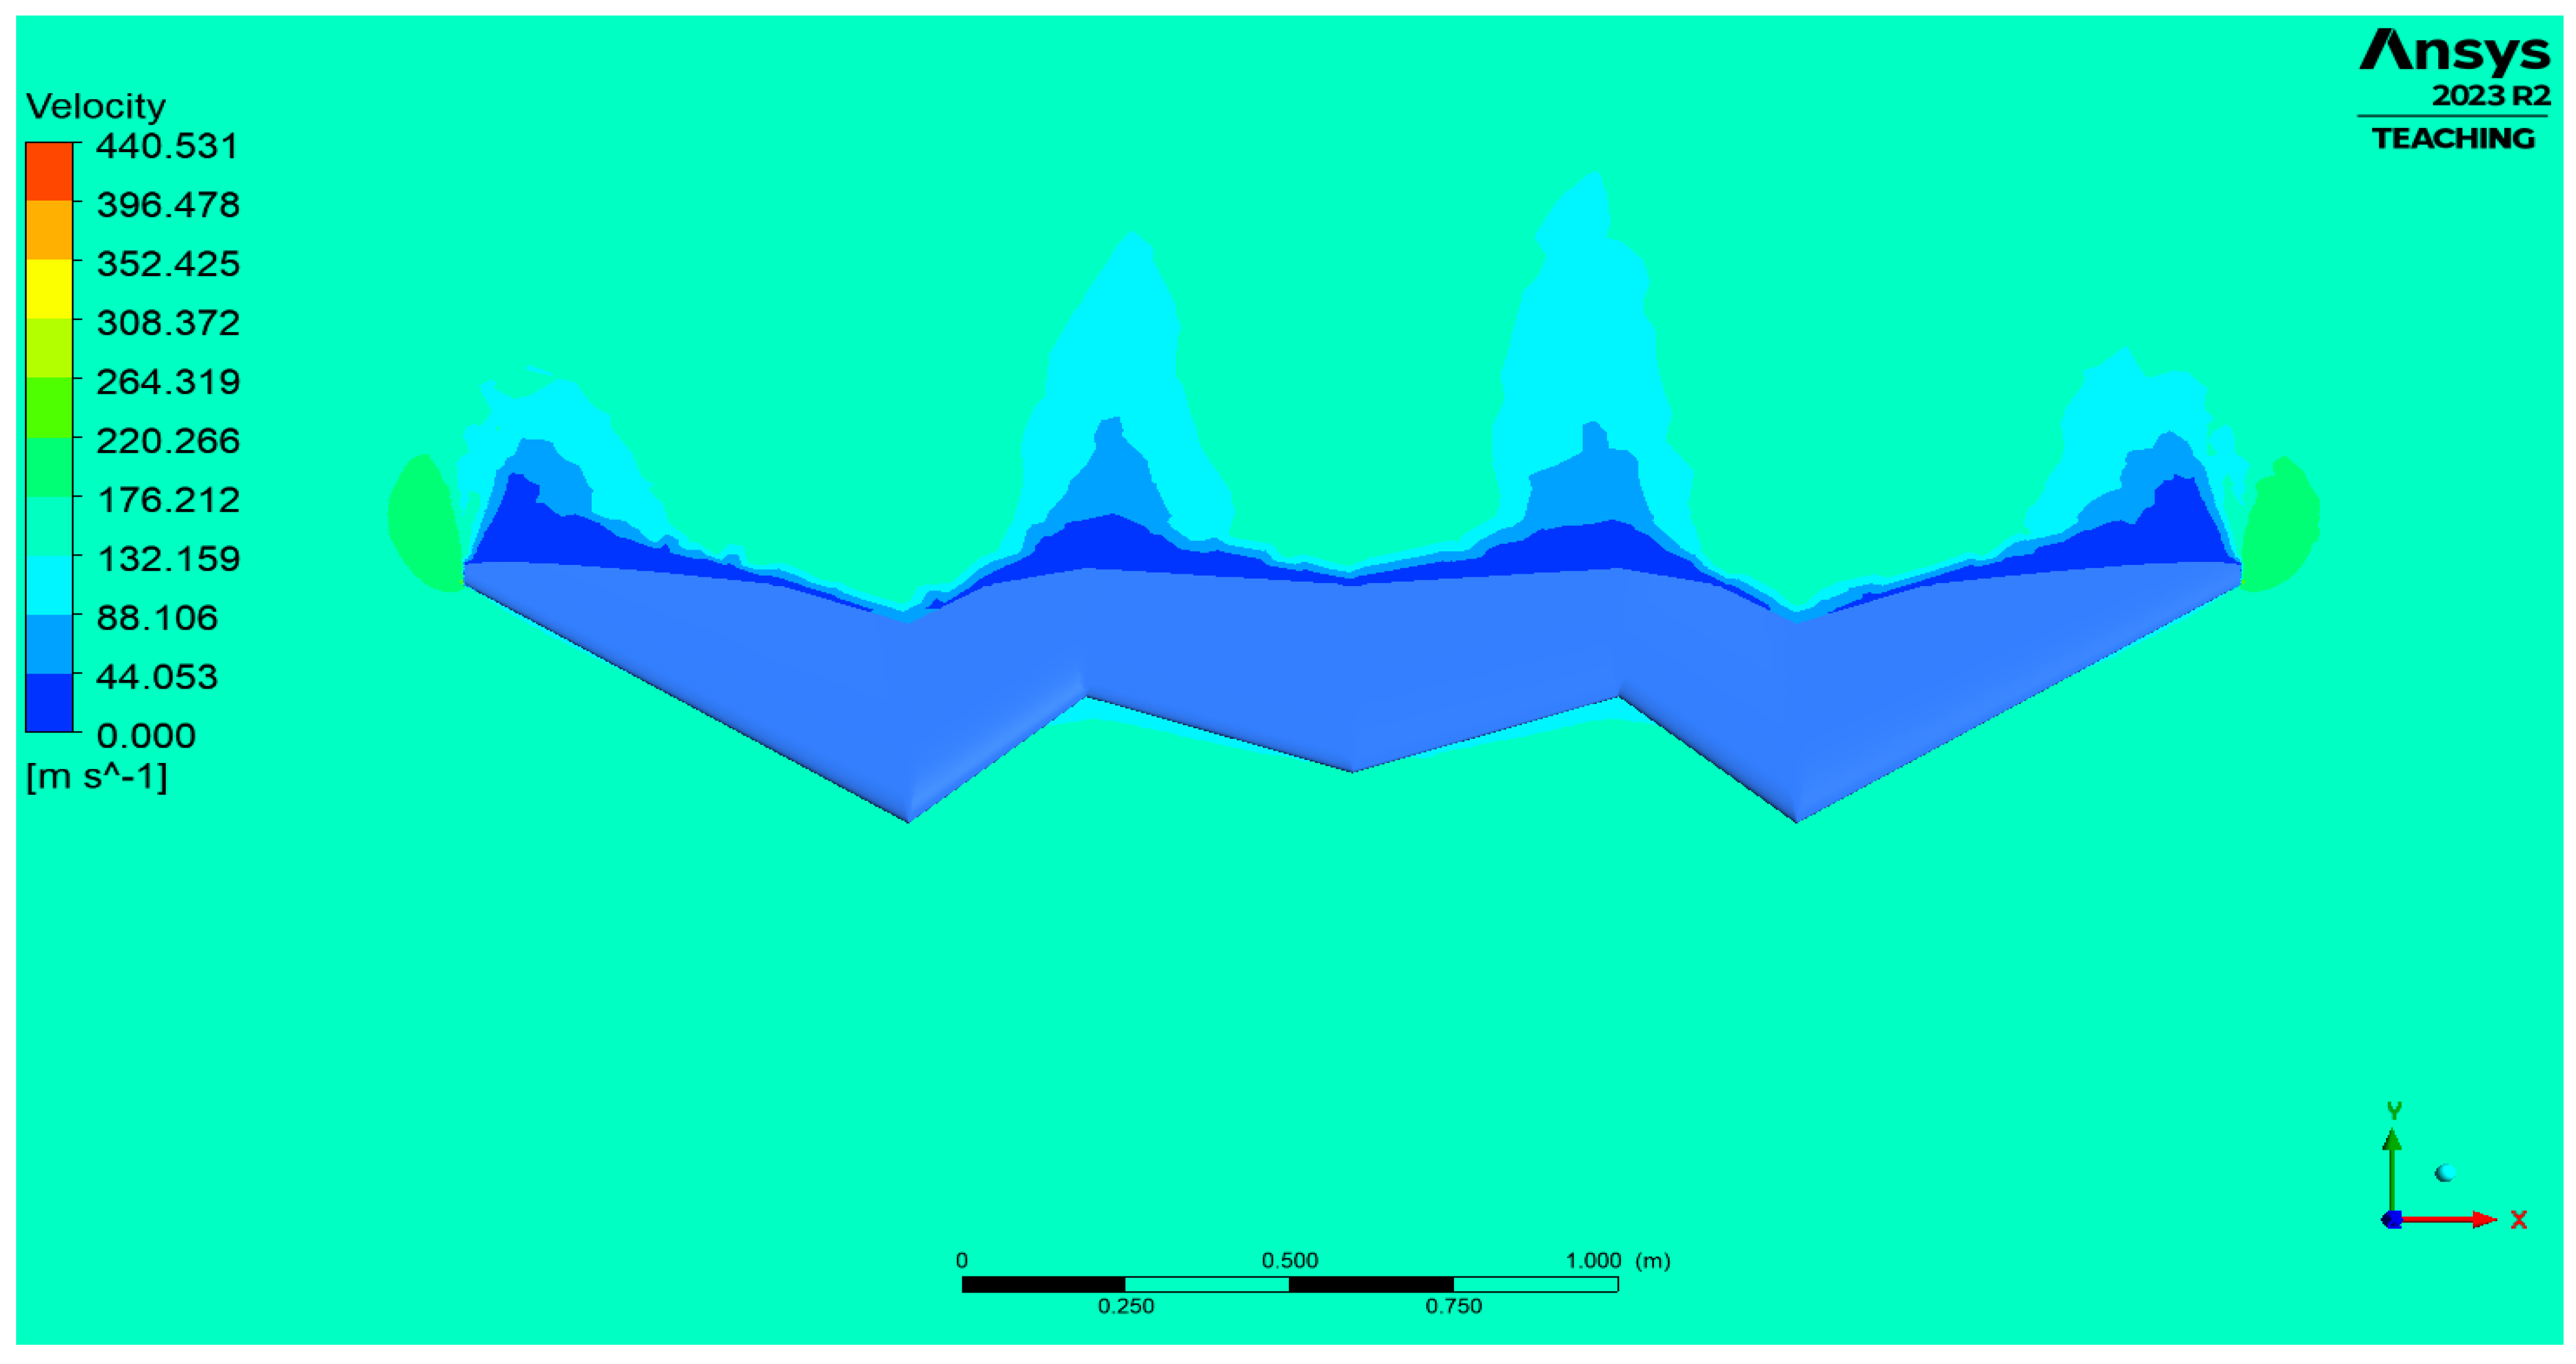
3.1.9. Flying Wing UAV-NIP-3
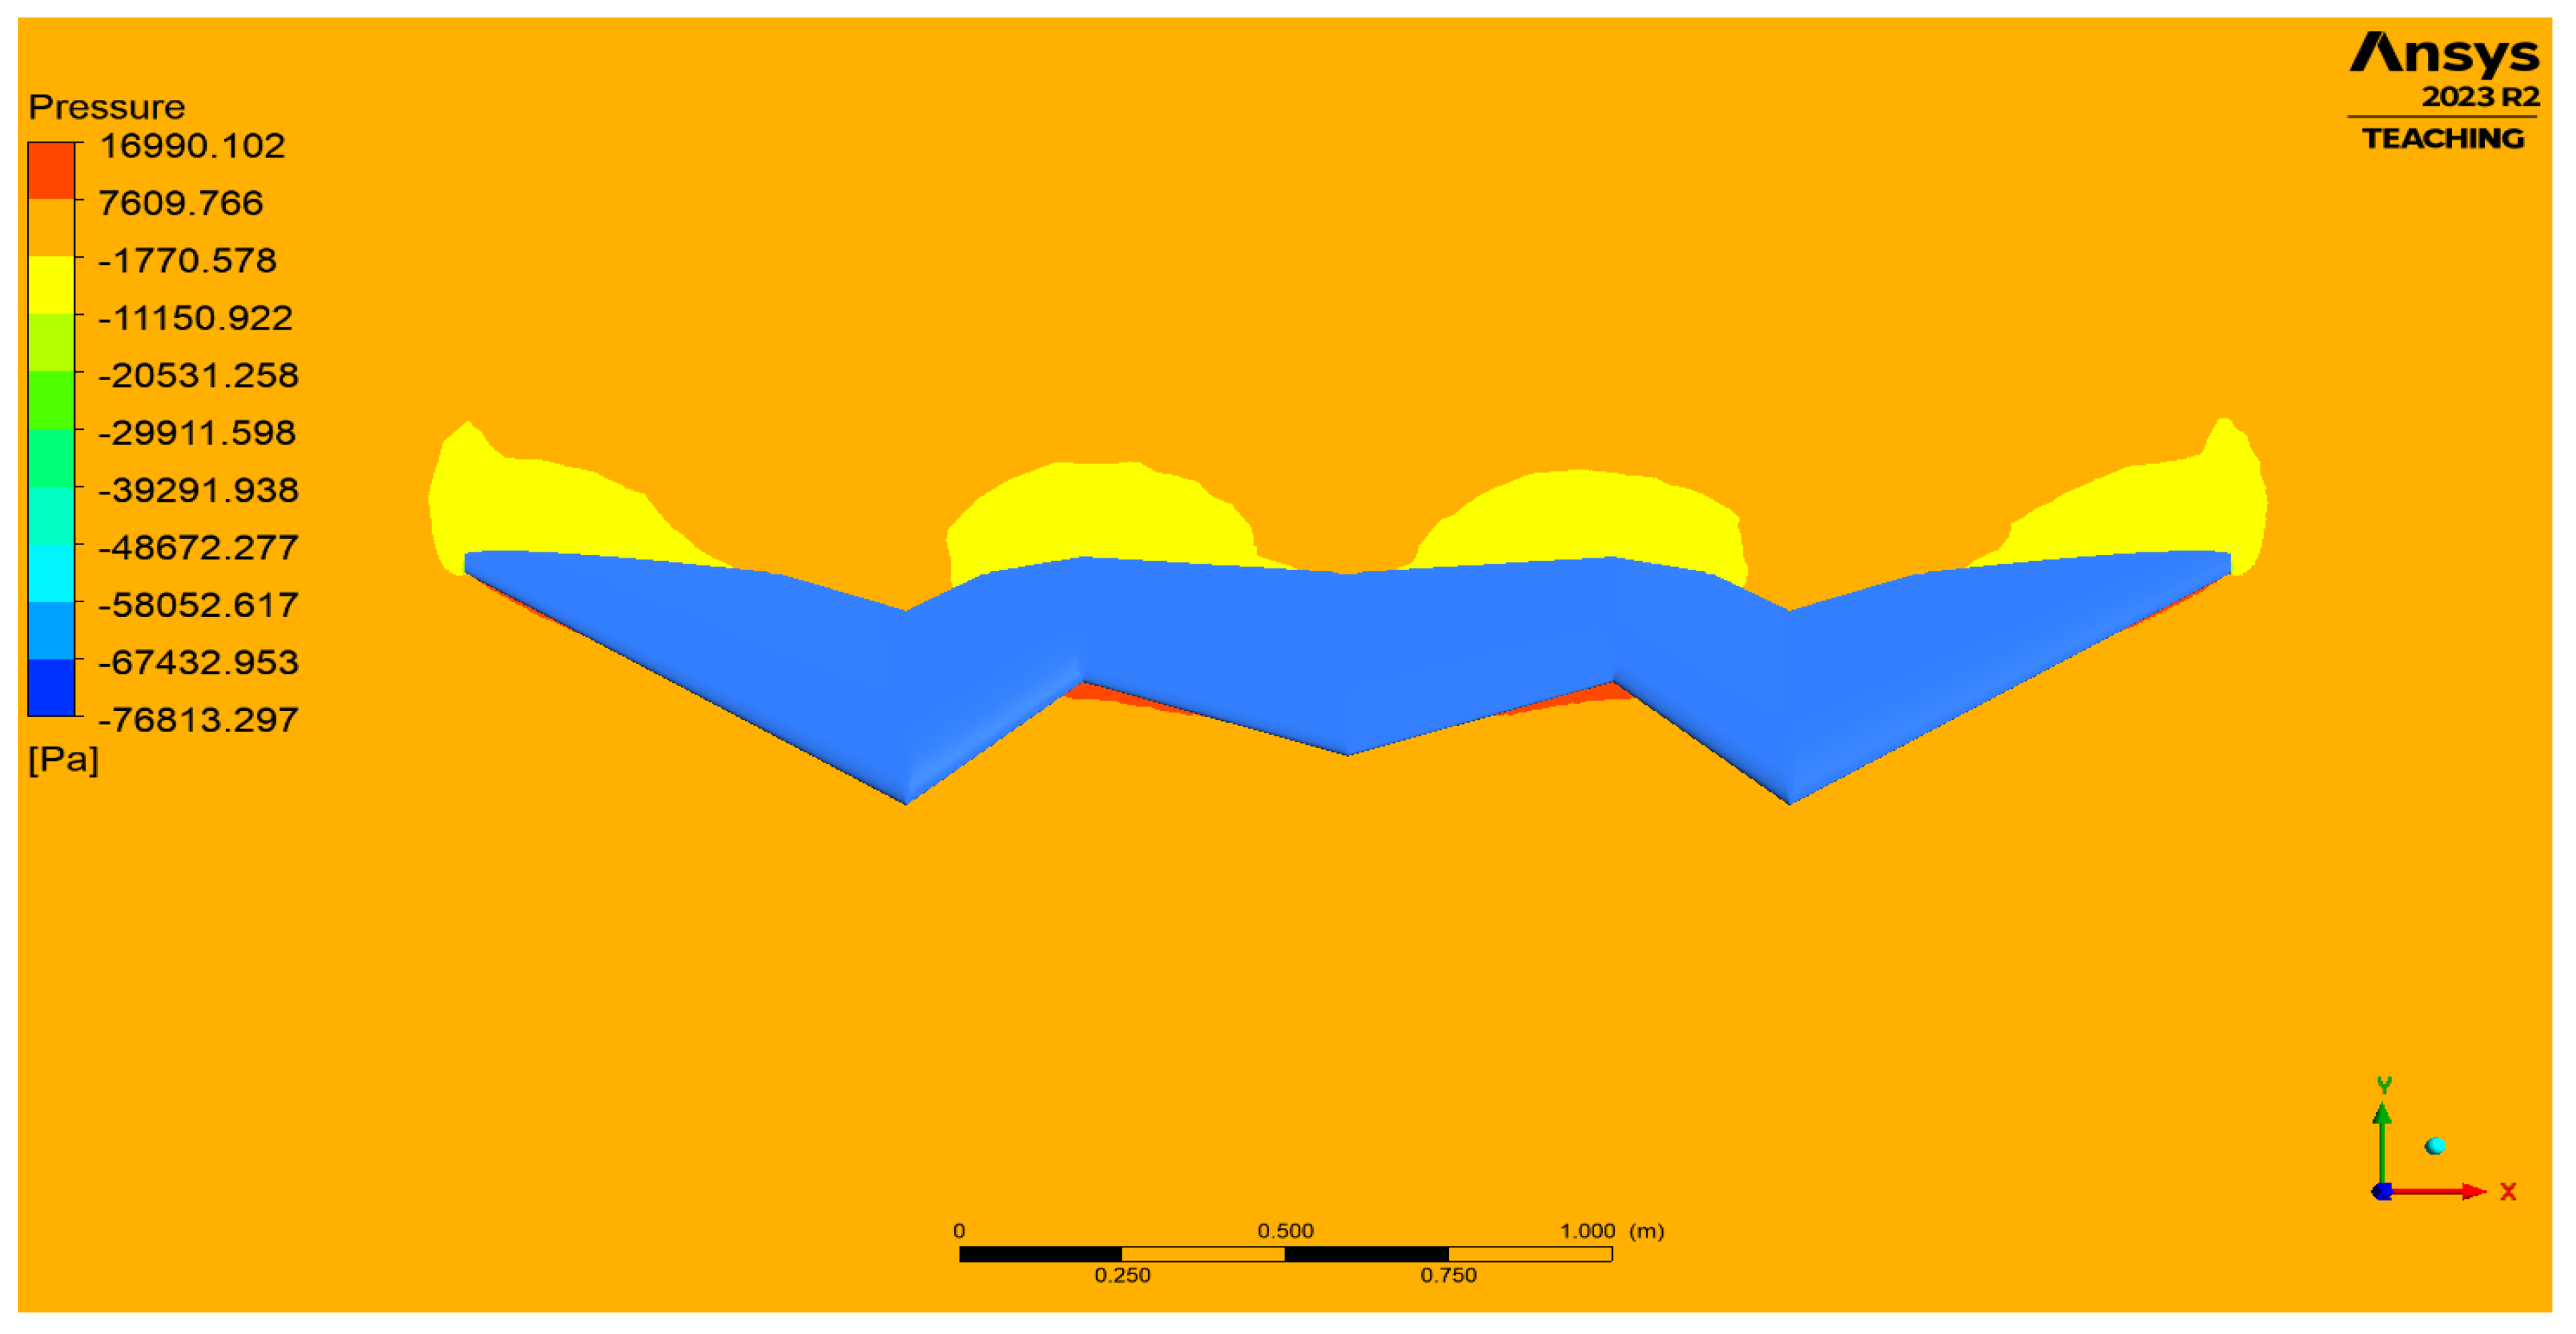
The flying wing UAV-NIP-3 design, inspired by the falcon, is simulated. The pressure and velocity variations over the model are revealed in Figure 57 and Figure 58.

Figure 57.
Pressure distribution around flying wing UAV-NIP-3.

Figure 58.
Velocity streamline around flying wing UAV-NIP-3.
3.1.10. Aerodynamic Forces Calculations
The aerodynamic forces, in addition to the maximum induced velocity and computed L/D ratio is determined. The graphical representation of the variations in lift, drag, induced velocity and calculated L/D ratio are shown in Figure 59, Figure 60, Figure 61 and Figure 62.
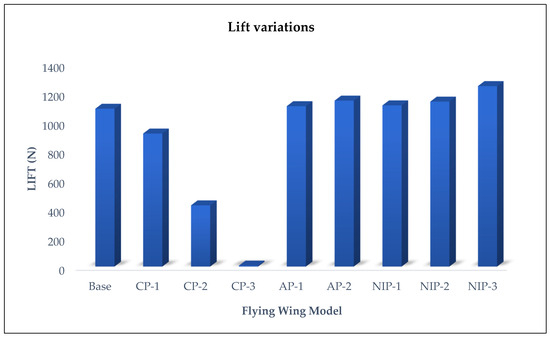
Figure 59.
Lift variations among the flying wing bodies.

Figure 60.
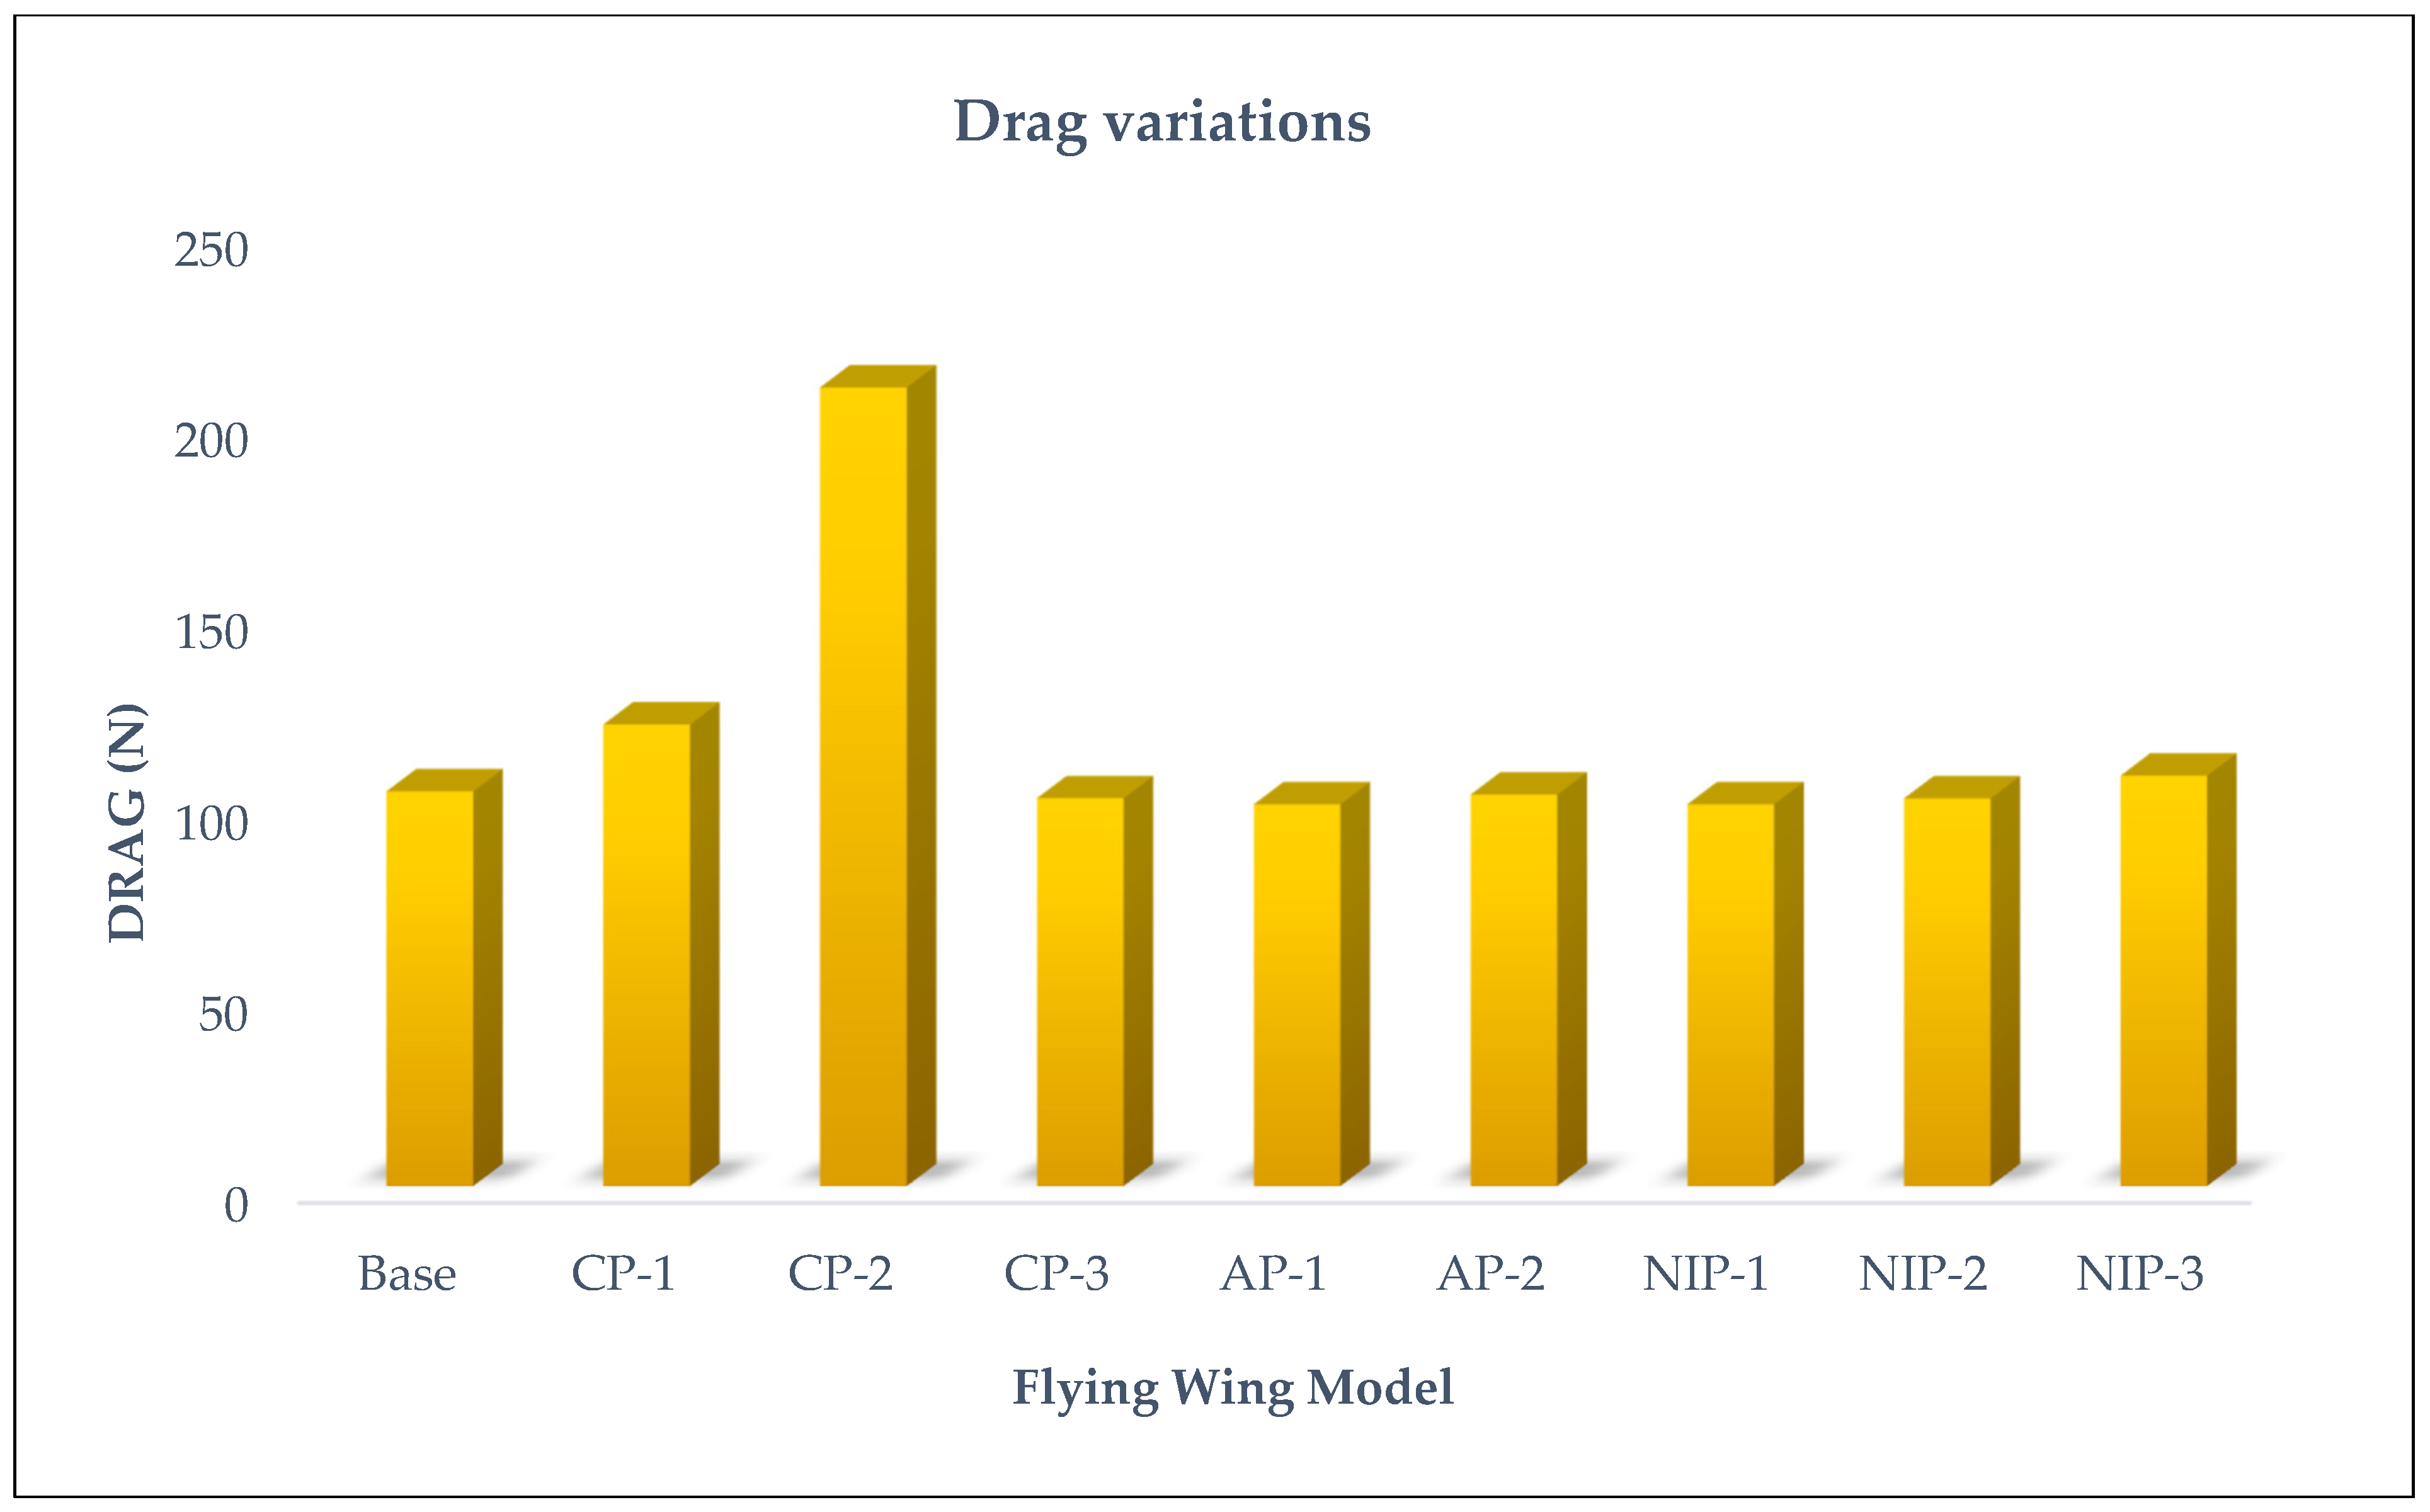
Drag variations for all the flying wing bodies.

Figure 61.
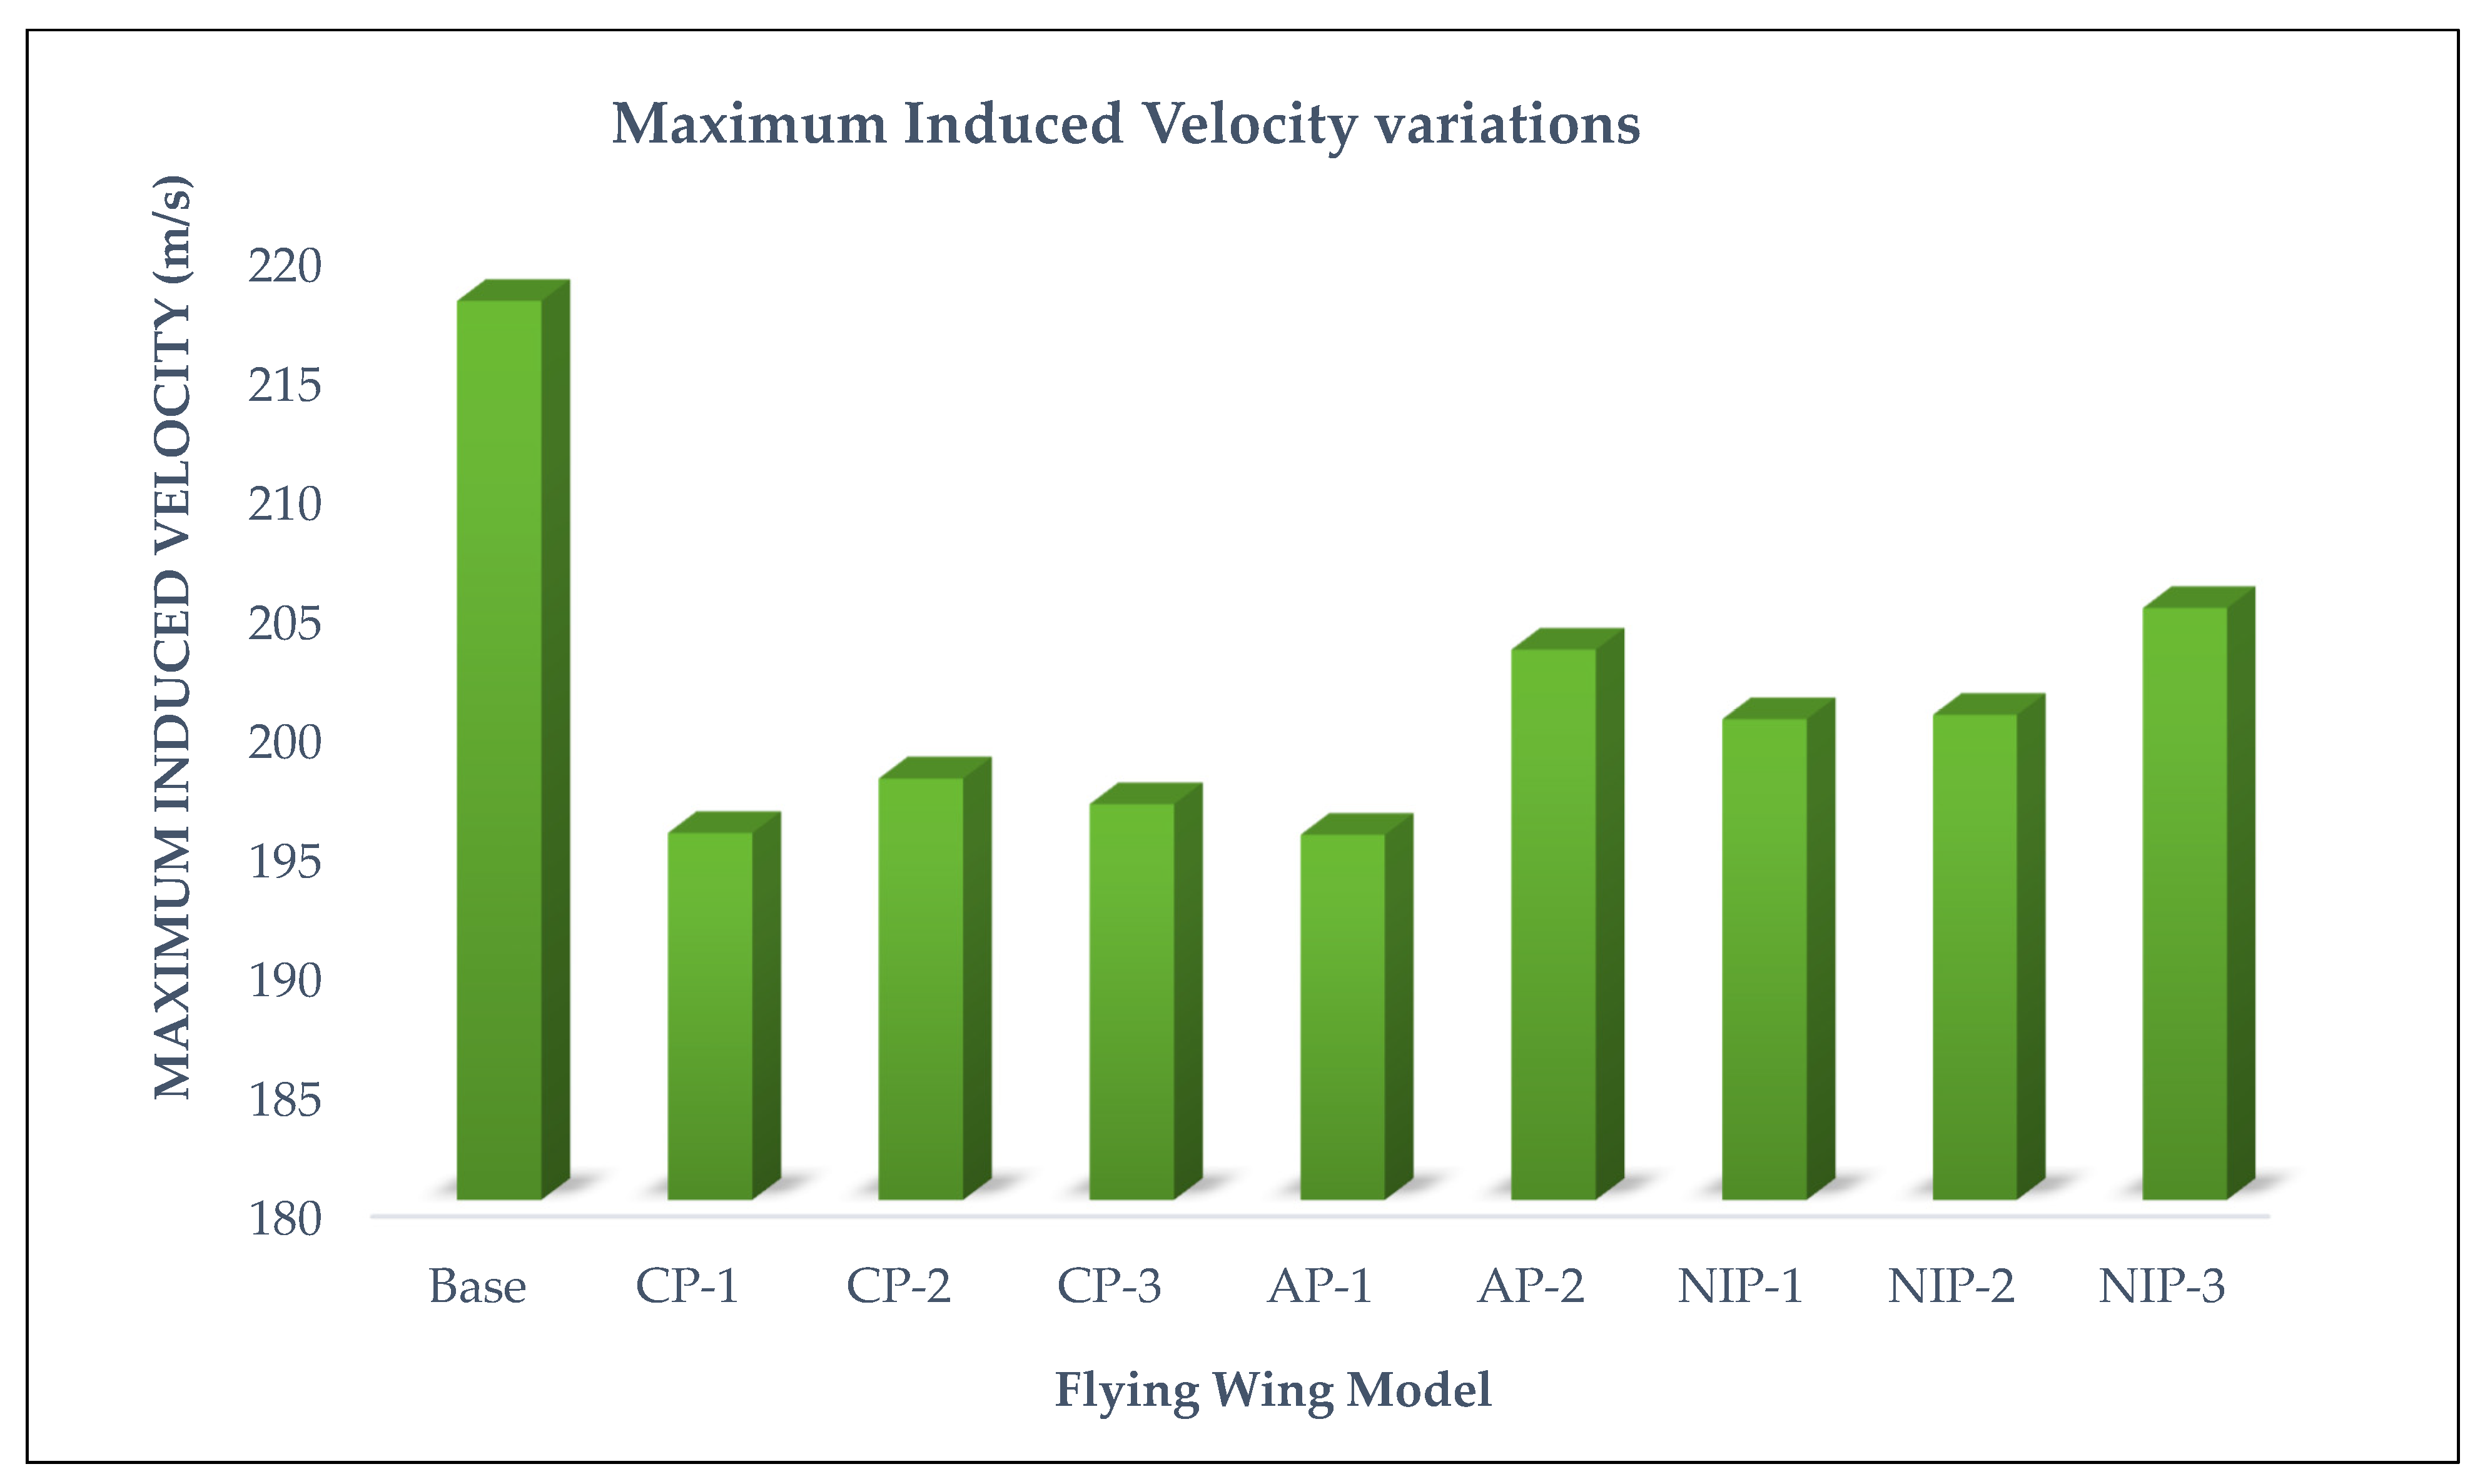
Induced velocity variations for the flying wing bodies.

Figure 62.
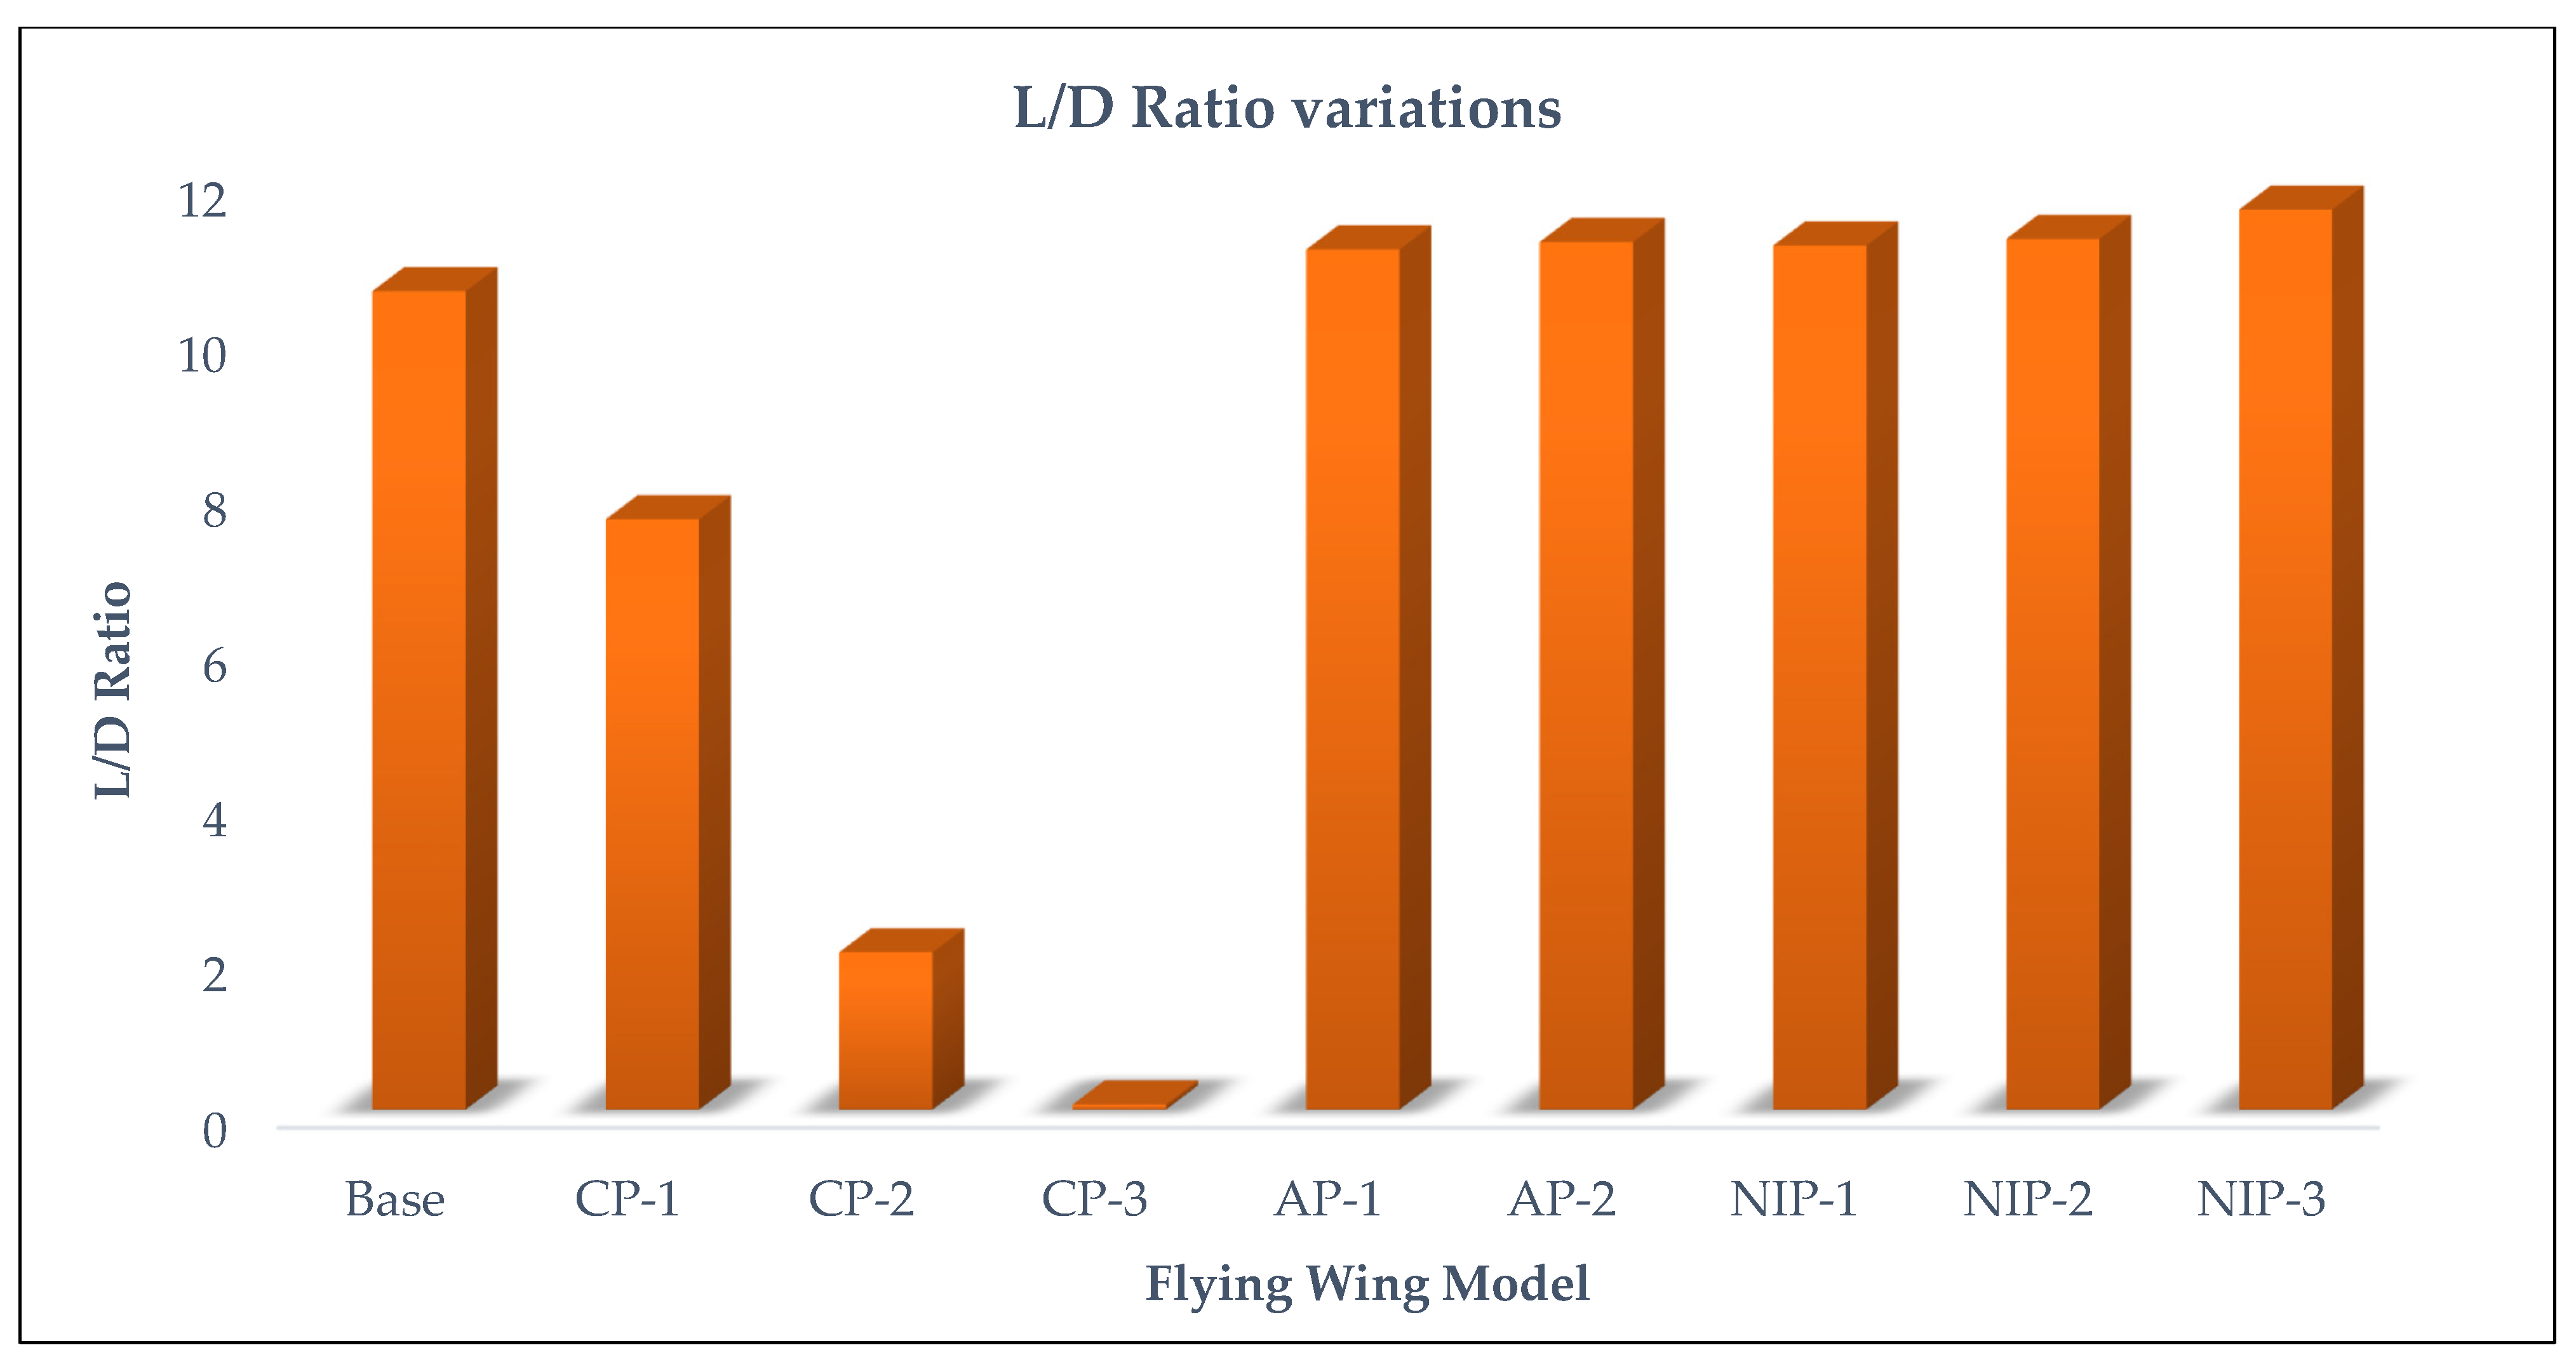
L/D ratio variations among the flying wing bodies.
3.1.11. Comprehensive Computations for Other AoAs
According to the constructed mission profile (Figure 1), no angle of attack variation is planned during the operation of the proposed flying wing UAV due to its VTOL capability. However, simultaneous changes in altitude and length of travel due to gust loadings are simulated and are revealed in the control dynamics section. For this slight change in angle of attack due to external parameters, a 7° change in angle is implemented and simulated for testing purposes. The results of the same are revealed in Figure 63 and Figure 64. From these results, a positive result of 13.027 L/D ratio is observed, which is considered enough for successful flight operation.

Figure 63.
Pressure contour around flying wing NIP-3 model at 7° AOA.

Figure 64.
Velocity contour around flying wing NIP-3 model at 7° AOA.
3.2. FSI Simulations
The FSI analysis is done for models flying wing UAV Base and flying wing UAV-NIP-3 as they perform better among the other configurations, with various materials to be implemented over the flying wing using one-way coupling approach in which the pressure loads from the CFD analysis’ results are imported to the structural solver to determine its materialistic behavior changes. The results are revealed as stress and deformation contours from Figure 65, Figure 66, Figure 67, Figure 68, Figure 69, Figure 70, Figure 71 and Figure 72. The advanced composite materials considered for this study include categories of Boron Fiber Reinforced Polymer (BFRP), Kevlar Fiber Reinforced Polymer (KFRP), Glass Fiber Reinforced Polymers and Carbon Fiber Reinforced Polymers (CFRP) [30,31]. The detailed list of advanced composite materials imposed are revealed in Table 8.

Figure 65.
Equivalent Stress variations on flying wing UAV Base—CFRP-UD-Pg-395-GPa.
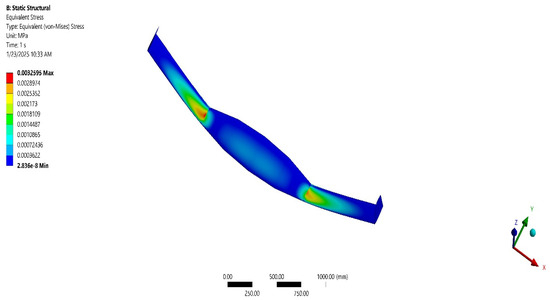
Figure 66.
Equivalent Stress variations on flying wing UAV Base—HMS-CFRP.

Figure 67.
Total deformation on flying wing UAV Base—GY-70-CFRP.

Figure 68.
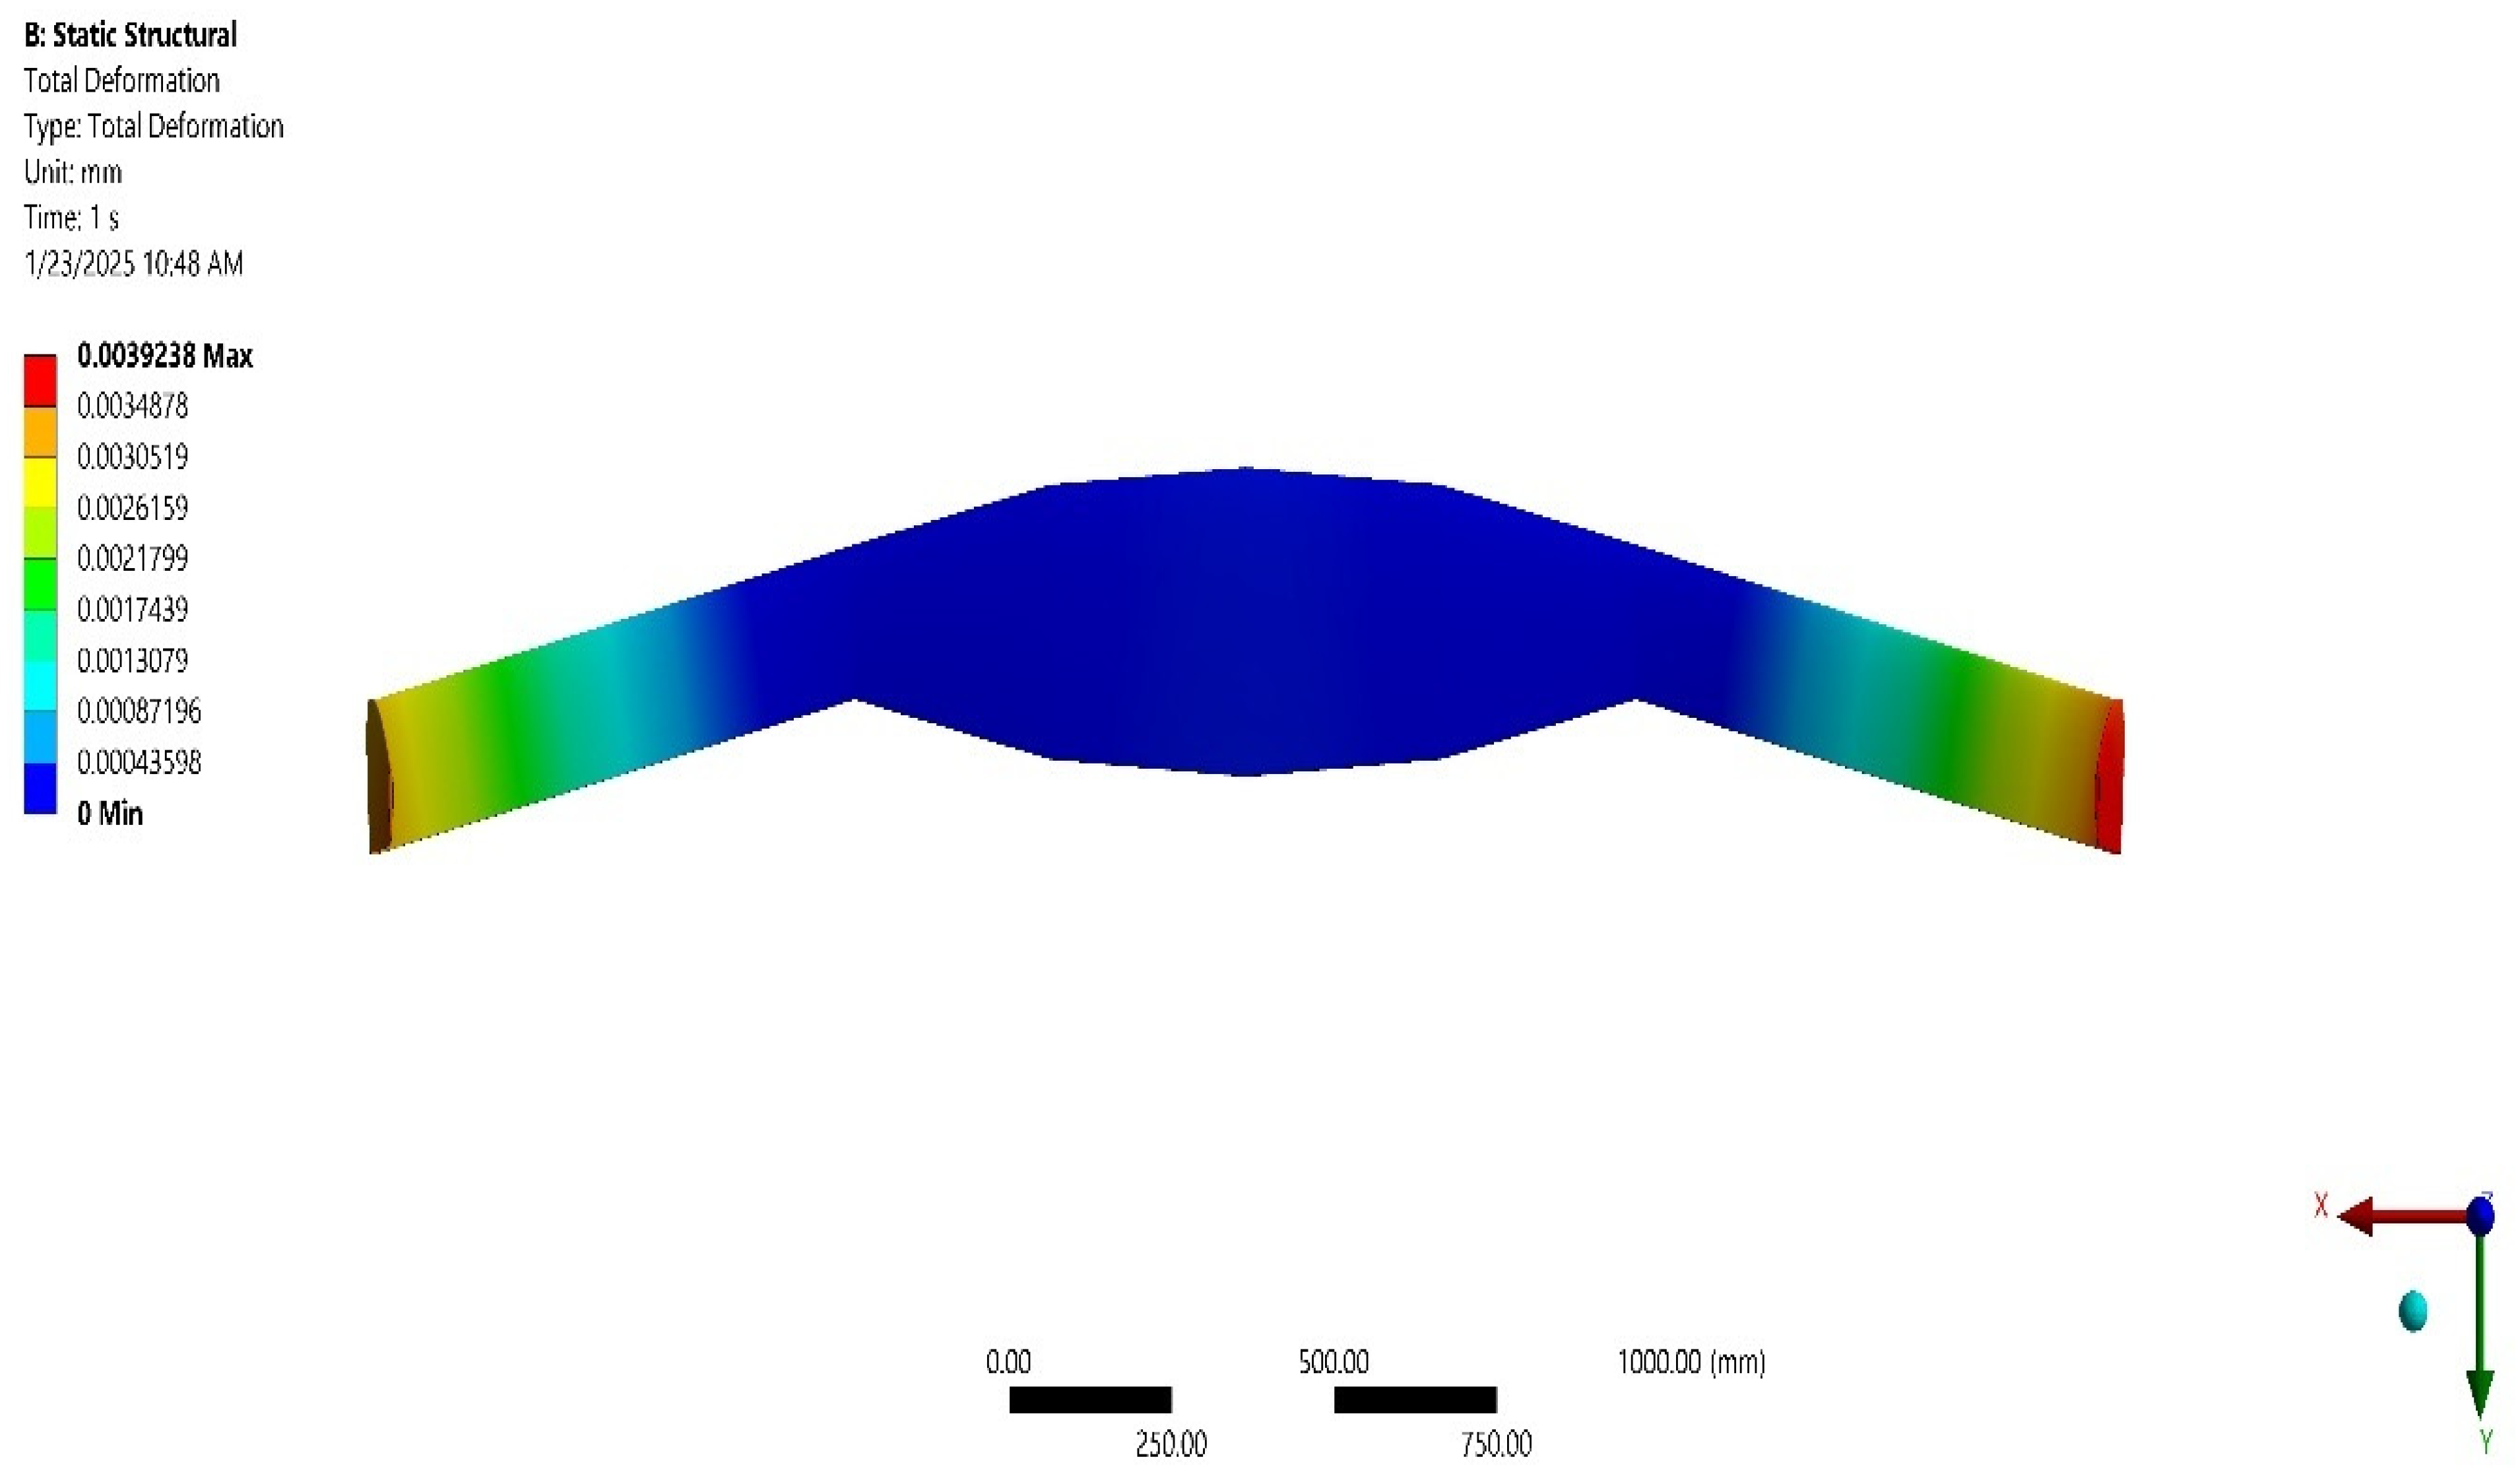
Total deformation on flying wing UAV Base—FR-4-GFRP-FABRIC.
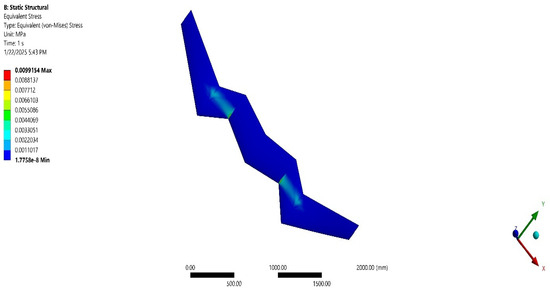
Figure 69.
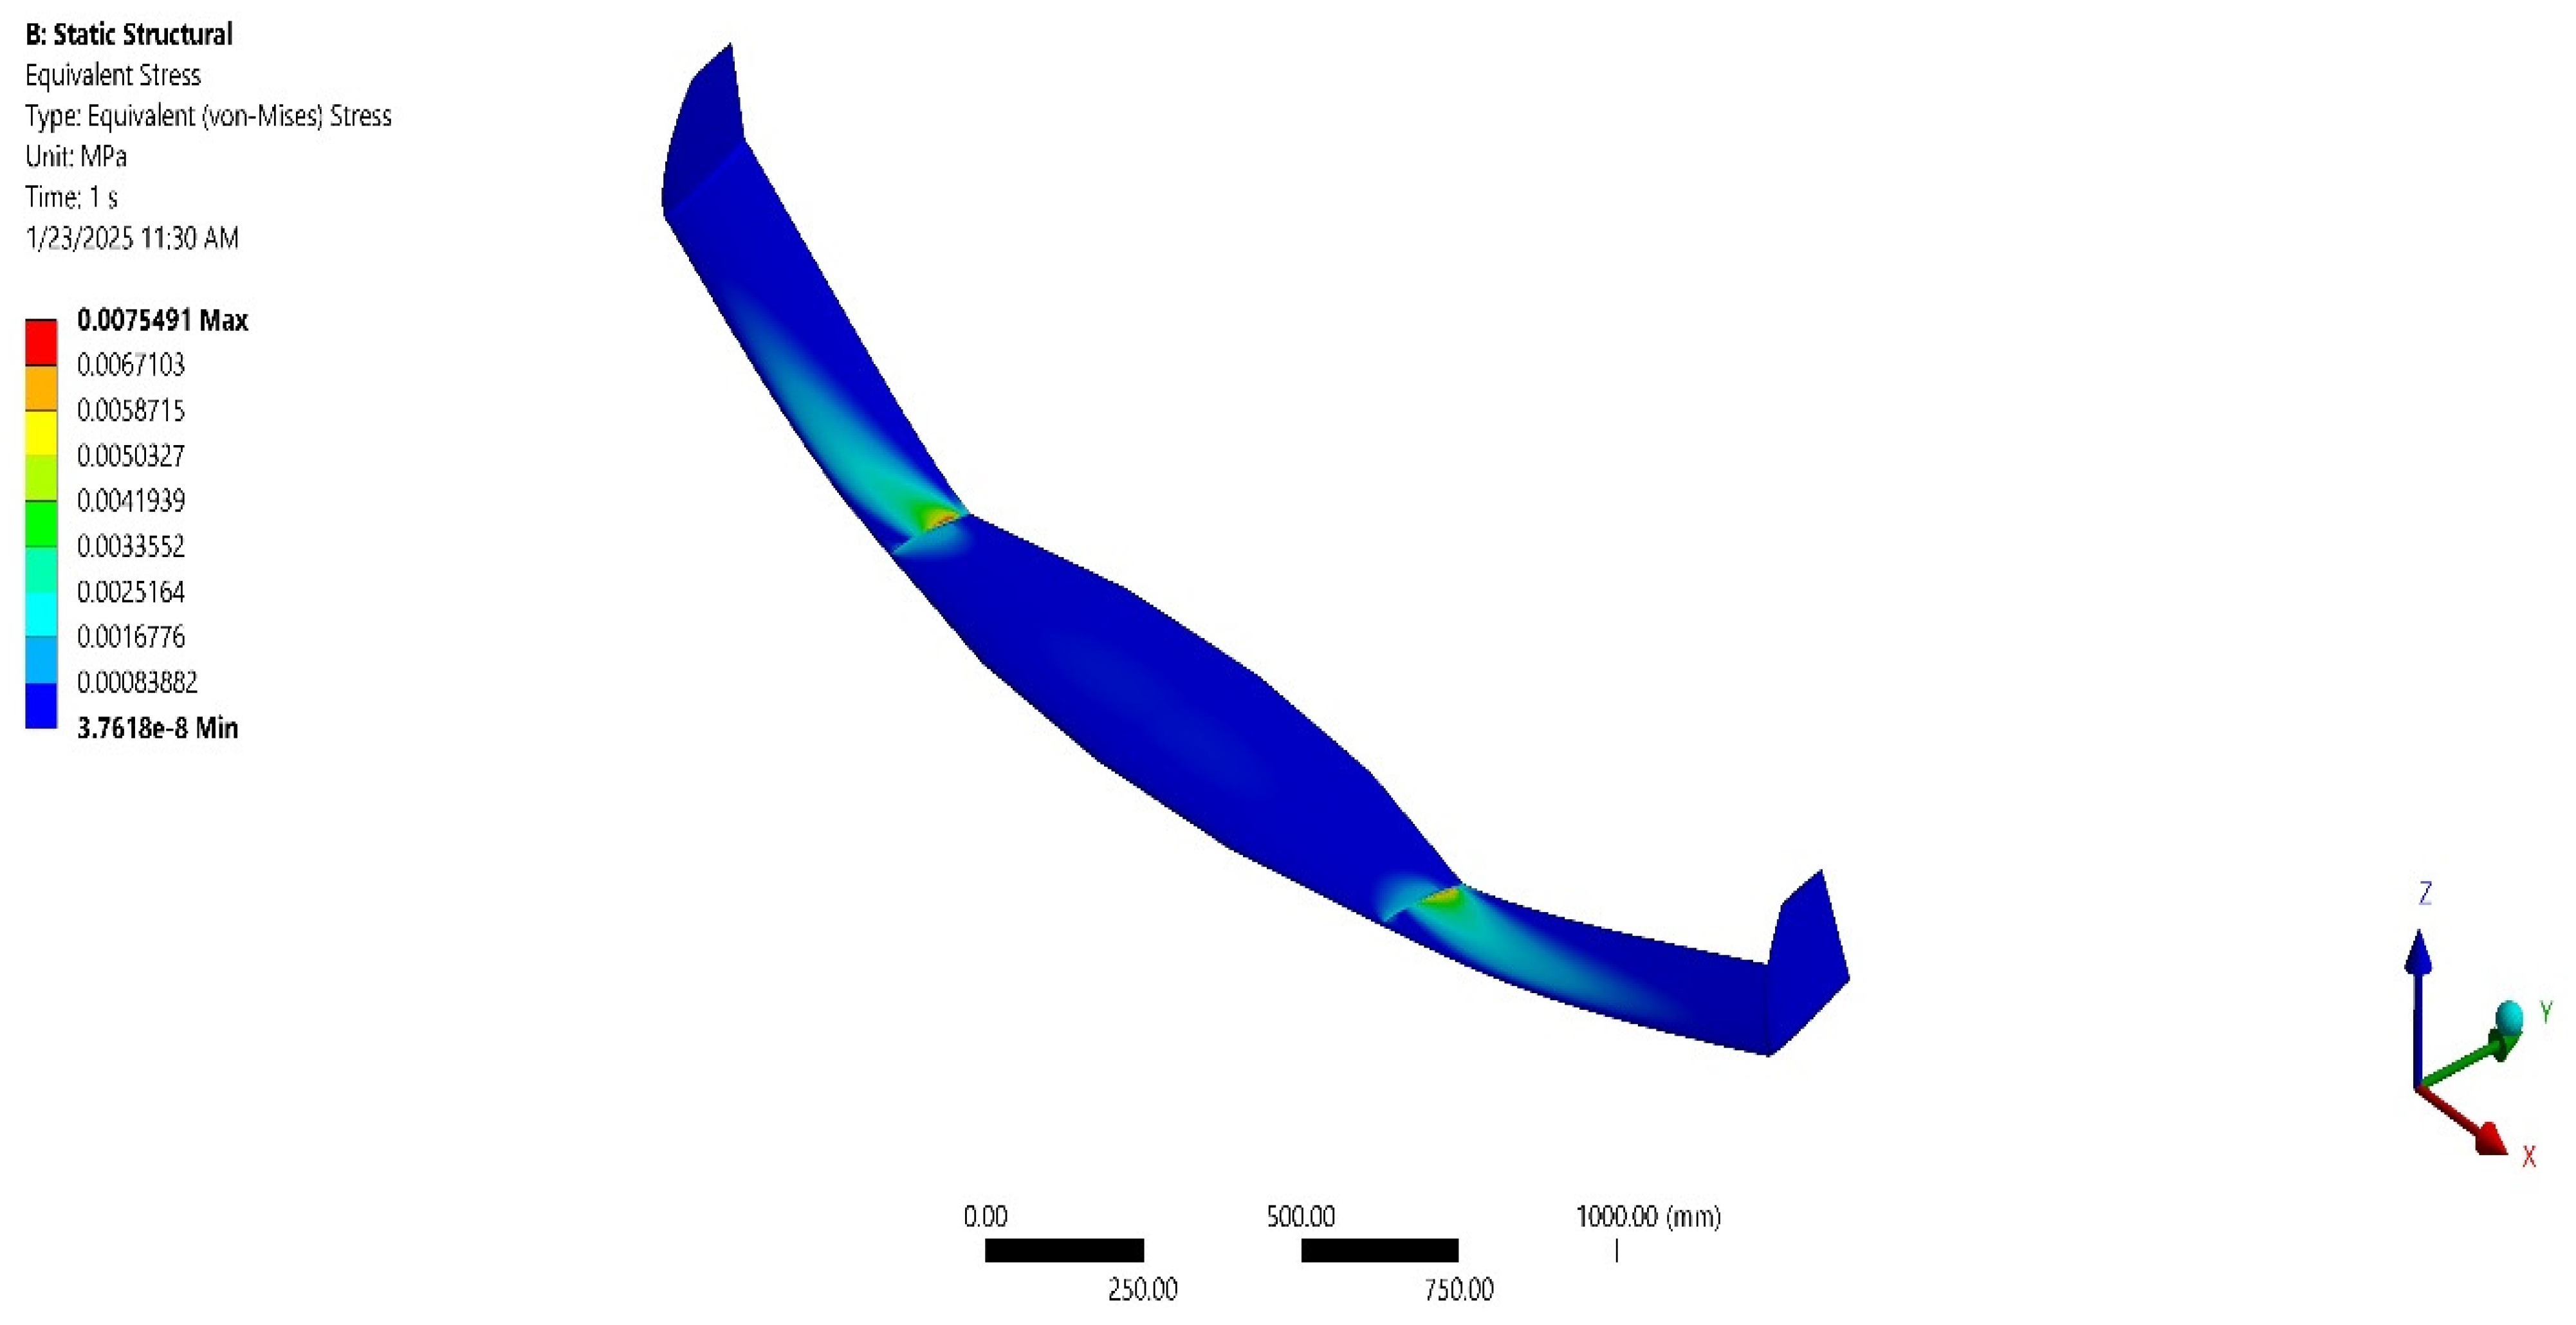
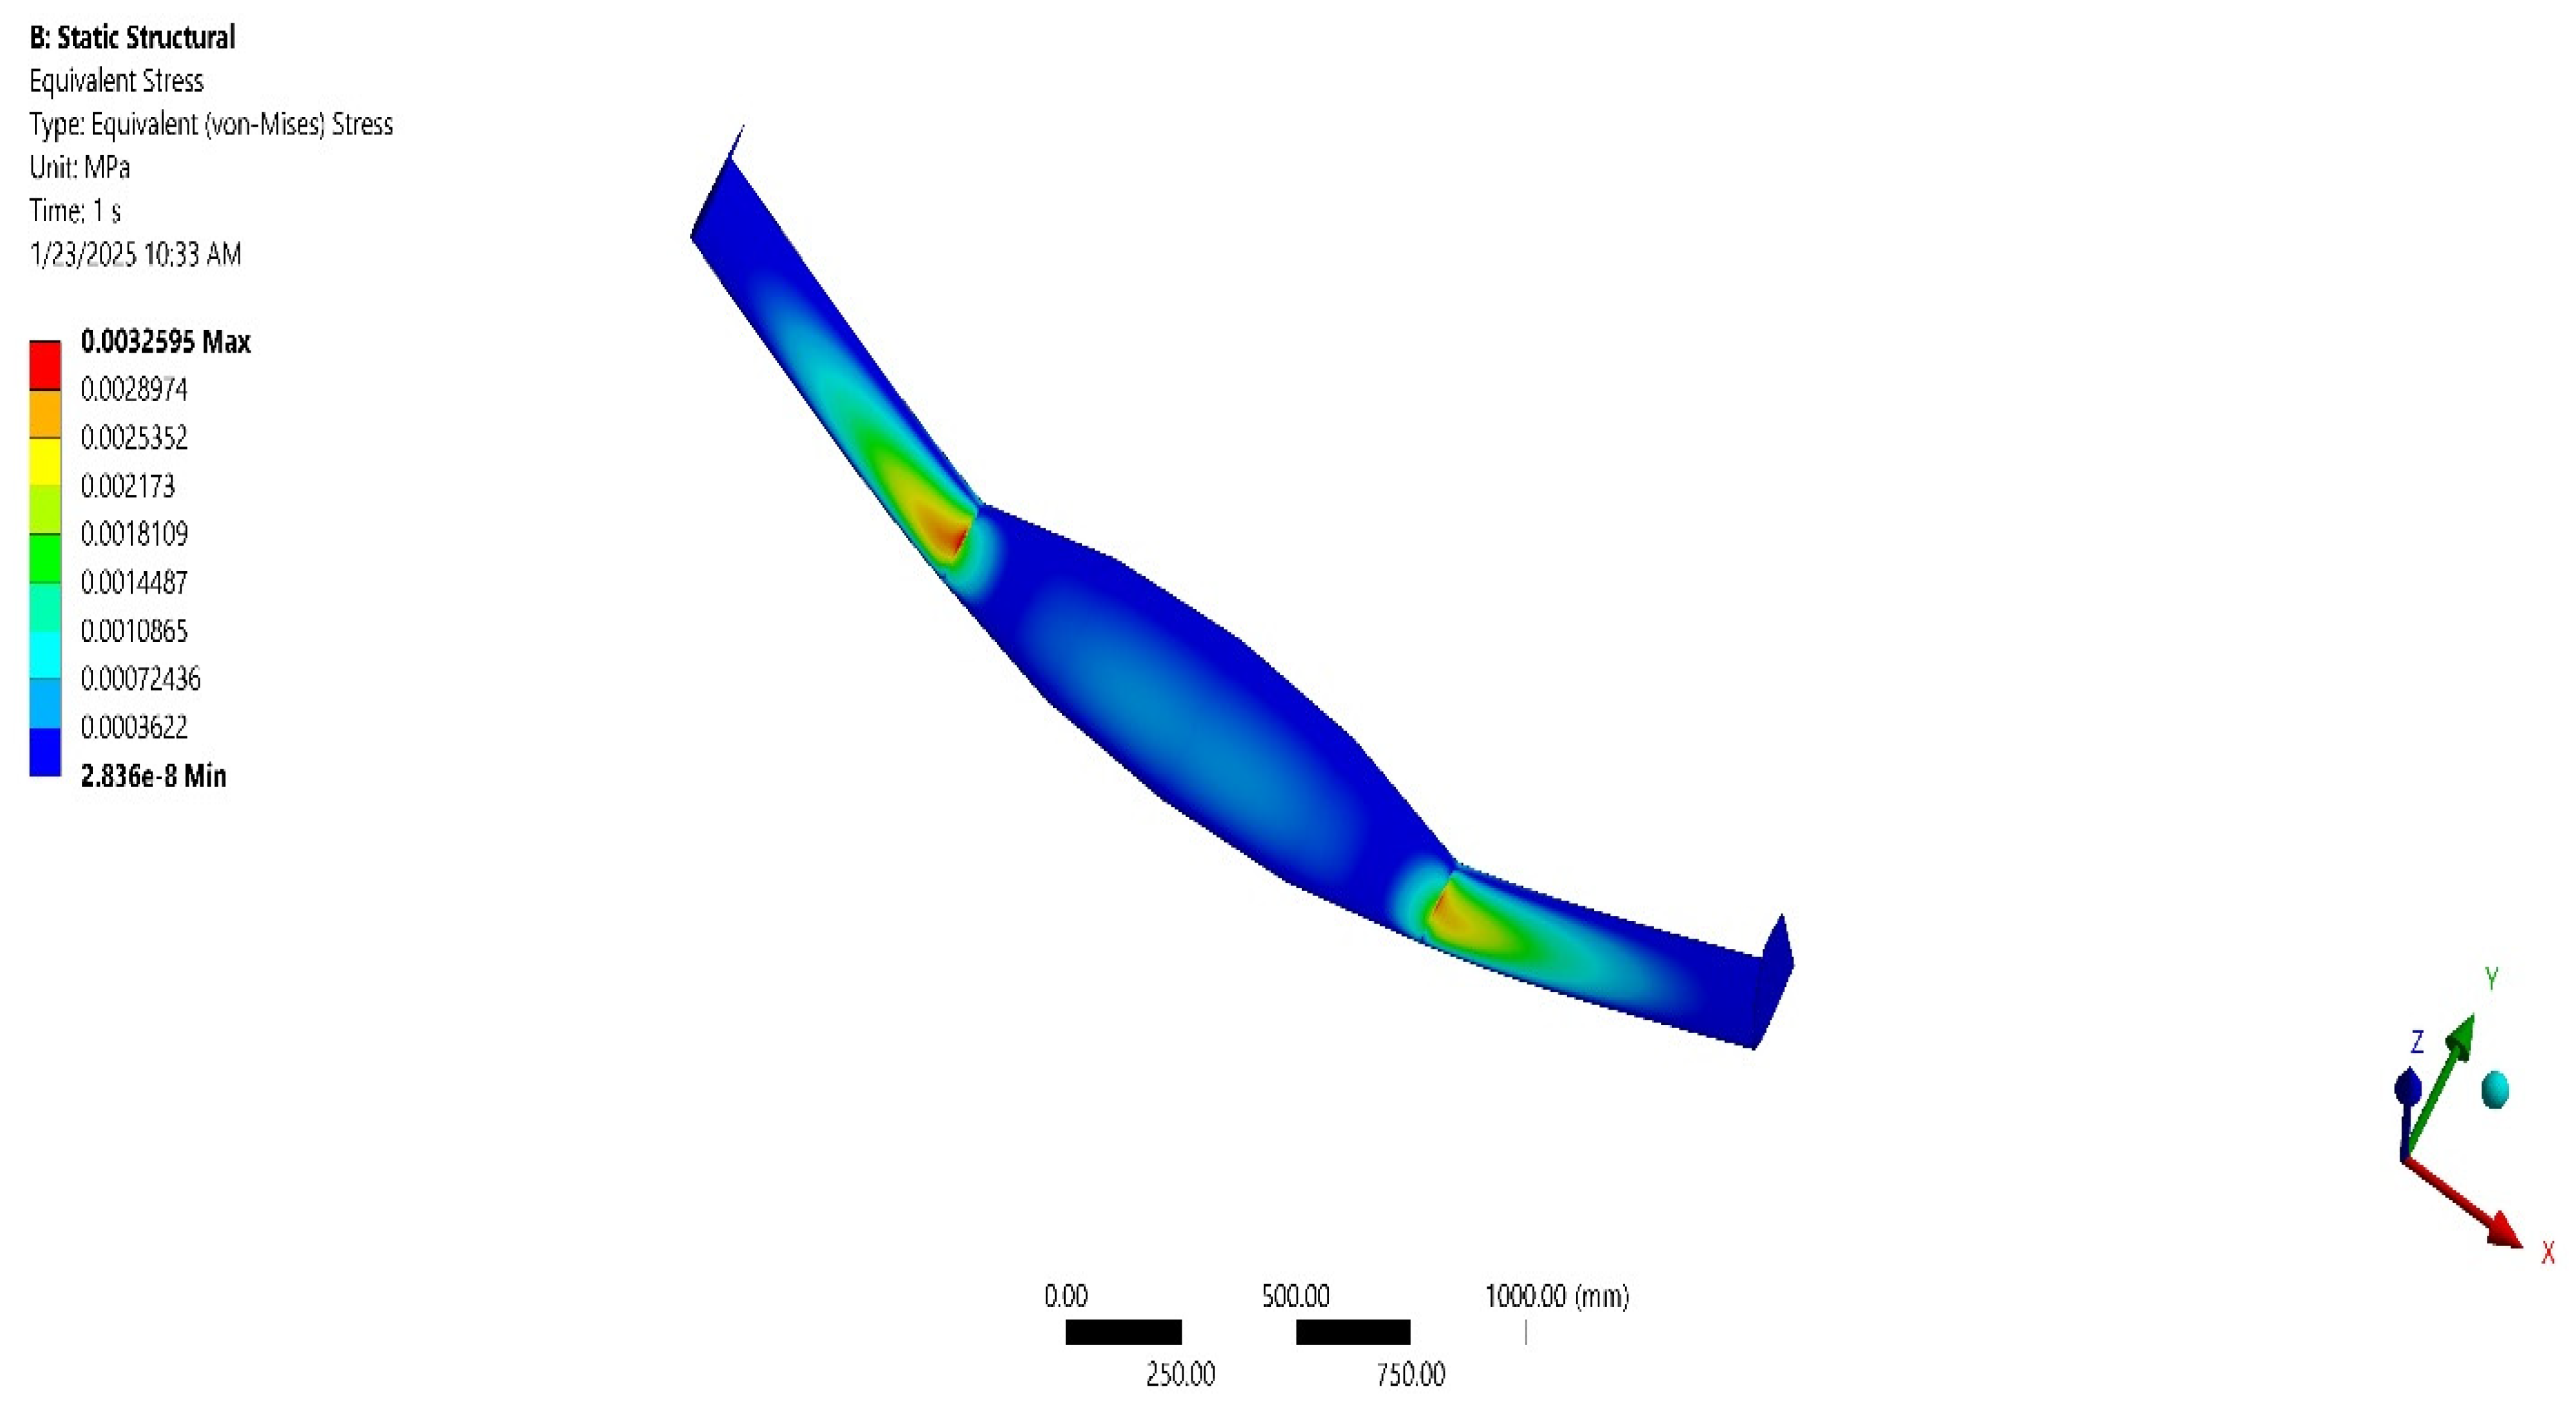
Equivalent Stress variations on flying wing UAV-NIP-3—CFRP-UD-Pg-395-GPa.
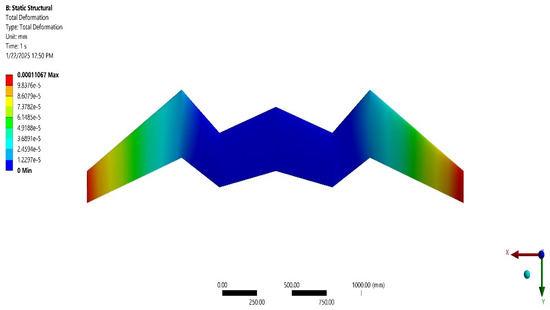
Figure 70.
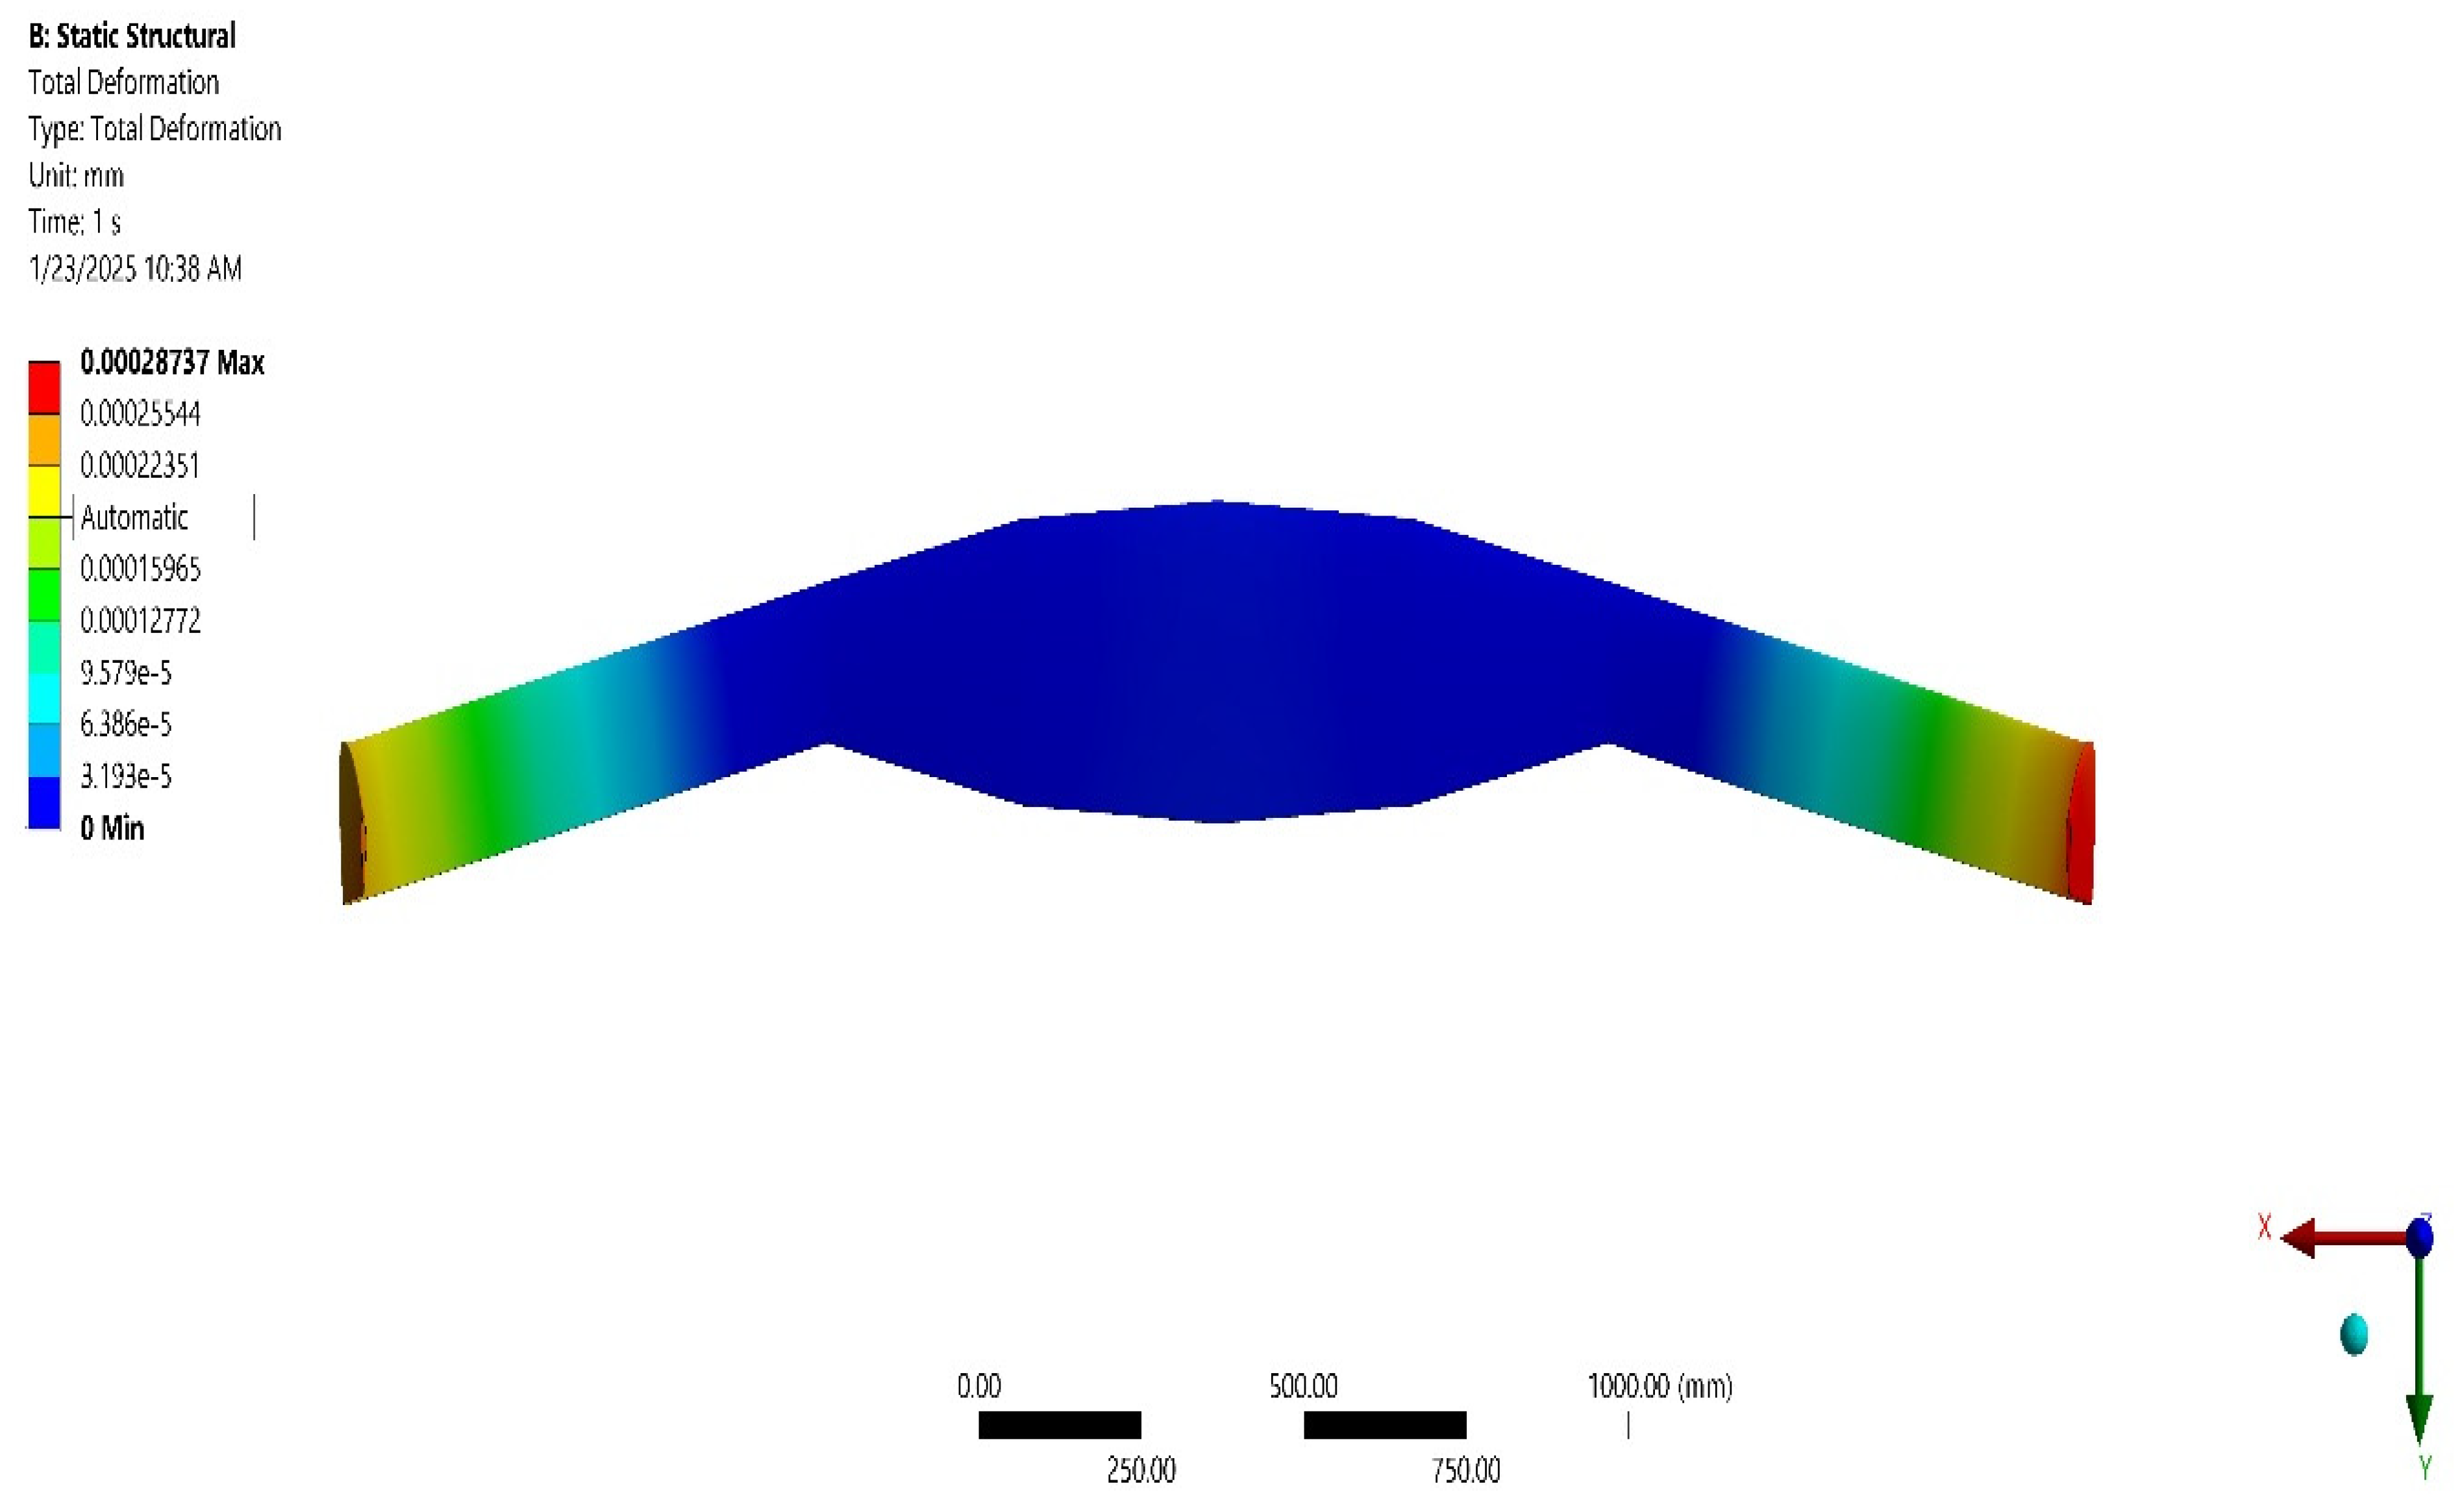
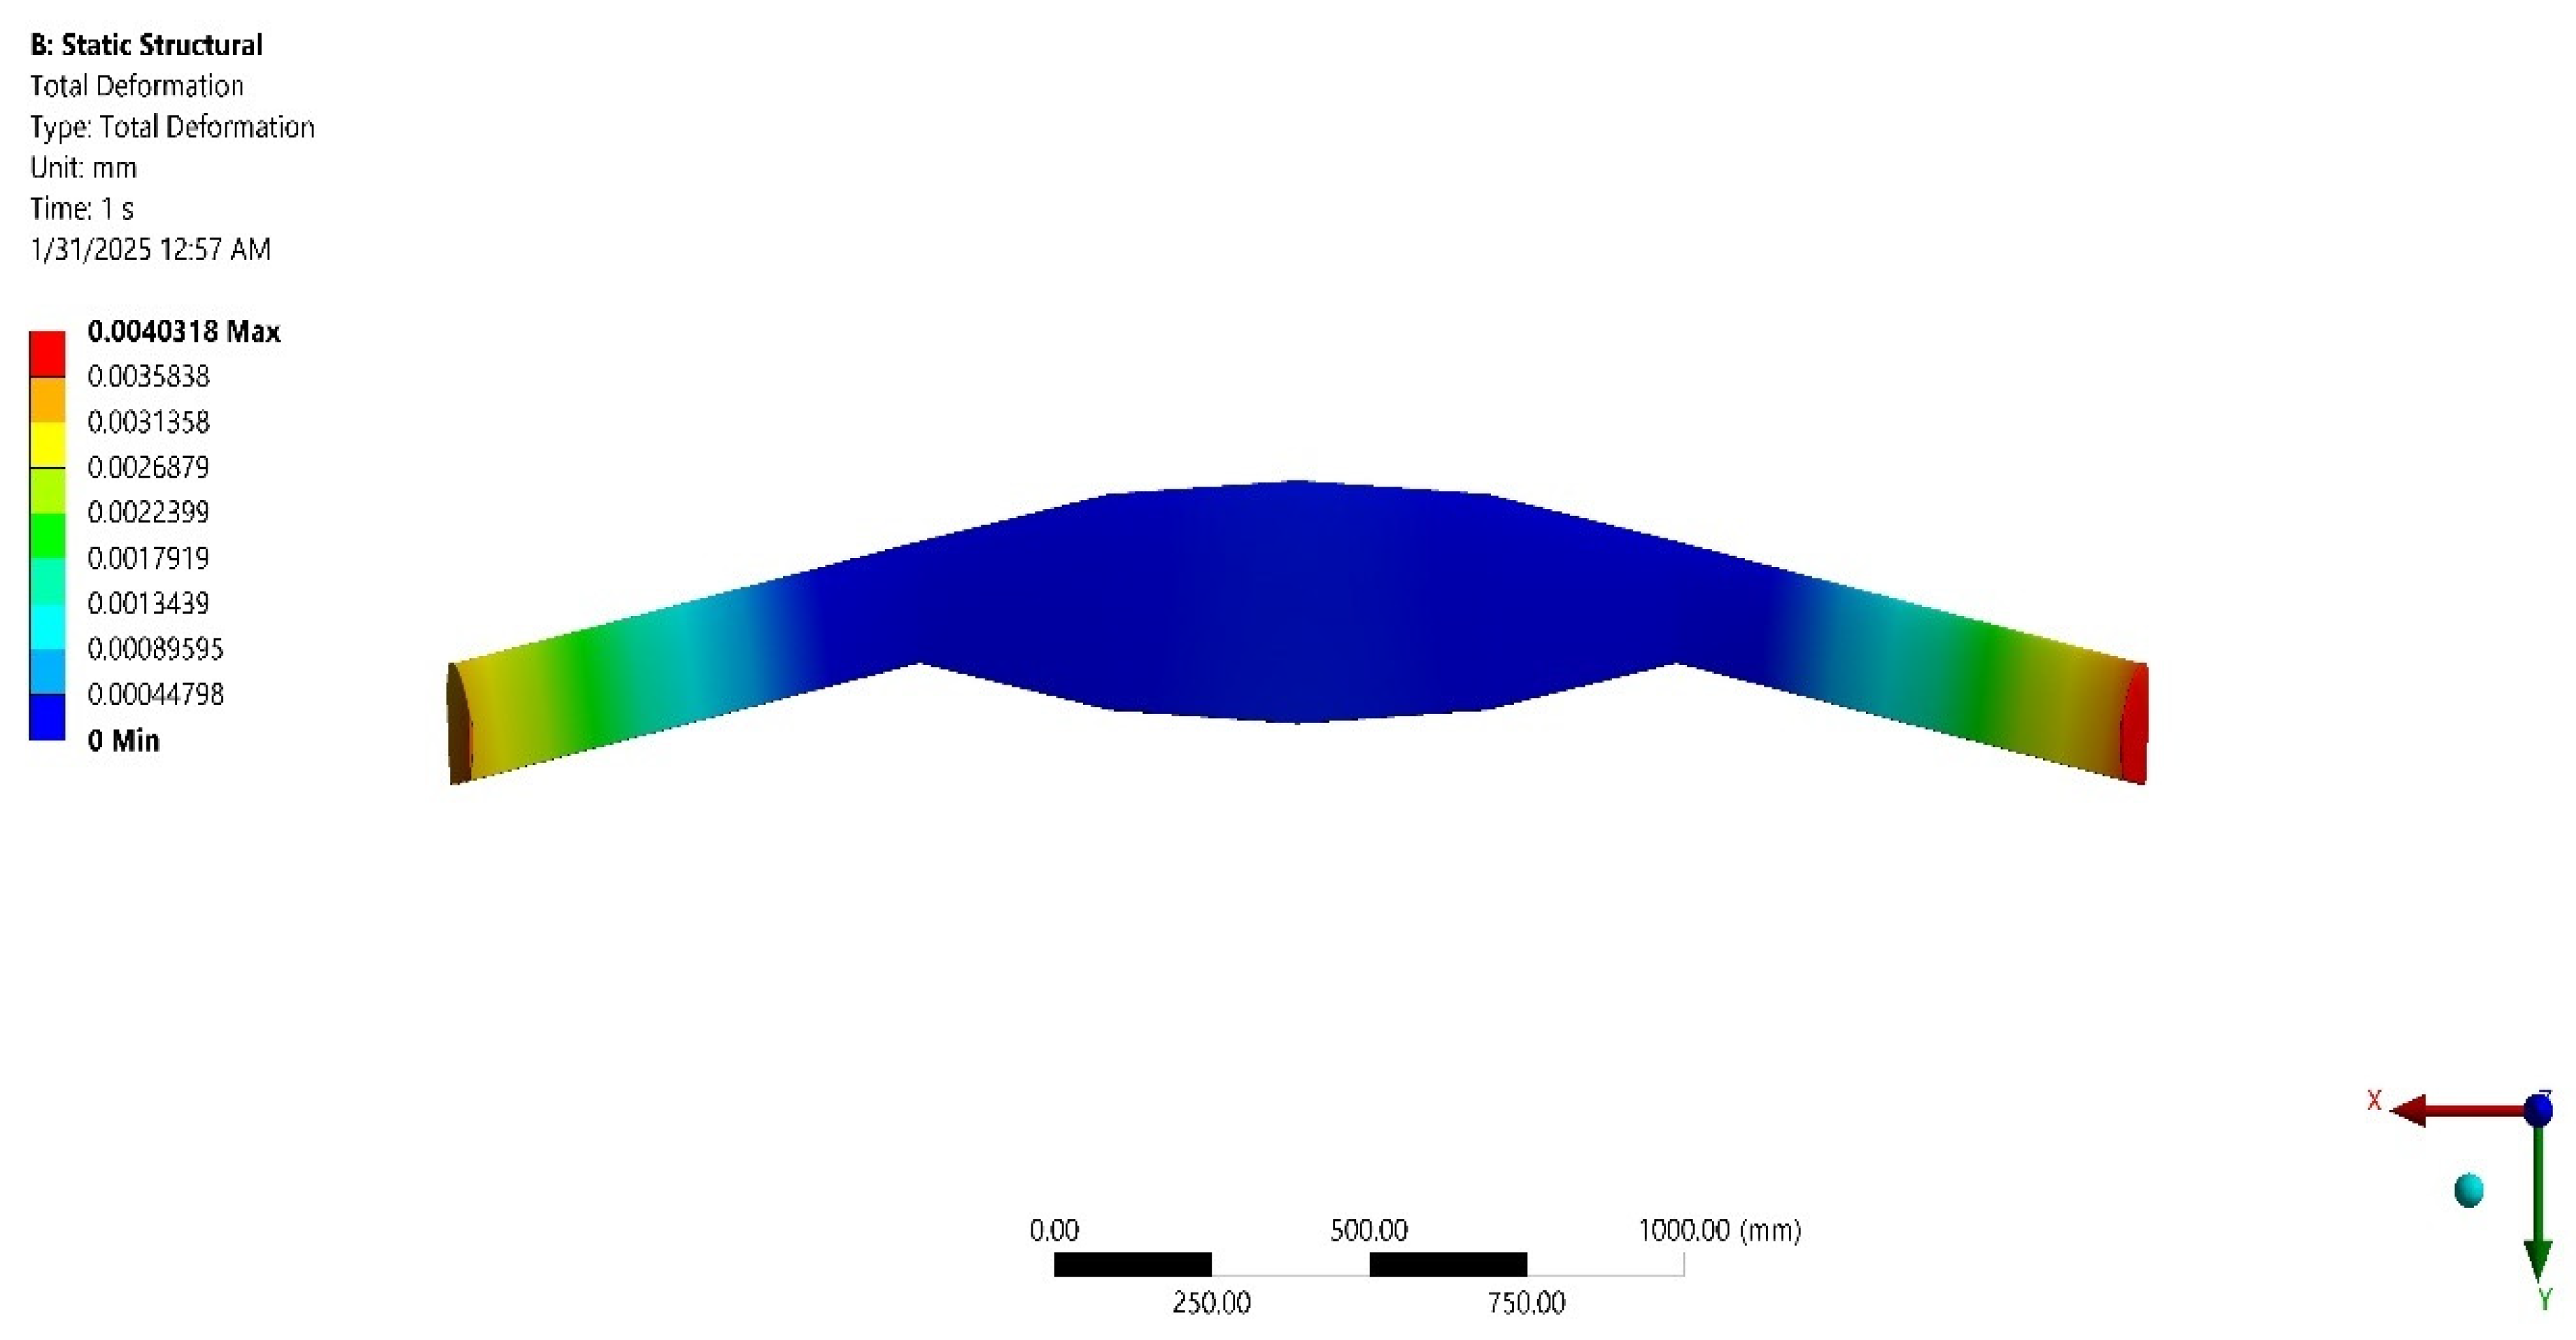
Total deformation on flying wing UAV-NIP-3—GY-70-CFRP.

Figure 71.
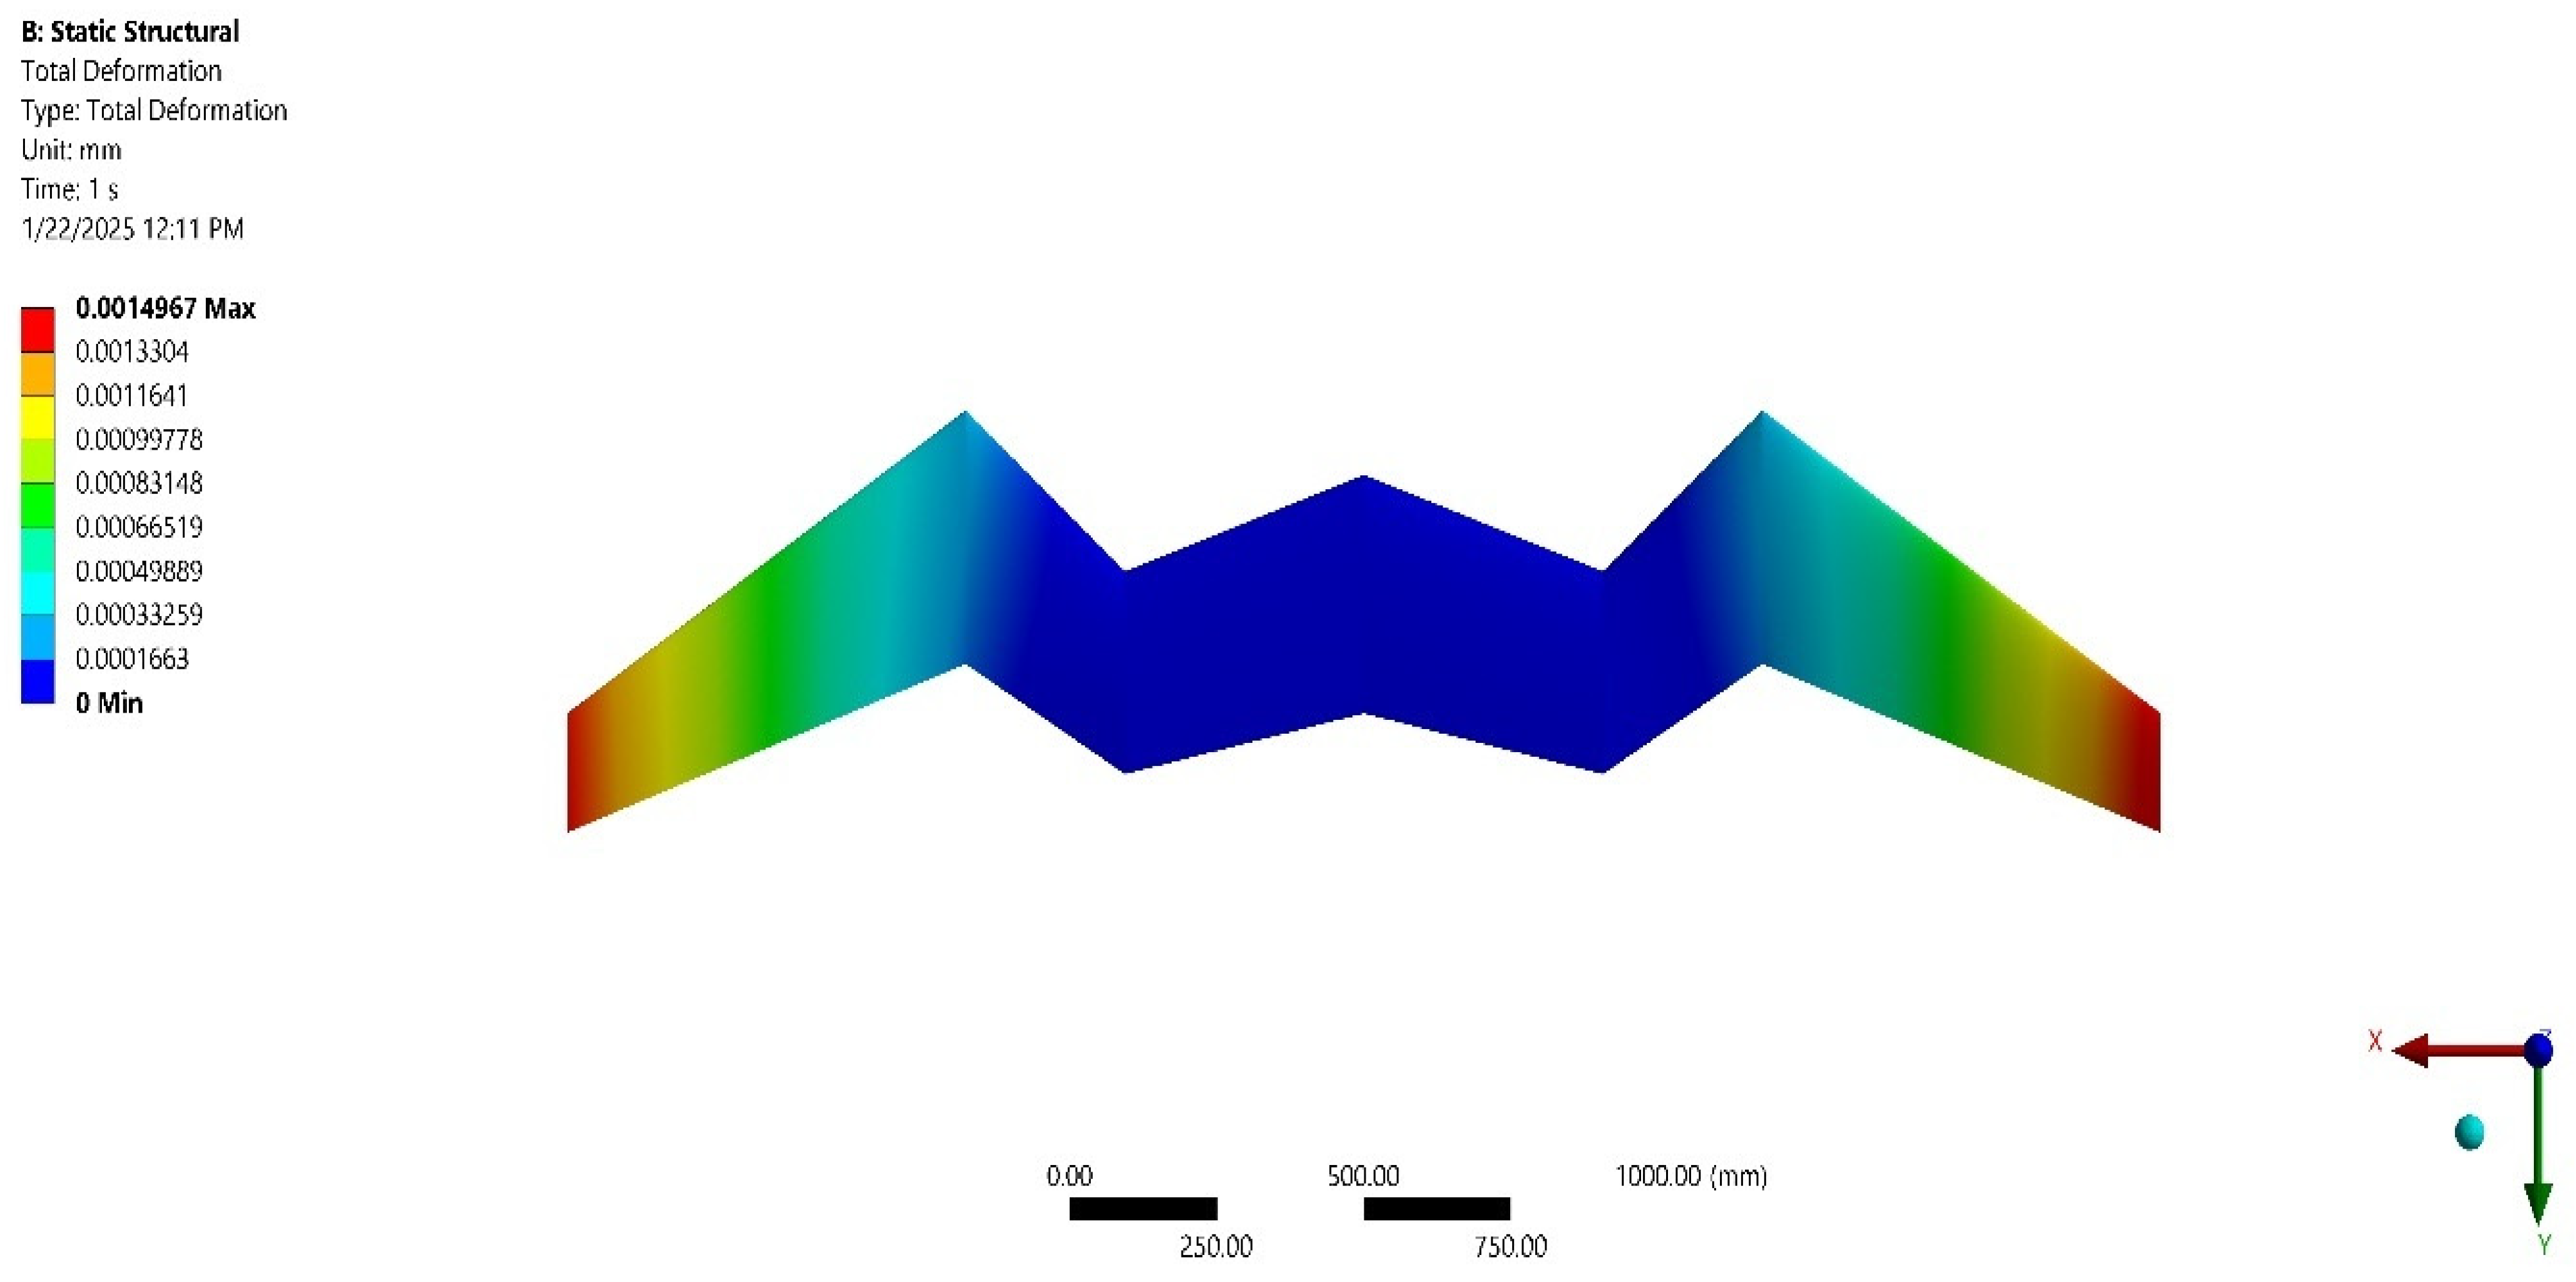
Total deformation on flying wing UAV-NIP-3—FR-4-GFRP-FABRIC.
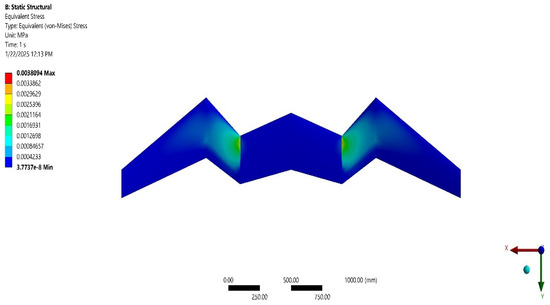
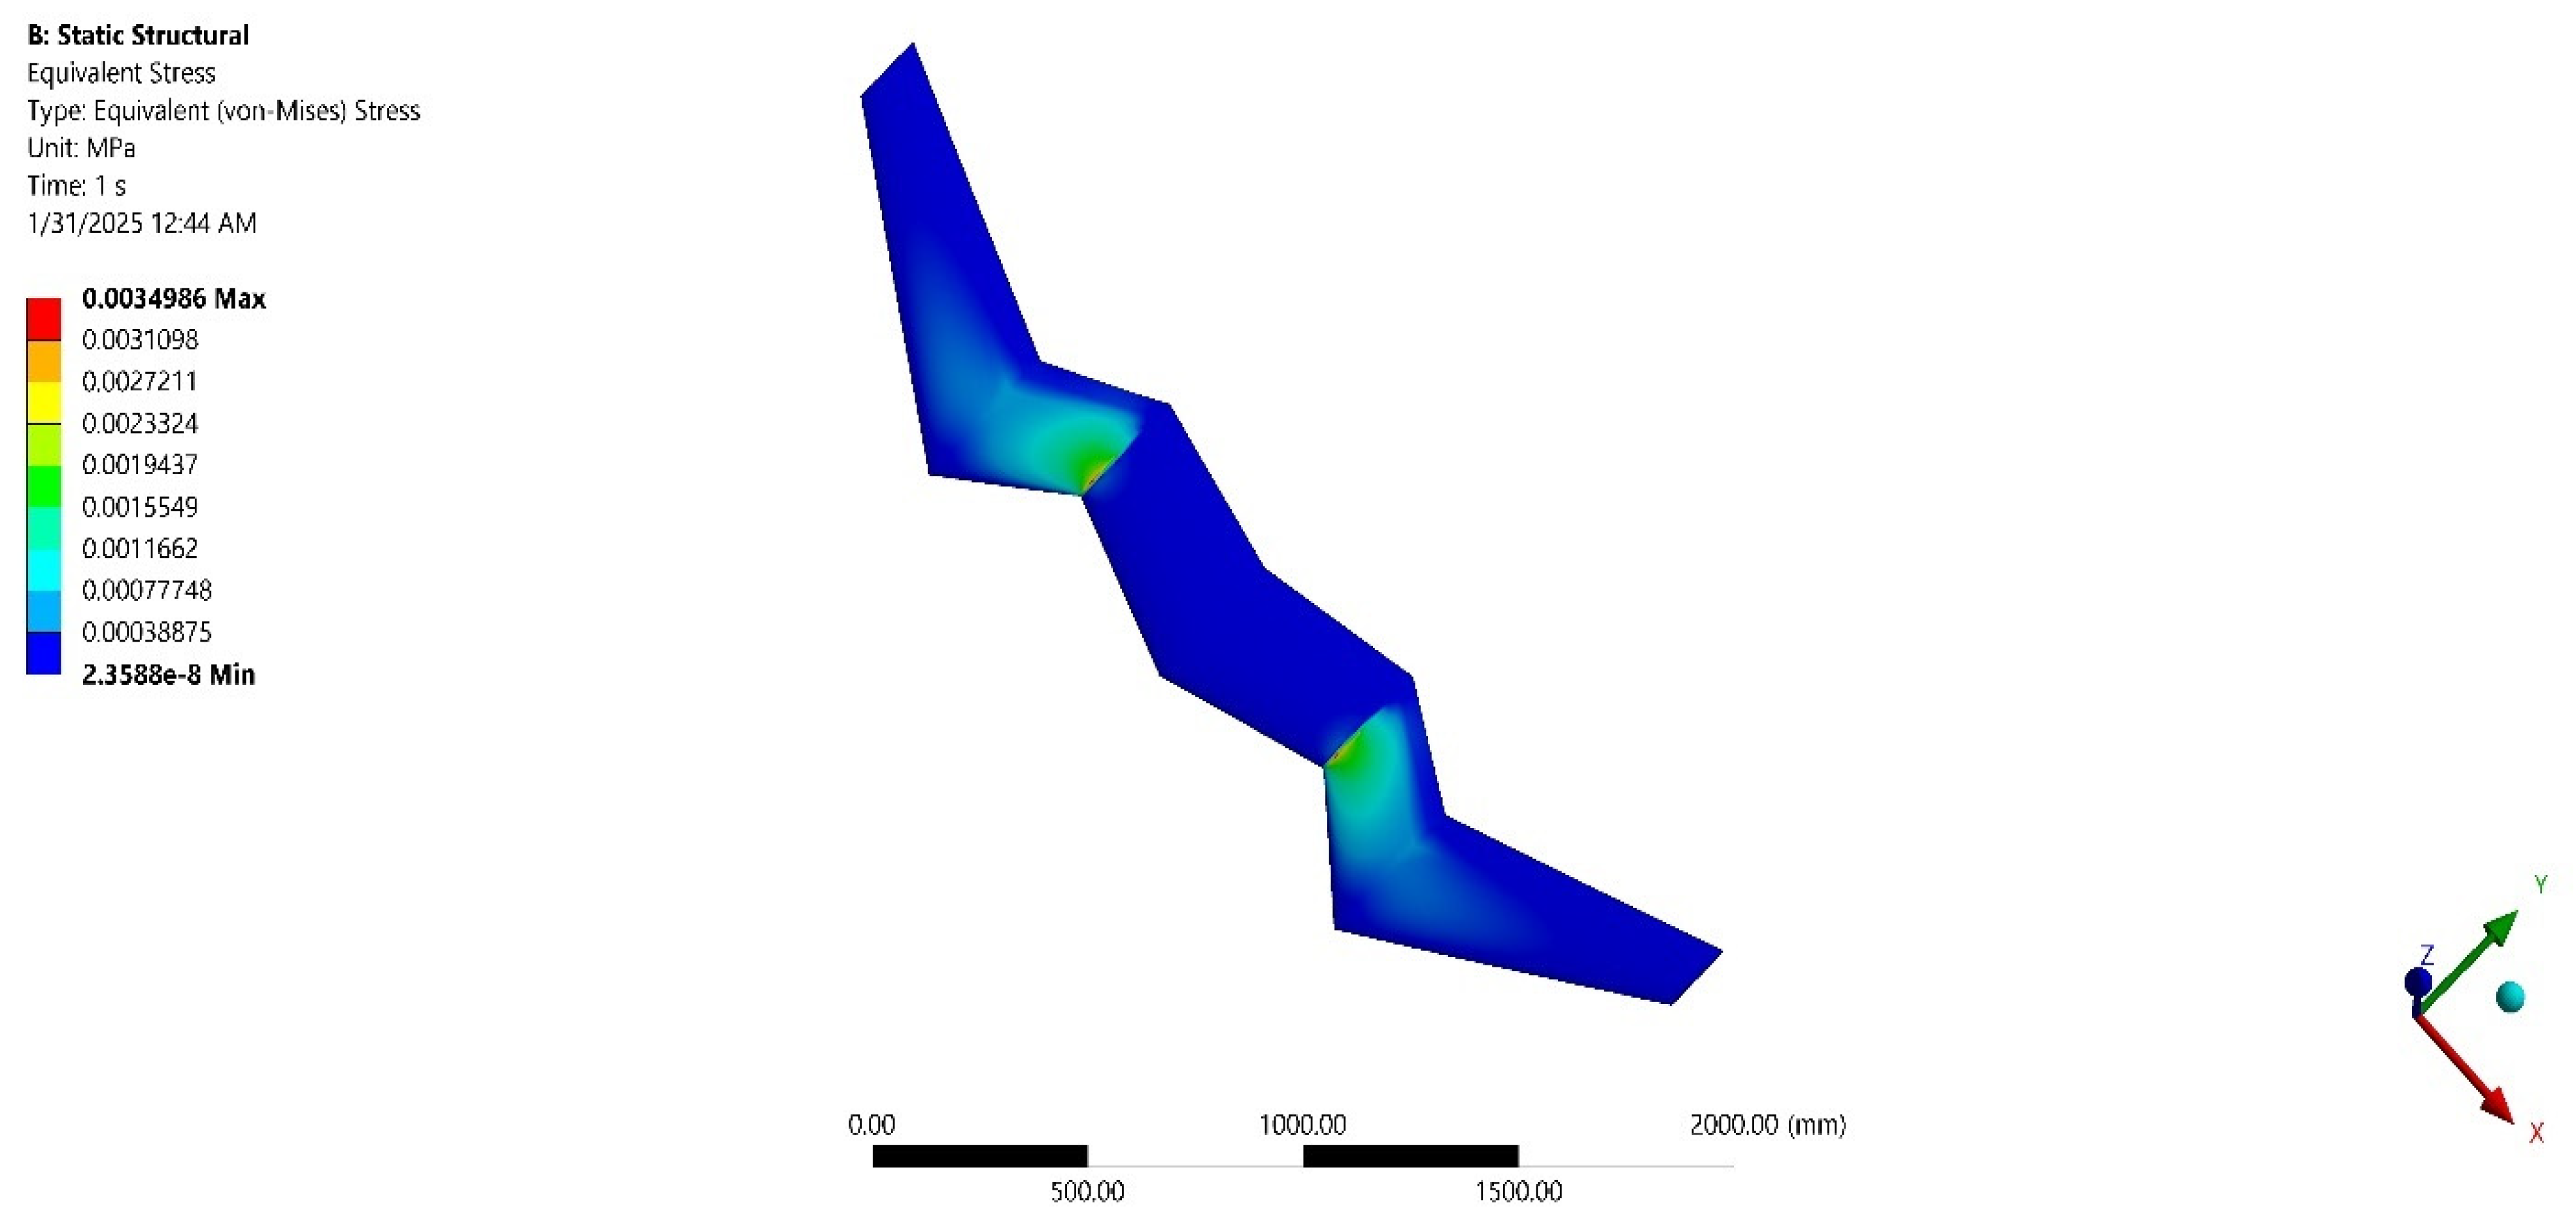
Figure 72.
Equivalent Stress variations on flying wing UAV-NIP-3—FR-4-GFRP-FABRIC.
Table 8.
List of advanced materials implemented over the flying wing UAV model.
3.2.1. Flying Wing UAV Base—FSI
3.2.2. Flying Wing UAV-NIP-3—FSI
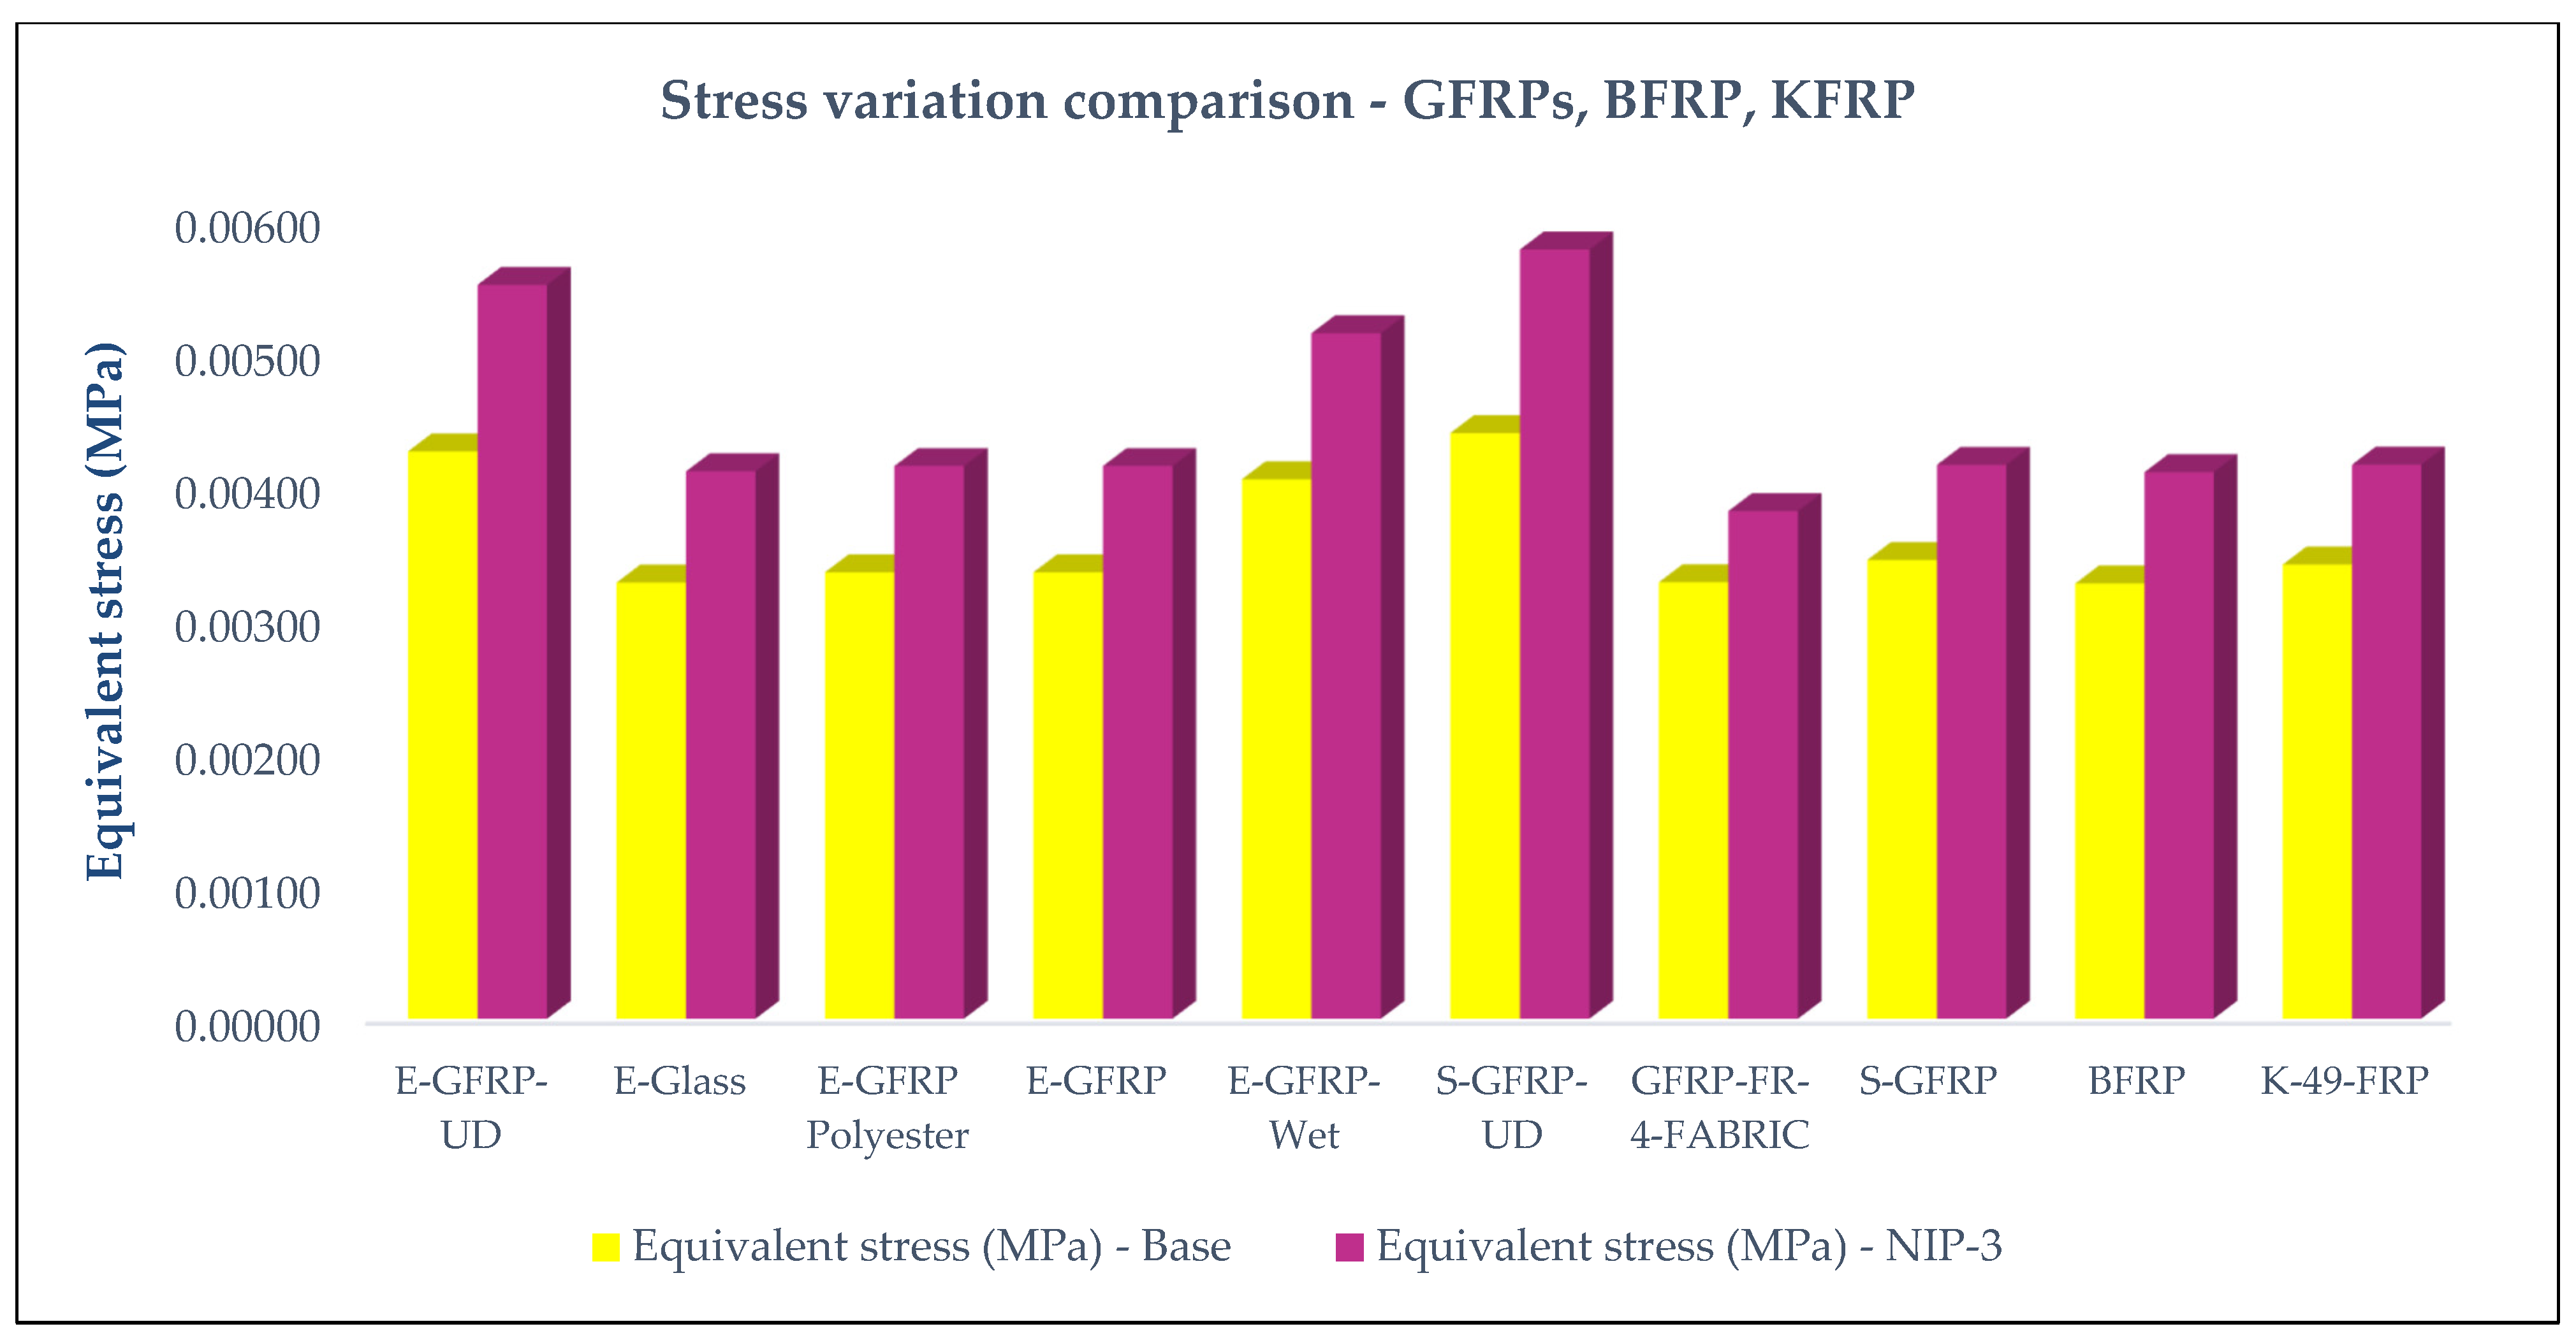
3.2.3. Material Study—Comparison
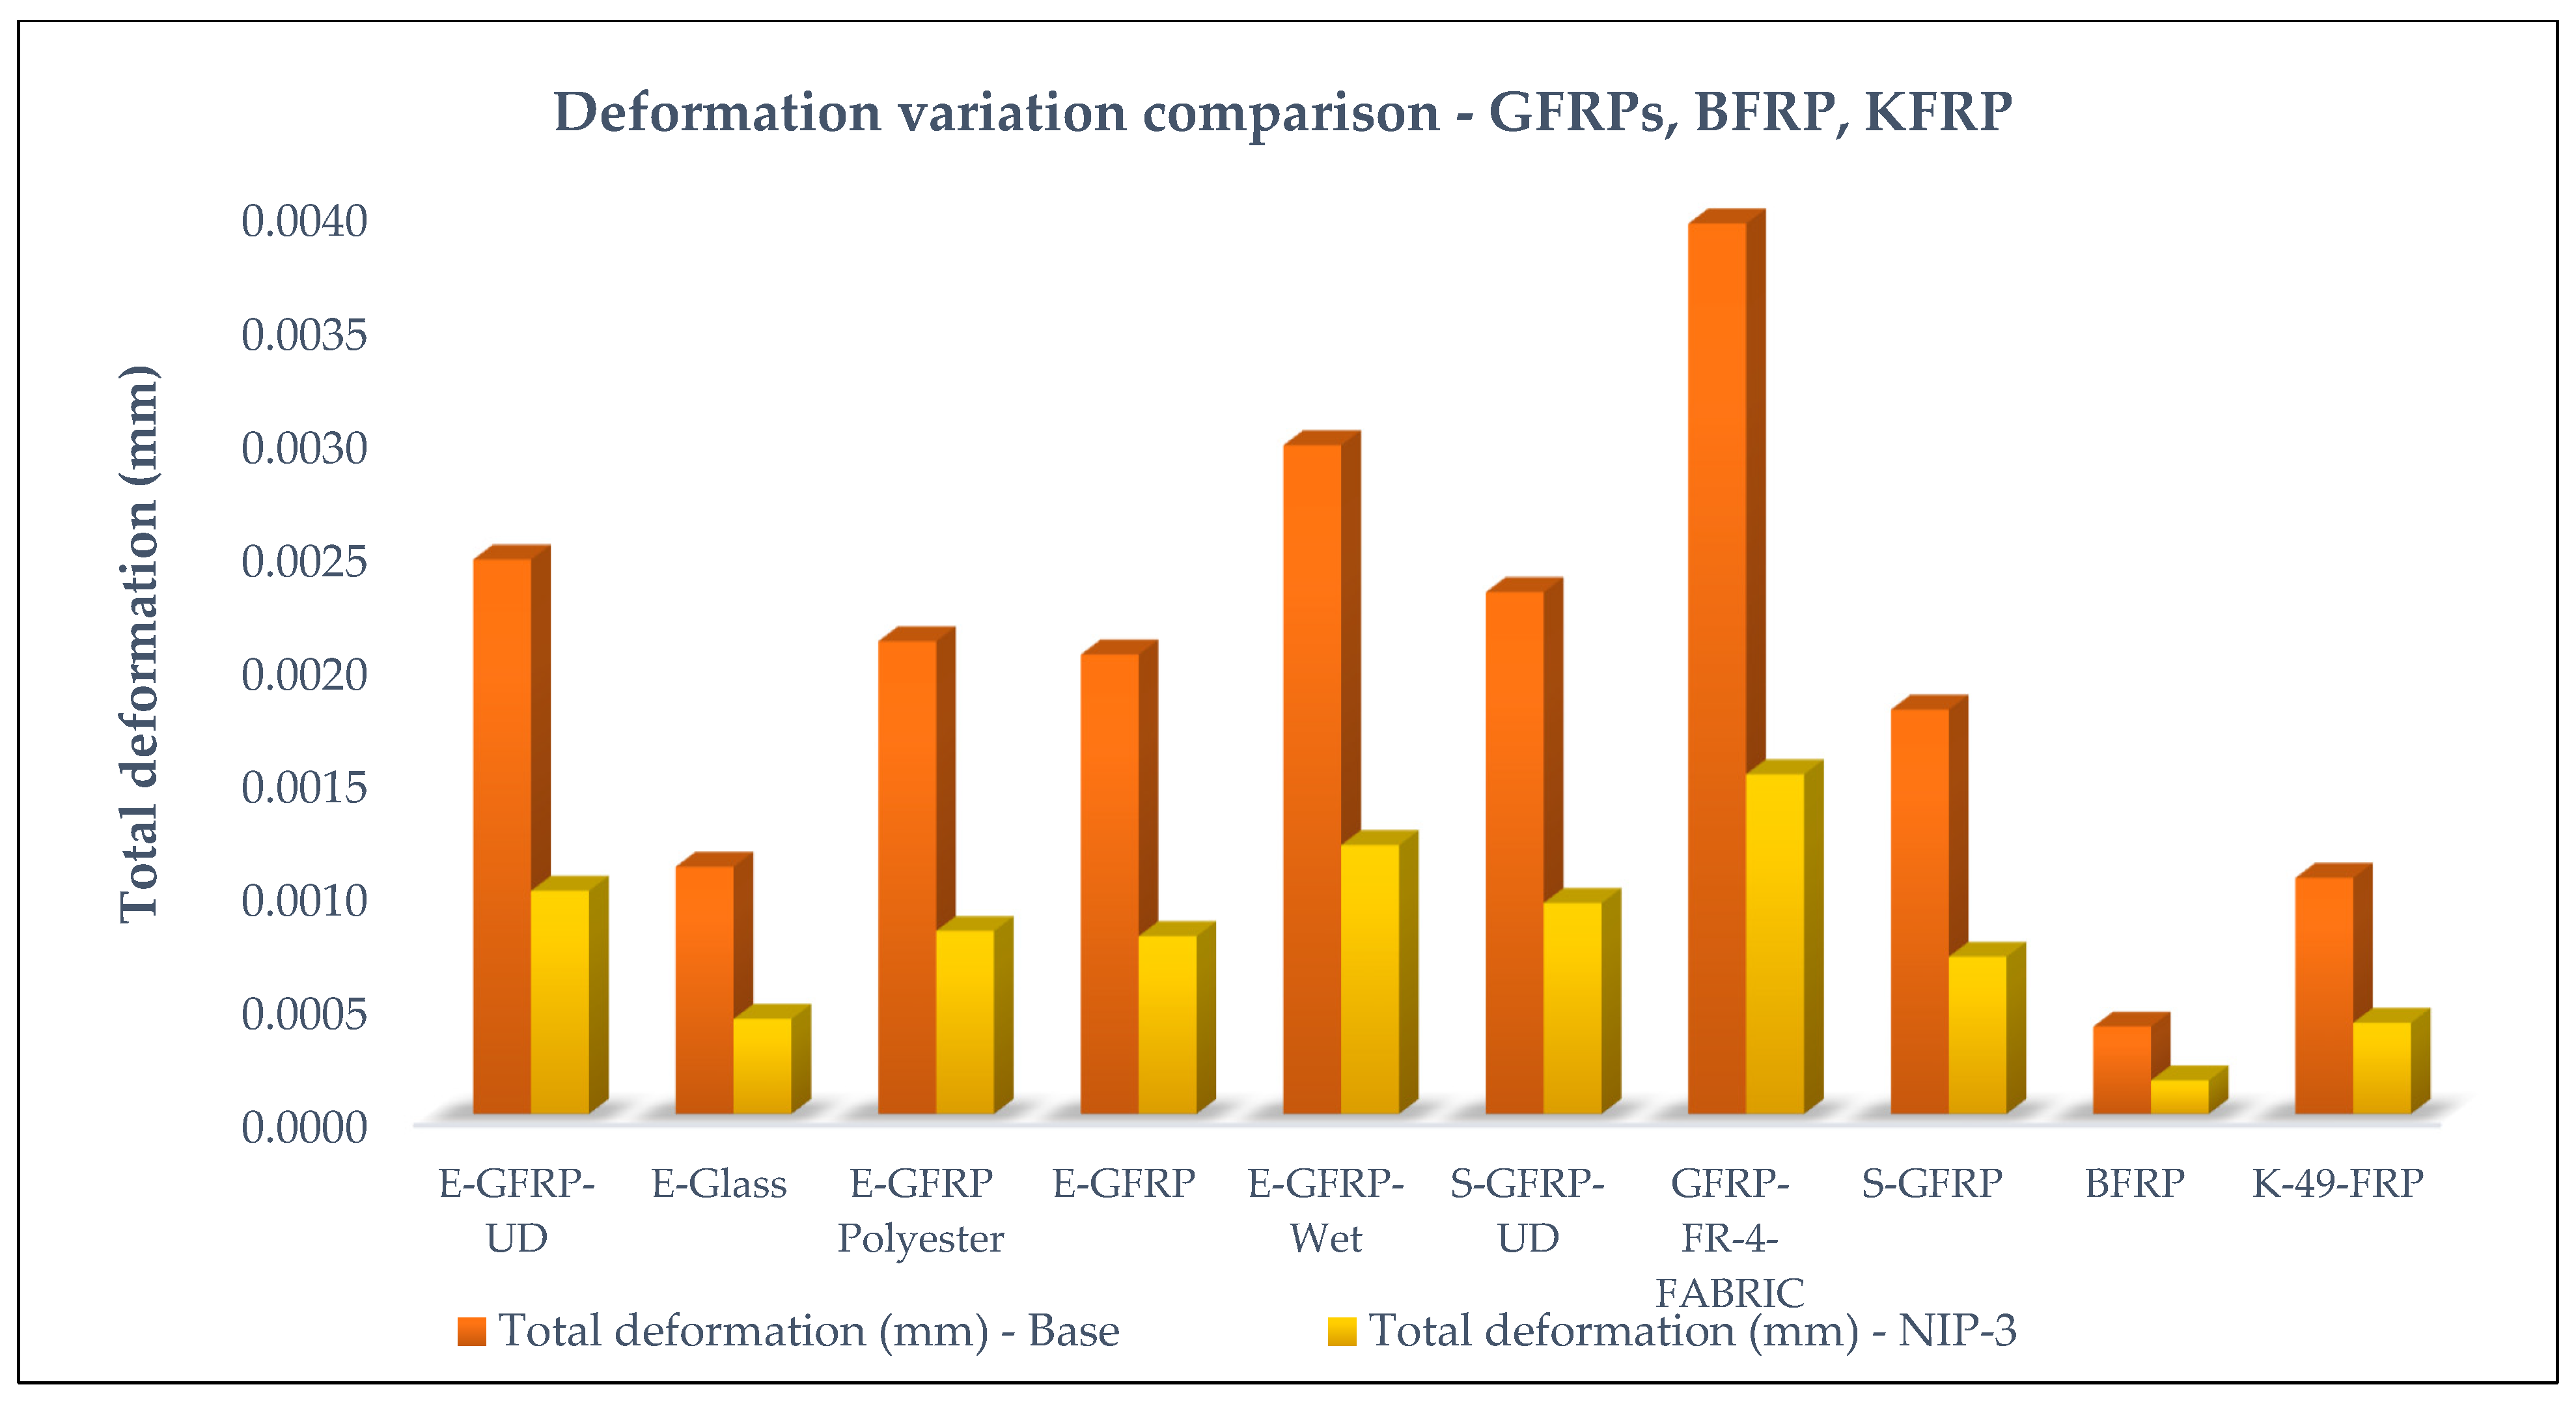
The factors considered for this structural analysis include total deformation and equivalent stress and are plotted for comparison between Base and NIP-3 models. The graphical representations are displayed in Figure 73, Figure 74, Figure 75 and Figure 76.
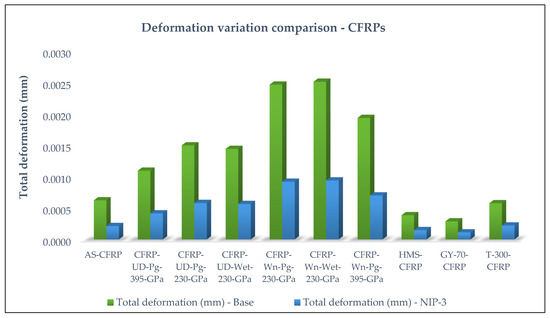
Figure 73.
Deformation comparison for CFRP materials imposed on flying wing models.
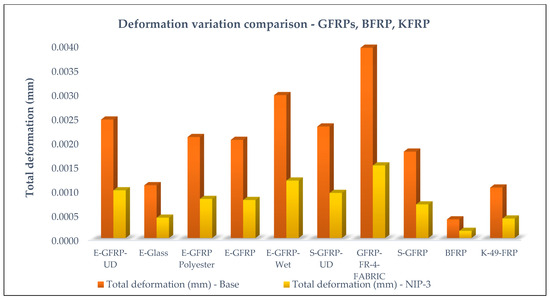
Figure 74.
Deformation comparison for other composites imposed on flying wing models.

Figure 75.
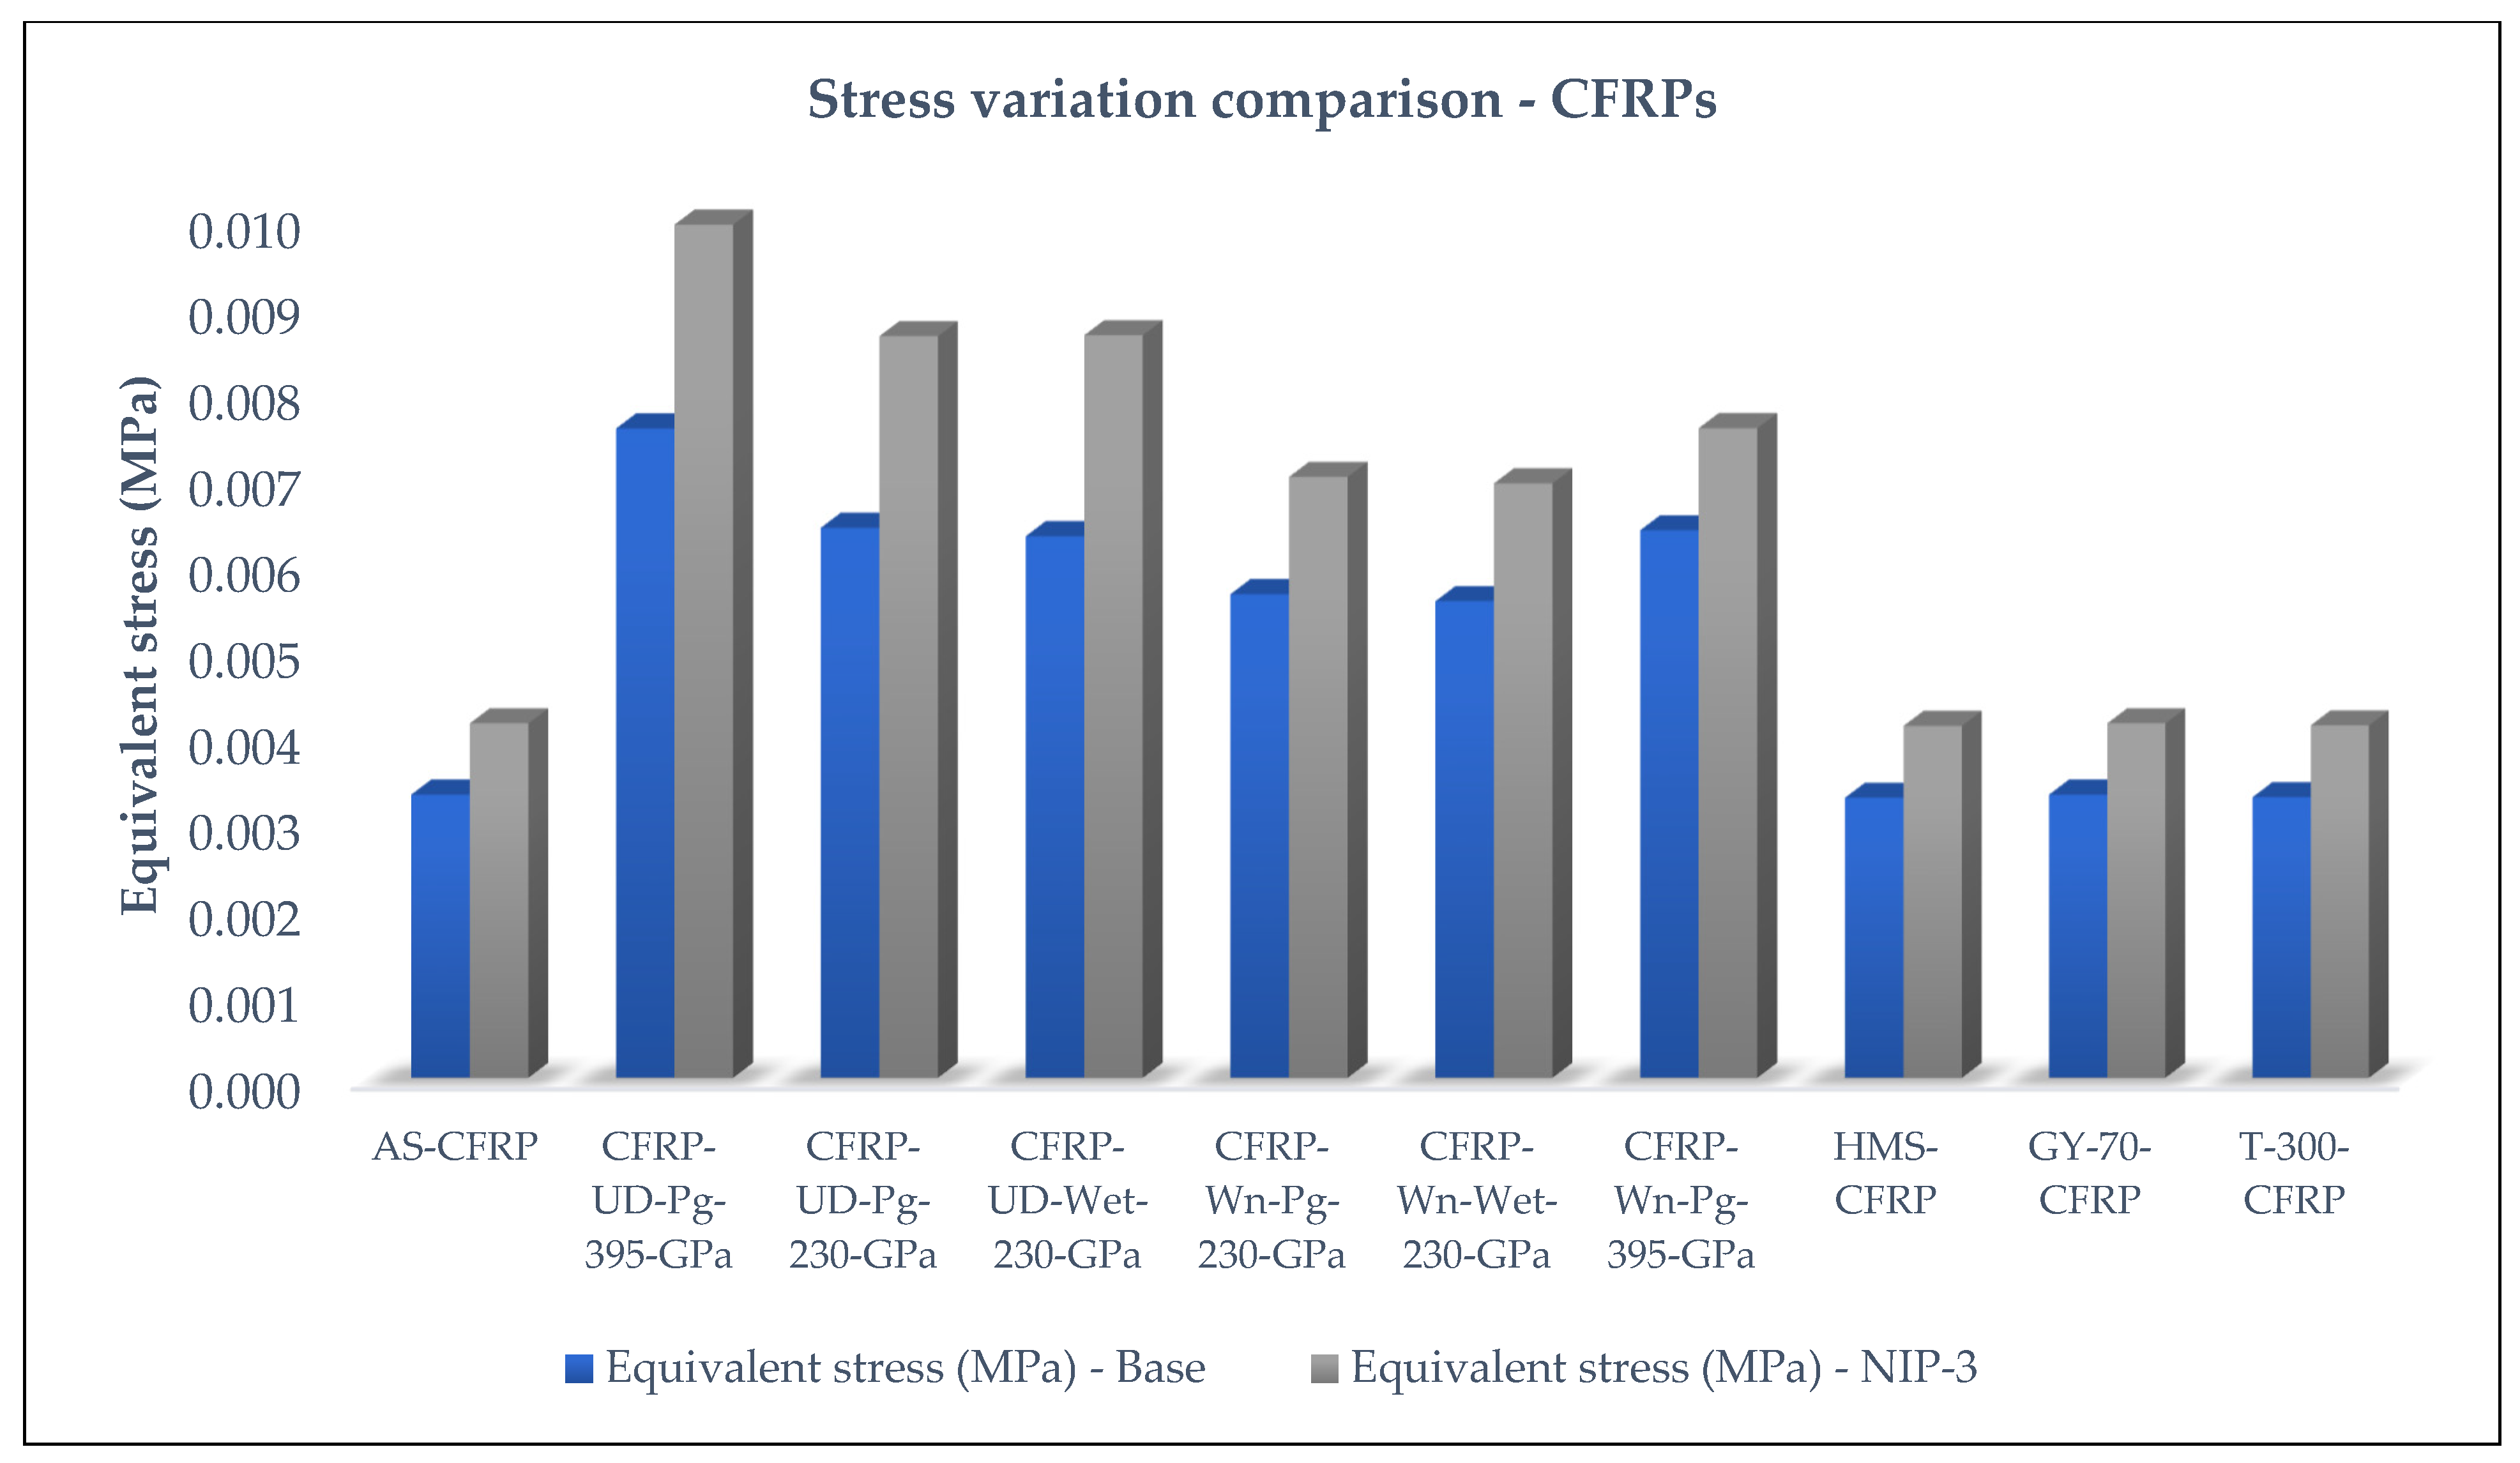
Stress comparison forCFRP composites imposed on flying wing models.

Figure 76.
Stress comparison of other composites imposed on flying wing models.
The material performances are revealed in Table 9, giving the best and worst performing materials when taking into account the deformation and stress parameters. As seen above, GY-70-CFRP and HMS-CFRP perform best, while GFRP-FR-4-FABRIC and CFRP-UD-Pg-395-GPa perform slightly less well in comparison. This could be utilized in further material design processes, for the betterment of its operation.
Table 9.
Discussion for material selection analysis—Base vs NIP-3.
The finite element analysis (FEA) results revealed magnitudes corresponding to best performance of more than one material. As per the objective intended for this analysis, internal energy and external energy-based parameters are chosen to be taken into account. The total deformation and equivalent stress data revealed better working conditions in terms of the chosen environment of application for four materials, namely, GY-70-CFRP, GFRP-FR-4-FABRIC, HMS-CFRP, and CFRP-UD-Pg-395-GPa. These materials, being advanced composites, are very suitable for the fabrication of the UAV in the crucial conditions during flight of the flying wing UAV, and in order to witness the external stress created during operation. However, usage of many materials is complicated and would increase the manufacturing cost in real-time. To compensate for this situation, a hybrid material is proposed where the superior parameters exhibited by each material is combined to a single material to produce the expected advantageous results. The expected increment in efficiency and integrity of the structural properties is achieved by implementing the hybrid material onto the frame structure.
3.2.4. Hybrid Material Design
The structural analysis results showed the superior working of the NIP-3 model when taking the deformation parameter into consideration. However, it cannot be the only deciding factor as there are other parameters involved in the study. In order to improve the performance of the material when imposed over NIP-3, which is the best working configuration, a hybrid material is designed that involves the combination of the best and worst performing materials. HMS-CFRP and GFRP-FR-4-FABRIC are the two chosen materials for the hybrid material design process. The layers of the two materials are aligned and solved for the creation of a new hybrid material, as shown in Figure 77.
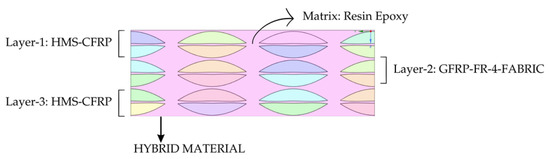
Figure 77.
Layering illustration of hybrid material design.
After the material design process, the final hybrid material is studied for any kind of improvement in its structural parameters. The material data are imported as a new structure in the Static structural solver and analyzed. The results of the deformation and stress variation contours are shown in Figure 78, Figure 79, Figure 80 and Figure 81. The comparison of individual conventional composite materials and the hybrid material results are shown in Table 10.

Figure 78.
Deformation variation in Base flying wing UAV—HMS-FR-4 Hybrid.
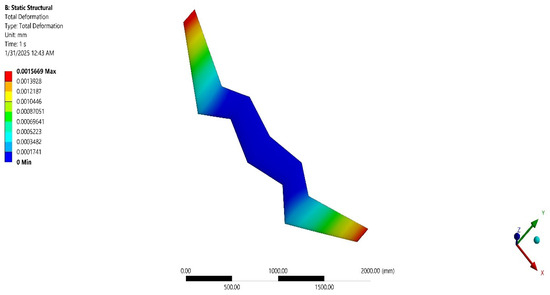
Figure 79.
Deformation variation in NIP-3 flying wing UAV—HMS-FR-4 Hybrid.
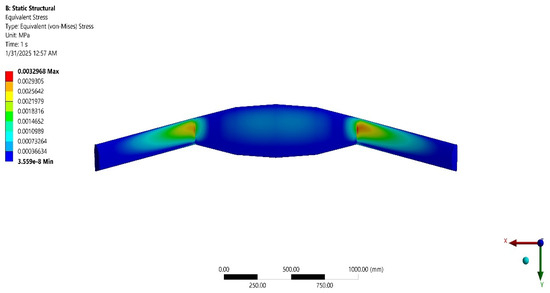
Figure 80.
Stress variation in Base flying wing UAV—HMS-FR-4 Hybrid.
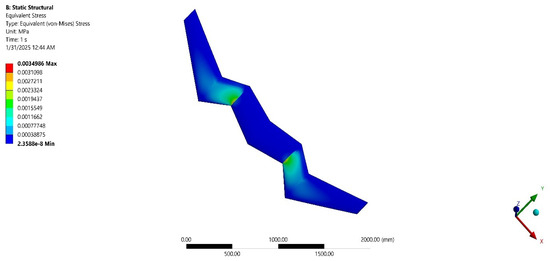
Figure 81.
Stress variation in NIP-3 flying wing UAV—HMS-FR-4 Hybrid.
Table 10.
Structural parameters comparison—Hybrid and individual materials.
From the results obtained from the hybrid material design and FSI analysis in Table 10, it can be seen that the hybrid material is beneficial and exhibits superior functionality when compared to individual composites to be imposed. The density is reduced to 1412.7 for the hybrid HMS-FR-4 composite in comparison with conventional HMS-CFRP and GFRP-FR-4-FABRIC composites, which is a major advantage in the weight reduction of the body. Although the results show a 6.12% increase in stress of NIP-3 than Base flying wing UAV, there is a 61.14% decrease in deformation for NIP-3 when compared with Base flying wing UAV when imposing the hybrid HMS-FR-4 composite. This is an extreme improvement from the structural point of view of the model during the material implementation process.
3.3. Computational Development and Its Control Dynamics Study
3.3.1. Estimation of Propeller Parameters
The maneuvering of the flying wing would be executed by the propellers. The propeller parameter calculations are as follows: starting with the overall weight of the UAV calculated as seen in Equation (1), the thrust requirement by a single propeller is found using Equation (8), where thrust to weight ratio (T/W) and overall weight of UAV are related.
T/W is fixed as 1. The number of propellers short-listed for this configuration is 6. Substituting the known values in Equation (8),
The standard formula for Thrust is given below, as Equation (9) which is taken from the NASA Website. Density () is taken to be 1.152 from the reference bay of bengal air velocity.
The advanced Quadcopter’s forward maximum velocity is picked as 55 m/s based on the mission requirement. The average velocity of the working fluid at the ocean-based environment is found to be 6 m/s. After substituting the determined data in Equation (9), the diameter of the propeller is calculated as
Finally, the diameter of the propeller is estimated as 0.182456 m = 7.1833 inches. Further historical data on the pitch to diameter ratio (P/D) of similar propellers are collected as shown in Equation (10), to calculate the pitch of the propeller.
Therefore, the pitch is calculated to be 3.67 inches. Thrust factor is an important parameter required for the altitude response computations. It is calculated from the Thrust co-efficient as seen in Equations (11) and (12).
3.3.2. Selection of Electronic Components
The propellers are operated by BLDC motors, whose KV rate is chosen to be 1700 KV, with an internal resistance of 72 , as per relevant historical data of propellers with similar parameters. Using the known values, the torque constant is computed as per Equation (13).
The moment of inertia is calculated for the propeller, motor and its combinations, and is revealed in Table 11.
Table 11.
Moment of inertia calculations for motor and propeller.
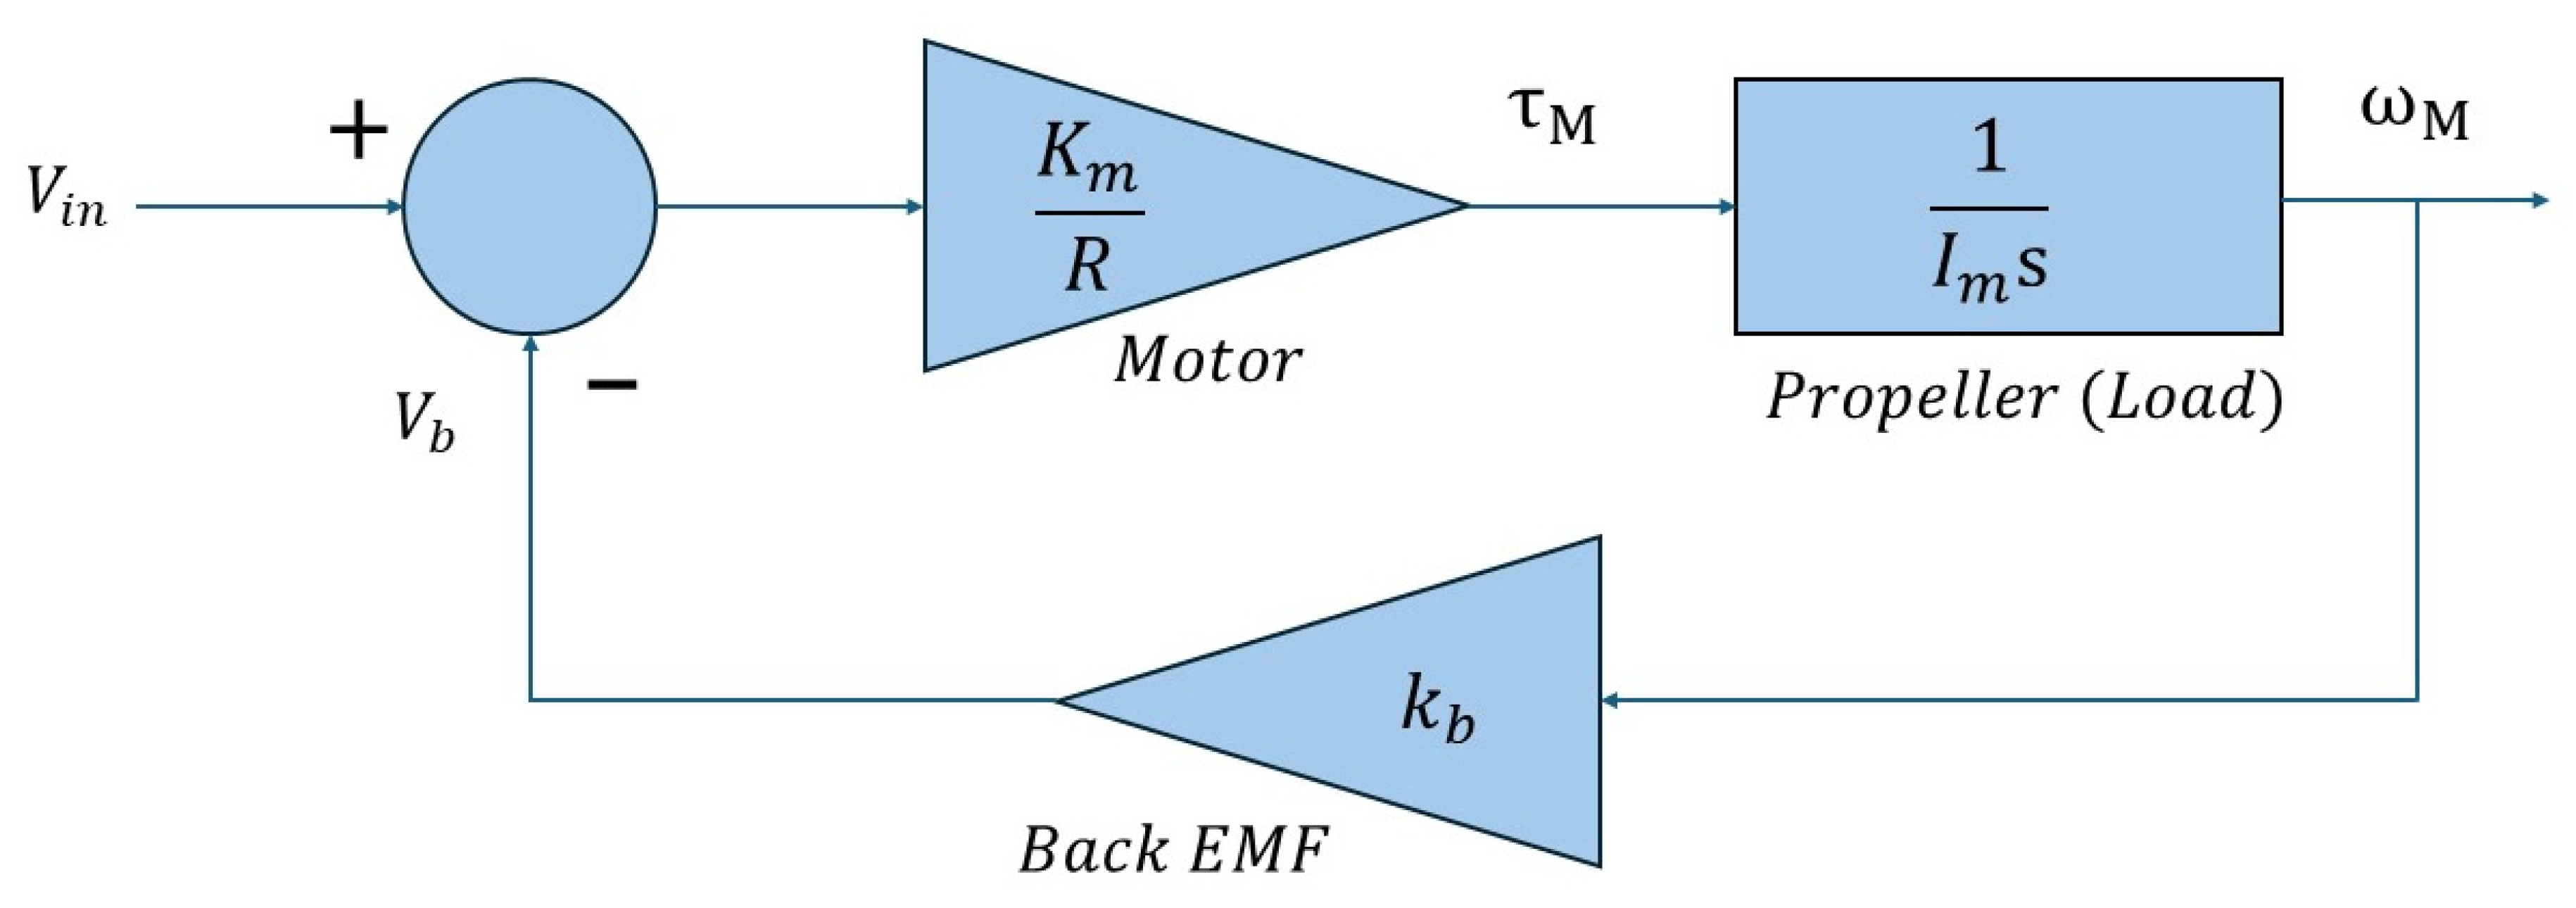
The block diagram of the created motor model with propeller as load is revealed in Figure 82.

Figure 82.
Control block diagram of motor model.
3.3.3. Control Dynamic Simulation
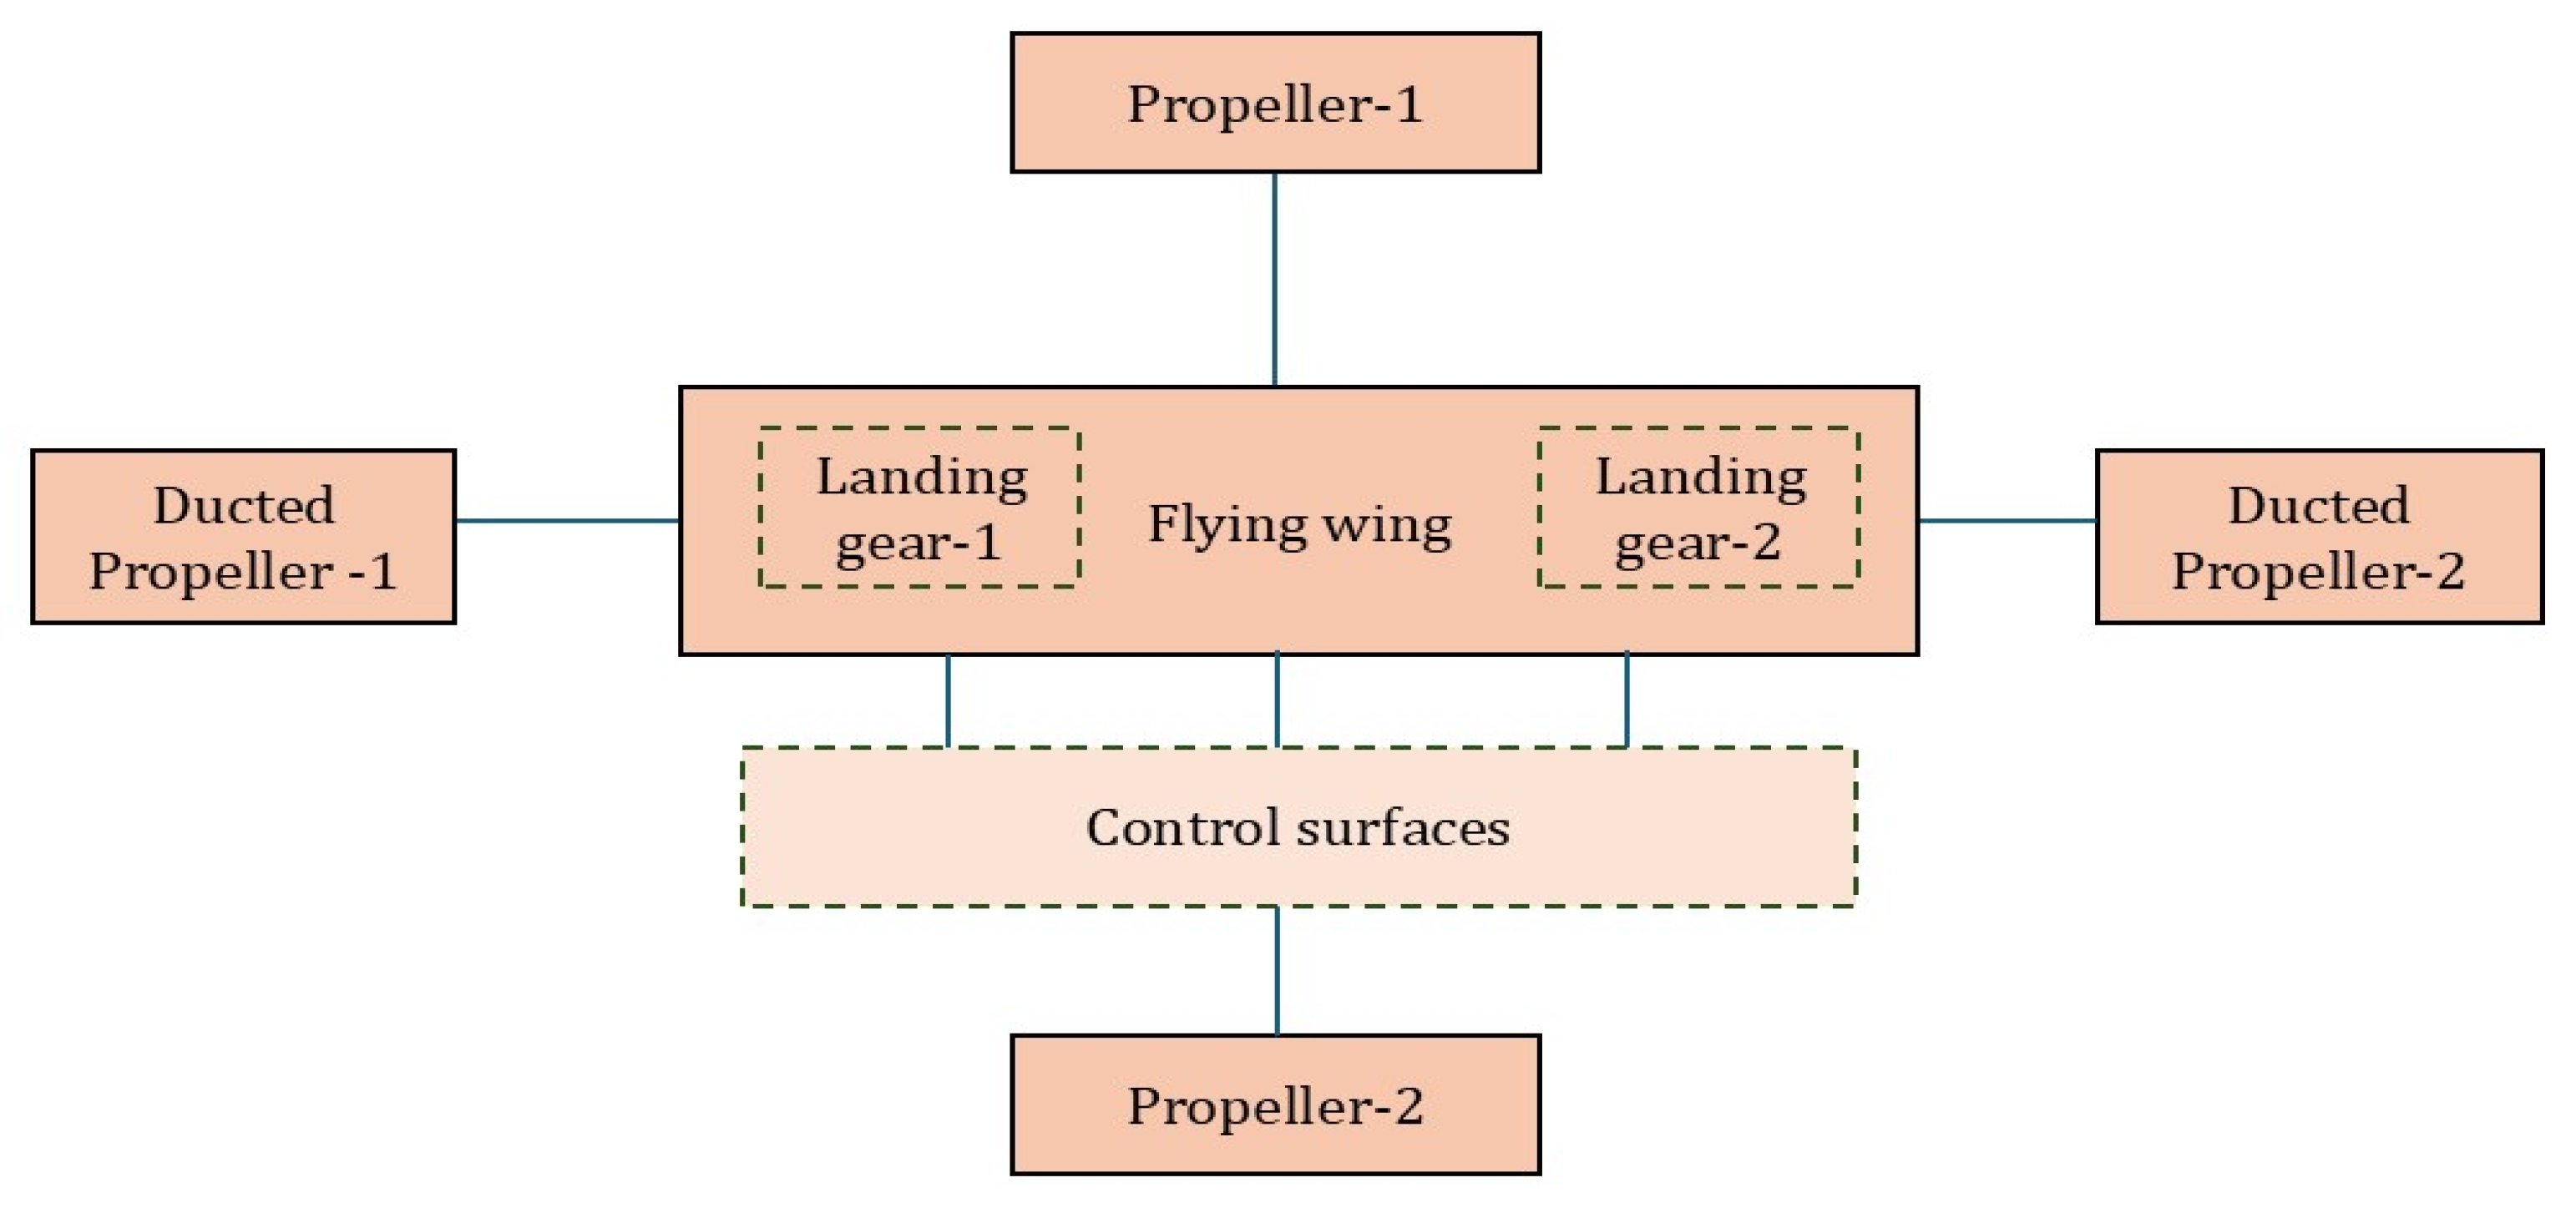
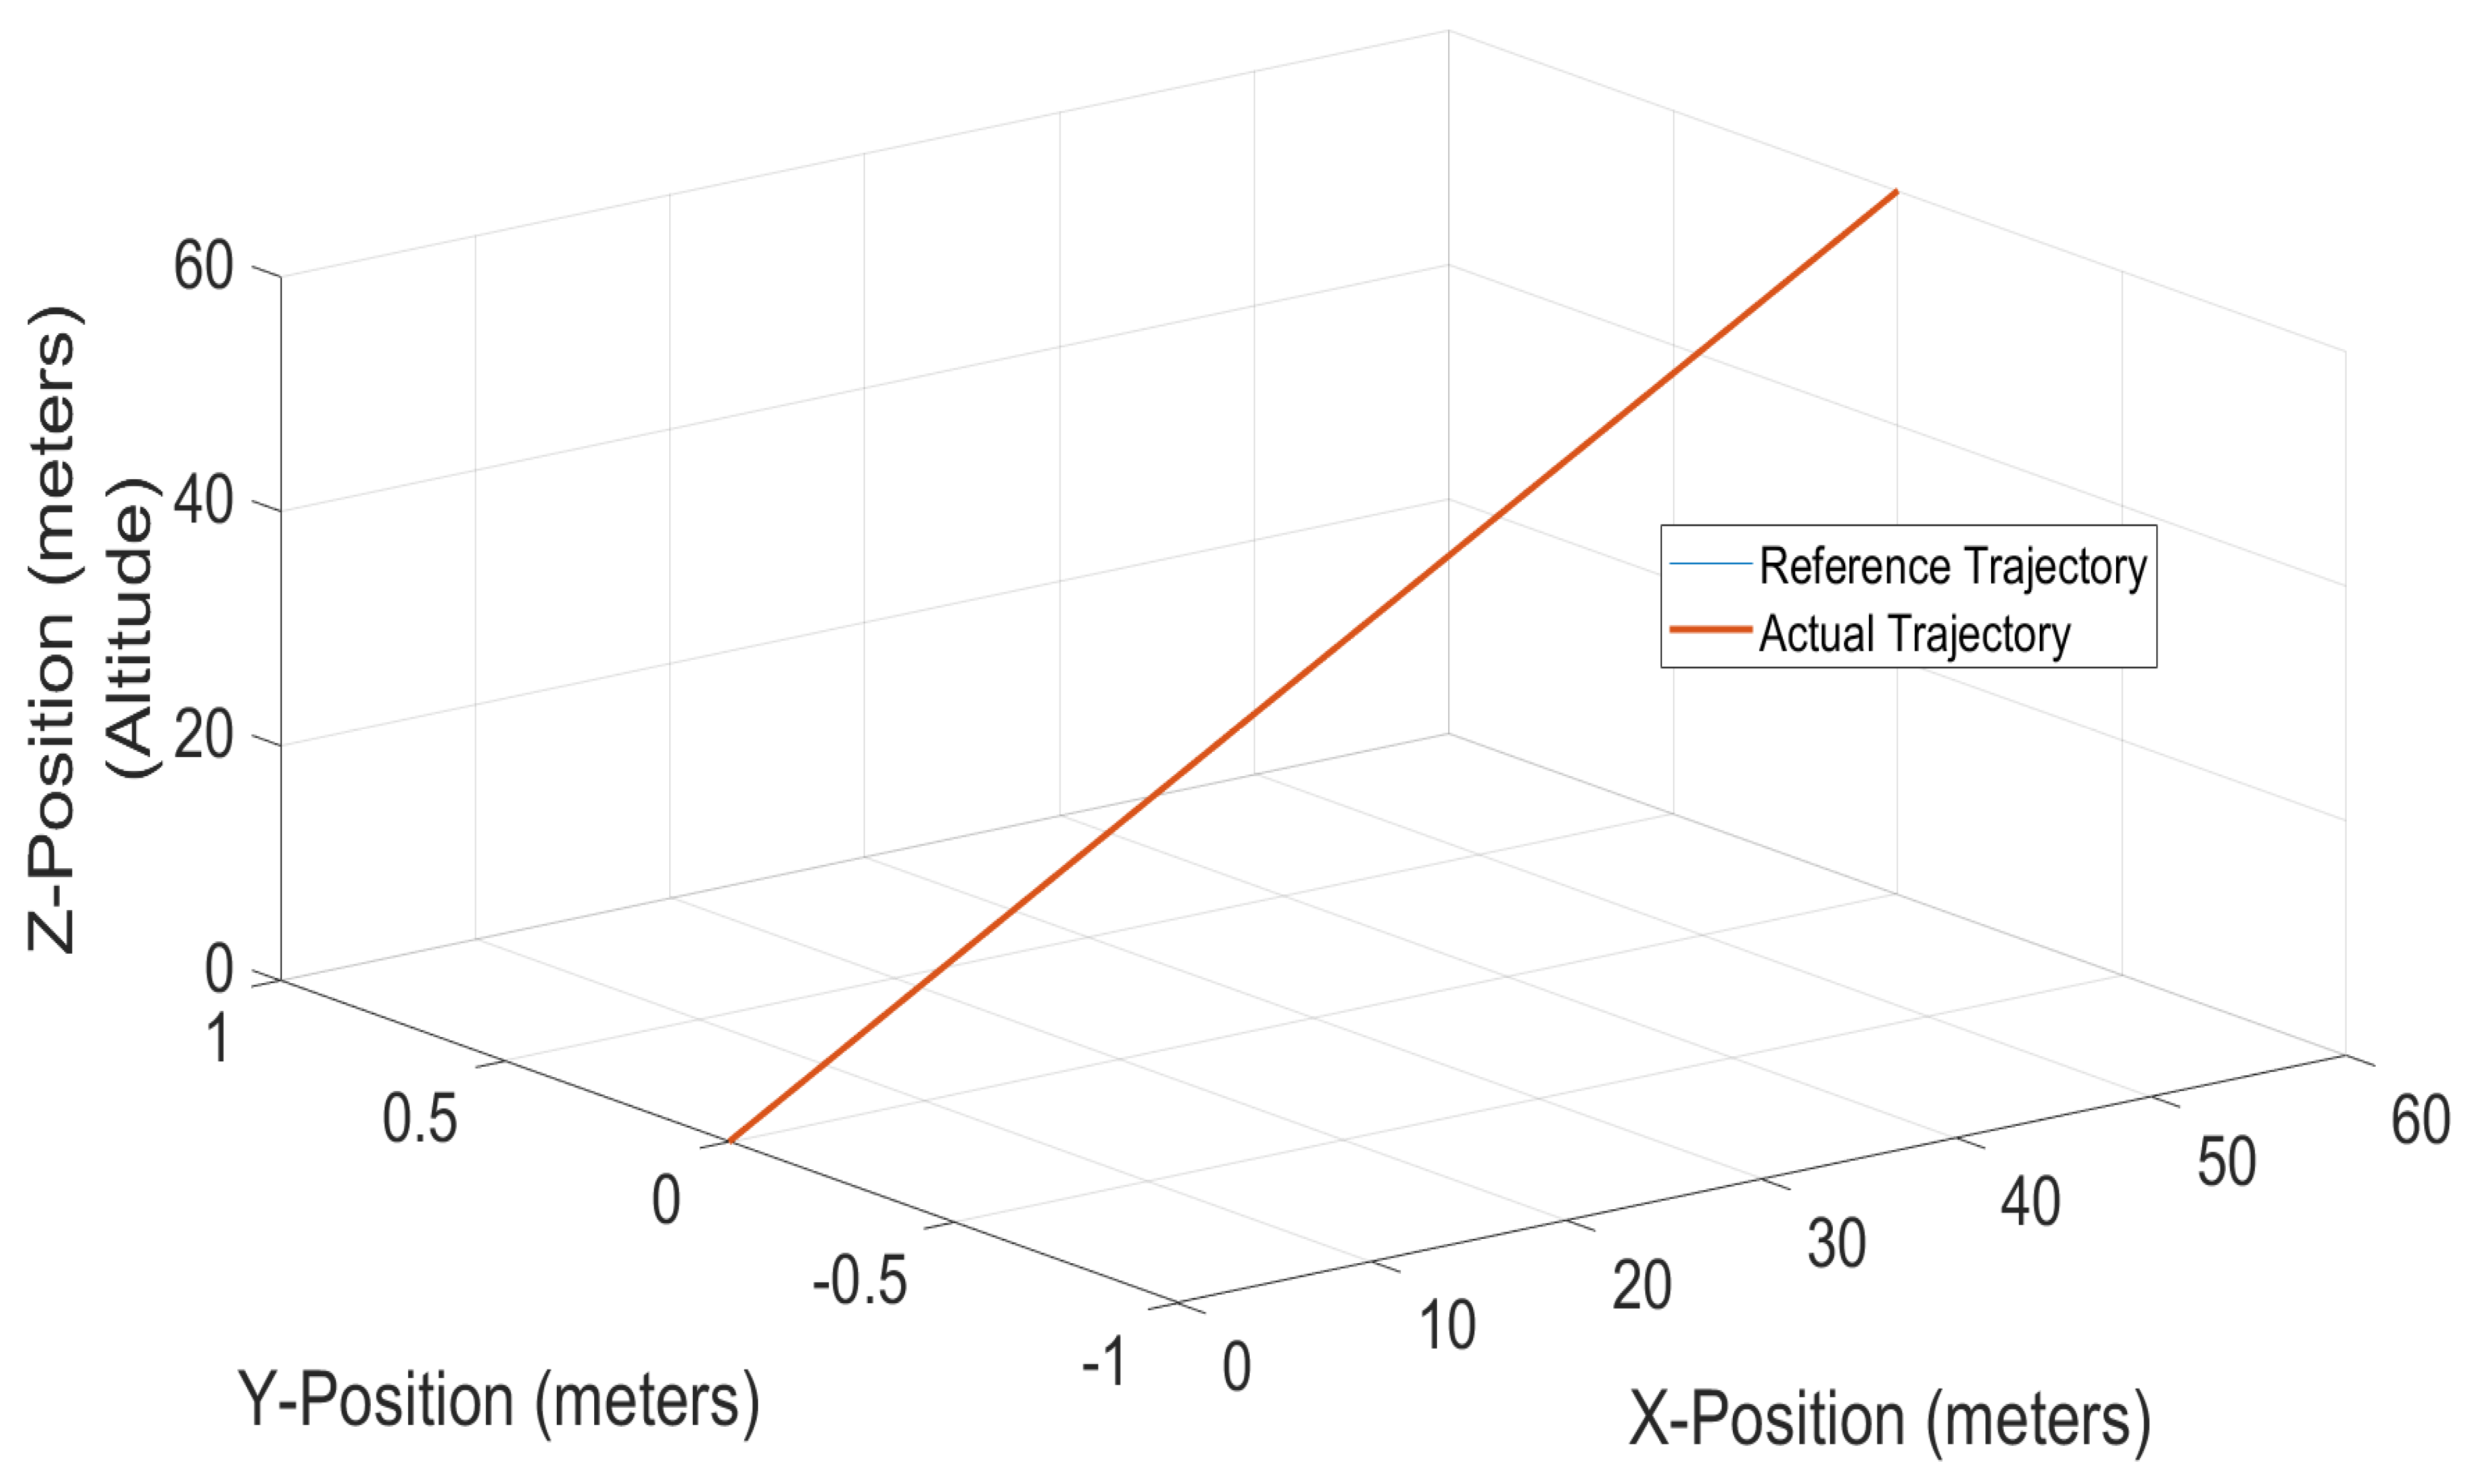
In this simulation, the propeller design calculations are developed and contribute to major movement in forward and vertical axes, during its intended operation. A systematic representation of the to-be developed flying wing UAV is shown in Figure 83. By performing the control analysis for the takeoff maneuver of the flying wing UAV, the altitude increments along with the distance increase for the reference trajectory provided during takeoff are demonstrated in Figure 84. A PID controller has been used for the model, which is tuned to decrease overshoot and increase stability during the crucial takeoff maneuver of flight.

Figure 83.
Systematic representation of flying wing UAV’s top view.
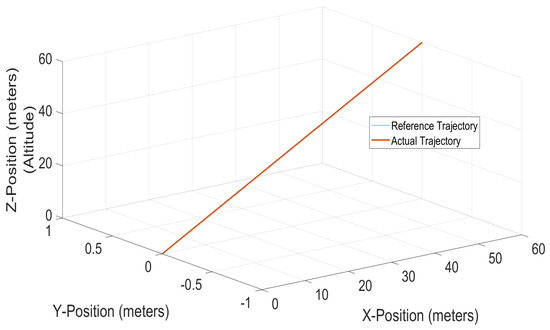
Figure 84.
Altitude and range increment maneuver of the flying wing UAV.
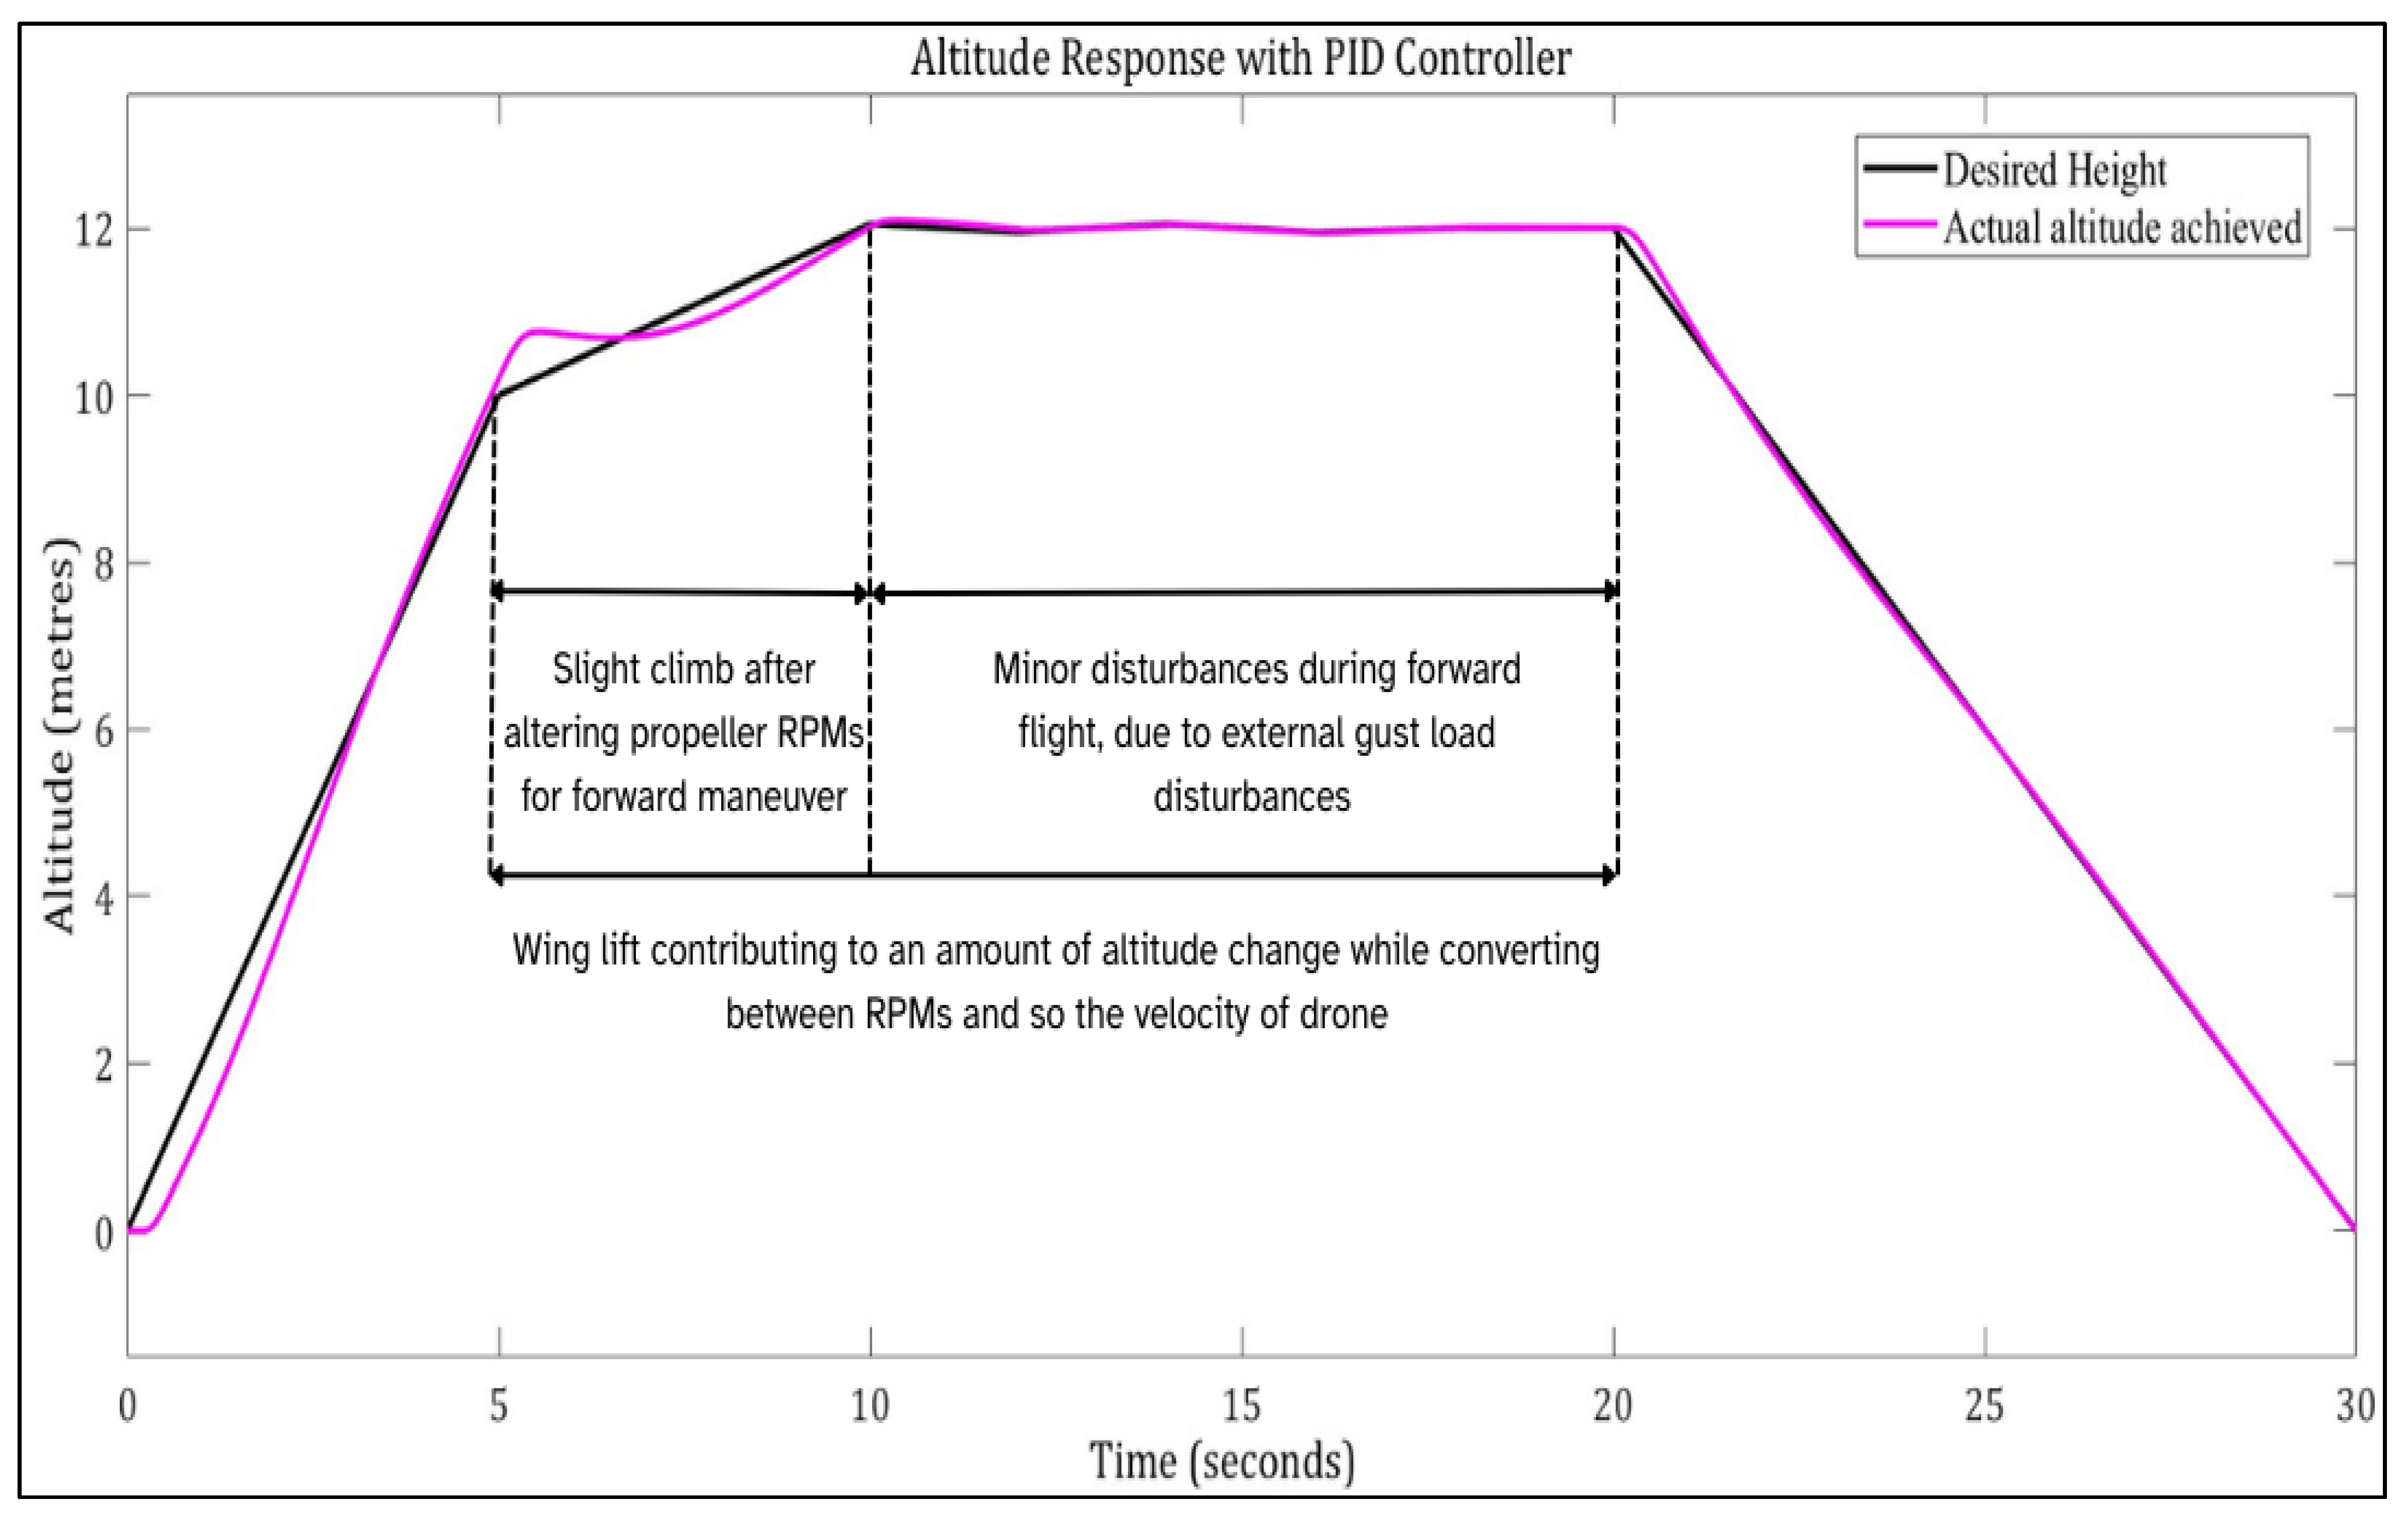
From Figure 83, it is observable that the other components of the drone, contributing to its overall weight and its following design calculations, are input onto the MATLAB R2024b software. From its estimated propeller thrust and RPM related data to be used for maneuvering purposes, it is calculated by the control block integrated with the PID controller, tuned for a stable enough response. From the result of the analysis, Figure 84 shows a takeoff maneuver in which the X-direction, which is range or length through runway, and Z-direction, namely, the altitude is increasing simultaneously as seen for a flying wing UAV. The tuned responses of gain values show a convenient takeoff response without much overshoot that follows the reference trajectory provided as an input. Figure 85 demonstrates the change in altitude between the given height and achieved actual height in the z-axis due to the gain variation and tuning process of PID controller. Also, the lift generated due to presence of wing is shown to be producing minor amount of forces, as seen in the simulation response.
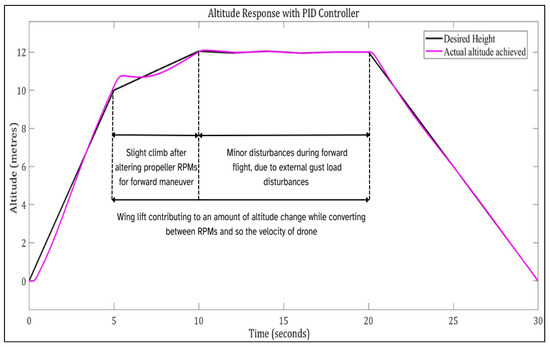
Figure 85.
Altitude response simulation of flying wing UAV.
4. Conclusions and Future Work
The flying wing configuration design process initially started with nature-inspired models. Falcon and dragonfly are the two chosen organisms, encompassing the enhanced aerodynamic characteristics and added advantages of producing greater lift, such that they are used in incorporating their natural features onto a flying wing UAV’s body. These created models are simulated using CFD techniques to understand their nature and deriving forces during flight. Following this, the initial base models are optimized further to create seven more configurations with modifications in either leading edge, trailing edge, or the outer overall shape of the structure. All the nine models proceed with advanced computational simulations executed over them. The pressure, velocity and force variations are computed and compared with each other. The deciding factor of the best performing configuration is the L/D ratio, also known as the aerodynamic efficiency of the model, along with lift, drag and induced velocity magnitudes. From the comparison, the first best model is chosen to be the flying wing UAV NIP-3 configuration, that produces the maximum L/D ratio magnitude, i.e., 11.5999, that stands as the highest among the other configurations. It also has a reasonably high maximum induced velocity, i.e., 204.82 m/s. This model, being aerodynamically efficient, needs to be structurally stable to withstand real time situations; as such, further FSI simulations were conducted to determine the best performing material to be chosen for fabrication. Considering these factors, the two models, namely Base and NIP-3 were chosen as the best performing configurations and further simulated for structural analysis with the implementation of BFRP, KFRP, GFRPs and CFRP materials. The CFRP composites perform the best, including HMS-CFRP and GY-70-CFRP; the other materials, like CFRP-UD-Pg-395-GPa and GFRP-FR-4-FABRIC are the worst performing materials. From the results, a hybrid material is designed for the combination of HMS-CFRP and GFRP-FR-4-FABRIC composites, that when imposed shows a 61.14% decrease in total deformation in the NIP-3 model in comparison with a Base flying wing UAV mode. In addition to the aerodynamic and structural analysis, control dynamics are also performed for the flying wing UAV. The output demonstrates a simultaneous altitude and range increment maneuver that is tuned for a stable flight. These results could be used for upcoming development including fabrication and accurate building of the prototype that is to be developed and built with other subcomponents such as the propulsive system, landing gear, vertical stabilizers, etc., as future work.
Author Contributions
Conceptualization—J.P.V.S.N., M.N.C., V.R. and N.K.K.; methodology—J.P.V.S.N., M.N.C., V.R. and N.K.K.; experimental tools—J.P.V.S.N., M.N.C., V.R. and N.K.K.; investigation—P.R., I.E.L., B.S.A., S.S. and D.V.; resources—P.R., I.E.L., B.S.A., S.S. and D.V.; data curation—J.P.V.S.N., M.N.C., V.R. and N.K.K.; writing—original draft preparation—J.P.V.S.N., M.N.C., V.R. and N.K.K.; writing—review and editing—P.R., I.E.L., B.S.A., S.S. and D.V.; supervision—P.R., I.E.L., B.S.A., S.S. and D.V.; project administration—P.R., I.E.L., B.S.A., S.S. and D.V. All authors have read and agreed to the published version of the manuscript.
Funding
This research received no external funding.
Data Availability Statement
The datasets used and/or analyzed during the current study are available from the corresponding author on reasonable request.
Acknowledgments
This research work is supported by Telekom Research and Development Sdn. Bhd. (RDTC/231096) and Multimedia University, Malaysia.
Conflicts of Interest
The authors declare that they have no competing interests. This manuscript is an original research work and has not been published elsewhere including open access at the internet; the data used in the research have not been manipulated, fabricated, or in any other way misrepresented to support the conclusions; no part of the text of the manuscript has been plagiarized; the manuscript is not under consideration for publication elsewhere; the manuscript will not be submitted elsewhere for review while it is still under consideration for publication in this journal. Finally, the authors declare that they have no conflicts of interest.
References
- Chung, P.H.; Ma, D.M.; Shiau, J.K. Design, manufacturing, and flight testing of an experimental flying wing UAV. Appl. Sci. 2019, 9, 3043. [Google Scholar] [CrossRef]
- Dagur, R.; Singh, V.; Grover, S.; Sethi, N.; Arora, B.B. Design of flying wing UAV and effect of winglets on its performance. Int. J. Emerg. Technol. Adv. Eng. 2018, 8, 414–428. [Google Scholar]
- Bliamis, C.; Zacharakis, I.; Kaparos, P.; Yakinthos, K. Aerodynamic and stability analysis of a VTOL flying wing UAV. IOP Conf. Ser. Mater. Sci. Eng. 2021, 1024, 012039. [Google Scholar] [CrossRef]
- Li, J.-G.; Chen, X.; Li, Y.-J.; Zhang, R. Control system design of flying-wing UAV based on nonlinear methodology. Def. Technol. 2017, 13, 397–405. [Google Scholar] [CrossRef]
- Winter, A.; Hann, R.; Wenz, A.; Gryte, K.; Johansen, T.A. Stability of a Flying Wing UAV in Icing Conditions. In Proceedings of the 8th European Conference for Aeronautics and Space Sciences (EUCASS), Madrid, Spain, 1–4 July 2019. [Google Scholar] [CrossRef]
- Priyambodo, T.K.; Dhewa, O.A.; Susanto, T. Model of Linear Quadratic Regulator (LQR) control system in Waypoint Flight Mission of Flying Wing UAV. J. Telecommun. Electron. Comput. Eng. (JTEC) 2020, 12, 43–49. [Google Scholar]
- Li, Y.; Chen, C.; Chen, W. Research on Longitudinal Control Algorithm for Flying Wing UAV based on LQR Technology. Int. J. Smart Sens. Intell. Syst. 2013, 6, 2155–2181. [Google Scholar] [CrossRef]
- Carlson, S. A hybrid Tricopter/Flying-Wing VTOL UAV. In Proceedings of the 52nd Aerospace Sciences Meeting, National Harbor, MD, USA, 13–17 January 2014. [Google Scholar] [CrossRef]
- Vasile, P. CFD analysis of UAV flying wing. INCAS Bull. 2016, 8, 65–72. [Google Scholar] [CrossRef]
- Ma, Z.Y.; Zhu, X.P.; Zhou, Z. On-ground lateral direction control for an unswept flying-wing UAV. Aeronaut. J. 2019, 123, 416–432. [Google Scholar] [CrossRef]
- Kapsalis, S.; Bliamis, C.; Kaparos, P.; Panagiotou, P.; Yakinthos, K. Parametric investigation of canards on a flying wing UAV using the Taguchi method. Aerospace 2023, 10, 264. [Google Scholar] [CrossRef]
- Mansor, Y.; Sahwee, Z.; Asri, M.H.M. Development of Multiple Configuration Flying Wing UAV. In Proceedings of the 2019 International Conference on Computer and Drone Applications (IConDA), Kuching, Malaysia, 19–21 December 2019; IEEE: Piscataway, NJ, USA, 2019. [Google Scholar] [CrossRef]
- Wang, K.; Zhou, Z. An investigation on the aerodynamic performance of a hand-launched solar-powered UAV in flying wing configuration. Aerosp. Sci. Technol. 2022, 129, 107804. [Google Scholar] [CrossRef]
- Kim, K.-J.; Ahn, J.; Kim, S.; Choi, J.-S.; Suk, J.; Lim, H.; Hur, G.-B. Analysis of partial wing damage on flying-wing unmanned air vehicle. Proc. Inst. Mech. Eng. Part G J. Aerosp. Eng. 2014, 228, 355–374. [Google Scholar] [CrossRef]
- Espinosa Barcenas, O.U.; Quijada Pioquinto, J.G.; Kurkina, E.; Lukyanov, O. Multidisciplinary Analysis and Optimization Method for Conceptually Designing of Electric Flying-Wing Unmanned Aerial Vehicles. Drones 2022, 6, 307. [Google Scholar] [CrossRef]
- Sai, M.S.; Kumar, K.; Prakash, B. Design, analysis and development of a flying wing UAV for aerial seeding and 3D mapping. In Innovative Product Design and Intelligent Manufacturing Systems; Lecture Notes in Mechanical Engineering; Springer: Singapore, 2020; pp. 1023–1033. [Google Scholar] [CrossRef]
- Alsahlani, A.A.; Johnston, L.J.; Atcliffe, P.A. Design of a high altitude long endurance flying-wing solar-powered unmanned air vehicle. Prog. Flight Phys. 2017, 9, 3–24. [Google Scholar] [CrossRef]
- Yusoff, N. Airfoil Design For Flying Wing Uav (Unmanned Aerial Vehicle). In Proceedings of the 4th WSEAS International Conference on Applied and Theoretical Mechanics (MECHANICS ’08), Cairo, Egypt, 29–31 December 2008. [Google Scholar]
- Ferrell, P.; Smith, B.; Stark, B.; Chen, Y. Dynamic flight modeling of a multi-mode flying wing quadrotor aircraft. In Proceedings of the 2013 International Conference on Unmanned Aircraft Systems (ICUAS), Atlanta, GA, USA, 28–31 May 2013. [Google Scholar] [CrossRef]
- Raja, V.; Prabhu, M.; Murugan, K.; Solaiappan, S.K.; Raji, A.P.; Gnanasekaran, R.K.; Ramaiah, M.; Rajapandi, R.; Mathaiyan, V.; Nandhan, A.K.; et al. Design and Multi-Perspective based Computational Analyses of Flying Wing UAV for Rescue Applications at Cryogenic Environments. In Proceedings of the AIAA AVIATION 2022 Forum, Chicago, IL, USA, 27 June–1 July 2022. [Google Scholar] [CrossRef]
- Standridge, Z.D.; Kochersberger, K.B. Design, development, and range optimization of Flying wing UAV. In Proceedings of the 2018 AIAA/ASCE/AHS/ASC Structures, Structural Dynamics, and Materials Conference, Kissimmee, FL, USA, 8–12 January 2018. [Google Scholar] [CrossRef]
- Liersch, C.M.; Schütte, A.; Siggel, M.; Dornwald, J. Design studies and multi-disciplinary assessment of agile and highly swept flying wing configurations. CEAS Aeronaut. J. 2020, 11, 781–802. [Google Scholar] [CrossRef]
- Aleisa, H.; Kontis, K.; Pirlepeli, B.; Nikbay, M. Conceptual design of a nonconstant swept flying wing unmanned combat aerial vehicle. J. Aircr. 2023, 60, 1872–1888. [Google Scholar] [CrossRef]
- Shi, P.; Liu, J.; Gu, Y.; Yang, Z.; Marzocca, P. Full-Span Flying Wing Wind Tunnel Test: A body Freedom flutter study. Fluids 2020, 5, 34. [Google Scholar] [CrossRef]
- Ibrahim, N.A.; Kamal, A.; Zakaria, M.Y. Flight testing of a Flying-Wing UAV. In Proceedings of the AIAA SCITECH 2023 Forum, National Harbor, MD, USA, 23–27 January 2023. [Google Scholar] [CrossRef]
- Mitridis, D.; Bliamis, C.; Kaparos, P.; Yakinthos, K. Design of a tilting mechanism for a VTOL flying wing UAV. IOP Conf. Ser. Mater. Sci. Eng. 2021, 1024, 012056. [Google Scholar] [CrossRef]
- Raghavan, B.; Patil, M.J. Flight control for flexible, High-Aspect-Ratio flying wings. J. Guid. Control. Dyn. 2010, 33, 64–74. [Google Scholar] [CrossRef]
- Ali, U.; Chadwick, E. Flow Control and High-Lift Performance for Flying-Wing Unmanned Combat Air Vehicle Configurations by inserting slots. Int. J. Multiphysics 2016, 10, 117–138. [Google Scholar] [CrossRef]
- Veeraperumal Senthil Nathan, J.P.; Pisharam, A.A.; Sourirajan, L.; Baskar, S.; Vinayagam, G.; Arputharaj, B.S.; Natrayan, L.; Sakthivel, P.; Raja, V. Operation of Advanced Flying Wing UAV: Examination of Structural Performance Under Aberrant Pressure and Thermal Loading Conditions with Integrated Computational Study; SAE Technical Paper 2025-28-0060; SAE International: Warrendale, PA, USA, 2025. [Google Scholar] [CrossRef]
- Veeraperumal Senthil Nathan, J.P.; Rajendran, M.; Arumugam, M.; Raji, A.P.; Sakthivel, P.; Madasamy, S.K.; Arputharaj, B.S.; Natrayan, L.; Raja, V. Computational Evaluations of Structural Integrity in Unmanned Aquatic Vehicles Utilizing Various Conventional and Hybrid Composites Using Hydro-Structural Analyses; SAE Technical Paper 2025-28-0056; SAE International: Warrendale, PA, USA, 2025. [Google Scholar] [CrossRef]
- Baskar, S.; Vinayagam, G.; Pisharam, A.A.; Gnanasekaran, R.K.; Raji, A.P.; Arputharaj, B.S.; Natrayan, L.; Ganesan, B.; Raja, V. Material Augmentation for Coaxial Propellers of Titan’s Unmanned Airship: Implementation of Advanced Composites for the Propulsive System Under Unconventional Loading Conditions with Incorporation of Structural Integrity Examinations; SAE Technical Paper 2025-28-0167; SAE International: Warrendale, PA, USA, 2025. [Google Scholar] [CrossRef]


Disclaimer/Publisher’s Note: The statements, opinions and data contained in all publications are solely those of the individual author(s) and contributor(s) and not of MDPI and/or the editor(s). MDPI and/or the editor(s) disclaim responsibility for any injury to people or property resulting from any ideas, methods, instructions or products referred to in the content. |
© 2025 by the authors. Licensee MDPI, Basel, Switzerland. This article is an open access article distributed under the terms and conditions of the Creative Commons Attribution (CC BY) license (https://creativecommons.org/licenses/by/4.0/).