1. Introduction
Workload prediction, intended as the ability to forecast the capacity required to perform a task accurately, is a critical aspect of Production Planning and Control (PPC) processes, aiming to improve efficiency and ensure timely delivery. It has a significant impact on production efficiency by providing the ability to foresee and formulate appropriate actions before production, cost-effectively improving system throughput [
1].
In small- and medium-sized enterprises (SMEs), generally, this planning task is based on managers’ experience, and this can be misleading but also risky if key personnel leave [
2,
3]. New data-driven approaches that provide practical solutions to improving accuracy need to be developed [
4,
5]. However, SMEs often struggle to adopt Big Data Analytics, Artificial Intelligence (AI), and Machine Learning (ML), cloud computing, and the Internet of Things solutions due to financial constraints and limited expertise and competence, relying instead on more traditional planning methods [
6,
7]. Adopting digital and smart solutions based on the use of data is crucial for growth and competitiveness in SMEs. What SMEs truly require are intuitive, lightweight systems that can be quickly adopted and seamlessly embedded into their already diverse and fragmented technological ecosystems [
4,
8,
9].
Manufacturing SMEs often struggle to keep pace with rapid technological progress and maintain their market competitiveness, especially when it comes to adopting advanced manufacturing systems and fully embracing the Industry 4.0 (I4.0) paradigm. Despite its potential, the integration of I4.0 digital technologies still represents a problem for many of these enterprises [
7,
10], although it holds significant promise, enabling enhanced productivity, lower operational costs, and improved product quality. Studies reveal that SMEs frequently underutilise the full range of technological tools available for I4.0 implementation [
11]. Focusing on AI and ML, generating valuable insights directly from operational data enables Industry 4.0 transformation [
12]. The growing use of AI and especially ML in manufacturing contexts is driven by their potential to extract actionable knowledge from complex datasets, delivering tangible improvements in efficiency, adaptability, and innovation [
13].
However, in SMEs, most academic and practical applications of these technologies have centred around maintenance and quality control, whereas production planning and operational control, on which this work focuses, remain underexplored areas in the literature [
11]. While AI and ML are gaining traction in dynamic manufacturing, their potential for planning tasks remains largely uncovered and applied [
14]. Systems incorporating AI possess analytical capabilities that emulate human cognition. ML, instead, the most promising subfield of AI, specifically enables computer systems to recognise correlations from data, thereby making human-like decisions without defined rules. It is based on the generalisation of knowledge from data and can be realised with different methods such as classification, clustering, regression, and anomaly detection [
13,
15]. Three categories of ML can be distinguished based on how the models learn from the data: supervised, unsupervised, and reinforcement learning techniques [
15]. Supervised learning, which is the focus of this study, is generally performed when goals are specified to be achieved from a set of inputs that use labelled data to train algorithms to classify data (classification models used to predict a label) or forecast outcomes (regression models to predict a quantity). All the tools or methods based on the use of data are dependent on the level of digitalisation of the companies [
8,
16]. Although digitalisation in planning processes is still a challenge for SMEs, the literature highlights an interesting new trend related to data analytics applications. ML is also increasingly leveraged in workload management within SMEs to predict production times more accurately. By using predictive analytics on production data, SMEs can improve scheduling and workforce allocation. Although often challenging to implement due to limited datasets, this approach helps SMEs adjust their workflows more dynamically, enhancing their responsiveness to demand changes and minimising downtime [
17]. According to the specific application, the companies need to be ready to implement “smart” solutions based on AI/ML [
18].
Regarding workload prediction, establishing the amount of time needed for an order task in manufacturing is essential for defining its overall load on the manufacturing system and its distribution over time on the resources. This helps in defining the overall order Lead Time (LT) and assigning a reasonable and reliable due date for the customer. The accuracy of this process not only allows for meeting customer expectations and becoming more competitive, but also affects shop floor management practices [
19,
20,
21]. It is essential to know how much time a product might take to get through the manufacturing system for good planning, which allows high flexibility of processes and resources and makes scheduling more predictable, agile, and flexible [
20]. For industries with high product variability such as Engineer to Order (ETO), Make To Order (MTO), or Small Series (SS), despite the complexities, the degree to which the plan is executed depends largely upon the ability to accurately predict the amount of time needed for the execution of the order [
20,
22]. Accurate LT prediction, which is strictly dependent on the order’s overall workload, is essential for effective production planning, especially in contexts with high product variability [
2,
4,
23,
24].
In SMEs, recent advances in data analytics and AI offer promise, but integrating these with real-world data remains difficult [
24,
25]. Analytical approaches have been developed to forecast an accurate LT, even though they are limited to single-case applications [
26]. To improve this planning task, SMEs must overcome these barriers, moving away from reliance on tacit knowledge to more systematic, data-driven approaches. However, fully connecting the shop floor to collect meaningful data and integrating automated retraining through Automated Machine Learning (AutoML), which provides methods and processes to make ML available for non-experts to improve the efficiency of machine learning and accelerate research in this field, are ongoing challenges in SMEs [
4,
24].
Aim of the Study
This work aims to provide an application of AutoML for regression that compares several supervised ML models and identifies the best one for the prediction of order task workload, considering the characteristics of the products manufactured as features on which the workload depends. The application was developed using data from a mid-sized company. To evaluate the impact of different product types on workload prediction accuracy, two cases were analysed: (A) focusing on a single product category and (B) incorporating all available products realised. This comparison helps determine whether product specificity enhances model performance. The innovative aspect of this work lies in offering a solution that is easy to implement. By starting with a manageable dataset, it becomes possible to enhance the planning process through more accurate workload estimations, all within an application built on open-source software. The primary advantages of this application lie in its ability to utilise the total predicted workload based on product features during the offer phase. This enables the sales department to formulate more precise offers, ensuring a more accurate budgeted cost. Additionally, the planning function benefits from a more precise workload estimation, allowing for the effective scheduling of work centres. In the context of Industry 4.0, this research work makes a significant contribution to the digital transformation of manufacturing SMEs by fostering the adoption of advanced technologies to enable data-driven decision-making in planning processes.
The structure of this paper is organised as follows.
Section 2 describes the methodology followed, even providing details related to the case study’s company.
Section 3 shows the results achieved for each case and predicts the results as a function of the regression model evaluated, and
Section 4 discusses them. The main conclusions, limitations, and future research steps are drawn in
Section 5.
2. Materials and Methods
2.1. Company Details
The company Motortecnica s.r.l., located in San Cipriano Picentino (Salerno, Italy), is a medium-sized company, founded in 1989, that operates in the electromechanical sector to provide repair services for electrical machines; it later extended its activities to the design and construction of motors and alternators of various types. It is an example of an “Engineer to Order” production system.
The company collected all data related to the orders realised, the characteristics of the product/service, and data from planning and monitoring, thanks to two customised tools developed in Microsoft Access and Microsoft Excel. Each manufacturing order, following a project-management-based approach, is decomposed into the realisation of multiple tasks constrained and interdependent. For each of them is essential in the planning phase to establish the overall workload (number of hours) on the working centres. The company faced several challenges in planning and controlling production orders, which hindered operational efficiency and led to numerous delays and inefficiencies in the overall process. The company relied heavily on an experience-based approach to planning, where decisions were made based on the intuition and historical knowledge of employees rather than data-driven insights. Although useful, experience-based planning lacks the precision needed in today’s complex production contexts. It also made it difficult to scale operations or make changes in response to shifting market demands or production challenges. As a result of the previous inefficiencies, the company often found itself in a situation where overtime was required to compensate for the workload not properly forecasted in the planning phase. This not only increased costs but also placed additional pressure mainly on operators, leading to potential burnout, reduced morale, and a decline in overall productivity.
2.2. Methodology
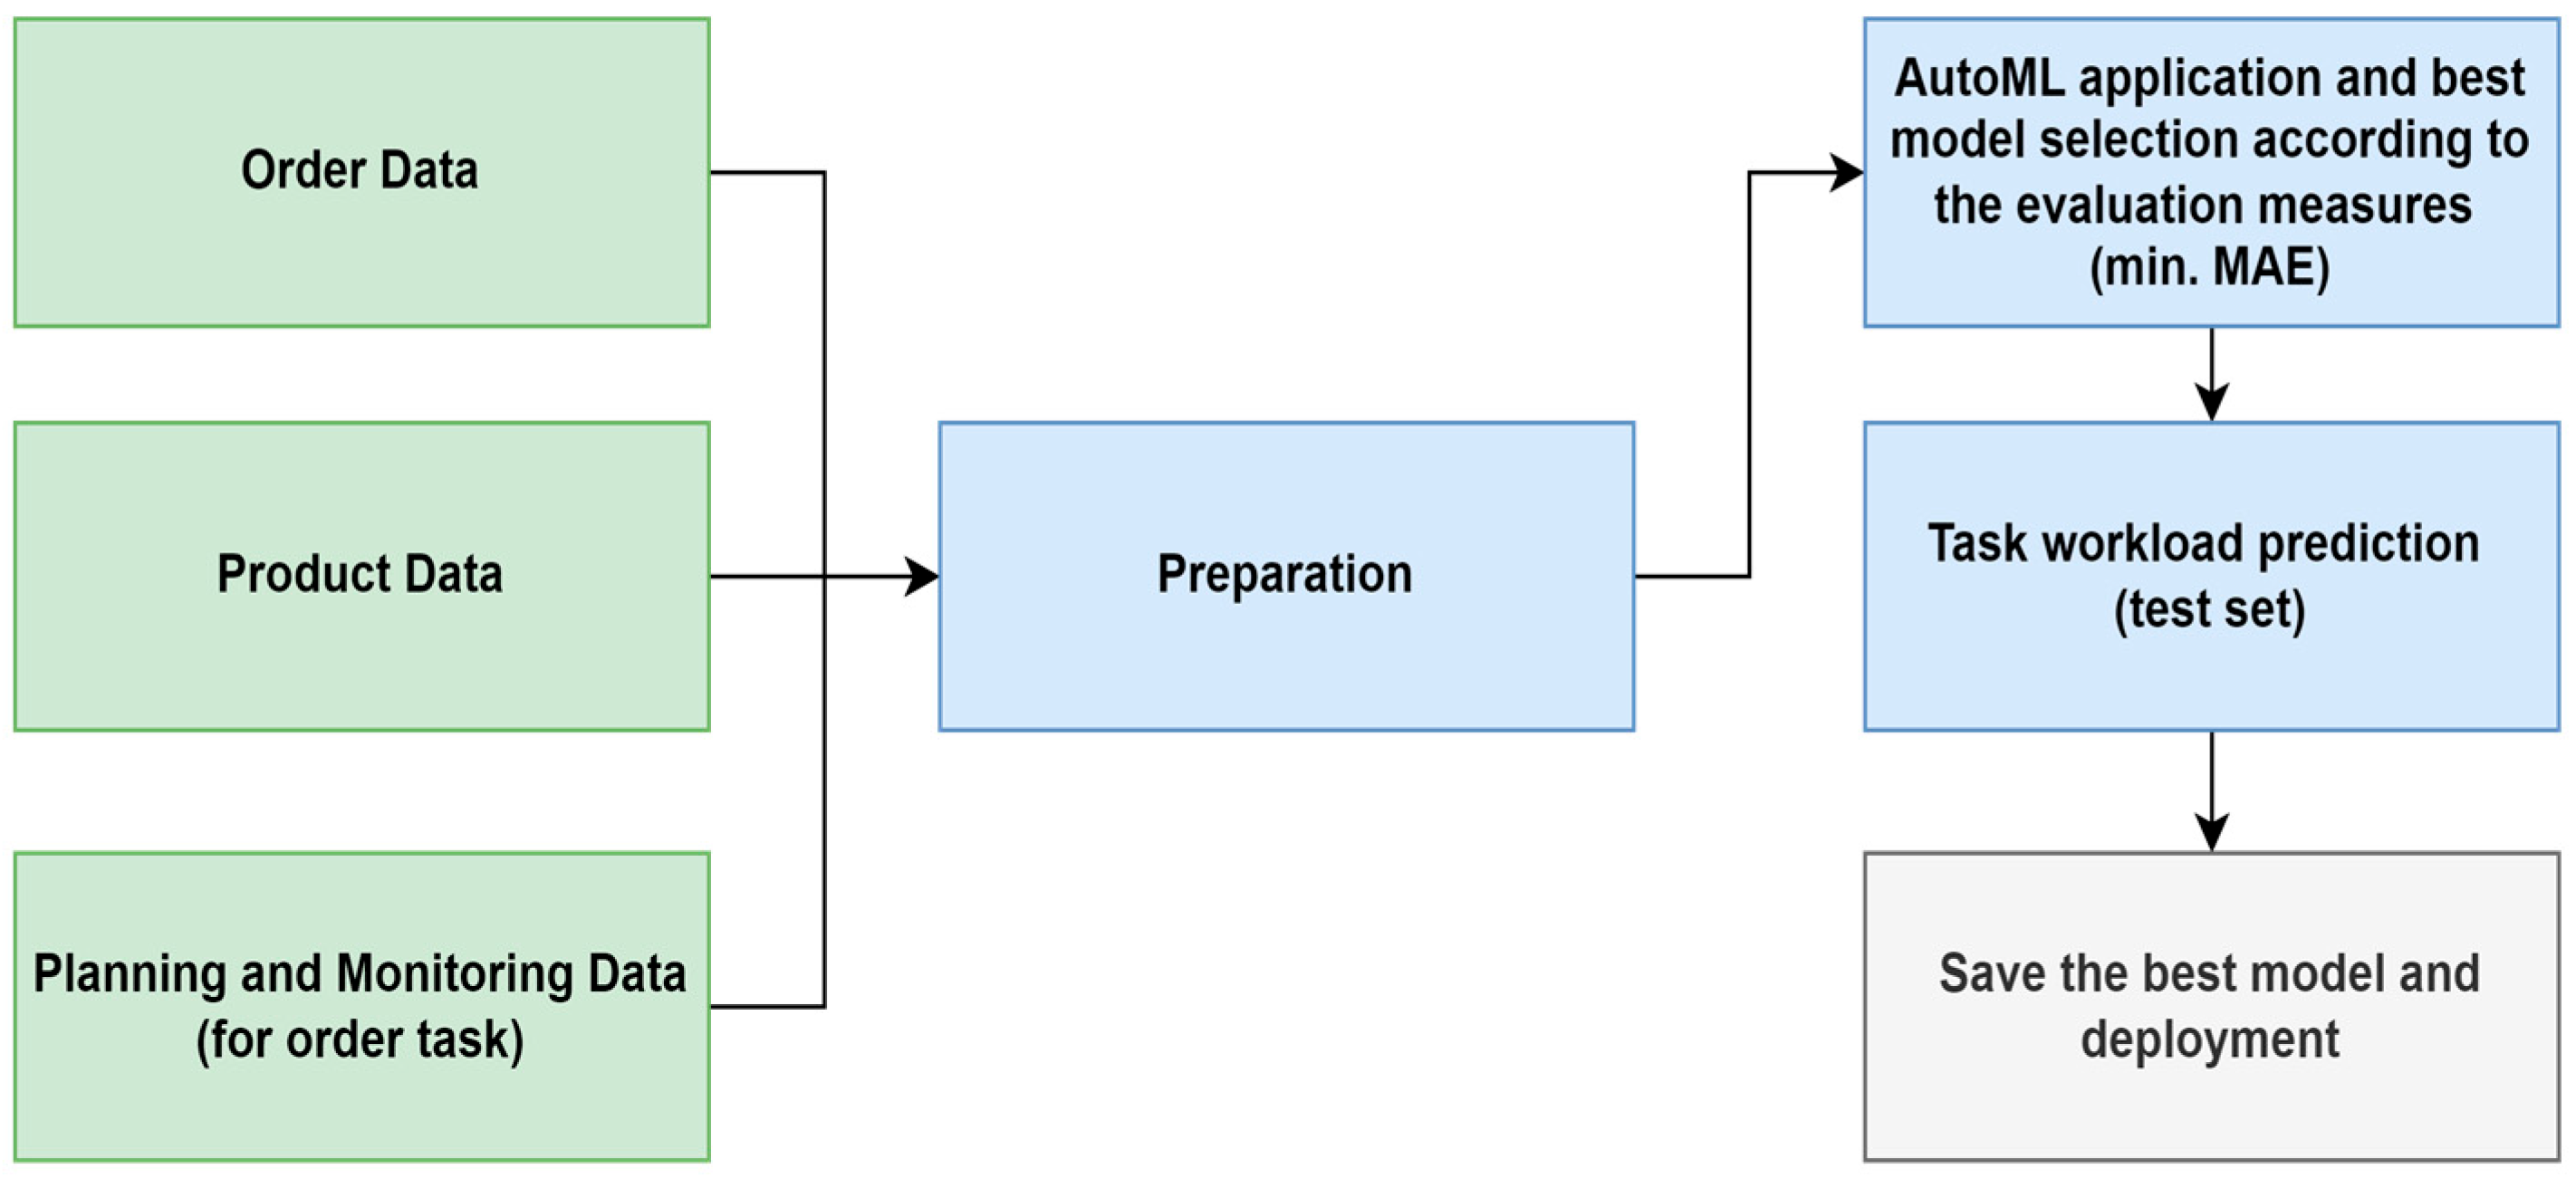
This study adopts the Cross-Industry Standard Process and Data Mining (CRISP-DM) framework as its methodological foundation. This framework is one of the most popular methodologies for data analytics [
27] that consists of the following steps: (i) business understanding refers to the conversion of the business objective into a data mining problem; (ii) data understanding identifies the data source and obtains the variables related to the problem; (iii) data preparation uses several data cleaning and transforming techniques to produce a well-structured dataset before analysis; (iv) predictive modelling includes variable selection, model development, hyperparameter tuning, and validation; (v) model evaluation measures and compares the predictive performance of the models based on different predefined error measurements; and (vi) model deployment generates insights to assist managerial decision-making. The application developed in this research study, based on the CRISP-DM framework, has been detailed in
Figure 1.
For the implementation, KNIME Analytics Software (version 5.3) was used [
25,
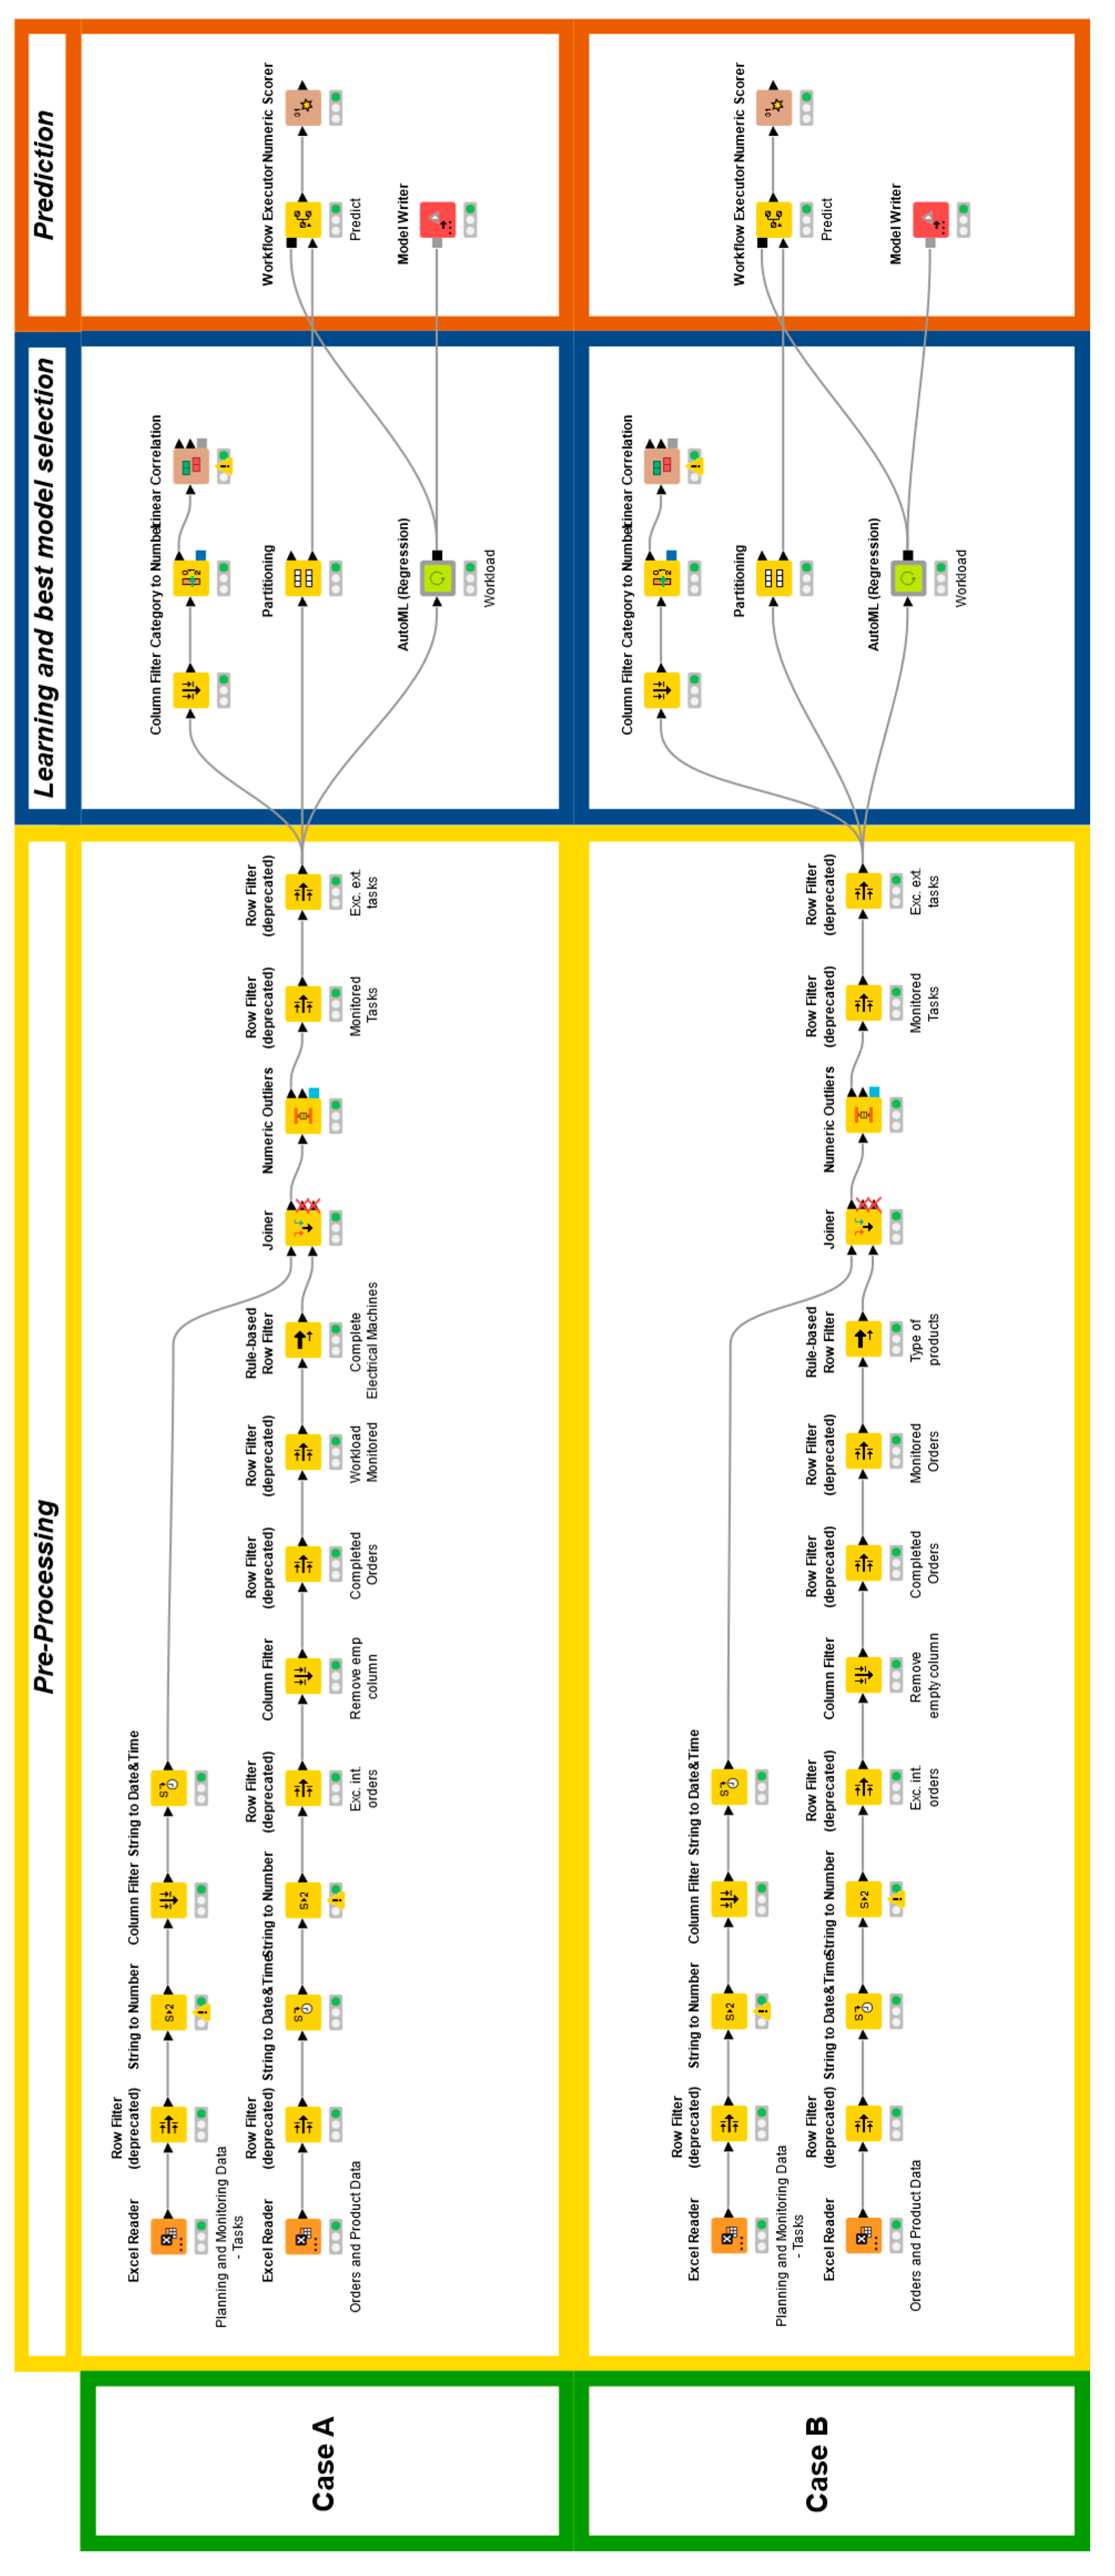
28], an open-source data analytics, reporting, and integration platform that enables users to perform data processing, analysis, and visualisation tasks through a visual, drag-and-drop interface. The software allows for creating complex workflows by connecting various components or “nodes” that represent different data operations. Thus, a smart application was realised to evaluate through the AutoML Regression tool to predict the workload of tasks in the planning phase. Two different applications have been modelled:
Case A: Only the data related to the orders that realised a complete generator have been investigated. Most of the orders handled by the company fall into this category. For this reason, specific attention was provided to this kind of product.
Case B: Data from all the orders and types of products were analysed. The objective was to demonstrate whether the typology of the product, considered as an explanatory variable rather than a predefined dataset constraint, affected the prediction models’ performance and to what extent. The product types examined include the full range of components associated with generators, which, for some customers, can also be sold as standalone products, such as rotor poles, stator windings, rotor bars, field coils, as well as other types of products like low-voltage and DC motors.
The developed workflow is depicted in
Figure 2. It includes a sub-workflow named “AutoML (Regression)” that has been used to carry out the parameter optimisation and the best model selection according to a specific criterion to optimise.
This workflow uses the entire dataset as a sample to split into learner and predictor splits. This is partitioned into 80% and 20% to learn and therefore train the model within the Auto ML Regression component. After the data preprocessing operation phase, the data sample is split into two parts, with 80% of the data going to the learner partition and the other 20% going to the predictor partition.
Regarding the feature selection, i.e., the identification of the most significant type of data that could be used for the regression, it is a critical preprocessing step in ML modelling. It involves selecting a subset of relevant features while removing irrelevant and redundant ones to improve model performance, reduce the computational cost, and enhance data visualisation. Identifying the most important features can accelerate training and improve model interpretability [
29,
30]. In this case study, the correlation analysis carried out to analyse the correlations between the independent variable (workload) and the dependent numeric variables was combined with the discussion with the planner and the production functions. Pearson’s correlation, widely used to measure the degree of correlation between two variables [
31], was assessed. The correlation value ranges from −1 (strong negative correlation) to 1 (strong positive correlation), with 0 indicating no linear correlation. In addition, a
p-value, representing the probability of obtaining the observed result if the correlation coefficient were zero (null hypothesis), was calculated to assess statistical significance. When this probability falls below the conventional threshold of 5% (
p < 0.05), the correlation coefficient can be considered statistically significant [
32]. The results are presented in
Table 1, with Case A referring to the constrained dataset and Case B to the full dataset. Significant values identified in this preliminary analysis are highlighted in bold.
Given the limited volume of available data, the correlation analysis, while helpful in providing some preliminary insights, proved insufficient on its own for supporting robust feature selection. In particular, the Pearson correlation coefficient did not fully capture the complex, often non-linear relationships between variables that influence workload in a real-world production environment. As such, we adopted a hybrid approach that combined quantitative analysis with expert judgement. Discussions with the planner and production functions were essential to this process. Their operational knowledge provided critical context, enabling us to evaluate the practical significance of certain features that, although not statistically prominent, were known to impact workload dynamics. This expert input helped to uncover underlying dependencies and process-specific nuances that the statistical model alone could not detect. Variables that showed weak or no correlation on paper were nonetheless retained in the feature set based on contextual relevance and domain experience. By integrating empirical data with operational expertise, a feature set was created that was not only data-informed but also grounded in practical reality. This hybrid methodology enhanced the reliability and applicability of the workload prediction model, aligning it more closely with actual production scenarios. The features identified, including the categorical variables that affect the workload for each task, with the related description, are reported in
Table 2.
Among 11 features, 5 are highly dependent on the specific product and may exhibit significant variability based on the unique characteristics and configuration associated with the “Type of product/service”. For example, in the case of generators, key parameters are represented by “Voltage [kV]”, “Power [MVA]”, “Rotational Speed [rpm]”, and the type of axis configuration (“Axis”). In contrast, when considering Case B, where data from a broader range of products and orders are analysed, there is considerable variability across different product types. For instance, in rotor poles, the factor that most affects workload is the internal length of the polar coils (“Polar Coil Length [mm]”). Meanwhile, for stator windings, the voltage level is a primary determinant, as it dictates the selection of insulating materials, which in turn influences the production technology employed. Specifically, the choice between Vacuum Pressure Impregnation (VPI) and Resin Rich (RR) processes is closely linked to the voltage requirements, with RR typically involving a higher workload compared to VPI.
Finally, machine learning models for regression were compared. In particular, the models evaluated through the AutoML node are as follows:
Linear Regression, which establishes the relationship between two variables by fitting a linear equation to observed data. One variable is treated as the explanatory variable and the other as the dependent variable. It has been trained with default parameters in KNIME.
Polynomial Regression, which represents the relationship between the explanatory and dependent variables using an nth-degree polynomial, allows the capture of non-linear relationships. It has been trained with the optimised parameter “Polynomial degree”.
XGBoost Linear Ensemble, which has been trained with optimised parameters “alpha” and “lambda”.
H2O Generalised Linear Model, trained with the KNIME H2O Machine Learning Integration.
Regression Tree, trained with optimised parameter “Min number records per node”.
Random Forest, derived from decision tree algorithms, addresses classification and regression problems through ensemble learning, which combines multiple classifiers to solve complex tasks. This method generates numerous decision trees, aggregates their predictions, and averages the outputs to improve accuracy. In KNIME, it has been trained with optimised parameters “Tree Depth”, “Number of models”, and “Minimum child node size”.
Gradient Boosted Trees, which builds a “strong” model by combining multiple “weak” models (e.g., decision trees). At each step, the error of the strong model is predicted using a new weak model, and the result is subtracted to reduce the error. It has been trained with the optimised parameter “Number of trees”.
XGBoost Tree Ensemble, trained with optimised parameters “eta” and “max depth”.
H2O AutoML, trained with the KNIME H2O Machine Learning Integration.
Then, the predictions from all models have been compared, and performance metrics have been calculated to evaluate the accuracy of machine learning models, assess the discrepancy between predicted and actual results, and ensure both the reliability and overall effectiveness of the model [
33]. Performance metrics are crucial for evaluating the accuracy of machine learning models. The performance metrics evaluated are as follows:
Mean Absolute Error (MAE), i.e., the average of absolute individual errors. On average, the predicted value is off by the MAE value. It defines the magnitude of errors without considering whether they are overestimations or underestimations. Unlike MSE, which squares the errors and can be influenced by outliers, MAE provides a more balanced error representation. It is generally used when the direction of errors is not critical.
Mean Squared Error (MSE), i.e., the average squared difference between the value observed in a statistical study and the values predicted from a model. A lower MSE indicates that the model’s predictions are closer to the true values, reflecting better overall performance.
Root Mean Squared Error (RMSE), i.e., the square root of the average squared differences between predicted and observed outcomes. By squaring, more weight is given to larger errors.
R-squared (R2), i.e., a measure of how well the independent variable(s) in a statistical model explain the variation in the dependent variable.
To establish the best model from the AutoML tool, as a criterion, the minimisation of MAE was identified as the best solution, as also reported in other similar applications in the literature [
4,
34]. At the end of the workflow, the system selects the best model according to the metric to optimise. The results obtained for each case are detailed in the following sections. As a benchmark for the final model evaluation, and also to establish a comparison with the actual conditions, simple averaging (representing a commonly used value as a rough estimate of variables considered in industrial settings based on the product type, task type, and the quantity to be processed) and manual prediction have been compared to the results obtained from the best ML model [
4,
35]. In particular, the simple average was specifically determined based on the product type, task type, and the quantity to be processed.
4. Discussions
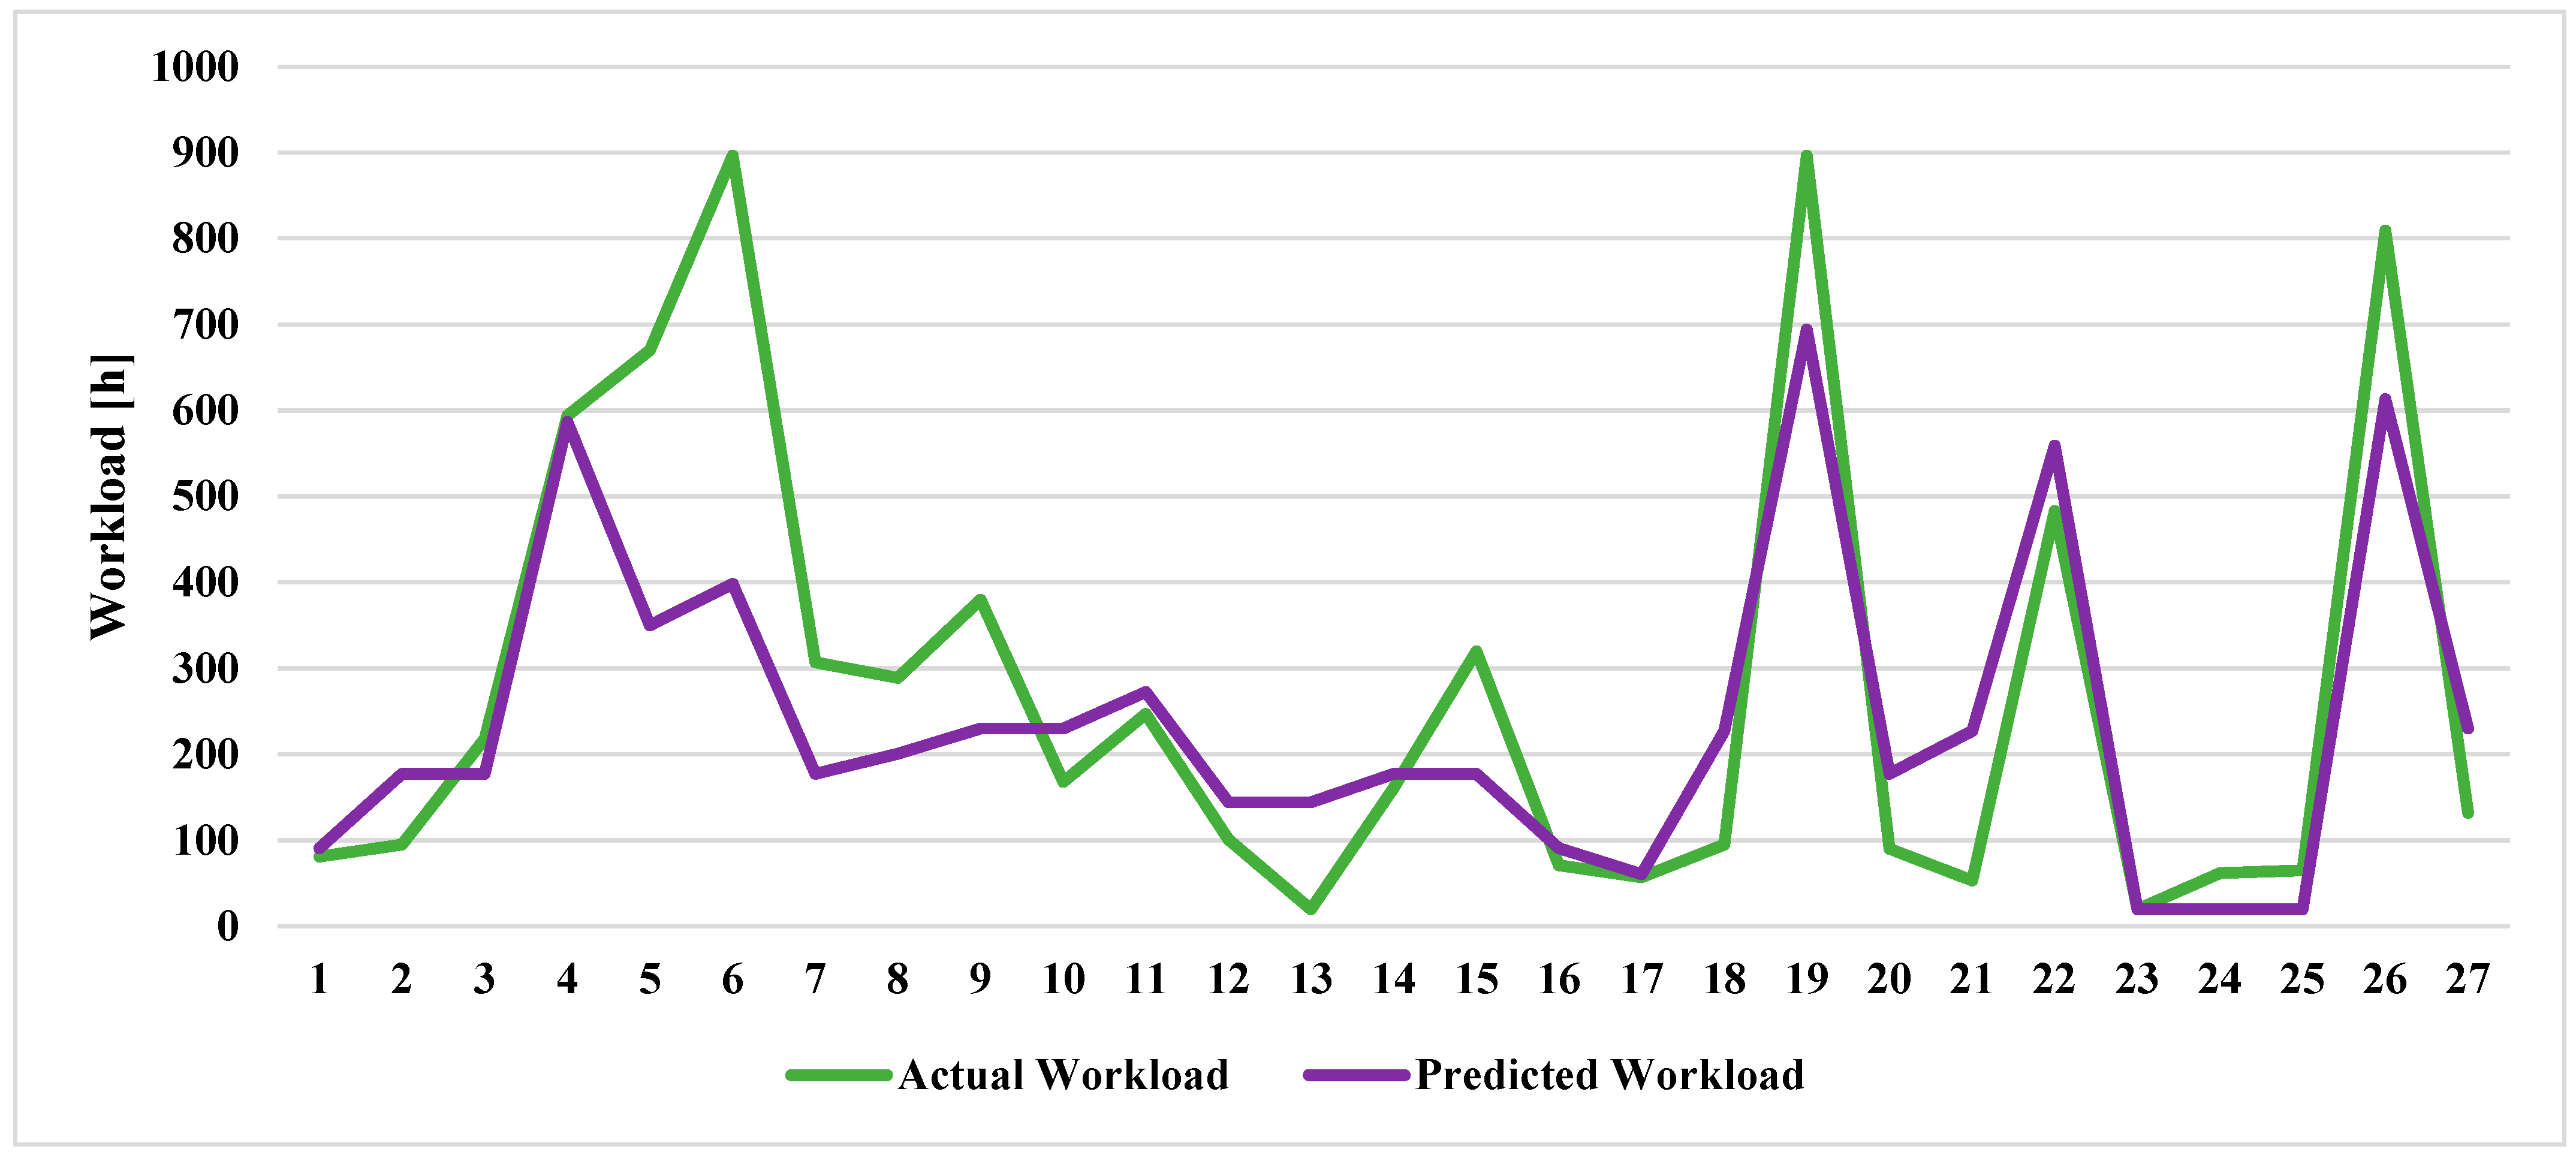
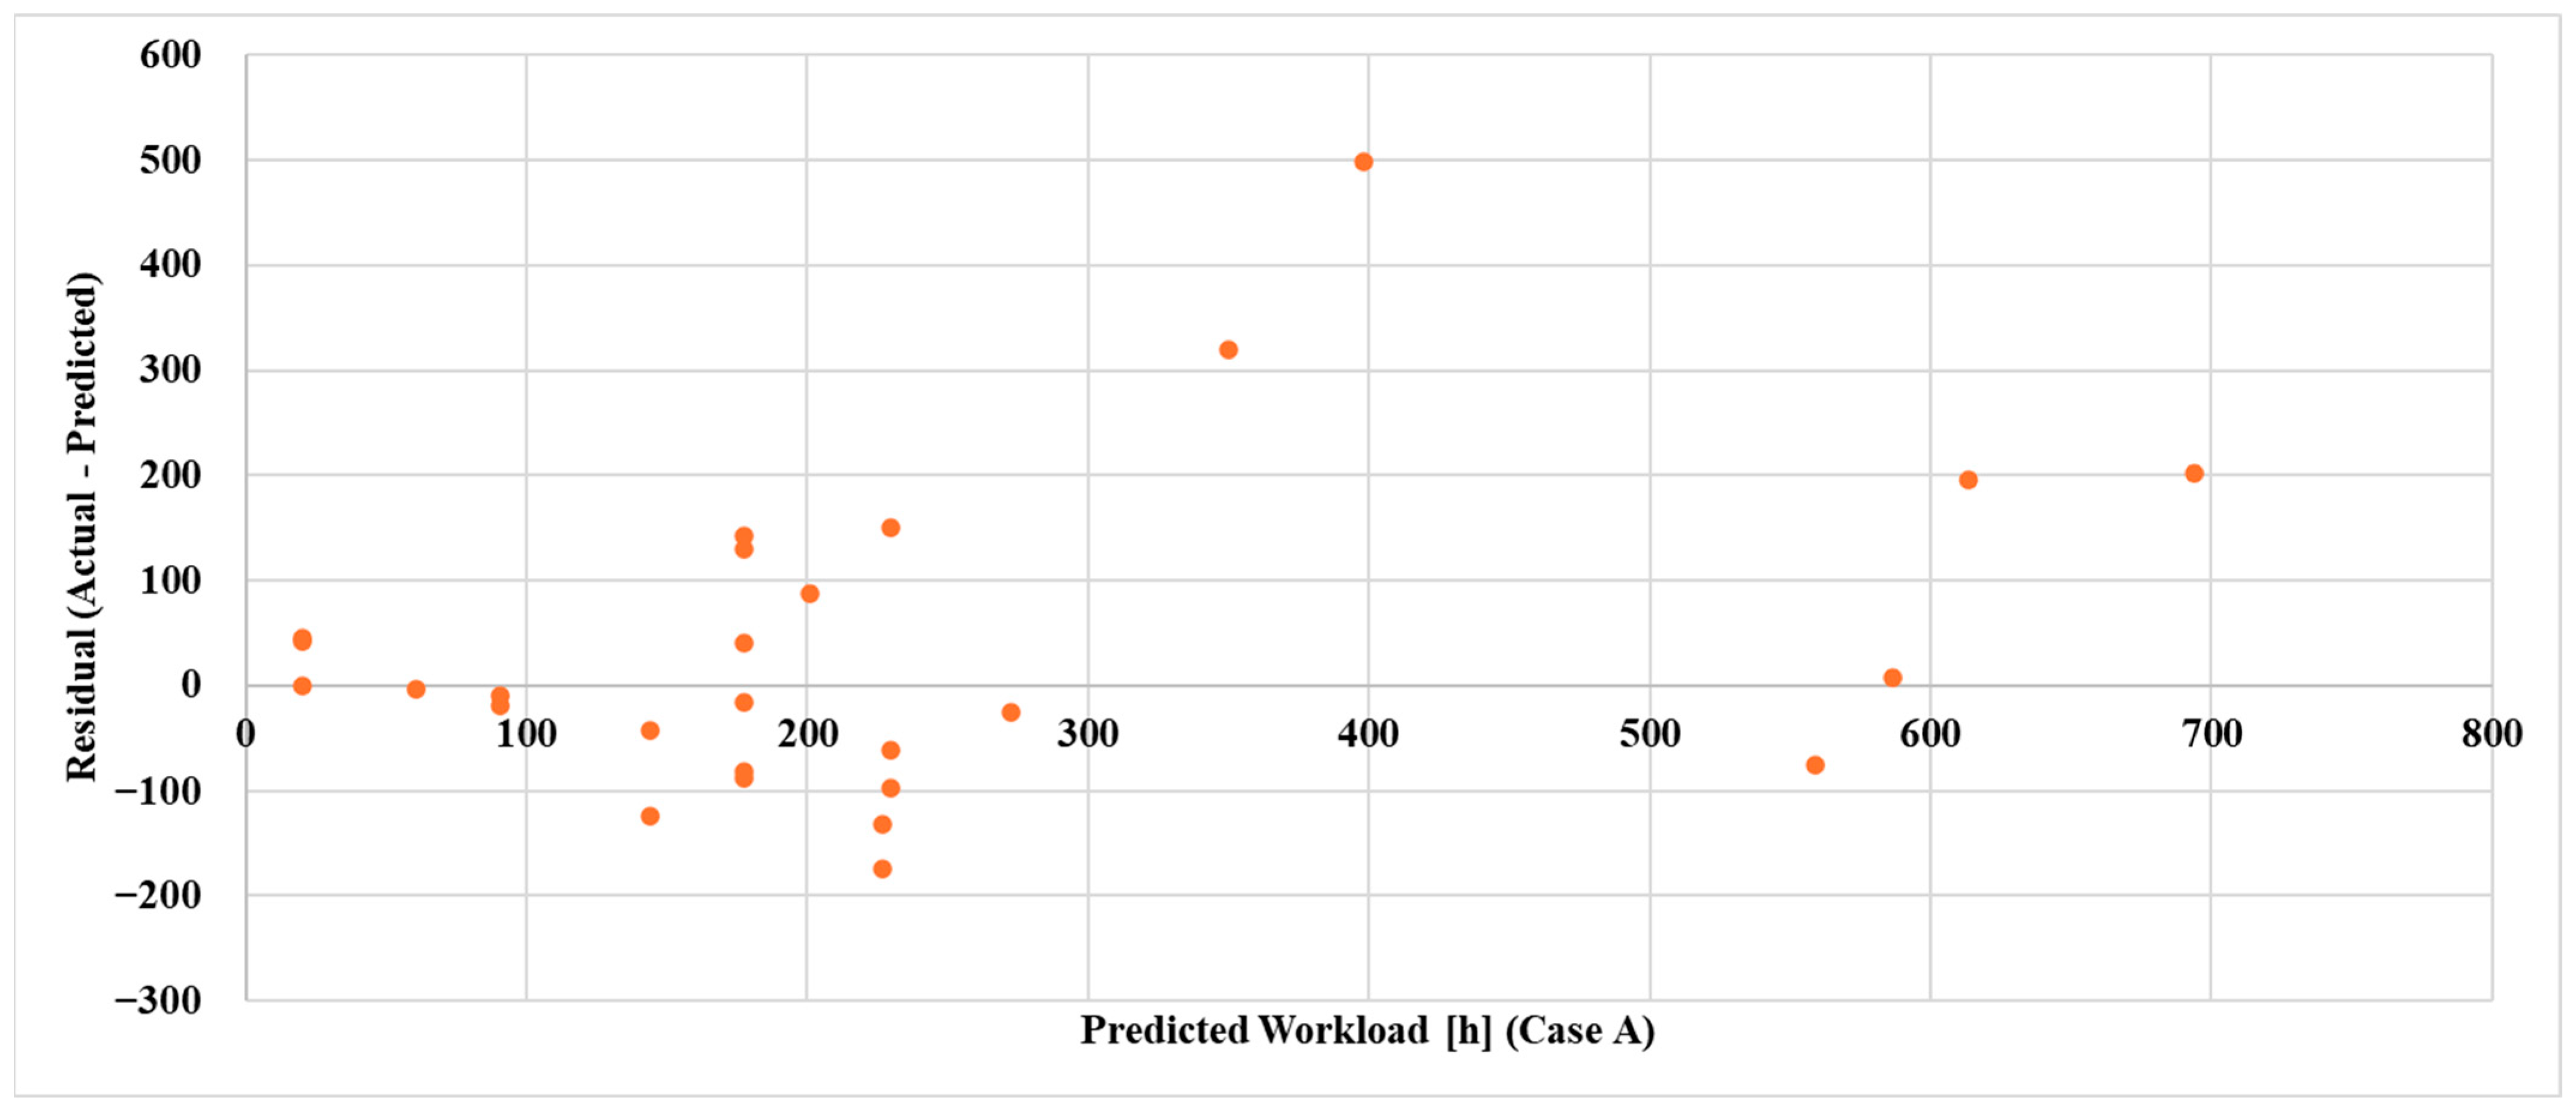
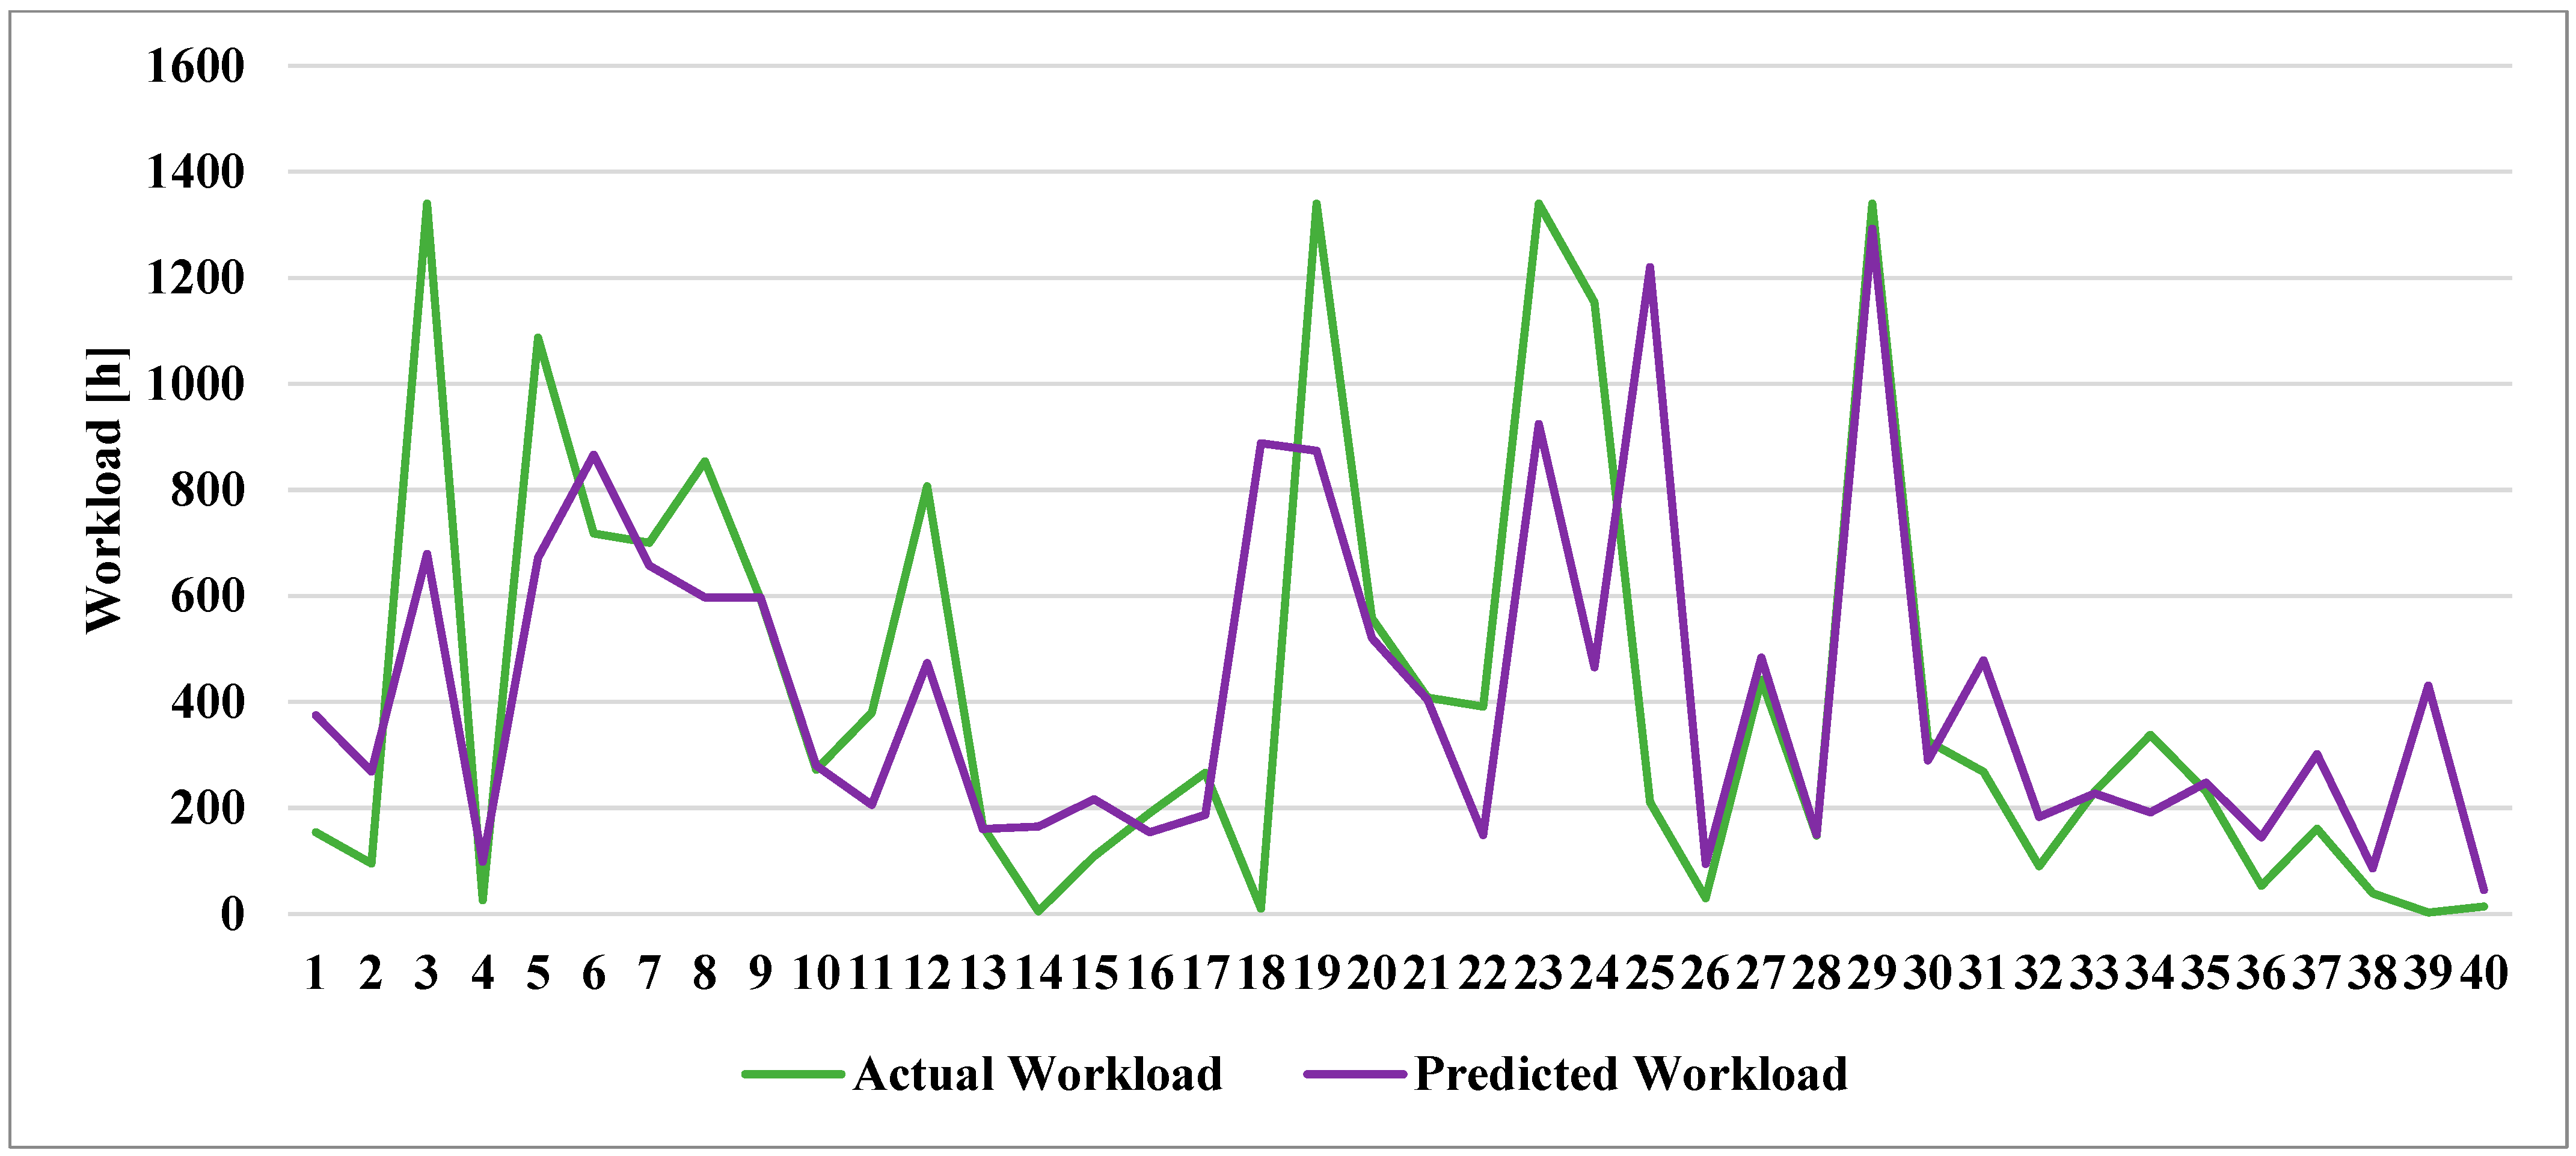
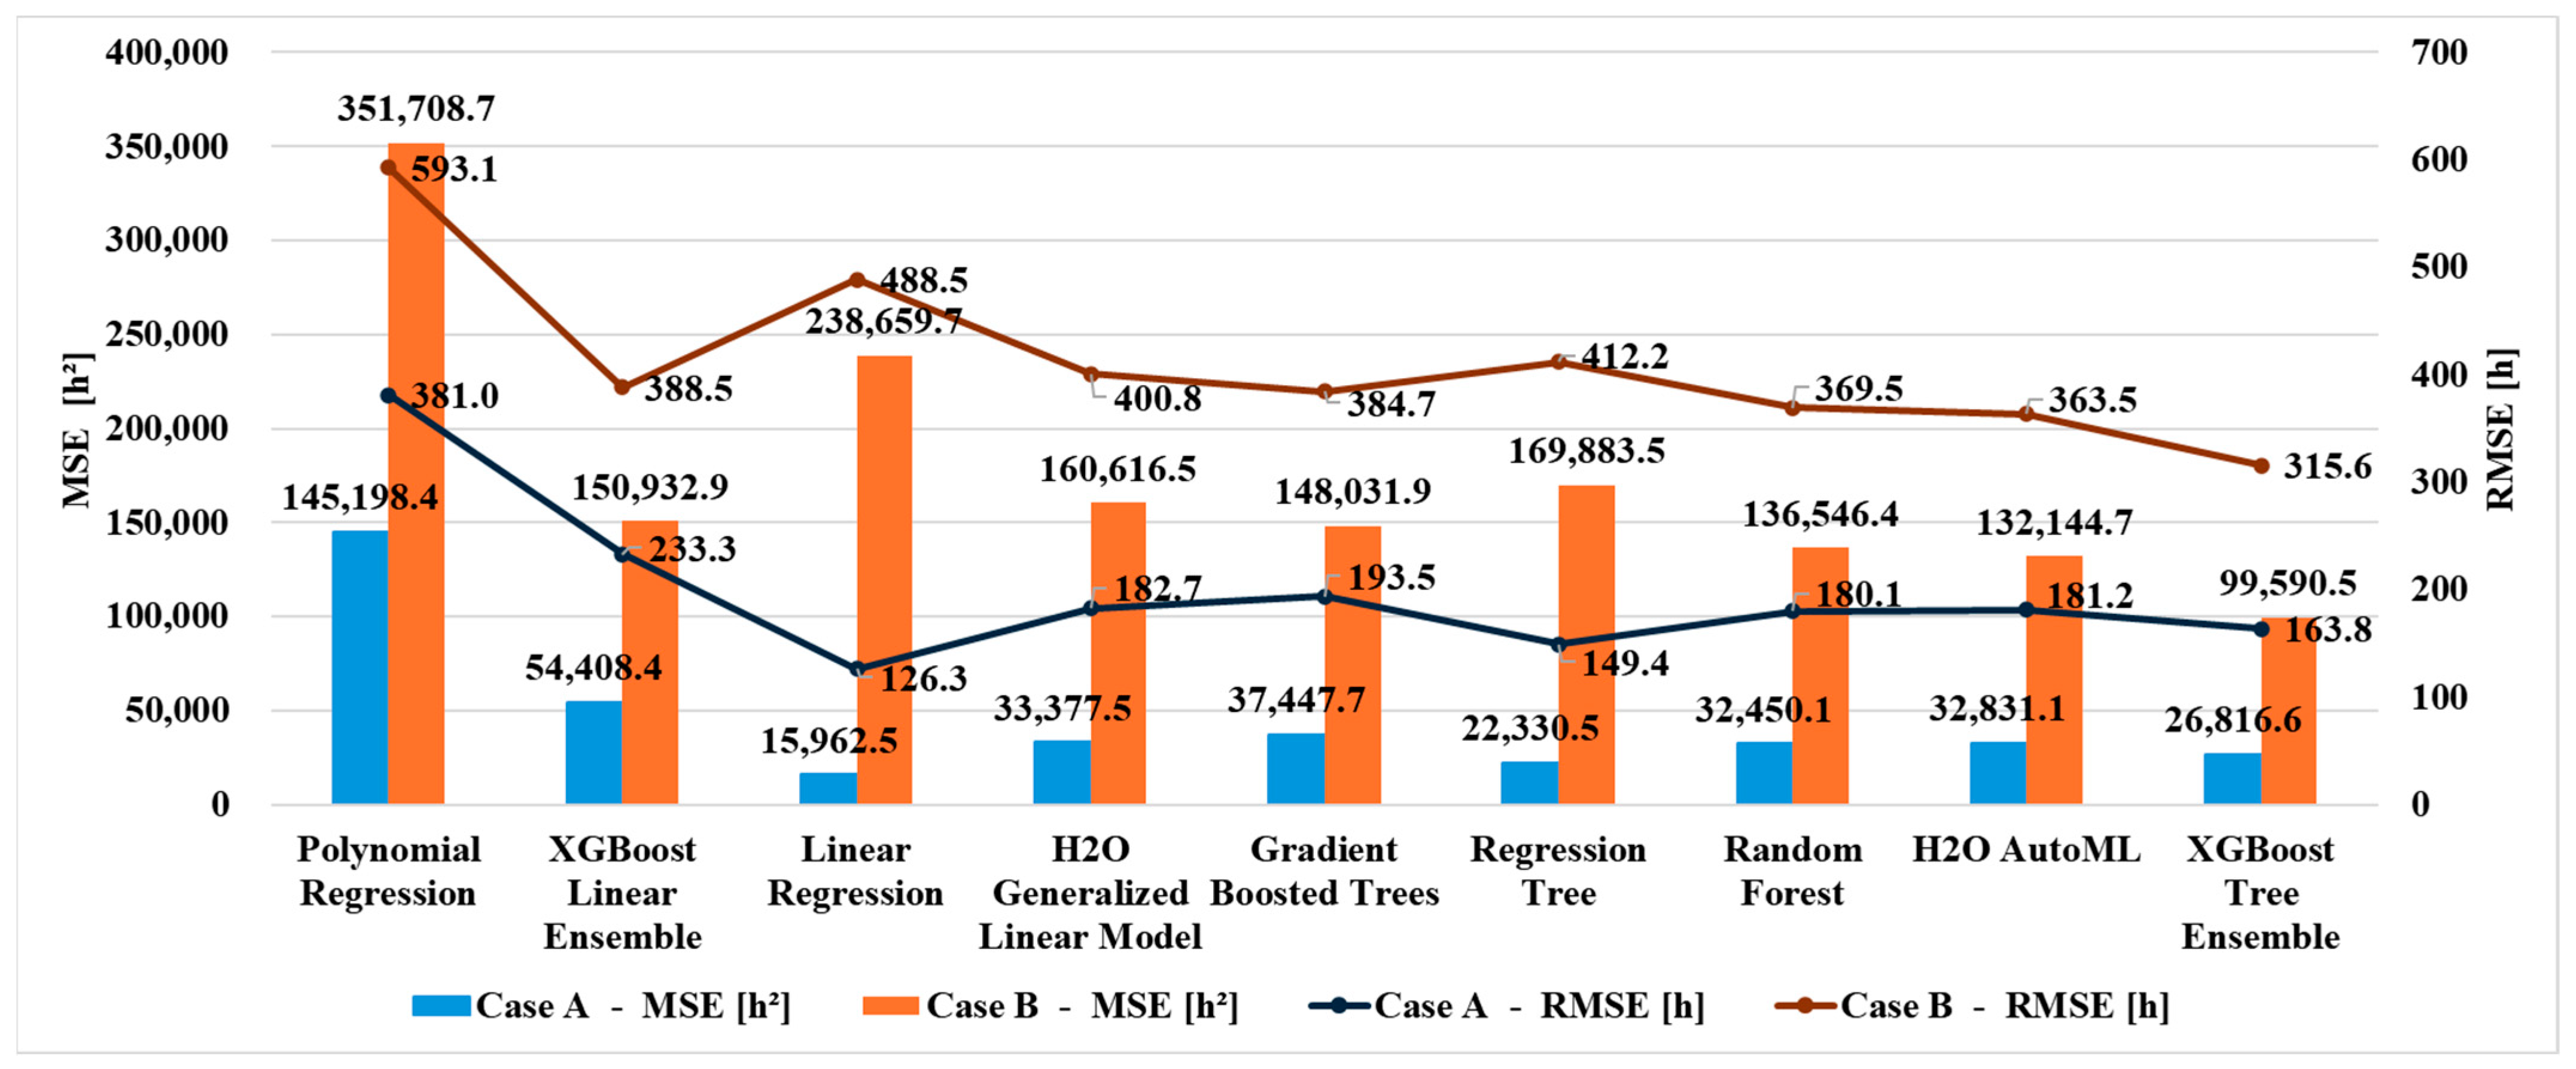
Due to the limited availability of data, it was not possible to develop models tailored to each specific product. However, when comparing the results obtained in the two cases (
Figure 7,
Figure 8 and
Figure 9), it is important to highlight that restricting the dataset to a specific product type (Case A) leads to significantly greater predictive accuracy. This trend holds consistently across all applied models. In fact, in Case A, all performance metrics are markedly better for every indicator, regardless of the model used.
In addition, comparing the best models obtained for both cases, the Regression Tree model (Case A) outperformed the XGBoost Tree Ensemble (Case B), achieving reductions models in MAE, MSE, and RMSE of 48%, 77%, and 52%, respectively, along with a 75% increase in R2.
Moreover, in assessing the workload associated with individual tasks, no consideration was given to the specific resources’ centres to which these tasks are assigned or their respective pre-existing workloads. This decision was made because, at the planning stage, the workload is intrinsically linked to the characteristics of the product. However, during the scheduling phase, it should vary according to the resources allocated to each task.
The AutoML approach demonstrated superior performance compared to both simple average and manual prediction. This method proved to be an effective and efficient way to predict the workload for order tasks accurately. Leveraging automation not only enhances prediction accuracy but also reduces the time and effort typically required for manual estimation, making it a valuable tool for improving planning processes.
A better estimation for single orders’ tasks allows for improved planning, leading to more efficient resource allocation and enhanced production planning. One of the most significant benefits of this application is the ability to utilise the predicted workload, based on product features, during the offer phase. This enables the sales department to establish a more accurate offer, aligning costs more closely with actual production requirements and reducing the risk of budget deviations. Furthermore, a precise workload estimation supports the planning function by providing a more reliable basis for defining the work centre schedules. This contributes to optimised resource utilisation, improved on-time delivery rates, and a more agile response to market demands.
In traditional methods generally used by SMEs, workload predictions are often made using simple averages or estimations based on limited data, leading to imprecise or overly optimistic forecasts. In contrast, the “smart” approach proposed in this article uses data analytics, historical data, and machine learning to create more reliable and refined projections. The case study application described allowed us to predict a better workload for order tasks in both cases of single or multiple product modelling. The proposed AutoML-based approach minimises the guesswork that usually accompanies manual predictions. This not only results in a better understanding of the order’s needs but also allows for more efficient management of time. This approach can adapt to new data and changing conditions, improving prediction accuracy. By doing so, it offers a level of accuracy and reliability that traditional methods cannot match. Regarding the specific case study, the sales engineering evaluation of costs did not include an accurately predicted workload in the offer. The budgeting was carried out without taking an accurate predicted workload (from a planning point of view) into account in the offer, leading to significant discrepancies between actual costs and expectations. Costs can be evaluated with a clear understanding of the predicted workload, leading to more accurate and reliable pricing and expectations for both the company and the customer. The more the dataset is restricted to a specific product type, the more it is possible to obtain accurate predictions. It should be possible to think in the future about integrating different ML models for the same output, according to the product.
The AutoML approach demonstrated superior performance compared to both simple average and manual prediction. These predictions are based on the workload assigned to the resources identified, ensuring a more reliable allocation of resources and improved planning. By leveraging automation, AutoML not only enhances prediction accuracy but also reduces the time and effort typically required for manual estimation, making it a valuable tool for optimising resource management and task scheduling. It is also worth noting that this application relies on data collected using Microsoft Excel and Microsoft Access (both from Microsoft Office 2021) and processed with KNIME Analytics Software (version 5.3), which is open-source software for smart applications. Regardless of the data collection that can be managed in multiple ways, the smart application can be implemented and managed internally without a significant initial investment.
Accurate data collection on the shop floor is crucial for optimising processes and making informed decisions. Nevertheless, measuring processing LTs and collecting data pose significant challenges that need to be addressed to improve data quality. Many systems, above all in SMEs, still rely on manual entry, which leads to errors and inconsistencies, and hinders real-time insights. In SMEs, generally, user-friendly dashboards allow managers and operators to track workload in real time, enhancing transparency and quick responses. When off-the-shelf solutions are not sufficient, customised tools can be developed to address specific production needs.
Manual solutions remain common in SMEs, but other technological solutions are available, although they may be challenging to implement in SMEs due to their complexity, low adaptability, and high cost. For example, existing Internet of Things (IoT) solutions, such as RFID tags and real-time location systems [
36,
37,
38], enable automated and accurate LT tracking, improving data reliability. SMEs can gradually adopt IoT-based solutions for data acquisition to enhance their production planning and control processes [
39]. Although technological solutions exist, the main challenge today is to make this system adaptable and easily exploitable for SMEs [
40]. By investing in IoT and integrated systems, organisations can achieve accurate insights that enhance efficiency and competitiveness. Implementing effective shop floor control and data collection systems in manufacturing SMEs can lead to better decision-making and improvement in manufacturing operations, but it is still an open challenge today due to the context of SMEs. Not all SMEs have the same needs or difficulties. The monitoring of order LT and data collection strictly depends on the available technological resources. In this specific case study application, data have been collected manually through an integrated platform that allows them to associate the order task workload realised and the distribution over time. This straightforward solution provides the essential data needed for task workload prediction. However, it is interesting to note that it has not been possible to collect much data on completed orders in the last few years.
This preliminary application serves only to define a data-driven approach that can help the decision maker but not force them into choices not due to their experience. In the future, downstream of new data collection, the already developed model should be reused, and the overall performance should be re-verified. In practice, the more the system tends to collect data, the more the estimates can improve. Combining AI/ML with the actions of the decision maker can ensure a more efficient planning system that can “augment” but not completely replace human decisions. This type of approach is more and more valid for small realities, where the decision maker often plays more than one role and needs to control flows and not be subjected to decisions. In the literature, performance indicators are often associated with model reliability, even though this association is not entirely accurate.
A critical factor in evaluating an ML algorithm’s quality is measuring its accuracy. However, while traditional metrics like MSE and RMSE assess overall model performance, they fail to capture localised insights into the expected error for prediction error for individual data points, especially when those points were not seen during training [
41]. MSE and RMSE are useful for evaluating overall performance in low-risk scenarios. However, in high-risk contexts such as medical diagnostics or manufacturing, relying exclusively on these metrics can result in unsafe predictions, which could have critical consequences. General performance measures do not guarantee the predictions’ safety or accuracy for individual inputs, which could lead to severe consequences [
42,
43]. In practice, a prediction model may produce some reliable predictions while others are less so. Average accuracy alone does not offer insight into the reliability of individual predictions. The reliability of a model should be defined as the uncertainty of its predictions in a clear and meaningful probabilistic manner to help assess the confidence of individual predictions [
44]. In classification ML tasks, reliability can be defined as the probability that the predicted class is equal to the actual one [
45,
46]. Regarding the reliability of regression models, i.e., the degree of trust that the prediction is correct, it is still poorly addressed in the literature [
42,
46]. Evaluating the performance of machine learning models solely with metrics such as MAE, MSE, and RMSE is inadequate. Particularly in environments like manufacturing, there is an increasing need to assess the reliability of predictions. For regression algorithms, this issue remains challenging due to the complexity of this task. In the future, an extension of the current application could incorporate reliability indicators for each prediction model, considering these when selecting the optimal model. At present, the criterion for the choice of the best model relies solely on MAE, which only measures the absolute error concerning the test set.
5. Conclusions
This study presents a practical and accessible ML-based approach for task workload prediction, delivering significantly improved accuracy over traditional average or manual estimation methods. It illustrates a smart, data-driven approach to managing order tasks in a real case study application that uses data collected and not simulated. For single-product modelling, the Regression Tree significantly outperformed both the simple average and manual prediction, achieving a reduction of 31% and 47% in MAE, respectively. When incorporating all available product data (multi-product case), despite a slight performance decrease in MAE, which is higher than the previous case, the XGBoost Tree Ensemble, as one of the ML models tested, still achieved better performance compared to the simple average and manual prediction (reduction of 32% and 42% in MAE, respectively). In both cases, ML models outperformed the traditional approaches.
Generally, predictions are often made using simple averages or estimations based on limited data, leading to imprecise or overly optimistic forecasts. In contrast, the “smart” approach uses data analytics, historical data, and advanced planning techniques to create more reliable and refined projections. For instance, by factoring in the specific capabilities and workloads of operators, as well as the integration of various departments, this approach minimises the guesswork that usually accompanies manual predictions. This not only results in a better understanding of the project’s needs but also allows for more efficient allocation of resources, better management of time, and the achievement of higher quality outcomes within the expected time frame. The advantage of this approach lies in its ability to adapt and refine predictions in real time based on new data and evolving project conditions. It offers a level of accuracy and reliability that traditional methods cannot match, ultimately leading to better project outcomes, reduced risks, and more successful project deliveries.
5.1. Limitations
One of the main limitations of this study lies in the limited size of the dataset used to train and evaluate the machine learning models, a consequence of the limited data available from the company. A restricted sample size can affect the generalisability and robustness of the results [
47,
48], increasing the risk of overfitting and diminishing the reliability of performance metrics when applied to unseen new data.
In the current work, model validation was conducted using a basic train/test split. Although this is a common practice, it may not fully capture the variability inherent in the data, nor does it provide a comprehensive evaluation of model performance across different data subsets. To mitigate this limitation and enhance the reliability of the findings, future studies should consider employing more rigorous validation techniques, such as k-fold cross-validation. This method involves dividing the dataset into k subsets (or “folds”) and iteratively training the model on some folds while testing it on the remaining ones [
49]. Such an approach enables the model to be assessed across multiple data partitions, thereby offering a more robust estimate of its generalisation ability and reducing potential biases introduced by a single train/test split.
Furthermore, efforts should be directed towards increasing the dataset size, either by collecting additional real-world data or by implementing data augmentation techniques to artificially expand the dataset where appropriate [
50,
51]. A larger and more diverse dataset would not only facilitate better model training but also improve the statistical power of the evaluation, leading to more credible and generalisable conclusions. While the current findings offer valuable insights, they must be interpreted with caution, given the constraints imposed by the limited dataset size and the validation strategy employed. Addressing these limitations in future research will be critical for the development of more robust and generalisable machine learning models. Another limitation concerns the features included in the models. Expanding the variables considered could help enhance the overall performance of the model, making it more accurate and effective in processing data and achieving more accurate results. Despite the complexity of collecting such data, ML-based approaches could offer significant benefits to integrating and correlating all these characteristics.
5.2. Future Research Steps
Moving forward, the goal should be to evaluate a combination of accuracy and reliability indicators, once suitable strategies are defined for assessment, to select the best model for a given prediction task. In addition, the characteristics of machines and operators (those responsible for executing tasks on the ground) play a significant role in determining the overall workload for tasks in the scheduling phase, which was not analysed in this application. The specific skills, experience, and capacity of the operators can directly affect the efficiency and speed with which tasks are completed. For example, operators with advanced technical skills and experience are likely to execute their tasks more quickly and with fewer errors, reducing the overall workload and project duration. Conversely, operators with less experience or insufficient skills may need more time for training, supervision, and error correction. This can prolong the project’s timeline and increase the workload for other team members. In addition to skill levels, other factors, such as the number of operators for each task and their work schedules, can impact project timelines. A well-balanced team, where operators are assigned tasks that align with their strengths, can work more efficiently and meet deadlines more consistently. Moreover, understanding these characteristics and considering them when planning can lead to more accurate project estimations, better workload distribution, and improved overall project performance. Although there are complexities in this kind of data collection, it could be extremely beneficial to use ML-based approaches to integrate and correlate all these characteristics.
In the coming years, increasing attention will need to be given to the role of the workforce within production systems, along with the broader social aspects that influence planning activities. This is particularly true for SMEs, where the workforce plays a central role and where success often depends on the knowledge, expertise, and experience of the workforce. For this reason, planning should go beyond technical resources and consider individual skills and current working conditions for improving planning tasks such as workload prediction, aligning with Industry 5.0 principles by supporting human-centric planning. From this perspective, it becomes essential to shift toward a model that places the human being at the core of innovation and industrial design. Unlike Industry 4.0, which has primarily focused on automation and digital technologies, Industry 5.0 introduces a more human-centric philosophy, promoting collaboration between people and smart systems, and social sustainability alongside technological progress [
52]. By integrating workforce characteristics into workload forecasting and planning processes, companies can build more adaptive, inclusive, and resilient workplaces. This approach not only will enhance productivity but also support the needs and the state of workers, reaffirming their fundamental role in the future of industry.
