1. Introduction
In industrial manufacturing, ensuring the quality of components through visual inspection is critical to maintaining process efficiency and product reliability. Machine vision technologies, particularly structured light systems (SLSs), are increasingly adopted for non-contact, high-resolution 3D inspection due to their speed and flexibility compared to traditional methods such as coordinate measuring machines (CMMs) [
1,
2,
3,
4].
SLS technologies operate by projecting structured light patterns onto surfaces and capturing their deformation through a calibrated camera system, enabling the reconstruction of the 3D geometry of target objects. One of the key advantages of SLSs lies in their active sensing mechanism, which makes them inherently less sensitive to surface texture and ambient illumination. By projecting known patterns onto the object, SLSs can effectively capture the geometry of complex parts and materials with challenging optical properties, such as reflective or specular surfaces. This capability makes them particularly suitable for industrial inspection applications in sectors such as automotive, aerospace, and tooling, which often involve demanding surface finishes and tight dimensional tolerances.
However, despite these strengths, ensuring reliable and accurate performance in real-world production environments remains challenging. Environmental variability, including fluctuations in ambient lighting, the presence of dust or oil residues, and temperature-induced mechanical instability, can compromise the visibility and fidelity of projected patterns. Similarly, surface reflectivity and curvature, particularly in polished metallic components, can distort or scatter the projected light, leading to incomplete or noisy point cloud reconstructions. These factors directly impact the inspection process by increasing acquisition times, generating false positives or missed defects, and complicating the detection of deviations from dimensional tolerances [
5,
6].
In high-throughput automotive manufacturing pipelines, these limitations translate into tangible operational risks: increased defective rates due to unreliable quality assessment, extended inspection times incompatible with cycle constraints, and higher manual intervention requirements that reduce scalability. These critical issues highlight the urgent need for practical, reproducible methodologies to evaluate and configure SLSs under real operating conditions. Recent reviews [
7,
8] have acknowledged the growing adoption of structured light and laser-based 3D scanning in industrial workflows, yet they emphasize that robust performance across variable environments and materials remains a bottleneck for broader deployment.
While numerous studies have proposed calibration techniques, point cloud quality metrics, and defect detection algorithms [
9,
10,
11,
12,
13], comprehensive and accessible methodologies to support system designers in evaluating and configuring SLSs solutions for specific manufacturing contexts remain limited. Most of the existing approaches are tailored to laboratory-grade conditions, assuming controlled lighting, stable thermal environments, and high-precision reference equipment, that are not representative of real-world production settings. These assumptions, although effective for benchmarking, reduce the applicability and scalability of such methods in mass-production environments where variability and cost constraints are significant factors. In particular, there is a lack of integrated frameworks that simultaneously account for optical configuration, environmental conditions, calibration constraints, and image enhancement strategies, all evaluated in relation to achievable performance and industrial feasibility.
This paper addresses this gap by proposing a practical and modular methodology to guide the characterization of SLSs based on dimensional accuracy and point cloud quality.
The methodology is organized into four key stages: calibration, acquisition, processing, and analysis. It incorporates reference-based measurements and metric-driven evaluations to support system integration decisions in industrial pipelines.
A case study is presented in which the methodology is applied to the inspection of automotive metal sheet components, a representative scenario characterized by reflective surfaces and tight dimensional tolerances. The study also includes a comparative assessment of different image-enhancement algorithms designed to mitigate specular reflections, demonstrating how configuration choices influence the quality and reliability of 3D reconstructions.
Overall, this work contributes to the advancement of digital inspection technologies by delivering a replicable and application-oriented framework. It supports system designers, process engineers, and quality control professionals in selecting, tuning, and validating structured light vision systems based on quantifiable performance outcomes and real-world constraints.
2. Related Works
The accuracy characterization of 3D optical systems has been extensively investigated through diverse approaches, particularly in the domain of SLSs. Prior studies have analyzed various aspects of the reconstruction pipeline, including calibration procedures, geometrical configurations, point cloud quality metrics, and the influence of environmental and surface conditions.
In particular, calibration-centric methods mainly focus on optimizing the interior and exterior orientation parameters of the camera–projector setup [
13,
14,
15,
16,
17,
18,
19]. For instance, in [
15,
16,
17], the authors explore simplified calibration workflows and investigate how calibration accuracy affects system performance. A common benchmark across these studies is the VDI/VDE 2634 Part 2 guideline [
20], which has become a de facto standard for validating the metrological performance of optical 3D measurement systems. It is widely adopted to compare calibration procedures and assess point cloud accuracy using certified reference objects. However, such methods often rely on idealized conditions and precision-engineered calibration targets (e.g., high-end checkerboards or laser-aligned planes), which may be impractical in cost-sensitive or constrained industrial settings. Even reference guidelines like VDI/VDE 2634 Part 2, while broadly recognized, implicitly assume access to high-accuracy metrological equipment and stable laboratory conditions. This limits their applicability in early-stage system deployment or on-site recalibration, or integration in dynamic production environments [
1,
8].
The geometric arrangement of the optical layout plays a critical role in determining measurement accuracy. Schild et al. [
21] examined how triangulation angles and baseline lengths affect measurement uncertainty, showing that no single configuration fits all use cases. Eiríksson et al. [
22] further demonstrated that focal length and stereo angle must be optimized relative to scene depth and working distance. While these studies provide useful insights, they generally lack application-specific design strategies that account for space constraints, mounting restrictions, or part variability typically encountered in industrial settings such as automotive manufacturing lines [
23,
24].
Point cloud quality metrics have been proposed to evaluate the output of SLSs [
25]. Dimitrov and Golparvar-Fard [
26] introduced metrics to assess segmentation performance and modeling fidelity in architectural reconstructions. Building upon this work, Song et al. [
27] introduced density-based and roughness-based metrics to further characterize the completeness and uniformity of reconstructed surfaces. Such evaluations are essential for systematically comparing alternative system configurations and for assessing the effectiveness of different enhancement algorithms. However, these works often lack standardization, making it difficult to compare results across platforms or replicate findings in different contexts. Moreover, some quality assessment approaches are tailored for architectural or heritage applications, offering limited generalizability to mass-production inspection scenarios.
A further critical factor affecting SLS performance is the handling of reflective and specular surfaces, which are common in industrial components [
28]. To address this challenge, several studies have proposed mitigation strategies involving preprocessing and adaptive lighting techniques. For instance, Wu et al. [
29] introduced an Exposure Fusion approach to overcome limitations associated with overexposed regions, while authors in [
28,
30] developed High Dynamic Range (HDR) imaging techniques that fuse multiple exposures to recover lost details. While effective, these methods often require multiple image acquisitions or specialized hardware, adding latency and complexity to the acquisition pipeline. Other approaches such as adaptive lighting control [
31] or polarimetric filtering [
32] introduce further cost or integration challenges, especially for low-cost or embedded systems.
Noise suppression and image enhancement algorithms have also been proposed to improve reconstruction robustness under difficult optical conditions. However, these algorithms are often evaluated independently from the overall system geometry and calibration fidelity. This compartmentalization limits their impact on comprehensive SLS optimization [
33].
Despite the breadth of existing literature, current research typically concentrates on isolated subsystems or individual evaluation phases. Few approaches offer a complete and integrated pipeline that spans from optical design and calibration to point cloud generation and quality analysis. Moreover, many existing methodologies rely on complex experimental setups or metrology-grade equipment (e.g., coordinate measuring machines, laser trackers), which are often impractical for early-stage integration studies in real production environments where cost, time, and operational constraints must be considered.
Although some recent works have begun integrating performance metrics into more comprehensive evaluation frameworks, they often overlook the combined influence of multiple factors, including system geometry, scene illumination, image preprocessing strategies, and reconstruction algorithms. Additionally, while deep learning techniques have gained increasing attention for defect detection and classification tasks [
34], their performance evaluation is often decoupled from the underlying physical accuracy of the reconstructed 3D geometry, limiting their applicability in metrology-driven or quality-sensitive contexts.
The methodology proposed in this study addresses these limitations by introducing a practical, metric-based workflow that integrates optical configuration, calibration, acquisition, preprocessing, and quantitative evaluation stages. Designed to be compatible with cost-effective hardware and open-source tools, it supports both scalability and deployment in real production settings.
Table 1 provides a comparative summary of our methodology against conventional approaches, highlighting improvements in replicability, industrial adaptability, hardware requirements, and software openness. Each advantage is explicitly linked to corresponding design choices that support standardized and repeatable deployment in constrained manufacturing scenarios
3. Materials and Methods
This section describes the proposed methodology for evaluating SLSs, aiming to support their integration into industrial inspection workflows. The approach focuses on assessing both dimensional accuracy and reconstruction completeness, using specific quantitative metrics extracted from the resulting 3D point cloud.
Unlike other approaches that begin with the desired accuracy as a design driver [
22,
35], the proposed methodology acknowledges the environmental and geometric constraints typical of industrial contexts. It prioritizes practical considerations such as robustness, cost-effectiveness, and ease of integration over purely theoretical performance optimization.
The methodology is designed for use by engineers, technicians, and researchers with basic knowledge of camera–projector systems and 3D data visualization. No advanced expertise in metrology or programming is required, although familiarity with 3D image acquisition tools is beneficial. Internal testing with novice users indicates that the entire workflow, comprising calibration, acquisition, and processing, can typically be mastered within 1–2 days of guided instruction. This short learning curve supports its rapid deployment in time-constrained industrial or research environments.
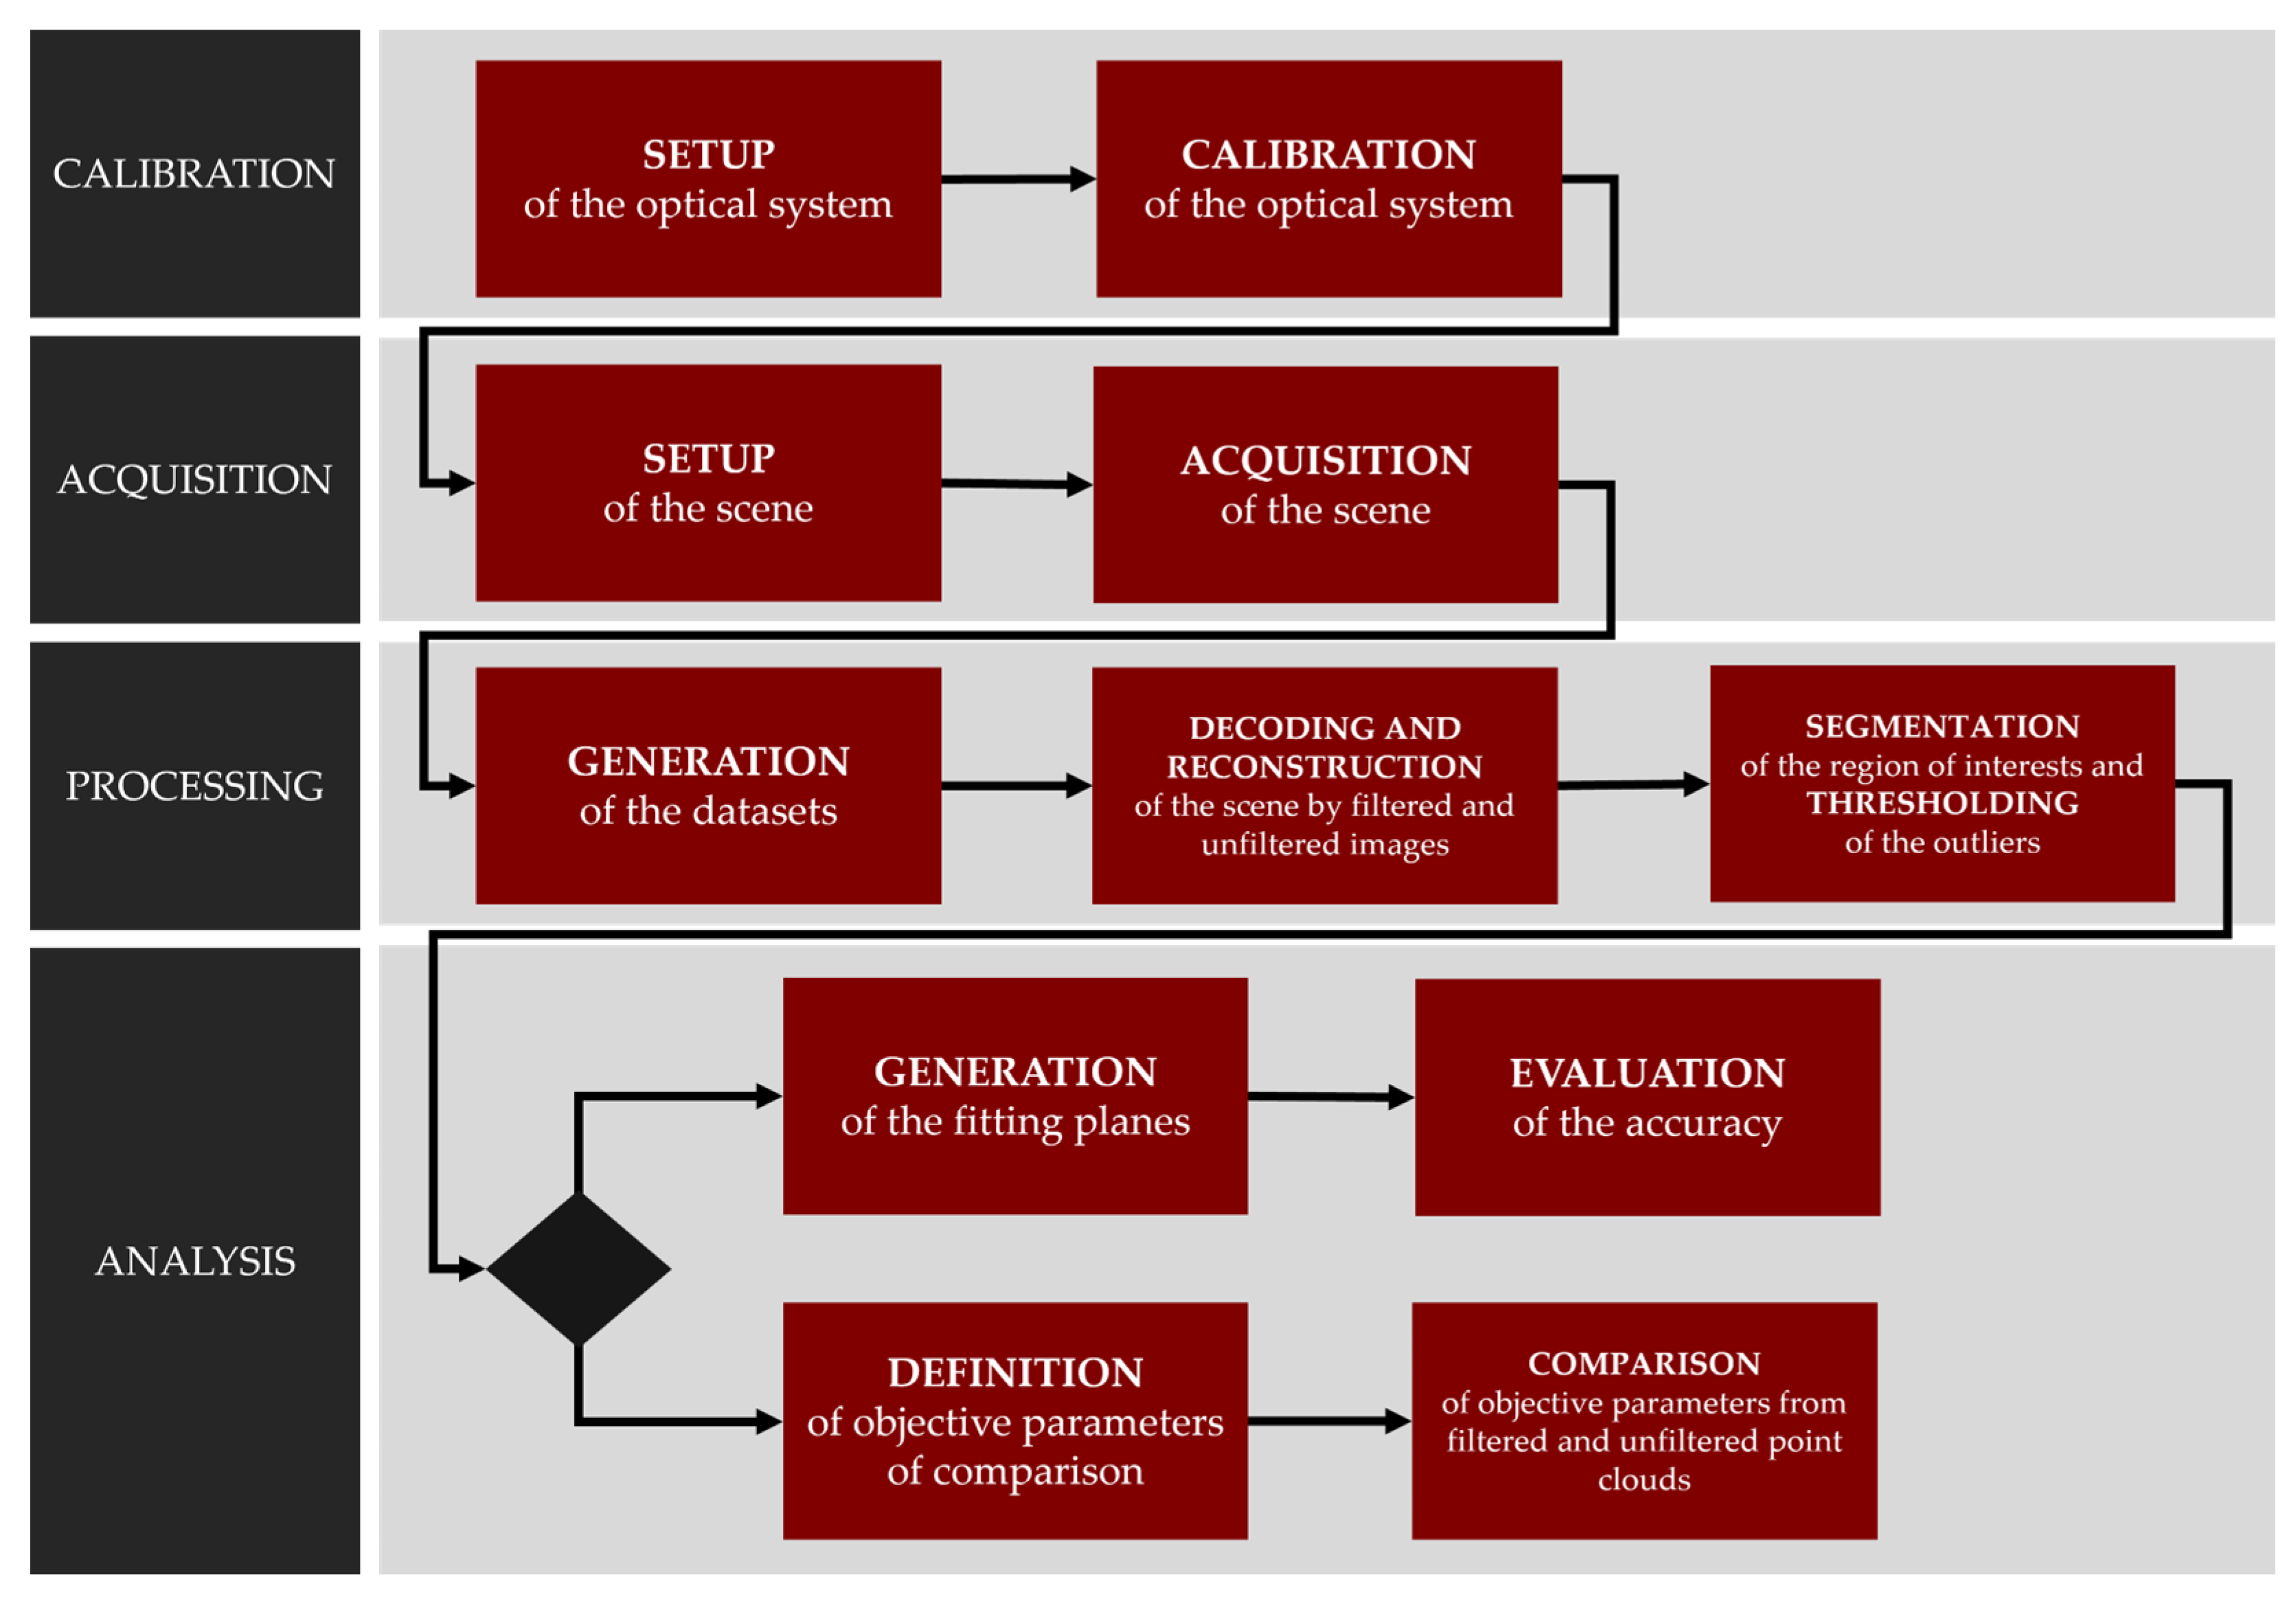
The methodology is structured into four main stages: calibration, acquisition, processing, and analysis. Before calibration, a critical setup phase is conducted to define the specific SLS configuration and the relevant working conditions. This preliminary phase ensures that the system is tested under realistic operational constraints and that the resulting performance metrics are both representative and repeatable.
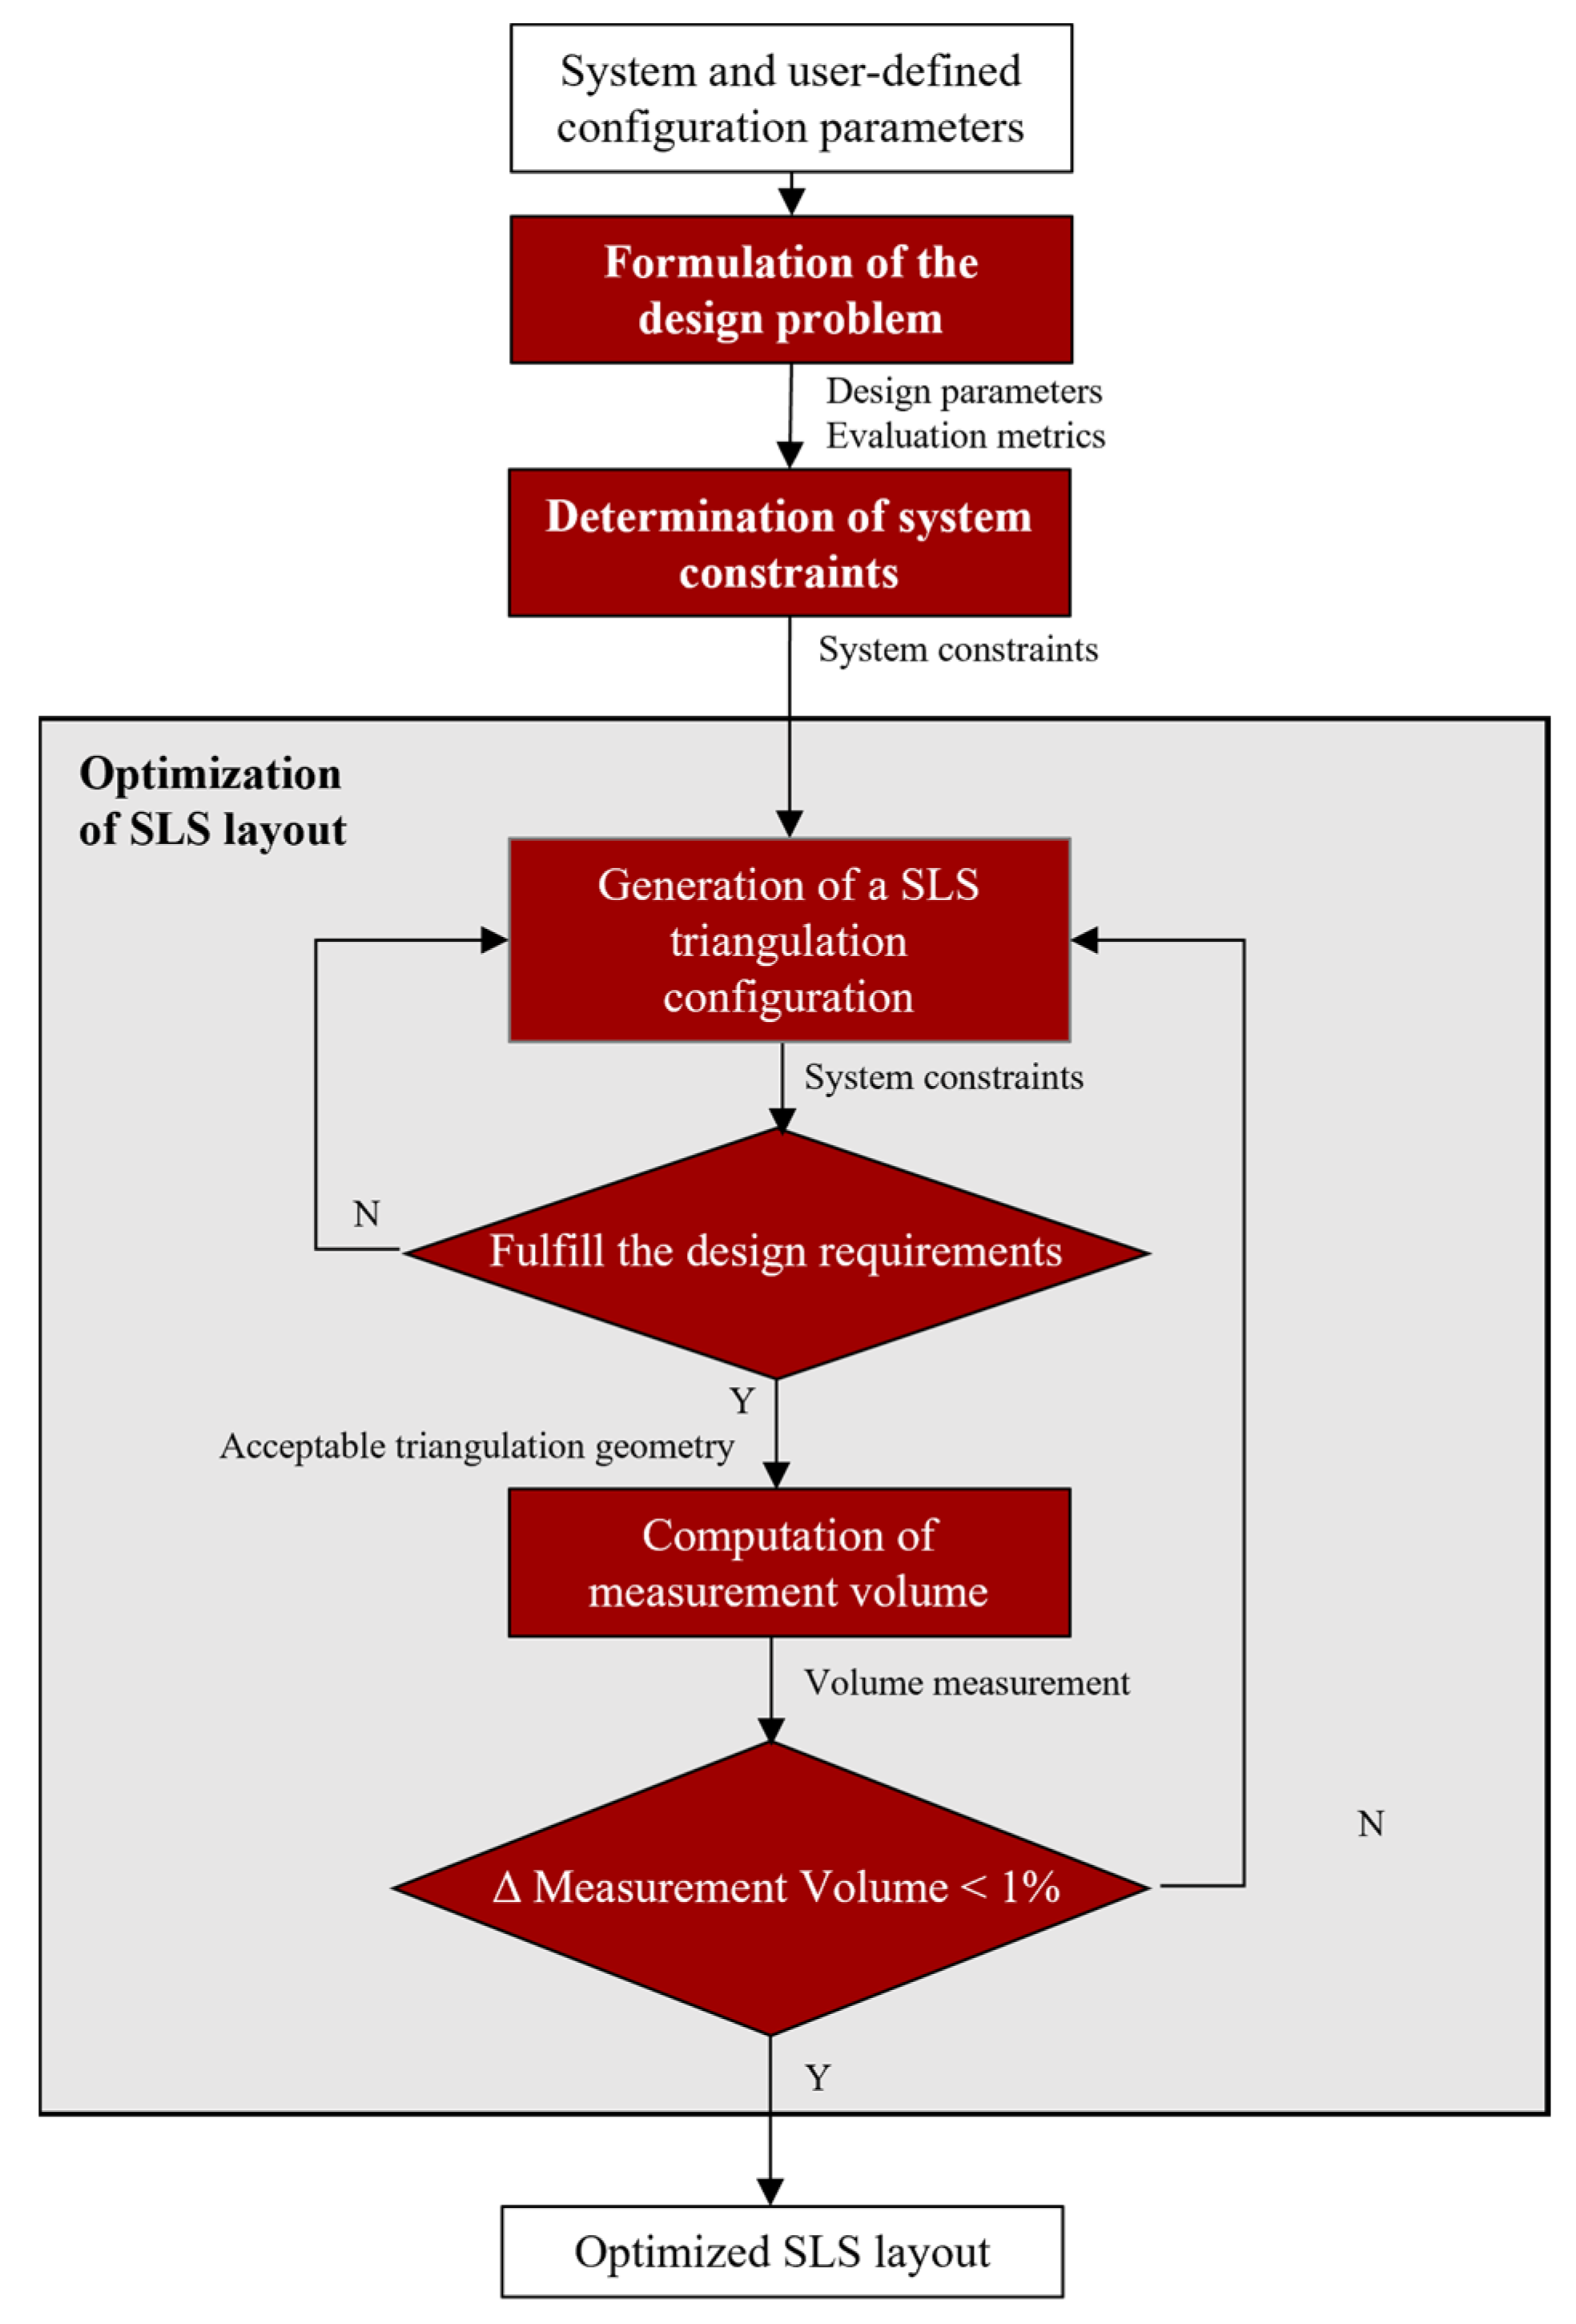
The first phase involves configuring SLSs by positioning the optical components (camera and projector) relative to the target, replicating the intended operational scenario. At this stage, all geometrical and optical parameters, including focal length, focus, zoom, depth of field (DOF), and field of view (FOV), must be fixed. The objective is to determine an optimal system configuration that maximizes the usable working volume while respecting physical space limitations.
Following the framework presented in [
36], the configuration process can be categorized into two main domains:
Digital acquisition parameters. Camera and projector resolution, dynamic range, and frame rate;
Optical specifications. Working distance, triangulation angle, and setup topology.
A reference decision diagram, adapted from [
36], is presented in
Figure 1 to illustrate the logical flow used for selecting hardware components and defining layout parameters.
Variations in baseline distance and focal length have a direct impact on triangulation precision; however, they may also lead to an increased spatial footprint or greater mounting complexity. As noted in [
21], no single optical configuration guarantees optimal performance across all object geometries. While longer focal lengths and larger baselines can improve measurement accuracy, they also increase the physical size of the system, which may be undesirable in space-constrained environments. Similarly, dual-projector setups can enhance pattern coverage and minimize occlusions, but they introduce additional calibration complexity and higher system cost [
37]. To balance performance with practicality, the proposed methodology adopts a minimal configuration based on a single camera and a single projector.
The lighting strategy also plays a crucial role, particularly when inspecting reflective or specular surfaces. Common lighting configurations include bright-field, dark-field, dome port, and coaxial forward lighting [
34]. In this study, coaxial forward lighting is employed due to its effectiveness in reducing glare and softening reflections, thereby improving image quality on metallic surfaces.
The encoding technique used in the projector significantly influences reconstruction accuracy. Among various methods, phase-shifting is recognized as one of the most accurate, achieving sub-pixel accuracy by projecting fringe patterns with incremental phase steps [
38,
39]. In contrast, binary patterns are simpler to implement but provide lower resolution. As demonstrated in [
40], the phase-depth sensitivity, defined as the gradient of phase change with respect to depth, is a key determinant of achievable accuracy. Maximum sensitivity is obtained when fringe patterns are orthogonal to the epipolar lines, ideally forming circular patterns centered on the epipole.
Once the optical layout is finalized, the system undergoes calibration. This process involves projecting structured light patterns (e.g., gray-code or phase-shift) onto a planar reference target, typically a checkerboard. The interior and exterior orientation parameters of both the camera and the projector are then computed based on their relative positioning and optical properties. Additionally, the calibration process includes lens distortion correction, which is typically modeled using radial and tangential distortion coefficients. It is important that all calibration steps are conducted under the same environmental conditions expected during system operation to ensure the continued validity of the computed parameters.
Figure 2 presents an overview of the complete methodological workflow proposed in this study.
Following calibration, the acquisition stage involves capturing scenes under controlled conditions. The system is tested under different configurations: one for assessing dimensional accuracy using gauge blocks and reference planes and another for evaluating image enhancement techniques under specular surface conditions. To simulate diverse operational scenarios, users can vary parameters such as background, lighting, and object geometry. For each configuration, images are systematically acquired and organized to ensure consistent dataset generation.
During the processing stage, the captured images may undergo optional filtering, such as HDR processing or Exposure Fusion, before being decoded to generate disparity or depth maps, which are then reconstructed into point clouds.
The Region of Interest (ROI) is segmented, and statistical filters are applied to remove outliers and noise. Image batches are organized based on experimental variables under investigation, such as pattern type, exposure level, or filtering strategy.
In the final analysis stage, two complementary evaluation paths are supported:
Absolute dimensional accuracy, based on known geometries (e.g., gauge blocks), fitted planes, and associated error metrics;
Relative quality assessment, based on point cloud metrics such as surface roughness, surface density, and volume density, computed using spatial neighborhood criteria.
By combining both evaluation paths, the methodology enables a comprehensive characterization of SLSs under realistic, application-specific constraints. It is particularly well suited for early-stage evaluations where the trade-off between performance and industrial feasibility must be carefully balanced.
3.1. Calibration Stage
The first stage of the methodology involves setting up and calibrating the optical acquisition system, aligning its configuration with the specific operational scenario under investigation. This includes defining the spatial arrangement and optical parameters of the core elements of the SLSs: the camera and the projector. Each component has a direct impact on the quality of the final 3D reconstruction, and their relative positioning must reflect the constraints of real-world deployment environments.
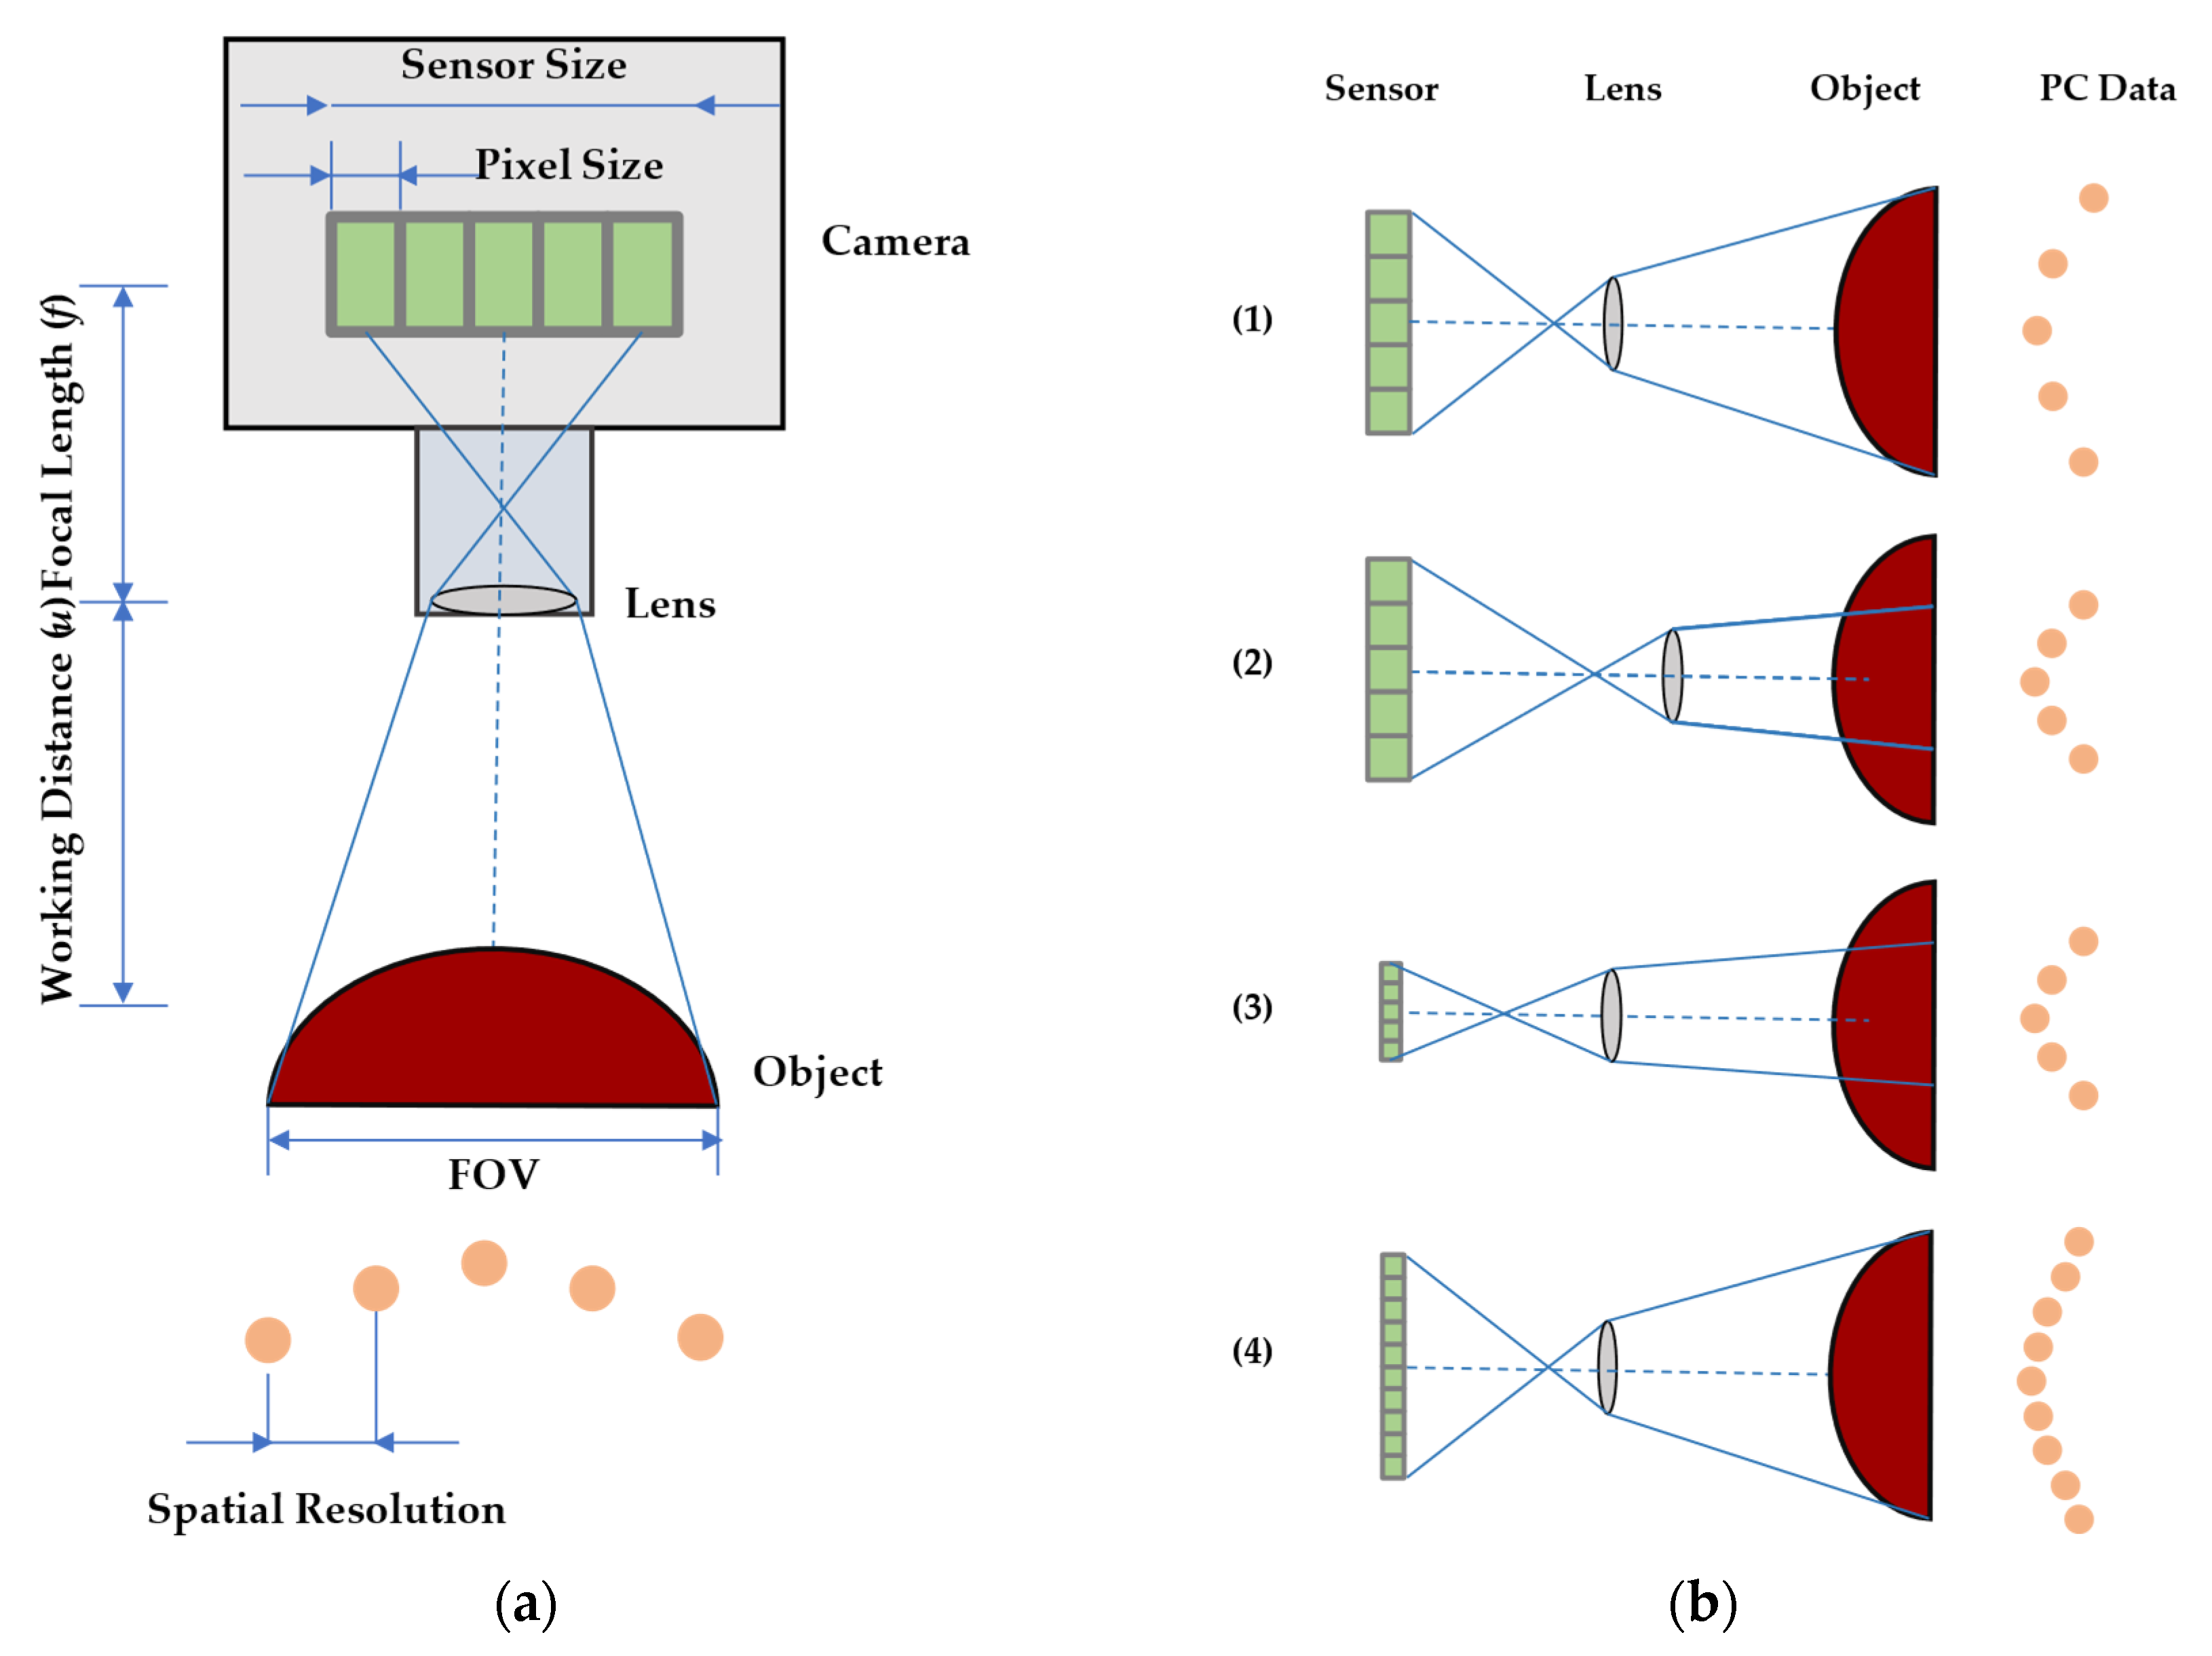
The camera captures light reflected from the object and projects it onto its internal sensor, which is composed of an array of photodetectors. The spatial resolution of the camera depends on both the architecture of the sensor and the lens configuration. The field of view (FOV) and the camera’s spatial resolution
are computed using the following equations:
where
is the spatial resolution of a camera;
is the field of view of the camera;
u is the distance of the camera from the target;
f is the focal length of the lens.
These relationships are illustrated in
Figure 3, which also highlights how spatial resolution can be improved by reducing pixel size, adjusting the FOV, or increasing the sensor resolution.
Lens-induced distortions are inherent to real-world optical systems and must be corrected during the calibration process. This step involves compensating for radial and tangential distortions and computing the orientation parameters of the camera using the pinhole camera model:
where
fx and
fy are the focal length expressed in pixels, and
cx and
cy are the coordinates of the optical center (also known as the principal point).
Radial distortion is modeled using the following equations:
Tangential distortion is modeled using:
where
k1,
k2, and
k3 are the radial distortion coefficients, and
p1 and
p2 are the tangential distortion coefficients.
The projector behaves, and is modeled, as an inverse camera: rather than capturing light, it emits structured patterns onto the object surface. Its effective resolution is determined by the projected pixel size (PPS), which directly affects the accuracy of the triangulated 3D point cloud. PPS is computed as
where
w is the sensor width,
d is the distance to the target,
f is the focal length, and
l_max is the image’s largest dimension.
In practice, the projector’s typically lower native resolution compared to the camera often makes it the limiting factor in overall system accuracy. Theoretical resolution is maximized when both the camera and projector operate near their minimum focus distances. However, when these distances differ, the larger of the two determines the effective lower bound of system resolution.
Operating either device outside its calibrated range leads to degraded measurement quality. To characterize spatial accuracy, the methodology adopts the Ground Sampling Distance (GSD) concept from photogrammetry. GSD defines the physical spacing between adjacent sampled points on the target surface, as seen from the camera’s perspective.
In active systems such as SLSs, effective sampling is influenced not only by the camera but also by the projector, particularly by the optical configuration and the selected pattern encoding algorithm.
Using both GSD and PPS provides a theoretical estimate of system accuracy and resolution before data acquisition, enabling system designers to verify whether the chosen configuration satisfies application-specific requirements, for example, the detection of sub-millimeter surface defects.
All calibration procedures should be conducted under environmental conditions that closely replicate those expected during the actual system operation. Changes in baseline, viewing angle, or working distance invalidate the calibration and may require a full re-estimation of the system parameters. To ensure the reliability and repeatability of the calibration process, external factors such as ambient lighting and temperature must remain stable throughout the procedure. Ideally, calibration should be performed in an indoor environment with uniform, constant-intensity artificial lighting and minimal exposure to variable light sources or direct sunlight, which can introduce shadows, glare, or contrast variations that hinder accurate corner detection. In our implementation, these guidelines were applied by conducting the calibration in a controlled laboratory setting using homogeneous artificial illumination. Additionally, the system was powered on and left idle for approximately 15 min before data acquisition to reach thermal equilibrium, reducing the impact of thermal drift and sensor instability caused by temperature fluctuations.
To ensure accurate and repeatable calibration, the following steps are recommended:
Define constraints. Identify physical and optical boundaries, such as FOV, DOF, working distance, and alignment, based on the specific operational context.
Configure the system. Set up the hardware components and position the calibration target according to the defined constraints.
Perform calibration. Apply appropriate pattern encoding and use dedicated software tools to derive accurate orientation parameters for the optical model.
3.2. Acquisition Stage
Following the calibration phase, the acquisition stage involves configuring and capturing the scene under realistic operating conditions. The position and orientation of the SLS components (camera and projector) must remain unchanged from the calibration setup, ensuring that the system continues to operate within the geometric and optical constraints for which the calibration parameters remain valid.
This stage focuses on evaluating the influence of environmental and application-specific factors on system performance. Variables such as ambient lighting, background tone, object geometry, surface properties, and target orientation can be systematically varied to assess their effects on reconstruction quality and dimensional fidelity.
When the objective is to evaluate the system’s dimensional accuracy, the scene must include reference objects with known nominal dimensions and tolerances significantly finer than the system’s expected resolution. Common references include gauge blocks and planar calibration plates, which provide measurement traceability and ensure repeatability. To preserve the validity of the evaluation, the SLS configuration must remain fixed throughout the process. Reference images should be acquired before introducing additional scene components or variations.
Special attention should be given to the following:
Ensuring that all gauge blocks are fully visible from the camera’s perspective;
Positioning the blocks in mutually orthogonal orientations to facilitate plane fitting and distance measurements;
Minimizing occlusions and shadows that could compromise the reconstruction.
For each experimental configuration, multiple acquisitions should be performed to account for variability and to support statistical analysis. Based on industrial metrology practice, we recommend a minimum of five repetitions per configuration, which allows for the computation of standard statistical indicators (e.g., mean, standard deviation, and error bounds) without excessive acquisition overhead. Additionally, environmental variations such as changes in ambient lighting, reflections, or temperature should be monitored and documented during the acquisition phase. If significant deviations are detected, defined, for example, as a >10% shift in exposure histogram distribution or dimensional discrepancies exceeding ±1 mm on reference objects, the acquisition session should be repeated or flagged for post-acquisition validation. These criteria aim to improve the reproducibility and consistency of the dataset, particularly in semi-controlled industrial environments where external variability cannot be fully eliminated.
In contrast, when evaluating image processing or reconstruction algorithms, the acquisition scene may intentionally include challenging elements, such as specular surfaces, complex geometries, or variable lighting conditions, to assess the robustness of the enhancement pipeline. In these cases, the goal is not to measure absolute accuracy but rather to compare the relative performance of different configurations or filtering strategies.
To this end, the system acquires images under a diverse yet controlled set of conditions, generating a representative dataset for subsequent processing. In our implementation, the angle of incidence between the projector and the target surface was systematically varied: flat surfaces were tested at tilt angles of 0°, 15°, and 30°. The results highlight a direct correlation between increased tilt and degradation in point cloud quality. As the angle increased, specular reflections became more pronounced, leading to localized data voids and noise artifacts, particularly in regions with surface curvature transitions.
The output from this acquisition phase, including raw image data and metadata describing experimental variables, is passed to the processing stage.
During the acquisition stage, the following actions are recommended:
Set up the accuracy characterization scene. Ensure that reference objects are positioned according to the design constraints established during the calibration phase.
Preserve system geometry. Maintain the physical configuration of the SLSs throughout acquisition to ensure that calibration parameters remain valid.
Acquire the scene multiple times. Capture multiple datasets per condition to account for variability and support statistically reliable evaluations.
Design for both objectives. Clearly distinguish between setups aimed at absolute accuracy characterization and those intended for comparative evaluation of image processing or reconstruction algorithms.
3.3. Processing Stage
The processing stage is dedicated to preparing the dataset for quantitative analysis. It encompasses the structured handling of acquired images, 3D scene reconstruction, and refinement of the resulting point clouds through cleaning and segmentation operations. While the acquisition stage focuses on evaluating the influence of environmental and physical configurations, the processing stage emphasizes the assessment of specific reconstruction and image enhancement algorithms.
3.3.1. Dataset Generation and Image Enhancement
The first step in the processing stage involves organizing the captured images into structured datasets according to the specific test objectives. Prior to 3D reconstruction, image enhancement algorithms may be applied to improve the semantic quality of the acquired images.
These algorithms are designed to address common visual limitations, such as the following:
Overexposed or underexposed regions;
Lack of sharpness or contrast;
Poor edge definition and limited surface detail.
Enhancement techniques may include the following:
Kernel-based filters, which operate based on fixed neighborhood rules;
Adaptive methods, which adjust pixel values based on local statistical properties;
Fusion strategies, which combine multiple exposures to restore visual information lost in extreme lighting conditions.
The goal of these enhancement steps is to increase the interpretability and quality of the input data for the subsequent decoding and 3D reconstruction algorithms, particularly under challenging acquisition scenarios, such as those involving specular surfaces, complex geometries, or non-uniform lighting.
3.3.2. Scene Reconstruction
Once the datasets are prepared, structured light decoding and 3D reconstruction are performed. In this methodology, decoding is typically conducted using the same software employed during calibration (e.g., Scan3D [
41]), ensuring consistency in the use of calibration parameters.
The resulting point cloud represents the 3D surface geometry of the captured scene. However, the reconstruction may include noise, missing regions, or artifacts introduced by limitation in the acquisition process or the decoding algorithm.
3.3.3. Point Cloud Post-Processing
To ensure reliable quantitative analysis, the reconstructed point cloud must undergo post-processing operations such as cleaning, thresholding, and segmentation. These procedures can be broadly categorized as follows:
Noise reduction. This involves the removal of isolated or spurious points, typically using statistical filters such as the Statistical Outlier Removal (SOR). It excludes points whose average distance to neighboring points exceeds a defined threshold, effectively eliminating outliers.
Region of Interest (ROI) segmentation. This procedure focuses on delimiting the relevant portion of the scene and excluding irrelevant elements (e.g., background regions, shadows, or structural clutter). ROI segmentation enhances computational efficiency and prevents non-essential data from skewing the analysis results.
Maintaining a careful balance between data cleaning and information preservation is essential. Excessive filtering may distort the underlying geometry, compromising the validity of subsequent measurements. Conversely, insufficient filtering may retain noise that reduces the reliability of the analysis.
3.3.4. Workflow Considerations
To ensure reproducibility and maintain clarity, the processing workflow should preserve a clear separation between the following steps:
Image enhancement (if applicable);
Decoding and 3D reconstruction;
Point cloud filtering and segmentation.
This modular structure enables the independent evaluation of each stage and supports the comparative analysis of alternative processing pipelines or algorithms.
3.3.5. Summary of Processing Recommendations
The processing stage should be organized into well-defined, traceable sub-steps to ensure consistency and analytical rigor:
Apply image enhancement algorithms during dataset preparation, particularly when surface properties or lighting conditions impair image quality.
Use statistical filters to clean the point cloud while avoiding overfitting or excessive smoothing that could distort geometric features.
Define ROI to focus computational resources and reduce analysis noise from irrelevant scene components.
Maintain a consistent and traceable processing pipeline to support reproducibility and facilitate meaningful comparisons across experiments.
3.4. Analysis Stage
The final stage of the proposed methodology focuses on evaluating the overall quality and accuracy of the 3D reconstruction while considering both operational conditions and application-specific constraints.
Two distinct evaluation paths are followed, depending on the intended objective: (i) dimensional accuracy assessment and (ii) comparative analysis of reconstruction quality across different system configurations or image enhancement algorithms.
Each strategy relies on dedicated metrics and standardized procedures to extract quantitative indicators of system performance.
The goal is to support informed decision-making in the design, optimization, and deployment of structured light-based inspection systems. These indicators guide design decisions and system optimization, supporting the deployment of structured light-based inspection tools in industrial settings.
Importantly, the analysis stage also enables a retrospective evaluation of upstream parameters, particularly those defined during calibration and acquisition. Deviations in the reconstructed geometry, such as surface warping, scale drift, or point cloud non-uniformity, can often be traced back to intrinsic system inaccuracies, including calibration misalignment, baseline instability, or suboptimal optical layout. While the methodology does not implement a formal error propagation model, it provides a practical diagnostic mechanism for identifying cross-stage coupling effects. Geometric anomalies observed in the final output serve as empirical indicators of earlier configuration flaws, thereby supporting an iterative refinement of system parameters. This form of implicit error tracing reinforces the importance of procedural consistency and robust parameter management across all stages, especially in dynamic or space-constrained environments.
3.4.1. Dimensional Accuracy Assessment
To evaluate the metrological performance of the system, the methodology employs gauge blocks and reference geometries with known nominal dimensions. This approach aligns with established standards, such as VDI/VDE 2634 [
20], which emphasize the importance of calibrated artifacts and statistical measurements across different spatial positions.
The assessment process begins by generating fitting planes over the surfaces of the gauge blocks. These planes are computed by minimizing the orthogonal distance between the reconstructed points and the fitted plane, thereby transforming the discrete point cloud into a set of continuous geometric surfaces. This enables direct measurement of the distances between reference planes, which are then compared to the known nominal values. Based on these comparisons, the absolute error and percent error are calculated, along with statistical descriptors such as mean error, standard deviation, and standard error. Together, these metrics provide a robust and quantitative estimate of the system’s dimensional accuracy under realistic operating conditions.
3.4.2. Point Cloud Quality Evaluation
When the focus shifts to evaluating the effects of different system configurations or image processing algorithms, the analysis relies on geometric metrics that characterize the quality and consistency of the resulting point cloud. A well-reconstructed 3D scene is expected to exhibit low noise, high point density, and uniform spatial coverage with minimal gaps. The selected metrics include the following:
Surface roughness, reflecting the local variation in surface topology;
Surface density, computed as
where
N represents the number of neighboring points within a defined radius
r.
These metrics can also be extended globally to compute mean indices for the entire point cloud.
This minimal set of quantitative indicators enables both absolute evaluation (e.g., the detection of noise or data gaps) and relative comparisons (e.g., assessing the performance of image enhancement techniques such as HDR or Exposure Fusion).
While absolute density values may vary depending on the hardware and acquisition geometry, relative trends remain stable and informative indicators of algorithmic performance.
3.4.3. Practical Implementation Guidelines
To ensure a structured and repeatable analysis, the following actions are recommended:
For dimensional accuracy assessment
Generate fitting planes on the faces of the gauge blocks;
Perform statistical evaluation of the distances between fitted planes;
Compare measured values against nominal dimensions to compute absolute and percentage errors.
For point cloud quality comparison
Define evaluation metrics (e.g., surface roughness, surface density, and volume density);
Apply consistent segmentation and filtering criteria across all datasets;
Perform comparative analysis under varying experimental conditions or across different image enhancement algorithms.
This dual-analysis strategy provides a comprehensive assessment of system performance and supports informed decision-making regarding both hardware configuration and the software processing pipeline.
4. Experimental Setup and Industrial Case Study
To validate the proposed methodology, an industrial case study was conducted within an automotive production environment. The objective was to evaluate SLSs for detecting surface defects and geometric deviations in metal sheet components prior their entry into the finishing phase. The system consisted of a camera–projector pair installed in a dedicated inspection cell along the production line.
The test scenario reproduced real industrial constraints, including highly reflective metallic surfaces, complex part geometries, and variable lighting conditions. These factors frequently introduce specular reflections, which degrade the quality of 3D reconstructions. To address this challenge, two image enhancement strategies, HDR and Exposure Fusion, were implemented and compared within the framework of the proposed evaluation methodology.
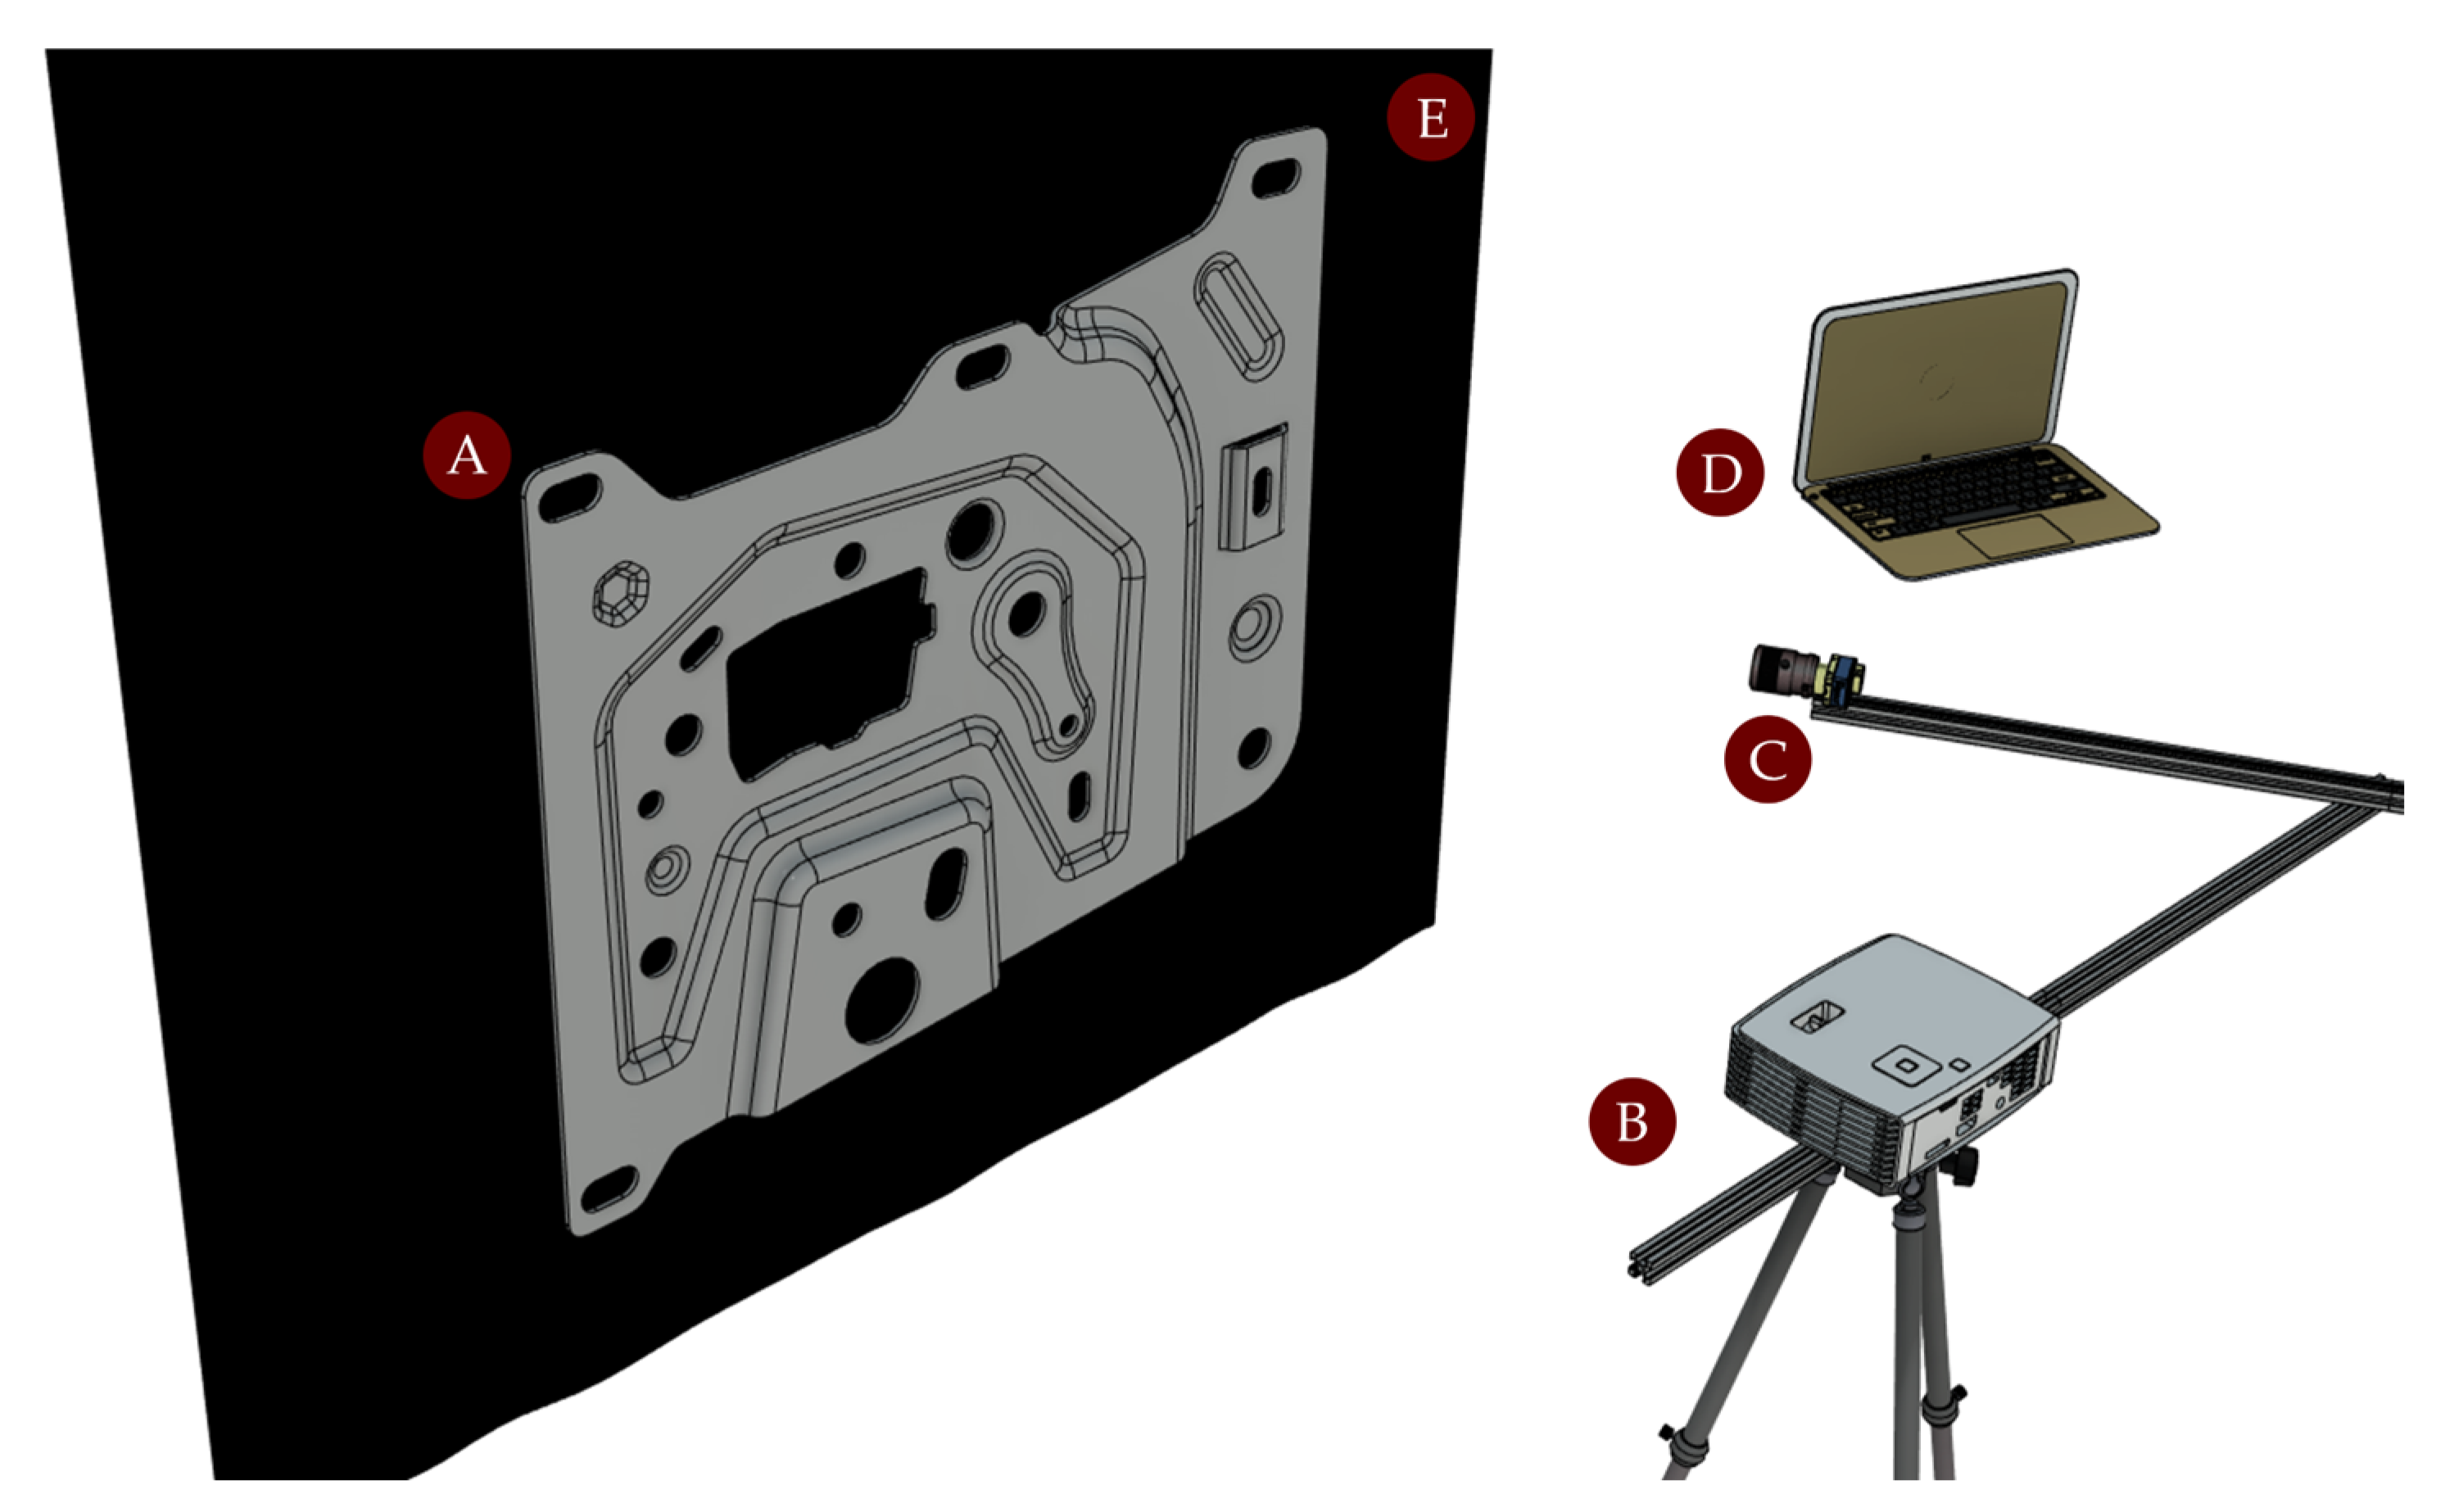
The optical setup (
Figure 4) included a monochrome camera Genie Nano M2590, 5.3 MP, 1″ sensor, pixel size 4.8 μm (Teledyne Dalsa, Waterloo, ON, Canada) equipped with a Computar V1628-MPY lens, 16 mm focal length (CBC Co., Ltd., Tokyo, Japan), and a digital projector ZH406, 1920 × 1080 px, 4500 lumens (Optoma Corporation, Fremont, CA, USA). All components were rigidly mounted within the inspection cell to ensure geometric stability. Working distances were set to 0.8 m for the camera and 1.0 m for the projector in compliance with their respective minimum focus constraints.
A dark background was used to replicate real production conditions and minimize interference from ambient light. Lighting was adjusted to closely simulate the operational environment of an inline inspection station, thereby ensuring consistency with actual deployment scenarios.
The calibration phase was performed using Scan3D software [
41]. A 10-bit gray-code pattern was projected onto a 12 × 16 checkerboard target (
Figure 5), and image sequences were acquired from three different poses, resulting in a total of 126 images. The software was then used to compute the system’s orientation parameters, completing the calibration of the optical model. This step is critical, as errors in exterior parameters have been observed to cause deviations exceeding 1 mm in plane-fitting accuracy during test acquisitions, underscoring the need for rigorous multi-view calibration.
All calibration activities were conducted in a controlled indoor environment to ensure stable and homogeneous illumination. To reduce variability that could degrade pattern quality, diffuse artificial light sources were used in combination with shielding elements to eliminate direct reflections and stray lighting. Although ambient temperature was not actively regulated, the system was powered on and left idle for approximately 15 min prior to acquisition, allowing thermal equilibrium to be reached and minimizing the impact of thermal drift or minor optical misalignments.
To assess the sensitivity of the calibration procedure to lighting conditions, additional sessions were conducted under deliberately altered illumination. In these scenarios, increased ambient brightness led to a perceptible reduction in projected pattern contrast, which impaired corner detection and increased the reprojection error from approximately 0.2 to 0.5 pixels. This degradation was particularly evident with reflective targets, where uncontrolled lighting introduced subtle geometric distortions in the calibration grid, ultimately compromising the accuracy and repeatability of the estimated parameters.
Based on the system specifications, the GSD was estimated to be approximately 0.1 mm/pixel at 0.3 m and 1.0 mm/pixel at 3.0 m.
For the projector, treated as an inverse camera, the projected pixel size was derived from the projection geometry and screen dimensions. These values were summarized in dedicated lookup tables and visualized using reference graphs.
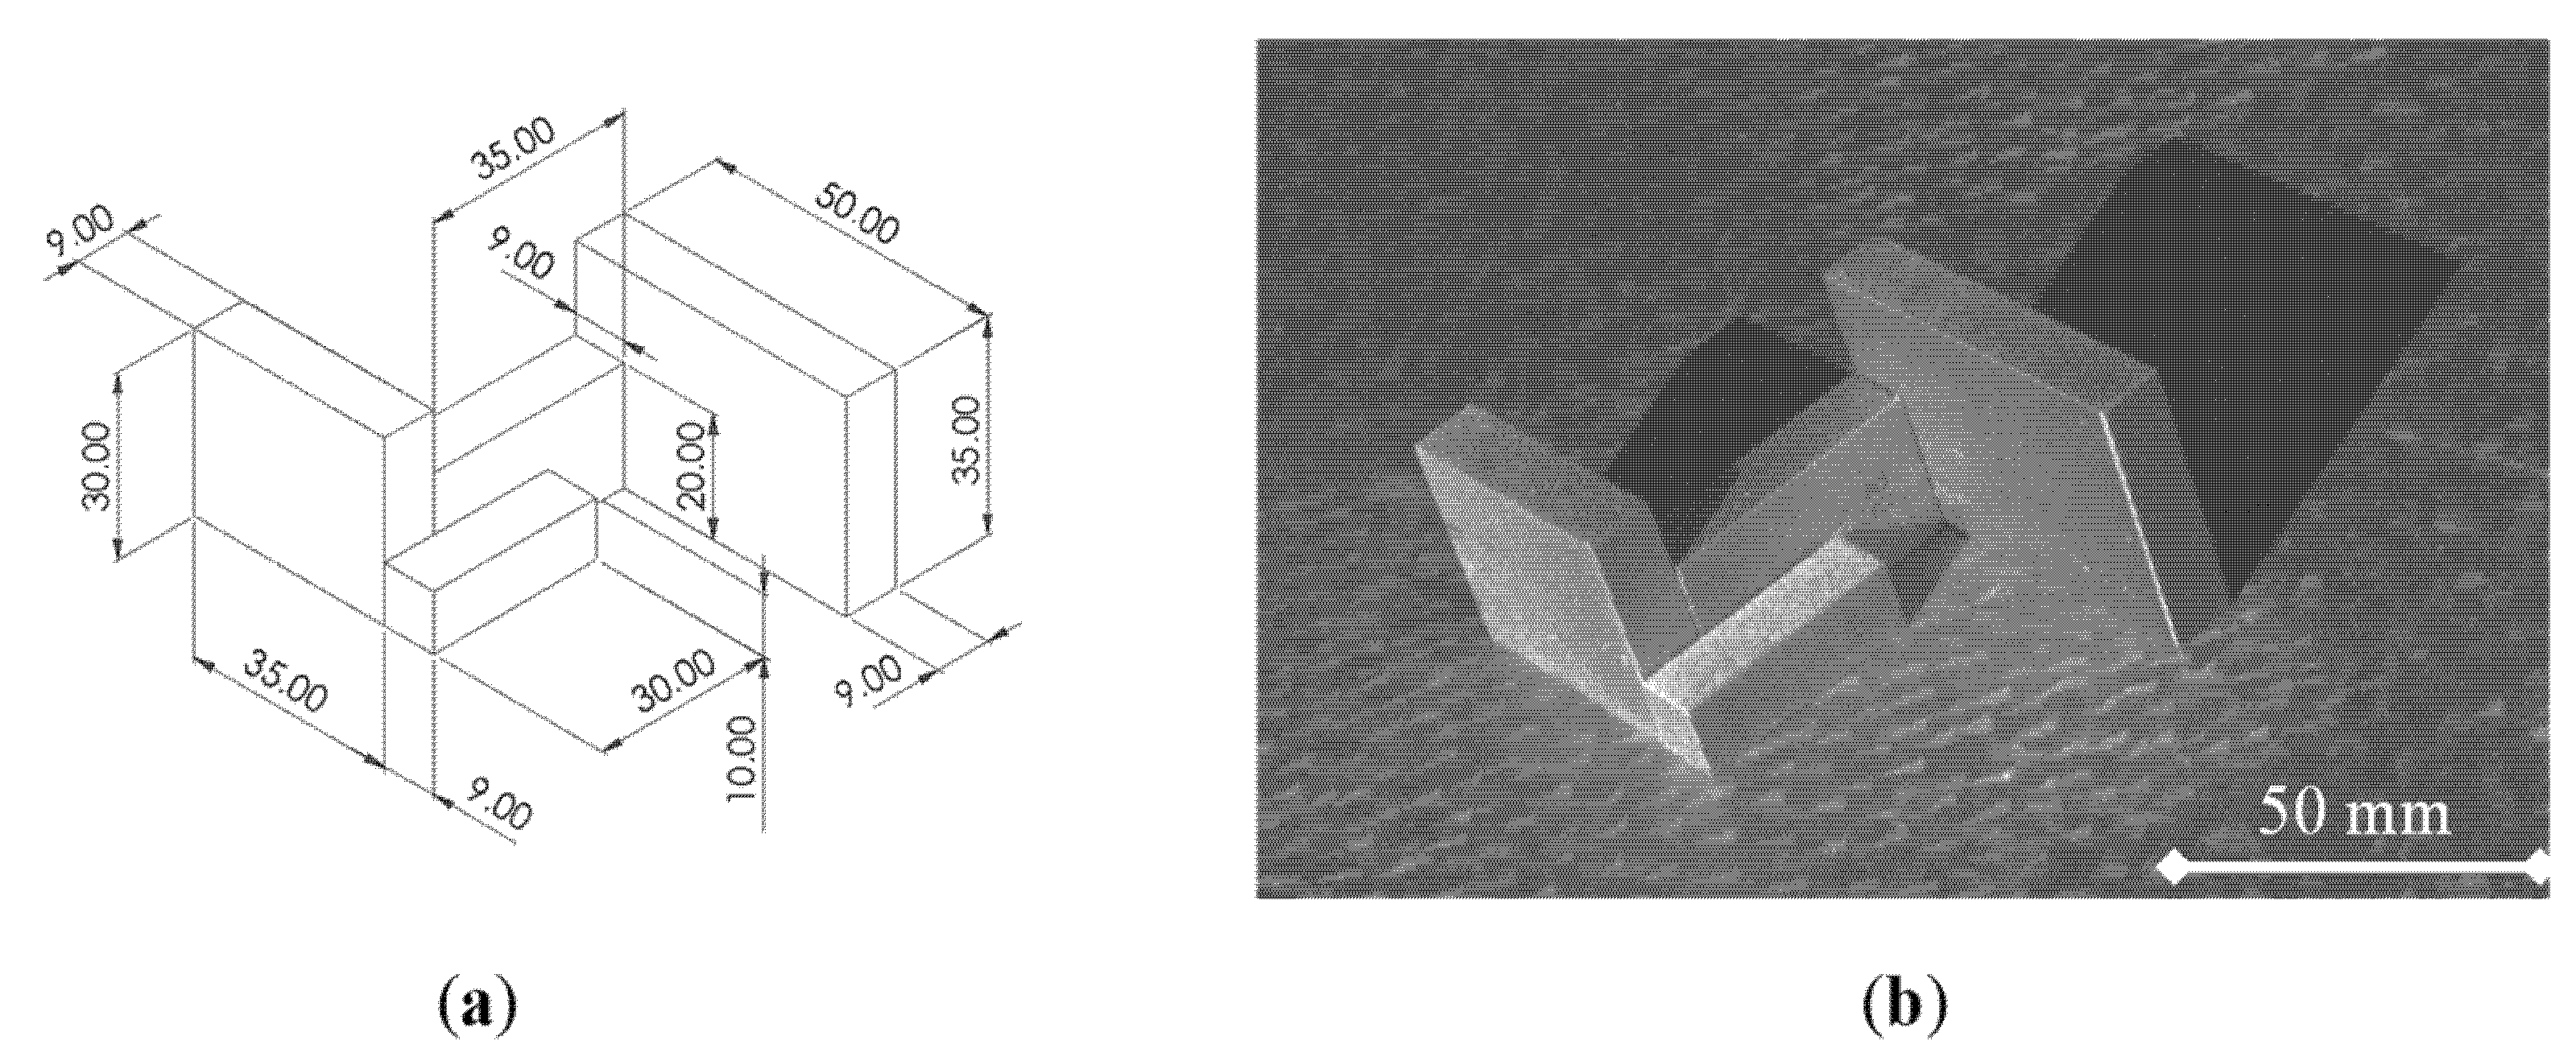
The case study involved two acquisition scenarios. In the first scenario, dimensional accuracy was evaluated using BRA32/0-grade gauge blocks (Mitutoyo Corporation, Kawasaki, Japan) placed on a DIN 876/I precision plate (Mitutoyo Corporation, Kawasaki, Japan). The setup was designed in a CAD environment to ensure proper alignment and orthogonality of the gauge blocks. To minimize surface reflectivity and improve acquisition quality, a dulling spray was applied to the blocks prior to scanning (
Figure 6).
The results of the dimensional characterization analysis are summarized in
Table 2. Measurements were taken across gauge blocks of varying nominal lengths, and the corresponding absolute and percent errors were computed.
Table 3 reports the statistical metrics derived from these measurements, including the mean absolute error, standard deviation, and standard error, providing an overall assessment of the dimensional accuracy.
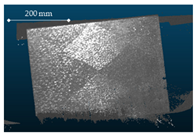
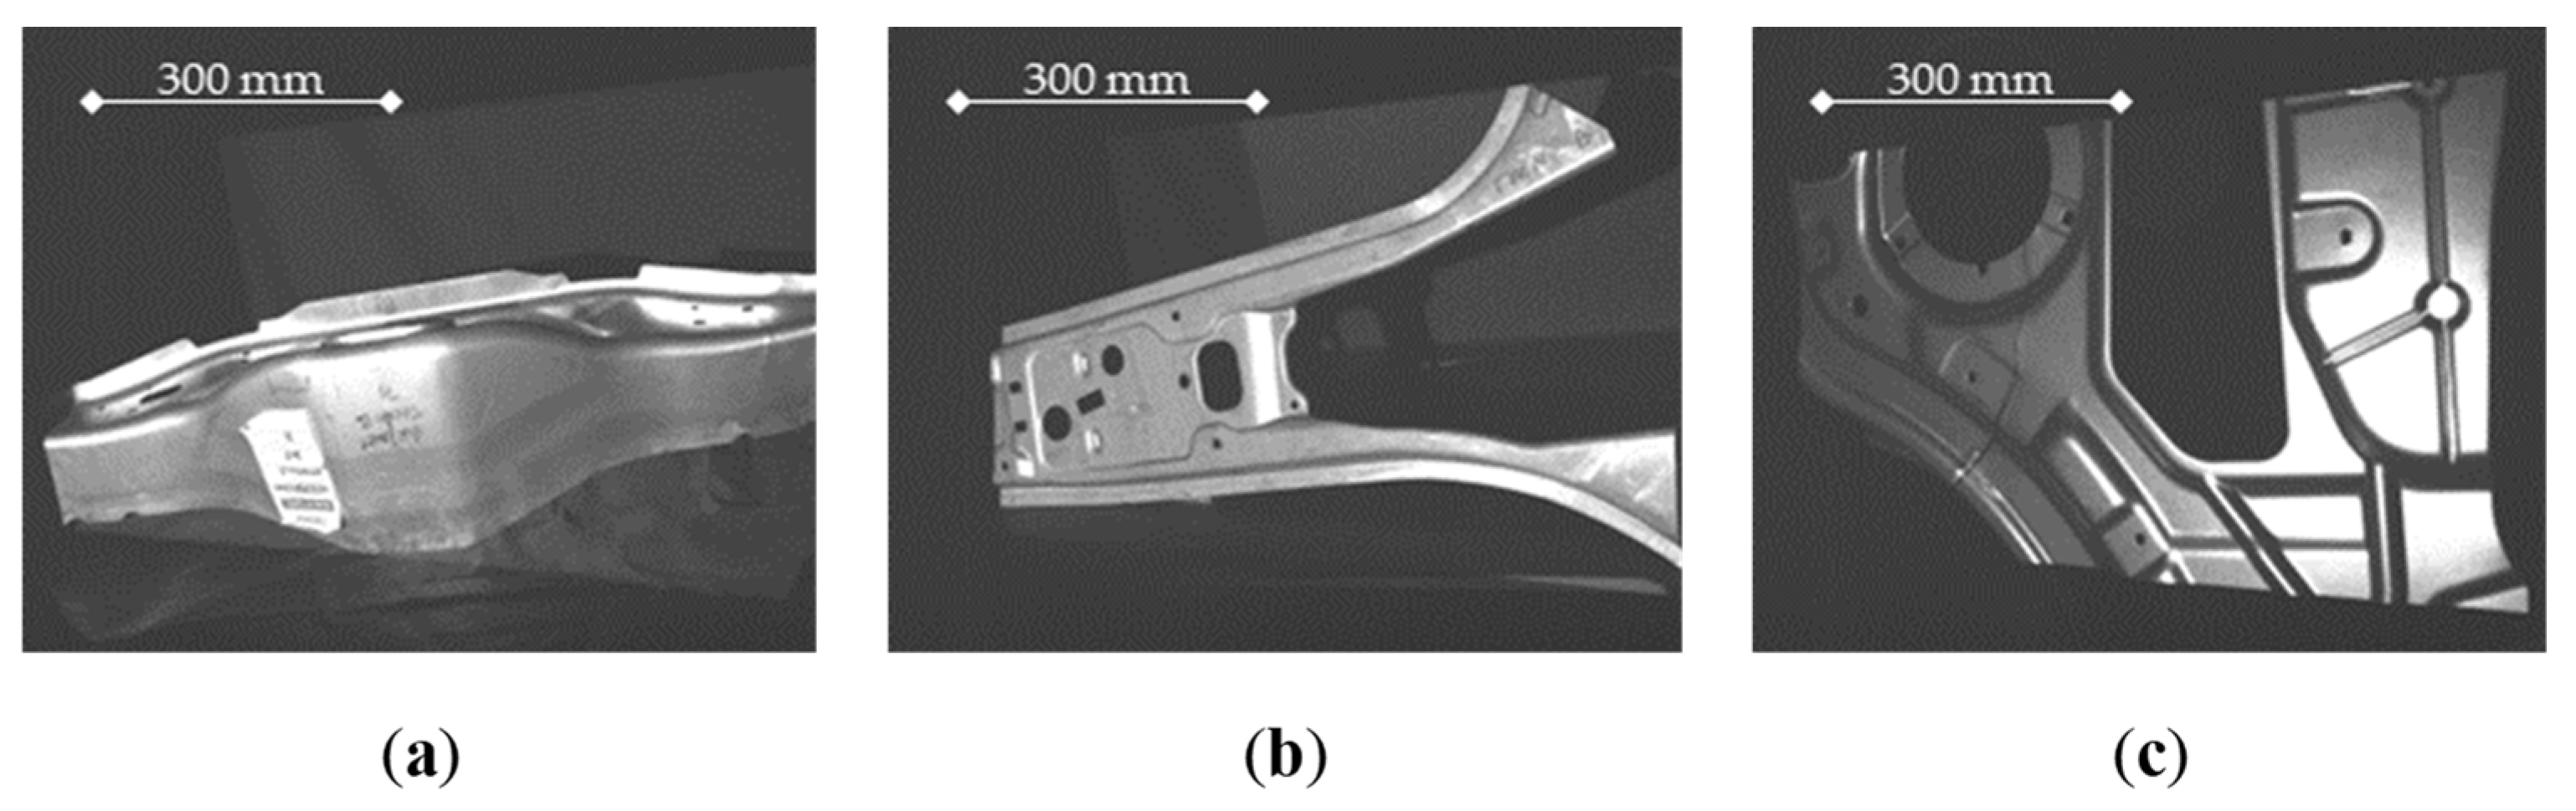
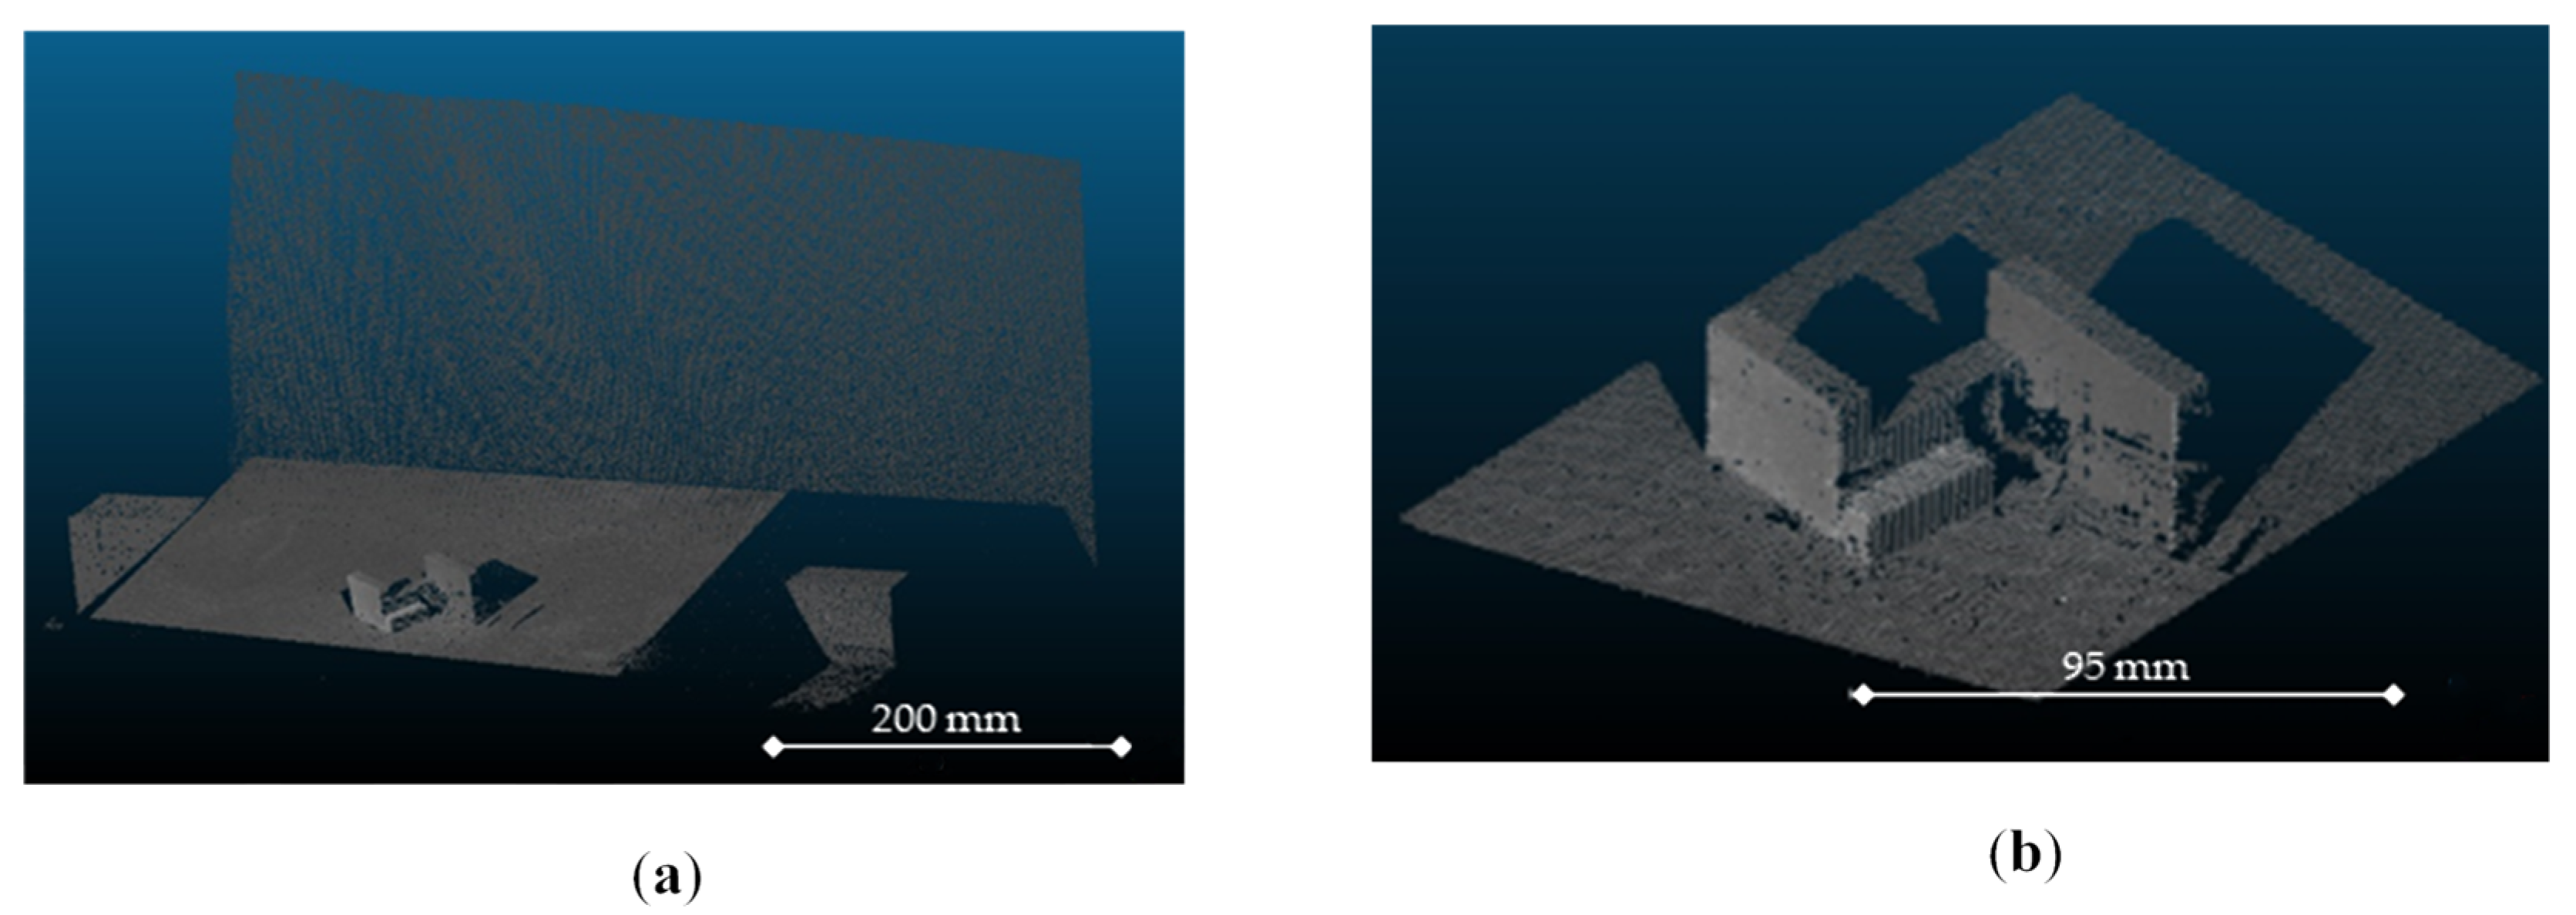
In the second scenario, aluminum metal sheet components, selected from production waste, were scanned to evaluate system performance under reflective surface conditions (
Figure 7).
The inspected parts featured both curved and flat regions, each generating distinct reflection patterns. For each configuration, a total of 42 structured light images were acquired at five different exposure times, resulting in 210 frames per object (
Figure 8).
Image datasets were generated and processed according to their respective evaluation objectives. For dimensional accuracy analysis, raw images were decoded directly without any enhancement procedure. For algorithm comparison, the datasets were processed using HDR and Exposure Fusion techniques to improve reconstruction quality under challenging lighting conditions.
The resulting 3D point clouds were reconstructed using Scan3D and post-processed in CloudCompare [
42] (
Figure 9). SOR filtering was applied to eliminate noise, and ROI segmentation was used to isolate the relevant surface areas for analysis.
Dimensional analysis was performed by generating fitting planes across selected surfaces of the gauge blocks and the reference plate.
5. Results
The analysis stage in the experimental setup of the case study provided valuable insights into both the effectiveness of the proposed methodology and the performance of the structured light system under industrial-like conditions. The dimensional accuracy evaluation was conducted using gauge blocks with certified nominal dimensions. Measurements extracted from the 3D reconstructed scene were compared against the nominal dimensions, resulting in a mean absolute error of 1.19 mm and a standard error of 0.60 mm.
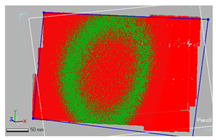
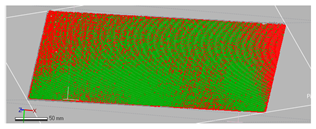
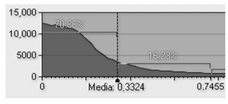
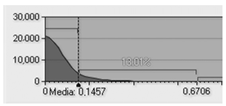
A planarity analysis conducted on the reference calibration plate highlighted a significant effect of surface orientation on reconstruction quality. When the plate was oriented facing the projector, thus increasing exposure to direct illumination and specular effects, the fitting error reached 0.3324 mm, compared to 0.1457 mm when it was positioned horizontally (flat). This result emphasizes the role of viewing angle and specular reflection in degrading reconstruction accuracy, particularly near edges or curved transitions.
Table 4 reports the results of this planarity analysis, where false-color maps indicate local deviations from an ideal plane. Green areas correspond to low deviation, while red regions highlight surface irregularities.
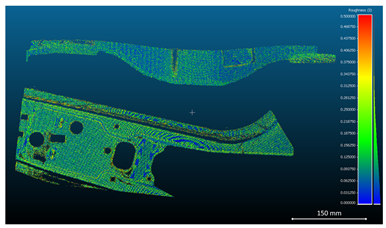
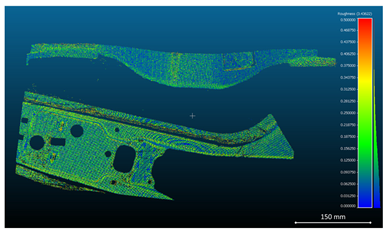
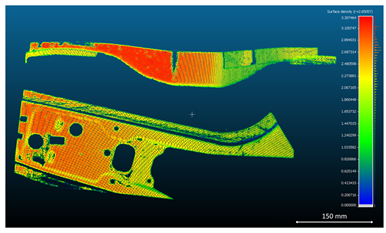
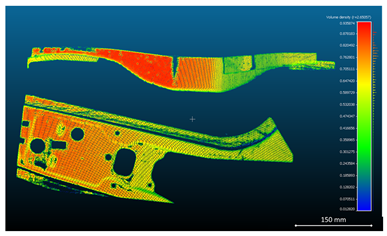
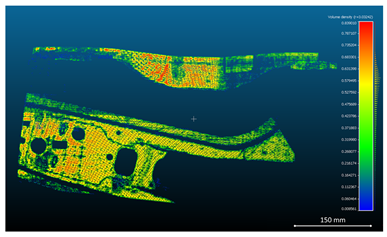
For the metal sheet components analyzed in
Table 5, quantitative metrics, including surface roughness, surface density, and volume density, were computed from the reconstructed point cloud data. The results are presented in
Table 6,
Table 7 and
Table 8.
In particular, three acquisition configurations were compared: unfiltered standard images, HDR-processed images, and images enhanced through the Exposure Fusion algorithm. All reconstructions were confined to a standardized spatial volume of 700 × 500 mm2 to ensure comparability.
Although the Standard dataset exhibited a slightly higher raw point count than the Exposure Fusion configuration, both roughness analysis and visual inspection revealed more pronounced clustering and noise artifacts, particularly in regions affected by surface reflectivity. In contrast, the Exposure Fusion algorithm yielded more uniform and continuous reconstructions, producing higher-quality point clouds with improved spatial coherence.
When normalized over the common bounding box, the calculated surface densities were 0.7571 pt/mm2 for the Standard dataset, 0.3566 pt/mm2 for HDR, and 0.7410 pt/mm2 for Exposure Fusion. Despite a marginally lower point density compared to the Standard configuration, the Exposure Fusion approach provided more consistent coverage by reducing the number of corrupted or noisy areas.
Compared to the Standard dataset, Exposure Fusion led to a 2% increase in usable surface area when excluding invalid points. Furthermore, it outperformed HDR in terms of point density by approximately 0.5–1.0% under identical acquisition parameters. These results are particularly relevant in industrial inspection tasks, where surface completeness, geometric continuity, and fidelity of reconstructed features are more critical than raw point count alone.
From a practical standpoint, the computational cost associated with Exposure Fusion was considerably higher. On a standard workstation equipped with an Intel i7 CPU (Intel Corporation, Santa Clara, CA, USA) and 32 GB of RAM, and without GPU acceleration, the average processing time per frame was approximately 1.6 s for Exposure Fusion, compared to 0.5 s for HDR. Peak memory usage reached about 1.8 GB per frame due to the handling of multiple high-resolution input exposures and pyramid blending operations, while HDR processing remained within 750 MB per frame.
Overall, although Exposure Fusion is currently less suitable for real-time implementation due to its computational demands, it proves highly effective in offline workflows dedicated to high-accuracy quality control. Its capacity to recover detail lost in over- and underexposed regions significantly enhances the reliability of 3D reconstructions, particularly in the presence of reflective surfaces or geometrically complex parts.
The case study confirms the applicability of the proposed methodology to realistic industrial inspection scenarios, providing a structured framework for both quantitative performance evaluation and comparative analysis of image enhancement techniques under constrained operational conditions.
These results underscore the methodology’s value in supporting informed decisions related to system configuration, calibration accuracy, and data processing strategies, ultimately facilitating the integration of structured light technologies into production environments where robustness, repeatability, and adaptability are critical.
6. Conclusions
This study presented a comprehensive methodology for evaluating the performance of SLSs in industrial inspection contexts, with particular emphasis on their applicability in real-world manufacturing environments. The proposed approach addresses both hardware and software dimensions of 3D optical acquisition, integrating calibration geometry, operational constraints, and the influence of image enhancement algorithms on reconstruction quality.
The methodology was validated through a case study involving metal sheet components in an automotive production line, demonstrating its effectiveness under realistic operating conditions.
Using reference geometries such as gauge blocks and reflective aluminum parts, the framework enabled a robust quantification of dimensional accuracy and point cloud quality. Key metrics, including surface roughness, point density, and planarity deviation, were employed to support a detailed and repeatable evaluation of system performance.
Among the principal findings, it was observed that environmental and geometric factors, such as component orientation and background characteristics, significantly influence the reliability of 3D reconstruction. Furthermore, the comparative analysis of image enhancement algorithms confirmed that techniques like Exposure Fusion can improve reconstruction quality in the presence of specular reflections, although current implementations remain computationally intensive and are not yet viable for real-time deployment.
Beyond these specific results, the proposed methodology offers several strengths in enhancing and streamlining the work performed by operators in industrial settings. First, its modular and clearly structured workflow, divided into setup, acquisition, processing, and analysis, enhances transparency, repeatability, and interpretability, making it suitable not only for vision experts but also for process engineers and operators. Second, the use of open-source tools and standardized metrics promotes accessibility and transferability across different industrial environments, supporting both training and technology adoption. Third, the methodology serves as a decision-support tool for assessing the feasibility, performance, and integration readiness of SLS-based systems prior to their deployment on the manufacturing line.
The study also identifies areas for future improvement. In particular, the development of adaptive acquisition strategies and predictive models, capable of estimating reconstruction reliability based on system and environmental parameters, would further strengthen the approach. Likewise, optimizing image enhancement algorithms for embedded or real-time systems could enable deployment in dynamic production environments.
In summary, the proposed methodology represents a practical, versatile, and scalable solution for evaluating and integrating SLSs in industrial inspection workflows. It supports not only accurate 3D reconstruction but also contributes to the broader goal of incorporating ergonomic and cognitive considerations into the digital transformation of manufacturing processes.


