Abstract
Cutting force is a critical indicator reflecting the interaction between the cutting tool and the workpiece in machining processes. Conventional measurement methods using dynamometers are accurate but costly and challenging for real-time applications. This study proposes a novel transfer learning-based method for estimating milling cutting forces using only spindle vibration signals without direct force sensors. The proposed approach consists of two stages: First, an autoencoder is trained with measured cutting force data to construct a latent feature space. Second, a target encoder aligns spindle vibration signals to this latent space, allowing the decoder to reconstruct estimated cutting forces. To reflect machining parameters into the learning model, the input dataset was constructed by integrating material type, cutting speed, and cutting direction as additional inputs into each model’s inputs. Experiments were conducted on Ti-6Al-4V and STS316L workpieces under various machining conditions. Under normal conditions, the proposed method achieved an average Pearson correlation coefficient (PCC) of 0.9213 () and 0.9072 (). Under abnormal transient conditions, robust performance was maintained, with PCC values of 0.8573 () and 0.9202 (). The results demonstrate that the proposed method can effectively monitor cutting forces and reflect changes across a variety of machining environments using only vibration signals.
1. Introduction
Cutting tools significantly affect the overall efficiency, stability, and product quality in machining operations. Tool wear, breakage, and abnormal conditions degrade dimensional accuracy, surface finish, and equipment health, resulting in unscheduled downtime and increased cost. Historically, tool changes have been scheduled based on empirical intervals or production volumes, which often leads to premature replacements or delayed interventions, both of which impact process efficiency [1,2]. In response to these challenges, Tool Condition Monitoring (TCM) has been recognized as a critical enabler of intelligent and reliable machining systems [1,3,4,5].
Among physical sensing modalities applied in TCM, including vibration, acoustic emission (AE), spindle current, and thermal sensing—cutting force has consistently been regarded as a primary physical indicator due to its ability to directly represent tool–workpiece interaction during material removal [4]. Cutting forces are influenced by machining parameters such as feed rate, depth of cut, tool geometry, and material hardness, enabling real-time inference of tool wear, breakage, and cutting instability [6,7,8].
However, the use of dynamometers for direct measurement of cutting forces is constrained by their high cost and installation limitations, making them impractical for deployment in general production environments. Additionally, long-term measurements may suffer from sensor nonlinearity or cumulative drift, and the reliability of force signals can be degraded by environmental noise [4,9]. As a result, recent research has focused on indirect force estimation using signals that correlate with cutting force, including spindle current, AE, and vibration [10,11,12].
Spindle current-based estimation is advantageous in terms of accessibility, as current signals are typically available in commercial CNC machines. However, these methods are limited by machine-dependent variability and the mechanical decoupling between the spindle and motor, which reduces their sensitivity to transient or localized force variations [9,11,13,14]. AE-based sensing captures high-frequency events such as chip segmentation and tool fracture, but the approach requires high sampling rates and expensive equipment, limiting its applicability for real-time implementation [15].
Among these alternatives, vibration-based monitoring has attracted considerable attention due to its low cost, simple integration, and ability to detect dynamic changes in tool–workpiece interaction [12,16,17]. In particular, spindle-mounted vibration sensing has been extensively studied over the past decades as an effective and practical method for indirect monitoring of machining dynamics [18,19]. This approach is advantageous over workpiece-mounted sensing methods because the spindle sensor remains fixed at a constant distance from the tool, ensuring consistent signal quality regardless of the workpiece geometry or material. In contrast, sensors placed on the workpiece or fixture may vary in distance to the cutting zone and are affected by changes in workpiece shape, material damping characteristics, and structural stiffness.
Furthermore, the tool–workpiece contact duration during cutting is extremely brief, making localized tool–workpiece interaction signals more prominent in spindle measurements. Therefore, spindle-mounted sensors are less susceptible to variations caused by workpiece geometry or material properties. However, vibration signals are highly nonlinear and nonstationary, as they are affected by machine structure, external disturbances, and system dynamics. These factors reduce the generalization ability of analytical and regression-based estimation models [7,8,9]. To address these limitations, recent studies have employed machine learning (ML) and deep learning (DL) techniques to capture the complex, nonlinear relationship between sensor signals and tool condition metrics [10,12,17,18]. Among these, autoencoders have shown effectiveness in learning latent feature spaces for anomaly detection through signal reconstruction. However, most prior applications have been limited to binary classification and lack the ability to estimate continuous cutting force signals [16,20]. In addition, recurrent models such as long short-term memory (LSTM) networks have been applied to estimate cutting forces from spindle vibration signals [21,22]. However, these approaches typically focus on predicting statistical features such as average peak force values rather than reconstructing full time-series force signals, which limits their effectiveness in dynamic monitoring [22].
This study proposes a novel transfer learning-based method for estimating milling cutting forces using only condition-aware spindle vibration signals without relying on direct force sensors. Unlike conventional approaches where vibration signals and autoencoders have primarily been used for tool condition classification, the proposed method performs continuous time-series force estimation across diverse machining conditions through regression in a learned latent space. The approach consists of two stages: first, an autoencoder is trained using measured cutting force data to construct the latent feature space. Second, a target encoder is trained to map vibration signals—augmented with machining condition inputs such as material type, cutting speed, and cutting direction—into this space. The decoder, fixed from the first stage, is then used to reconstruct the estimated cutting forces. The model enables high-fidelity estimation of cutting force time series from vibration signals, with strong generalization across varied machining scenarios. The model is experimentally validated using Ti-6Al-4V and STS316L workpieces under four distinct cutting conditions. Estimated forces are compared with dynamometer-based reference measurements, and performance is quantitatively assessed using the Pearson correlation coefficient.
2. Autoencoder for Latent Vector Extraction of Cutting Forces
In this study, a representation learning-based machine learning model is proposed to estimate cutting forces indirectly using only spindle vibration signals without relying on expensive direct force sensors such as dynamometers. The model is composed of two stages. First, a deep autoencoder is trained using ground-truth cutting force data measured by a dynamometer. This autoencoder learns a compressed latent vector that captures the temporal dynamics of the force signal. In the second stage, this learned latent space is used as a target for training a separate encoder that takes vibration signals as input.
2.1. Structure and Operation of Autoencoder
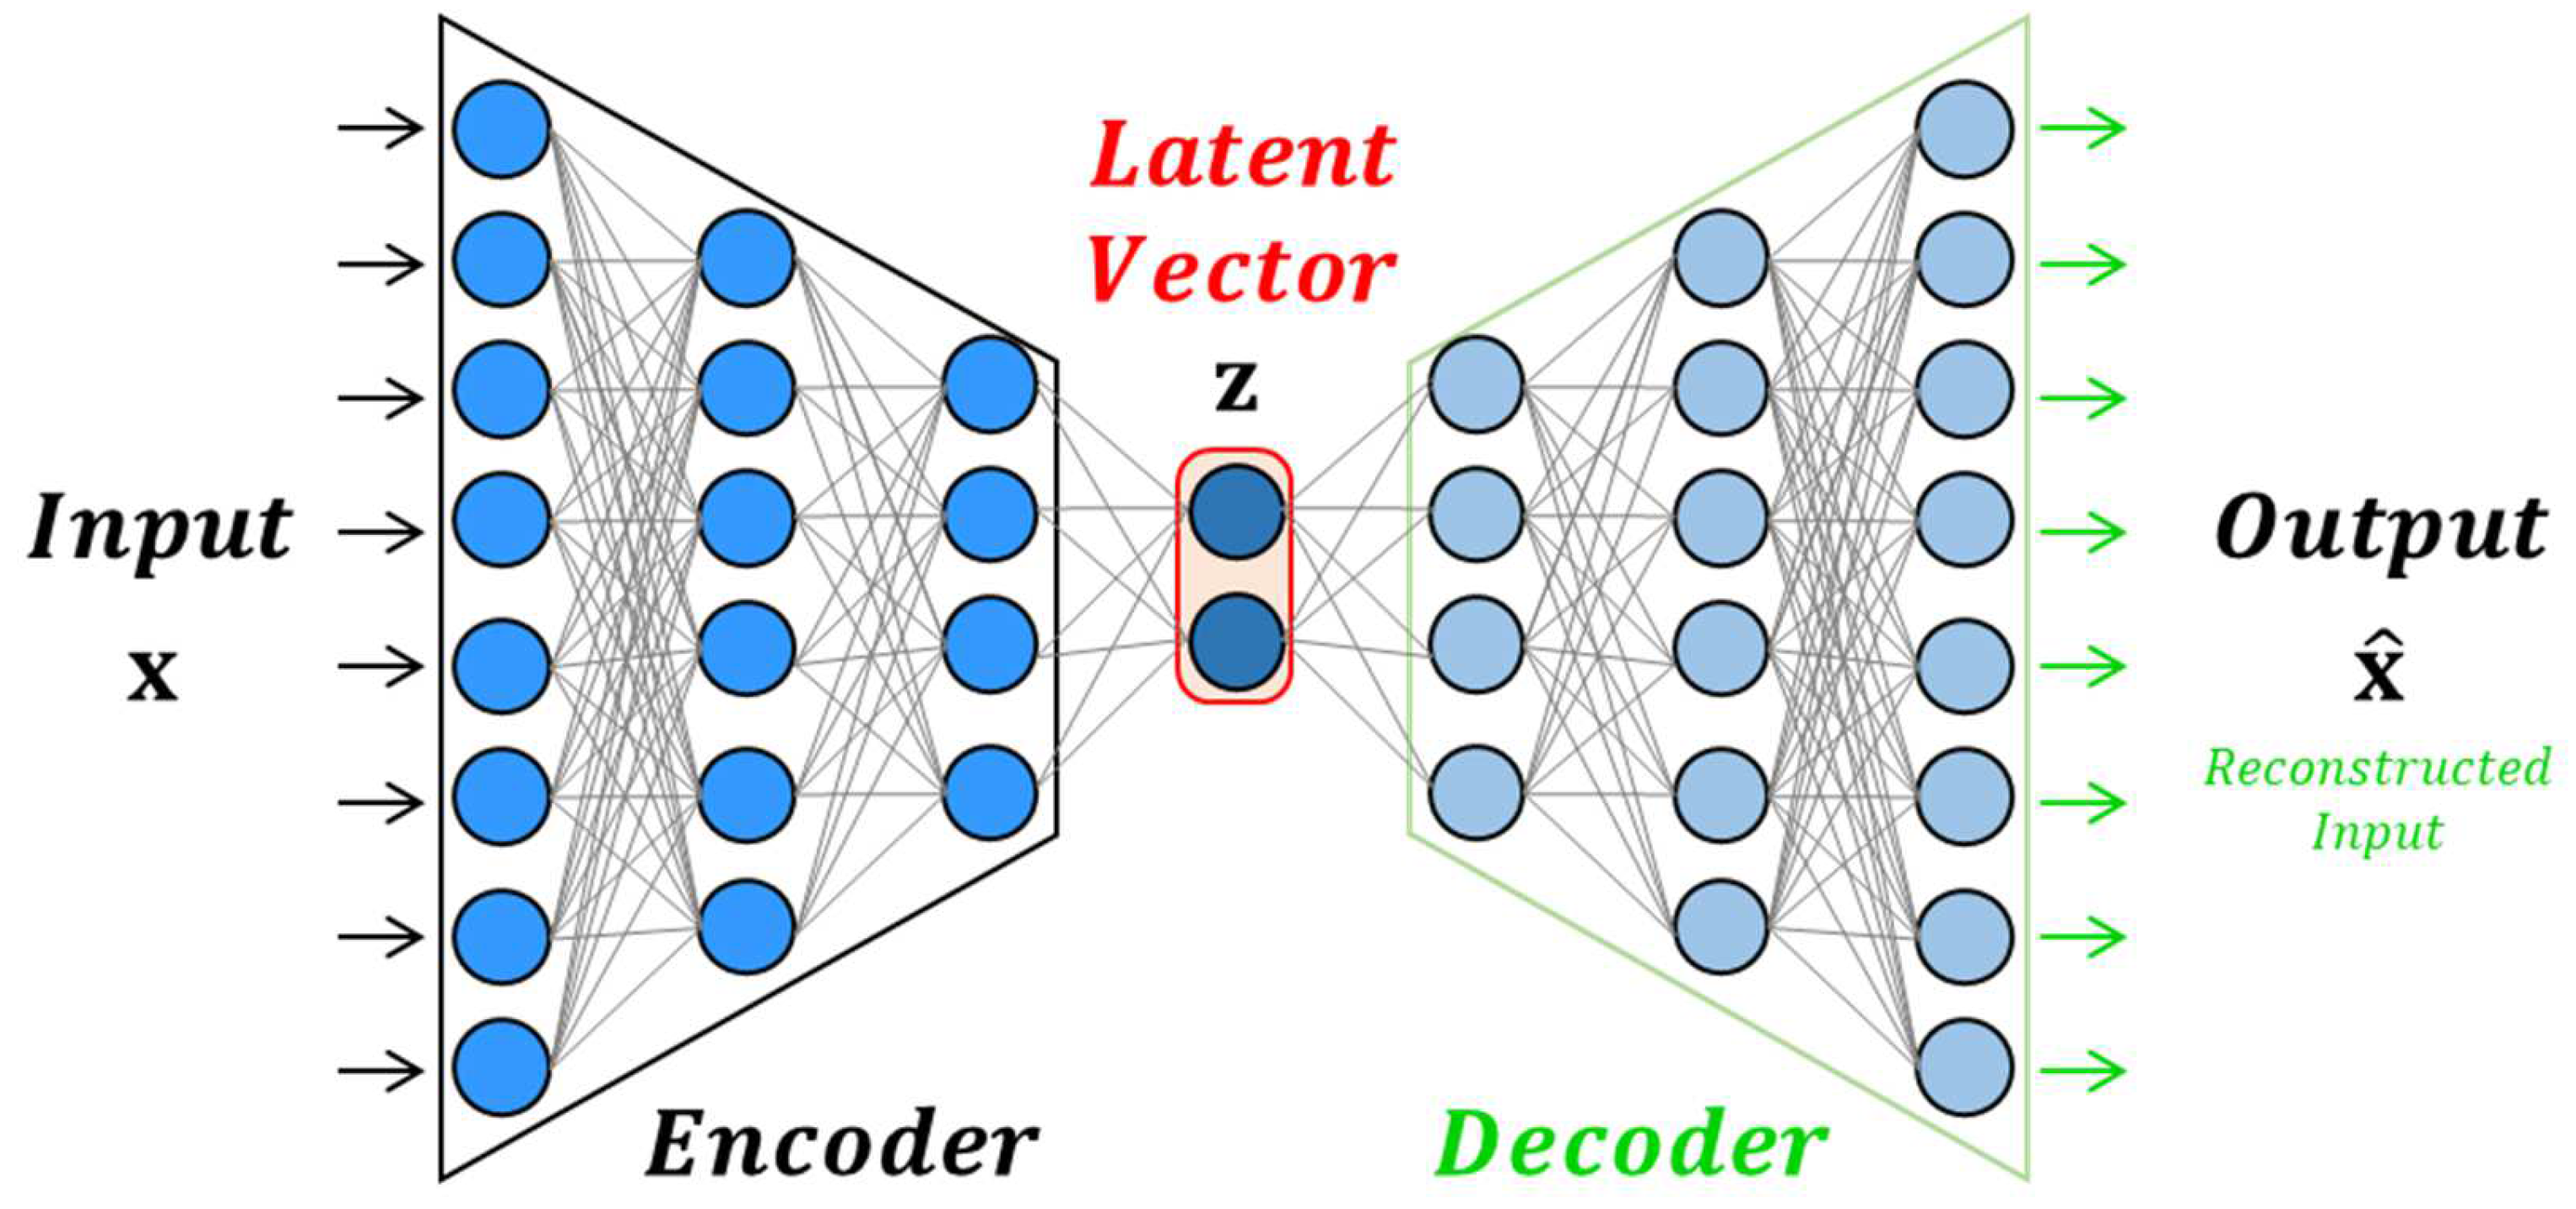
The autoencoder consists of two main components: an encoder that compresses the input vector into a lower-dimensional latent vector and a decoder that reconstructs the original input from this latent vector [17,19]. The overall structure of the autoencoder is shown in Figure 1. This architecture has been widely applied in domains such as fault diagnosis, process monitoring, and signal compression in manufacturing systems [13,18].
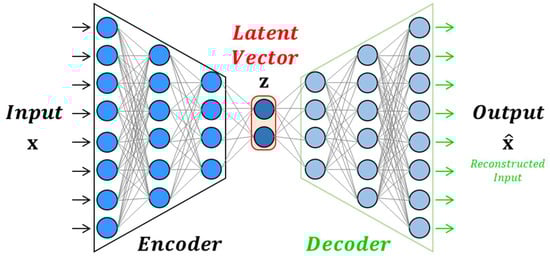
Figure 1.
Overall architecture of the autoencoder.
The encoding and decoding operations are defined mathematically as:
where is the input vector, is the latent vector and denotes the reconstructed input vector. , , and , represent the weights and biases of the encoder and decoder, respectively. The function σ(⋅) is a nonlinear activation function.
2.2. Design of Autoencoder for Latent Vector Extraction of Cutting Force
To estimate cutting forces in real time, the model utilizes a time-series input vector segmented over a fixed-duration window. In this study, the sampling rate for cutting force signals was set to 2.5 kHz, a widely adopted standard in machining applications and commercial dynamometer systems. This sampling frequency supports accurate signal representation up to 250 Hz, sufficiently covering the dominant frequency range of cutting dynamics. While the Nyquist criterion provides a theoretical minimum, prior studies have emphasized that oversampling by a factor of 4–10 is often necessary to reliably capture envelope modulations and transient behaviors inherent in force signals. To define the temporal extent of the input segment, the dominant cutting frequency was assumed to be approximately 20 Hz, corresponding to one full revolution of the spindle. Accordingly, a 50-millisecond input window was selected, ensuring that each segment contains at least one full tool engagement cycle. This duration captures the periodic characteristics of the cutting process and guarantees the presence of signal features from all tool flutes within each input vector.
At the selected sampling rate, the 50 ms vector includes 125 samples for the cutting force in the x-direction () and 125 samples for the y-direction (), resulting in a 250-dimensional input vector. To incorporate process-specific context into the input data, the force signal was augmented with three additional condition variables: material type, cutting speed, and cutting direction. These machining parameters were encoded and concatenated with the time-series force data to form a 253-dimensional condition-aware input vector. By embedding these features directly into the input, the model is enabled to learn force patterns that are sensitive to variations in operating conditions, thereby enhancing its generalization capability across different cutting scenarios. To understand the underlying dynamics of the cutting force signal, a deep autoencoder was designed with three hidden layers in both the encoder and decoder. The 253-dimensional input vector is progressively compressed to a 64-dimensional latent vector (). This architecture follows previous studies demonstrating that deep and denoising autoencoders are effective in capturing latent features in machining-related time-series signals [17].
The encoder utilizes LeakyReLU, ReLU, and Tanh activation functions, and a dropout rate of 0.5 is applied after the first layer to prevent overfitting. Expanding the input dimension from 253 to 512 in the first encoder layer, followed by dropout, is intended to enhance model robustness under diverse conditions. The decoder mirrors the encoder structure to reconstruct the signal from the latent representation. The detailed layer configuration of the autoencoder used for cutting force signal reconstruction is summarized in Table 1.

Table 1.
Layer configuration of the autoencoder for cutting force.
The encoder and decoder operations for a cutting force signal are defined as follows:
The decoder operation for reconstructing is defined by the following Equation (4):
where is the original cutting force signal, is the reconstructed output, and is the latent vector of the cutting force.
To ensure numerical stability during training, the input force signal is normalized to the range [−1, 1] as follows:
The model is trained by minimizing the mean squared error (MSE) between the input signal and its reconstruction:
where N is the number of training samples. The latent vector generated by this autoencoder serves as the target in the subsequent model that estimates cutting forces from vibration data [13,15].
3. Spindle Vibration-Based Cutting Force Estimation
This section presents the second stage of the proposed cutting force estimation framework, focusing on the training of a target encoder that maps spindle vibration signals into the latent feature space learned by the autoencoder. As a prerequisite to this step, appropriate preprocessing of the vibration signals is required to ensure that the input data reflect cutting-related characteristics and do not introduce noise or irrelevant variations into the learning process. The following subsection outlines the preprocessing methodology applied to the vibration signals.
3.1. Spindle Vibration Signal Preprocessing
Spindle vibration signals contain a complex mixture of dynamic components arising from various sources, including tool–workpiece interaction, structural resonance, spindle rotation, and environmental disturbances. A structured preprocessing strategy was applied to isolate the signal components that are closely related to cutting force generation. The purpose of this stage is to extract only those signal features that are representative of cutting conditions, thereby improving the quality of learning in the subsequent model. The overall procedure is summarized in Figure 2.
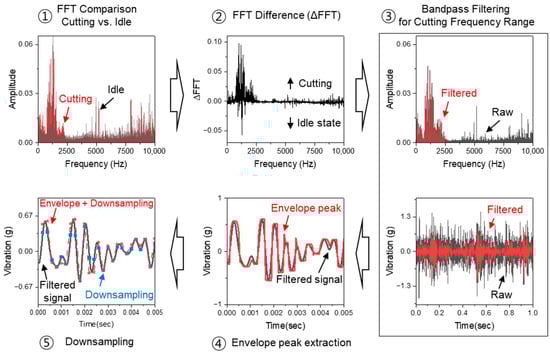
Figure 2.
Preprocessing stages for extracting and compressing cutting signals from spindle vibration data.
Since cutting forces are generated exclusively during material engagement, it is reasonable to assume that cutting-related features are embedded in the spindle vibration signal primarily during cutting states, and not during idle operation. Therefore, a frequency-domain comparison was conducted between cutting and idle vibration signals to identify spectral bands that are dominant during cutting. The difference between their FFT spectra (ΔFFT) was used to focus the analysis on frequency components uniquely present or amplified in the cutting state, while suppressing those originating from idle conditions or background noise. To extract meaningful features within this target frequency band, high-resolution signal acquisition is required. However, while high sampling rates help capture fine-grained signal information, they also result in large input dimensions, increasing the complexity and computational cost of the learning model.
Moreover, the frequency range of interest in cutting-related vibration is generally lower than the raw sampling rate, suggesting that downsampling can be applied without losing critical information, provided it is done carefully. Direct downsampling of raw vibration signals, however, may result in loss or distortion of important frequency and amplitude components, especially in transient-rich signals like those observed during machining. To address this, the proposed method introduces an envelope-based peak extraction step before downsampling. Instead of directly reducing the sampling rate, the vibration signal is first processed through envelope detection, which captures amplitude modulations corresponding to periodic force events. Then, peak values within each target window are extracted and used to form a lower-resolution signal. This approach minimizes the potential loss of critical information during downsampling while significantly reducing the input size used for learning. By focusing on machining-dominant frequency bands and reducing data dimensionality through envelope-based signal compression, the proposed preprocessing stages ensure that the final input vector is both compact and highly informative. This refined signal representation improves the model’s ability to learn cutting force dynamics while maintaining computational efficiency and serves as the input to the target encoder network described in the following section.
3.2. Design of the Target Encoder
The input vector is constructed from time-series vibration signals acquired by a tri-axial accelerometer mounted on the spindle. Based on the preprocessing procedure described in Section 3.1, the raw vibration data were signal-conditioned and uniformly resampled at 5 kHz, which was selected as the input resolution for this study. Consistent with the cutting force autoencoder input design, a 50-millisecond window is used to define each input vector. At this sampling rate, 250 samples are obtained per axis (, and ), resulting in a 750-dimensional input vector that captures a complete time segment of vibration signals. In addition, three condition labels—material type, cutting speed, and cutting direction—are encoded using the same method adopted during the autoencoder training stage and concatenated to the vibration signal vector. This results in a 753-dimensional condition-aware input vector. This input configuration allows the model to learn a condition-aware representation that aligns with the latent cutting force space and supports generalization under multi-condition settings [14,23].
The target encoder adopts a network configuration analogous to the encoder described in Section 2.2 but is extended to include four hidden layers instead of three to accommodate the increased dimensionality of the input vector. It maps the 753-dimensional input vector into a 64-dimensional latent vector () through a sequence of fully connected layers with decreasing dimensionality. This architecture facilitates effective feature projection from the vibration signal domain into the latent space previously learned from cutting force data, enabling supervised alignment in the latent representation space. The network architecture includes four hidden layers with decreasing dimensions: 1024 → 512 → 256 → 128 → 64. Each hidden layer employs nonlinear activation functions—LeakyReLU, Tanh, and ReLU—to preserve nonlinearity and signal diversity. To prevent overfitting, a dropout layer with a rate of 0.3 is applied after the first hidden layer. The detailed layer configuration of the target encoder used for cutting force estimation based on latent vector alignment is summarized in Table 2.
Table 2.
Layer configuration of the target encoder for latent vector alignment.
The final output of the network () is designed to match the structure of the latent vector () obtained from the autoencoder. This design enables latent-level alignment between the force-based and vibration-based models, supporting transfer learning by using supervised alignment in the latent space.
4. Evaluation of Cutting Force Estimation Performance
4.1. Experimental Setup and Data Acquisition
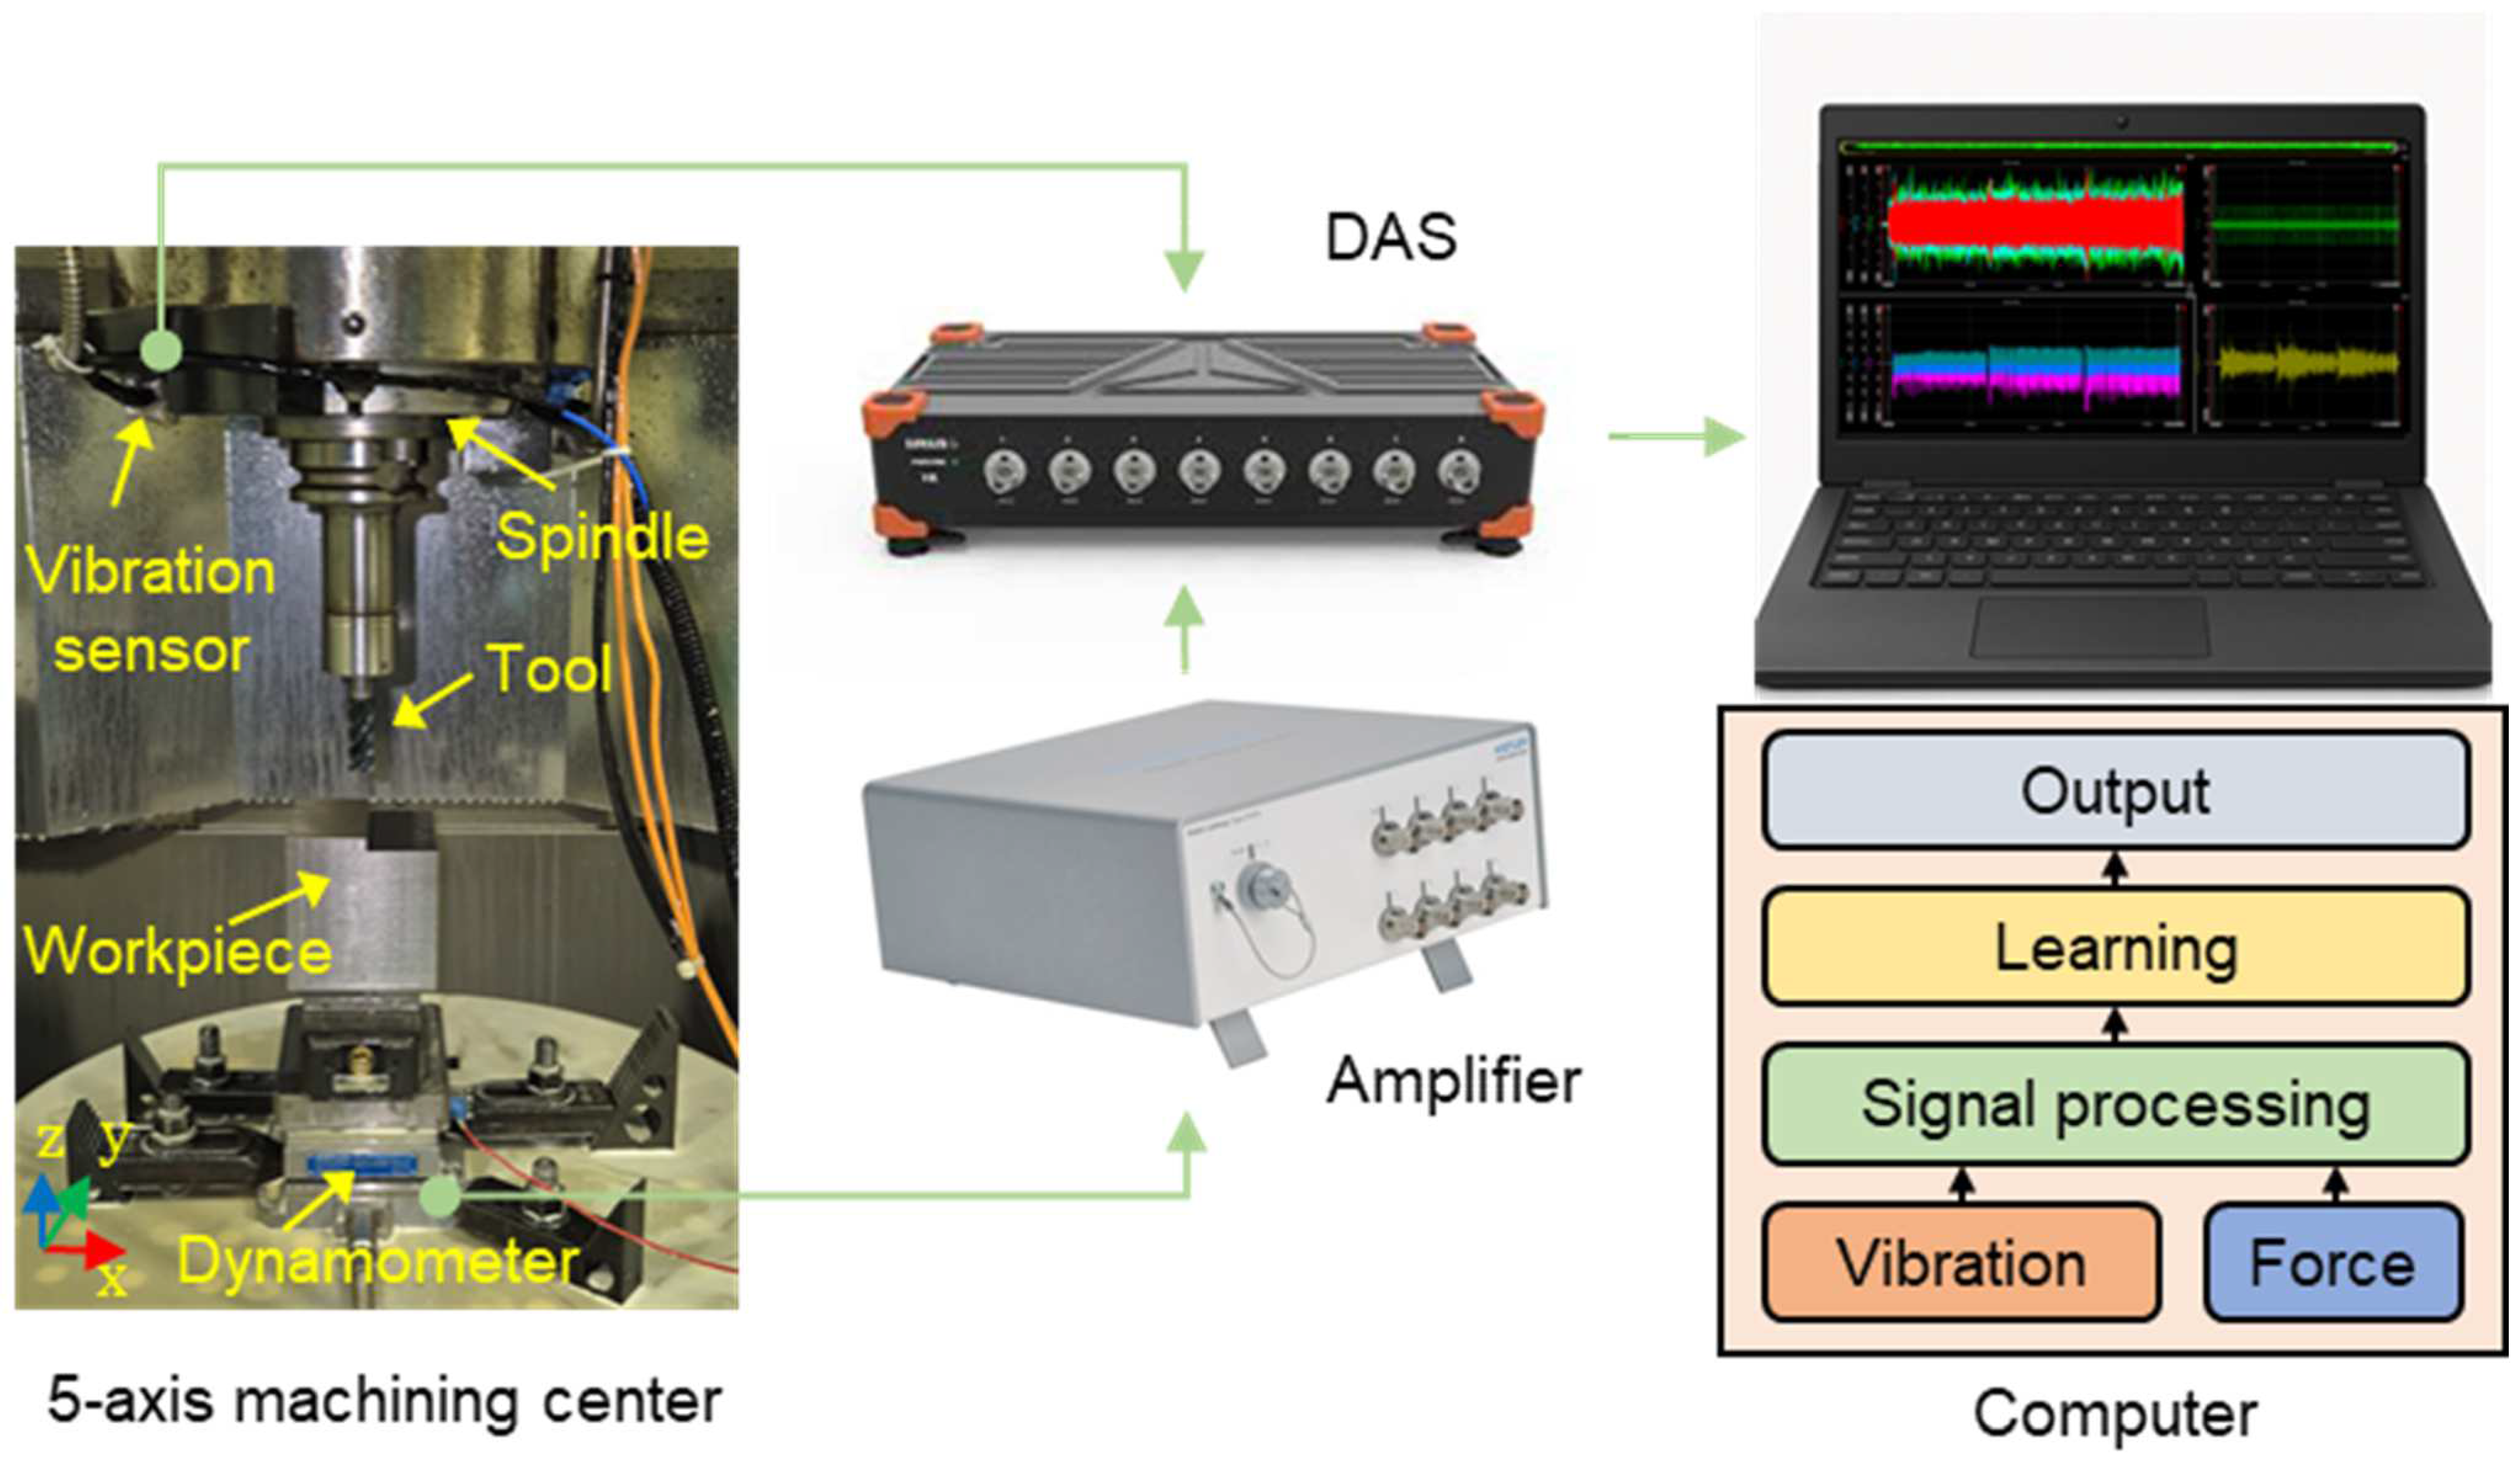
To evaluate the performance of the proposed model, a series of milling experiments were conducted using a five-axis vertical machining center (Mytrunnion-5G, Kitamura, Tokyo, Japan). The experimental setup, shown in Figure 3, presents the sensor placement within the five-axis machining center along with the overall signal acquisition and processing architecture. This includes the connections from each sensor to the charge amplifier, the data acquisition system (DAS), and the computing unit responsible for signal processing. Cutting force signals were measured using a dynamometer (9257B, Kistler, Winterthur, Switzerland) connected to a charge amplifier (5167A81, Kistler), while vibration signals were measured using a tri-axial accelerometer (356A15, PCB, Hornsby, NSW, Australia) mounted on the spindle housing. All sensor outputs were routed through the DAS (SIRIUS-HS-8xACC, DEWESoft, Trbovlje, Slovenia), which digitized the analog signals at 16-bit resolution to ensure high fidelity for downstream analysis.
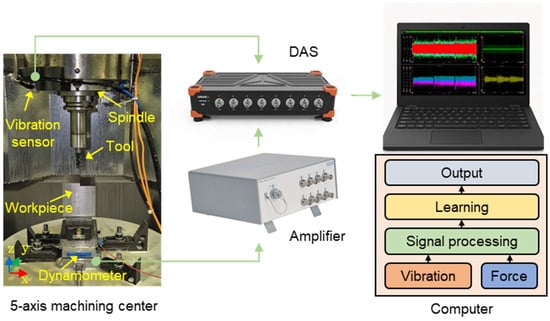
Figure 3.
Experimental setup for cutting force and vibration signal acquisition.
The measurement specifications for the sensors and data acquisition system are summarized in Table 3, including measurement ranges, sensitivities, and sampling frequencies. Cutting force signals were sampled at 2.5 kHz in accordance with standard dynamometer configurations, and vibration signals were sampled at 20 kHz to capture high-frequency content relevant to tool–workpiece interaction dynamics.
Table 3.
Specifications of sensors and data acquisition (DAQ) system.
To validate the model’s generalization capability across diverse process scenarios, two workpiece materials with distinctly different machining behaviors were selected: Ti-6Al-4V, a high-strength titanium alloy known for its low thermal conductivity and poor machinability, and STS316L, austenitic stainless steel with excellent ductility and corrosion resistance, but moderate cutting resistance. The contrasting properties of these materials—particularly in terms of strength, elongation, and thermal behavior—offer a meaningful basis for assessing the robustness of the proposed estimation approach under variable cutting conditions. The properties of both materials are summarized in Table 4.
Table 4.
Properties of the workpiece materials.
To validate the model’s generalization capability across diverse process scenarios, four cutting conditions were defined by varying the workpiece material (Ti-6Al-4V and STS316L), spindle speed (1220 and 2440 rpm), and cutting direction (Y+ and Y−). The feed rate () was fixed at 585 mm/min, and the axial () and radial () depths of cut were set to 3 mm and 1.2 mm, respectively. These configurations are summarized in Table 5, which presents the specific combinations of machining parameters for evaluating the model under normal cutting conditions. In addition to validating the model’s performance under nominal conditions, its robustness under abnormal force conditions was also investigated. For this purpose, two additional cases (Cases 5 and 6) were introduced using Ti-6Al-4V as the workpiece material, where a thin wall geometry (0.7 mm thickness, 9 mm height) was embedded in the center of the toolpath. This artificial geometric feature was designed to induce a localized and transient increase in cutting force during tool engagement. All other cutting parameters were kept consistent with those of the normal conditions to ensure fair comparison. These cases were used to evaluate the model’s ability to estimate cutting forces under nonstationary and dynamically varying conditions and are categorized as abnormal conditions in this study.
Table 5.
Experimental cutting conditions.
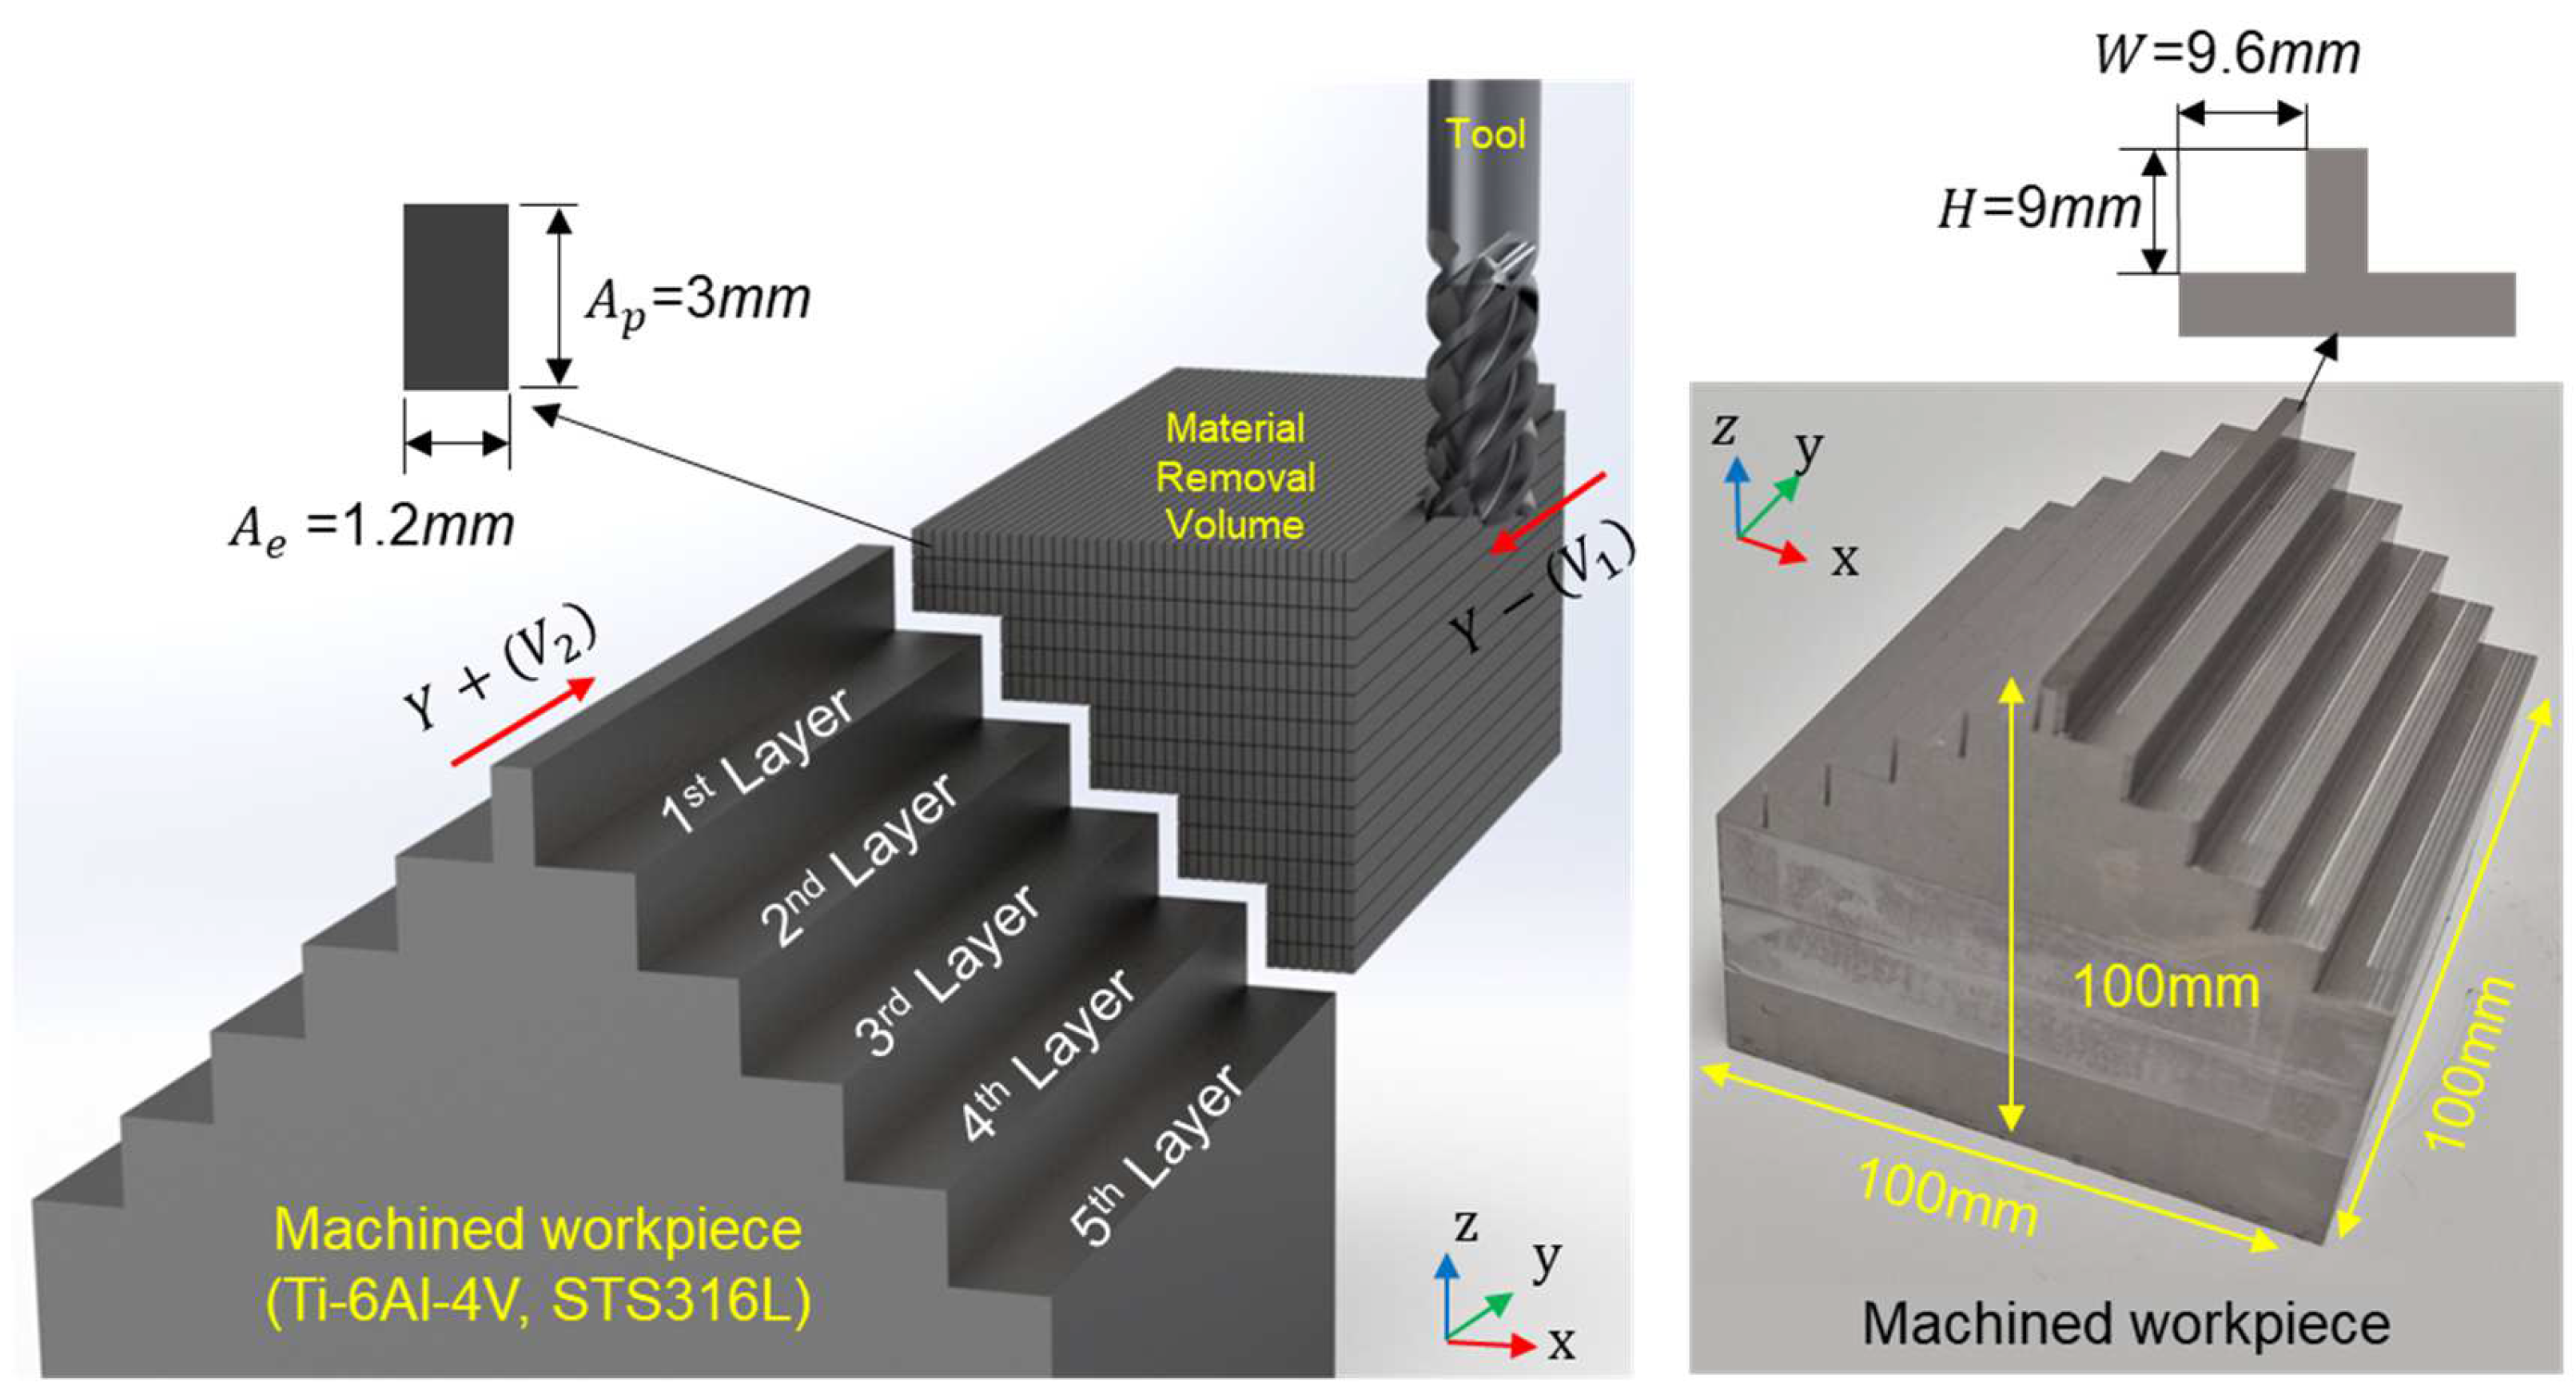
Figure 4 shows the multi-step cutting path and corresponding machined geometry used in the experiments. The toolpath was designed to generate a five-layer stair-shaped profile, visualizing the material removal process rather than simulating various cutting engagement scenarios. This machined shape was identically applied to both Ti-6Al-4V and STS316L workpieces to ensure consistent geometric conditions across material types. Each workpiece was processed symmetrically, where the right side was machined in the Y− direction at cutting speed and the left side in the Y+ direction at a higher cutting speed . This configuration allowed for comparative analysis under mirrored tool trajectories and speed conditions within a single workpiece.

Figure 4.
Machining strategy and resulting multi-layer step geometry of the workpiece.
4.2. Cutting Force Reconstruction Using Autoencoder
The performance of the autoencoder was evaluated by measuring how accurately it could reconstruct the input cutting force signals. A total of 478,995 samples were collected across all six experimental cases (Cases 1–6), with 80% used for training and 20% for validation. Each sample consisted of a 50 ms segment of vibration input and the corresponding 50 ms time series of cutting force output. To ensure data diversity and prevent information leakage, the dataset was randomly shuffled across all cases prior to being split into training and validation sets in an 8:2 ratio. Each input vector consisted of 125 time-domain samples for both and , forming a 250-dimensional vector. All inputs were normalized prior to training. The encoder and decoder for cutting force reconstruction were trained using the hyperparameter settings summarized in Table 6.
Table 6.
Training Hyperparameters.
The reconstruction quality was assessed using the Pearson Correlation Coefficient (PCC), which quantifies the linear correlation between the original and reconstructed signals.
The model’s reconstruction accuracy was evaluated using PCC( defined as:
where and denote the individual observations of variables and , respectively; and represent their respective mean values; and is the total number of paired observations. The coefficient quantifies the strength and direction of the linear relationship between and , ranging from −1 (perfect negative correlation) to +1 (perfect positive correlation), with 0 indicating no linear correlation. For each case, PCC values were calculated for individual data samples, and their mean and standard deviation were used to represent the overall estimation performance.
The results are shown in Table 7, which lists PCC values for both force components across all experimental conditions.
Table 7.
Autoencoder-based reconstruction performance (PCC values).
The average PCC across all conditions was 0.9803 for and 0.9625 for , indicating strong reconstruction capability. Notably, the performance under STS316 conditions (Case 3 and Case 4) was particularly high, with PCC values exceeding 0.99 for , suggesting the autoencoder effectively captured the consistent temporal patterns observed in this material.
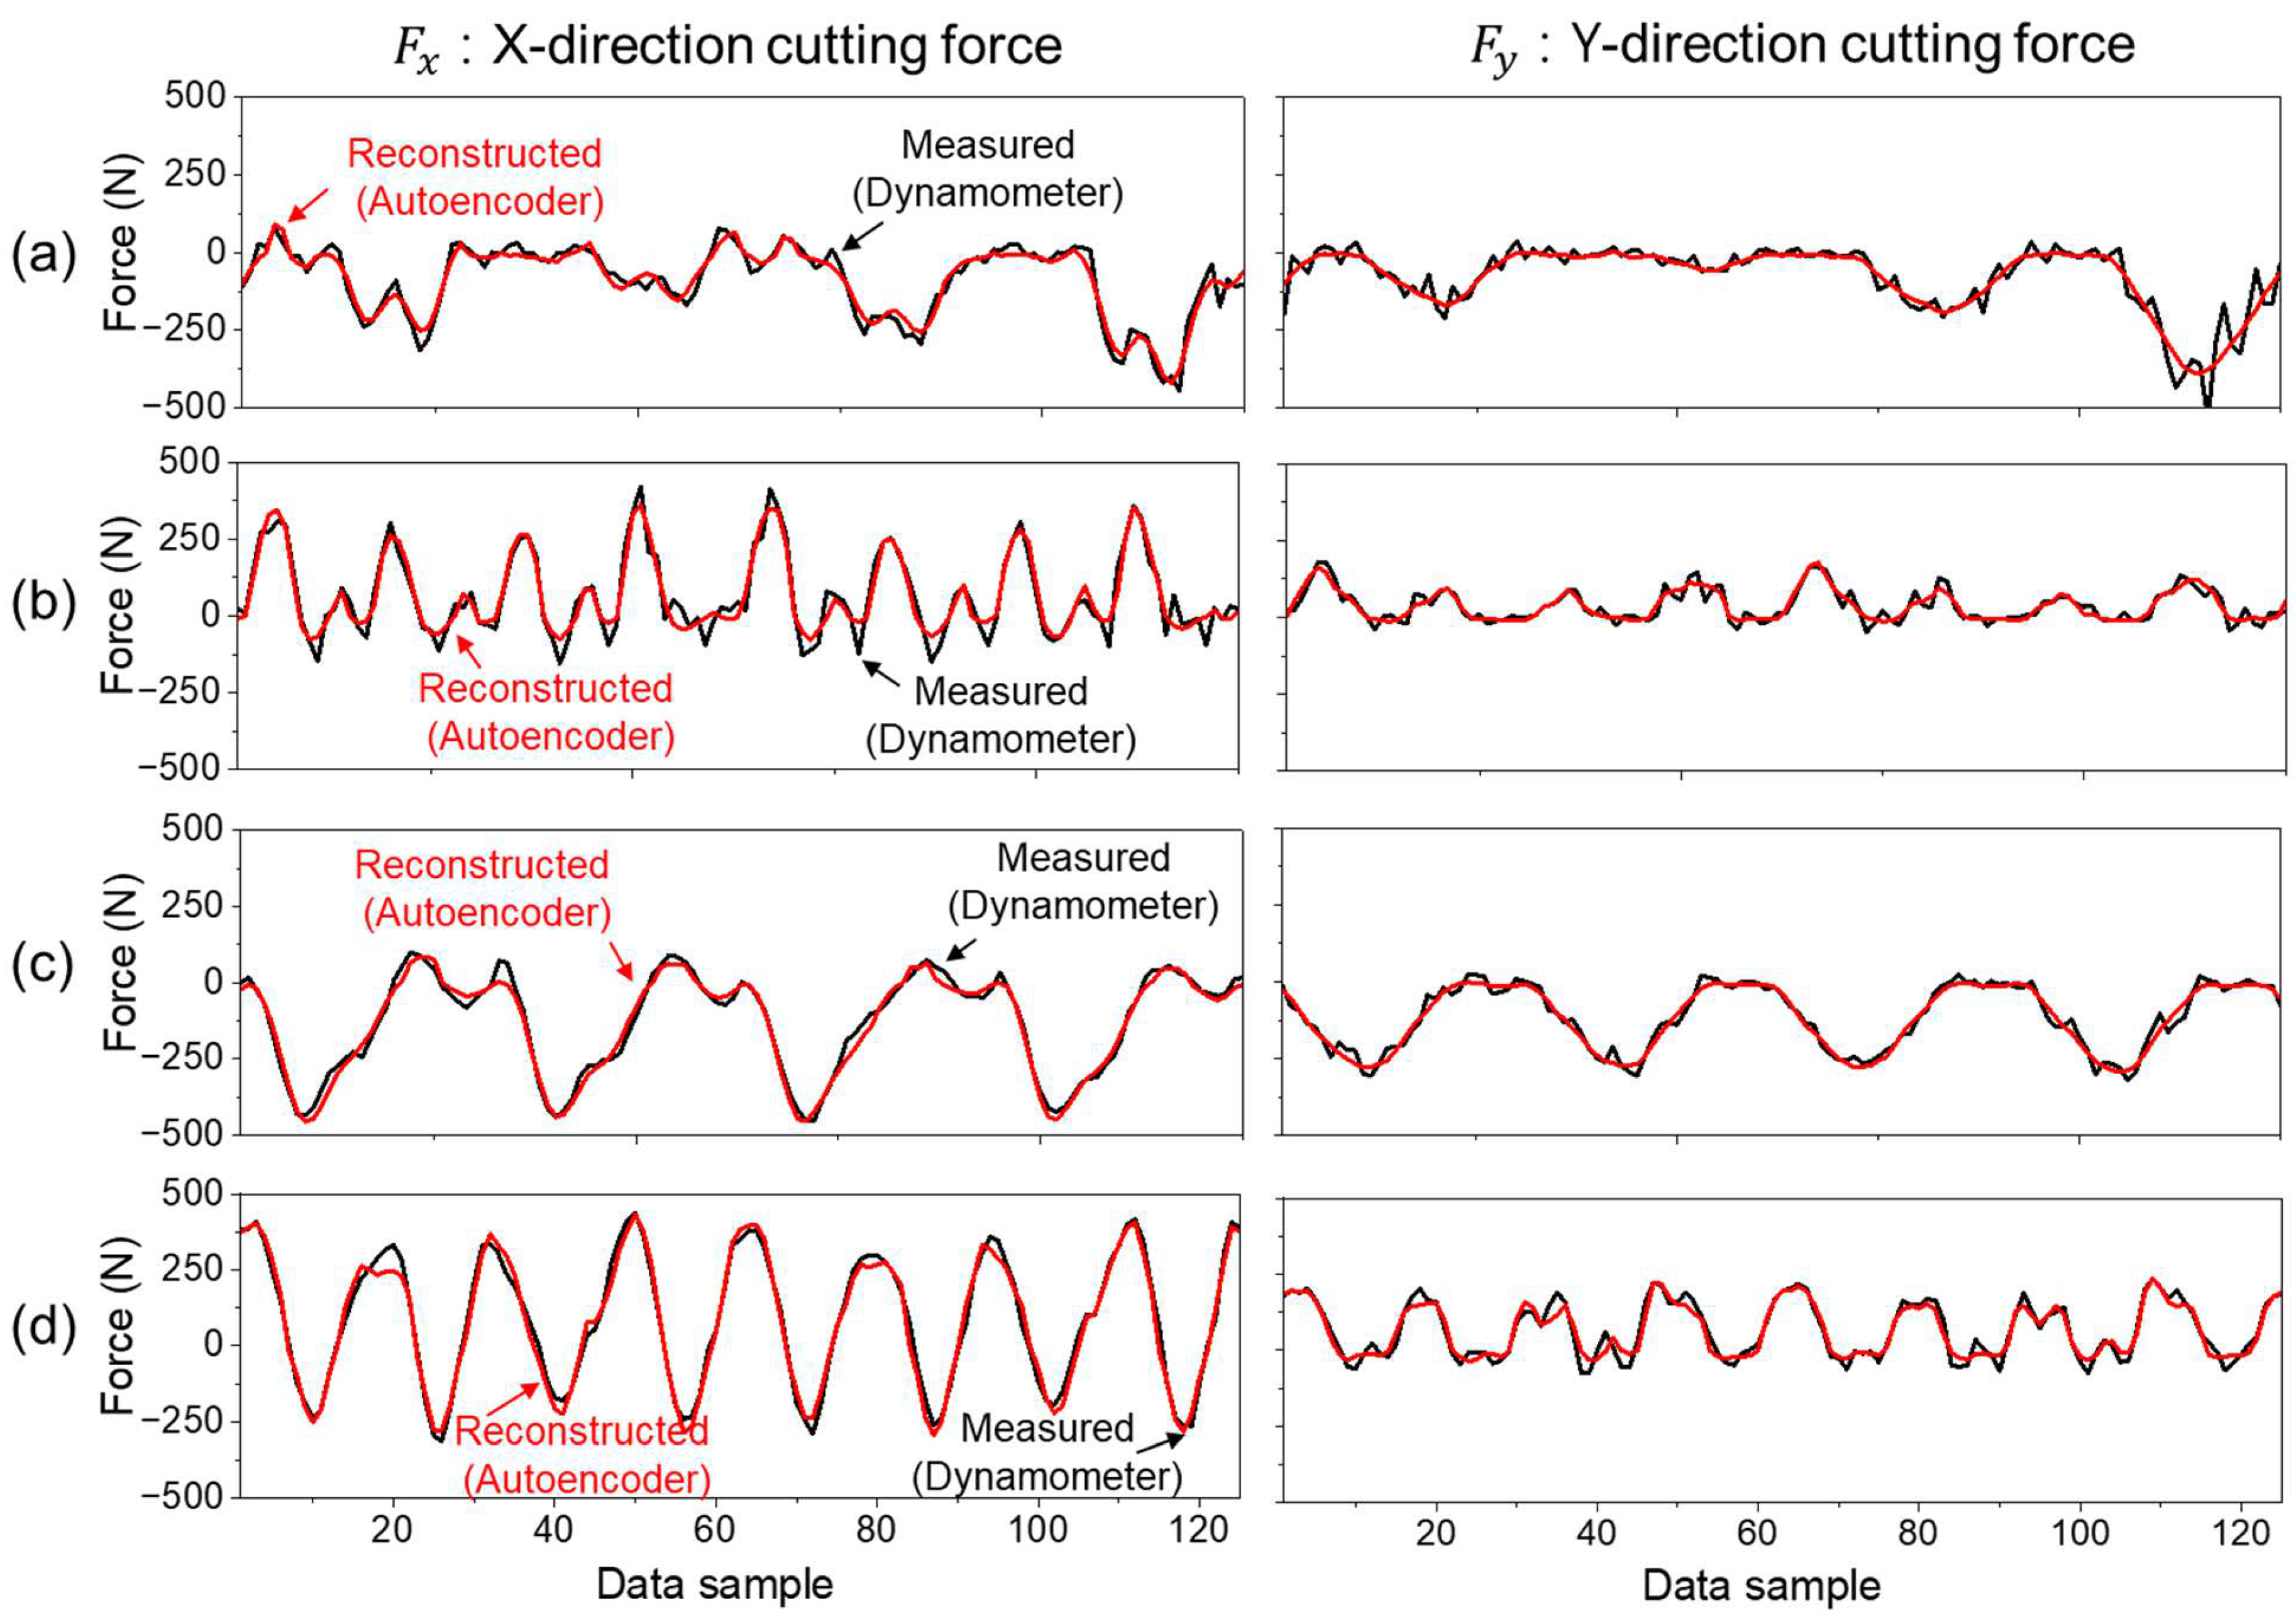
Table 6 shows the reconstruction accuracy achieved by the autoencoder across each machining condition. The reconstructed waveforms for a representative case are shown in Figure 5, which demonstrates that the autoencoder preserves both amplitude and temporal structure with high fidelity.

Figure 5.
Reconstruction performance of cutting force components and using the autoencoder under four cutting conditions: (a) Case 1—Ti-6Al-4V, cutting speed = 46 m/min. (b) Case 2—Ti-6Al-4V, cutting speed = 92 m/min. (c) Case 3—STS316L, cutting speed = 46 m/min. (d) Case 4—STS316L, cutting speed = 92 m/min.
4.3. Evaluation of Target Encoder Performance with Vibration Signals
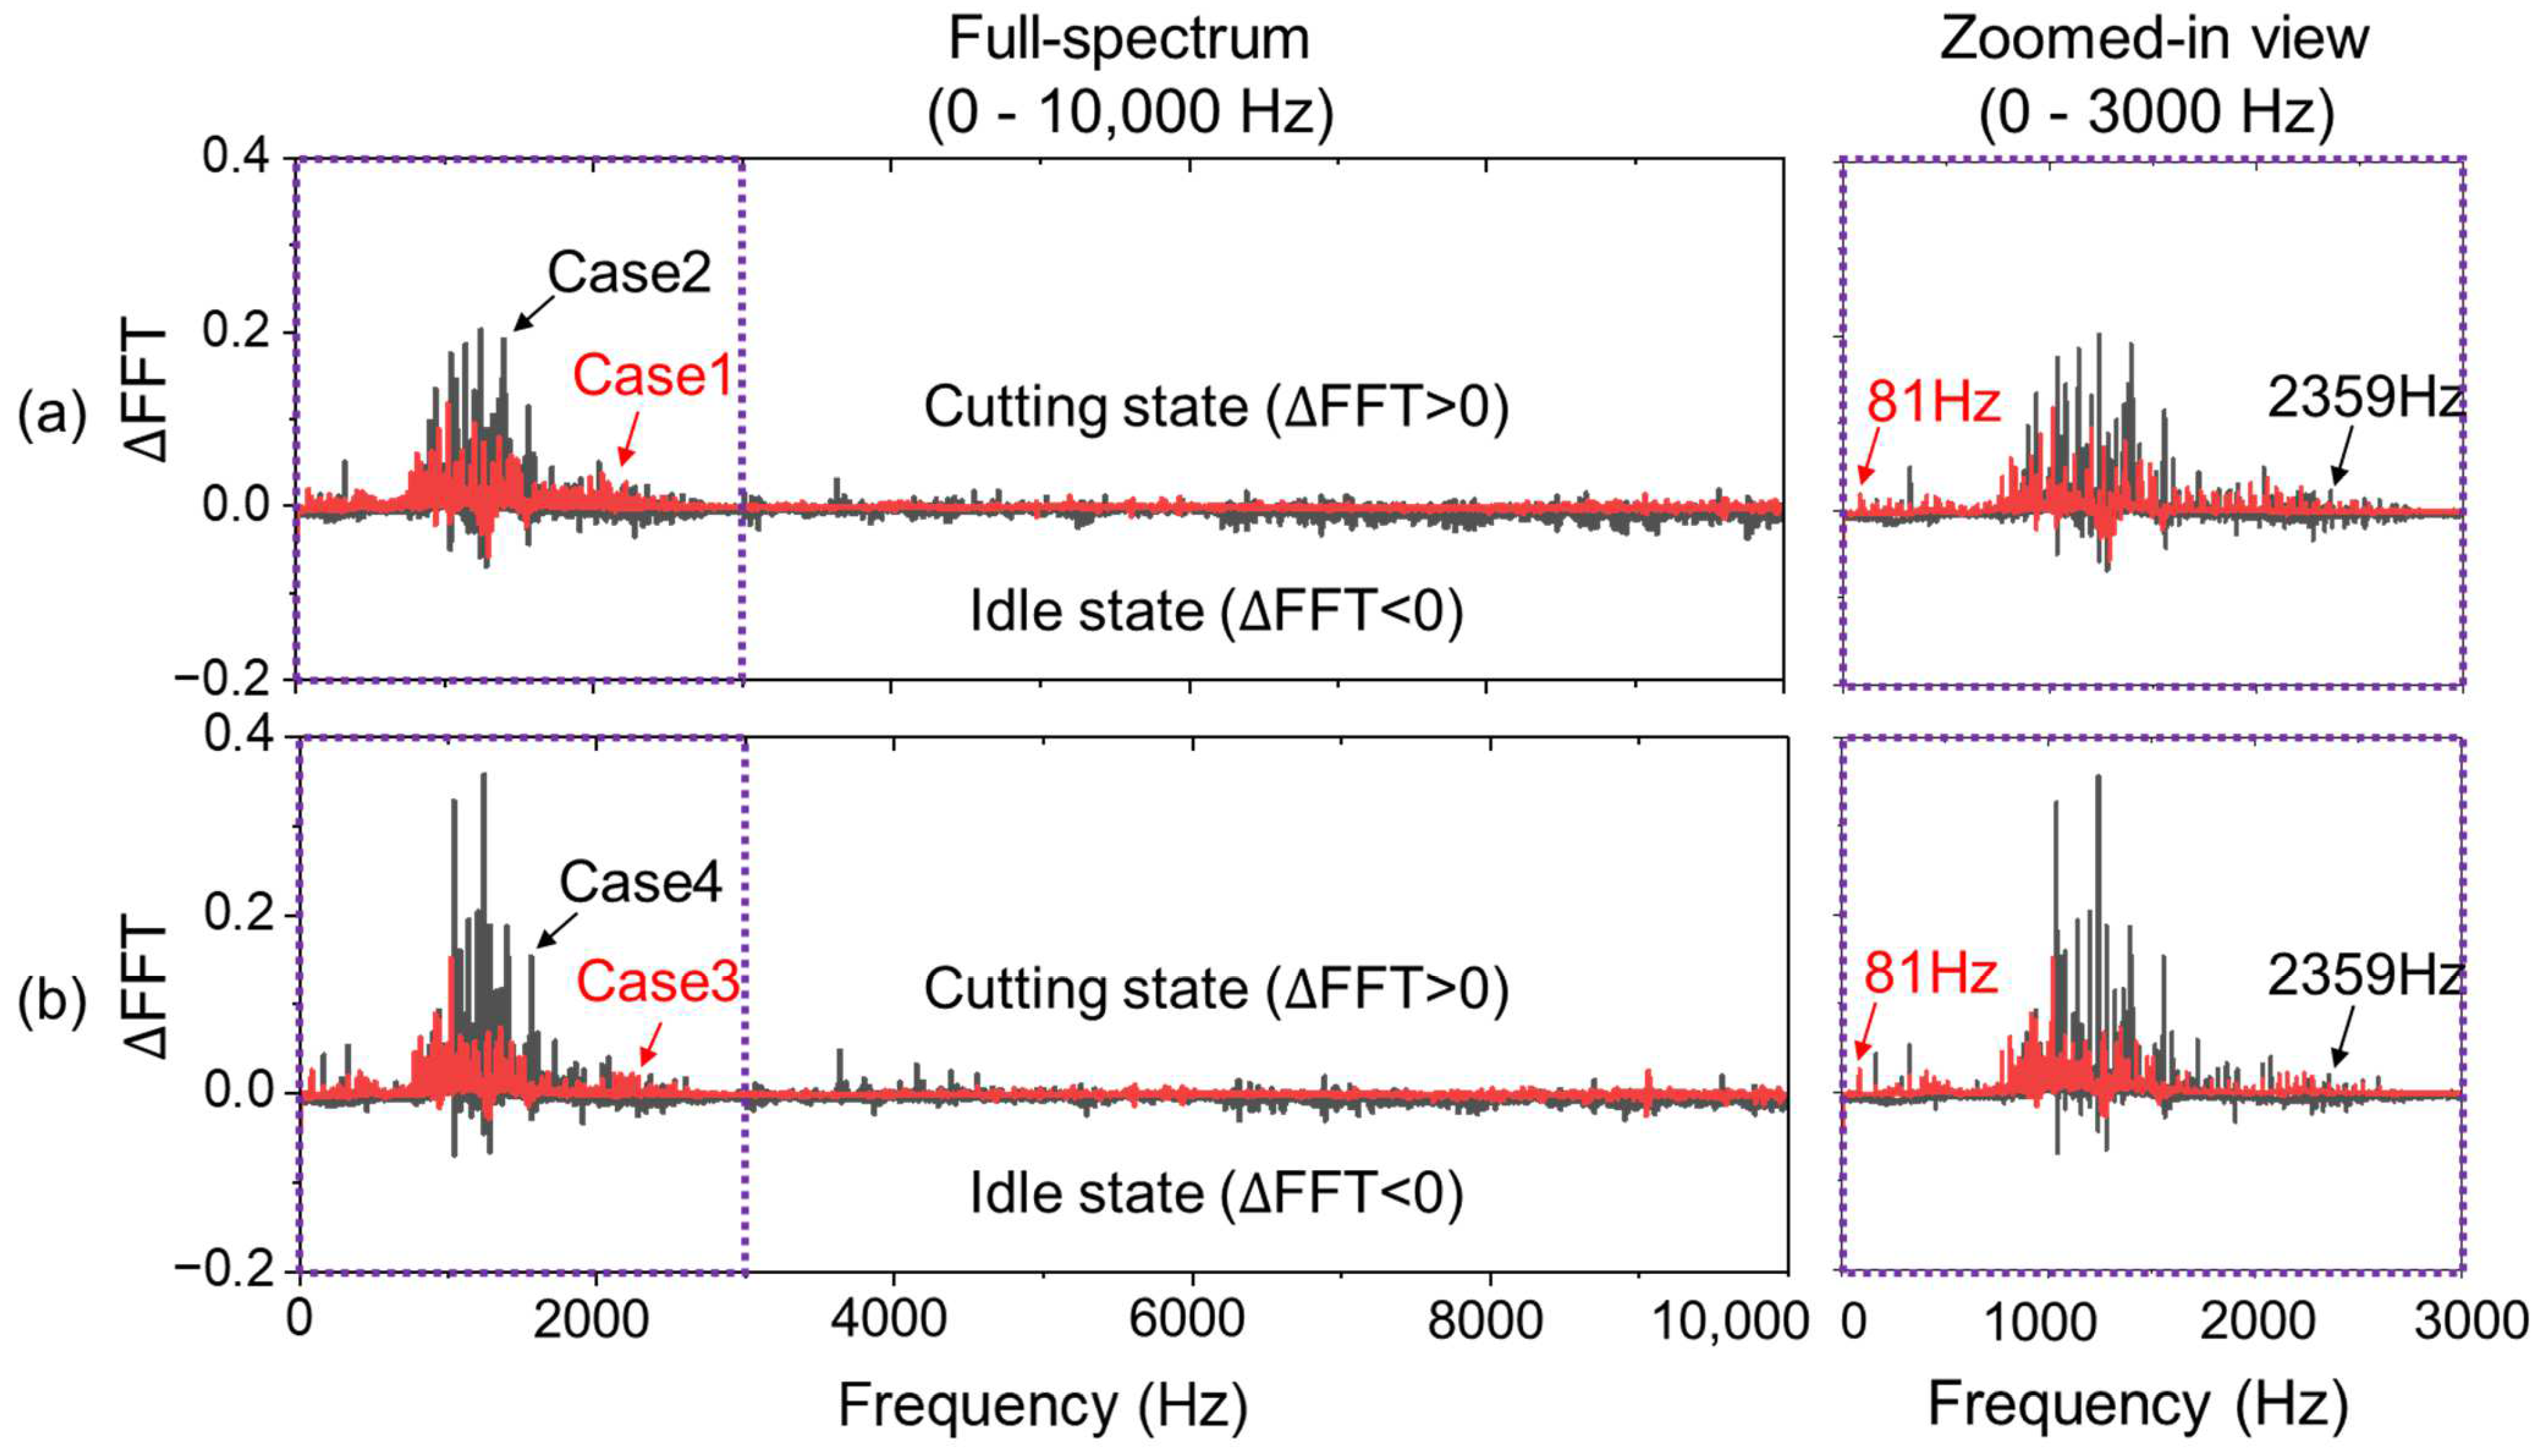
The performance of the target encoder was evaluated by analyzing its ability to reconstruct cutting force signals using only vibration inputs. To enhance signal quality and emphasize cutting-related features, a series of signal processing steps were applied to the raw vibration data prior to input vector construction. As shown in Figure 6, a spectral analysis was performed by computing the FFT difference (ΔFFT) between the vibration signals measured during cutting and idle states. This differential spectrum highlights frequency components that are dominant under cutting conditions, where positive ΔFFT values represent increased amplitude during cutting, and negative values indicate frequencies more active during idle operation. The analysis revealed that most cutting-related frequency content is concentrated within the 81–2359 Hz range. Based on this observation, a finite impulse response (FIR) bandpass filter was applied with a passband of 20–2500 Hz to retain the relevant frequency components while suppressing low-frequency drift and high-frequency noise. The passband was slightly extended beyond the observed range to prevent attenuation near the frequency boundaries due to the filter’s transition band.

Figure 6.
Comparison of spindle vibration frequency spectra between cutting and idle states using FFT difference (ΔFFT). A consistent cutting-dominant frequency band is observed in the range of 81–2359 Hz across all cutting conditions: (a) Case 1 and Case 2—Ti-6Al-4V at 46 m/min and 92 m/min. (b) Case 3 and Case 4—STS316L at 46 m/min and 92 m/min.
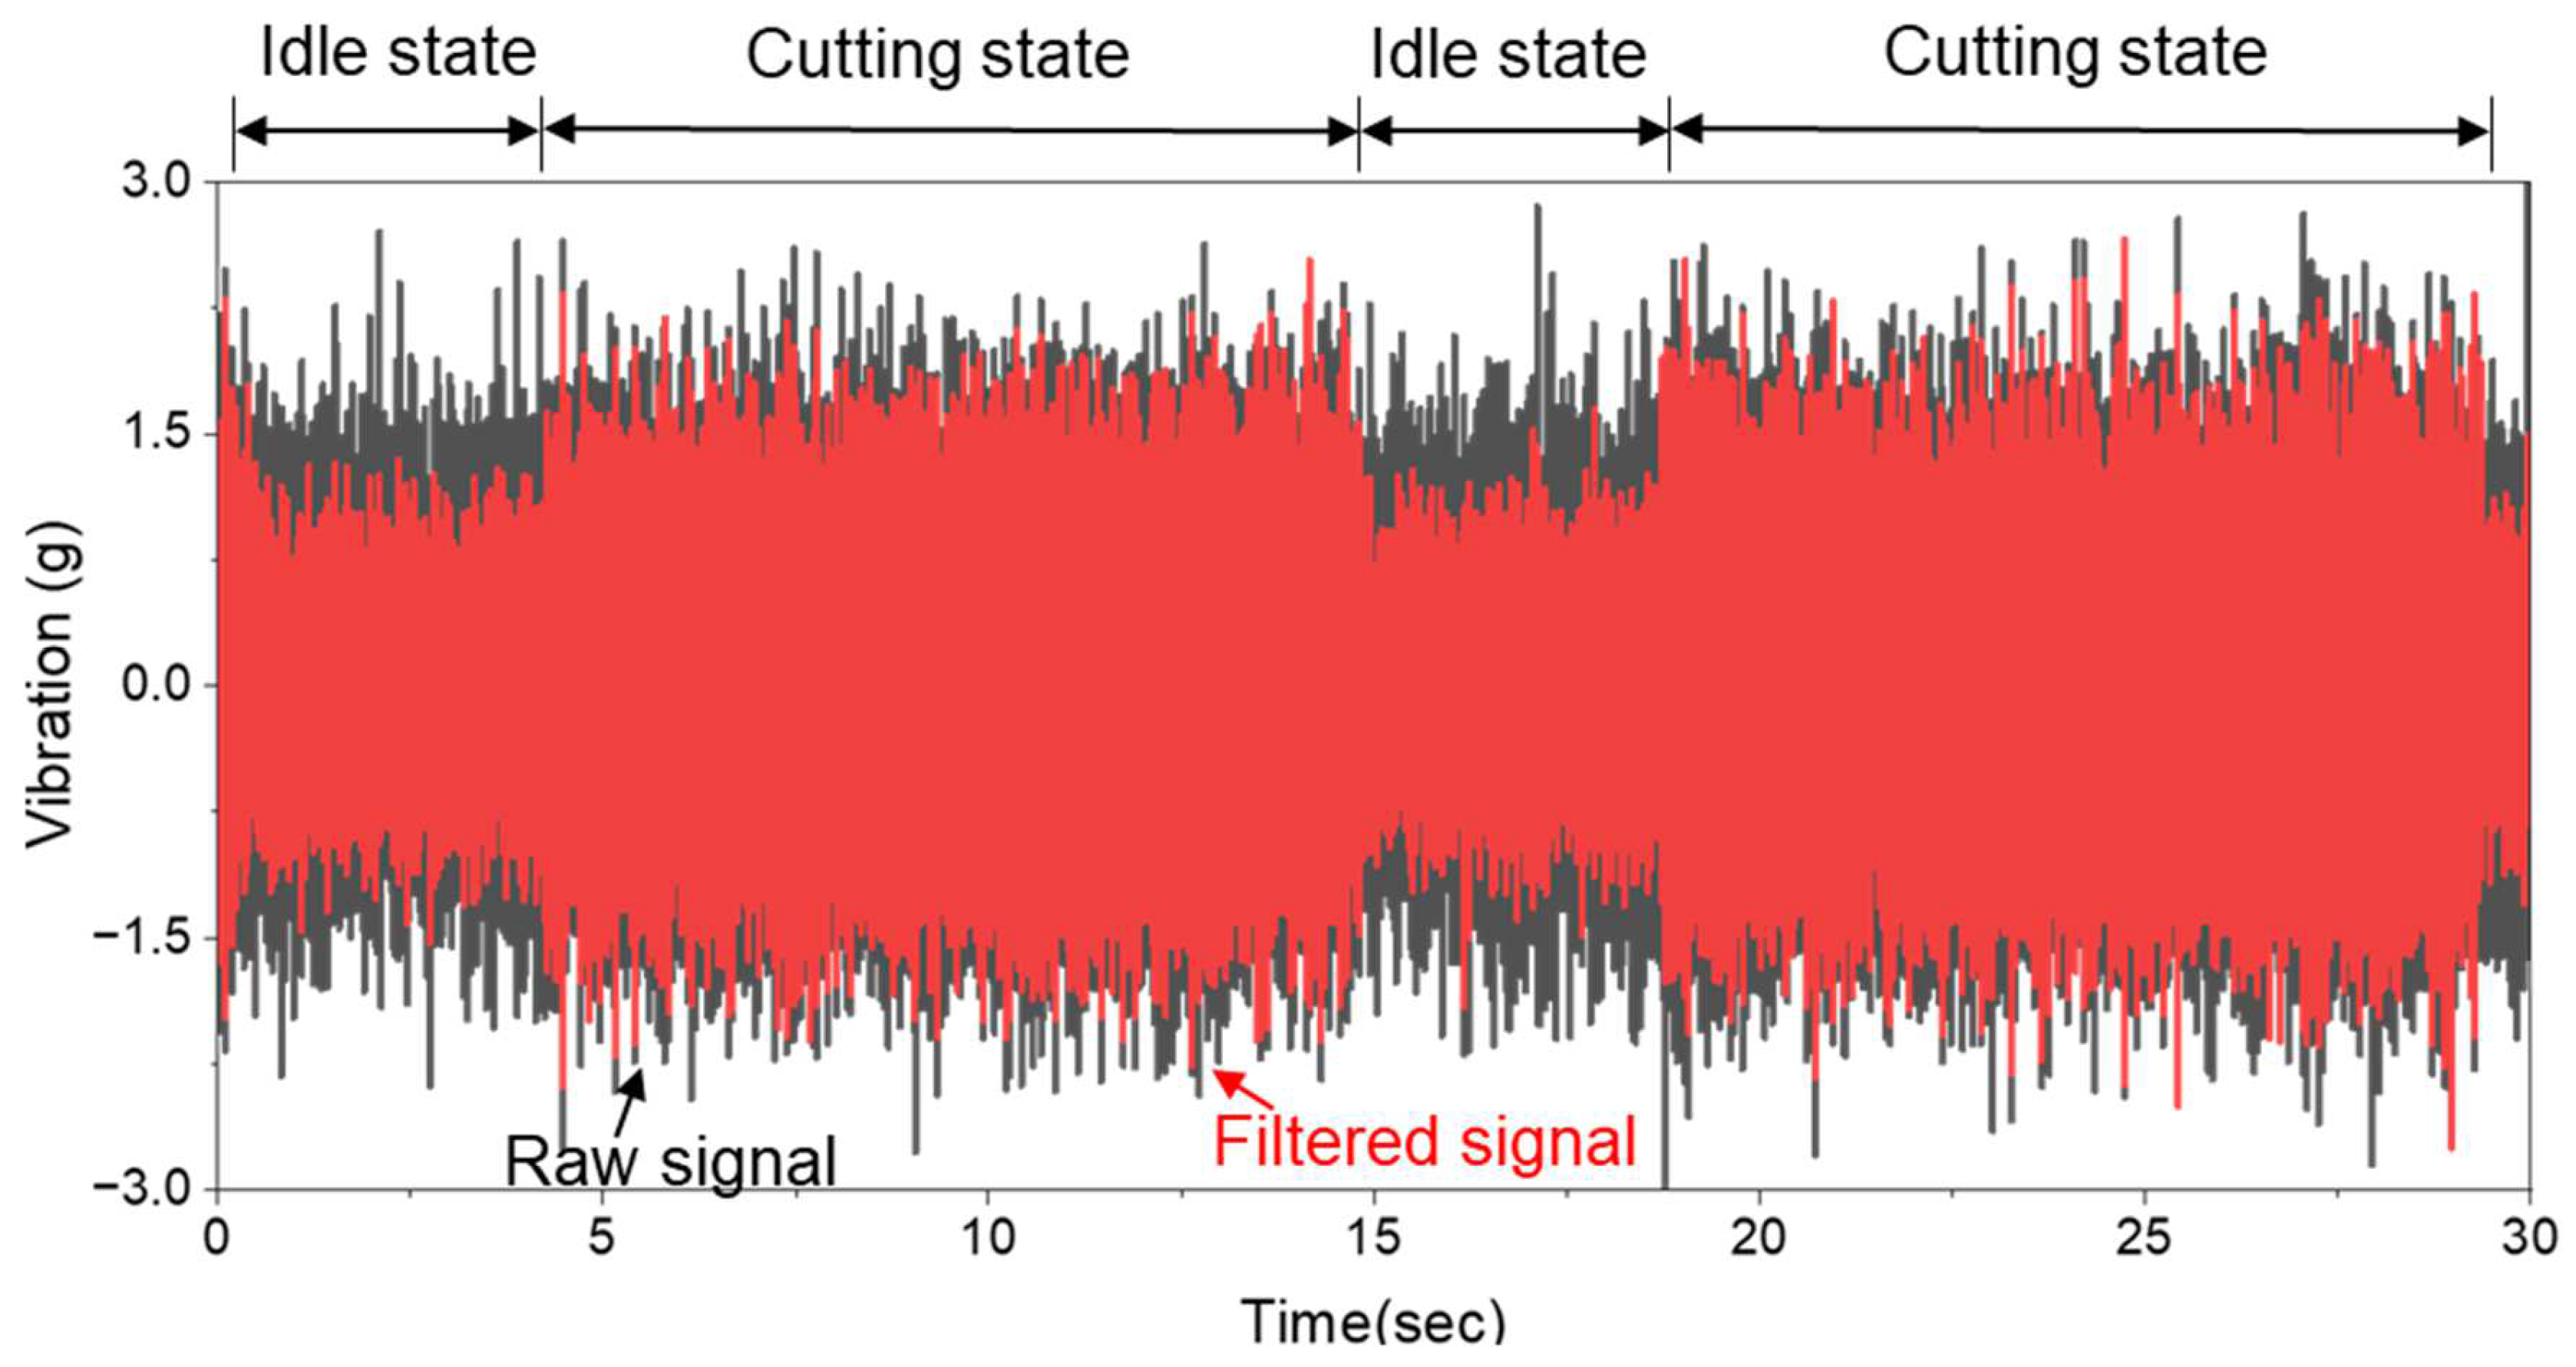
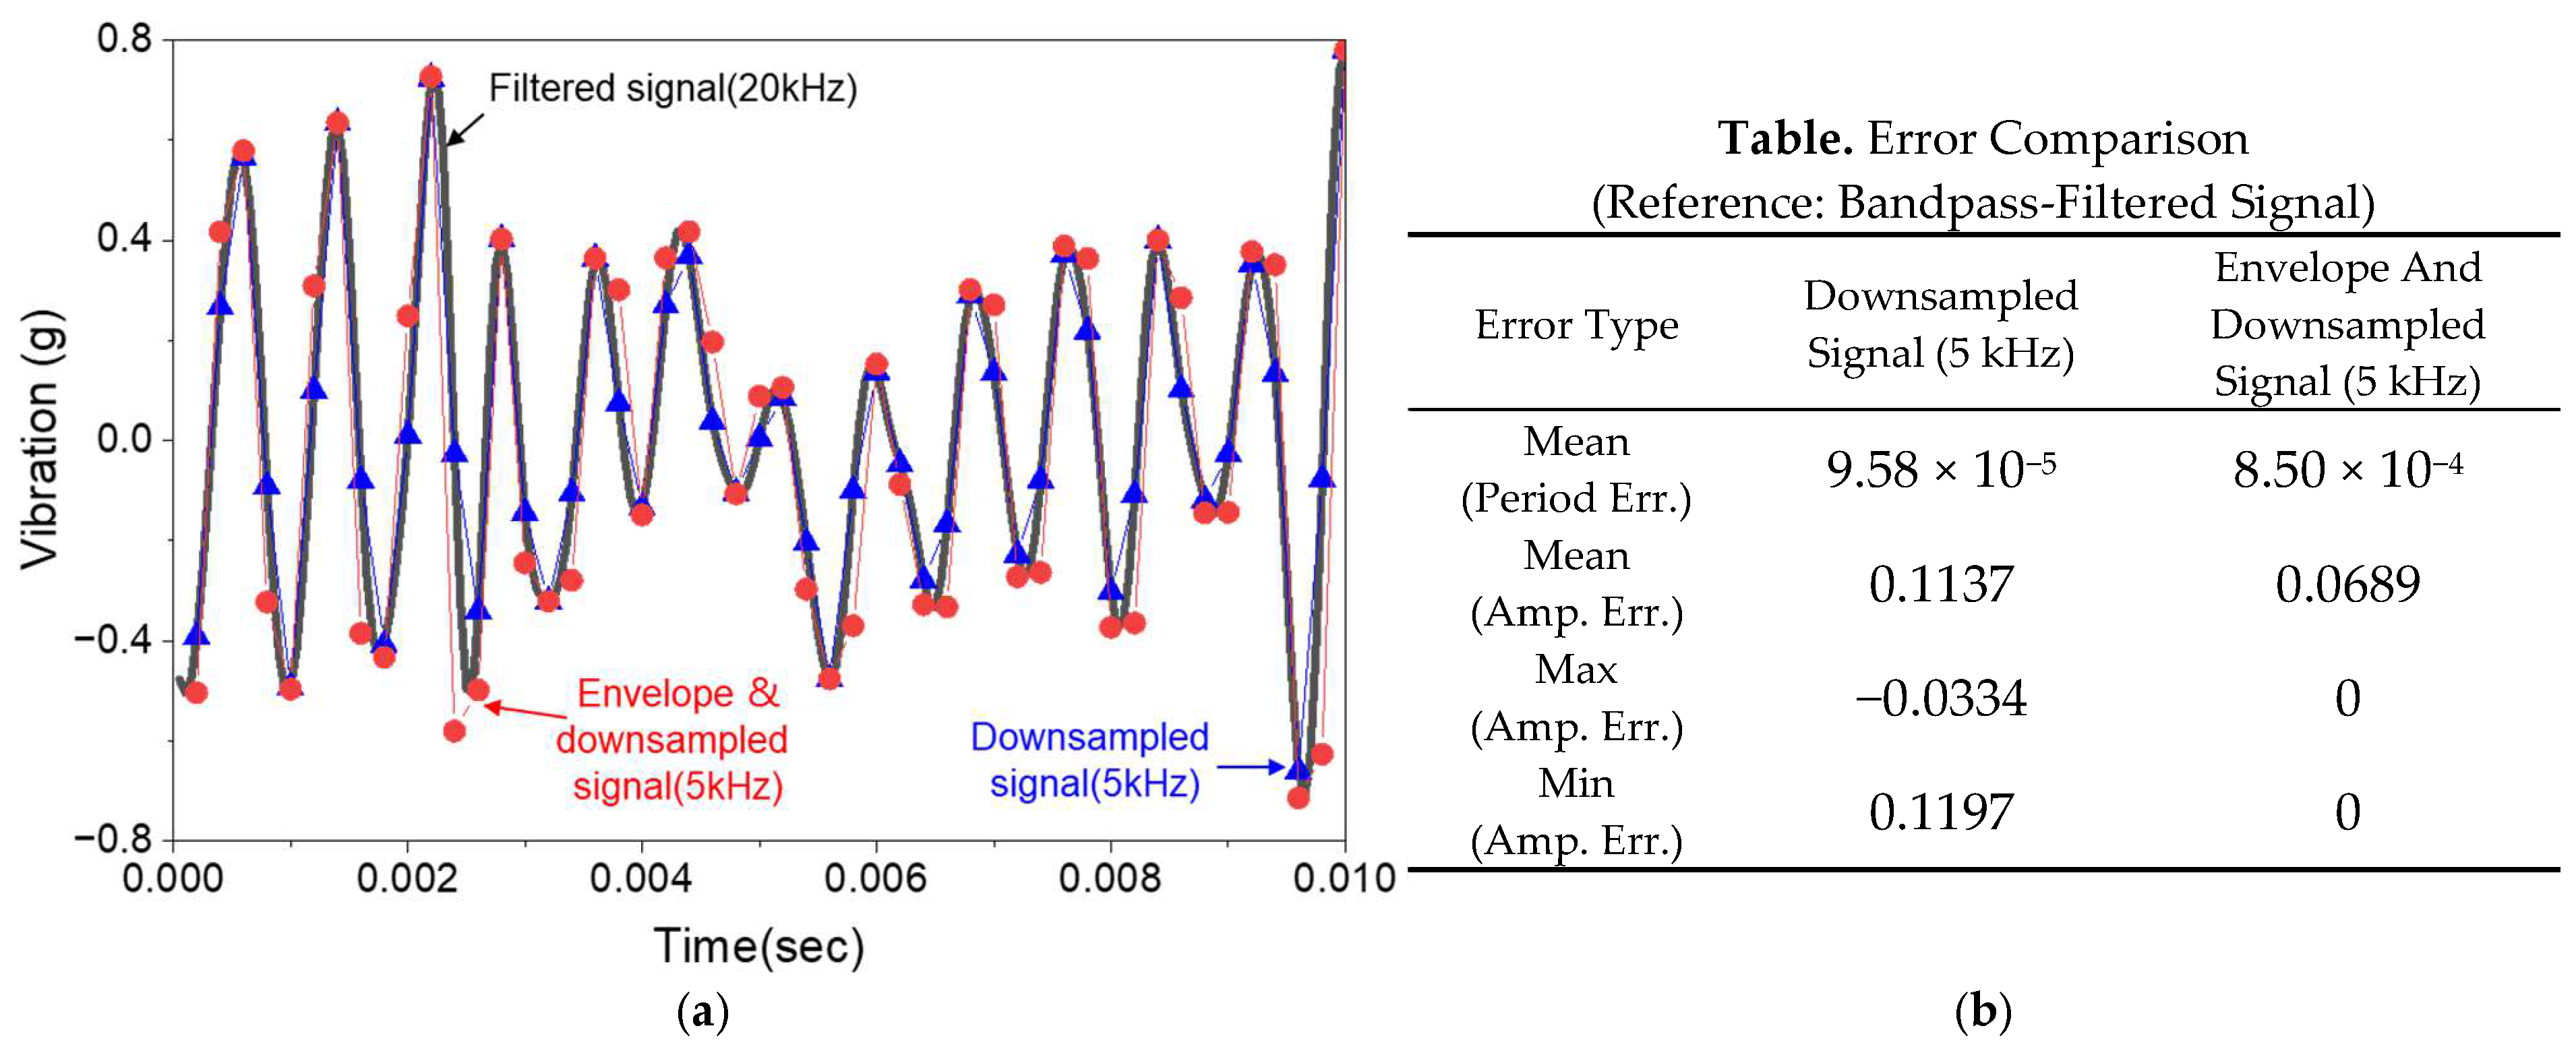
The filtered vibration signals are shown in Figure 7, where the influence of extraneous frequency bands has been effectively removed. This step serves to enhance the signal-to-noise ratio and stabilize the downstream learning process. To further extract dynamic features associated with tool–workpiece interactions, an envelope detection technique was applied to the filtered signal. This process highlights amplitude modulations induced by periodic cutting forces and contact events. The envelope signal was then downsampled to 5 kHz, balancing computational efficiency with temporal resolution. Figure 8 shows representative results of this envelope-based signal compression process. Figure 8a shows a time-domain comparison of three signals: the original bandpass-filtered signal sampled at 20 kHz, the directly downsampled signal at 5 kHz, and the envelope-extracted signal also downsampled to 5 kHz. This comparison clearly shows that envelope-based downsampling better preserves amplitude modulations relevant to cutting dynamics. Figure 8b shows a partial quantitative error analysis, where period and amplitude errors (mean, max, and min) are computed with respect to the original filtered signal. These results confirm that envelope-based downsampling achieves lower amplitude error and improved fidelity, yielding a compact and informative input for the neural network.
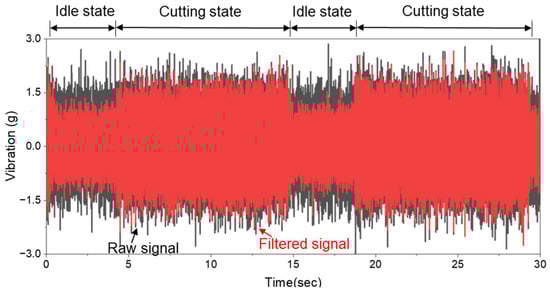
Figure 7.
FIR bandpass filtering applied to raw vibration signals (20–2500 Hz).
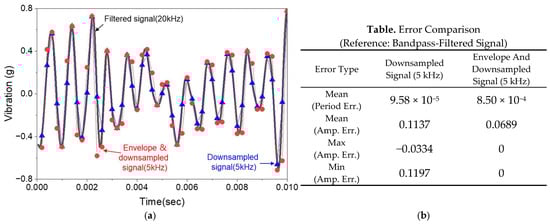
Figure 8.
Comparison of downsampling methods applied to bandpass-filtered vibration signals (20 kHz → 5 kHz). (a) Time-domain representation of the original bandpass-filtered signal (20 kHz), the directly downsampled signal (5 kHz), and the envelope-extracted downsampled signal (5 kHz). (b) Quantitative comparison of period and amplitude errors between the two downsampling methods, based on the signals shown in (a).
After preprocessing, the final input vector consisted of 750 features derived from three-axis acceleration (250 samples per axis), along with three condition labels representing material type, cutting speed, and cutting direction. These inputs formed a 753-dimensional condition-aware input vector, which was fed into the target encoder to generate the corresponding latent representation. The target encoder produced a 64-dimensional latent vector , which captured the essential dynamics of the cutting process and was trained using the same hyperparameter settings summarized in Table 6.
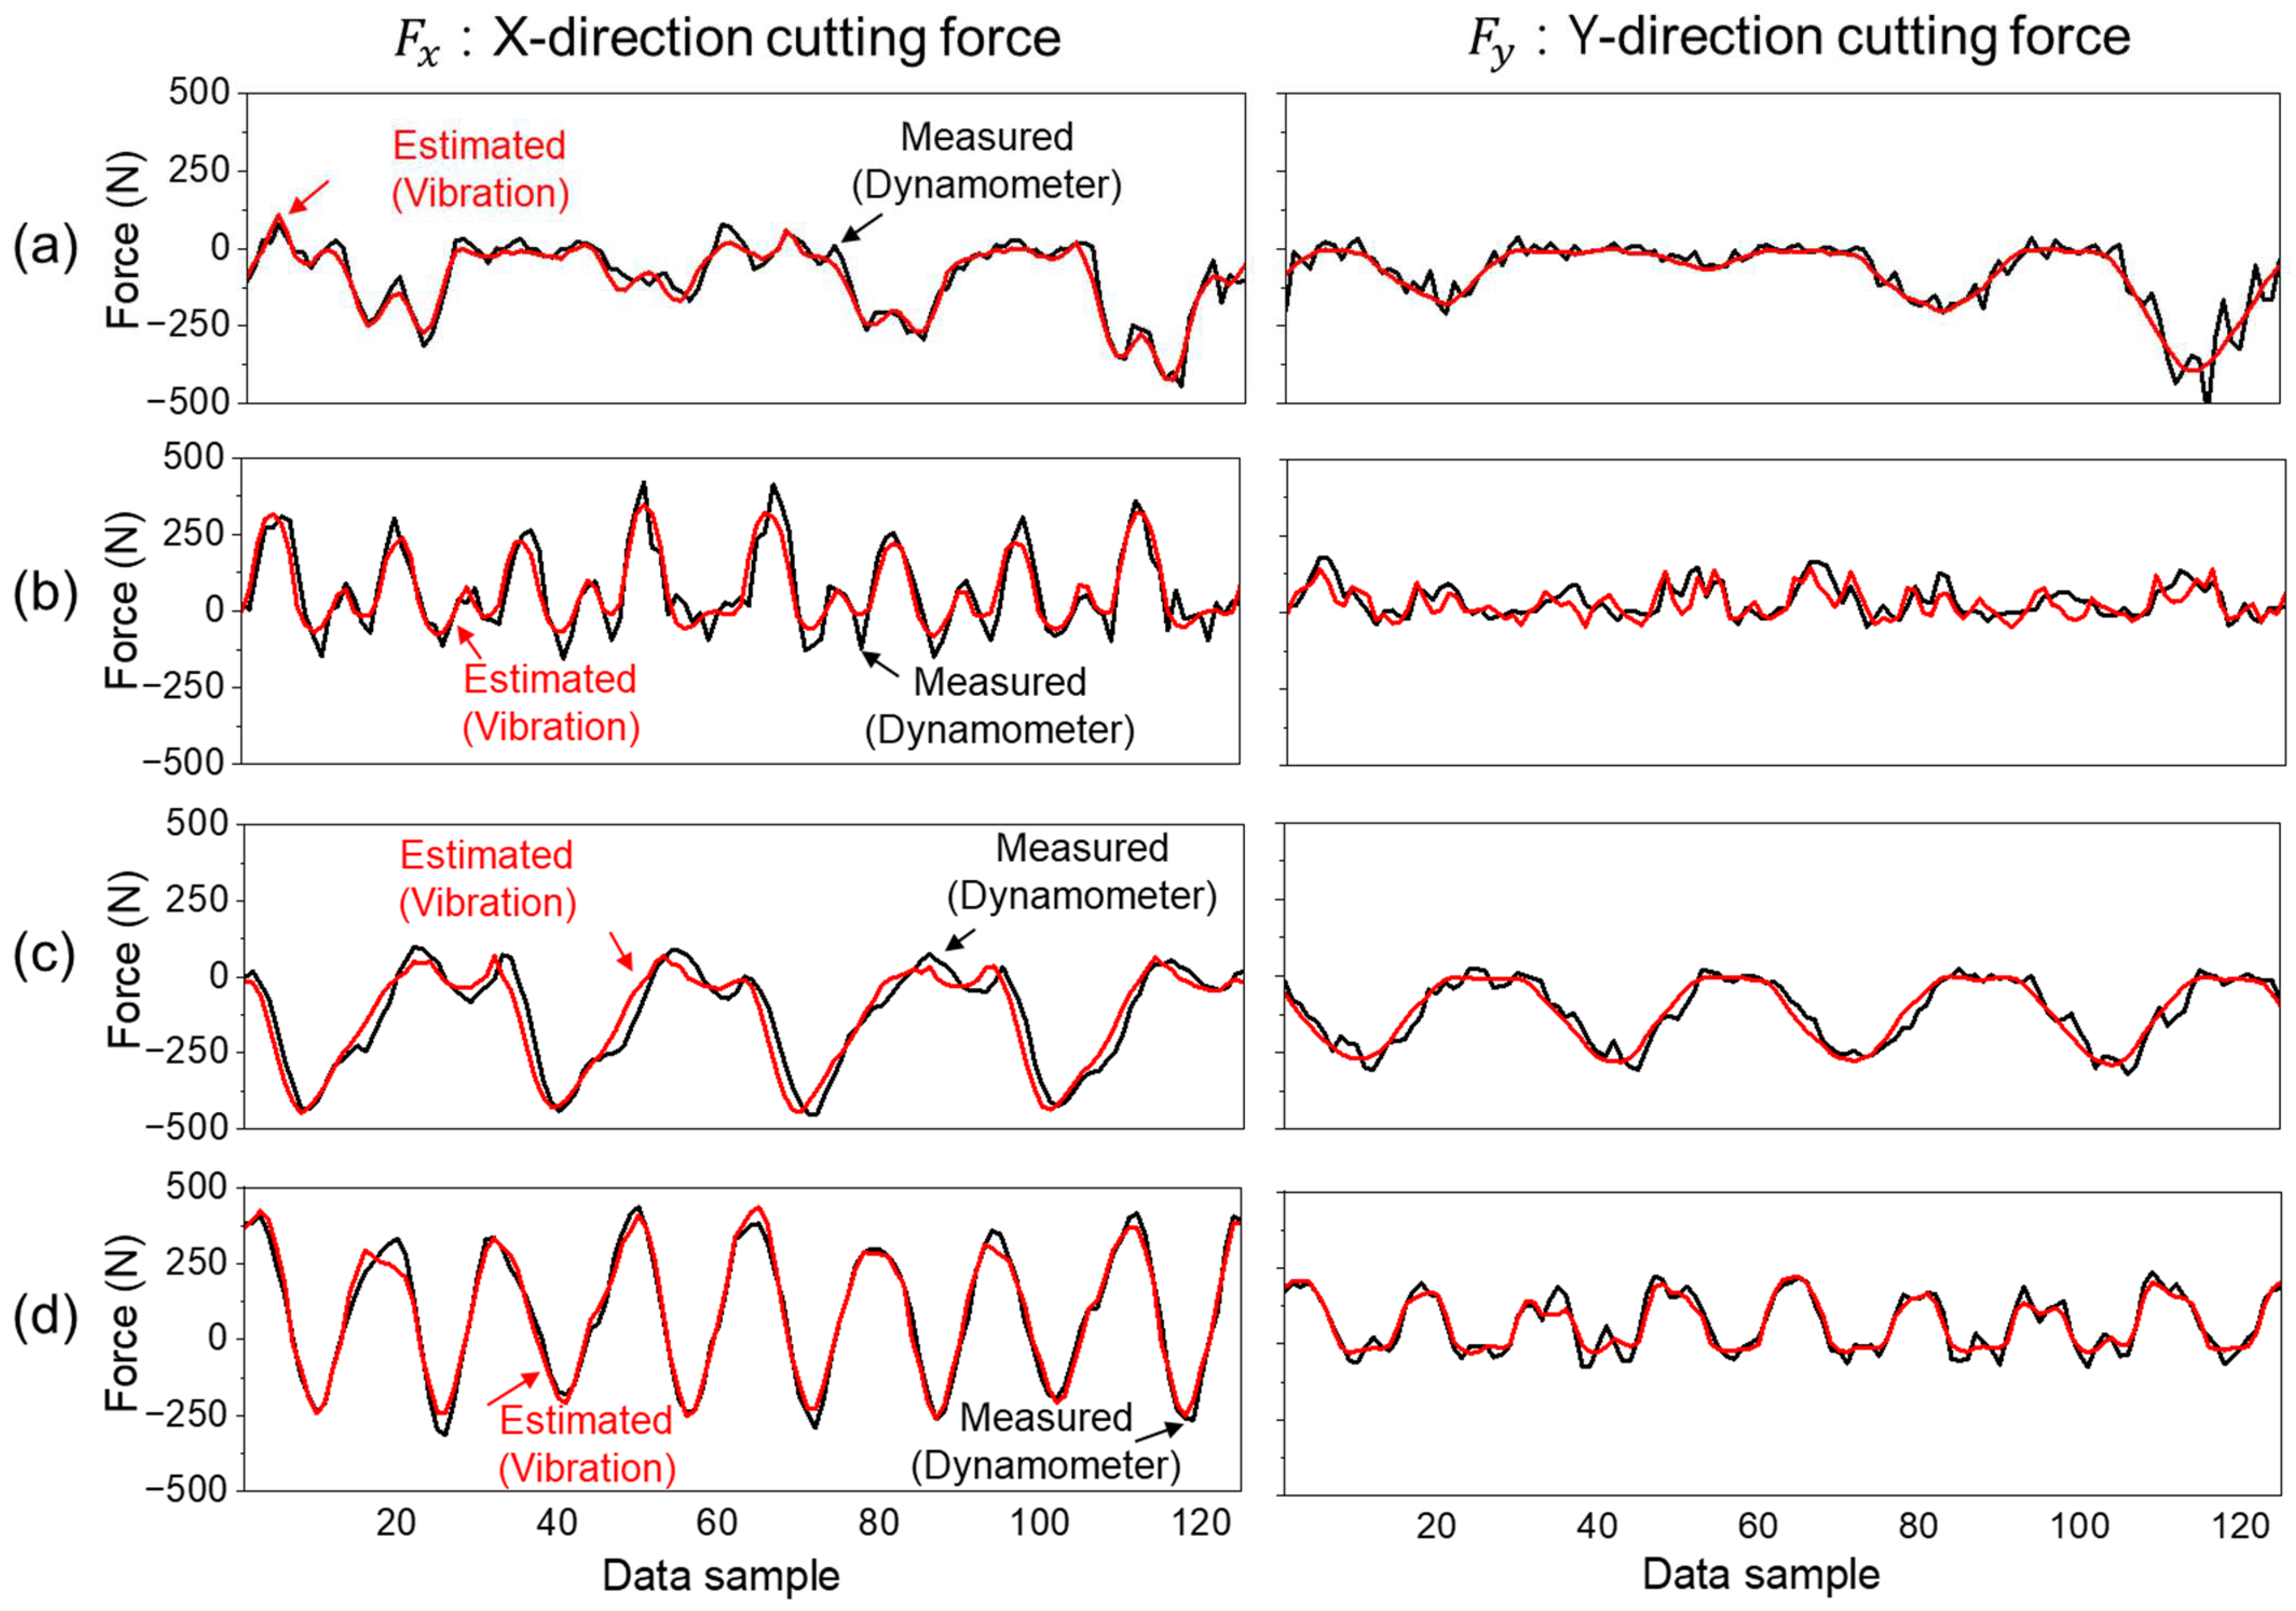
These latent vectors were then passed through the fixed decoder, originally trained with cutting force signals, to reconstruct the estimated force waveform. In Figure 9, the reconstructed cutting force signal is compared against the reference signal obtained from the dynamometer. The comparison validates that the target encoder, followed by the fixed decoder, can effectively reconstruct the original force signal using vibration-derived features. The reconstruction accuracy was quantitatively assessed using PCC between the estimated and measured force signals across all experimental conditions.
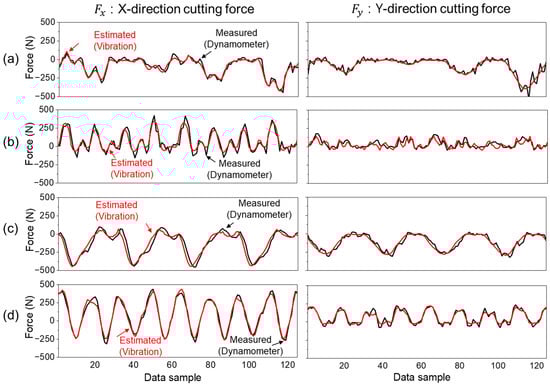
Figure 9.
Estimation performance of cutting force components and using the proposed vibration-based model under four cutting conditions: (a) Case 1—Ti-6Al-4V, 46 m/min. (b) Case 2—Ti-6Al-4V, 92 m/min. (c) Case 3—STS316L, 46 m/min. (d) Case 4—STS316L, 92 m/min.
The estimation performance was quantitatively evaluated using PCC between the reconstructed force signal and the reference signal measured by the dynamometer. As shown in Table 8, the proposed model achieved high estimation accuracy across all cutting conditions, with an average PCC of 0.9213 ± 0.0535 for and 0.9072 ± 0.0498 for . Among the four cases, estimation performance was highest for Case 3 and Case 4, which correspond to STS316L, while it was relatively lower for Case 1 and Case 2, which used Ti-6Al-4V. This difference is primarily due to the inherent machinability of the materials. STS316L showed slightly higher reconstruction performance ((: 0.961, (): 0.928) compared to Ti-6Al-4V (: 0.889, 0.895). An analysis of the measured cutting force profiles revealed that STS316L generated higher absolute cutting forces under identical cutting conditions, but the force curves exhibited smoother, more parabolic shapes. In contrast, Ti-6Al-4V showed more abrupt force fluctuations with sharp peaks and localized changes. This distinction can be attributed to differences in material properties, as summarized in Table 4. STS316L, austenitic stainless steel, has a lower yield (274.7 MPa) and tensile strength (549.2 MPa) than Ti-6Al-4V, but its significantly higher elongation (63.8% vs. 15.0%) enables more ductile deformation and continuous chip formation. This results in gradual tool engagement and stable force profiles. Conversely, Ti-6Al-4V tends to produce segmented chips due to its low ductility and high strength, leading to localized material breakage and sudden changes in cutting force [24,25]. Similar trends between chip morphology and force signal smoothness have been reported in previous studies on material-dependent machinability [26]. These differences in chip formation behavior directly impact the difficulty of force signal reconstruction and explain the observed performance gap between the two materials.
Table 8.
Cutting force estimation performance using vibration input (PCC values).
Furthermore, since autoencoders inherently compress input signals into a low-dimensional latent space, subtle or high-frequency variations may be attenuated during the reconstruction process. As a result, materials like Ti-6Al-4V, which exhibit abrupt and non-smooth force transitions due to segmented chip formation, are more susceptible to minor information loss during encoding. Nonetheless, the model still achieved a high level of reconstruction performance for such cases, with PCC exceeding 0.89, demonstrating the robustness of the proposed approach despite the inherent signal complexity.
In addition, the estimation accuracy decreased slightly in Case 2 and Case 4, which involved higher cutting speeds. At increased spindle speeds, more cutting events occur within the same 50 ms input window, resulting in a denser and more dynamic signal. The model thus needed to compress more complex information into a single latent vector while also handling increased vibrational noise due to machine excitation and resonance effects [15]. These factors collectively contributed to the performance drop in high-speed conditions.
Nevertheless, despite the variability introduced by material properties and cutting dynamics, the results clearly demonstrate that the proposed autoencoder and transfer learning-based model achieved accurate and robust cutting force estimation using only vibration input. The overall performance validates the effectiveness of the modeling approach and its applicability to diverse machining environments without reliance on direct force measurement.
4.4. Evaluation Under Abnormal Cutting Force Conditions
To evaluate the performance of the proposed model under more challenging and realistic machining conditions, additional experiments were conducted using cutting force data containing abnormal events. Unlike previous tests that focused on nominal cutting behavior, this evaluation included a separate condition specifically designed to induce transient force surges. The data from this condition were included in the training process, and the model’s performance was evaluated on a validation set extracted from the same abnormal condition.
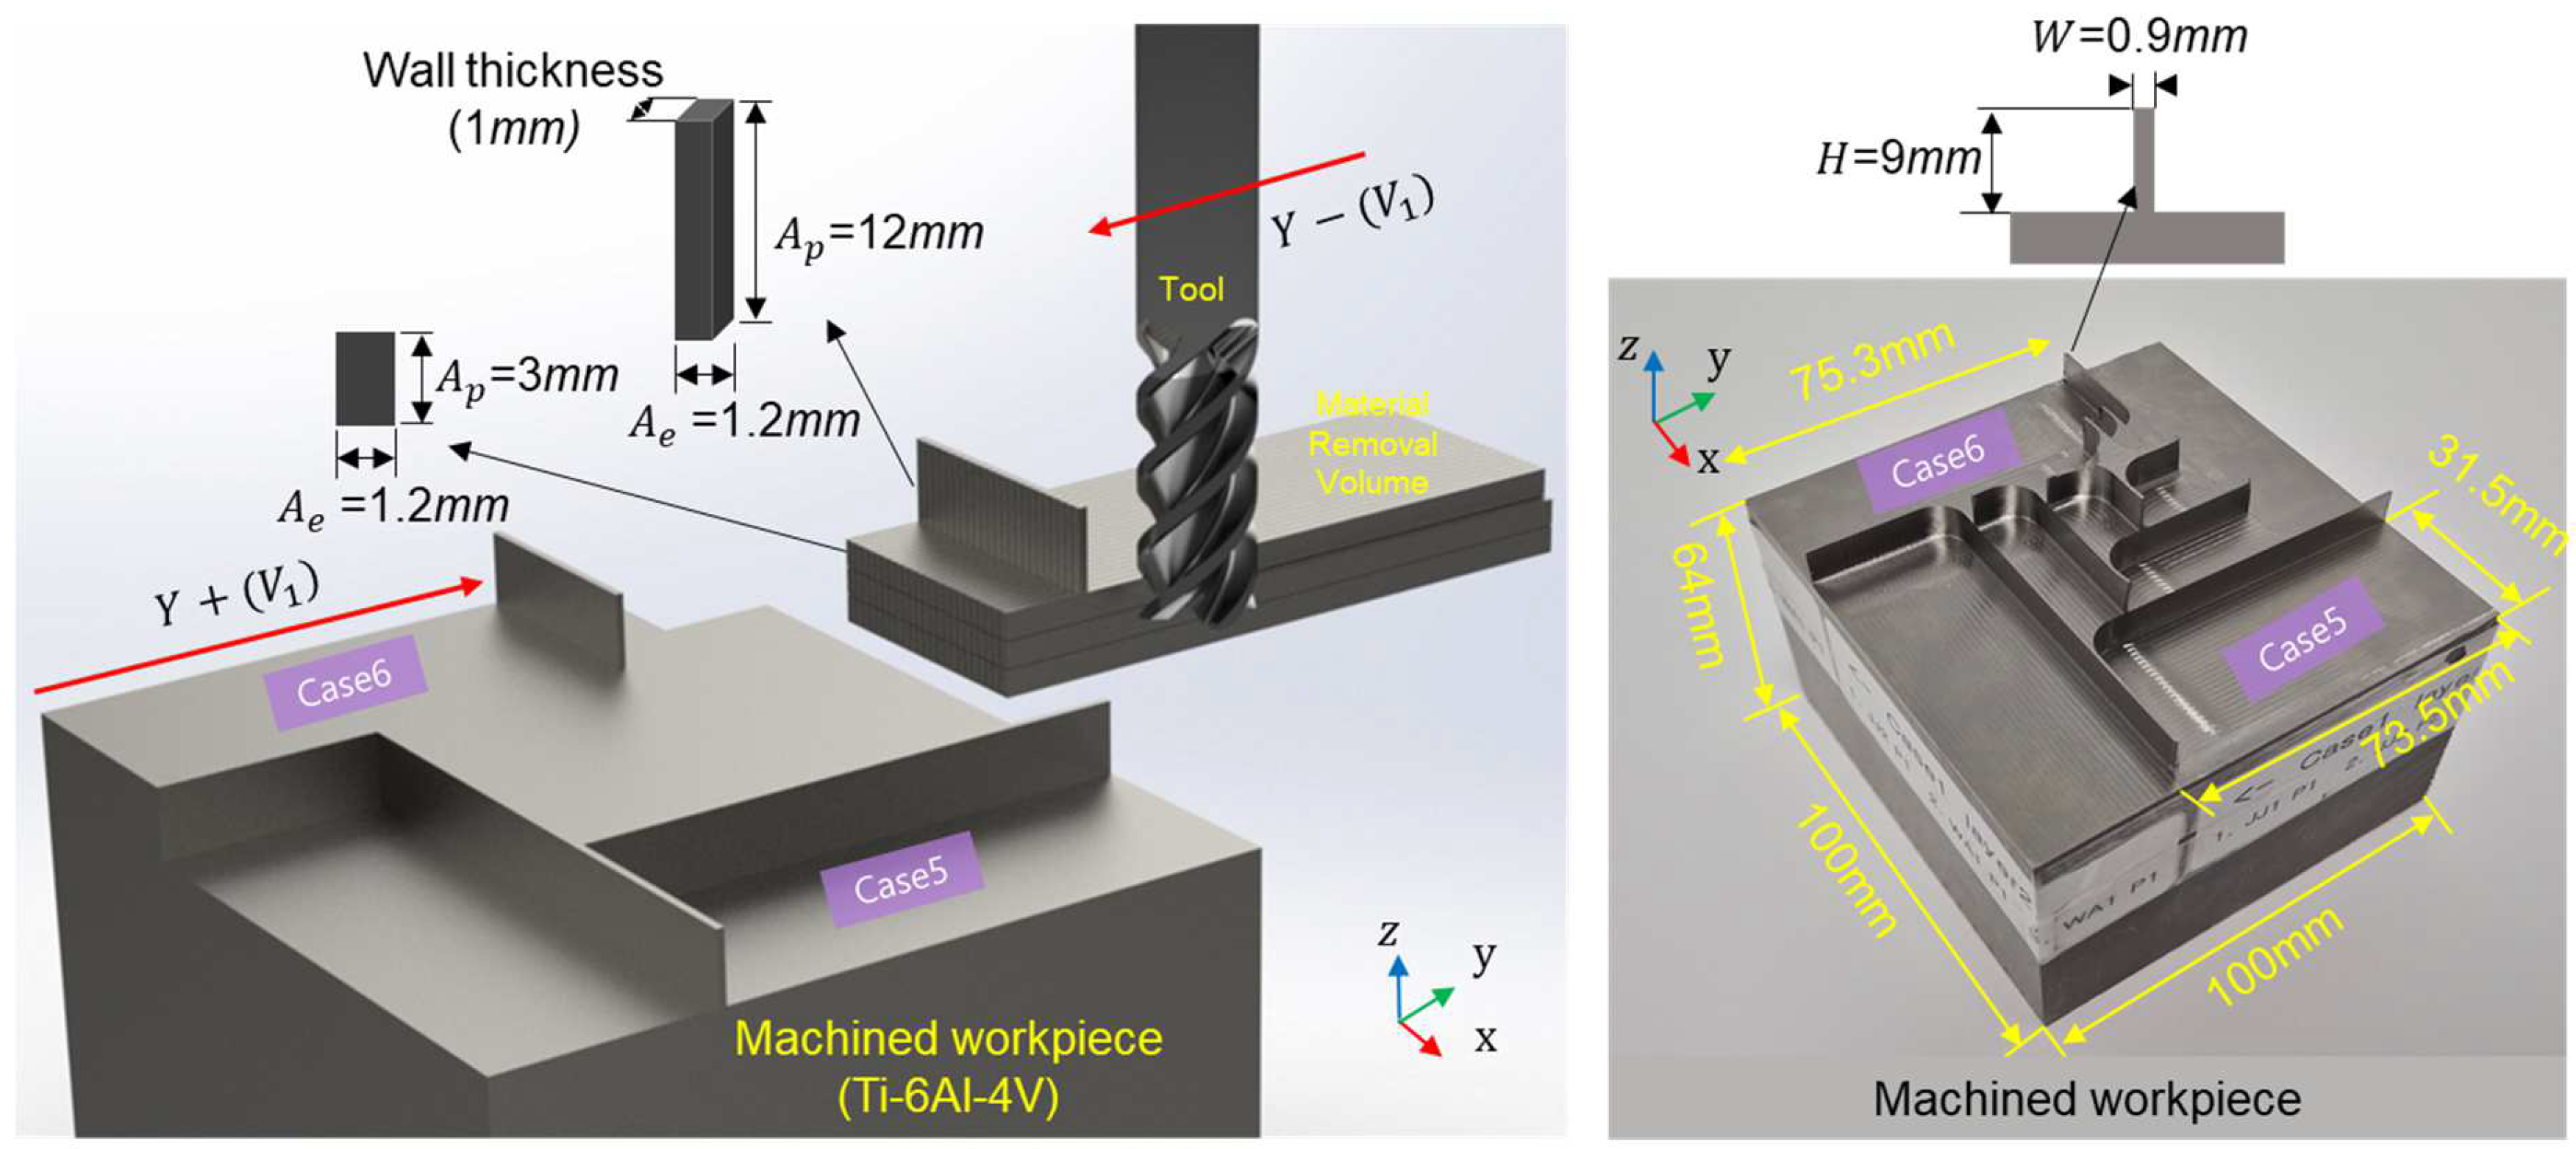
The test setup maintained the same material (Ti-6Al-4V) and cutting speed (46 m/min) as in Case 1, with cutting performed in both the Y+ (Case 5) and Y− (Case 6) directions. To evaluate the model’s robustness under nonstationary conditions, localized force transients were intentionally induced by machining a thin-wall structure, as shown in Figure 10. A 1 mm-thick wall perpendicular to the feed direction was incorporated into the workpiece geometry, creating a sudden increase in the axial depth of cut() (from 3 mm to 12 mm) as the tool passed through the region. This transition occurred within 1.2 ms, producing a rapid rise in material removal rate and cutting force. The design was intended to generate transient, nonstationary force and vibration signals representative of unstable cutting conditions.

Figure 10.
Cutting path and workpiece geometry with localized thin wall feature for force surge induction.
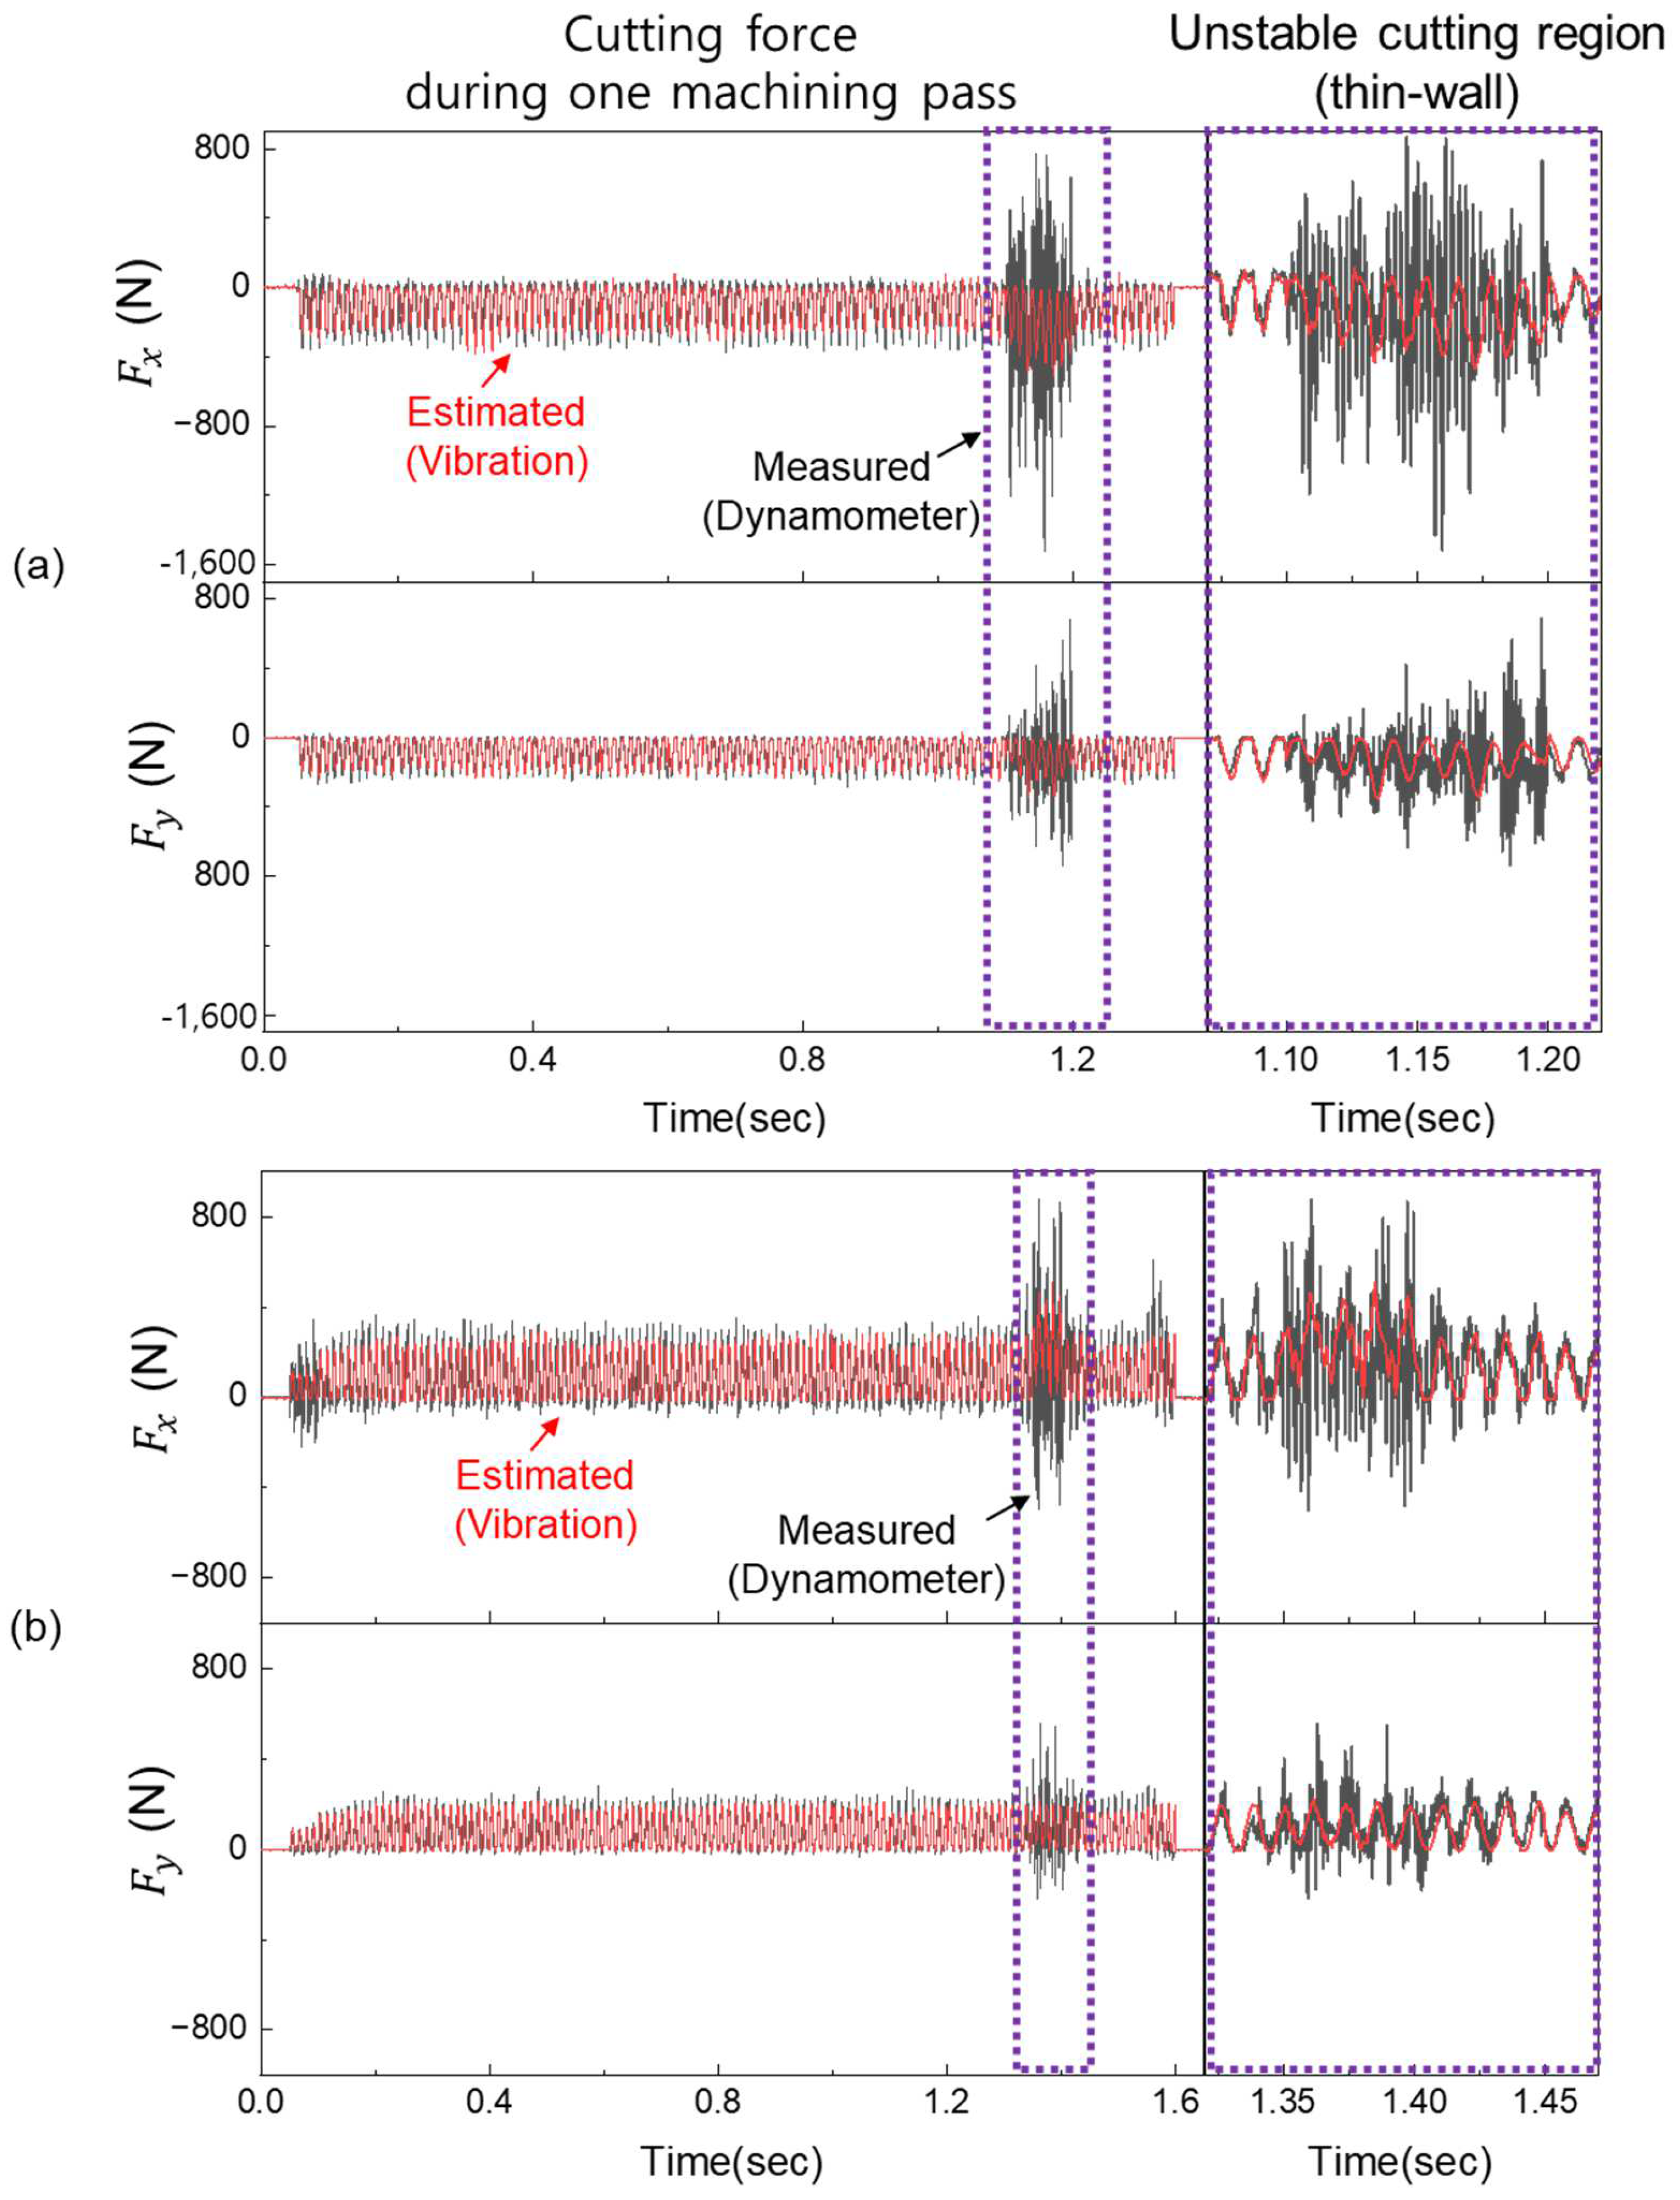
As shown in Figure 11, the behavior of the cutting force during tool engagement with the thin wall was accurately characterized by the proposed model. In the case of the component, the model slightly underestimated the peak amplitude, which is attributed to the abrupt onset and high-frequency nature of the transient. Nevertheless, the model effectively captured the overall temporal evolution of the force and accurately reflected its return to steady-state levels once the disturbance subsided. In contrast, the estimation of exhibited greater consistency, with a low error margin and stable tracking performance maintained across the entire duration. Quantitative evaluation using the PCC is summarized in Table 9, with avg values of 0.8573 ± 0.0503 for and 0.9202 ± 0.0296 for . These results confirm that the model maintained high estimation accuracy even under abnormal cutting conditions involving transient force surges. The slightly lower performance observed in the feed-normal direction () is attributed to the significantly larger force variations and sharp, high-gradient transients caused by increased chip load concentration and tool deflection, making accurate reconstruction more challenging compared to the feed direction. Nonetheless, the model successfully captured both the rising and recovery trends in the force signals, indicating its robustness in dynamic and nonstationary environments. These findings demonstrate that the proposed latent vector-based cutting force estimation model, composed of a deep autoencoder and a transfer learning-based encoder, is capable of maintaining stable performance when exposed to previously unseen geometric disturbances. The model generalizes effectively not only across materials and cutting speeds but also under transient variations induced by workpiece geometry, validating its potential for real-time implementation in intelligent machining systems.
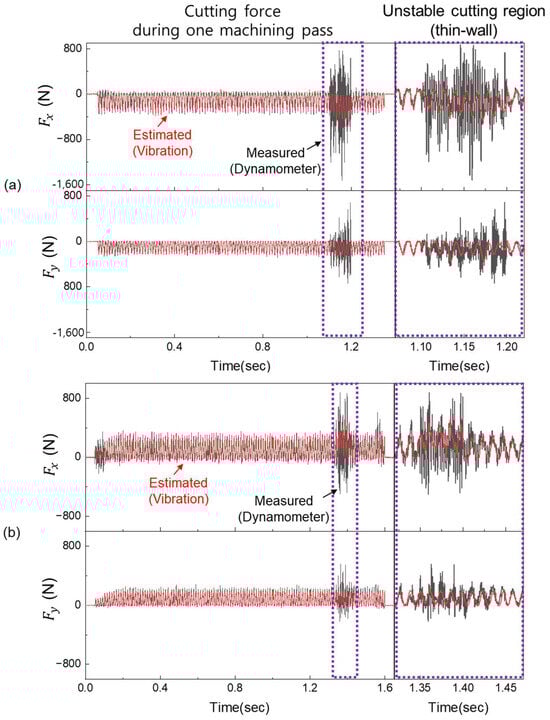
Figure 11.
Estimated cutting force components and under abnormal cutting conditions (Ti-6Al-4V, 46 m/min): (a) Case 5—feed direction Y+. (b) Case 6—feed direction Y−.
Table 9.
Cutting force estimation performance under abnormal cutting conditions using a vibration-based model (PCC values).
5. Conclusions
This study presented a machine learning-based approach for estimating milling cutting forces using only spindle vibration signals without requiring direct force measurements from dynamometers. The proposed model is composed of two stages: a deep autoencoder that learns compact latent vectors from cutting force signals and a target encoder trained through supervised transfer learning to map vibration signals into the same latent space. The decoder, pre-trained on force data, remains fixed during the second stage to ensure consistent reconstruction of force signals. To enhance model generalization, condition-aware input vectors were constructed by incorporating material type, cutting speed, and cutting direction. The model was trained and validated on data collected under four different cutting conditions and tested under both nominal and abnormal machining scenarios.
The experimental results demonstrated that the model accurately reconstructed cutting force signals, achieving a high correlation with ground-truth measurements. The average PCC were 0.9707 ± 0.250 for and 0.9501 ± 0.0297 for in the autoencoder stage, and 0.9213 ± 0.0535 for and 0.9072 ± 0.0498 for Fy when using vibration signals for estimation. In additional tests using abnormal cutting conditions with sudden force surges, the model still achieved strong performance (0.8573 ± 0.0503 for , 0.9202 ± 0.0296 for ), confirming its robustness. These results indicate that the effectiveness of the proposed model comes not only from latent vector alignment but also from the overall architecture, which combines unsupervised representation learning and transfer learning with condition-aware inputs. The model also showed sensitivity to material and speed conditions—performing better with STS316L than with Ti-6Al-4V and slightly lower under high-speed cutting due to increased signal complexity.
In conclusion, the proposed method provides a reliable and accurate solution for real-time cutting force estimation using vibration signals. Its generalization ability and robustness under both normal and transient conditions make it suitable for implementation in tool condition monitoring and intelligent manufacturing systems.
Author Contributions
Conceptualization, J.-D.R., J.L., S.-R.K. and M.C.L.; Methodology, J.-D.R., S.-R.K. and M.C.L.; Software, J.-D.R.; Formal analysis, J.-D.R.; Investigation, J.-D.R. and J.L.; Resources, J.L. and S.-R.K.; Data curation, J.-D.R.; Writing—original draft, J.-D.R.; Writing—review and editing, J.-D.R. and M.C.L.; Supervision, S.-R.K. and M.C.L.; Funding acquisition, S.-R.K. All authors have read and agreed to the published version of the manuscript.
Funding
This study was supported by the Korea Institute of Industrial Technology (KITECH) under the “Establishment of Process Collaboration Platform for Root Industry Advancement (MZ250010)”.
Data Availability Statement
The original contributions presented in this study are included in the article. Further inquiries can be directed to the corresponding author.
Conflicts of Interest
Authors Je-Doo Ryu, Jung-Min Lee, and Sung-Ryul Kim were employed by the Korea Institute of Industrial Technology. The remaining author, Min Cheol Lee, declares that the research was conducted in the absence of any commercial or financial relationships that could be construed as a potential conflict of interest.
Nomenclatures
| List of Symbols and Variables. | ||
| Symbol | Description | Unit |
| Cutting force components in X, Y direction | N | |
| , and | Spindle vibration components in X, Y, Z direction | g |
| Cutting speed | m/min | |
| Feed rate | mm/min | |
| Axial depth of cut | mm | |
| Radial depth of cut | mm | |
| Pearson correlation coefficient | - | |
| , | Weight of encoder and decoder | - |
| , | Bias of encoder and decoder | - |
| Latent feature vector from autoencoder | - | |
| Activation function (sigmoid) | - | |
| Activation function (hyperbolic tangent) | - | |
References
- Serin, G.; Sener, B.; Ozbayoglu, A.M.; Unver, H.O. Review of tool condition monitoring in machining and opportunities for deep learning. Int. J. Adv. Manuf. Technol. 2020, 109, 953–974. [Google Scholar] [CrossRef]
- Prickett, P.W.; Johns, C. An overview of approaches to end milling tool monitoring. Int. J. Mach. Tools Manuf. 1999, 39, 105–122. [Google Scholar] [CrossRef]
- Nasir, V.; Sassani, F. A review on deep learning in machining and tool monitoring: Methods, opportunities, and challenges. Int. J. Adv. Manuf. Technol. 2021, 115, 2683–2709. [Google Scholar] [CrossRef]
- Peng, D.; Li, H. Intelligent monitoring of milling tool wear based on milling force coefficients by prediction of instantaneous milling forces. Mech. Syst. Signal Process. 2024, 208, 111033. [Google Scholar] [CrossRef]
- Nath, C. Integrated tool condition monitoring systems and their applications: A comprehensive review. Procedia Manuf. 2020, 48, 852–863. [Google Scholar] [CrossRef]
- Okafor, A.C.; Sultan, A.A. Development of a mechanistic cutting force model for wavy-edge bull-nose helical end-milling of Inconel 718. Appl. Math. Model. 2016, 40, 306–324. [Google Scholar] [CrossRef]
- Audy, J. An appraisal of techniques and equipment for cutting force measurement. J. Zhejiang Univ. Sci. A 2006, 7, 1781–1789. [Google Scholar] [CrossRef]
- Hanif, M.I.; Aamir, M.; Ahmed, N.; Maqsood, S.; Muhammad, R.; Akhtar, R.; Hussain, I. Optimization of facing process by indigenously developed force dynamometer. Int. J. Adv. Manuf. Technol. 2019, 100, 1893–1905. [Google Scholar] [CrossRef]
- Kuntoğlu, M.; Aslan, A.; Pimenov, D.Y.; Usca, Ü.A.; Salur, E.; Gupta, M.K.; Mikolajczyk, T.; Giasin, K.; Kapłonek, W.; Sharma, S. A review of indirect tool condition monitoring systems and decision-making methods in turning: Critical analysis and trends. Sensors 2021, 21, 108. [Google Scholar] [CrossRef]
- Liang, Y.C.; Wang, S.; Li, W.D.; Lu, X. Data-Driven Anomaly Diagnosis for Machining Processes. Engineering 2019, 5, 646–652. [Google Scholar] [CrossRef]
- Bhuiyan, M.S.H.; Choudhury, I.A.; Dahari, M. Application of acoustic emission sensor to investigate the frequency of tool wear and plastic deformation in tool condition monitoring. Measurement 2016, 92, 208–217. [Google Scholar] [CrossRef]
- Siddhpura, A.; Paurobally, R. A review of flank wear prediction methods for tool condition monitoring in a turning process. Int. J. Adv. Manuf. Technol. 2013, 65, 371–393. [Google Scholar] [CrossRef]
- Riaz, S.; Ahmed, M.; Iqbal, F.; Mahmood, A.; Nawab, R.M.A. TransLSTM: A hybrid LSTM-Transformer model for fine-grained suggestion mining. Nat. Lang. Process. J. 2024, 8, 100089. [Google Scholar] [CrossRef]
- Lara de Leon, M.A.; Kolarik, J.; Byrtus, R.; Koziorek, J.; Zmij, P.; Martinek, R. Tool Condition Monitoring Methods Applicable in the Metalworking Process. Arch. Comput. Methods Eng. 2023, 31, 221–242. [Google Scholar] [CrossRef]
- Ahmed, A.; Ibaraki, S.; Matsubara, A. Monitoring and adaptive control of cutting forces based on spindle motor and servo motor currents in machining centers. JSME Int. J. Ser. C 2004, 47, 1018–1025. Available online: https://mecdes.hiroshima-u.ac.jp/~ibaraki.h0523/pubs/papers/jusfa04_ahmed.pdf (accessed on 15 May 2025).
- Choi, K.; Yi, J.; Park, C.; Yoon, S. Deep learning for anomaly detection in time-series data: Review, analysis, and guidelines. IEEE Access 2021, 9, 120043–120065. [Google Scholar] [CrossRef]
- Martínez-Arellano, G.; Terrazas, G.; Ratchev, S. Tool wear classification using time series imaging and deep learning. Int. J. Adv. Manuf. Technol. 2019, 104, 3647–3662. [Google Scholar] [CrossRef]
- Postel, M.; Aslan, D.; Wegener, K.; Altintas, Y. Monitoring of vibrations and cutting forces with spindle mounted vibration sensors. CIRP Ann. 2019, 68, 413–416. [Google Scholar] [CrossRef]
- Cao, H.; Zhang, X.; Chen, X. The concept and progress of intelligent spindles: A review. Int. J. Mach. Tools Manuf. 2017, 112, 21–52. [Google Scholar] [CrossRef]
- Ahmed, M.; Kim, J. Sensor fault detection and classification using multi-step-ahead prediction and autoencoder-based deep learning models. Appl. Sci. 2024, 14, 7717. [Google Scholar] [CrossRef]
- Hochreiter, S.; Schmidhuber, J. Long short-term memory. Neural Comput. 1997, 9, 1735–1780. [Google Scholar] [CrossRef] [PubMed]
- Ryu, J.-D.; Lee, H.-H.; Ha, K.-N.; Kim, S.-R.; Lee, M.-C. Cutting Force Estimation Using Milling Spindle Vibration-Based Machine Learning. Appl. Sci. 2025, 15, 2336. [Google Scholar] [CrossRef]
- El-Taybany, Y.; Elhendawy, G.A. Experimental investigation of different machine learning approaches for tool wear classification based on vision system of milled surface. Int. J. Interact. Des. Manuf. 2024, 18, 493–506. [Google Scholar] [CrossRef]
- Ezugwu, E.O.; Wang, Z.M. Titanium alloys and their machinability—A review. J. Mater. Process. Technol. 1997, 68, 262–274. [Google Scholar] [CrossRef]
- Arrazola, P.J.; Garay, A.; Iriarte, L.M.; Armendia, M.; Marya, S.; Le Maître, F. Machinability of titanium alloys (Ti6Al4V and Ti555.3). CIRP J. Manuf. Sci. Technol. 2009, 1, 70–76. [Google Scholar] [CrossRef]
- Umbrello, D.; Filice, L. Improving surface integrity in orthogonal machining of hardened steel by modeling white layer formation. Int. J. Mach. Tools Manuf. 2009, 49, 1007–1014. [Google Scholar] [CrossRef]

Disclaimer/Publisher’s Note: The statements, opinions and data contained in all publications are solely those of the individual author(s) and contributor(s) and not of MDPI and/or the editor(s). MDPI and/or the editor(s) disclaim responsibility for any injury to people or property resulting from any ideas, methods, instructions or products referred to in the content. |
© 2025 by the authors. Licensee MDPI, Basel, Switzerland. This article is an open access article distributed under the terms and conditions of the Creative Commons Attribution (CC BY) license (https://creativecommons.org/licenses/by/4.0/).