Abstract
During geomagnetic storms, a geomagnetically induced current (GIC) flows into grounding transformers, potentially causing anomalous vibrations and audible noise in internal components. This study establishes an electromagnetic–mechanical–acoustic coupling (EMAC) model to characterize the multi-physics interactions in transformers under GIC interference. Based on the measured data, the GIC is classified into fluctuating and constant components according to its fluctuation characteristics. A propagation-path-based coupling model is proposed to investigate the correlated interactions among physical fields, extracting critical parameters, including winding current, magnetic flux, electromagnetic force, vibration, and noise. Comparative simulations reveal that the fluctuating component induces more complex multi-physics variations, generating significantly higher vibration amplitudes and noise levels compared to those of the constant component. A dynamic experimental platform is built to obtain multi-physics field information in different modes, and the effectiveness of the model and the correctness of the conclusions are verified through virtual–physical consistency validation. On this basis, multimodal feature information domains are established to delineate the operational state intervals of the transformer under GIC interference. Stability threshold criteria are subsequently developed, providing a critical quantitative basis for the condition monitoring of power transformers.
1. Introduction
Section 1 introduces the research background, identifies the gaps in the existing geomagnetically induced current (GIC) studies (e.g., the neglect of GIC fluctuation characteristics and multi-field coupling), and outlines the main method and the key contributions of our study.
1.1. Background
This section points out the adverse effects of a GIC on transformers during geomagnetic storms and the potential threats to power grid security, providing a realistic background for follow-up research.
In recent years, large-scale power outages caused by (quasi-)DC disturbances in transformers have occurred frequently worldwide [1,2]. GICs, induced by geomagnetic storms, have attracted significant attention as a major cause of transformer DC bias [3]. Under GIC intrusion, a transformer exhibits an unstable performance of excitation saturation and parameter distortion [4]. These situations are accompanied by the abnormal vibration and noise of components [5,6], which may affect the stable operation of equipment [7], and even endanger the security and reliability of the power grid [8,9].
1.2. Literature Review and Motivation
In this section, by comparing the limitations of the existing research, the necessity of distinguishing the GIC components of different fluctuation characteristics and establishing a multi-field coupling model is proposed, and the research gap and innovation direction are clarified.
In recent years, many researchers have extensively explored the impacts of GICs on power transformers. Bejmert et al. proposed two algorithms to stabilize differential protection under GICs by leveraging the differential current change rate and the DC component of the neutral point current, addressing the maloperation risks caused by saturation-induced harmonics [10]. Duan et al. developed a saturated transformer model incorporating B-H magnetization curves to quantify the GIC effects on core saturation and multi-physical responses [11]. Rezaei-Zare derived an analytical model for reactive power loss in single-phase transformers under a GIC, revealing the nonlinear relationship between reactive loss and the GIC [12]. Further advancing this field, Rezaei-Zare et al. introduced a duality-based transformer model considering tank air gaps and magnetic shielding, quantifying GIC-induced electromagnetic saturation, harmonic generation, and reactive power dynamics [13]. Recently, Saleh et al. investigated the role of transformer load levels in GIC harmonic distortion, finding minor load effects with dominant second harmonics [14]. Notably, Abuhussein and Sadi explored negative sequence harmonics from a GIC in transformers, revealing high-voltage transformers are more susceptible and second/fifth harmonics are prominent, even affecting the isolated sides [15]. Complementary research by Zheng et al. analyzed the GIC flow paths in Yg-Y and Yg-Δ transformers, showing uneven distribution during asymmetrical saturation and potential protection system impacts due to low-frequency GIC characteristics [16].
However, the existing research has two critical limitations: First, most studies treat a GIC as unified DC bias excitation, neglecting the time-domain fluctuation characteristics of a GIC. For example, while prior analyses addressed the harmonic characteristics and flow paths of GICs, they did not compare the multi-physics coupling effects between the fluctuating component (e.g., high-frequency fluctuations from rapidly changing geomagnetic horizontal components) and the constant component (e.g., slow variations during the decay phase of geomagnetic storms) [14,15,16]. Similarly, the strength of a GIC was directly evaluated using the DC level [10,11]. This gap hinders our understanding of the dynamic evolution mechanisms for abnormal transformer vibrations and noise. Second, the existing models lack the systematic characterization of multi-field feature coupling relationships. Although electromagnetic coupling models were successfully built, they did not integrate mechanical vibration and acoustic propagation into a unified framework, making it difficult to reveal the dynamic correlations among winding currents, magnetic flux, electromagnetic forces, vibration acceleration, and noise under GIC disturbance [11,13].
In summary, the existing studies have analyzed the impact of GIC intrusion on transformers from multiple perspectives. However, the changes in multi-field feature information and their coupling relationships within the transformer under GIC intrusion have not been thoroughly explored. On the other hand, the fluctuating component in a GIC is more severe and complex than the constant component, and it has a greater impact on the anomaly identification of transformers and other equipment. Therefore, the disturbance difference between the two components needs to be further studied.
1.3. Main Methods and Contributions of This Work
This section describes the core methods and three major contributions of this research, providing a framework for subsequent model construction, simulation, and experiment analysis and laying the foundation for research in the future.
To address the aforementioned issues, this study classifies GICs into a fluctuating component and a constant component according to the different fluctuation characteristics. The intrusion path of a GIC into power grid transformers is studied, and a multi-physics model of the transformer is constructed based on electromagnetic–mechanical–acoustic coupling (EMAC). Moreover, a multi-field feature extraction method is proposed. The electromagnetic features are solved by the finite element method, and the stress of the components is calculated. The electromagnetic–mechanical coupling model is built to solve the vibration acceleration of the components. Then, the spatial–temporal distribution of sound pressure is calculated by mechanical–acoustic coupling. Taking a Yd-connected three-phase three-limb transformer as an example, the current, magnetic flux, vibration, and noise of winding and the core are simulated and analyzed under GIC intrusion. Thus, the disturbance difference between the fluctuating component and the constant component is revealed. Meanwhile, a dynamic experimental platform is built to collect electrical, mechanical, and acoustic signals, and consistency between the experiments and the simulations is verified. On this basis, multimodal feature information domains are established to delineate the state intervals, and the stability threshold criteria are further formed.
The contributions of this article are summarized as follows.
(1) A novel electromagnetic–mechanical–acoustic coupling model is proposed to characterize the multi-physics interactions in transformers under geomagnetically induced current (GIC) disturbance. By integrating electromagnetic excitation, mechanical vibration, and acoustic propagation paths, this model quantifies the dynamic evolution of critical parameters (e.g., magnetic flux, vibration acceleration, and noise levels), addressing the limitations of single-field analysis in the existing studies.
(2) A refined classification of GIC disturbance is introduced, distinguishing fluctuating and constant component disturbance based on their time-domain mutation patterns and fluctuation intensity. This approach reveals that the fluctuating component induces the transient intensification of both vibrations and noise (e.g., abrupt spikes in mechanical and acoustic anomalies), while the constant component exhibits steady disturbance with minimal transient impacts, challenging the conventional equivalence of a GIC to pure DC bias effects.
(3) Based on the validated consistency between the simulations and the experiments, multimodal feature information domains are developed by systematically fusing the electromagnetic, mechanical, and acoustic parameters. This framework delineates the operational state intervals of the transformer under GIC intrusion using the disturbance level as the key indicator. The stability threshold criteria are subsequently established to support fault identification and equipment protection in GIC scenarios.
This article is structured as follows: Section 1 has introduced the background, research gaps, and contributions. Section 2 details the EMAC model and the experimental setup. Section 3 analyzes the disturbance differences between the fluctuating component and the constant component using the simulation and experimental results. Section 4 establishes the stability thresholds, while Section 5 concludes with engineering implications.
2. Materials and Methods
This chapter details the methodology for analyzing transformer behavior under a GIC, including the classification of GIC components, the development of a multi-physics coupling model, and procedures for both numerical simulations and experimental validation.
2.1. Analysis of GIC Time-Domain Fluctuation Characteristics
This section analyzes the time-domain fluctuation characteristics of a GIC based on the field data from the Ling’ao Nuclear Power Plant, providing the foundation for component classification.
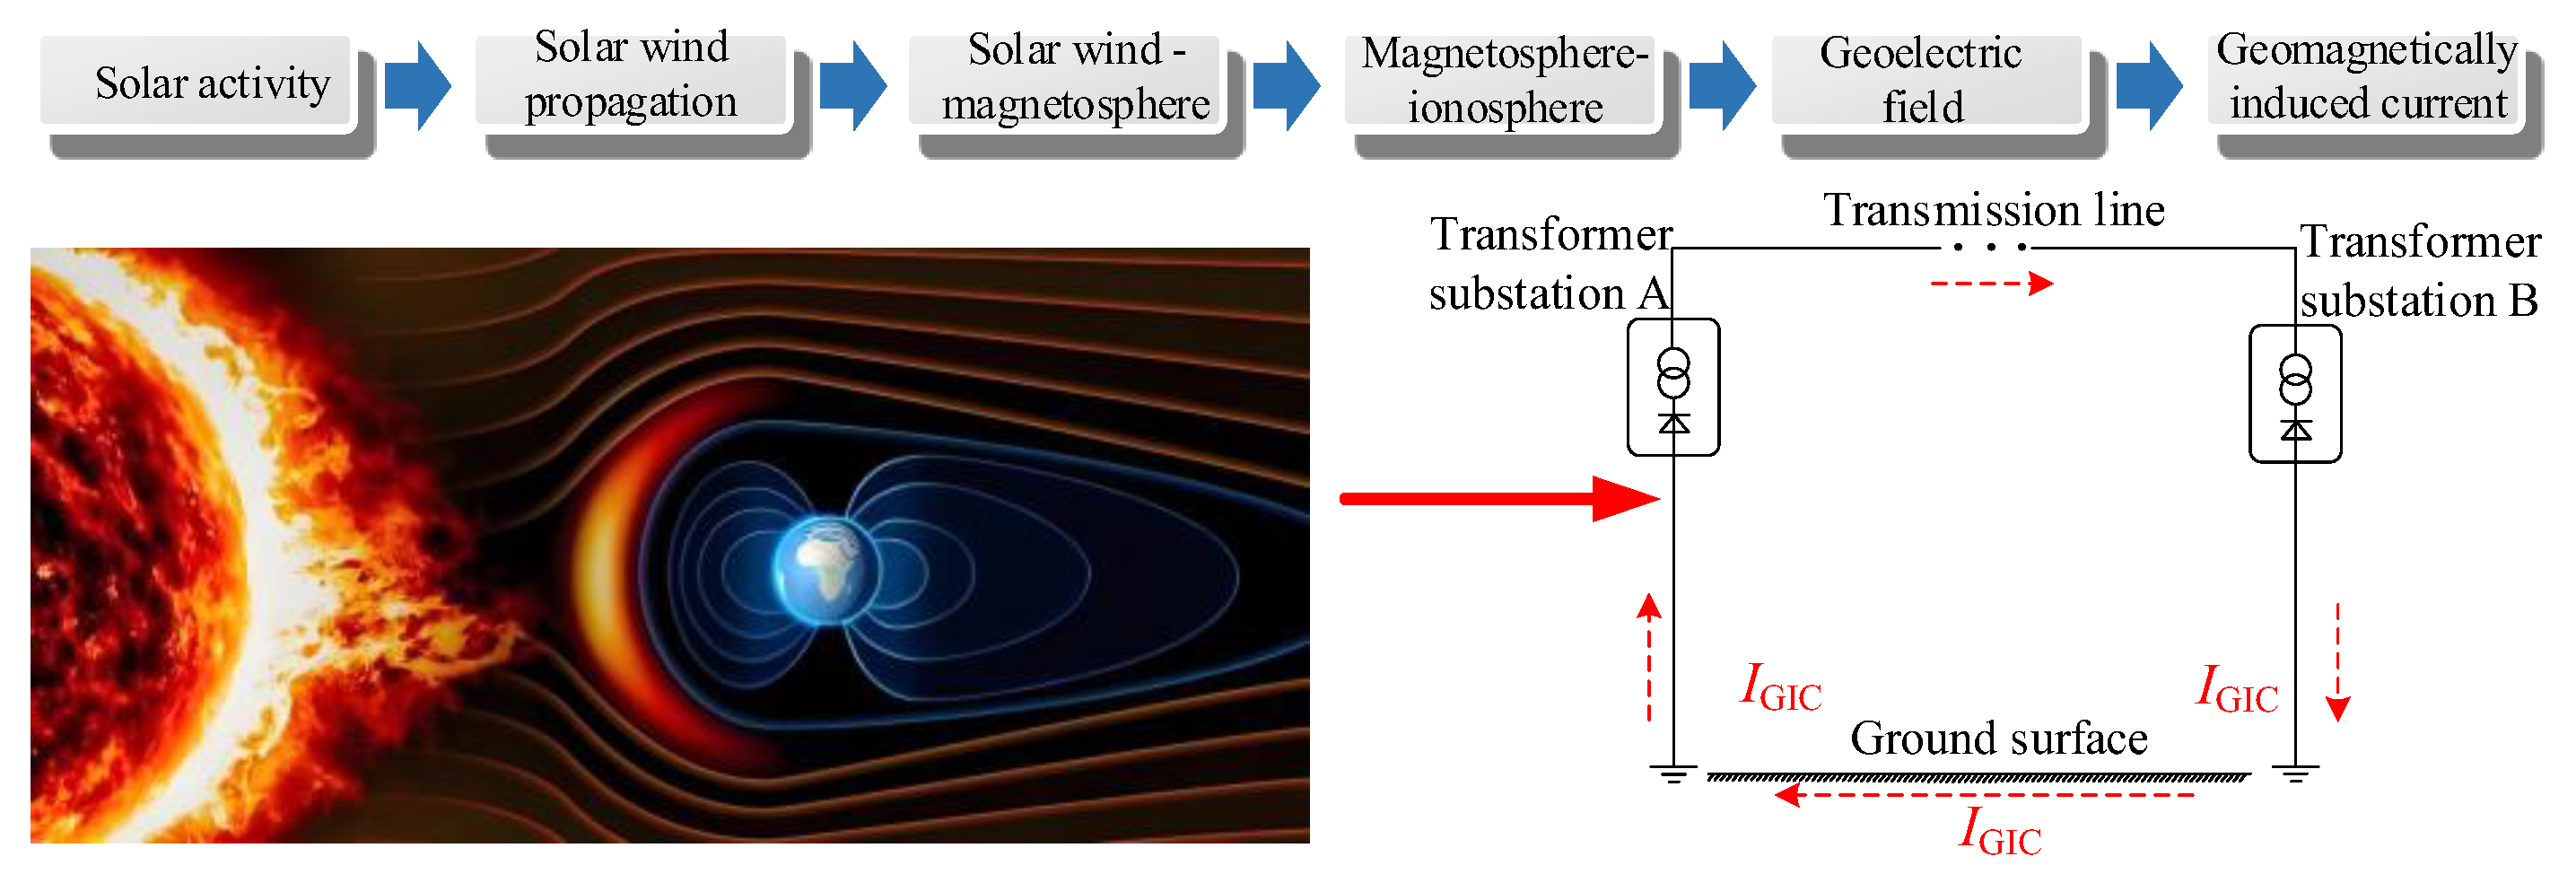
Geomagnetic storms caused by solar activity result in global disturbances in the Earth’s magnetic field. This phenomenon induces ground potential differences between substations, generating a GIC that flows through grounded transformers into the power grid [15]. The disturbance current, defined as IGIC, has an intrusion path into power grid transformers, as illustrated in Figure 1.
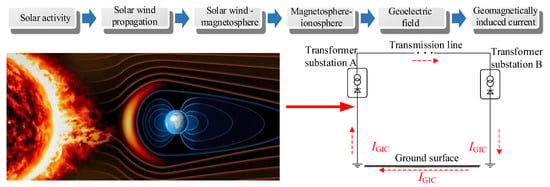
Figure 1.
Intrusion path of IGIC into power grid transformers.
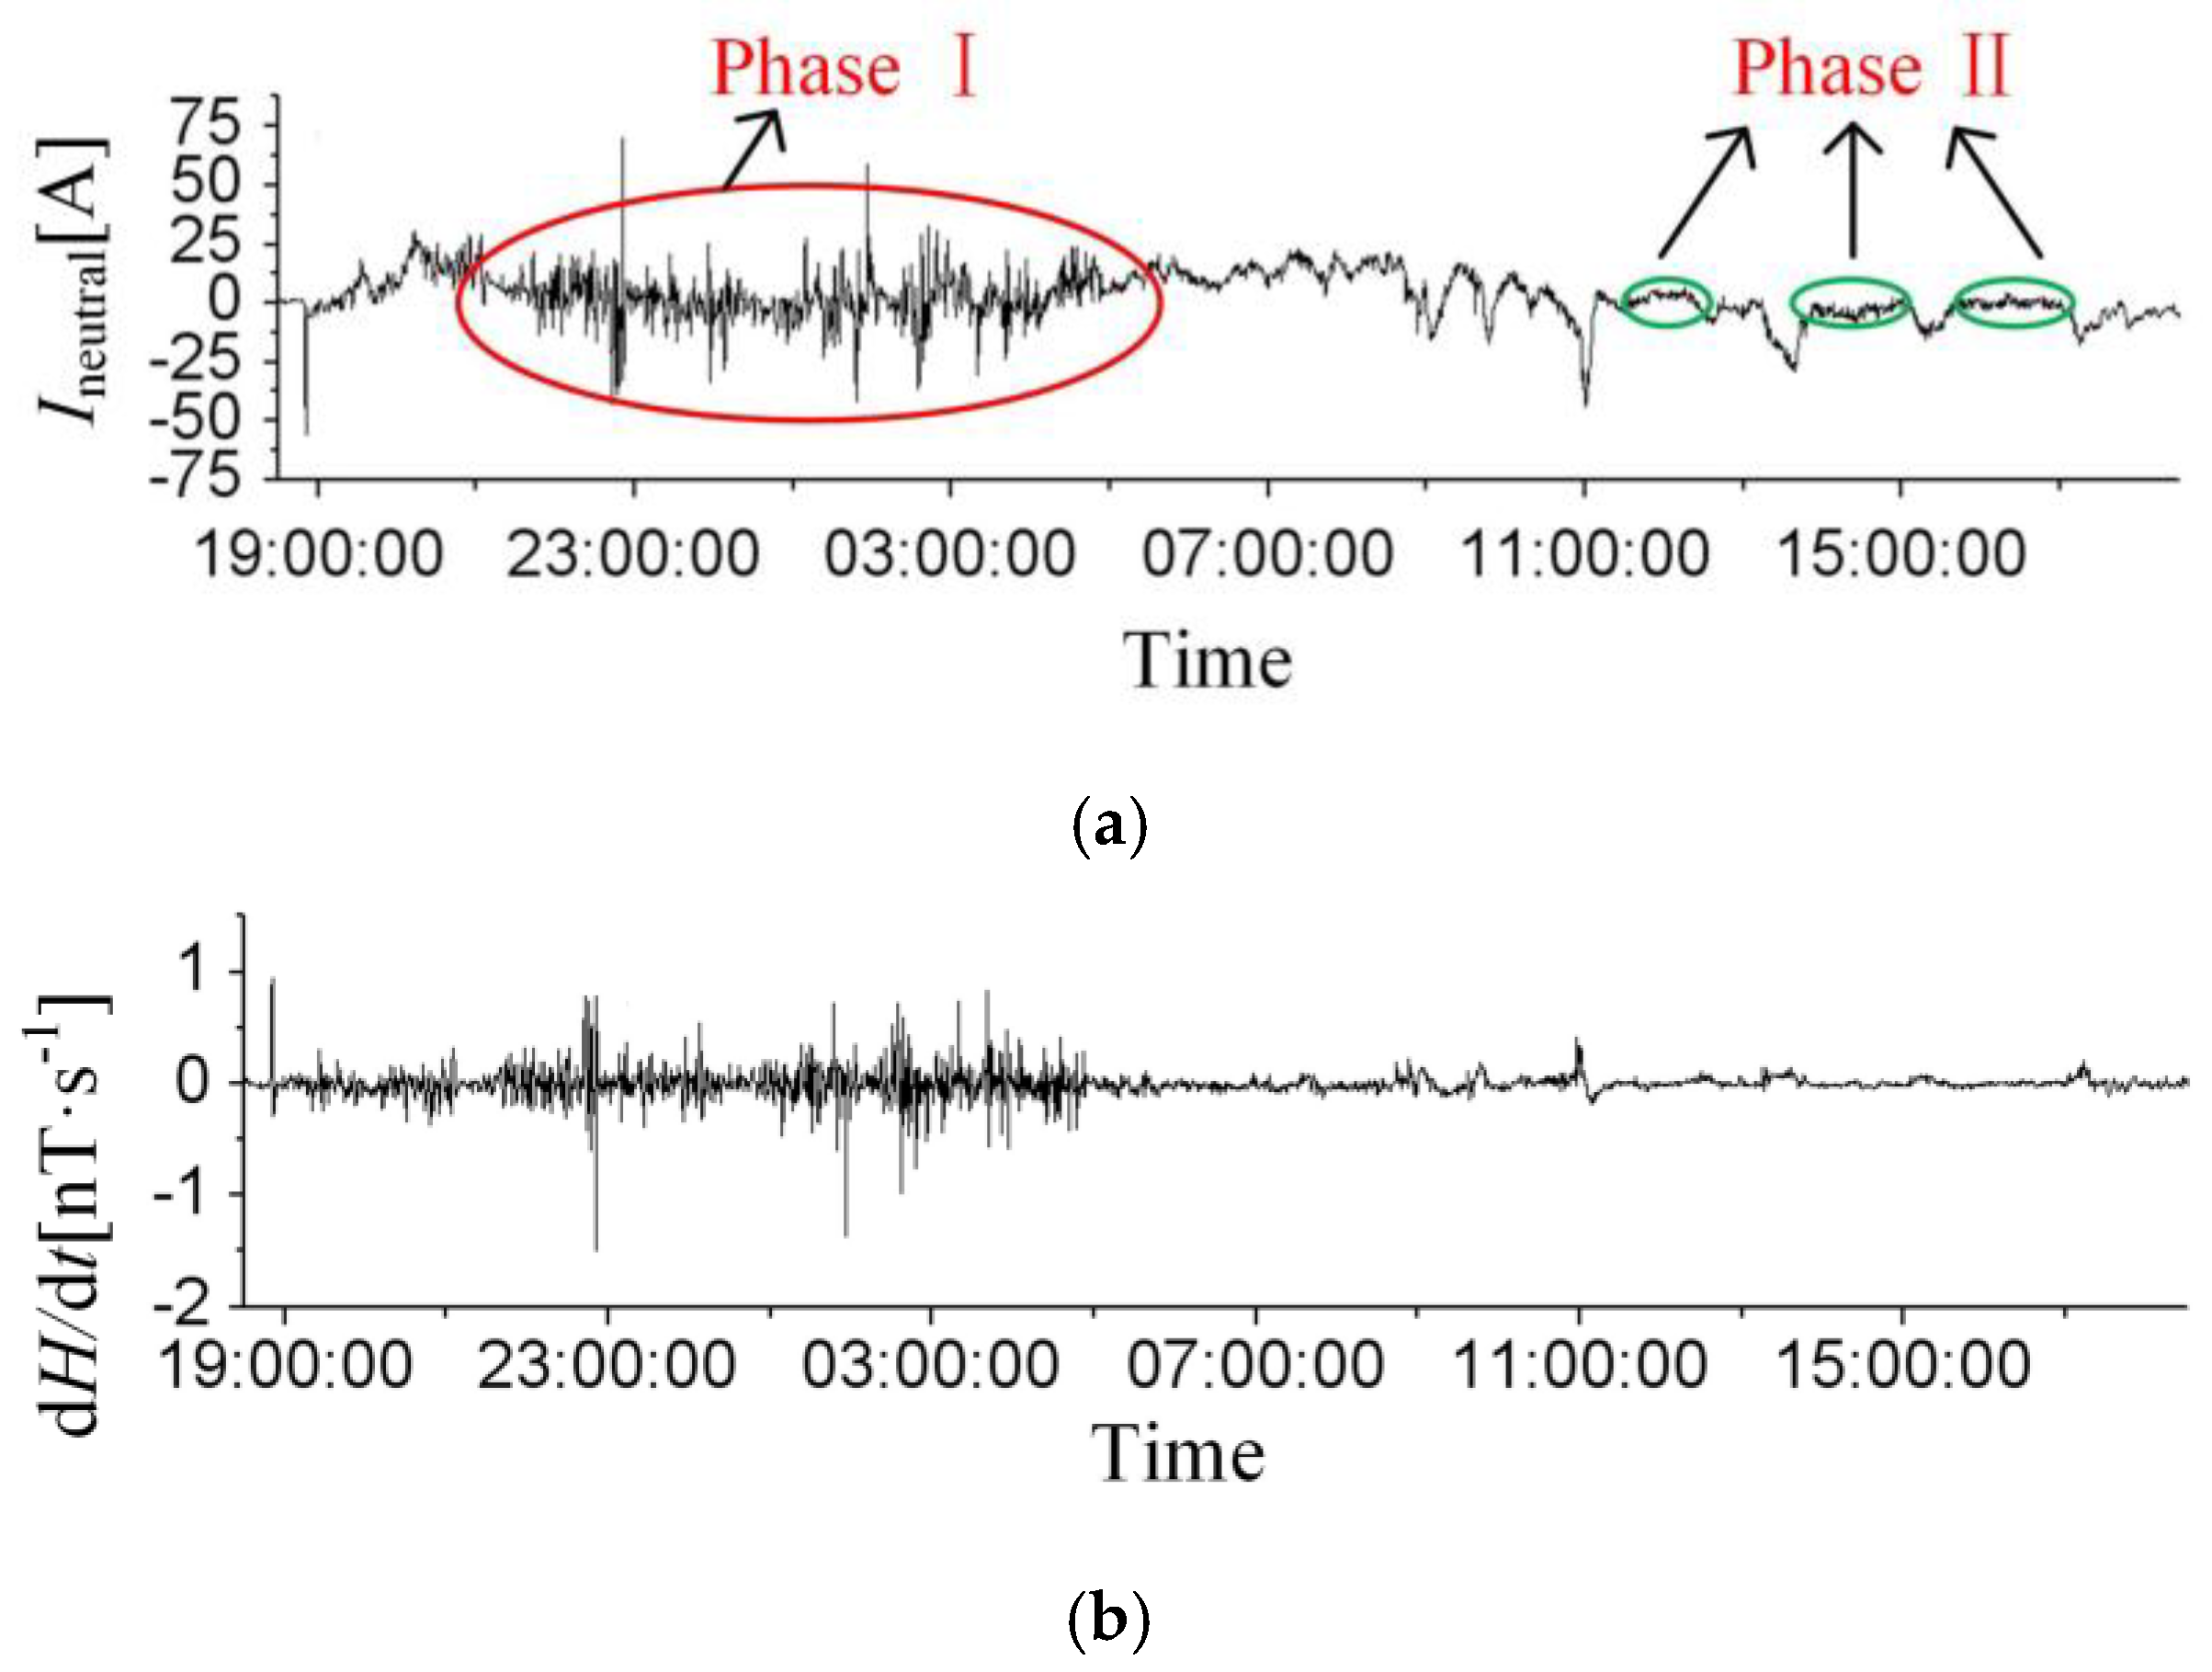
Based on the measured data of geomagnetic storm intrusion into the Guangdong Ling’ao Nuclear Power Plant, the time-domain fluctuation characteristics of IGIC are analyzed. The monitoring data of the neutral point current in the main transformer during a typical geomagnetic storm day are shown in Figure 2a, and the variation rate of the geomagnetic horizontal component monitored by the Zhaoqing geomagnetic observatory is shown in Figure 2b [17].
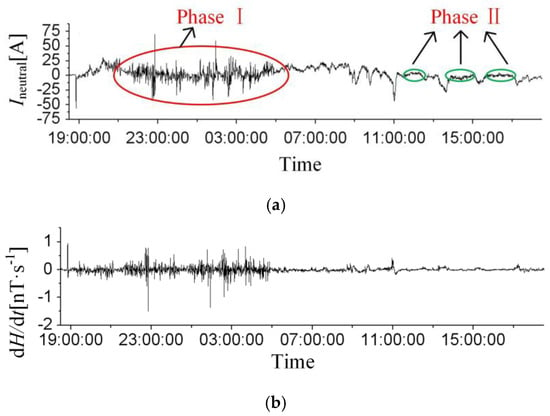
Figure 2.
Monitoring data of (a) neutral point current in main transformer; (b) variation rate of geomagnetic component.
As shown in Figure 2, the neutral point current of the main transformer is closely correlated with the variation in the geomagnetic horizontal component, with their peak moments perfectly coinciding. Investigation reveals that the nearby HVDC system was not operating in monopole mode during this period, confirming that the neutral point current is IGIC induced by geomagnetic storms. As shown in Figure 2a, the GIC in phase I exhibits significant fluctuations (up to ±70 A), while in Phase II, the amplitude variation is confined to ±3 A over an hourly scale. This distinction arises from the differing geomagnetic activity states:
Phase I corresponds to intense solar wind–magnetosphere interactions, driving rapid variations in the geomagnetic horizontal component. Therefore, IGIC in phase I is defined as the fluctuating component If.
Phase II represents the decay phase of geomagnetic activity, where stabilized solar wind conditions lead to subdued dH/dt variations. At the power frequency cycle scale (20 ms), these slow GIC fluctuations can be approximated as DC, aligning with the “constant component Ic” definition.
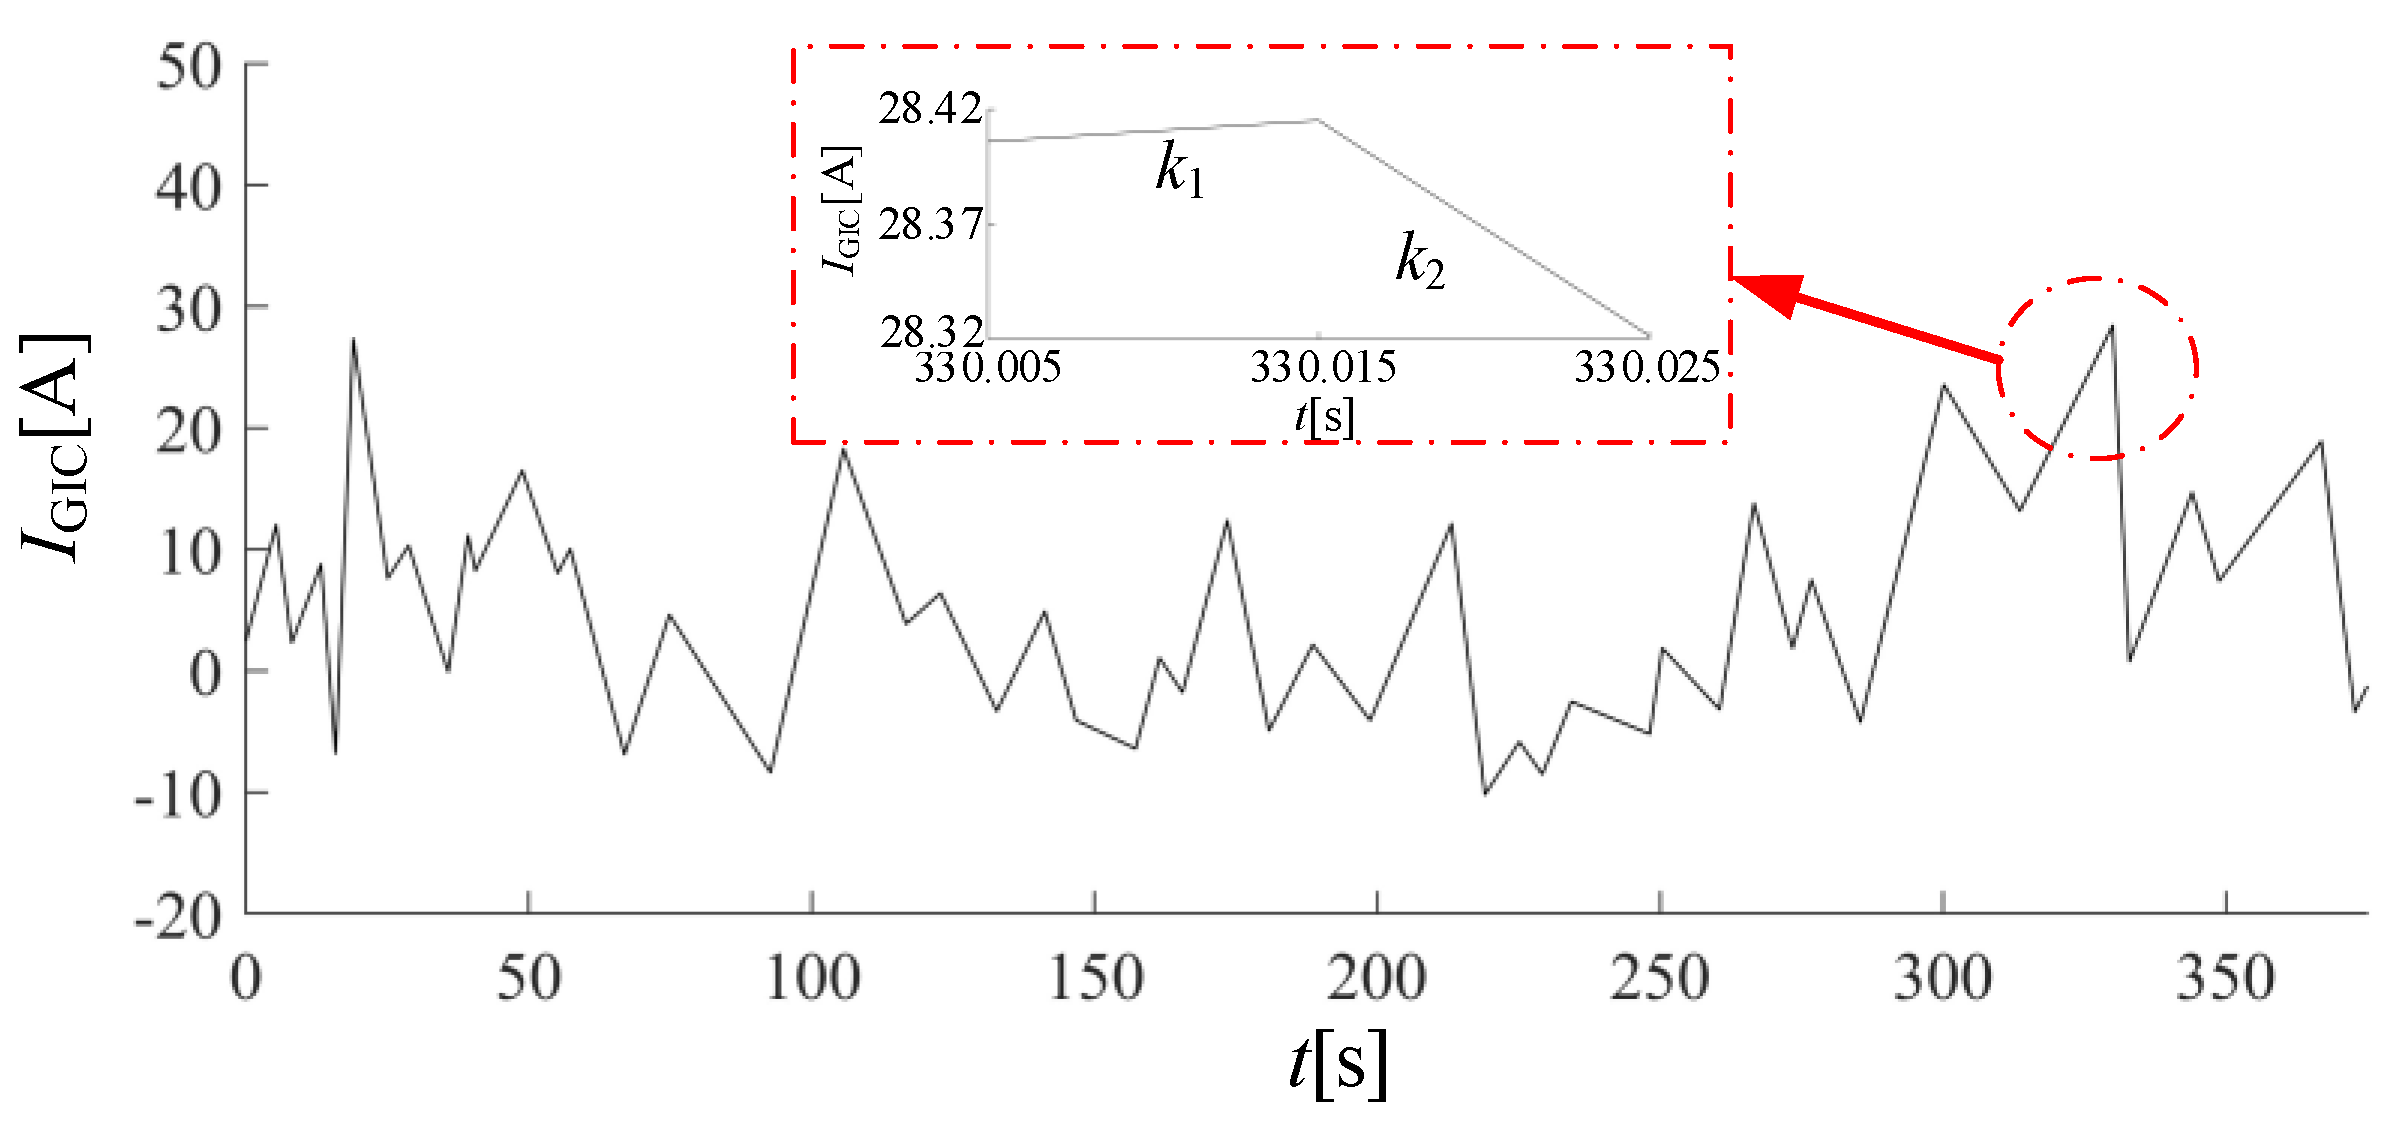
Further, a typical time period within phase I of the geomagnetic storm day is selected, as shown in Figure 3. The fluctuation in IGIC exhibits instantaneous mutations and long-term continuous changes, which are relatively slow compared to the power frequency cycle (0.02 s for 50 Hz systems). Therefore, it can be regarded as quasi-DC.
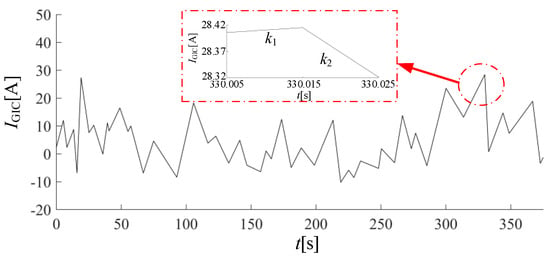
Figure 3.
Monitoring data of IGIC during typical time period within phase I.
In addition, the GIC monitoring data in Figure 3 exhibit a nominal sampling interval of 3 s, with occasional extensions to 5–15 s due to transient communication delays (no long-term data gaps). Importantly, GIC variations during geomagnetic storms exhibit low-frequency characteristics (minute-to-hour scales), and their key features—such as abrupt mutations and amplitude trends—can be effectively analyzed even with extended sampling intervals. The typical fluctuating component in this study was identified based on actual sampled data points. Linear interpolation was employed solely for visualization purposes and does not compromise the reliability of core conclusions. In summary, non-uniform sampling and interpolation align with the low-frequency nature of GICs and the macroscopic research objectives. These treatments do not affect the validity of the disturbance difference analysis between fluctuating and constant components.
2.2. Modeling Process
Building on the GIC classification, this section develops the EMAC model to quantify the electromagnetic, mechanical, and acoustic interactions.
With GIC disturbance, the transformer exhibits an unstable performance of excitation oversaturation, current distortion, and leakage increase. Then, the increased stress of the transformer components is caused by the deviation of electromagnetic parameters, which may lead to abnormal vibration and noise. Therefore, the propagation path of GIC disturbance is formed in the electromagnetic–mechanical–acoustic field through the aforementioned processes.
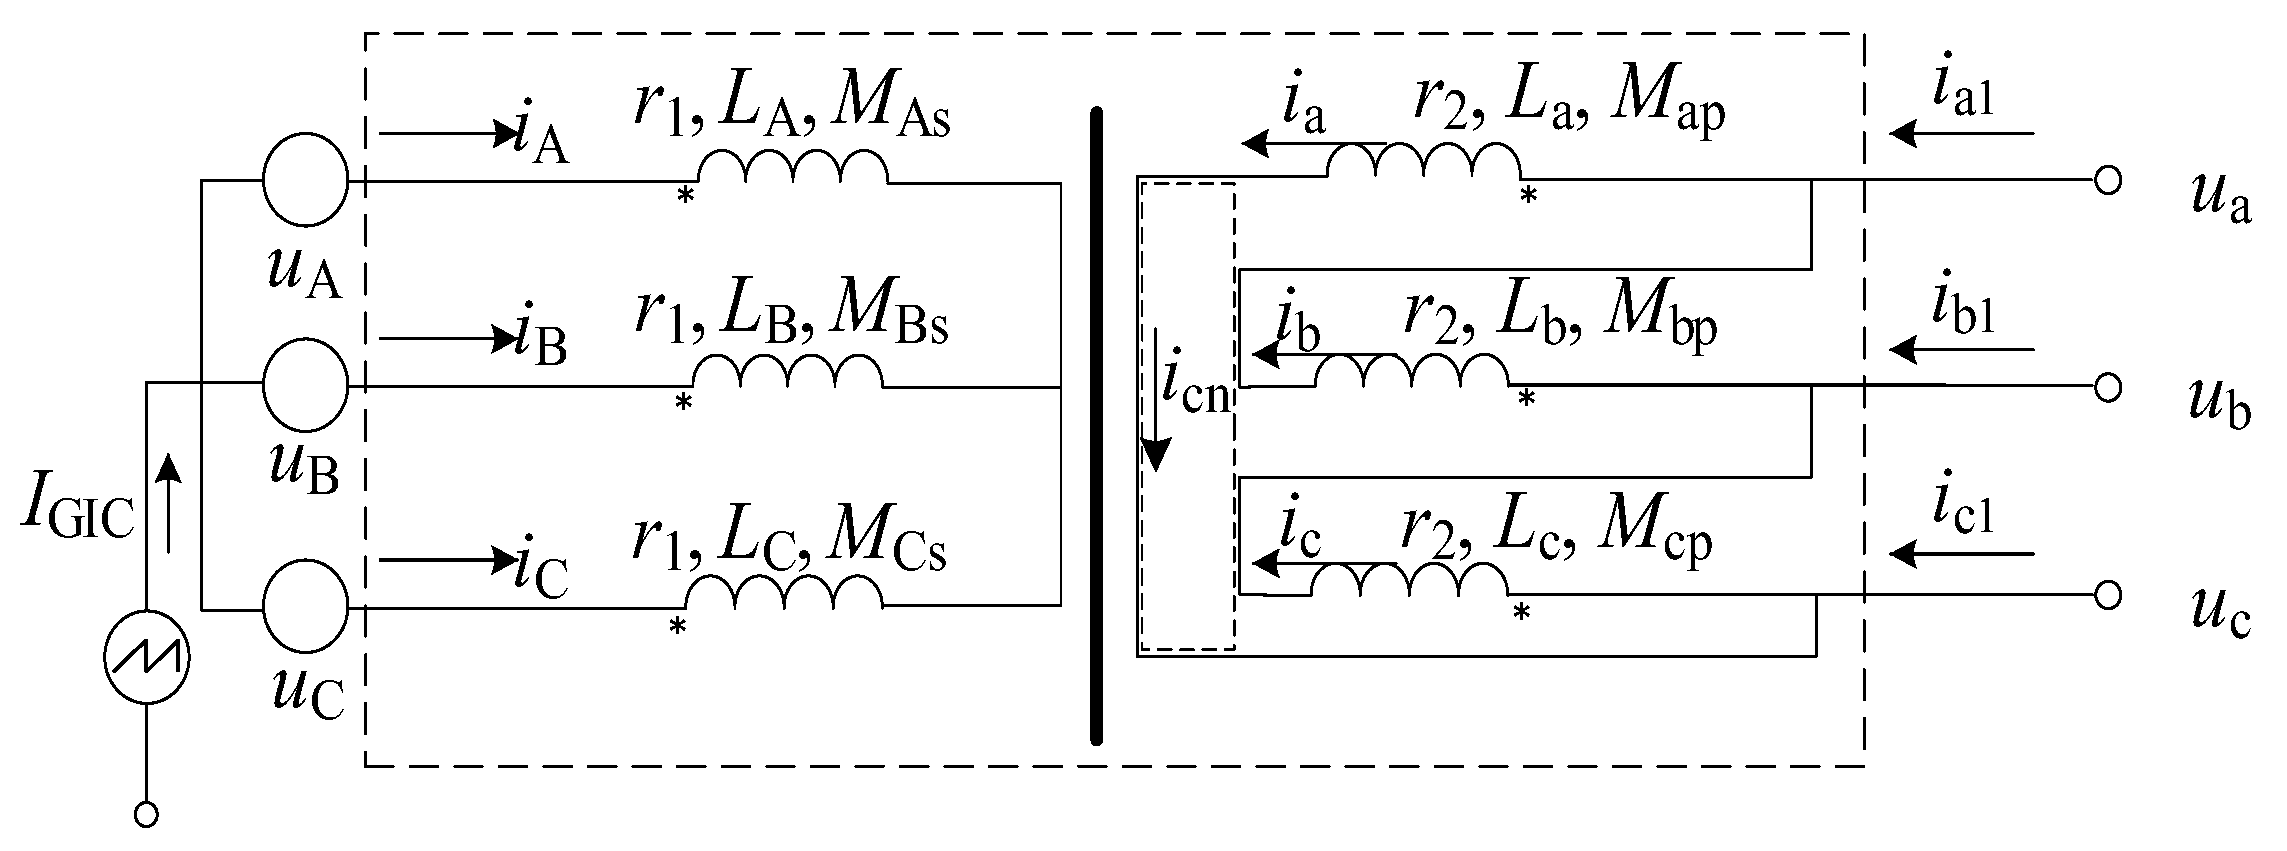
A circuit model of a three-phase transformer under GIC disturbance is established as shown in Figure 4, with the disturbance current injected from the primary side.
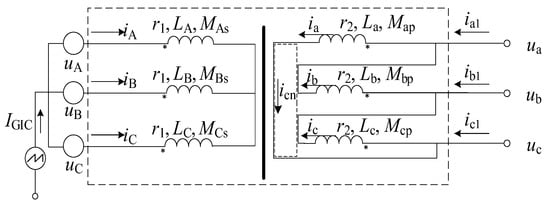
Figure 4.
Circuit model of three-phase transformer with GIC disturbance. * denotes the terminals of the same polarity.
Here, uA, uB, and uC are the primary side voltages; iA, iB, and iC are the primary side currents; ua, ub, and uc are the secondary side voltages; ia1, ib1, and ic1 are the secondary port currents; icn is the secondary-side circulating current in the delta-connected windings; r1 and r2 are the winding resistances; and LA/LB/LC and La/Lb/Lc are the primary/secondary self-inductances. The mutual inductances MAs/MBs/MCs represent couplings between the primary windings (A/B/C) and the secondary windings, while Map/Map/Map denote couplings between the secondary windings (a/b/c) and the primary windings.
The time-domain circuit differential equation is derived as follows:
In Equation (1), ids and idp represent the current increments induced by mutual inductance coupling in the primary and secondary windings, respectively. Specifically, ids arises from the interaction of primary-side mutual inductances (MAs, MBs, and MCs), which model electromagnetic coupling between the primary-phase windings (A, B, and C) under GIC disturbance. Conversely, idp stems from the secondary-side mutual inductances (Map, Mbp, and Mcp), describing the current interactions within the secondary windings (a, b, and c). These terms are critical to capturing cross-phase electromagnetic interactions in the transformer circuit. Additionally, UGIC is the voltage drop induced by IGIC.
The magnetic model with GIC disturbance is established, and the model was solved by Galerkin [18].
where GGIC is the Galerkin residual; Mm is the vector weight function; v is magnetic reluctivity; A is the vector magnetic potential; JAC is the AC excitation current density; JGIC is the disturbance current density; n is the normal vector; dV is the differential increment of volume integral; and dS is the differential increment of the surface integral.
The above equation is discretized to obtain a system of algebraic equations from which A can be solved. Then, the electromagnetic parameters, such as magnetic flux density B, magnetic field intensity H, and magnetic field energy W, can be further calculated.
The electromagnetic force on the component can be calculated through the solved parameters in electromagnetic model.
where Fk is the electromagnetic force of the coil or iron core in the direction k, and the definition range of k is {x, y, z}.
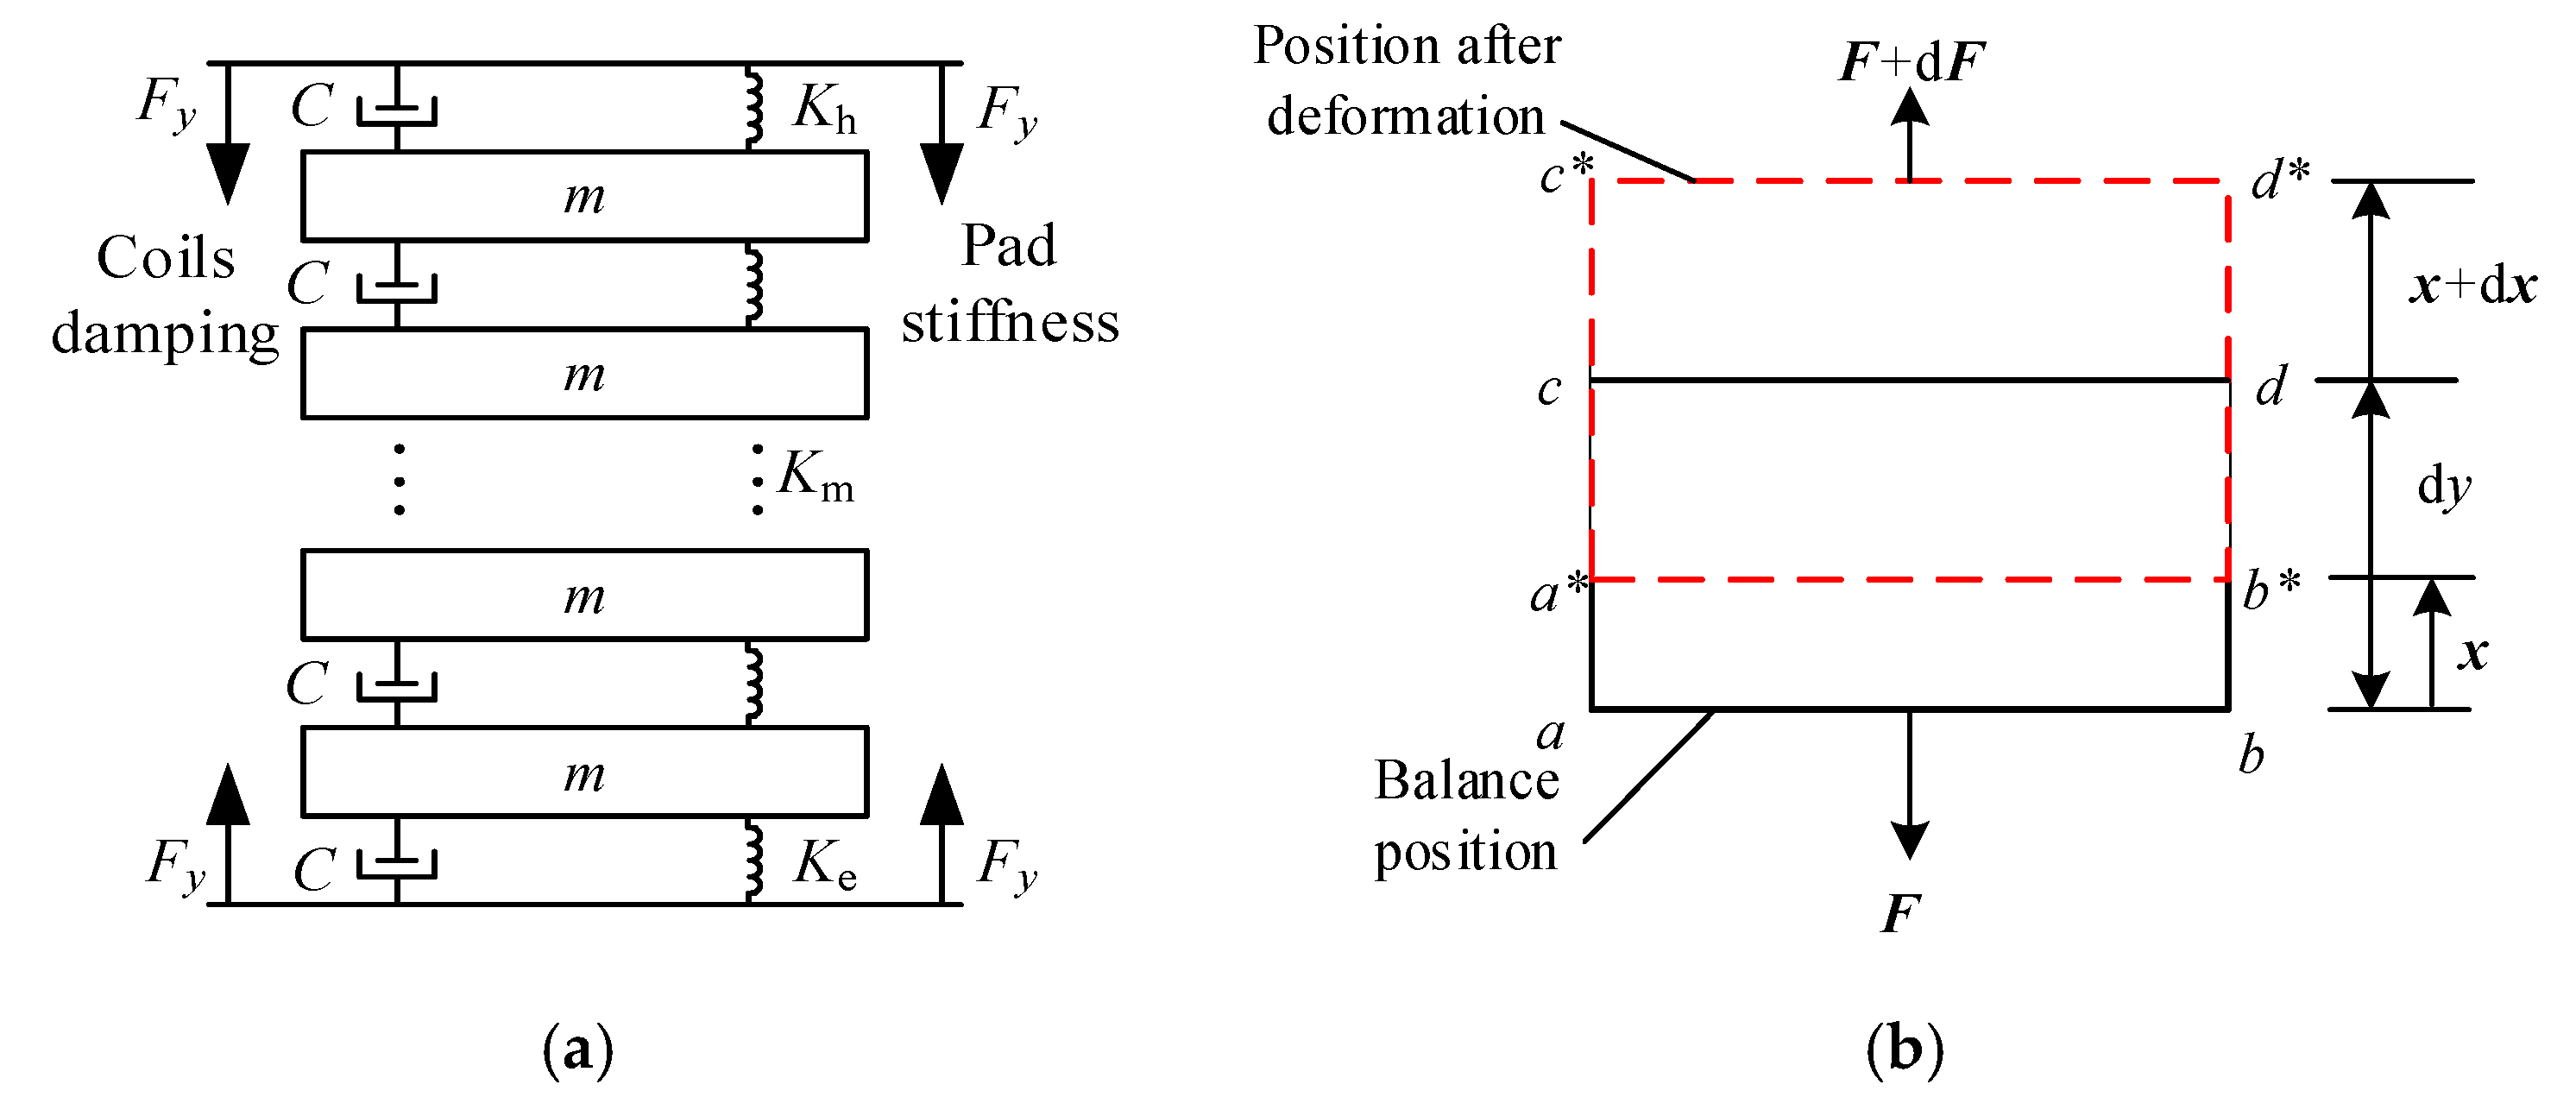
With electromagnetic force F as the excitation of mechanical model, electromagnetic–mechanical coupling is achieved. A more significant axial force scenario is focused on in this paper, and the axial mechanical models of the winding and core are shown in Figure 5.
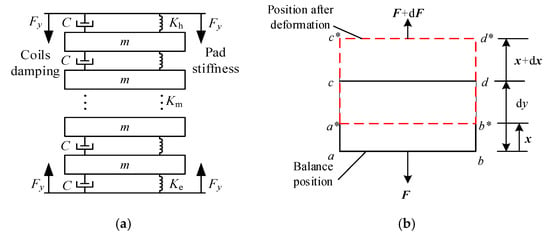
Figure 5.
Mechanical model of transformer winding and core. (a) Mechanical model of winding. (b) Mechanical model of core. * indicates the position after disturbance.
In Figure 5a, pie winding is replaced by a rigid mass block, the coil damping is represented by a damper, and the insulation pads are represented by springs. The pre-tightening force of the end pads is set as Fy. The mathematical model for the axial mechanical vibration of winding is built [19].
where n is the number of winding coils; m is the mass of a single pie winding; C is the damping coefficient; Kh, Km, and Ke are the stiffness coefficients of the head, middle, and end pads, respectively; sw, v, and g are the displacement, velocity, and acceleration vectors of the winding node; and Fw and G are the electromagnetic force and gravity of the transformer winding. Since the stiffness of the insulation pads and winding coils remains essentially unchanged, the material parameters can be considered constant when the pre-tightening force is constant.
Figure 5b shows the axial vibration equivalent model of the core. F + dF represents the force on the cross-section of the core unit.
where E is Young’s modulus; ∂x/∂y is axial strain; f(y, t) is the magnetostrictive force on this mass unit; y and t are position and time, respectively; ρ is iron core density, defined as 7650 kg/m3; and Sc is the cross-sectional area, with a value of 0.00836 m2.
Vibration acceleration g can be calculated by vibration displacement s.
Subsequently, an acoustic fluctuation model is further constructed to study the noise effects of the transformer. The vibration acceleration g obtained from the electromagnetic–mechanical model is used as the excitation for the acoustic model, thereby achieving mechanical–acoustic coupling.
where ρk denotes air fluid density, with a value of 1.21 kg/m3; qd stands for the dipole domain source, representing periodic forces from vibrating surfaces (e.g., core/windings) that drive acoustic excitation; pt is the total sound pressure; pb is the background sound pressure (set to 0 Pa due to the ideal environment); and p is the transformer sound pressure.
The acoustic field fluctuations around the winding and core are calculated based on acoustic principles.
where v is the speed of sound; Q denotes the monopole domain source, representing a volumetric pulsation source, where periodic expansion or contraction of a small fluid volume (e.g., air in the transformer’s surrounding medium) generates spherical sound waves.
By analyzing the sound pressure variations, the sound pressure level Lp of the transformer is calculated.
where P is the valid value of the sound pressure; Pref is the reference sound pressure, taken as 20 μPa.
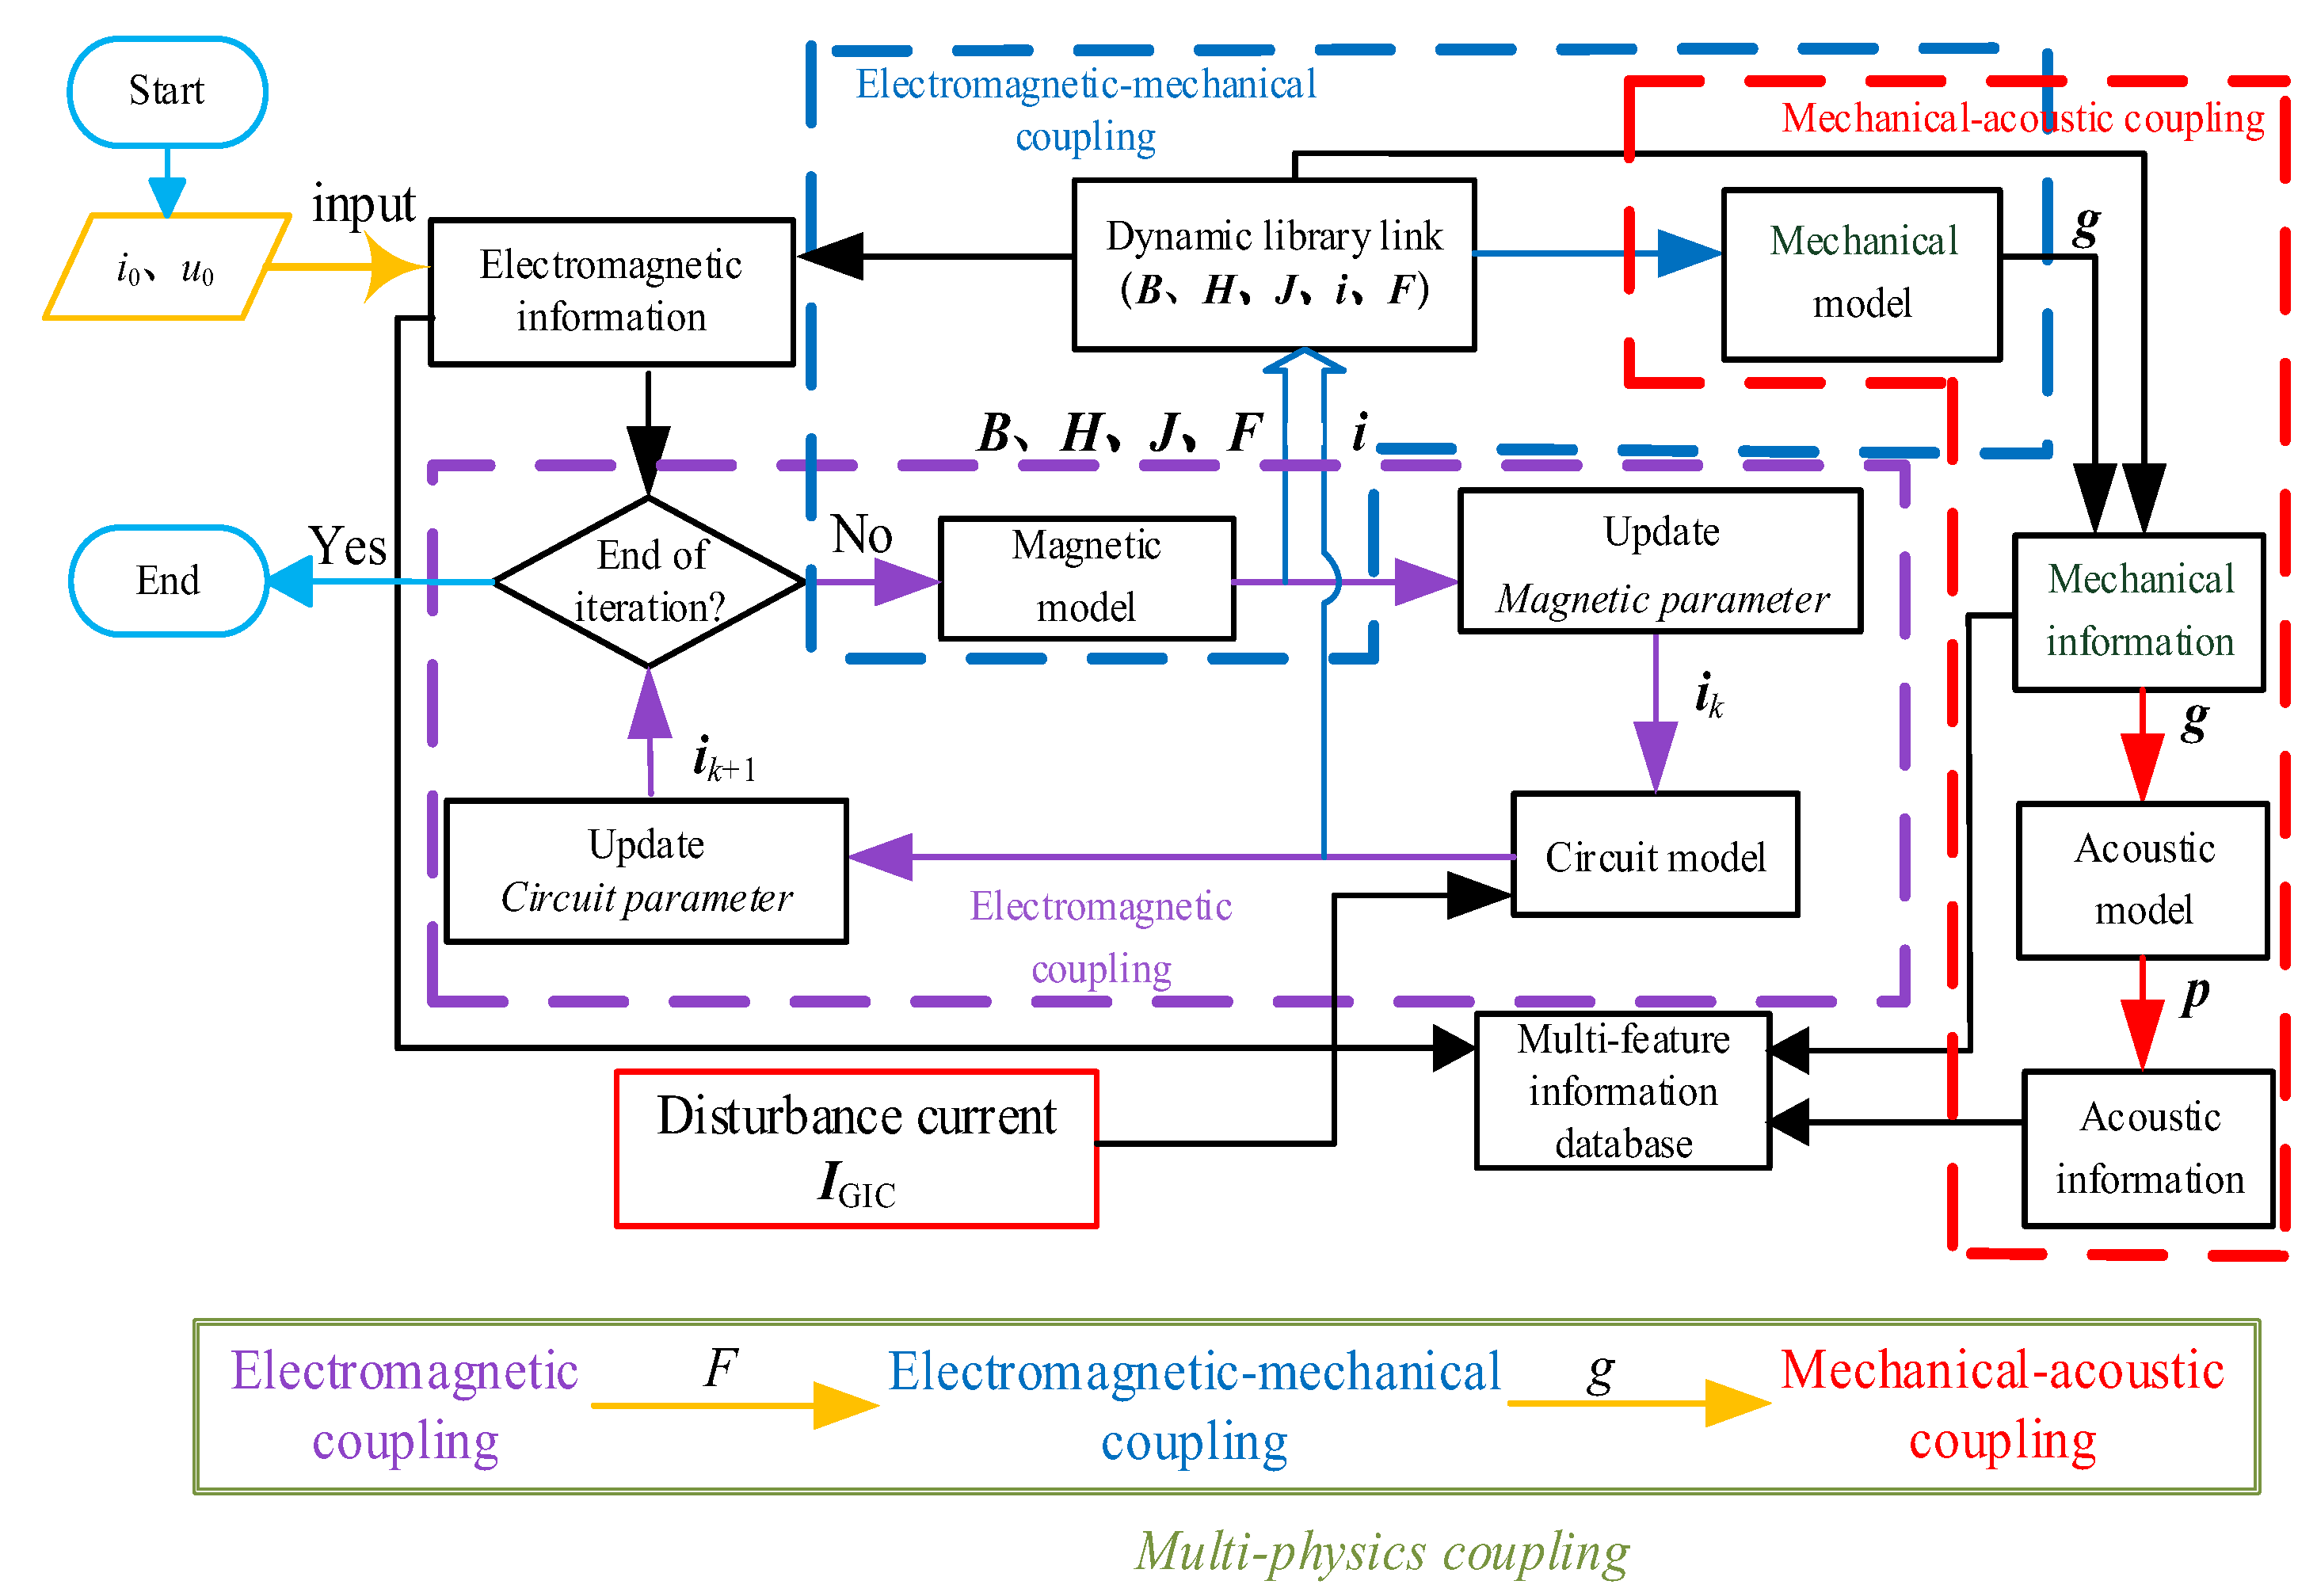
Based on electromagnetic–mechanical–acoustic sequential coupling, the multi-physics coupling model of the transformer is shown in Figure 6. By solving this model, the key feature parameters of each physical field can be extracted, and a multi-feature information database can be built. Time index and mode labels are introduced to correlate the feature information across different fields. The specific steps of the feature extraction method based on multi-field coupling are as follows:
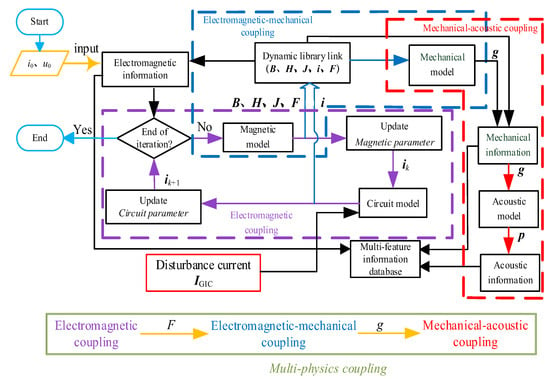
Figure 6.
Multi-physics coupling model of transformer.
(1) Electromagnetic coupling: With time t as the index, electromagnetic information at time tk is obtained. The winding current ik at tk is used as the excitation input to the current-carrying domain and the magnetic connected domain. Meanwhile, the control parameters (IGIC and load rate β, defined as the percentage of the actual load to the rated load (e.g., β = 0 for no load; β = 100% for full load)) are input. The electromagnetic spatial–temporal distribution of the transformer is solved to obtain the feature information such as magnetic flux density B.
(2) Electromagnetic–mechanical coupling: Based on the magnetic information obtained from the electromagnetic coupling, the electromagnetic force Fk of component at tk is calculated. In the mechanical vibration domain, Fk is taken as the excitation to obtain the vibration acceleration gk of the winding and the core.
(3) Mechanical–acoustic coupling: In the multi-feature information database, gk of the component at tk is extracted. In the noise propagation domain, gk is input as excitation to obtain sound pressure pk.
(4) The iterative process of feature information extraction: With t as the link index, the solution is found using the physical evolution mechanism of EMAC. The control parameters IGIC and β are used as mode labels, and the feature information of each field is stored in the multi-feature information database along with the corresponding control parameters. The field parameters are then updated for the next time step. If the absolute convergence norm is less than the preset threshold or the number of iterations does not reach the upper limit, the multi-field solution at time tk+1 is carried out; otherwise, the iteration ends.
Utilizing the proposed information extraction method, the multi-field spatial–temporal distribution of the transformer components can be studied under different disturbance currents and load conditions. Additionally, a multi-feature information database is constructed to facilitate the division of state intervals for the transformer under GIC intrusion.
2.3. Simulation Process
This section describes the preprocessing steps for numerical simulations, including the construction of a three-dimensional finite element model, the measurement of transformer parameters, and the definition of boundary conditions for the electromagnetic, mechanical, and acoustic domains.
Taking an actual three-phase three-limb transformer (BSS-1000VA, manufactured by Jianhua Electric Appliance Factory, Jilin, China) as the research object, a three-dimensional finite element model is constructed using finite element analysis software COMSOL Multiphysics 6.0. The specific parameters of the transformer are shown in Table 1.

Table 1.
Three-phase transformer parameters.
Given the complexity of the transformer structure, simplifications are made to the core, windings, and other components during the simulation modeling process to improve the stability and efficiency of the numerical calculations.
(1) The material parameters of the winding and core are obtained through tensile-compression tests and linearized. This approximation is valid for the quasi-static-to-low-frequency GIC disturbance investigated here, where material behavior remains within the linear elastic range [20].
(2) Microscale air gaps between the winding disks and the core laminations were omitted. Given the tight mechanical assembly of the experimental transformer, these gaps have a negligible impact on macroscale multi-field interactions (e.g., electromagnetic force–vibration correlations). This simplification aligns with the common practices in transformer modeling [21].
The different physical fields are preprocessed as follows:
(1) In electromagnetic coupling, a three-phase current is input to the coil as excitation for the electromagnetic model. The parallel outer boundary condition of magnetic induction is applied to the magnetic connected domain, while the other boundary conditions are set as the natural boundaries.
(2) In electromagnetic–mechanical coupling, the base of transformer is set as a fixed constraint considering the axial vibration of the components, while the other parts are set as default constraints.
(3) In mechanical–acoustic coupling, the environmental background sound pressure is set to 0 Pa, and it is assumed that external environmental noise has no effect on the transformer sound pressure. With the sound propagation boundary set to be a perfectly matched layer, sound reflection and refraction errors of sound are ignored.
Taking IGIC at the typical moment in the measured data of Figure 3 (k1 = 0.7529, k2 = −9.0613) as an example, the fluctuating component disturbance is set. Meanwhile, the corresponding constant component disturbance is set for comparison. The disturbance current control equation is as follows.
The disturbance control parameters include the disturbance level control factor h and the time-domain fluctuation control factor k, which are detailed in Table 2. Among them, h ∈ {0, 0.5, 1, 1.5, 2, 3} represents the DC disturbance level of IGIC, where h = 0 indicates no disturbance, and h ≥ 0.5 corresponds to increasing DC levels (e.g., h = 3.0 represents a severe disturbance condition); k = {k1, k2} = {0.7529, −9.0613}, representing the temporal variation in the disturbance current. This describes the rising and falling slopes of the disturbance current waveform, with a larger |k| indicating more abrupt fluctuations.

Table 2.
Disturbance control parameters.
Considering the different load modes (β = 0, 50%, 100%) in the operating condition control parameter, the variations in electromagnetic–mechanical–acoustic feature parameters are simulated and analyzed in different modes.
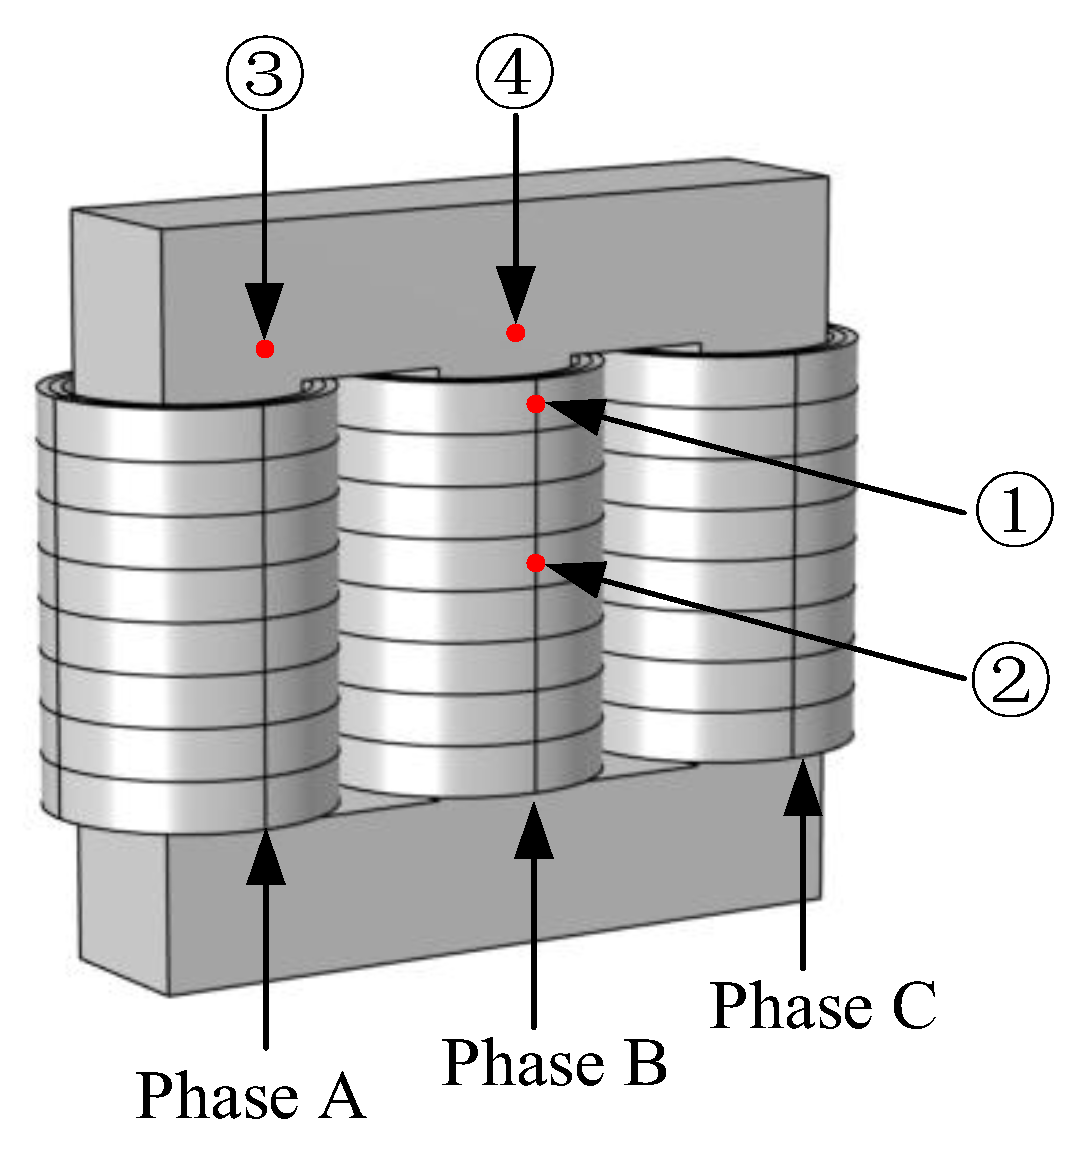
The observation points ①–④ are arranged considering the structural characteristics of transformer, as shown in Figure 7.
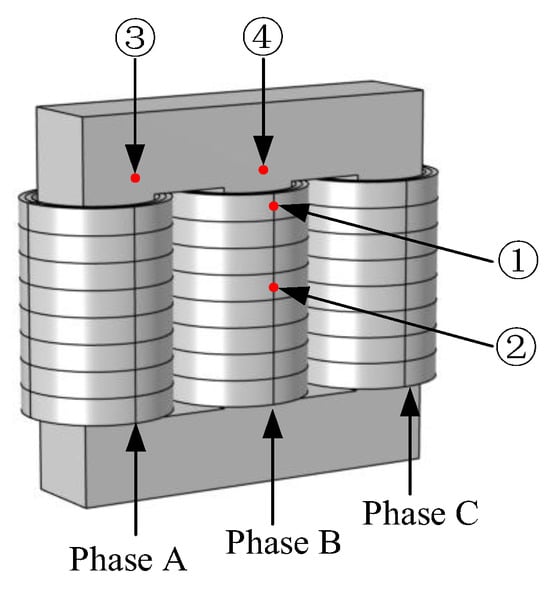
Figure 7.
Observation point distribution of transformer.
2.4. Experimental Process
This section outlines the experimental steps for acquiring multi-physics signals, providing the basis for virtual–physical validation.
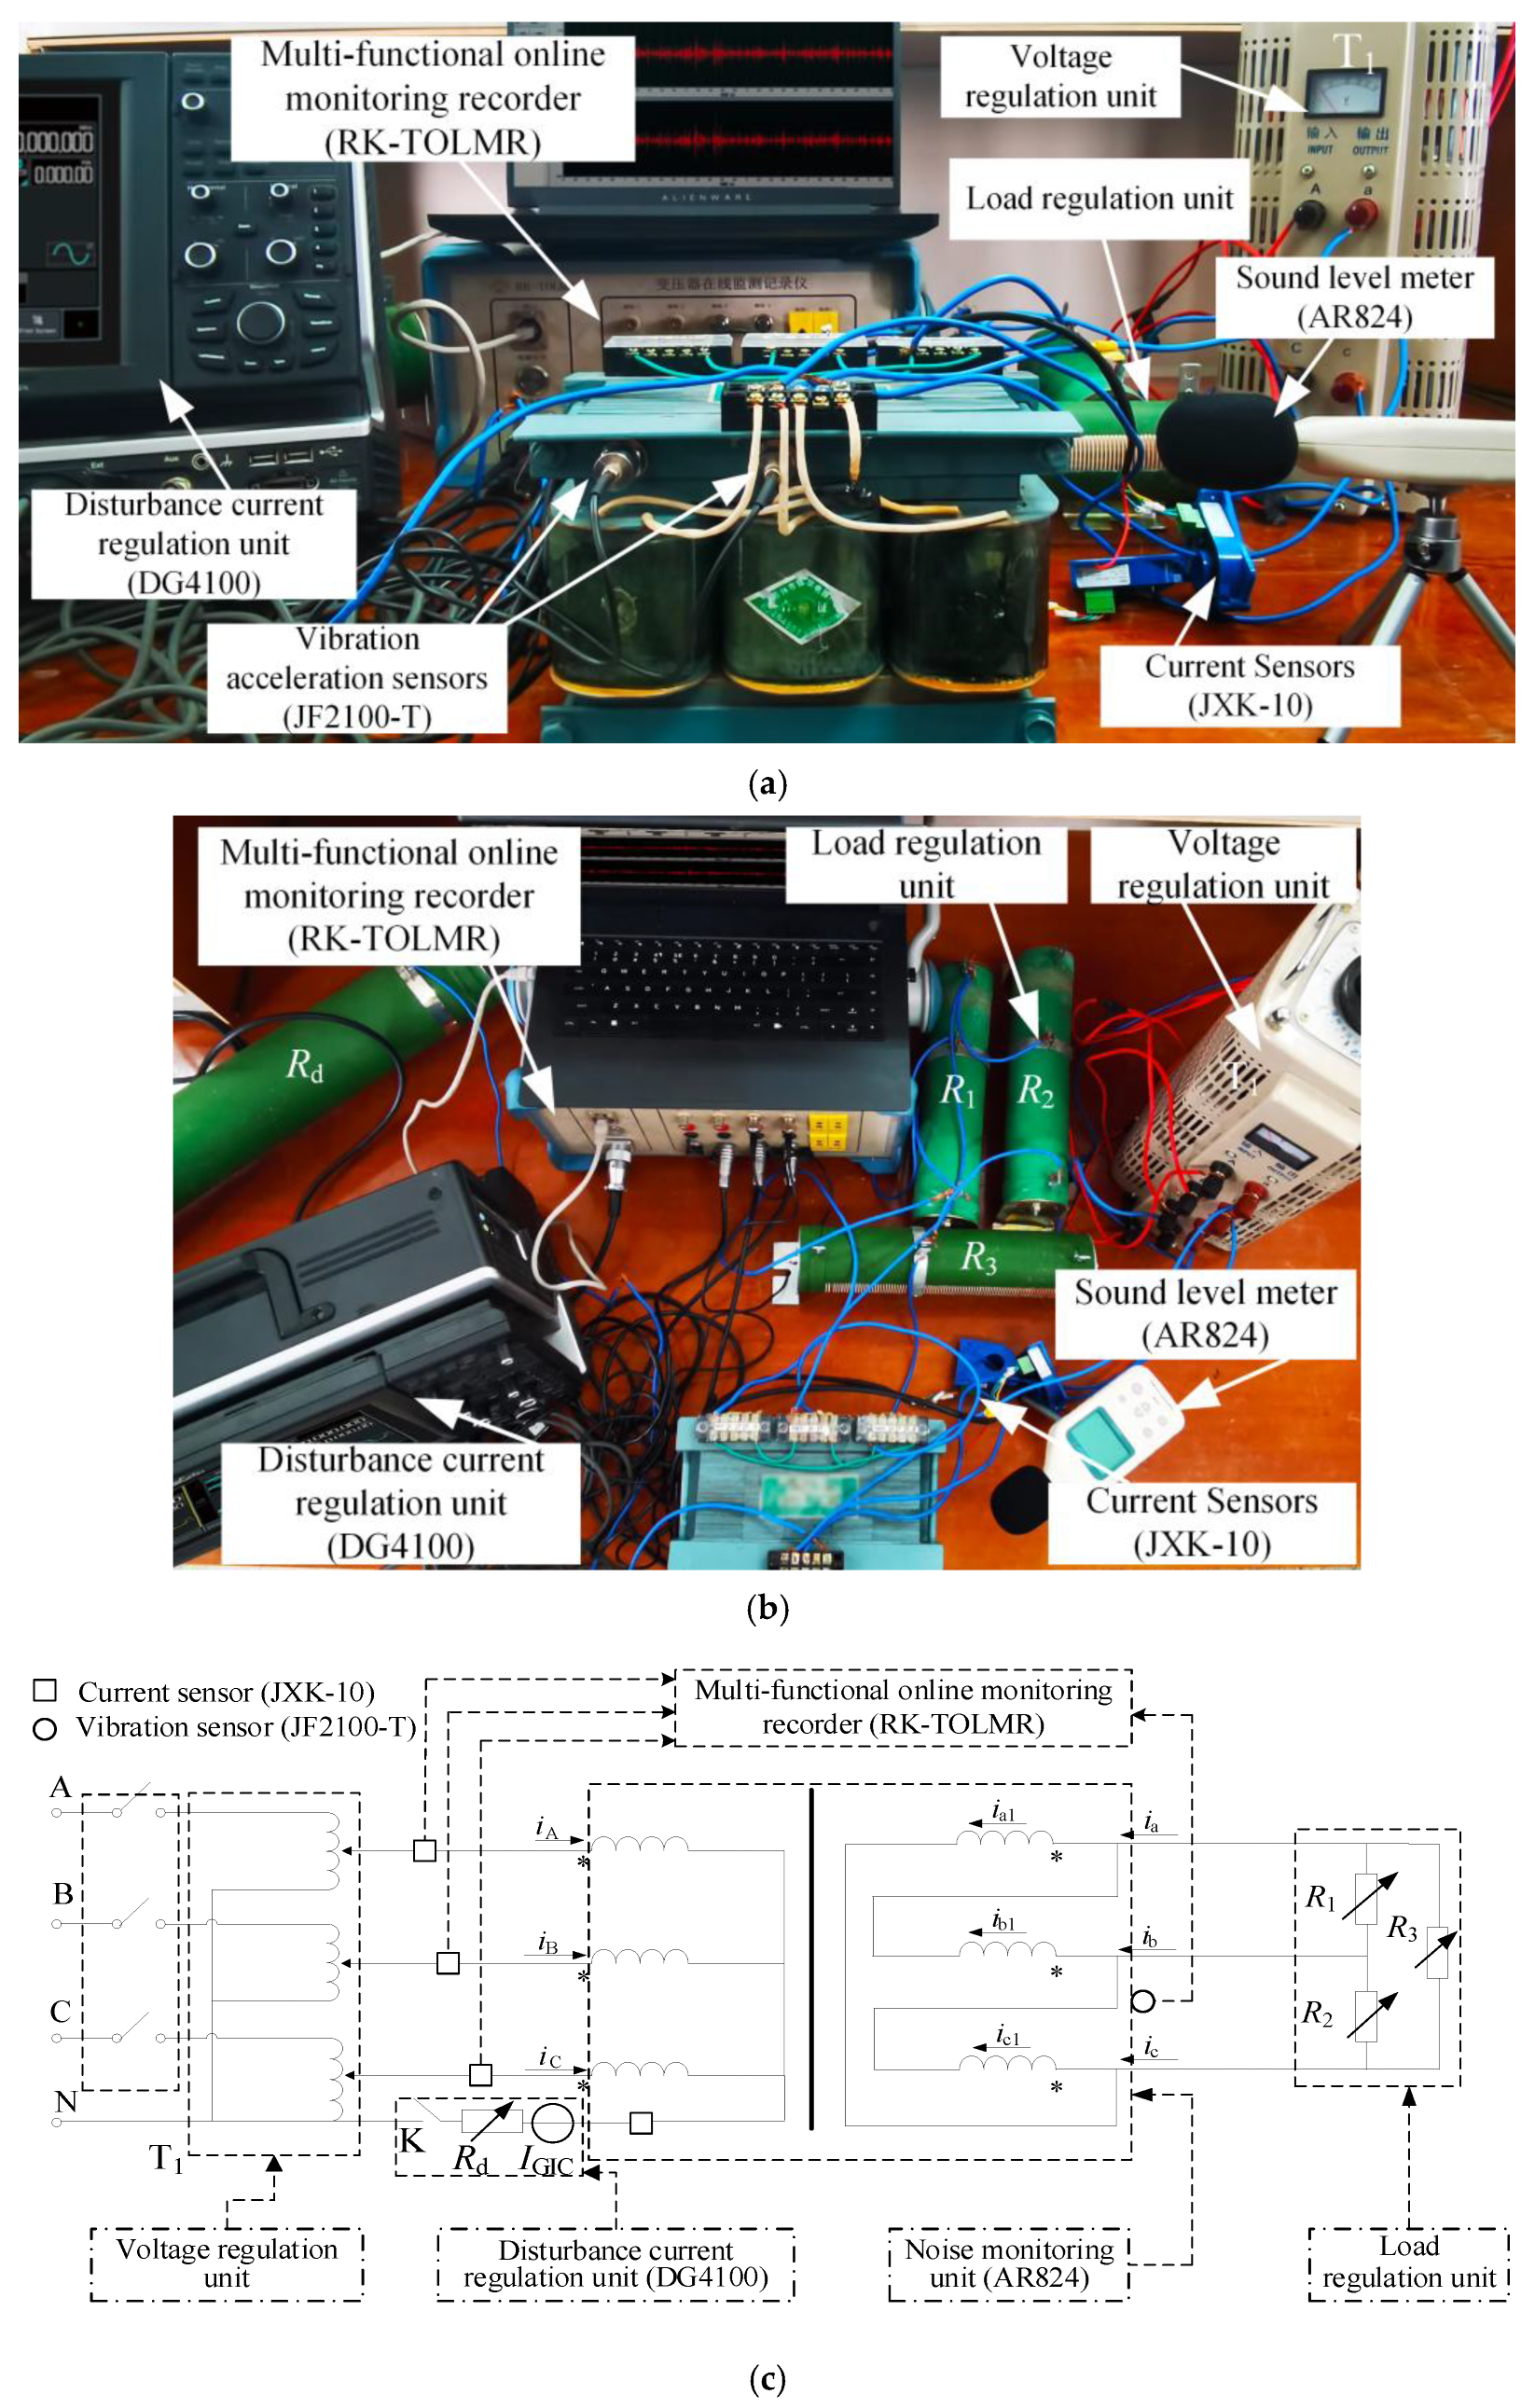
Taking the three-phase three-limb experimental transformer (BSS-1000VA, manufactured by Jianhua Electric Appliance Factory, Jilin, China) as an example, the dynamic experiment platform is built, as shown in Figure 8. The current and vibration acceleration signals are measured via a transformer multi-functional online monitoring recorder (RK-TOLMR manufactured by Dingxin Technology Co., Ltd., Shenzhen, China), which integrates current sensors (JXK-10, manufactured by Qidian Automation Technology Co., Ltd., Huaibei, China) for electrical signal acquisition and interfaces with the vibration sensors (JF2100-T, manufactured by Hangzhen Instrument Factory, Shanghai, China). According to the standard of transformer noise monitoring [22], transformer noise is monitored using the sound level meter (AR824, manufactured by Smart Sensor, Dongguan, China).
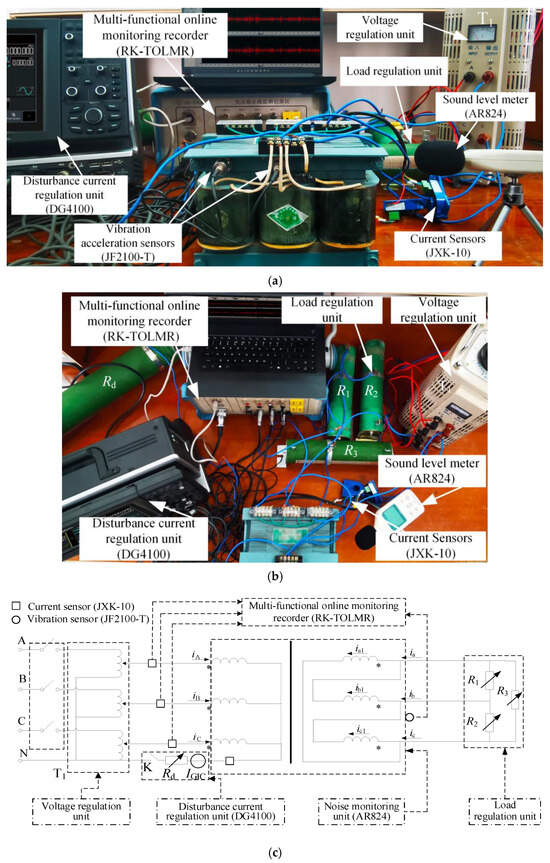
Figure 8.
Dynamic experimental platform of three-phase transformer. (a) Frontal view; (b) upper view; (c) wiring schematic. * denotes the terminals of the same polarity.
The specific experimental procedures are carried out as follows:
(1) Component Integration and Initial Setup: All the components are interconnected, and monitoring units are integrated into the system. The rated voltage on the primary side of the transformer is achieved by adjusting voltage regulator T1 within the voltage regulation unit. The variations in transformer load rates are subsequently implemented through controlled adjustments of the sliding rheostat in the load regulation unit.
(2) Disturbance Current Modulation: Switch K is closed to engage the disturbance current regulation unit, which incorporates a signal generator (DG4100, manufactured by Dongguang Instrument Factory, Changchun, China) and a sliding rheostat. The waveform of disturbance currents under different operational modes is governed by configuring the output frequency of the DG4100 signal generator. The amplitude of these currents is controlled through adjustments to the sliding rheostat.
(3) Data Acquisition: The vibration data are collected using the piezoelectric acceleration sensors JF2100-T within the vibration monitoring unit, with observation points selected to align with the simulation framework. Concurrently, noise signals are captured by the AR824 sound level meter integrated into the noise monitoring unit.
The piezoelectric acceleration sensors (JF2100-T) and the sound level meter (AR824) utilized in the experiments were factory-calibrated by the manufacturer and included third-party calibration certificates from an accredited laboratory, ensuring compliance with the international standards for vibration (ISO 16063-44) [23] and acoustics (GB/T 3785.1-2010) [24]. The calibration covered essential parameters such as sensitivity and frequency responses, with stated uncertainties suitable for this study’s measurement requirements. Prior to data collection, functional checks were performed under no-load conditions to verify stable baseline signals and eliminate any zero-point drift. To ensure spatial consistency, the sensors installed at symmetric observation points were cross-validated, with signal amplitude differences controlled within 5% across all the operational modes.
3. Results
In this chapter, the simulation and experimental results are presented.
3.1. Simulation Results
This section presents the simulation results under the fluctuating component and the constant component, highlighting their differential impacts.
3.1.1. Simulation Results of Winding
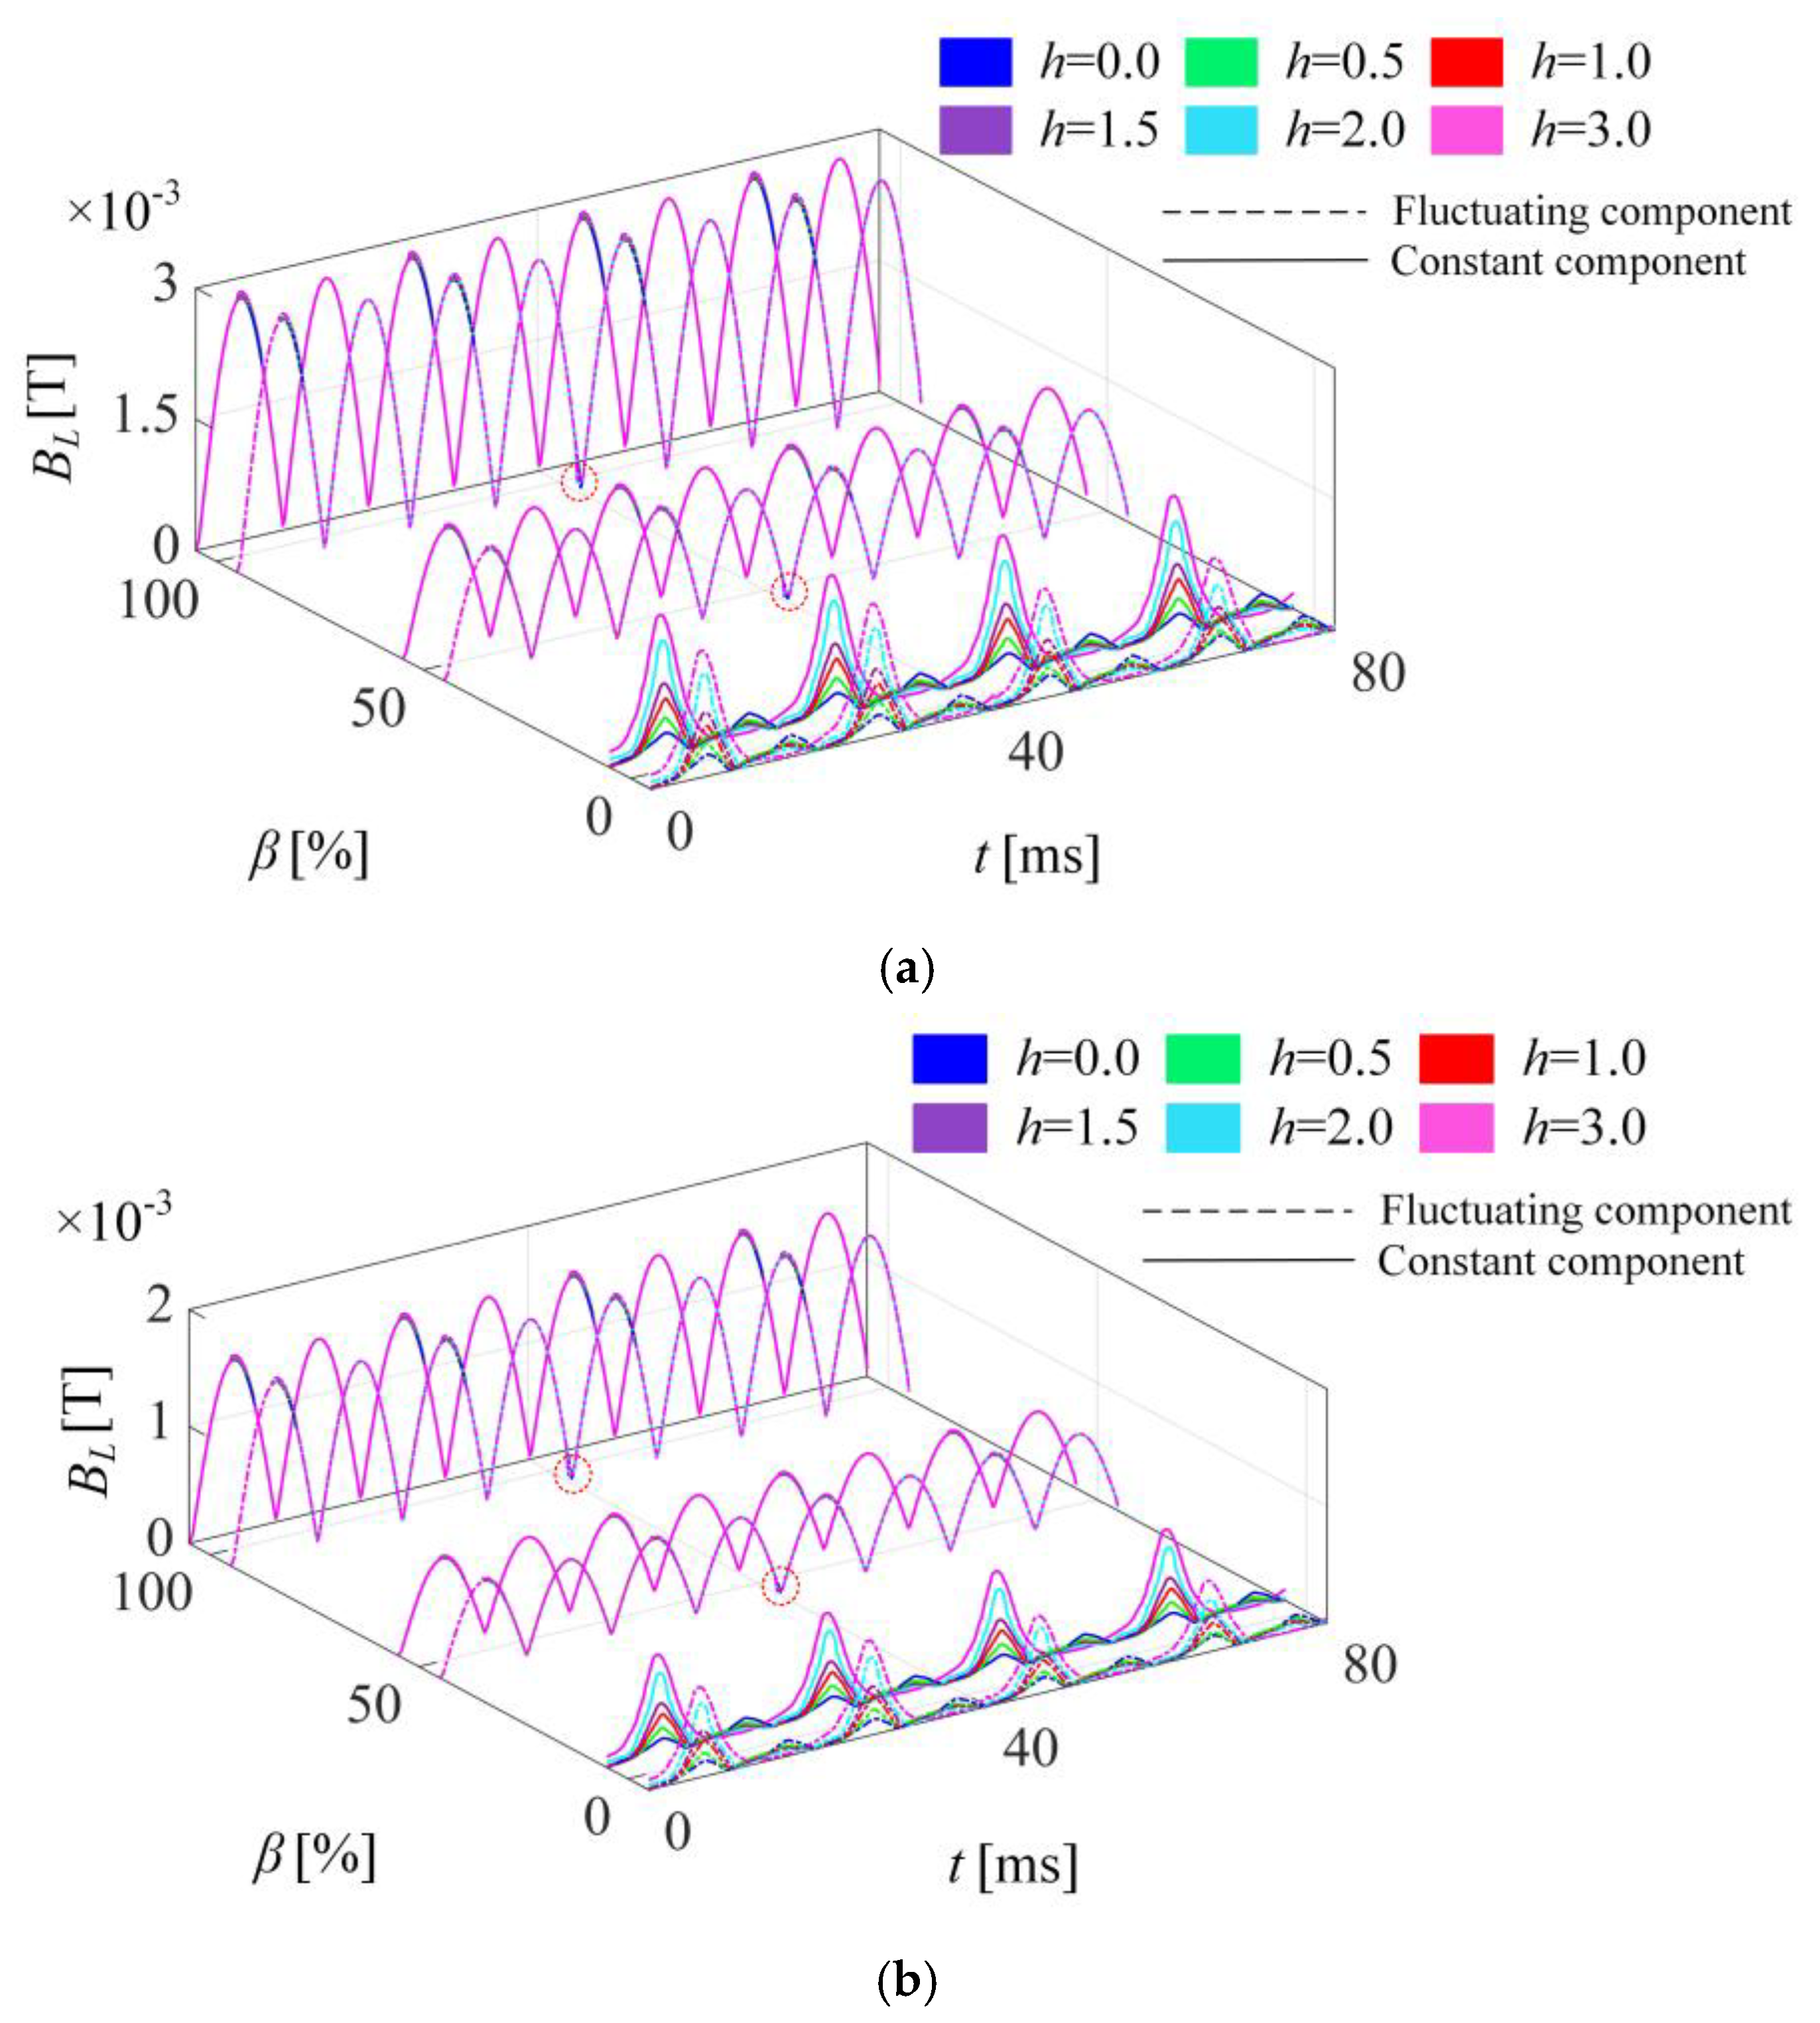
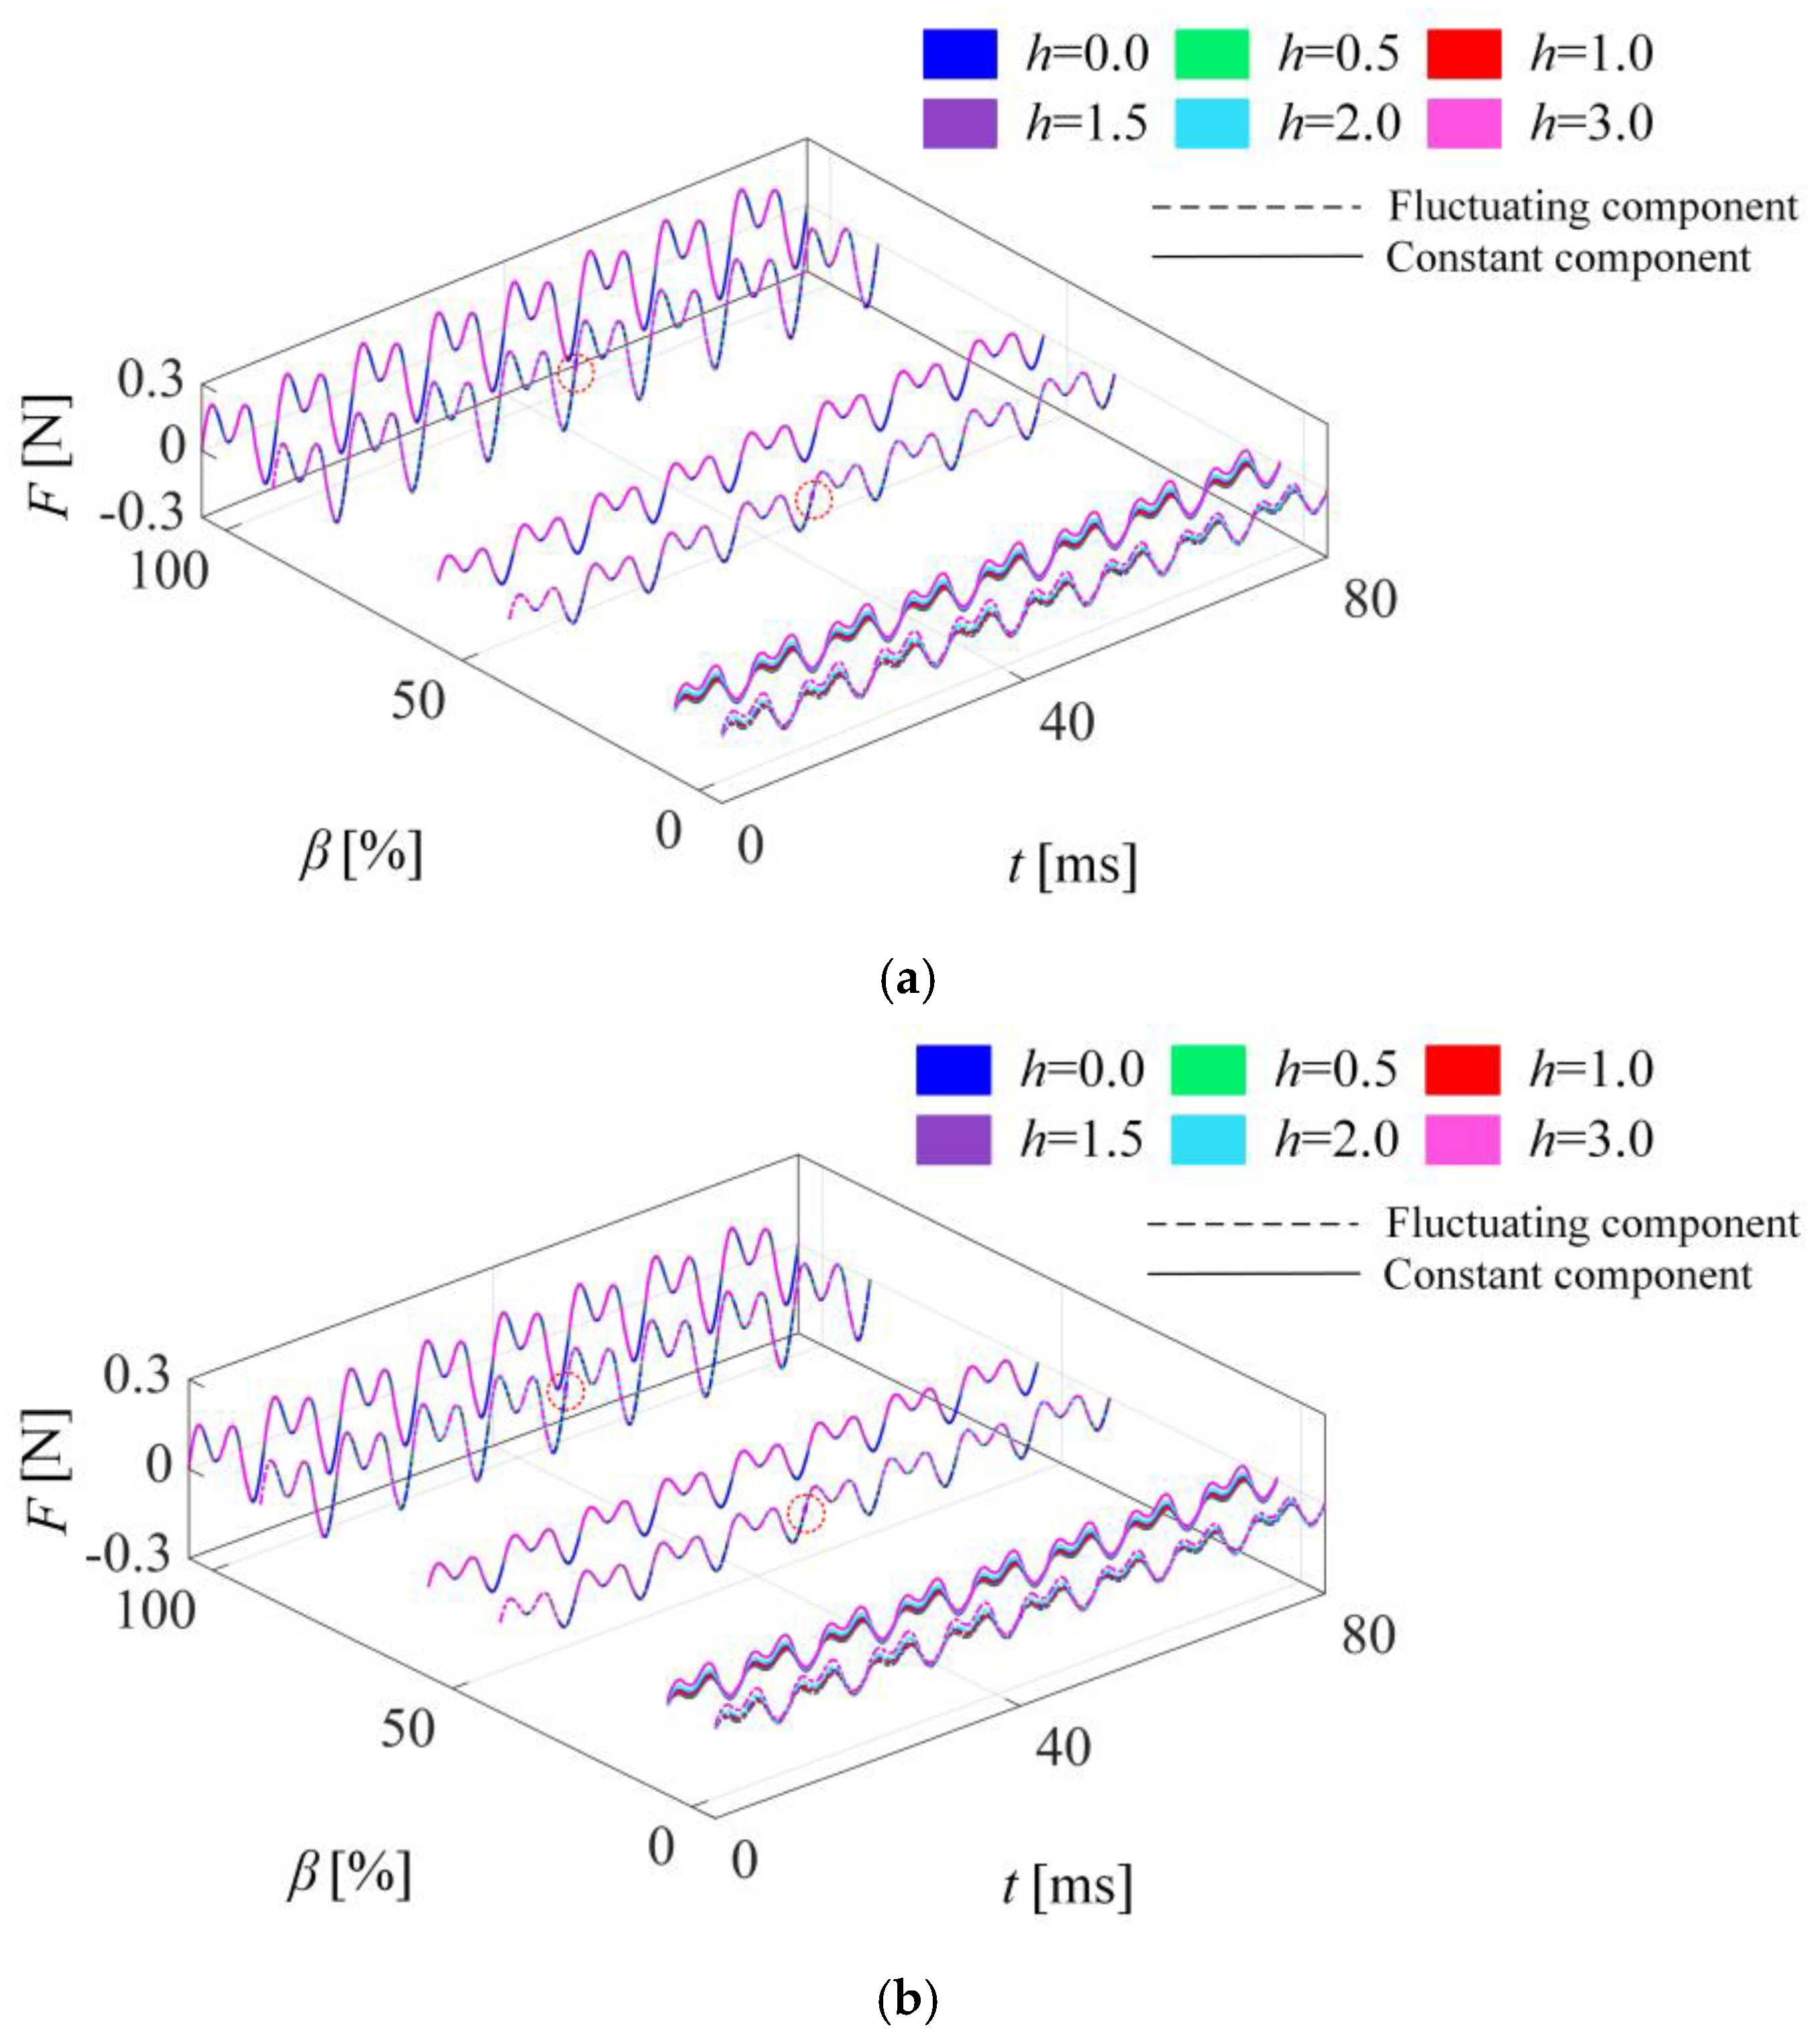
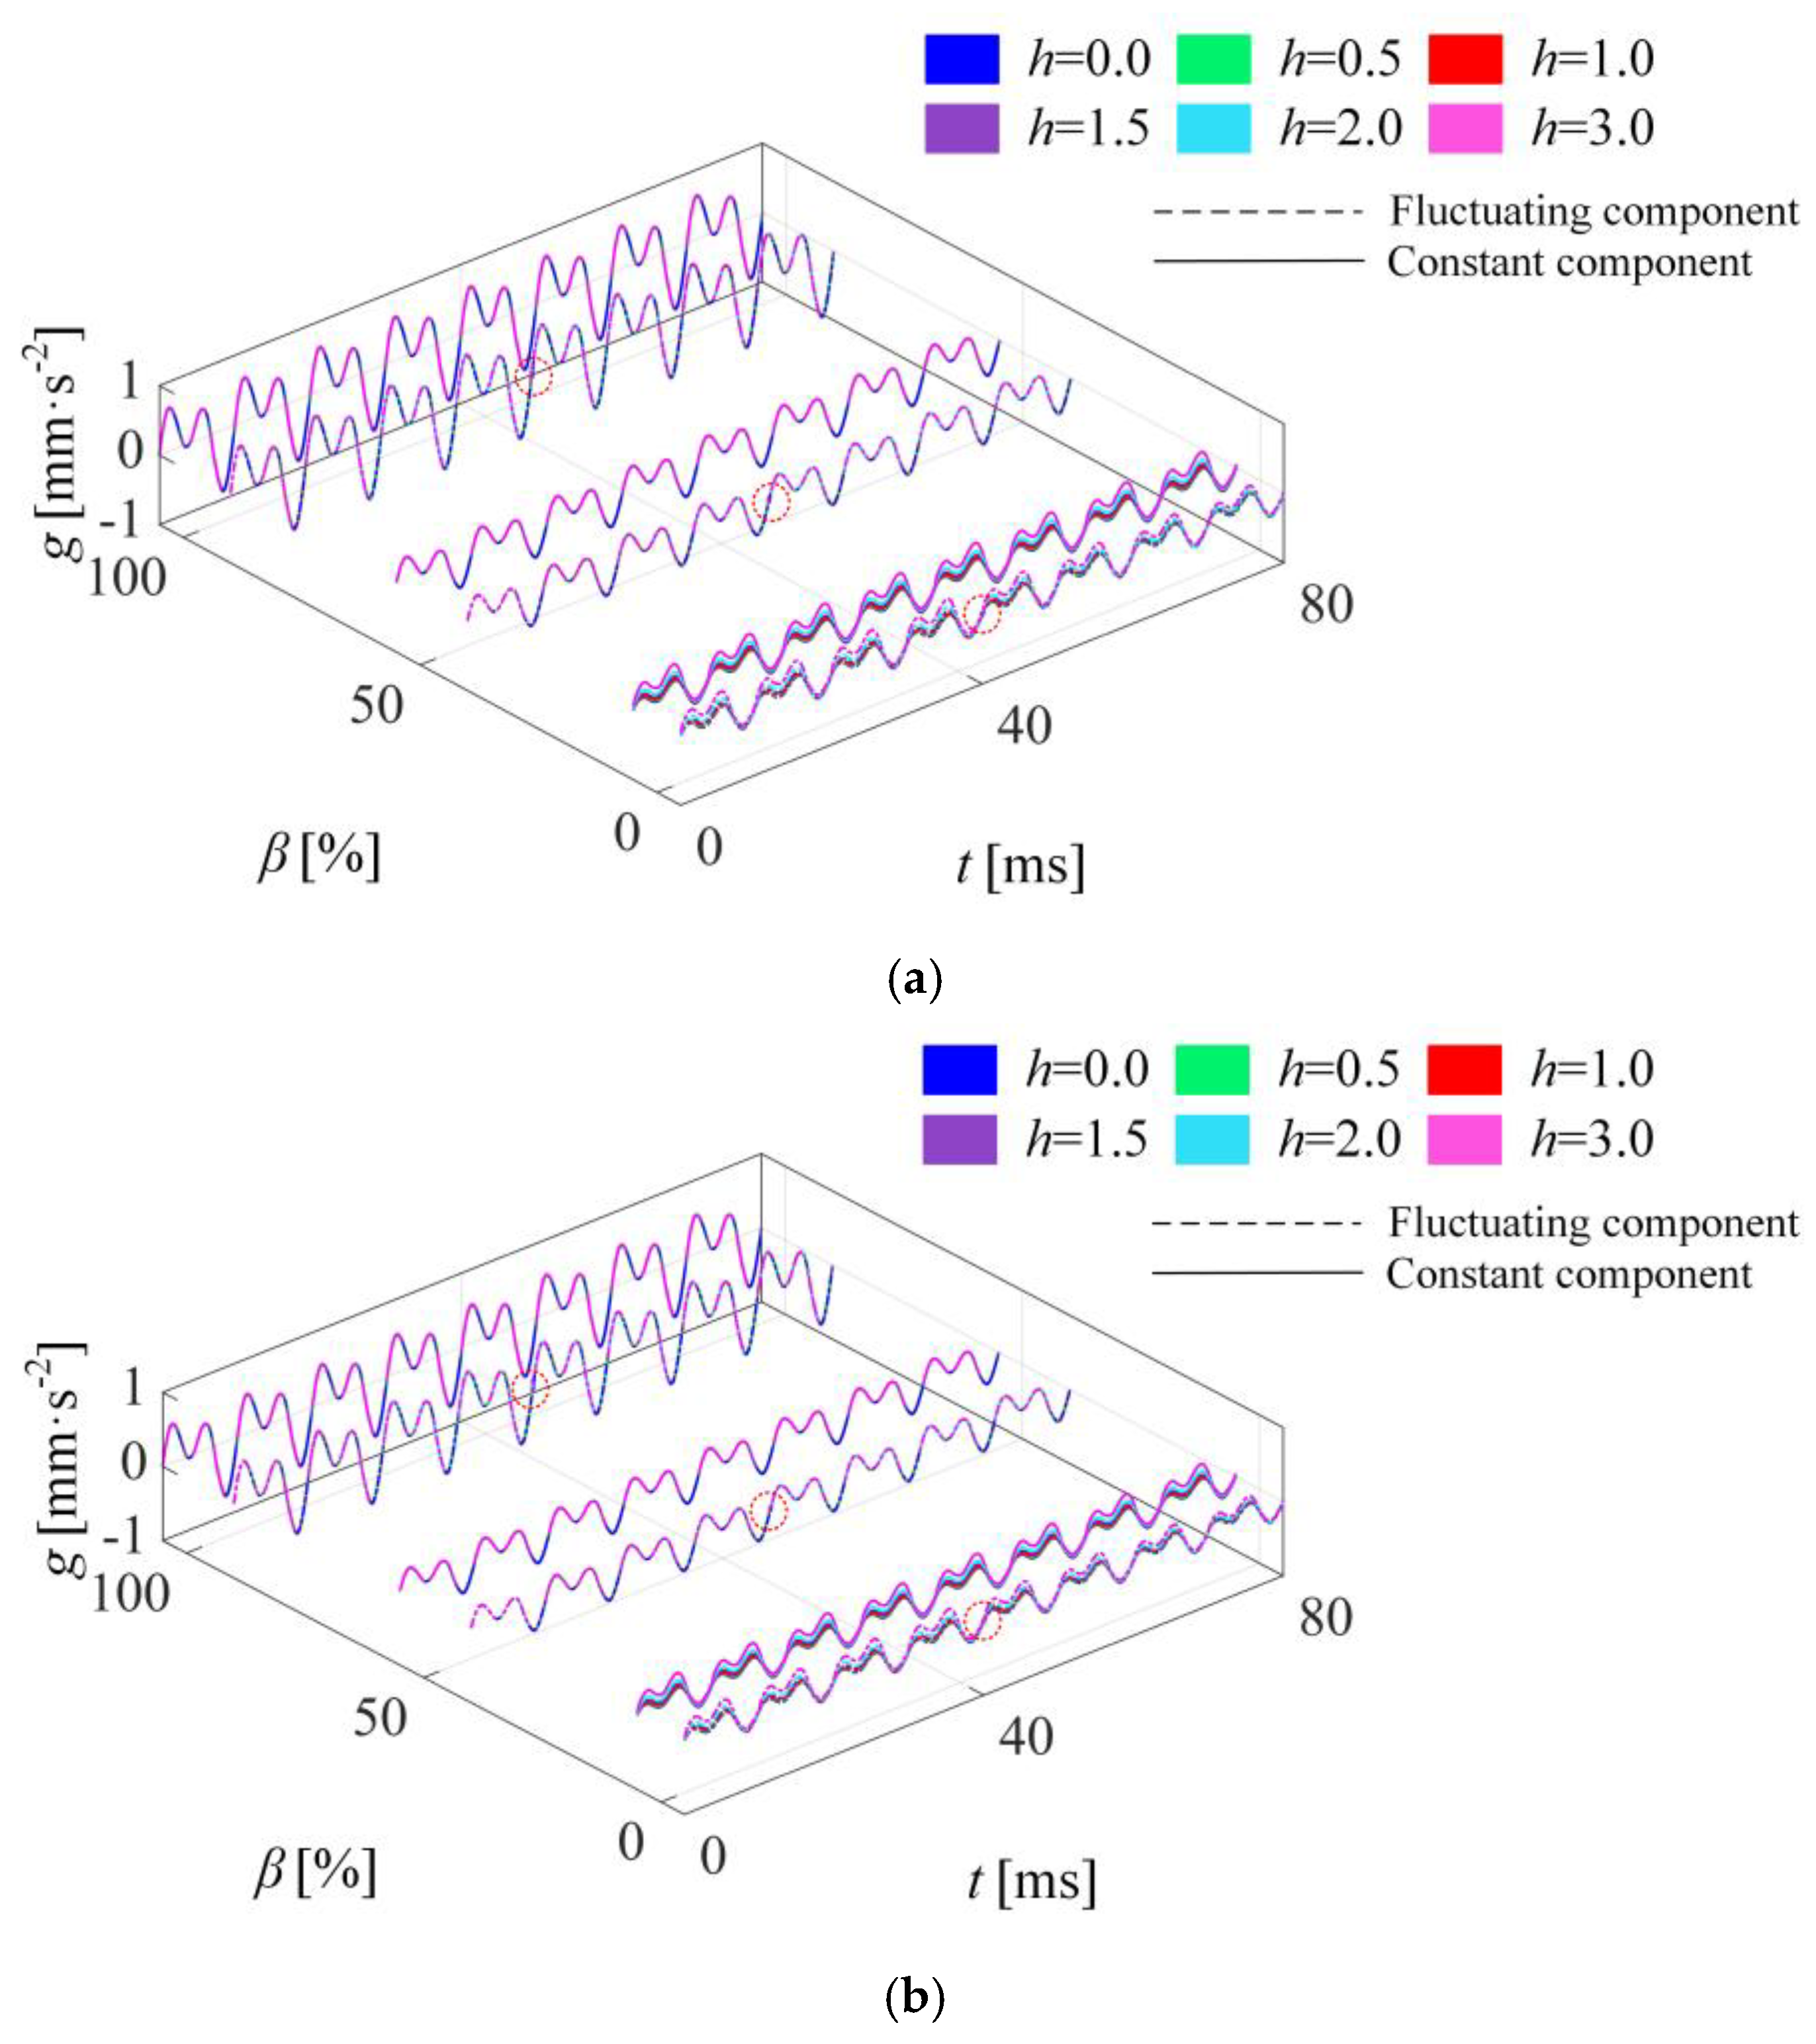
Section 3.1.1 focuses on the winding responses, including magnetic leakage flux, electromagnetic force, and vibration acceleration (Figure 9, Figure 10 and Figure 11).
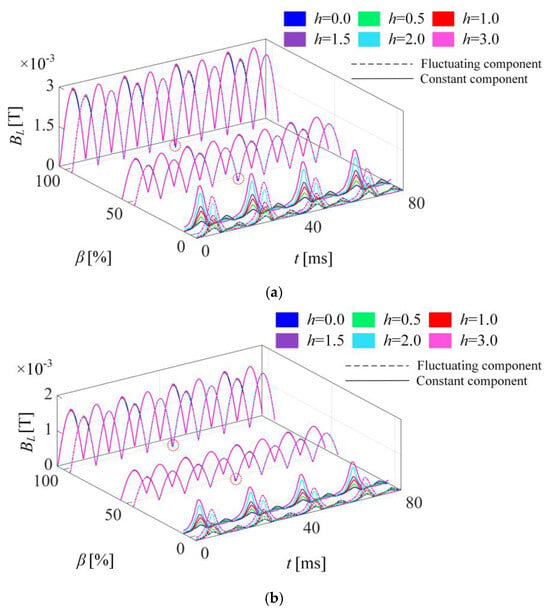
Figure 9.
Leakage flux density modulus at observation points of winding (the red dotted circle marks the distortion at 40 ms). (a) Observation point ①; (b) observation point ②.
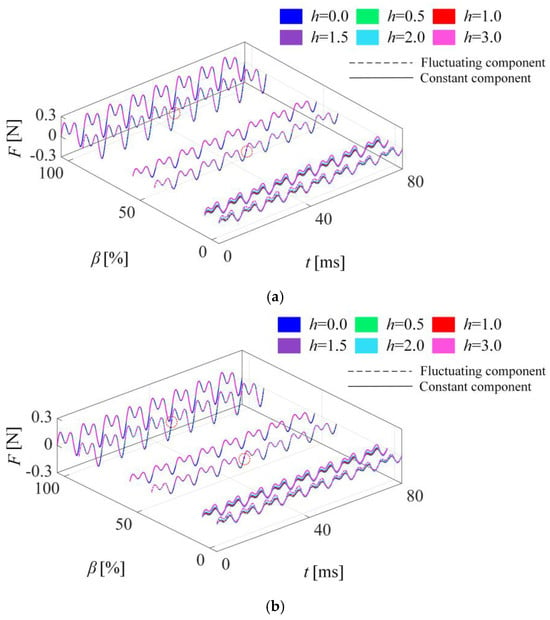
Figure 10.
Electromagnetic force at observation points of winding (the red dotted circle marks the distortion at 40 ms). (a) Observation point ①; (b) observation point ②.
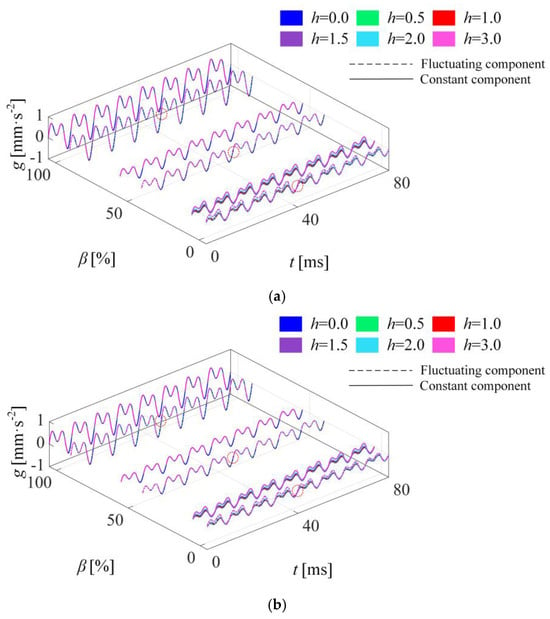
Figure 11.
Vibration acceleration at observation points of winding (the red dotted circle marks the distortion at 40 ms). (a) Observation point ①; (b) observation point ②.
The multi-field feature parameters are simulated under different disturbance modes and load modes, and the partial results of the winding current are shown in Appendix A (Figure A1). Meanwhile, the electromagnetic–mechanical information of winding is obtained. Taking phase B as an example, magnetic leakage, electromagnetic force, and vibration acceleration at each observation point are shown in Figure 9, Figure 10 and Figure 11.
As shown in Figure 9, the leakage is mainly concentrated at the terminal of winding under GIC intrusion. In the no-load mode, a variation law about the leakage of “half-wave enhancement and half-wave decay” is observed. In the loading modes, leakage increases with rising β. Obviously, the winding leakage is greatly affected by the variation in h in the no-load mode, whereas the effect of h on leakage becomes less pronounced during the loading modes. In addition, winding leakage under fluctuating component disturbance has a similar variation to constant component disturbance. However, due to the influence of the fluctuating component, the variation in k results in a more complex temporal fluctuation in leakage with no load. Furthermore, the amplitude variations caused by k2 (which has a larger value than k1) are more pronounced. When h reaches 2.0, there is a significant bias phenomenon in leakage under the no-load condition. As determined through analysis, the winding leakage is mainly caused by current-carrying excitation. Thus, the variation in leakage is consistent with the current. The effect of IGIC on the winding current and leakage is not obvious in the loading modes.
The electromagnetic force and vibration acceleration of winding can be solved based on the leakage results, and axial information is extracted. The results are shown as follows.
In Figure 10 and Figure 11, the fluctuation frequency of winding electromagnetic force and vibration acceleration is approximately twice as large as that of power frequency. In the two disturbance modes, a variation law about F and g of “half-wave enhancement and half-wave decay” is observed under the no-load condition. Furthermore, the fluctuations in F and g in the time domain are the same as those of leakage flux, and the amplitudes of F and g increase with rising h. When h = 1.5, the vibration amplitude of winding is approximately 1.2 times as high as that without disturbance in the no-load mode. Under the loading conditions, F and g intensify as β increases. However, F and g are less affected by GIC disturbance. The reason is that both F and g are determined by the current and leakage, which have no significant change in the loading operation when IGIC is injected. By comparing Figure 9, Figure 10 and Figure 11, it can be concluded that the current, leakage, force, and vibration acceleration of winding have similar variations.
3.1.2. Simulation Results of Iron Core
Section 3.1.2 analyzes the core vibration anomalies caused by GIC disturbance.
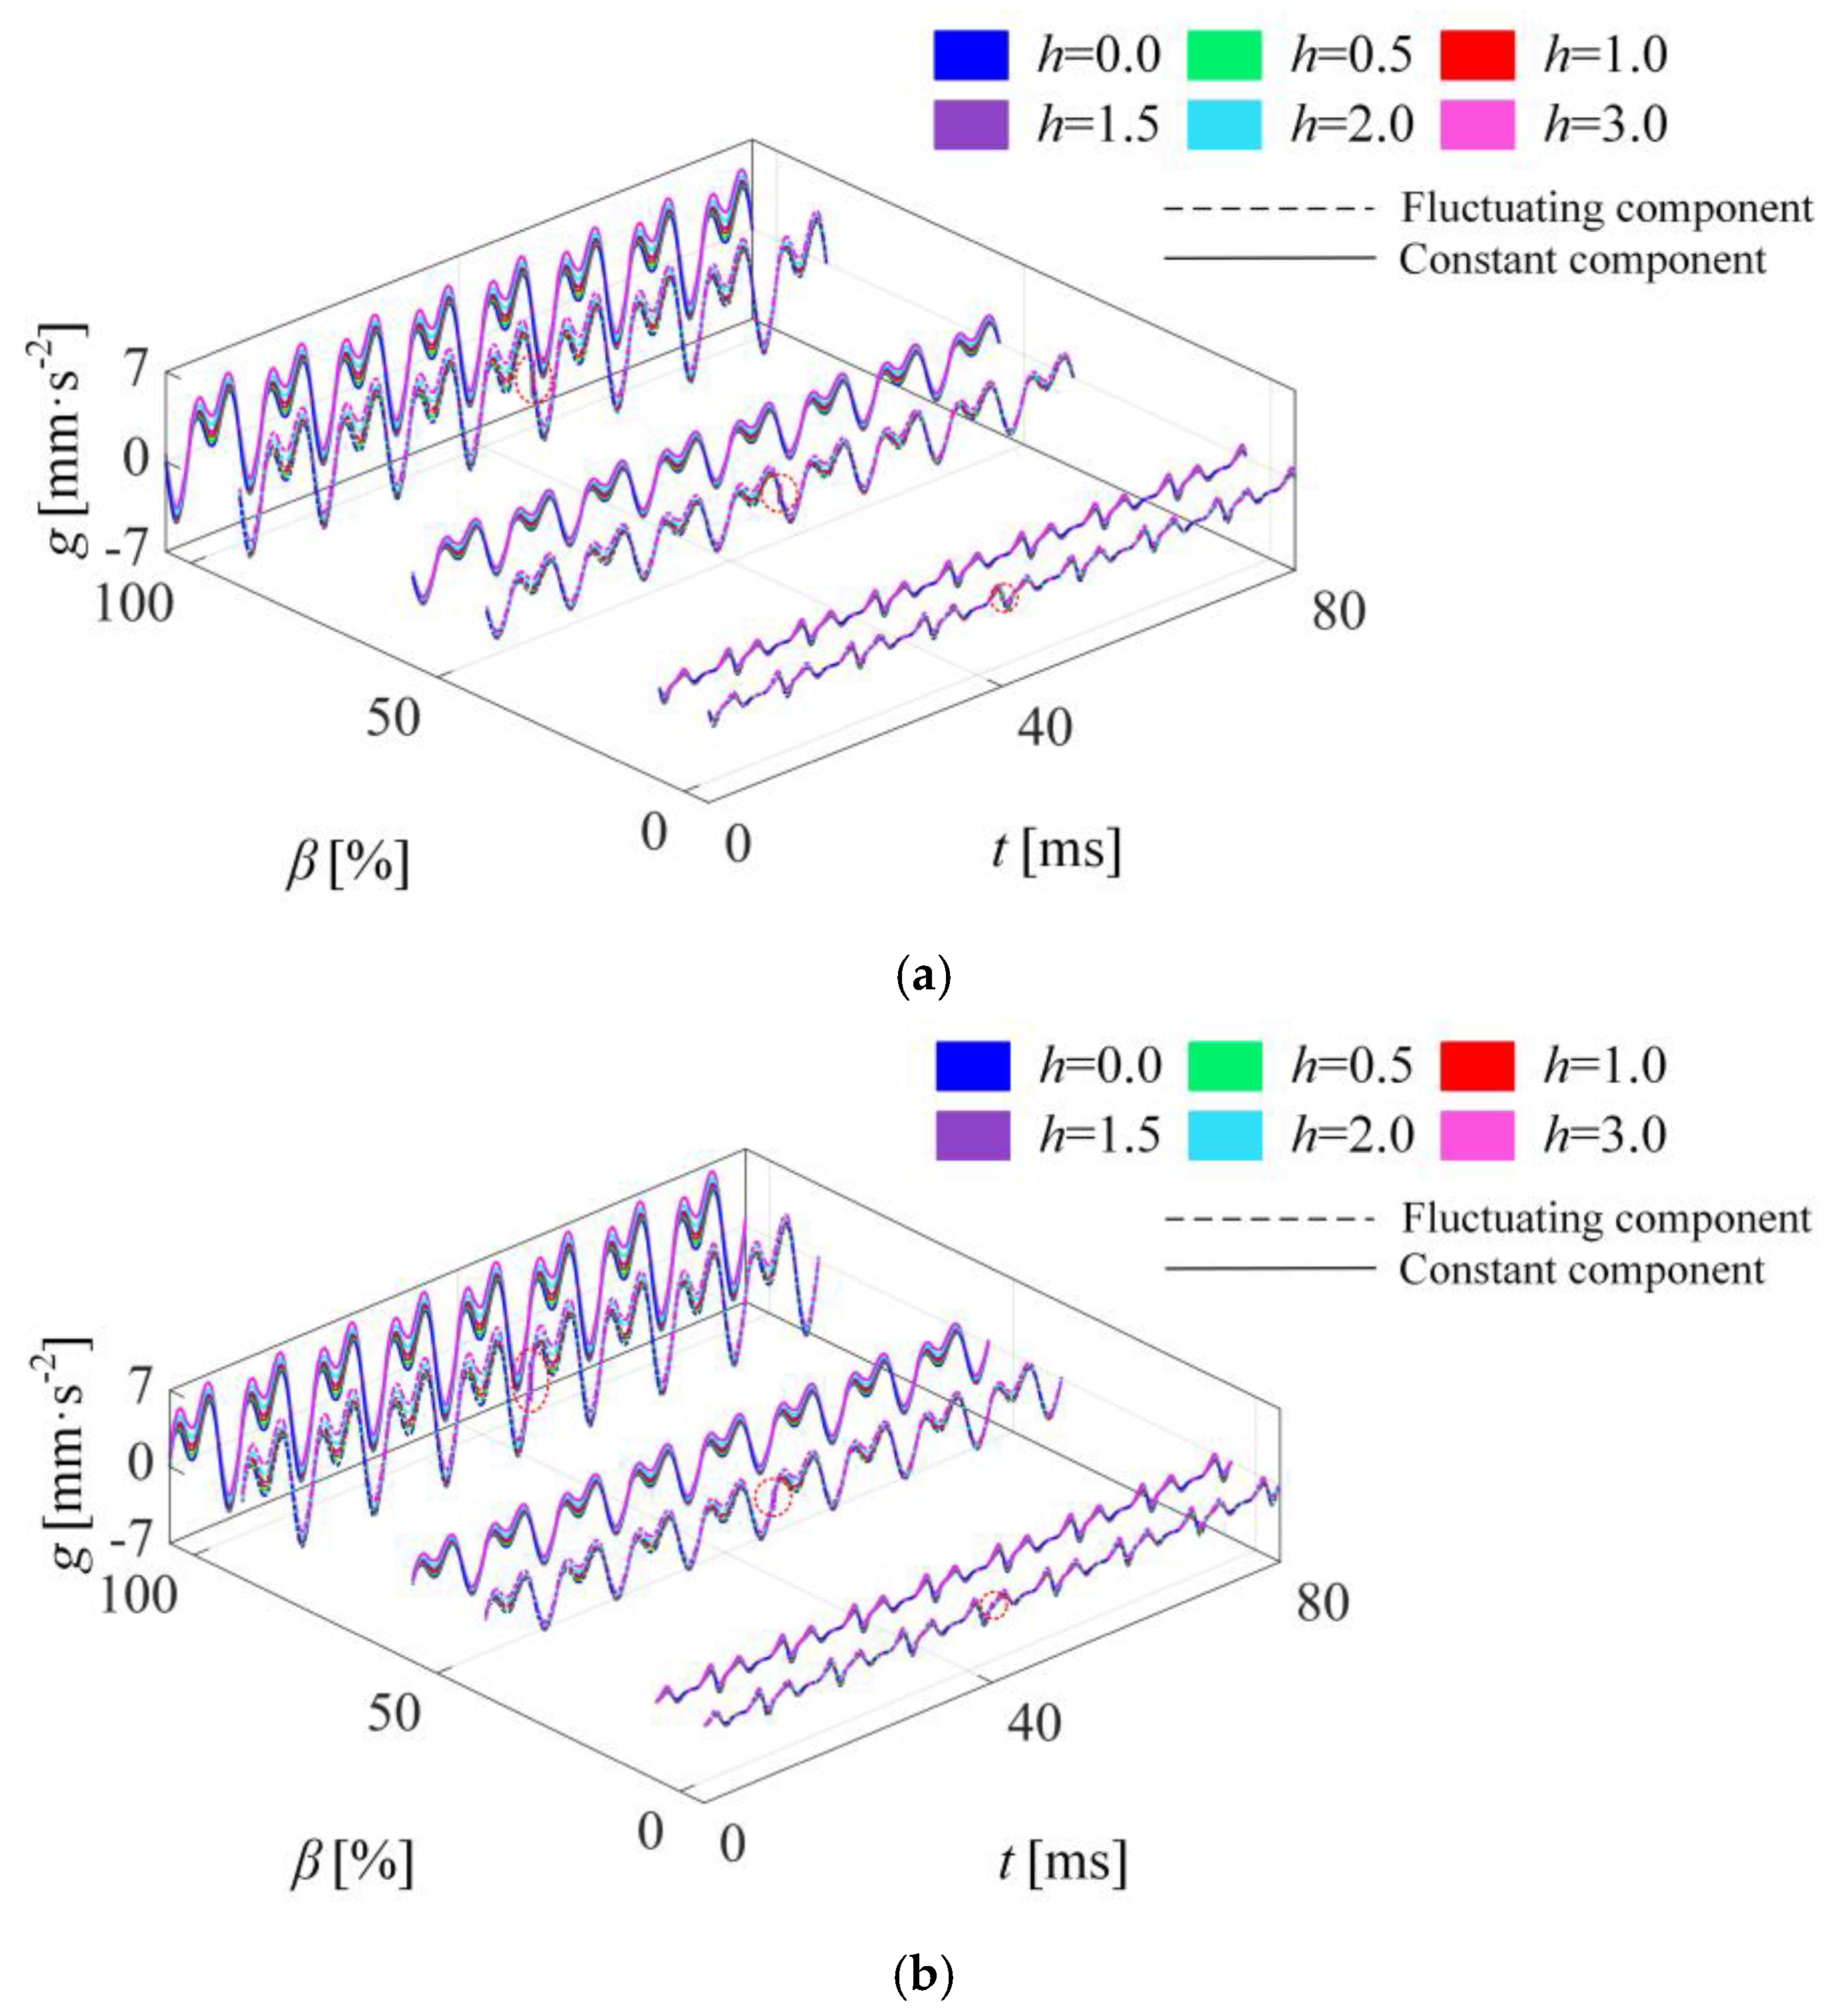
The vibration problem of iron core in the different modes are further studied. The simulation results of main flux are shown in Appendix A (Figure A2), and axial vibration information at each observation point is shown in Figure 12.
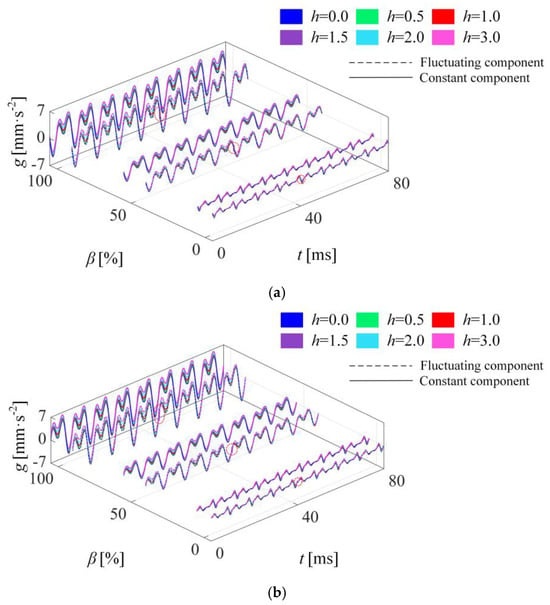
Figure 12.
Vibration acceleration at observation points of core (the red dotted circle marks the distortion at 40 ms). (a) Observation point ③; (b) observation point ④.
In Figure 12, when the transformer is subjected to GIC disturbance, the vibration of the iron core intensifies with rising h and β. Furthermore, the vibration of the main iron column is more severe than that of the adjacent column. Under fluctuating component disturbance, the temporal fluctuation laws of core vibration under the various load modes exhibit similarities to those of no-load winding, and these variations become more pronounced at a larger |k| value. When h = 1.5, the vibration amplitudes at the core observation points under the loading conditions are approximately 1.3 times higher than those under undisturbed conditions.
Comparing Figure 11 and Figure 12, it can be concluded that the vibration of the iron core is more complex and severe than winding in the same mode. Under the loading conditions, the iron core is more seriously disturbed by the GIC. At the mutation moment of the fluctuating component (t = 40 ms), the core vibration exhibits more pronounced distortion compared to winding. The entry of the GIC into the transformer generates a DC flux in the core, leading to excitation distortion and core saturation, which subsequently intensifies core vibration.
3.1.3. Global Acoustic Simulation of Transformer
Section 3.1.3 evaluates the global acoustic effects, linking vibration transients to noise spikes.
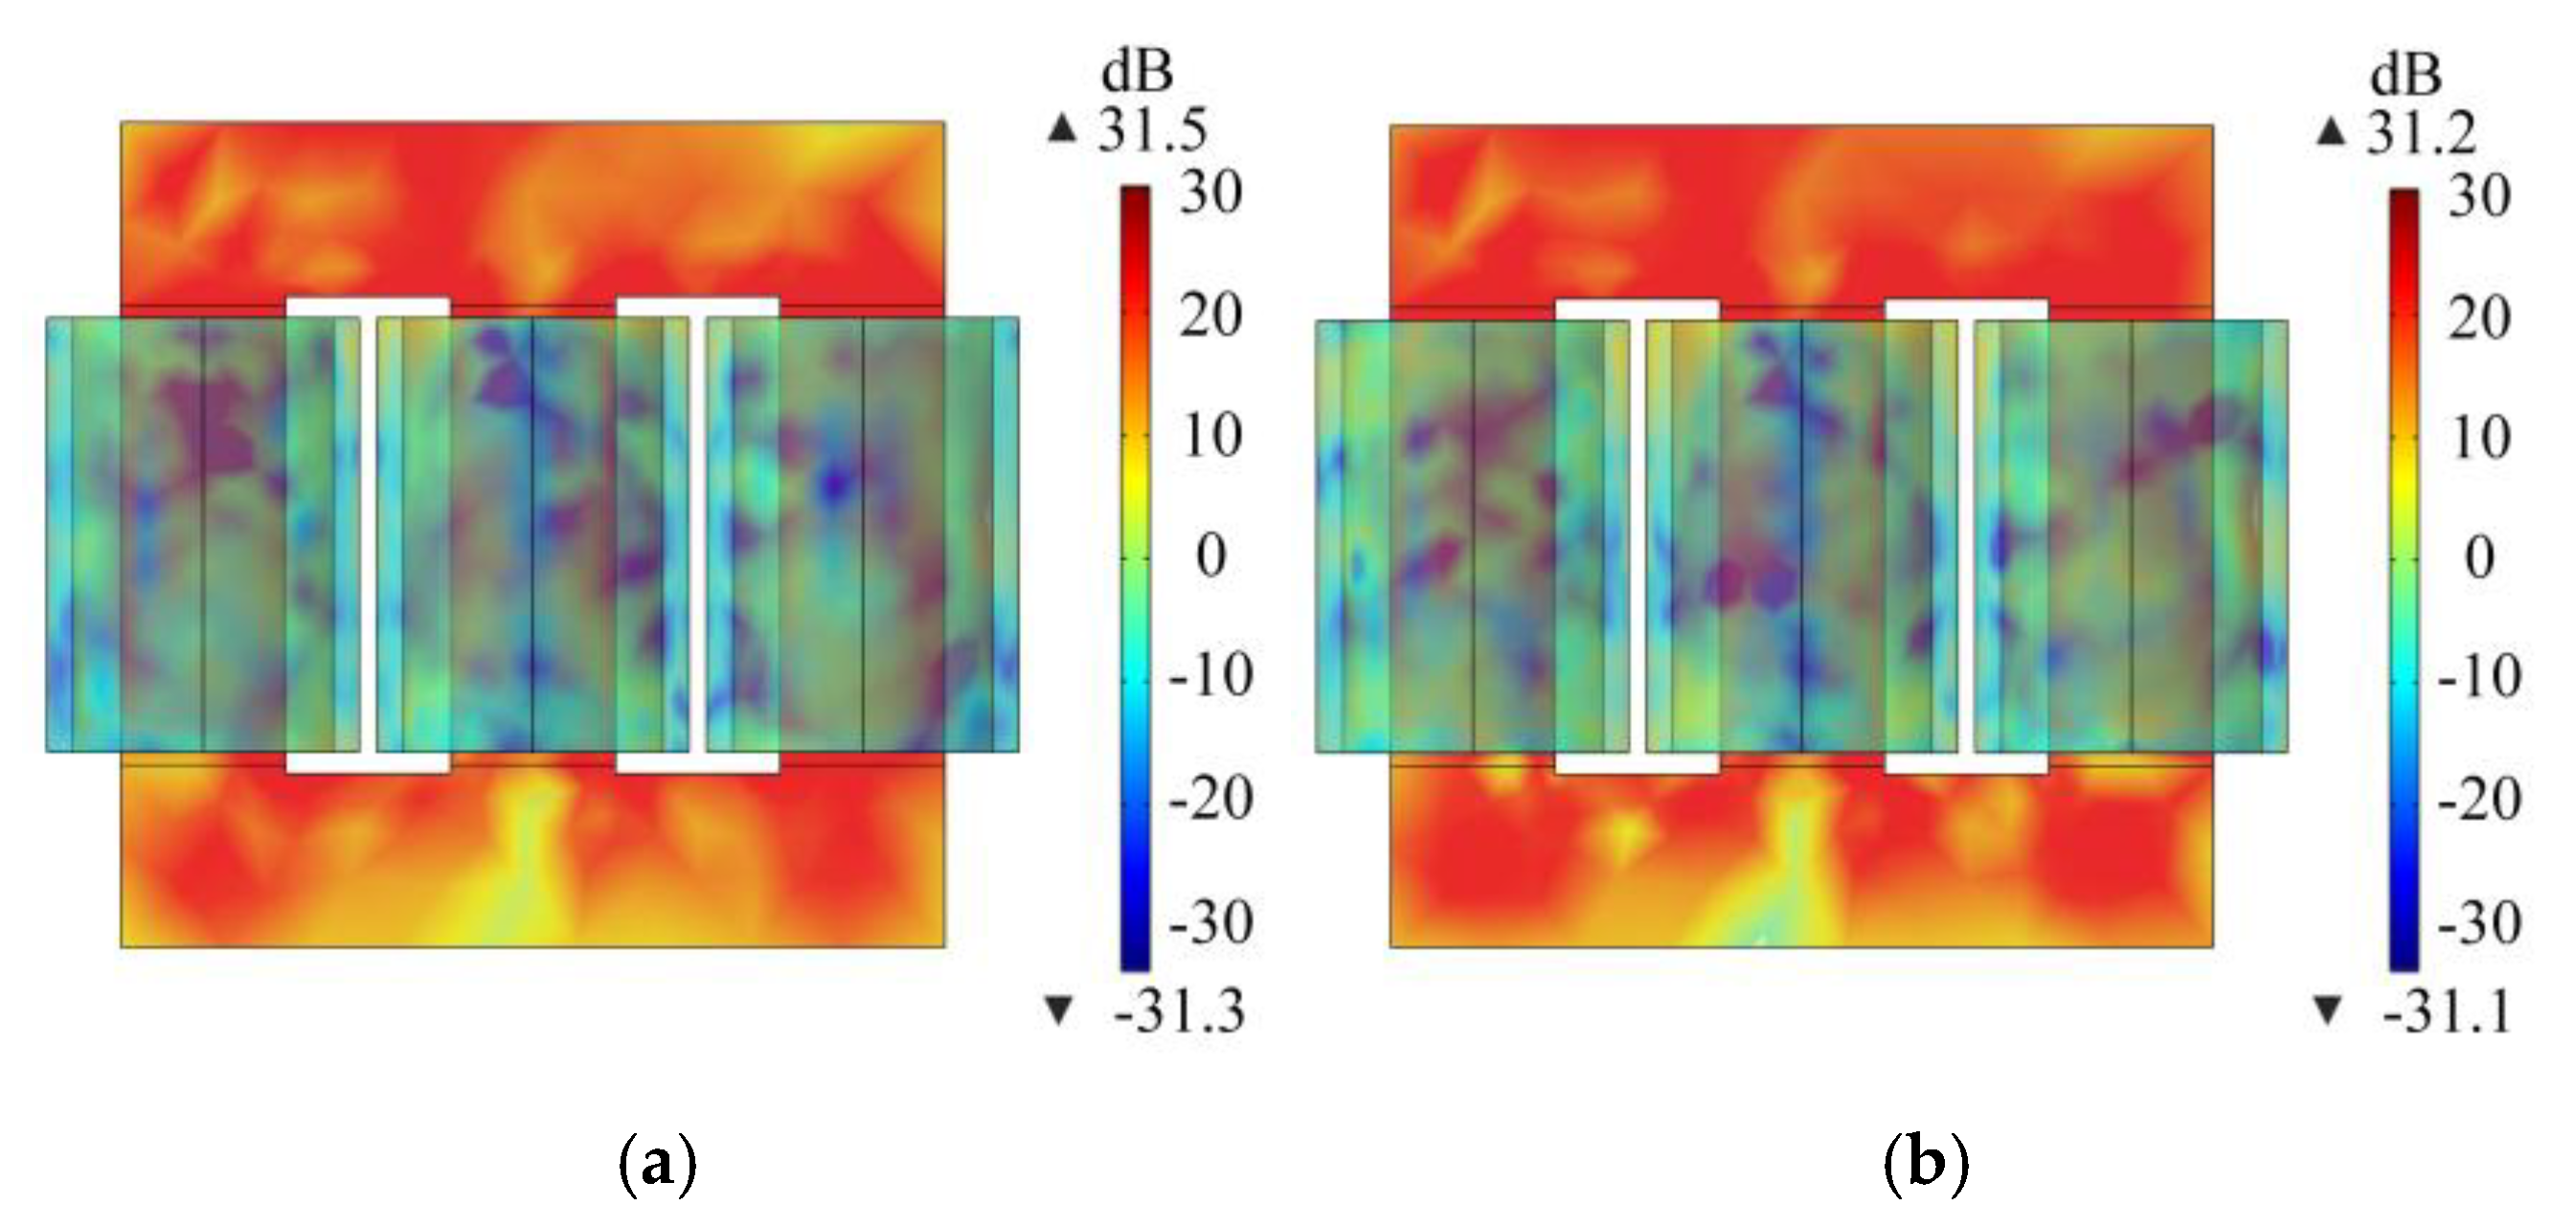
Combining the propagation process of disturbance in the electromagnetic–mechanical field, the noise effect is further studied. The maximum surface sound pressure level Lmax on the transformer is simulated under the different modes, and the results are shown in Table 3 and Table 4.

Table 3.
Maximum surface noise of transformer with constant component disturbance.

Table 4.
Maximum surface noise of transformer with fluctuating component disturbance.
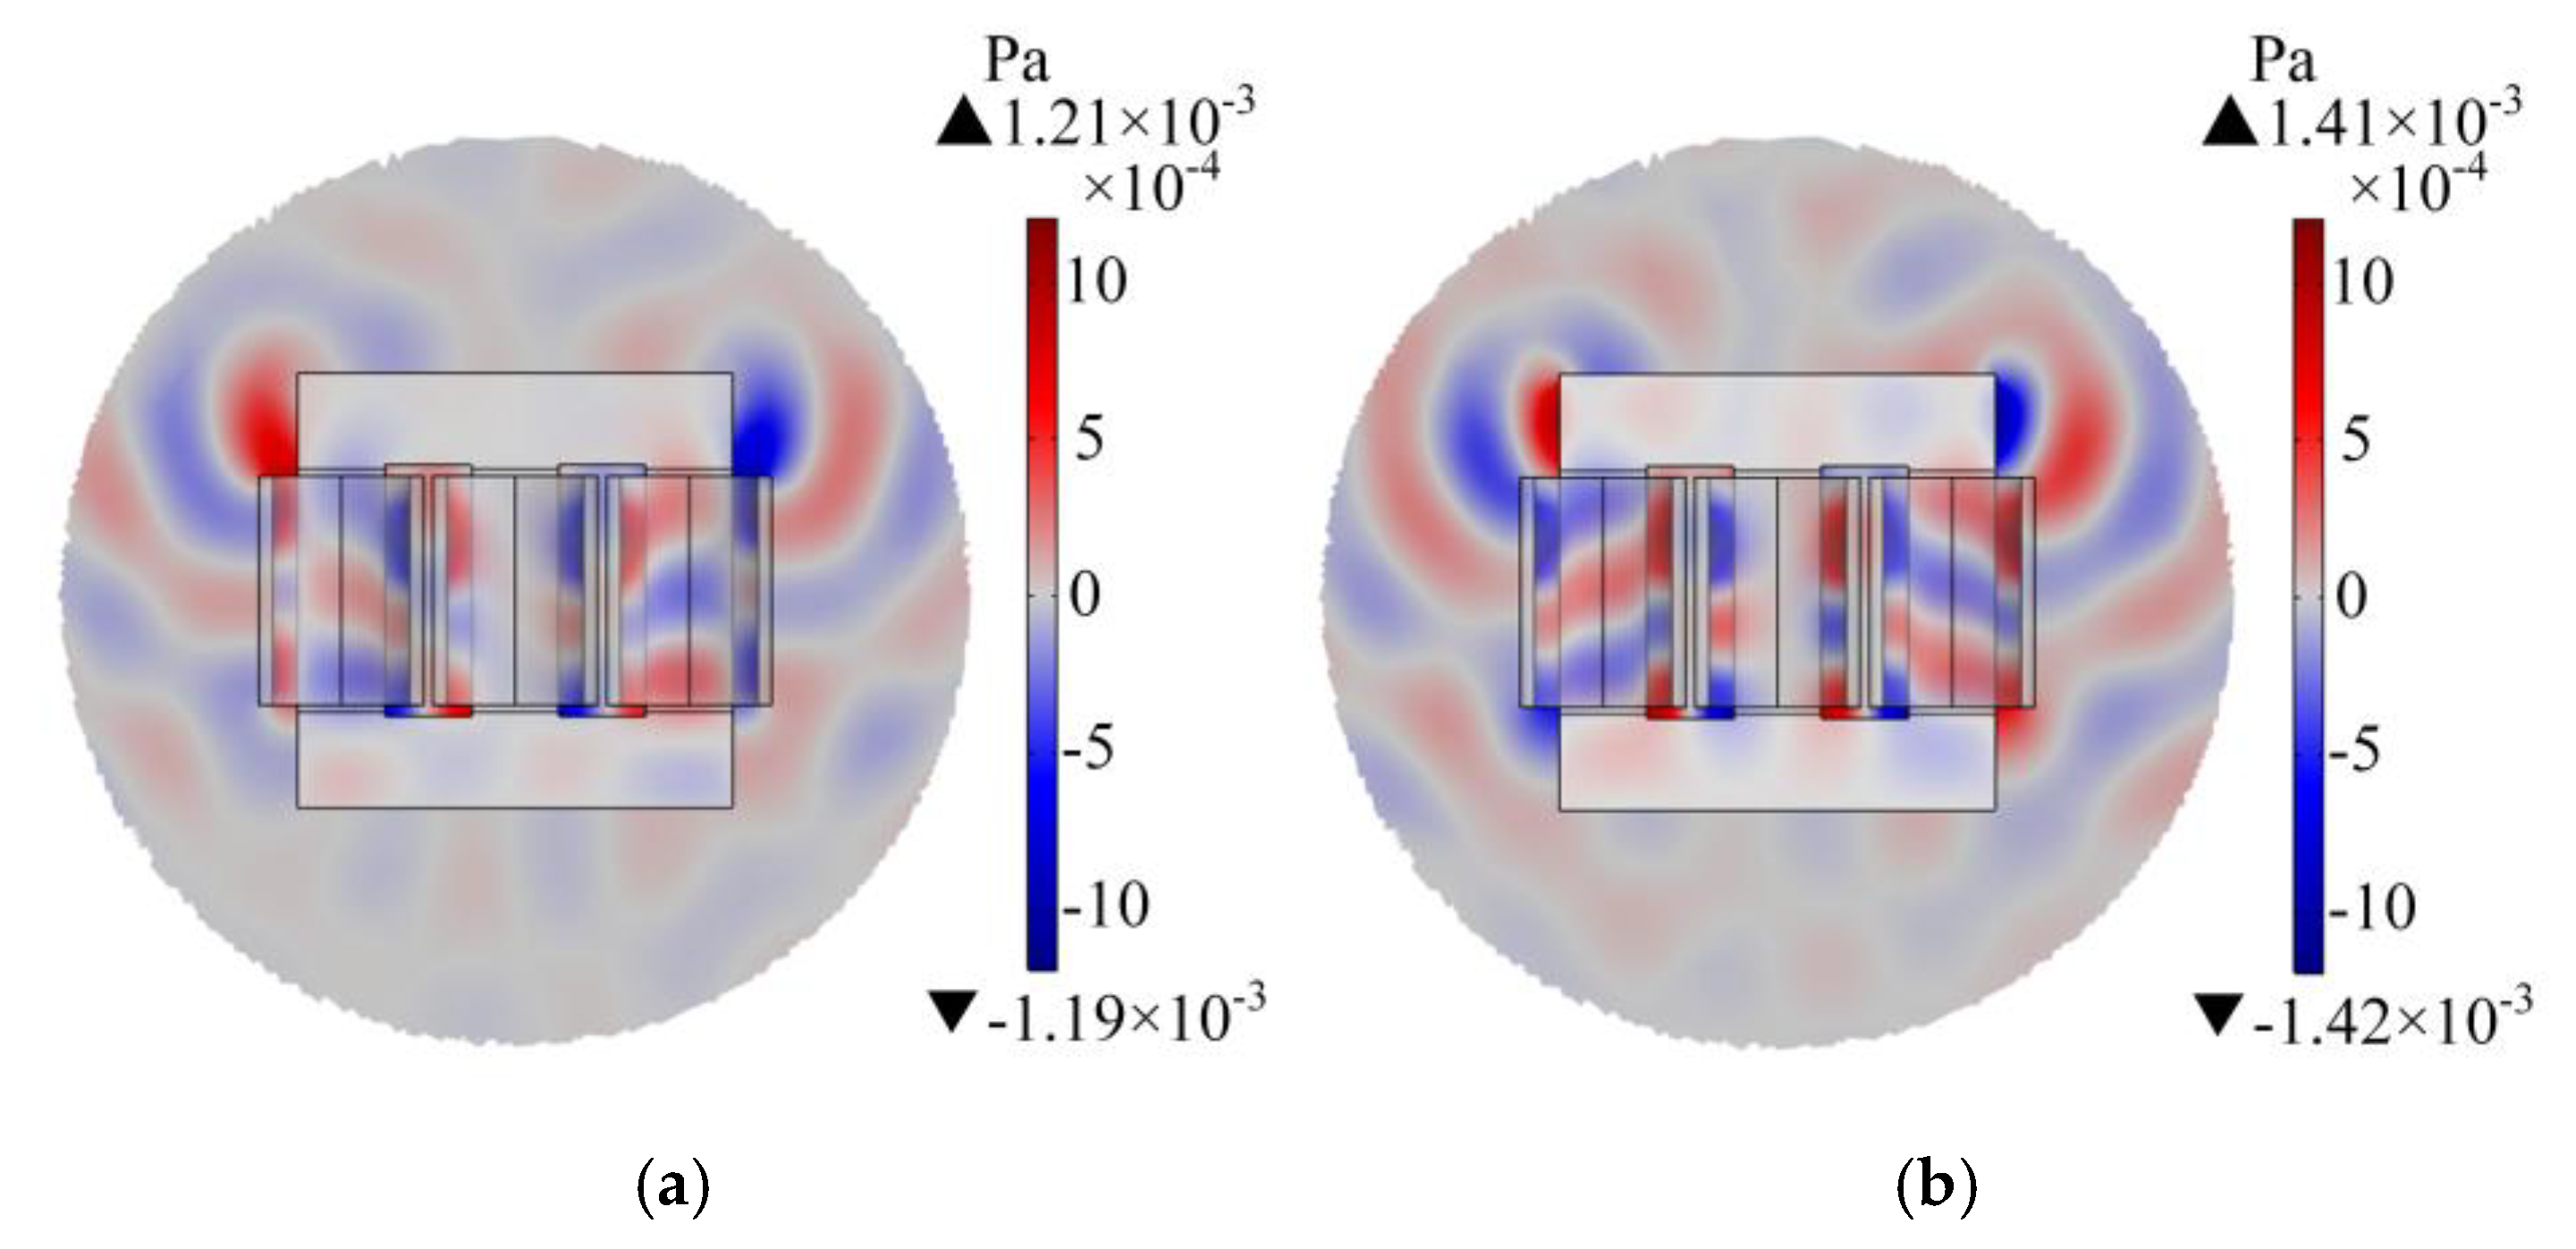
As shown in the tables above, Lmax increases with rising h and β, which is basically consistent with the varying g. Furthermore, there is no significant difference in Lmax between the constant component and fluctuating component disturbance conditions. When h = 2.0, Lmax increases by approximately 5 dB compared to that in the undisturbed condition at full load. Taking the mode with β = 50% and h = 1.5 as an example, the maximum sound pressure level on the transformer is shown in Figure 13. At the moment of mutation (t = 40 ms) in the fluctuating component, abnormal noise is caused by acute vibration, and spatial sound pressure distribution is shown in Figure 14.
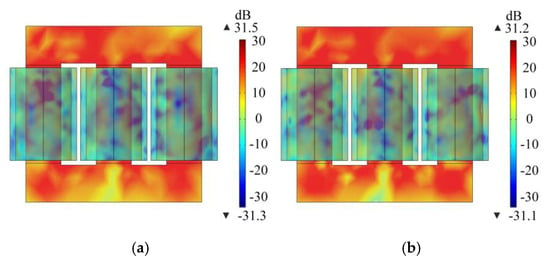
Figure 13.
Maximum surface sound pressure level of transformer. (a) Constant component disturbance; (b) fluctuating component disturbance.
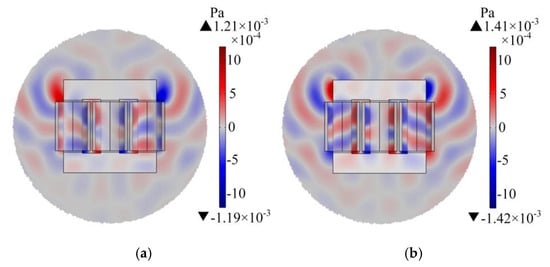
Figure 14.
Spatial sound pressure of transformer (t = 40 ms). (a) Constant component disturbance; (b) fluctuating component disturbance.
The results indicate that at the same disturbance level, the global noise from the constant component does not differ significantly from that of the fluctuating component. However, the global noise becomes substantially more pronounced at the fluctuating component mutation moment (t = 40 ms) than during constant component disturbance. Under the same mode, the sound pressure level of the core is higher than that of winding, which is consistent with the vibration simulation results.
The propagation of GIC disturbance in the three-phase transformer is simulated and analyzed, and the following laws are summarized:
(1) Under GIC intrusion, the physical features, such as current, leakage flux, electromagnetic force, and the vibration acceleration of winding, all have similar variation laws. Under the no-load conditions, the multi-field feature parameters display a “half-wave enhancement, half-wave decay” law, and their temporal fluctuations are significantly influenced by the fluctuating component. When |k| is larger, the amplitude fluctuations become more significant. However, the impact under the loading conditions is less pronounced. The multi-field feature parameters intensify with an increase in the DC disturbance level and the load rate. In the same mode, the feature parameters at the winding terminal change more noticeably.
(2) Core excitation, vibration, and noise intensify with an increasing disturbance level and load rate. At the same disturbance level and load rate, the vibration and noise of the core are more severe than those of winding. At the mutation moment of the fluctuating component, the core’s vibration and noise are greater than those under the same disturbance level of the constant component. When h reaches 2.0, the internal components of the transformer already exhibit severe vibration abnormalities, and global noise becomes significant.
3.2. Experimental Results
This section validates the EMAC model using the experimental data, ensuring the reliability of obtaining multi-field feature information.
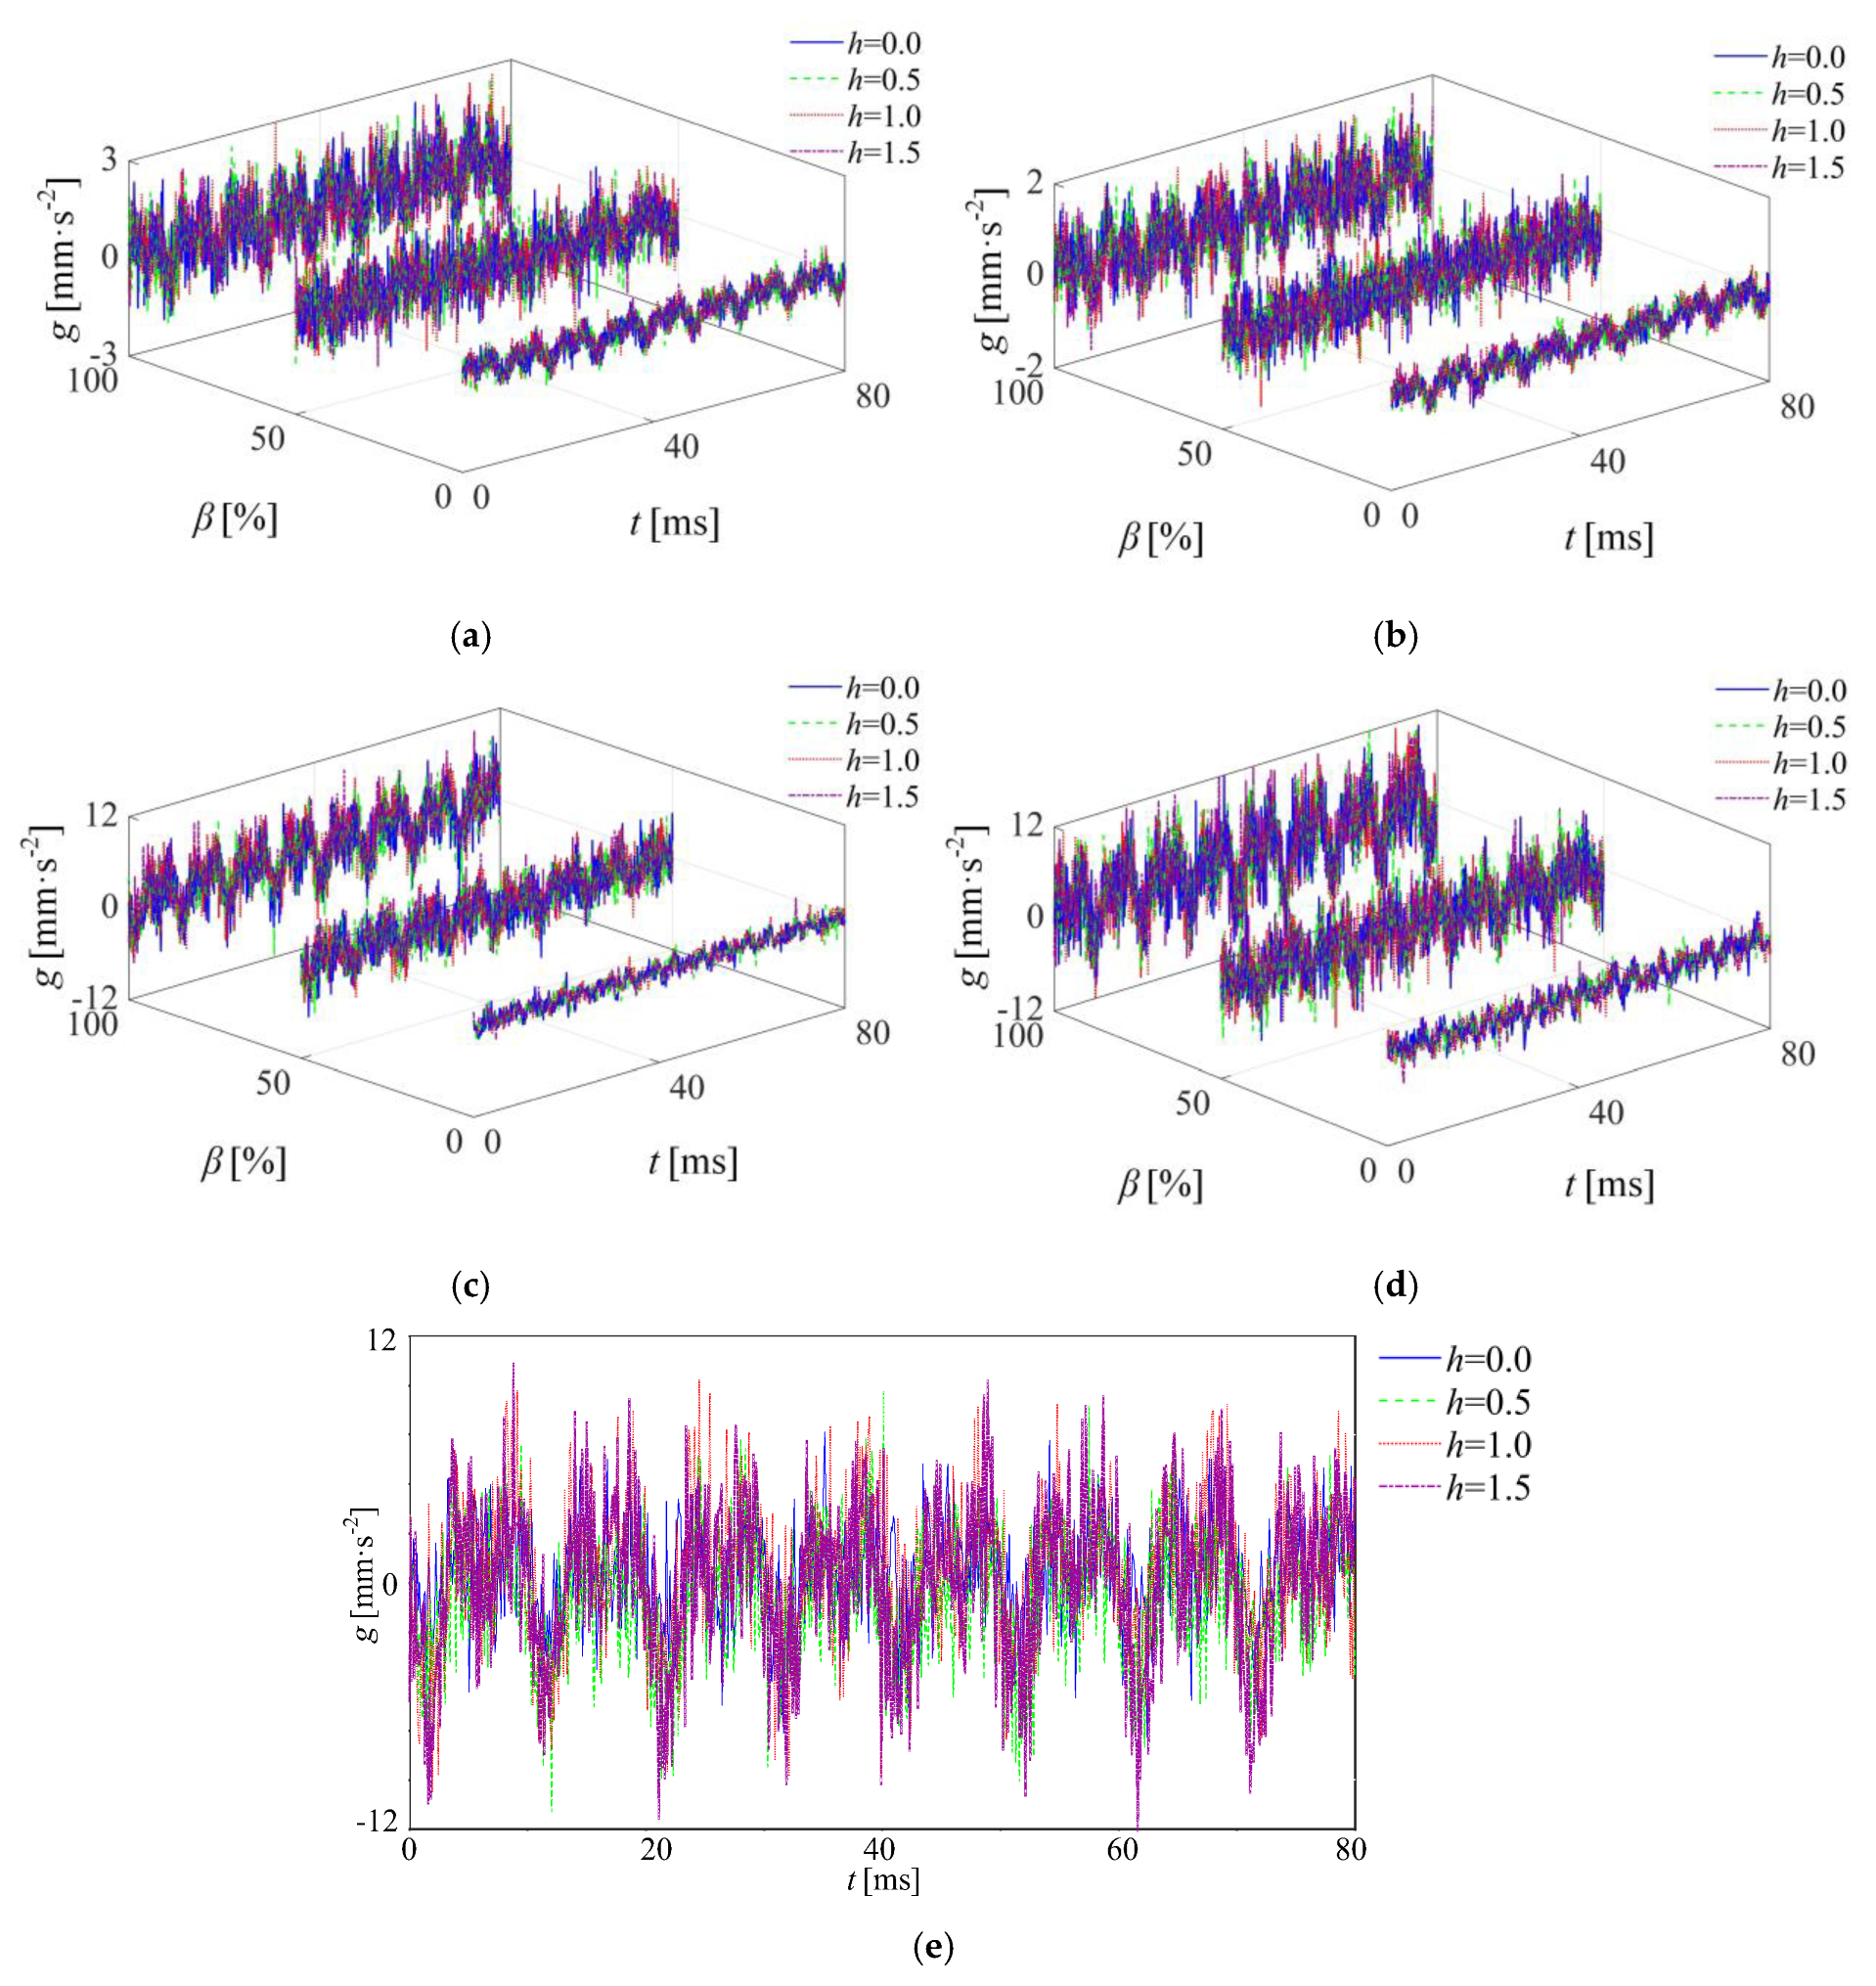
The vibration signals of the transformer components are collected, and their axial information is extracted as shown in Figure 15.
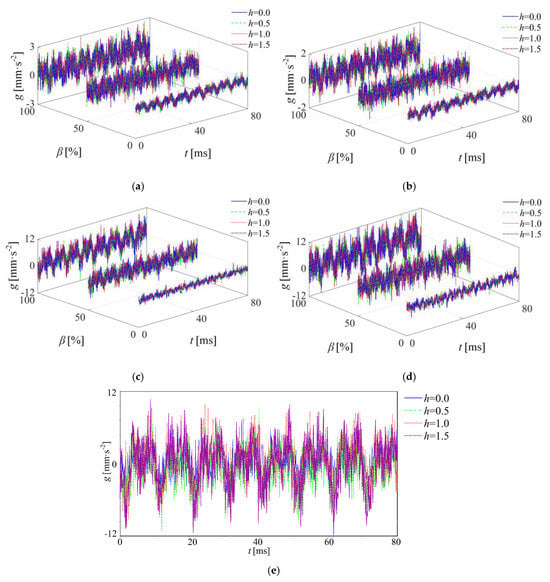
Figure 15.
Partial vibration monitoring results of transformer. (a) Observation point ① (fluctuating component). (b) Observation point ② (constant component). (c) Observation point ③ (fluctuating component). (d) Observation point ④ (fluctuating component). (e) Observation point ③ (constant component, β = 100%).
The results show that the vibration of the winding and the core intensifies with the increases in h and β, and the experimental and simulation laws are basically consistent. The nonlinear excitation and magneto-strictive characteristics of the core result in more high-frequency components in its vibration signal, and the tight coupling of components leads to mutual interference in vibration. Thus, the experimental waveform is more complex and severe than the simulation results. When h = 2.0, the component vibration is severe, and insulation burnout occurs.
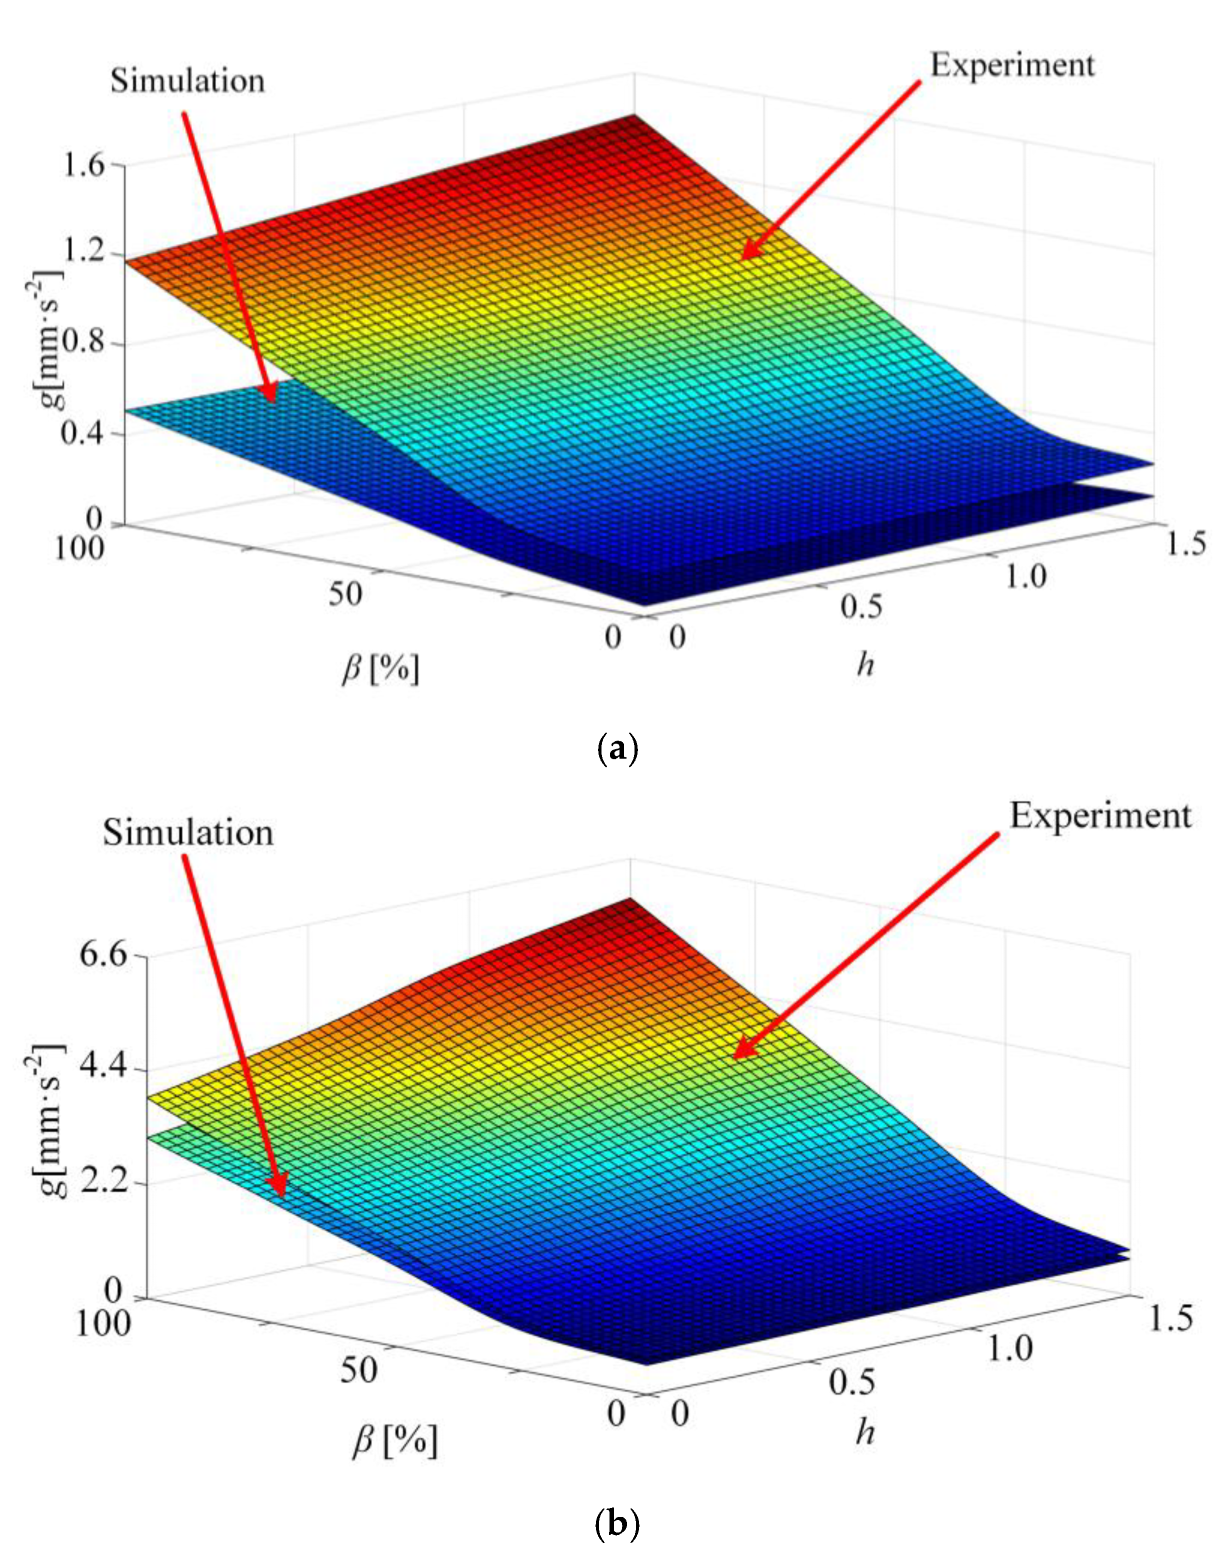
Taking observation points ② and ④ as examples, the effective values of the experimental vibration data are extracted and compared with the simulation results as shown in Figure 16.
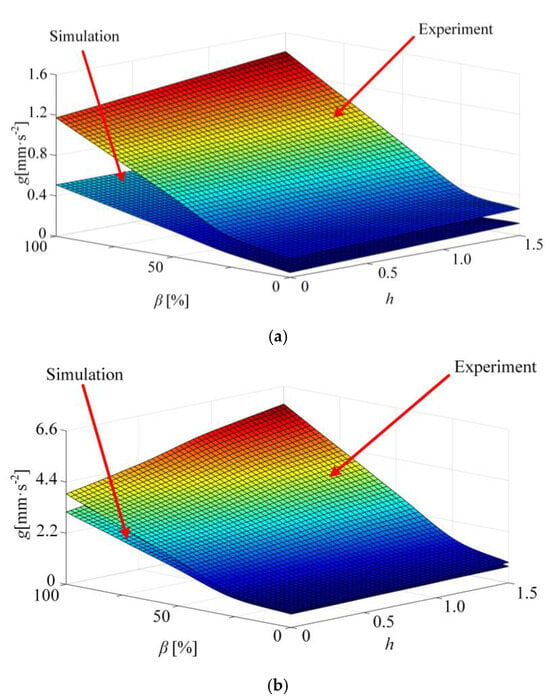
Figure 16.
Comparison between experiment and simulation of component vibration. (a) Observation point ② (fluctuating component). (b) Observation point ④ (constant component).
From the above comparison results, it can be seen that the mutual interference of the transformer components’ vibrations results in more severe experimental vibrations than the simulations, but the basic variation patterns of both are the same; the vibration of the winding and the core increases with rising h and β.
The experimental noise monitoring results of the transformer are shown in Table 5 and Table 6, which are directly compared with the simulation results in Table 3 and Table 4 to quantify the acoustic discrepancies. As detailed in Table 7 (constant component) and Table 8 (fluctuating component), the experimental noise levels exceed simulation results by 1.6–2.4 dB across all the tested conditions, with average errors of 2.0 dB (constant) and 1.9 dB (fluctuating). The errors remain within the engineering acceptability threshold of ±3 dB for acoustic measurements, a standard criterion outlined in GB/T 3785.1-2010. This difference stems from environmental factors, such as laboratory background noise (e.g., electromagnetic interference and auxiliary equipment vibration) and measurement uncertainties, which are inherent in physical testing environments.

Table 5.
Experimental noise of transformer with constant component disturbance.

Table 6.
Experimental noise of transformer with fluctuating component disturbance.

Table 7.
Errors between simulation and experimental noise (constant component disturbance).

Table 8.
Errors between simulation and experimental noise (fluctuating component disturbance).
Despite these absolute differences, both the experimental and simulation results exhibit the same variation trend. Taking constant component disturbance as an example, as h increases, Lmax rises monotonically in both the datasets; under full load, Lmax increases from 30.4 dB (simulation)/32.2 dB (experiment) at h = 0 to 33.8 dB (simulation)/35.8 dB (experiment) at h = 1.5.
4. Discussion
Building on the virtual-real consistency results presented in Section 3, the operational state intervals and stability threshold criteria of the transformer are further studied under GIC intrusion in this chapter.
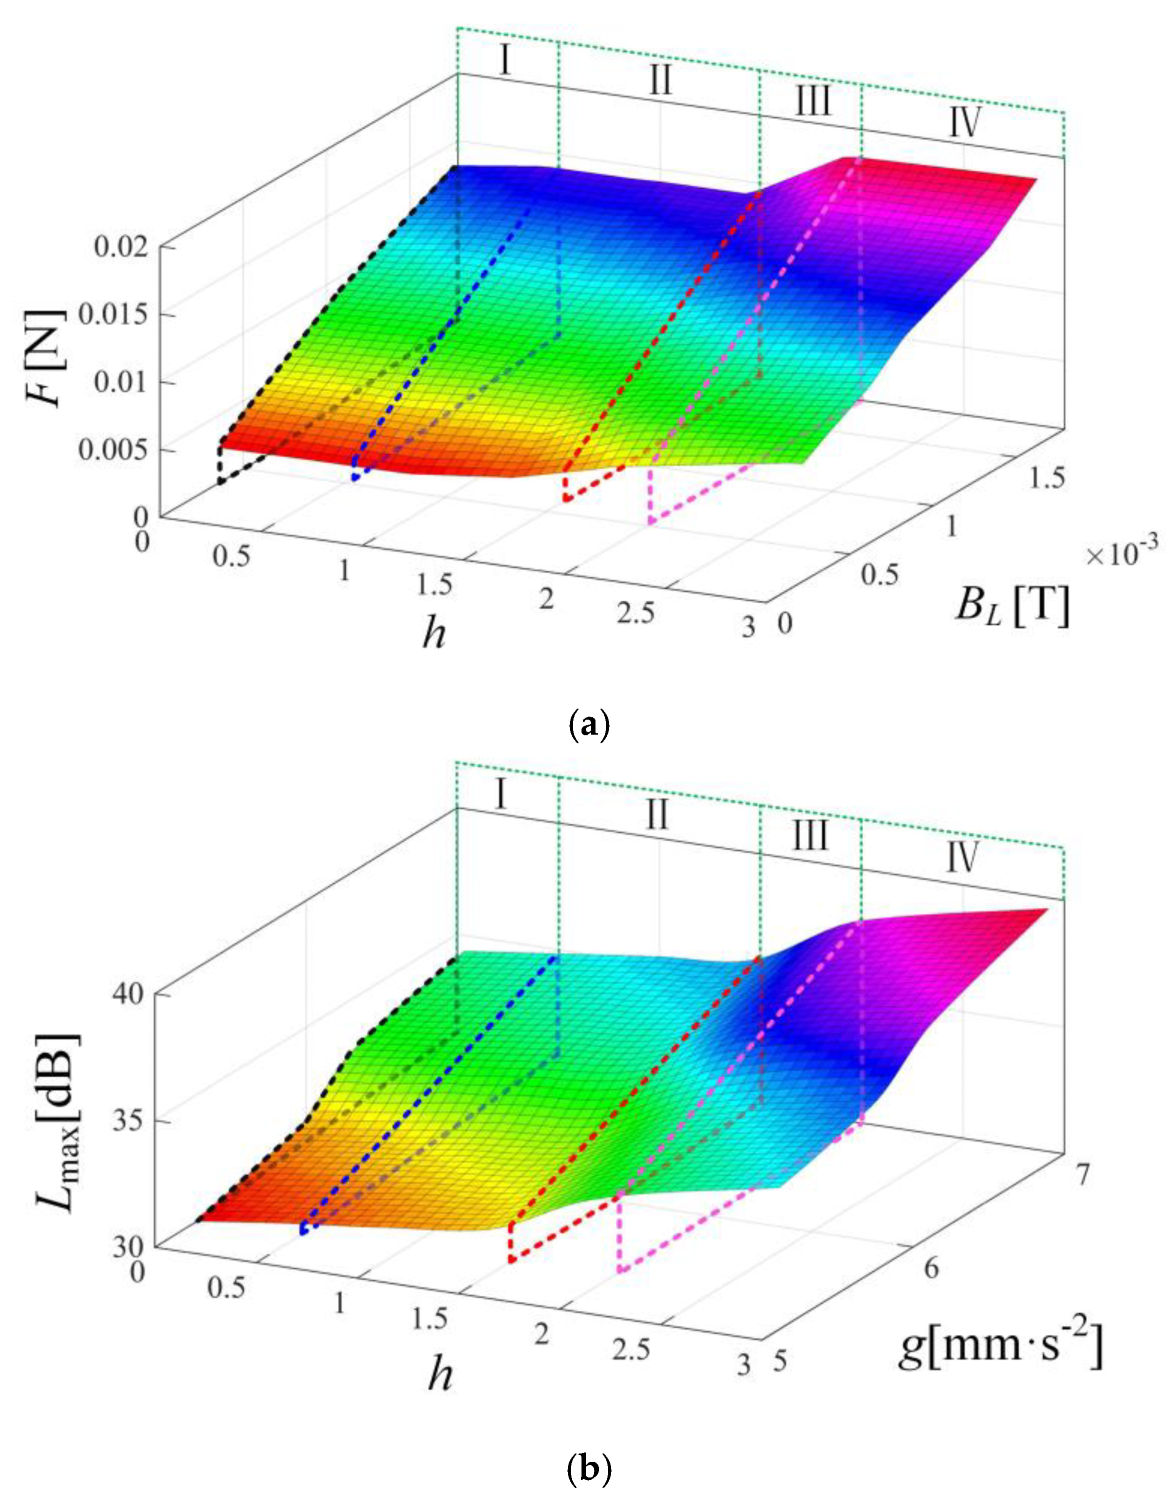
By analyzing the multi-field propagation of GIC disturbance in the electromagnetic–mechanical–acoustic fields of the transformer, a multi-feature information database is constructed. Subsequently, the feature information of each field is extracted and assigned different mode labels, forming multimodal feature information domains. Taking β = 0% and β = 100% as examples, the multimodal feature information distribution of the winding and the core is observed, and the typical feature information domains are illustrated in Figure 17.
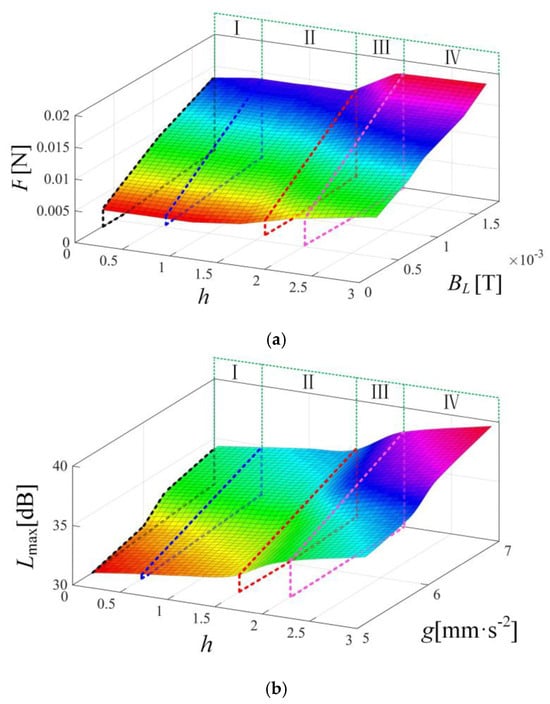
Figure 17.
Multimodal feature information domains. (a) Winding (β = 0%, h-BL-F, constant component). (b) Core (β = 100%, h-g-Lmax, fluctuating component). Four state intervals are bounded by dotted lines of different colors.
As shown in Figure 17, GIC disturbance has a significant impact on the multi-field feature distribution of components. The results show that the multimodal feature information domains under the different conditions have similar distribution rules. In the same mode, the amplitudes of feature information increase with the rising h. When the disturbance level h ≥ 2.0, the changes in multimodal feature information tend to be severe. Taking h as the key indicator, the feature information domains can be divided into four state intervals: Normal State (I), Alert State (II), Risk State (III), and Failure State (IV).
Based on the multimodal feature information domains, the stability criteria can be simplified as follows.
where R = 1.1 is the reliability coefficient, accounting for the measurement uncertainties and complex operating conditions to ensure robustness of the stability criteria under practical conditions. hGIC is the ratio of IGIC to I0 in actual engineering. When h reaches 1.5, the vibration and noise levels of the transformer become markedly intensified, hence h = 1.5 is designated as the safety threshold.
(1) When 0 ≤ h < 0.5, the transformer is minimally affected by the GIC. In this case, the GIC disturbance remains within the transformer’s tolerance range, and the state can be classified as a Normal State.
(2) When 0.5 ≤ h < 1.5, the vibration and noise of the components increase. If the transformer is continuously disturbed by the GIC, issues such as winding deformation and vibration displacement may arise. Here, the GIC significantly impacts the electromagnetic compatibility and structural stability of the transformer, and the state is classified as an Alert State.
(3) When 1.5 ≤ h < 2.0, the effect of the GIC on the transformer becomes severe, leading to instability in its internal electromagnetic and mechanical environment. Immediate action is required, and the state is determined as a Risk State.
(4) When h ≥ 2.0, GIC causes severe damage to the internal components and insulation of the transformer, and the state is classified as a Failure State.
In practical engineering, the load rate of transformers is generally lower than 75%. Though the winding current under GIC disturbance has not exceeded the safety threshold, adverse effects have occurred in internal components. In particular, the mutation characteristics of the fluctuating component in the GIC will repeatedly lead to an instantaneous increase in vibration and noise. When the mutation moment of disturbance current matches the phase angle of AC excitation, more serious mechanical hazards will be caused. Moreover, due to the characteristics of GIC disturbance, such as its long duration, random mutation time, and low variation frequency, the applicability of capacitor DC blocking device remains to be studied. Building on the established stability criteria, state interval indicators can be embedded into monitoring systems to enable real-time fault identification and the condition awareness of transformers under GIC disturbances.
In addition, it is essential to clarify that the IGIC modeled in this study represents a measurable electrical response to geomagnetic disturbance rather than the root cause of the disturbance itself (i.e., geomagnetic storm phenomenon). This approach prioritizes engineering practicality by focusing on observable neutral point currents, which differ fundamentally from non-geomagnetic DC bias scenarios (e.g., HVDC monopolar operation). In the latter, Ineutral remains stable and non-fluctuating (equivalent to setting k = 0 in Equation (11)), whereas the GIC exhibits inherent time-varying fluctuations (captured by the parameter k) that drive transient interactions with AC excitation, such as abrupt spikes in vibration acceleration and sound pressure (Figure 12 and Figure 14). While the framework can be adapted for other DC biases by removing temporal fluctuations, its core value lies in isolating the unique effects of GIC’s fluctuating component, a complex characteristic of real-world geomagnetic activity that prior studies have not fully addressed. By linking multi-physics responses to disturbance parameters (h and k), this work establishes a critical baseline for distinguishing GIC-induced anomalies from those caused by static DC bias, with implications for broader transformer condition monitoring.
5. Conclusions
This chapter provides an overview of the conclusions and practical application value based on the core results of this research.
An electromagnetic–mechanical–acoustic coupling (EMAC) model is built to analyze the transformer responses under geomagnetically induced current (GIC) interference, validated through simulation–experiment consistency. The multi-physics interactions reveal that key parameters—including magnetic flux, vibration acceleration, and noise levels—intensify with rising GIC disturbance levels. The simulation results show that at a disturbance level h = 1.5, the vibration acceleration of no-load winding increases by approximately 1.2 times relative to the undisturbed state. Similarly, when h = 1.5, the vibration amplitudes at core observation points under loading conditions are approximately 1.3 times larger than those under undisturbed conditions.
The time-varying nature of the GIC significantly impacts transformer stability, with the fluctuating component causing transient distortions in vibrations and noise, particularly when its mutation moment aligns with the phase angle of AC excitation. Taking the mode with β = 50% and h = 1.5 as an example, at the mutation moment (t = 40 ms), the maximum global sound pressure under fluctuating component (1.42 ×·10−3 Pa) is notably higher than that under the constant component (1.12 × 10⁻³ Pa).
By integrating the multi-field feature data, operational state intervals are defined using h as a key indicator. At 0 ≤ h < 0.5, the GIC effects remain within the transformer’s tolerance (Normal State). As h rises to 0.5 ≤ h < 1.5, vibrations and noise increase significantly, necessitating continuous monitoring (Alert State). Severe internal instability occurs at 1.5 ≤ h < 2.0, requiring immediate action (Risk State), while h ≥ 2.0 leads to critical component damage (Failure State). Building on the established stability criteria, state interval indicators can be embedded into monitoring systems to enable the real-time fault identification and condition awareness of transformers under GIC disturbance.
Author Contributions
Conceptualization, J.A. and X.S.; methodology, C.P.; investigation, J.A.; writing—original draft preparation, J.A.; writing—review and editing, X.S.; supervision, C.P. All authors have read and agreed to the published version of the manuscript.
Funding
This research was funded by the National Key R&D Program of China, grant number 2021YFB2400800.
Data Availability Statement
The original contributions presented in this study are included in the article. Further inquiries can be directed to the corresponding author.
Conflicts of Interest
The authors declare no conflicts of interest.
Abbreviations
The following abbreviations are used in this manuscript:
| GIC | Geomagnetically induced current |
| EMAC | Electromagnetic–mechanical–acoustic coupling |
Appendix A
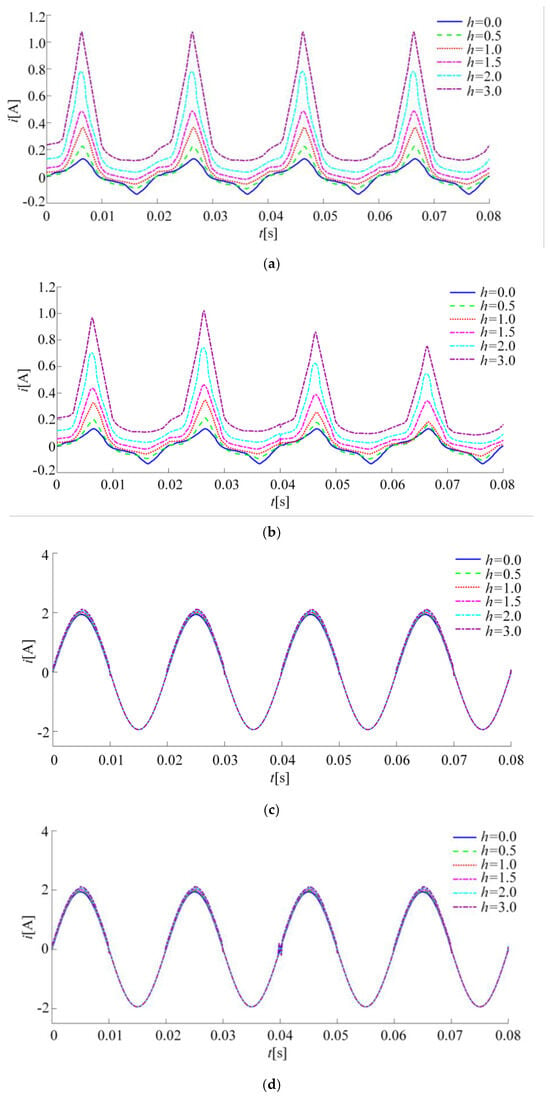
Figure A1.
Partial results of primary winding current. (a) β = 0 (constant component); (b) β = 0 (fluctuating component); (c) β = 100% (constant component); (d) β = 100% (fluctuating component).
Figure A1.
Partial results of primary winding current. (a) β = 0 (constant component); (b) β = 0 (fluctuating component); (c) β = 100% (constant component); (d) β = 100% (fluctuating component).
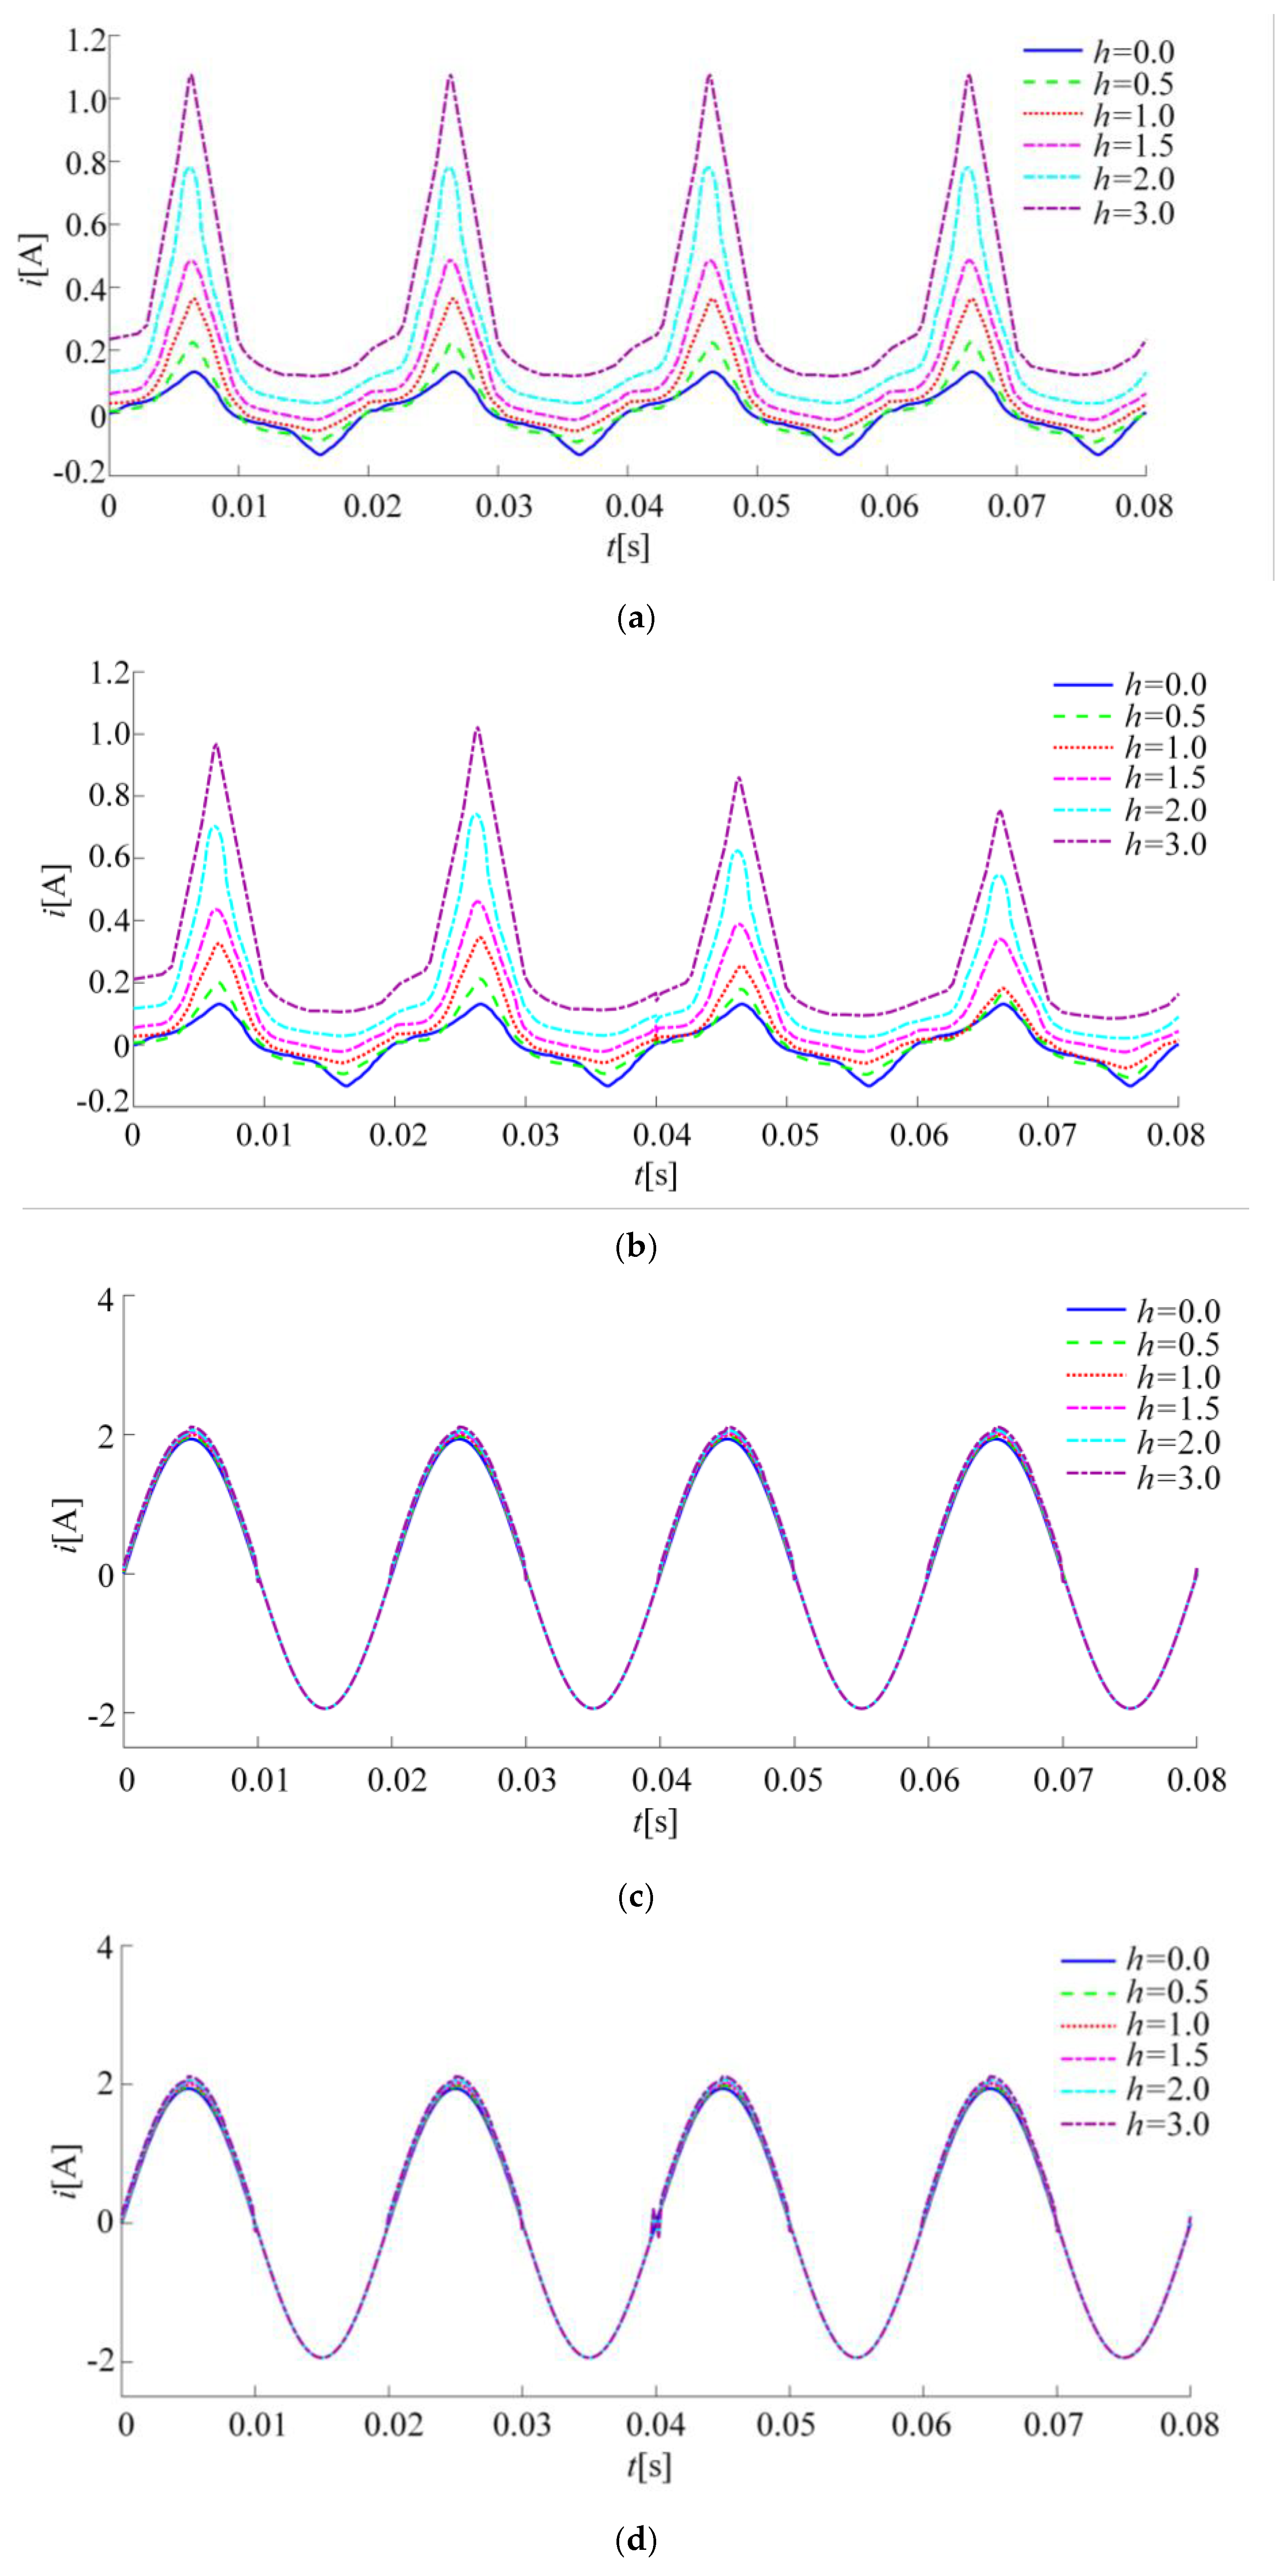
Figure A1 presents the primary winding current waveforms under varying load rates and disturbance modes. Figure A1a,b correspond to the no-load condition (β = 0%). Both the fluctuating and constant component disturbances induce current distortion, which becomes more severe with increasing disturbance levels. However, the fluctuating component leads to more complex temporal fluctuations. For instance, the waveform peaks during 60–80 ms are significantly lower than those at 20–40 ms (see Figure A1b). Notably, abrupt distortion occurs at the fluctuating component’s mutation moment (t = 40 ms), a phenomenon absent under constant component disturbance.
Figure A1c,d represents the full-load condition (β = 100%). Here, the impacts of both the disturbance components are less pronounced compared to the no-load case. The current distortion under disturbance (h > 0) shows minimal deviation from the undisturbed waveform (h = 0). Nevertheless, a transient distortion still emerges at t = 40 ms under fluctuating component disturbance, highlighting its unique transient behavior even under full load.
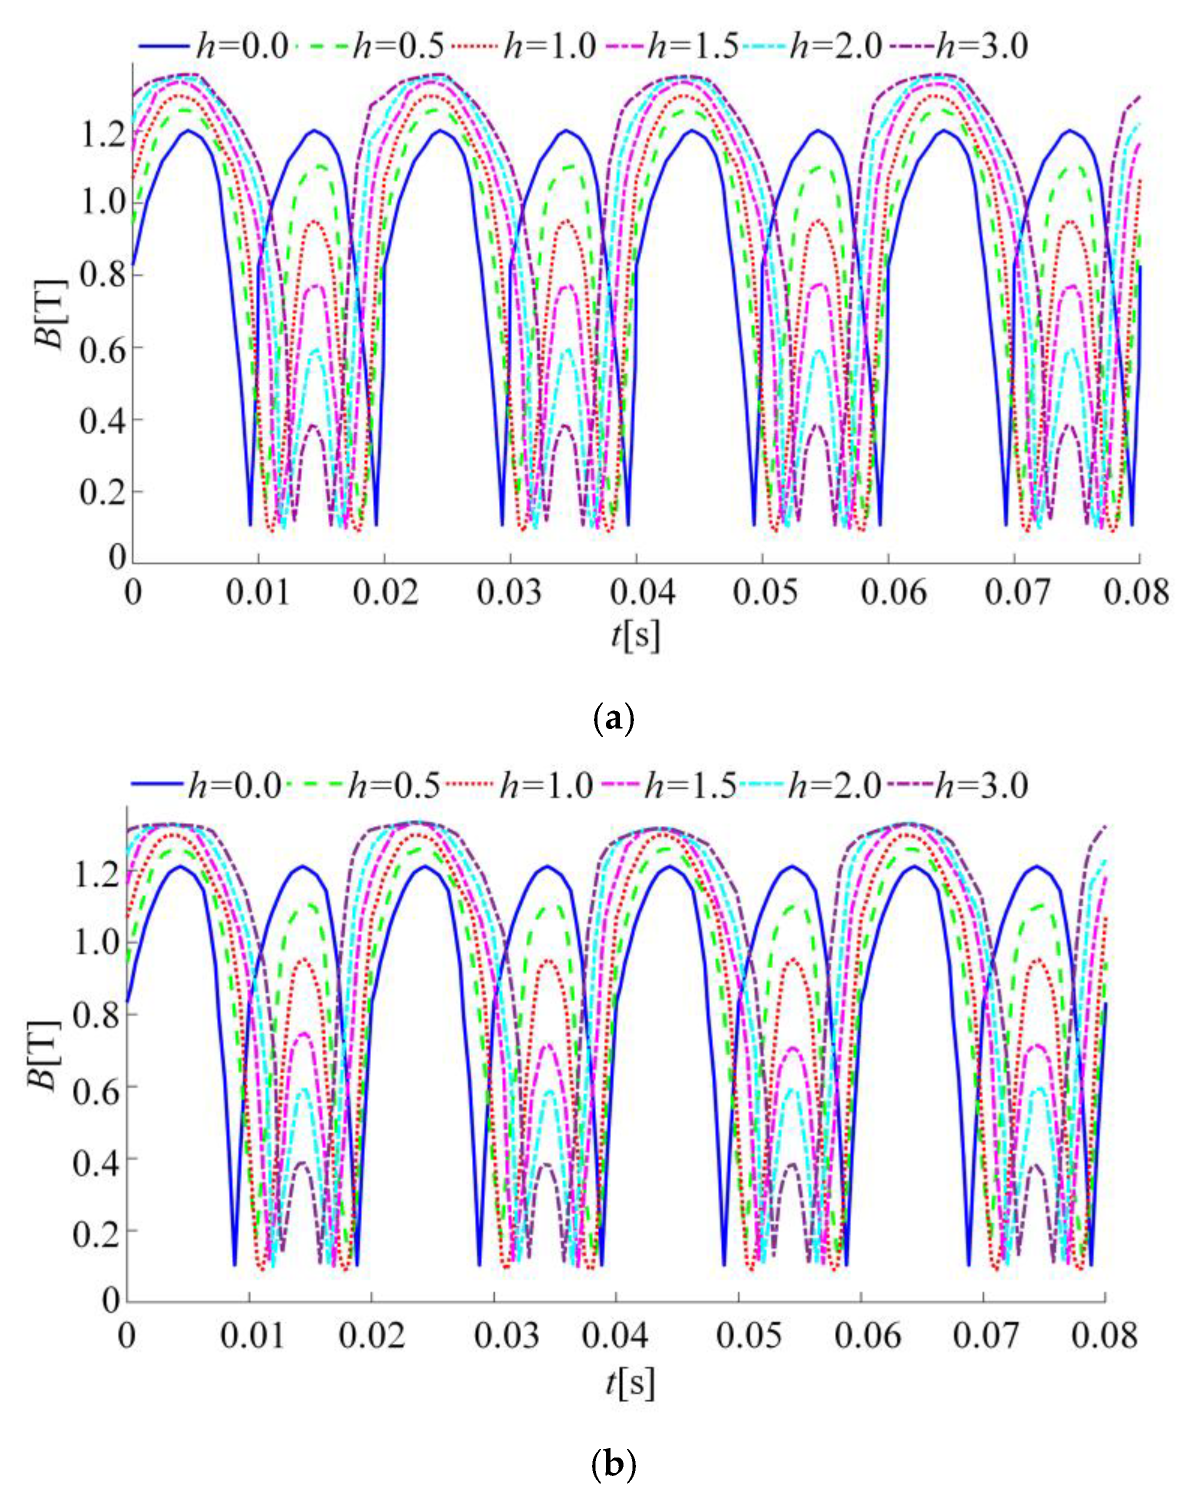
Taking the constant component disturbance mode as an example, partial simulation results of the B-phase main flux are as follows.
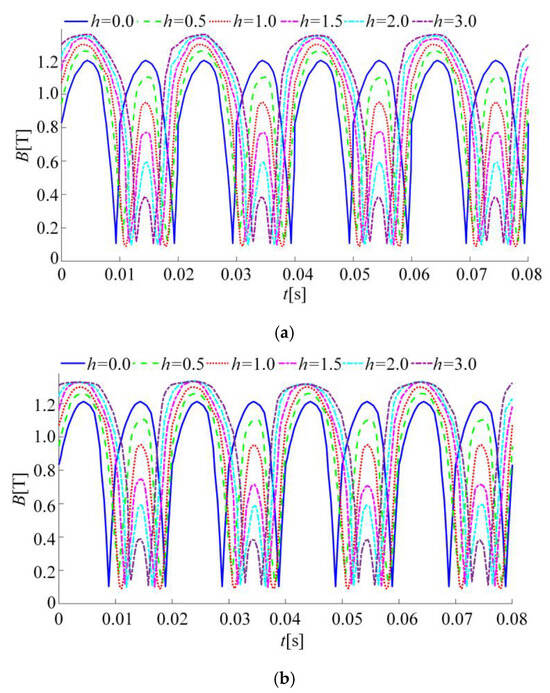
Figure A2.
Partial results of main flux (filtered out DC bias components). (a) β = 0; (b) β = 100%.
Figure A2.
Partial results of main flux (filtered out DC bias components). (a) β = 0; (b) β = 100%.
References
- Canturk, S.; Balci, M.E.; Hocaoglu, M.H.; Koseoglu, A.K. Investigation of the effects of DC bias on single-phase shell type transformers using frequency-dependent reluctance-based model. IEEE Trans. Magn. 2021, 57, 1–9. [Google Scholar] [CrossRef]
- Chen, Z.W.; Li, H.M.; Liu, L.W.; Xiang, L.; Bai, B.D. DC bias treatment of hybrid type transformer based on magnetic flux modulation mechanism. IEEE Trans. Magn. 2019, 55, 1–4. [Google Scholar] [CrossRef]
- Akbari, M.; Rezaei-Zare, A. Thermal analysis of power transformers under geomagnetically induced current. IEEE Trans. Power Del. 2023, 38, 4114–4121. [Google Scholar] [CrossRef]
- Xin, W.K.; Liu, C.M.; Rezaei-Zare, A.; Li, A.Q.; Wang, Z.Z. Real-time monitoring method of power grid voltage stability during geomagnetic storms. IEEE Trans. Power Del. 2023, 39, 192–201. [Google Scholar] [CrossRef]
- Pan, Z.H.; Wang, X.M.; Tan, B.; Zhu, L.; Liu, Y.; Liu, Y.L.; Wen, X. Potential compensation method for restraining the DC bias of transformers during HVDC monopolar operation. IEEE Trans. Power Del. 2016, 31, 103–111. [Google Scholar] [CrossRef]
- Chen, D.Z.; Hou, B.Q.; Feng, Z.Y.; Bai, B.D. Study of magnetostriction influence of electrical sheet steel under different DC biases. IEEE Trans. Magn. 2019, 55, 1–5. [Google Scholar] [CrossRef]
- Li, X.; Wen, X.; Markham, P.; Liu, Y. Analysis of nonlinear characteristics for a three-phase, five-limb transformer under DC bias. IEEE Trans. Power Del. 2010, 25, 2504–2510. [Google Scholar] [CrossRef]
- Ding, H.; Zhao, W.; Li, M.; Zhang, L.; Sun, Y. Electromagnetic vibration characteristics of high-frequency transformer under DC bias with different winding structures. Processes 2023, 11, 1185. [Google Scholar] [CrossRef]
- Boteler, D.H.; Bradley, E. On the interaction of power transformers and geomagnetically induced currents. IEEE Trans. Power Del. 2016, 31, 2188–2195. [Google Scholar] [CrossRef]
- Bejmert, D.; Boehme, K.; Kereit, M.; Rebizant, W. HV transformer protection and stabilization under geomagnetically induced currents. Energies 2020, 13, 4693. [Google Scholar] [CrossRef]
- Duan, J.; Bao, Y.; Zhang, G.; Wang, X.; Jiang, P.; Niu, W.; Zhang, H.; Zhen, W.; Xia, Y.; Song, R. Modeling and simulation analysis of three-phase saturable transformers: A study on the effects of geomagnetically induced current on transformers. Energies 2025, 18, 824. [Google Scholar] [CrossRef]
- Rezaei-Zare, A. Reactive power loss versus GIC characteristic of single-phase transformers. IEEE Trans. Power Del. 2015, 30, 1639–1640. [Google Scholar] [CrossRef]
- Rezaei-Zare, A.; Marti, L.; Narang, A.; Yan, A. Analysis of three-phase transformer response due to GIC using an advanced duality-based model. IEEE Trans. Power Del. 2015, 31, 2342–2350. [Google Scholar] [CrossRef]
- Saleh, S.A.; Zundel, E.W.; Young-Morris, G.; Meng, J.; Cardenas, J.; Hill, E.F.; Brown, S. Impacts of transformer loading on the harmonic distortion created by GIC flows. IEEE Trans. Ind. Appl. 2024, 60, 4666–4676. [Google Scholar] [CrossRef]
- Abuhussein, A.; Sadi, M.A.H. The impact of geomagnetically produced negative-sequence harmonics on power transformers. IEEE Access 2021, 9, 19882–19890. [Google Scholar] [CrossRef]
- Zheng, T.; Gao, X.Q.; Yang, G.S. Analysis of GIC flow path in windings of three-phase power transformer. Electr. Power Automat. Equip. 2017, 37, 104–112. [Google Scholar]
- Liu, C.M.; Liu, L.G.; Pirjola, R. Geomagnetically induced currents in the high-voltage power grid in China. IEEE Trans. Power Del. 2009, 24, 2368–2374. [Google Scholar] [CrossRef]
- Zhao, X.; Lu, J.; Li, L.; Cheng, Z.; Lu, T. Analysis of the DC bias phenomenon by the harmonic balance finite-element method. IEEE Trans. Power Del. 2011, 26, 475–485. [Google Scholar] [CrossRef]
- Pan, C.; Wang, C.; Liu, Z.; Chen, X. Winding vibration analysis of unbalanced transformer based on electromagnetic-mechanical coupling. Int. J. Electr. Power Energy Syst. 2022, 134, 107459. [Google Scholar] [CrossRef]
- He, L.; Zhu, Y.; Liu, G.; Cao, C. Simulation analysis and experiment research of transformer vibration based on electric–magnetic–mechanic coupling. Energies 2025, 18, 2238. [Google Scholar] [CrossRef]
- Duan, X.; Zhao, T.; Liu, J.; Zhang, L.; Zou, L. Analysis of winding vibration characteristics of power transformers based on the finite-element method. Energies 2018, 11, 2404. [Google Scholar] [CrossRef]
- IEC Standard 60076–10; Power Transformers: Part 10: Determination of Sound Levels. International Electrotechnical Commission: Geneva, Switzerland, 2001.
- IEC Standard 16063-44; Methods for the Calibration of Vibration and Shock Transducers: Part 44: Calibration of Field Vibration Calibrators. International Electrotechnical Commission: Geneva, Switzerland, 2018.
- GB/T 3785.1-2010; Electroacoustics: Sound Level Meters: Part 1: Specifications. Standards Press of China: Beijing, China, 2018.
Disclaimer/Publisher’s Note: The statements, opinions and data contained in all publications are solely those of the individual author(s) and contributor(s) and not of MDPI and/or the editor(s). MDPI and/or the editor(s) disclaim responsibility for any injury to people or property resulting from any ideas, methods, instructions or products referred to in the content. |
© 2025 by the authors. Licensee MDPI, Basel, Switzerland. This article is an open access article distributed under the terms and conditions of the Creative Commons Attribution (CC BY) license (https://creativecommons.org/licenses/by/4.0/).

