Abstract
In the era of digitalization, prescriptive maintenance and equipment condition monitoring are essential for ensuring the continuity of operations in various industries. The proposed software solution provides an integrated solution for monitoring and maintaining equipment, facilitating the collection, processing and interpretation of data related to their performance. Prioritization of prescriptive maintenance recommendations for alerts within the application is based on a set of well-defined criteria that integrate both the analysis of physical sensor data and computer logs. This is achieved through a hierarchical classification mechanism, combining predefined thresholds, prescriptive assessments and severity levels. The proposed project is a prescriptive equipment monitoring and maintenance application focused on the collection and analysis of sensor data to identify and prevent potential failures. The application structure integrates components such as data processing, machine learning, databases and recommendation generation, each of which has a specific role in the project workflow. The integration of sensor data and logs enhances robustness, scalability and efficiency, ensuring both high performance and adaptability to the varying needs of users. The proposed system processes and analyzes large data volumes. It combines threshold-based logic with machine learning to enhance adaptability.
1. Introduction
Within quickly advancing scenes of data innovation around technology and communications, a framework of unwavering quality and execution is basic to operational effectiveness. Conventional support methodologies, such as responsive and preventive approaches, frequently result in unforeseen disappointments, expanded downtime and excessive costs. The rise in prescient upkeep has made advances over disappointment expectations through information analytics and machine learning. In any case, prescriptive upkeep speaks to a worldview move to not foresee disappointments but suggest optimized remedial activities in real time [1].
This article investigates the hypothetical establishment and execution system of a prescriptive support framework, particularly custom-made for IT&C hardware. By joining artificial intelligence, Internet of Things sensors and progressed analytics, prescriptive support empowers mechanized decision-making and self-healing capabilities inside IT&C infrastructures. The main idea looks at key innovative enablers, challenges and potential benefits, emphasizing the part of machine learning models, inconsistency location and decision-support frameworks. Diagramming a possible strategy for implementing a prescriptive upkeep framework in IT&C scenarios while considering its viability, impact and selection issues is the aim of this investigation. Using an efficient examination of existing tactics and emerging trends, this article focuses on the important topics that contribute to the academic discussion of an effective maintenance system and their recommendations for IT&C resource administration.
The non-functional requirements specific to the prescriptive maintenance of the application must cover aspects that ensure its efficiency, scalability and reliability in practical use. The software application must support regular updates without significant operational interruptions, ensure compatibility with the latest versions of software packages and allow easy integration of new modules for data processing and improvement of prediction algorithms. Application reliability is crucial, so it must be able to handle database connection failures as indicated in the log file and have robust mechanisms for detecting, notifying and resolving critical issues such as excessive memory or disk space usage. The application must provide consistent performance, even with large volumes of processed data, and optimize response times to evaluate and generate recommendations. To facilitate the efficient integration of data from many sources, it is recommended to employ techniques such as chronological unification and data aggregation.
Constant monitoring and automated reports, as well as the ability to intervene in real time to adjust maintenance patterns, are also essential requirements to support effective and proactive prescriptive maintenance. System logs significantly contribute to improving the reliability of an application, providing critical information about the system performance and status in real time [2]. They allow continuous events monitoring and rapid identification of technical problems. For example, from the log file, it can be seen how incidents, such as a loss of database connection, excessive memory usage and reaching critical disk space thresholds, are recorded. This information is essential for the early detection of risk situations and for preventing a possible total service interruption. The logs give information about the nature of the issues (such as “Database connection lost” or “Critical disk space usage”) and the precise moment they happened. These data make it easier to identify root causes and allow the technical team to quickly intervene and implement appropriate solutions.
In addition, the log history can be analyzed to identify recurring patterns, which helps prevent future problems by adjusting configurations or optimizing the application [2]. Logs can also be used to evaluate the performance of system components and to validate changes made during maintenance. In prescriptive maintenance scenarios, this information supports the modeling and updating of prescriptive algorithms, providing concrete feedback on the effectiveness of the implemented solutions [3].
2. Materials and Methods
The stages of the data integration process are collecting data from various sources, loading and transforming data into the working format, validating and cleaning data, standardizing data and storing it in the database, respectively, consolidating it for the machine learning process. Designing an effective prescriptive maintenance system involves a detailed planning and software modeling stage, which guarantees the system’s proper operation and that the performance requirements are met [4]. The schematization of the elements represents a fundamental stage in the software design process and the flows that intervene at the level of the developed application.
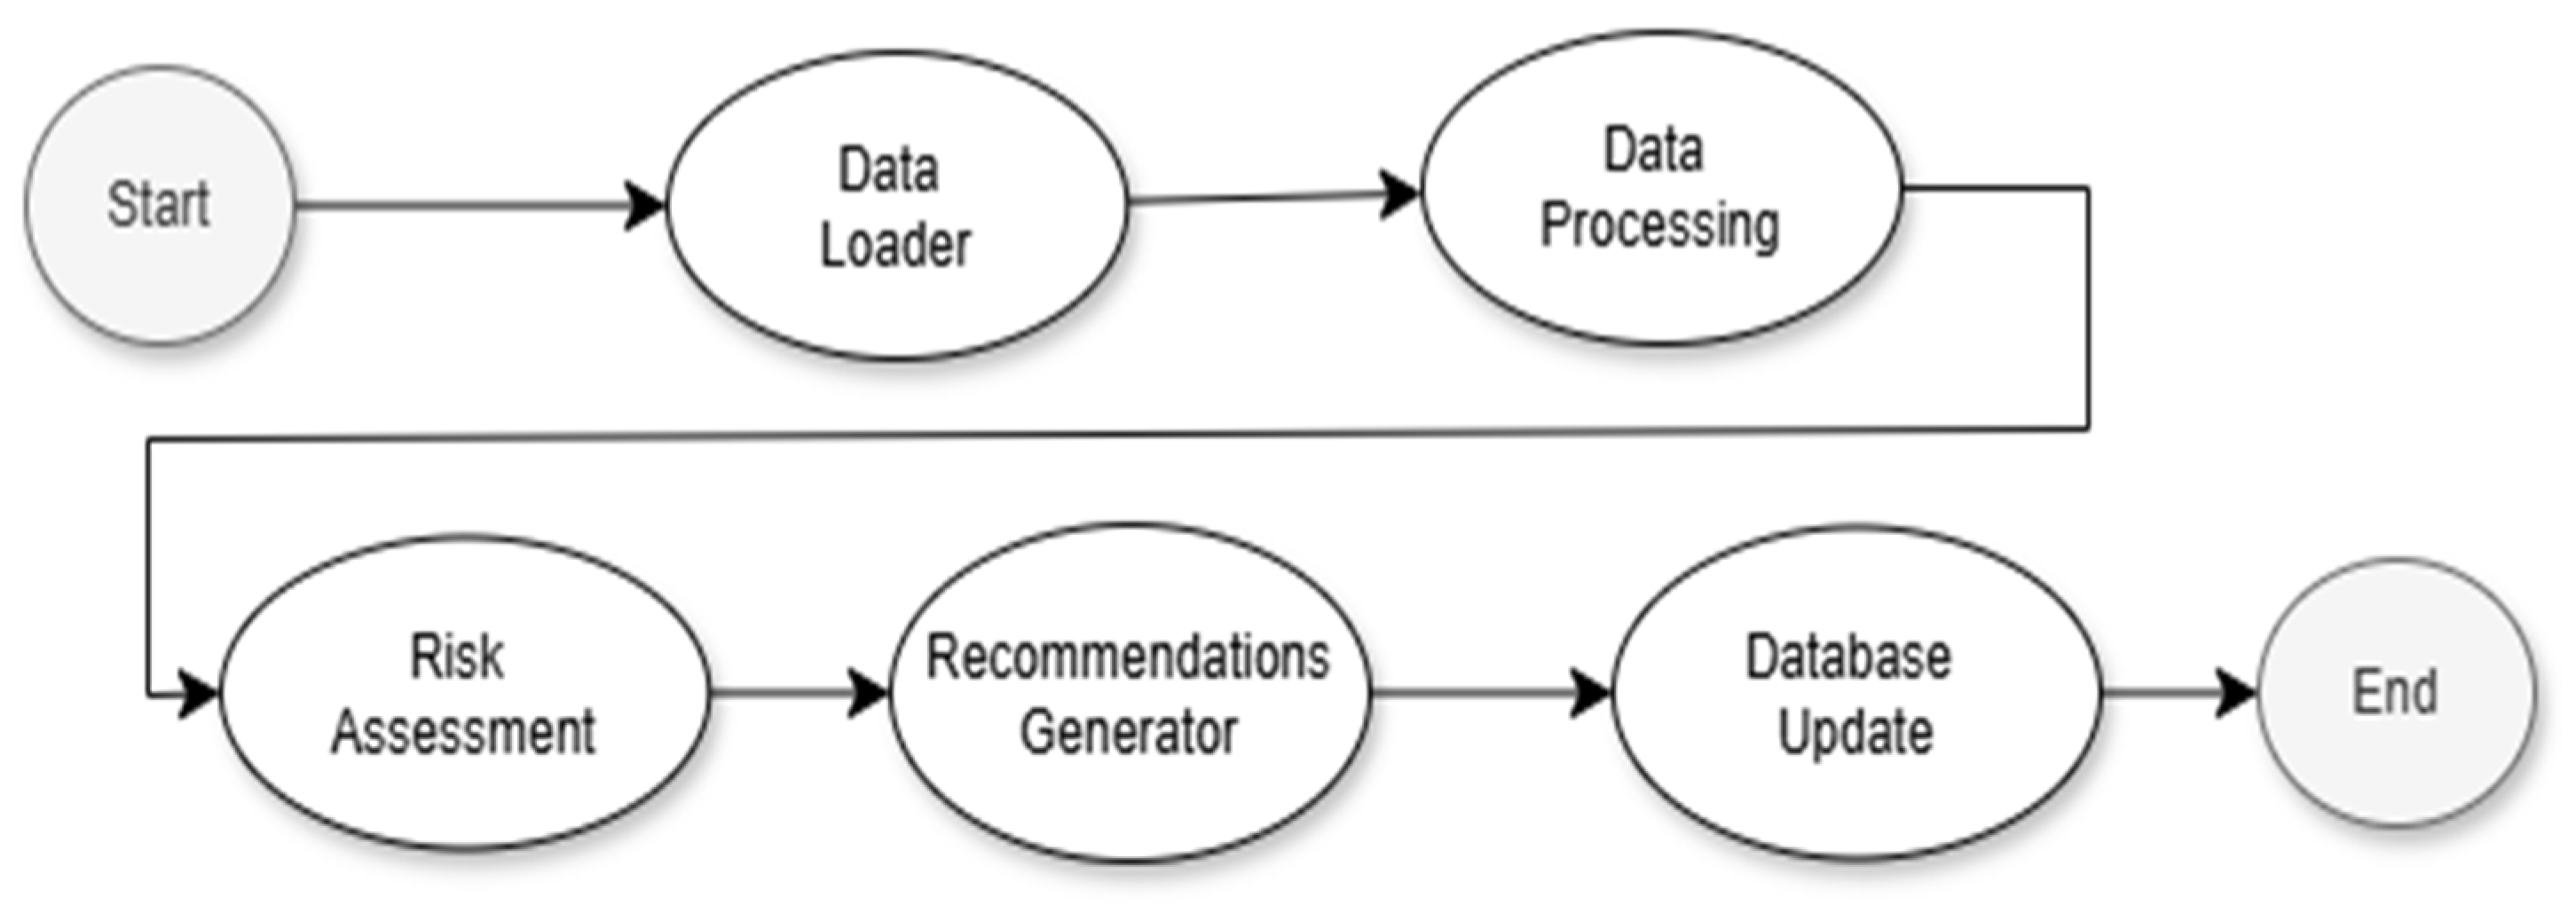
The activity diagram presented in Figure 1 shows the main flow of the maintenance process, from data loading and processing to risk assessment and recommendation generation. Figure 1 illustrates the system’s key stages and the sequential relationships between them.

Figure 1.
Activity diagram.
The dataset used in the prescriptive maintenance system originates from a combination of field-collected sensor data and system-generated logs. Sensor data are acquired directly from IT&C equipment using physical sensors embedded in or connected to the hardware. These sensors likely monitor parameters such as temperature, memory usage and operational thresholds relevant to equipment performance. In parallel, system logs, extracted from software applications, record events like database disconnections, critical memory consumption and disk space issues. These two data sources are integrated to provide a comprehensive view of equipment health, enabling both reactive and proactive maintenance strategies.
The system relies heavily on historical data patterns, indicating a longitudinal collection approach over an extended period. These data feed into machine learning models, such as Random Forest and Gradient Boosting algorithms, which are trained to assess risk levels and predict failures. Before training, the data undergo a thorough preprocessing phase that includes the standardization of sensor values to ensure consistency and model efficiency, as well as the identification and removal of missing or anomalous data entries. Sensor data are structured into tabular formats, while log data are parsed into hierarchical dictionaries, ensuring compatibility with analysis workflows. These preprocessing techniques ensure the integrity and usability of the data, laying the groundwork for accurate failure prediction and effective maintenance recommendations.
The initial stage, Start, is representative of the initiation of the application workflow. In the data loading stage, data are loaded from external sources, such as CSV and JSON files containing information about equipment sensors and system logs. The data processing functionality ensures that the required data are loaded and validated before being processed. In the data processing stage, the uploaded data are processed so that they can be used in the next stages of the project.
Preprocessing data ensures that they are in the correct format for risk assessment and recommendation generation, ensuring data transformation and standardization for the machine learning model and checking for discrepancies by removing missing or incorrect values [4]. The risk assessment stage allows for the early identification of potential equipment operating problems. The machine learning model analyzes the processed data to determine the probability of failure or other risks associated with the equipment being monitored. Based on risk assessment and log analysis, recommendations for prescriptive maintenance are generated, displaying specific recommendations for high-risk equipment and analyzing system logs to identify critical errors and warnings [5].
The ability to load sensor data makes it easier to import system logs from JSON files and sensor data from CSV files. The data are subsequently processed and structured into a data frame (for tabular sensor data) or a dictionary (for log-based hierarchical data) to ensure compatibility with further analysis. The risk assessment request entails training a machine learning model to predict potential failures based on sensor data [6]. The trained model assesses risk levels by analyzing historical trends and anomalies, supporting prescriptive maintenance strategies.
The system generates automated recommendations derived from the risk predictions. Additionally, it performs log analysis to refine and augment these recommendations, ensuring a data-driven decision-making approach. The log analysis functionality systematically examines system logs to identify errors and warnings. Based on the severity of detected issues, appropriate recommendations are formulated to mitigate potential system failures or inefficiencies. By integrating recent data, the model enhances its prescriptive accuracy, ensuring adaptability to evolving operational conditions.
In Table 1, presented below, the essential flows of each possible use case are explained; the technical implementation details are also provided. The provided table outlines various functionalities relevant to a data-driven system that integrates sensor data, machine learning and database management for risk assessment and recommendation generation.

Table 1.
The data flows related to the designed activities.
3. Results
To ensure a clear understanding of the operation of each module in the prescriptive maintenance system, the project uses both flowcharts and pseudocode, both of which are illustrated and detailed below. These design tools provide an overview of the logic and structure of each function, facilitating the development, testing and subsequent maintenance of the system.
Flowcharts are used to visualize the main steps of each function, from the beginning of the process to its completion, highlighting the essential decisions and actions. Each main function in the project, such as sensor data loading, risk assessment, recommendation generation and database management, is presented in the form of an algorithm, implementing each iteration and each decision point. The flowcharts thus allow for intuitive navigation through the essential functionalities of the system and highlight optimal workflows.
In addition to the flowcharts, the pseudocode presented in the following is used to describe in detail the internal logic of each function. Pseudocode provides a textual representation of programming logic, using simple terms and easy-to-understand structures that abstract away from the syntax specific to a particular programming language [7]. Through the combined use of flowcharts and pseudocode, the project benefits from detailed technical documentation that makes it easy to understand and implement each module.
3.1. Data Flow Processing
A prescriptive maintenance model extends beyond predictive maintenance by not only forecasting failures but also providing actionable recommendations to mitigate risks [8]. The data flow within such a model follows a structured pipeline involving data acquisition, preprocessing, model training, inference, generating recommendations and executing decisions. The preprocessed data are used to train a prescriptive maintenance model that estimates the probability of failure. After deployment, the trained model continuously processes incoming real-time sensor data to predict failure risks and to detect anomalies by identifying deviations from normal operating conditions. Unlike predictive maintenance, which merely anticipates failures, prescriptive maintenance proactively recommends optimal corrective measures by leveraging predefined expert rules, reinforcement learning algorithms that refine intervention strategies based on past data and causal inference techniques to pinpoint failure root causes and suggest precise solutions [9].
3.1.1. Risk Assessment Process Flow
The training function builds a model based on historical sensor data and the prediction function uses this trained model to evaluate the failure risk of new sensor readings. This architecture enables real-time risk assessment, providing actionable insights to optimize maintenance scheduling and prevent equipment failures. Table 2 presents both the algorithmic iterations specific to the described functionality as well as the pseudocode necessary for the actual implementation.
Table 2.
The flow of the risk assessment process.
The given pseudocode defines a machine learning-based maintenance prediction system with two core functions: one for training a prescriptive model and another for generating failure risk predictions. Raw sensor data undergo standardization, a process that scales numerical features to ensure uniformity, thereby improving model stability and training efficiency. A machine learning model should be instantiated. This could be a supervised learning algorithm such as a decision tree, Random Forest, Gradient Boosting Machine or a deep learning model like Long Short-Term Memory used for time-series forecasting [10]. The preprocessed sensor data are fed into the model for training. The model learns patterns in the data to establish relationships between sensor readings and failure occurrences. Once training is complete, the function outputs the trained machine learning model, which can later be used for predicting potential failures [11].
3.1.2. The Flow of Obtaining Recommendations
The pseudocode presented in Table 3 defines a prescriptive maintenance system, which integrates sensor-based risk prediction and log-based error analysis to generate actionable maintenance recommendations. Each mentioned function contributes to the decision-making process by leveraging prescriptive analytics, severity-based log analysis and outlines the essential recommendations.
Table 3.
Flow related to obtaining referrals.
If the risk score exceeds a predefined threshold, the system identifies the component as at risk of failure [6]. The first functionality outputs a comprehensive list of maintenance recommendations based on both sensor risk scores and log severity levels. The second functionality analyzes system logs to identify errors or warnings that indicate potential issues. The system generates recommendations, including immediate corrective actions.
The algorithm outputs a list of maintenance alerts derived from log analysis. This pseudocode represents a hybrid approach to prescriptive maintenance, integrating machine learning-based failure prediction with log analysis for real-time system monitoring [12]. The system enhances operational efficiency, reduces downtime and optimizes maintenance scheduling by providing both data-driven and rule-based recommendations.
The given mathematical formula describes the decision-making process in a prescriptive maintenance model, which leverages sensor data and machine learning to assess failure risks and generate maintenance recommendations.
The notation
represents a set of sensor readings, where each rx represents an individual sensor measurement, and x corresponds to the total number of sensor readings. These readings may include various parameters collected from industrial equipment. A maintenance action is triggered if the risk score exceeds a predefined threshold:
where φ is the risk threshold, a predefined, specific value based on the monitored parameters, f(rx, λ) represents the estimated failure risk score for sensor readings rx, and λ represents the learned parameters of the machine learning model. If the function f(rx, λ) exceeds the φ value, the sensor readings indicate a possible failure or dysfunction, generating a maintenance recommendation.
R = {r1, r2, r3, …, rx}
f(rx, λ) > φ
In the context of the prescriptive maintenance system described in the article, the determination of risk thresholds primarily follows a data-driven methodology grounded in statistical analysis, enhanced by machine learning techniques. Specifically, risk scores are computed using models like the Random Forest Classifier, trained on longitudinal sensor and log data. The risk threshold is then defined as a decision boundary—established through model performance metrics such as precision–recall trade-offs—that distinguishes normal operating conditions from potential failure states.
The threshold is derived through rigorous model evaluation and tuning, ensuring that the model’s predictions achieve a balance between false positives and missed detections, reflecting empirical validation based on historical equipment behavior and failure data. The hierarchical classification mechanism, which integrates predefined thresholds and severity levels, reflects industry-specific knowledge about acceptable operational margins and failure tolerances.
3.1.3. The Flow Corresponding to the Analysis of Computer Logs
The pseudocode presented in Table 4 represents a generalized log data analysis framework that systematically processes log entries by categorizing and managing them accordingly.
Table 4.
The flow corresponding to the analysis of computer logs.
The primary goal of this function is to process and analyze log data by categorizing each log entry and generating an appropriate message. This structured approach allows for efficient log management, error detection and system monitoring. Each entry contains relevant information such as timestamps, event descriptions or status codes. By categorizing logs, the function enables the prioritization of critical events while filtering less significant messages. The analysis function returns a list that contains categorized and processed log messages. The proposed solution system ensures efficient log management, adaptive monitoring and insightful decision-making [12]. This approach is scalable and suitable for real-time logging systems, prescriptive maintenance and security monitoring applications.
3.2. Data Access Logic
Data access logic refers to how application components communicate with the data storage infrastructure to retrieve, modify, add or delete information, respecting the principles of security, integrity and consistency. Modularized, data access logic is located between the infrastructure layer (database or data source) and the functional logic layer of the application, facilitating a clear separation of responsibilities and ensuring secure and efficient interaction between components [13].
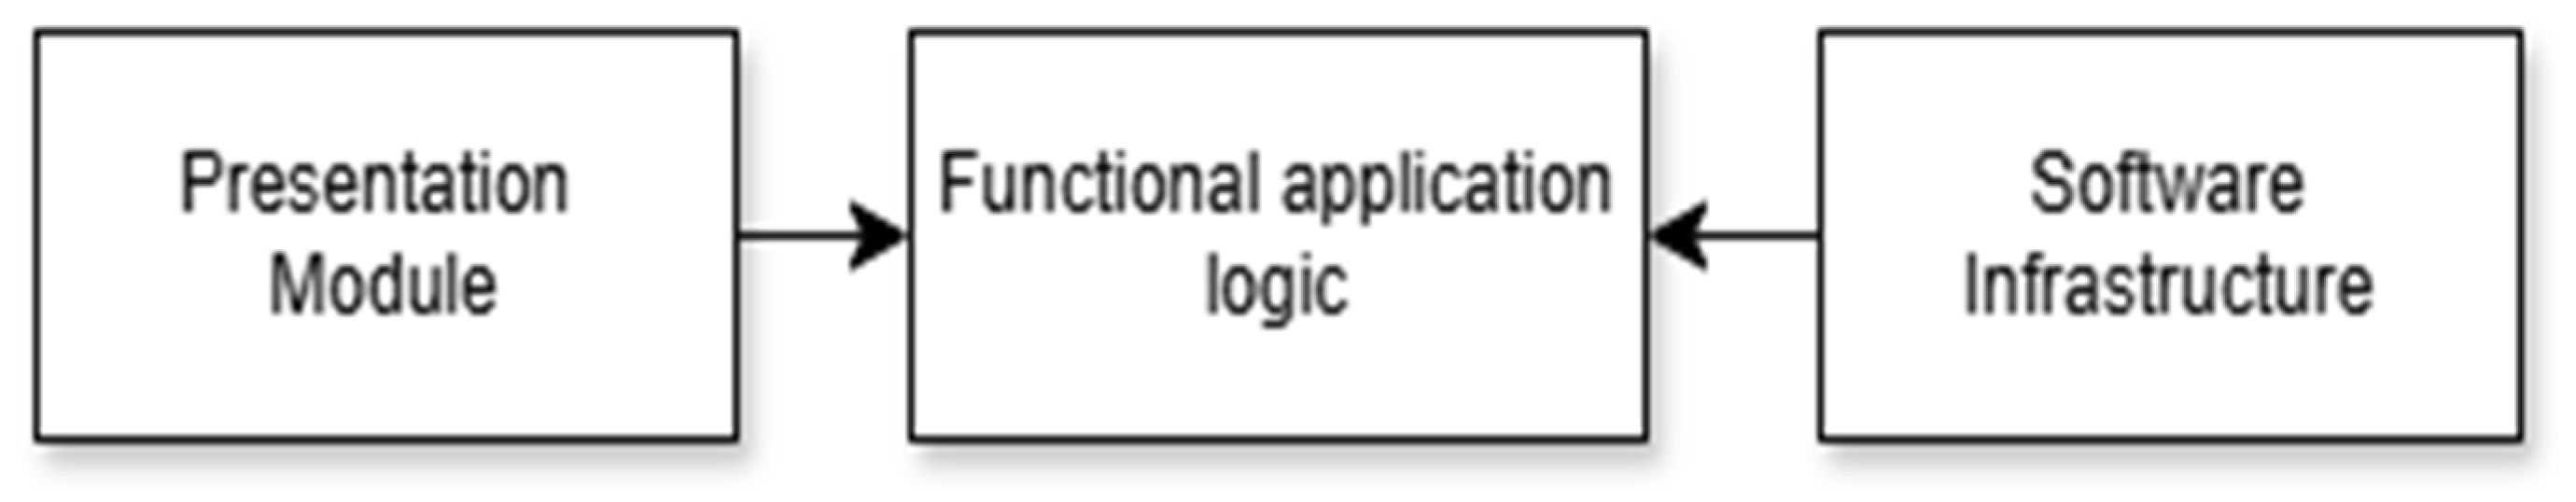
Every interaction with the database—such as loading sensor data, saving risk assessment results or storing generated recommendations—is handled by a dedicated data access layer. This layer abstracts the complexity of CRUD (Create, Read, Update, Delete) operations and protects data integrity, allowing application logic to focus on essential processes, such as data analysis [13] and generating maintenance recommendations. The data access logic, including how the three main modules, the presentation, functional application logic and infrastructure, respectively, communicate, is presented in Figure 2.
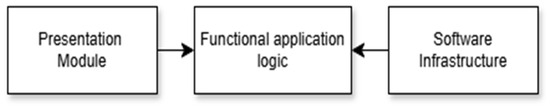
Figure 2.
Modularity of data access logic.
Each of these modules plays a distinct role within the prescriptive maintenance project and is designed to perform specific functions while maintaining a clear separation of responsibilities. The presentation module is responsible for sending user actions to the functional logic layer and intuitively displaying the results. The presentation module represents the interface through which users interact with the system. The graphical interface will facilitate users’ access to the recommendations generated by the system to support specific maintenance decisions [14].
The functional application logic is the module that manages the basic processes of the application and implements the business rules [15]. This is the core of the prescriptive maintenance system and includes all the essential functions for data processing and performing prescriptive analysis [16]. Using a machine learning model, this layer computes risk scores for equipment based on sensor data and maintenance history. Based on the risk score and log analysis, the functionality module generates customized recommendations for equipment maintenance, either in the form of preventive actions or in the form of warnings for possible impending failures. The module monitors logs and identifies critical errors or warnings. This allows the detection and reporting of emerging problems that could affect the operation of the system or the monitored equipment.
The infrastructure module manages the data and ensures its persistence. System logs, which include error messages, warnings and important information about the status of sensors and equipment, are stored and accessible for analysis and diagnostics. System-generated risk assessments and maintenance recommendations are stored in the database, ensuring a permanent track of equipment status and recommended actions.
3.3. Sequence Diagram Related to the Prescriptive Model
The diagram shown in Figure 3 illustrates the sequential flow of a maintenance project, detailing the interactions and information transfer between various modules. At the center of this flow is the main software application, which serves as the hub for communication between the user and the other components. The process begins with the user, who can request data from the sensors. This request is transmitted to the application, which coordinates the next steps based on the user’s requirements.
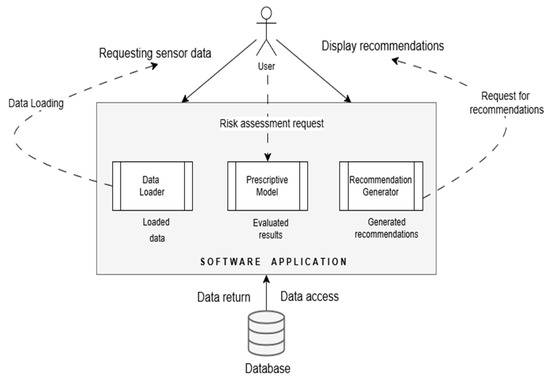
Figure 3.
Sequence diagram corresponding to the prescriptive maintenance system.
To obtain the required data, the application interacts with the “Data Loader” module, which loads the relevant data from the database and transmits them to the application as “Loaded Data”. The database returns the requested data to the “Data Loader” module for further use in the evaluation process.
After acquiring the data, the application generates a “Risk Assessment Request” and sends it to the “Prescriptive Model”, which has the role of analyzing and assessing the associated risks. The results of this assessment are then sent back to the application in the form of “Assessment Results”. Based on these results, the application can ask the “Recommendation Generator” to create specific maintenance recommendations.
The recommendation generator, based on the assessments received, generates concrete suggestions, which are then returned to the application in the form of “Generated Recommendations”. Finally, the application displays these recommendations to the user, thus completing the information cycle.
The diagram outlines a well-defined sequence in which each module contributes to the collection, assessment and recommendation process, ensuring efficient data and risk management within the maintenance project [17].
3.4. Logic Diagram Related to the Designed Functionality
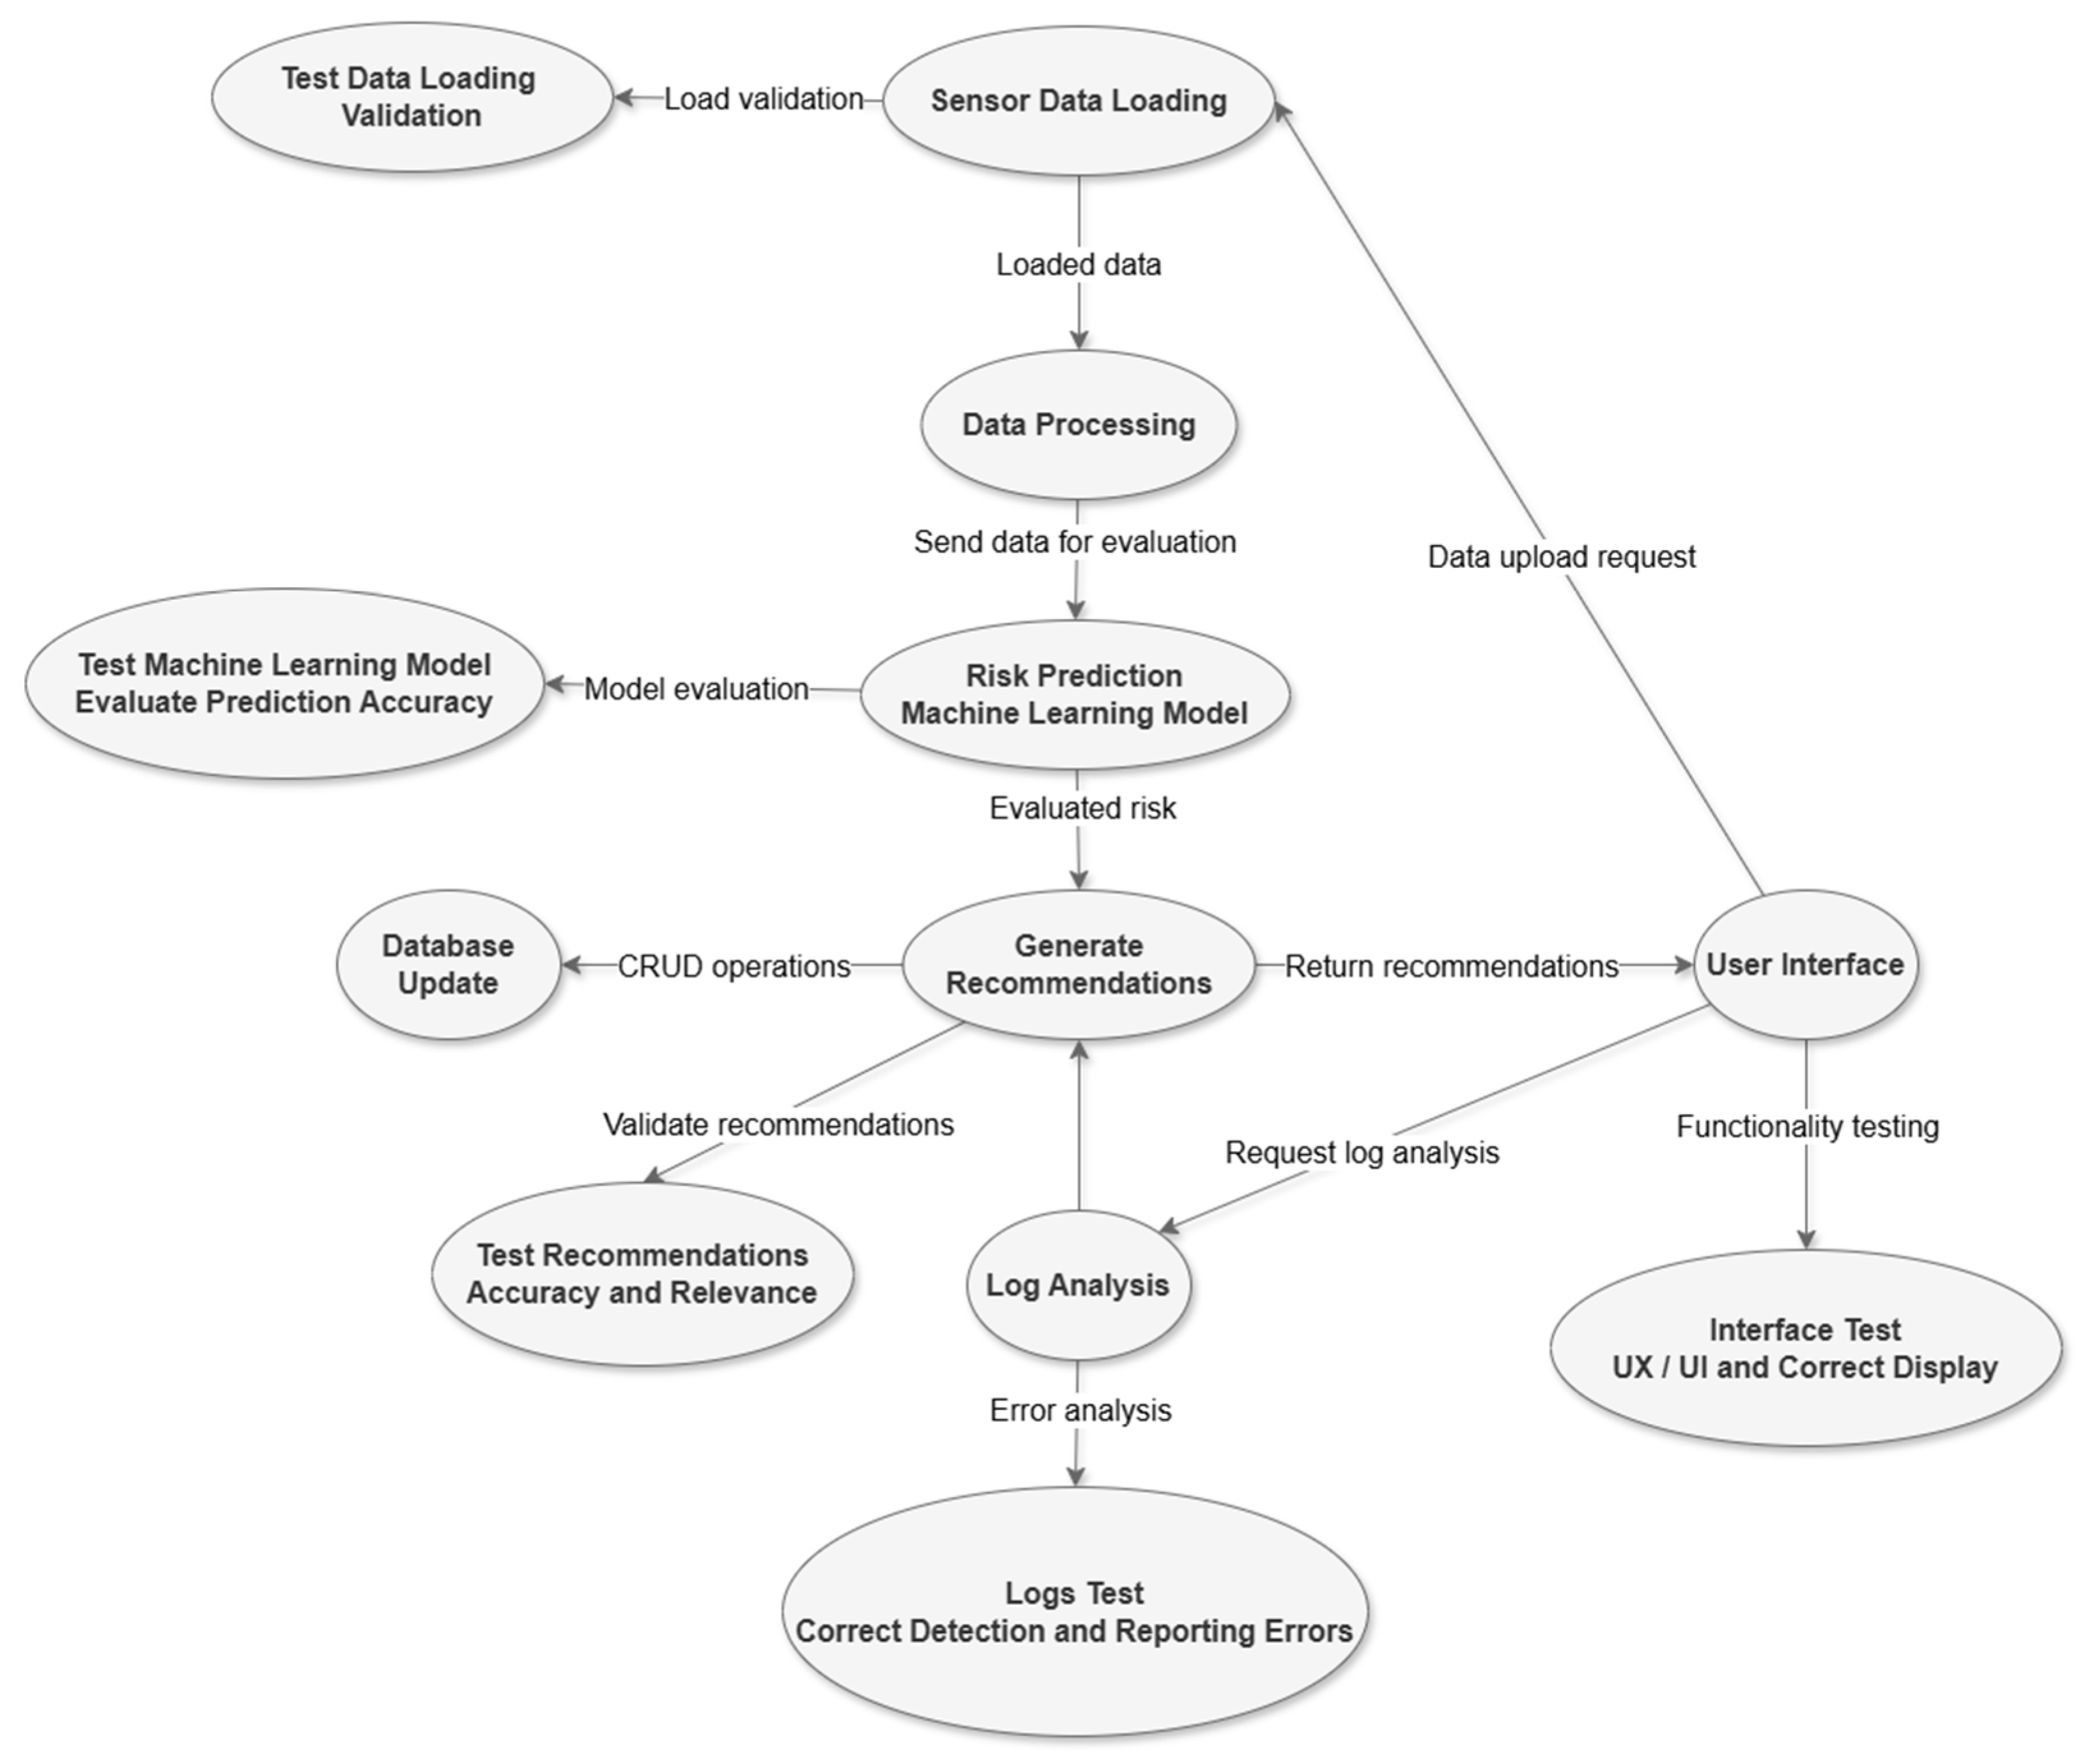
The logic diagram of the maintenance system describes a well-structured flow that integrates several interconnected stages, each having a distinct role in the risk assessment and management process [18]. The first flow is initiated by the “Input Data” and contains the data collected from sensors or historical logs. These raw data are loaded by the “Data Loader” module, which checks the integrity and validity of the information to prevent errors or anomalies that could affect further processing.
The system applies analytical methods to identify vulnerable areas and prioritize issues that require immediate attention [19]. Based on this analysis, the flow continues to the “Recommendations” module, which uses risk information to generate personalized recommendations. These recommendations are designed to reduce identified risks and to improve system performance. The generated recommendations are stored and updated in a centralized “Database”, allowing quick access to historical and updated information. This database plays a key role in the ongoing management of equipment data, providing support for decision-making and future requests [20].
The user interface connects all these components, giving the user the ability to query the system, view the results and request new risk assessments. Through this interface, the results of the processing, including risk reports, recommendations and updated logs, are presented in an accessible and clear way. This interface facilitates the integration of system-generated information into user workflows, ensuring effective risk management and continuous improvement of maintenance processes [21]. Overall, the diagram, presented in Figure 4, describes a robust system, oriented toward quality assurance at each stage, through testing and validation, to provide the end user with relevant information for the actions to be taken.

Figure 4.
The functionality of the prescriptive maintenance system.
3.5. Prescriptive Maintenance Database Design
The database functionality focuses on monitoring equipment and facilitating proactive maintenance through sensors [22]. The connection between tables ensures a well-organized relational structure, which allows the extraction of relevant information for maintenance activities. Each table contributes to an aspect of the maintenance process such as continuous monitoring, analysis, prevention, history and traceability. The proposed database is composed of several interconnected tables, each with a specific role in storing and managing data related to equipment, sensors, alerts and recommendations.
The key relationships and constraints provide a solid structure for organizing maintenance data and monitoring sensors. The entity–relationship (ER) model highlights the main entities, their attributes and the relationships between them [23]. The conceptual entity–relationship schema is briefly presented below:
(1) Equipment → (many) Sensors
(1) Sensor → (many) Log records
(1) Sensor → (many) Recommendations
(1) Sensor → (many) Alerts
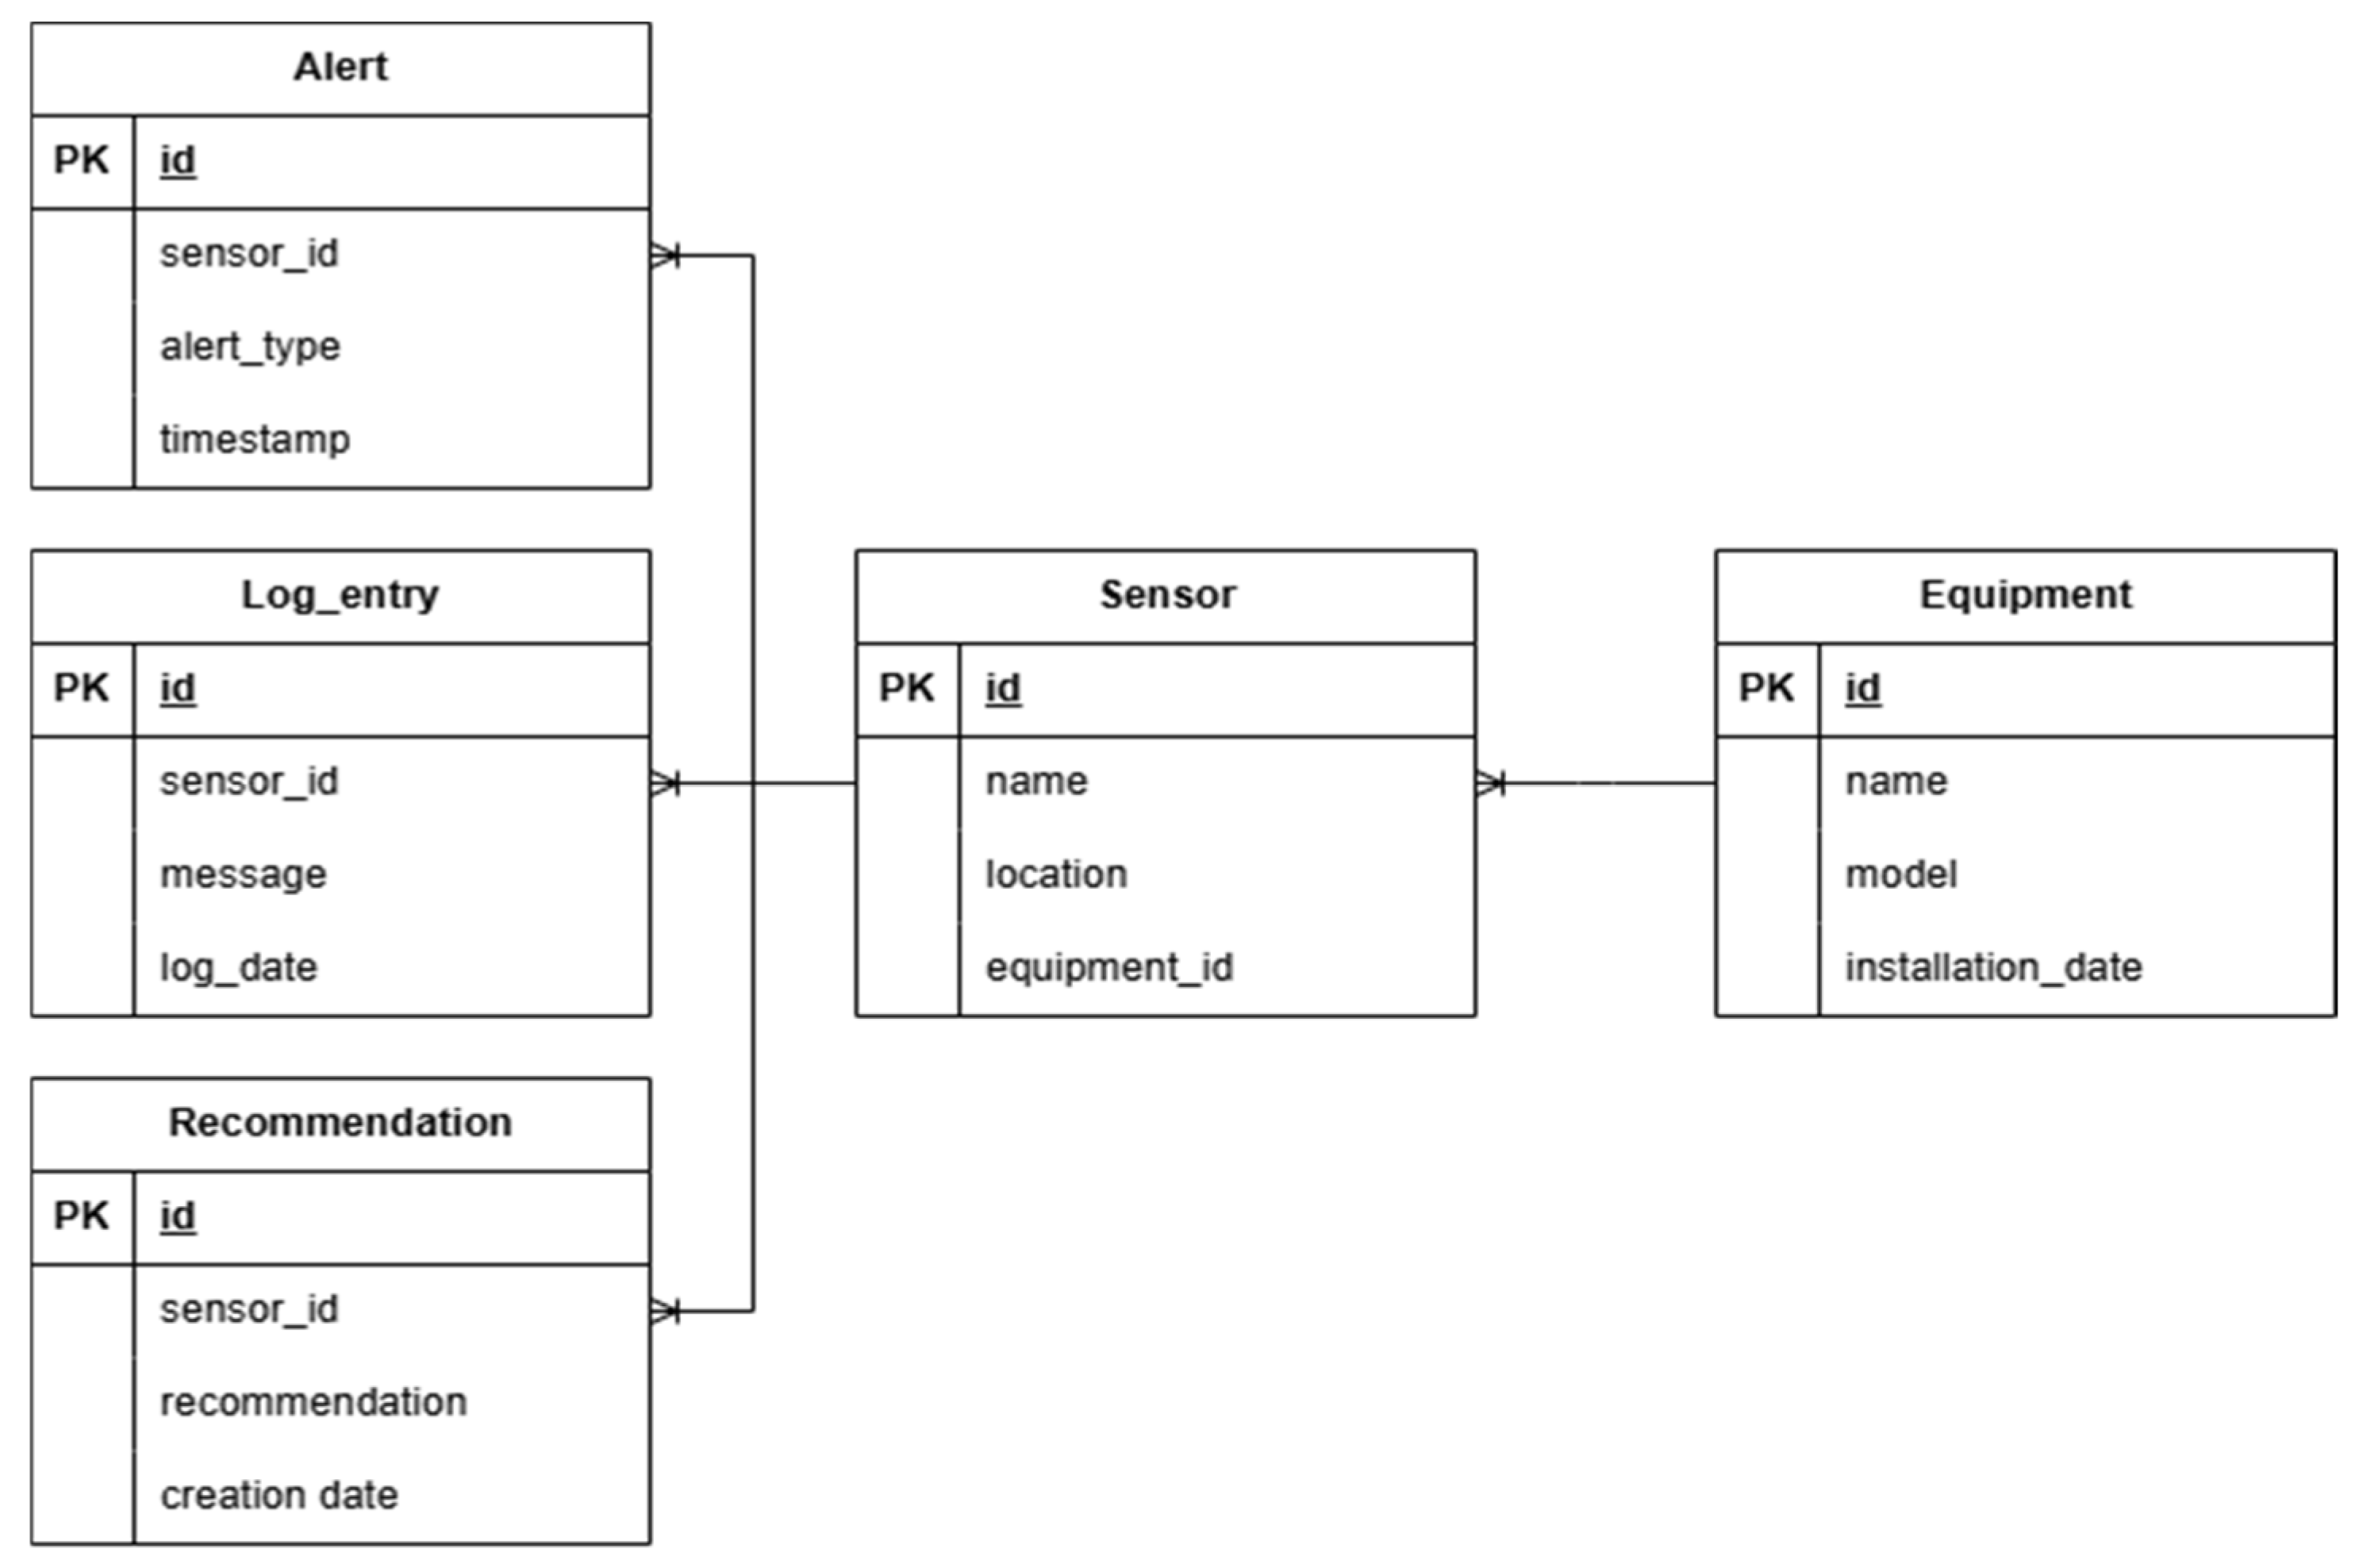
The conceptual architecture shown in Figure 5 reflects the relational structure of the database, highlighting the links between equipment, sensors, recommendations, alerts and log records. Each sensor monitors a specific piece of equipment, generates logs, triggers alerts and produces recommendations based on machine learning models or rule-based analytics.
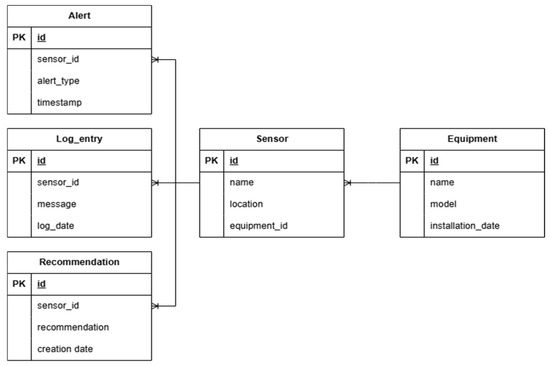
Figure 5.
Conceptual architecture related to SQL database.
The schema consists of five tables: Equipment (id, name, model, installation_date—Primary Key: id) and Sensor (id, name, location, equipment_id—Primary Key: id, Foreign Key: equipment_id), ensuring each sensor is linked to a specific piece of equipment for efficient monitoring. The Log Entry (id, sensor_id, message, log_date—Primary Key: id, Foreign Key: sensor_id), Alert (id, sensor_id, alert_type, timestamp—Primary Key: id, Foreign Key: sensor_id) and Recommendation (id, sensor_id, recommendation, creation_date—Primary Key: id, Foreign Key: sensor_id) tables ensure that each sensor generates logs, triggers alerts and receives maintenance recommendations, enabling real-time fault detection.
This database thus provides an efficient and scalable structure, which facilitates equipment management [23] and supports maintenance decisions based on historical and real-time data. Continuous monitoring is ensured by the fact that sensors report data and events via the log_entry table. Through recommendations and alerts, potential failures can be identified and preventive measures can be taken. Keeping a history of sensor-specific activities and problems encountered is achieved through the log_entry and alert tables, which are useful for long-term performance analysis.
4. Machine Learning—Related Methods
In the monitoring and maintenance project, machine learning techniques are essential to predict equipment failures, using sensor data [24]. Machine learning algorithms allow the model to identify patterns and anticipate events based on historical information, providing a proactive approach to prescriptive maintenance [25]. After preprocessing the data, relevant features are selected to train the model. In this project, information such as sensor values (value) and status (status), transformed into a binary label (1 for error and 0 for normal operation), are used. The data are divided into training and testing sets, ensuring that the model will learn on part of the data and be evaluated on new data, which were not used in the training process [26].
The Random Forest Classifier is a machine learning algorithm used for classification and is ideal for fault prediction problems due to its robustness and accuracy [27]. This algorithm is a supervised learning model based on creating a large number of decision trees, each of which is built on a different subset of the data [28].
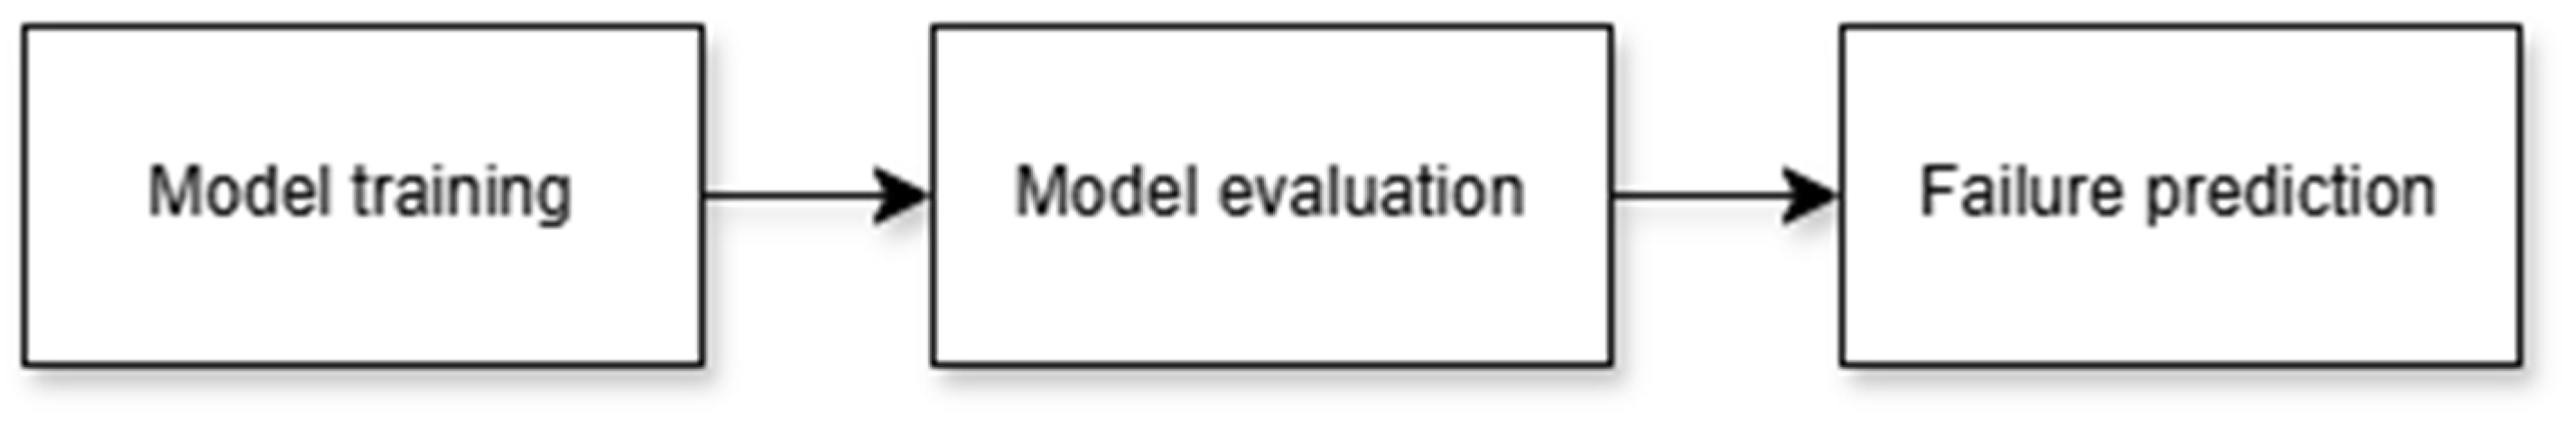
Each tree makes a prediction and the final result is determined by the “vote” of the majority of the trees. Random Forest is efficient at handling datasets with many features and is resistant to overfitting due to the aggregation of results from multiple trees, thus reducing the total variance of the predictions [29]. At each stage, the algorithm learns from the errors generated and adjusts the predictions to improve accuracy [30]. The workflow of the machine learning model is illustrated in Figure 6. In the training stage, data are fed to either the Random Forest Classifier algorithm or a Gradient Boosting model (XGBoost or LightGBM) [31] for training. Each algorithm learns the patterns associated with sensor values and the occurrence of faults. During training, the model adjusts its internal parameters to minimize error and maximize accuracy on the training set [32].
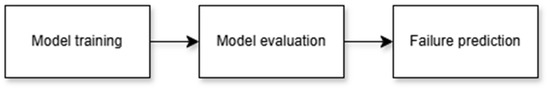
Figure 6.
Machine learning model flow.
From a model evaluation perspective, after training, the model is evaluated on a test set, which contains new data, unused during training, to verify its accuracy and generalization ability [33]. Performance metrics such as accuracy, precision, recall and F1-score are calculated to determine how well the model predicts faults [34]. These metrics are essential for parameter tuning and final model selection.
The trained model is used to predict equipment failures based on current data collected from sensors. The model processes new data in real time or in batch mode and returns a probability or class (failure or no failure) for each input. Based on the model’s predictions, the application can trigger alerts and recommend prescriptive maintenance measures. Random Forest Classifier algorithms are a machine learning method that uses the concept of “ensemble learning” to improve classification performance [35]. They work by creating an ensemble of decision trees, each built on different subsets of the training data, to reduce variability and increase the accuracy of predictions [36].
For each decision tree, the algorithm selects a random subset of the features (attributes) available at each node, rather than using all the features. This random selection reduces the correlation between trees, which contributes to the overall performance of the ensemble. Each decision tree generates a prediction for the test data [36]. This step is performed independently for each tree. To produce the final prediction, the ensemble combines all the individual predictions using the majority method for classification. Thus, the class that is most frequently predicted by the trees is considered the final class [37].
The implementation of this algorithm at the level of the specific prescriptive maintenance application involves loading the dataset and inspecting its structure [38]. The target variable is considered the status column and the rest of the numerical columns (sensor_id, value, z_score) were considered features. The second step consists of separating the data into two subsets: the training set (70% of the data) used to build the model and the test set (30% of the data) used to evaluate the model’s performance, respectively [39]. Dividing the set allows for a realistic evaluation of the model, thus preventing overfitting [40].
Each decision tree in the forest of trees specific to the Random Forest Classifier algorithm is trained on a random subset of data, and at each node in the tree, a random subset of features is used to decide the division. Each tree independently predicts the class for each example in the test set and the final decision is made by majority vote, thereby facilitating the generation of predictions [41].
The dataset was analyzed to handle any non-numeric data. This process included converting date/time values to numeric values [42]. The features (sensor readings or other variables) were extracted and the target variable, status, representing the classification label, was prepared. Each tree in the forest independently learned a set of decision rules for classifying the data [43]. These rules divide the dataset into smaller subsets based on conditions such as:
value ≤ threshold
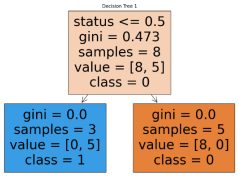
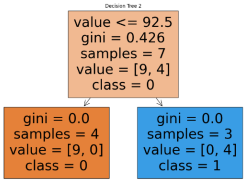
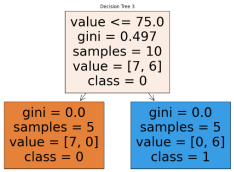
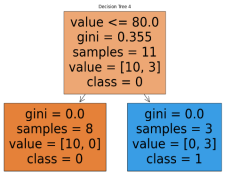
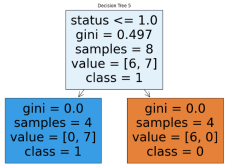
The decision trees were visualized and saved as graphical representations. These visualizations highlight the data partitions at each node and provide insights into how the trees in the forest make decisions [44]. For example, decision nodes display metrics such as Gini impurity, the number of samples and the majority class at that node [45]. During prediction, each decision tree in the forest “votes” for the class it predicts. Random Forest aggregates these votes and the class with the most votes is returned as the final prediction. Sequences of training each decision tree in the forest of trees specific to the prescriptive maintenance project are shown, iteratively, in Table 5.
Table 5.
Evolution of decision trees in the forest of trees.
The visualized decision trees demonstrate a hierarchical structure where each root node performs an initial binary split based on a specific feature threshold (status, value), aiming to reduce Gini impurity, a metric quantifying the class distribution homogeneity within nodes [46]. As the trees progress, terminal nodes (leaf nodes) exhibit complete purity when containing samples exclusively from a single class, indicating optimal separability in classification. The differences in root feature selection and threshold values across decision trees illustrate feature randomness and bootstrap aggregation—key mechanisms of the Random Forest algorithm [47].
This controlled variability enhances the generalization capability of the ensemble model by reducing the risk of overfitting to specific patterns found in individual trees while capturing diverse decision boundaries in high-dimensional feature space [48]. The Gini coefficient values assigned to each node reflect the degree of impurity reduction achieved by splitting criteria, with lower values indicating higher discriminative power in partitioning data points into distinct class labels [45]. The iterative process of minimizing Gini impurity through feature selection and threshold tuning facilitates optimized decision boundary construction, ensuring maximal information gain at each split.
Each node in the decision trees is annotated with the number of samples processed at that stage, reflecting the proportional distribution of dataset instances across different branches [49]. For each tree in the forest, the Gini impurity starts at a higher value at the root node, where the class distribution is more diverse. After applying the splitting rules, the terminal nodes become completely pure, having a Gini impurity of 0.0, meaning that all instances at a terminal node belong to the same class. This transition reflects the efficiency of the algorithm in separating classes.
The observed imbalances in sample allocation highlight the model’s ability to favor dominant class representations, potentially influencing bias–variance trade-offs in classification performance [50]. As the decision trees evolve, the depicted transitions from broader feature-based splits to granular, class-specific terminal nodes demonstrate the sequential refinement of prescriptive rules. This progressive feature-space segmentation results in highly specialized decision rules, which, when aggregated in a Random Forest ensemble, contribute to improved classification robustness, noise resilience and overall model stability [51].
5. Discussion
Data validation models are applied to ensure the accuracy and consistency of the data used in the machine learning process. By applying these validation techniques, the proposed project can reduce the risk of errors, improve the quality of predictions and provide a solid basis for decision-making. These steps contribute to the confidence in the prescriptive maintenance system, allowing the maintenance team to anticipate failures with a high degree of accuracy and act effectively [52].
The machine learning model for fault prediction in the context of this prescriptive maintenance project presents certain inherent limitations, which influence the accuracy and efficiency of the predictions made. These limitations can come from the complexity of the data, the algorithms used, the preprocessing techniques used or even the fault prediction problem itself. Therefore, the main limitations of the model in the context of the project are the following: the quality and completeness of the existing data at the input file level, the limitations of the machine learning algorithms, the generalization problems applied to new data and the limitations in evaluating the performance of the prescriptive model, respectively.
The data may also contain errors or outliers that do not accurately represent the state of the equipment. Such values can affect the performance of the model and their identification and elimination may not always be successful. In many cases, failures are rare compared to normal states. This imbalance between the “failure” and “no failure” classes can lead to a model that favors “no failure” predictions, with failure omissions being critical for a prescriptive maintenance system [42].
Generalization is a critical issue and the model may not be able to perform well on new data or under changed operating conditions. The data in the training set may not cover all types of variations or extreme conditions encountered in operations. For example, seasonality, changes in equipment configuration or environmental changes (temperature, humidity) may affect sensor measurements and therefore the accuracy of the model’s predictions [53].
In the case of inserting new equipment, the model will require additional training to be effective, which may not be immediately feasible in real-time maintenance situations. The model is sensitive to the features selected for training (such as sensor values and status). If these features do not capture the relevant information about the equipment’s condition well enough, the model’s performance will be limited. Identifying additional features or adjusting existing ones may require more resources and analysis. The limitations of the machine learning model are inherent to the complex failure prediction problems and technical constraints. To reduce these limitations, it is important to implement a continuous process of model evaluation and adaptation, collect new data and explore additional modeling techniques, such as neural networks or deep learning, that could better capture the complex variations in the data. This approach could help reduce uncertainty and improve predictions, thus providing a more robust and adaptable prescriptive maintenance solution.
For future developments of the prescriptive maintenance application, more advanced functionalities could be integrated to extend the utility and performance of the system. One of the essential directions is the implementation of deep learning algorithms to improve the accuracy of predictions and to identify complex patterns in sensor and log data, using architectures such as recurrent neural networks or Long Short-Term Memory for time-series analysis [54].
Also, the development of a public application programming interface would enable interoperability with other industrial systems and IoT platforms, strengthening connectivity and automation. On the security side, adding a module for detecting cyber anomalies in computer logs would improve the protection against cyber threats. The proposed prescriptive maintenance system for IT&C equipment introduces several innovative, domain-specific contributions, notably the implementation of a hierarchical log-sensor prioritization mechanism.
This unique approach merges sensor readings and system log data into a unified decision-making framework, enabling precise fault diagnosis and the prioritization of maintenance tasks based on severity and risk assessment. This hierarchy is guided by both predefined thresholds and machine learning predictions, enabling the system to dynamically adapt to the operational state of diverse equipment. The use of structured log dictionaries and standardized sensor data further enhances the system’s robustness and supports scalability across varying infrastructures. To bolster its real-time responsiveness and data processing efficiency, advanced adaptations such as edge computing can be integrated. This would enable decentralized processing directly at the source, significantly reducing latency. Moreover, the application of federated learning could preserve data privacy while enabling the collective training of prescriptive models across distributed IT&C environments, making the system suitable for complex, multi-site deployments.
Unlike reactive approaches that respond post-failure, the proposed system proactively minimizes downtime and operational disruptions by recommending timely interventions. When compared to state-of-the-art machine learning models like Long Short-Term Memory (LSTM) networks, the current system’s use of Random Forest and Gradient Boosting algorithms demonstrates competitive, if not superior, results in classification accuracy, interpretability and computational efficiency. LSTM models, while powerful in temporal data analysis, require extensive computational resources and are more susceptible to overfitting, especially with irregular or sparse IT&C data. The proposed system’s modular architecture also allows for incremental updates and model retraining, ensuring sustained performance without the need for extensive recalibration. These characteristics not only benchmark favorably against industry standards but also position the system as a leading solution in prescriptive maintenance for IT&C infrastructures.
The proposed prescriptive maintenance system addresses several persistent shortcomings in existing methods by implementing a novel integration of structured log analysis and sensor data. Through a hierarchical prioritization model that combines machine learning with expert-defined thresholds, it achieves a fine-grained, context-aware recommendation process. Unlike black-box deep learning solutions, our use of interpretable models ensures transparency and operational trust. Furthermore, the modular, scalable architecture supports real-time analytics and future extensions such as edge computing and federated learning. These innovations position the system not just as a research tool, but as a viable solution for robust, real-world IT&C maintenance.
6. Conclusions
The proposed system represents an integrated and efficient system for the monitoring and prescriptive maintenance of equipment, using advanced data processing and machine learning methods. The implementation of data loading, storage, prescriptive analysis and recommendation generation functions optimizes operating times, providing a scalable and adaptable solution for modern maintenance needs. The prescriptive maintenance model is trained on structured datasets, using scaled sensor values and status labels.
An important component is the database integration for storing and updating information about equipment, sensors and recommendations. The application manages both physical sensors and software logs, using correlated analytics to detect deviations and generate appropriate recommendations. Recommendations cover a wide spectrum of severity, from passive monitoring to urgent actions, such as stopping equipment or requesting technical intervention. The prioritization of alert recommendations within the application is based on a set of well-defined criteria that integrates both physical sensor data analysis and computer logs. This is achieved through a hierarchical classification mechanism, combining predefined thresholds, prescriptive assessments and severity levels. The prescriptive model calculates the probability of failure based on sensor values and high risks receive maximum priority in generating recommendations.
This integration brings robustness, scalability and efficiency, ensuring both high performance and adaptability to the varying needs of users. The proposed system processes and analyzes large data volumes. It combines threshold-based logic with machine learning to enhance adaptability. Current research in maintenance strategy optimization has increasingly shifted from traditional reactive and preventive methods to data-driven approaches that integrate predictive and prescriptive analytics, particularly leveraging machine learning and IoT technologies.
Compared to prior articles that often focus on predictive maintenance alone, the present submission advances the field by implementing a comprehensive prescriptive maintenance system tailored for IT&C equipment. Its integration of sensor data and system logs through a hierarchical classification framework enables real-time, severity-based maintenance recommendations—an innovation that enhances diagnostic precision and operational responsiveness. Unlike deep learning models commonly used in other studies, which can be computationally intensive and less interpretable, this system employs Random Forest and Gradient Boosting algorithms, offering a balanced trade-off between accuracy, interpretability and computational efficiency.
Furthermore, its modular architecture promotes scalability and ease of integration. However, the system’s effectiveness is contingent upon the quality and completeness of the input data and it remains susceptible to challenges such as data imbalance and limited generalization to novel conditions. These limitations, while acknowledged, suggest that further enhancement, potentially through the incorporation of advanced neural models or federated learning, could improve robustness and adaptability in broader industrial contexts.
While the proposed prescriptive maintenance system demonstrates strong adaptability and performance within centralized IT&C environments, the issue of data decentralization remains a critical factor for real-world scalability, especially across distributed infrastructures. In scenarios where data cannot be aggregated due to privacy, security or bandwidth limitations, federated learning offers a compelling solution. Integrating concepts from recent advances, such as the Dynamic Barycenter Bridging Network, which aligns feature distributions across disparate machine groups, could enhance the proposed system’s ability to generalize across sites without direct data sharing. By adapting these methods, the current architecture could evolve toward a federated prescriptive maintenance framework, enabling collaborative model training across multiple IT&C installations while preserving local data sovereignty [55]. This would not only increase robustness in heterogeneous environments but also position the system as a forward-compatible solution in decentralized industrial ecosystems.
Author Contributions
Conceptualization, methodology, formal analysis, writing—original draft preparation, review and editing were realized by A.-D.P.-S., N.S.U. and A.P. All authors have read and agreed to the published version of the manuscript.
Funding
This research received no external funding.
Data Availability Statement
The original contributions presented in this study are included in the article. Further inquiries can be directed to the corresponding author.
Conflicts of Interest
The authors declare no conflicts of interest.
References
- Ansari, F.; Glawar, R.; Nemeth, T. PriMa: A prescriptive maintenance model for cyber-physical production systems. Int. J. Comput. Integr. Manuf. 2019, 32, 482–503. [Google Scholar] [CrossRef]
- Zeng, L.; Xiao, Y.; Chen, H.; Sun, B.; Han, W. Computer operating system logging and security issues: A survey. Secur. Commun. Netw. 2016, 9, 4804–4821. [Google Scholar] [CrossRef]
- Pecchia, A.; Cinque, M.; Carrozza, G.; Cotroneo, D. Industry Practices and Event Logging: Assessment of a Critical Software Development Process. In Proceedings of the 2015 IEEE/ACM 37th IEEE International Conference on Software Engineering (ICSE), Florence, Italy, 16–24 May 2015; pp. 169–178. [Google Scholar]
- Famili, A.; Shen, W.-M.; Weber, R.; Simoudis, E. Data preprocessing and intelligent data analysis. Intell. Data Anal. 1997, 1, 3–23. [Google Scholar] [CrossRef]
- Diameh, J.T.; Oluwatobi, B.T.; Daniels, C.; Sunday, O.E.; Nelson, C.A.; Quaye, M. Integrating AI-driven predictive analytics in project risk management to optimize decision-making and performance efficiency. Int. J. Eng. Technol. Res. Manag. 2025, 9, 373–389. [Google Scholar]
- National Research Council. Science and Decisions: Advancing Risk Assessment; The National Academies Press: Washington, DC, USA, 2009. [Google Scholar]
- Uddin, S.; Khan, A.; Hossain, E.; Moni, M.A. Comparing different supervised machine learning algorithms for disease prediction. BMC Med. Inform. Decis. Mak. 2019, 19, 281. [Google Scholar] [CrossRef]
- Marques, H.; Giacotto, A. Prescriptive Maintenance: Building Alternative Plans for Smart Operations. In Proceedings of the 10th Aerospace Technology Congress, Stockholm, Sweden, 8–9 October 2019; pp. 231–236. [Google Scholar]
- Jeon, C.-H.; Shim, C.-S.; Lee, Y.-H.; Schooling, J. Prescriptive maintenance of prestressed concrete bridges considering digital twin and key performance indicator. Eng. Struct. 2024, 302, 117383. [Google Scholar] [CrossRef]
- Caterini, A.L.; Chang, D.E. Recurrent neural networks. In Deep Neural Networks in a Mathematical Framework; Springer Nature: Dordrecht, The Netherlands, 2018; pp. 59–79. [Google Scholar]
- Zhao, Y.; Yang, J.; Wang, W.; Yang, H.; Niyato, D. TranDRL: A Transformer-Driven Deep Reinforcement Learning Enabled Prescriptive Maintenance Framework. IEEE Internet Things J. 2024, 11, 35432–35444. [Google Scholar] [CrossRef]
- Mahesh, B. Machine learning algorithms—A review. Int. J. Sci. Res. (IJSR) 2020, 9, 381–386. [Google Scholar] [CrossRef]
- Miller, G.; Spiegel, E. Guidelines for Research Data Integrity (GRDI). Sci. Data 2025, 12, 95. [Google Scholar] [CrossRef]
- Zonta, T.; da Costa, C.A.; da Rosa Righi, R.; de Lima, M.J.; da Trindade, E.S.; Li, G.P. Predictive maintenance in the Industry 4.0: A systematic literature review. Comput. Ind. Eng. 2020, 150, 106889. [Google Scholar] [CrossRef]
- Zhuang, H.; Lin, Z.; Yang, Y.; Toh, K.-A. An analytic formulation of convolutional neural network learning for pattern recognition. Inf. Sci. 2025, 686, 121317. [Google Scholar] [CrossRef]
- Ungureanu, N.; Ungureanu, M. System of Predictive Maintenance. Sci. Bull. Ser. C Fascicle Mech. Tribol. Mach. Manuf. Technol. 2015, 2015, 90. [Google Scholar]
- Ungureanu, N.; Ungureanu, M.; Cotetiu, A.; Barisic, B.; Grozav, S. Principles of the maintenance management. Sci. Bull. Ser. C Fascicle Mech. Tribol. Mach. Manuf. Technol. 2010, 24, 69–72. [Google Scholar]
- de Almeida, J.K.B.; Lopes, R.S.; Fontana, M.E. Predictive maintenance management of gear systems in the era of computer vision. Int. J. Qual. Reliab. Manag. 2025. ahead-of-print. [Google Scholar] [CrossRef]
- Naser, M.Z.; Alavi, A.H. Error Metrics and Performance Fitness Indicators for Artificial Intelligence and Machine Learning in Engineering and Sciences. Arch. Struct. Constr. 2023, 3, 499–517. [Google Scholar] [CrossRef]
- Harrington, J.L. Relational Database Design and Implementation; Elsevier: Amsterdam, The Netherlands, 2016. [Google Scholar]
- Bousdekis, A.; Magoutas, B.; Apostolou, D.; Mentzas, G. Review, analysis and synthesis of prognostic-based decision support methods for condition based maintenance. J. Intell. Manuf. 2015, 29, 1303–1316. [Google Scholar] [CrossRef]
- Pech, M.; Vrchota, J.; Bednář, J. Predictive Maintenance and Intelligent Sensors in Smart Factory: Review. Sensors 2021, 21, 1470. [Google Scholar] [CrossRef]
- Sumathi, S.; Esakkirajan, S. Fundamentals of Relational Database Management Systems; Springer Nature: Dordrecht, The Netherlands, 2007. [Google Scholar]
- Xiao, H.; Li, Z.; Chen, C.L.P. Formation Control of Leader–Follower Mobile Robots’ Systems Using Model Predictive Control Based on Neural-Dynamic Optimization. IEEE Trans. Ind. Electron. 2016, 63, 5752–5762. [Google Scholar] [CrossRef]
- AlShorman, O.; Irfan, M.; Saad, N.; Zhen, D.; Haider, N.; Glowacz, A.; AlShorman, A. A Review of Artificial Intelligence Methods for Condition Monitoring and Fault Diagnosis of Rolling Element Bearings for Induction Motor. Shock Vib. 2020, 2020, 8843759. [Google Scholar] [CrossRef]
- Ben Chaabene, W.; Flah, M.; Nehdi, M.L. Machine learning prediction of mechanical properties of concrete: Critical review. Constr. Build. Mater. 2020, 260, 119889. [Google Scholar] [CrossRef]
- Afuan, L.; Isnanto, R.R. Enhanced Fall Detection using Optimized Random Forest Classifier on Wearable Sensor Data. J. Appl. Data Sci. 2025, 6, 213–224. [Google Scholar] [CrossRef]
- Li, P.; Wang, Y. A Novel Disc Herniation Prediction Utilizing the Power of Random Forest Base Predictive Models. J. Inst. Eng. Ser. B 2025, 1–18. [Google Scholar] [CrossRef]
- Speiser, J.L.; Miller, M.E.; Tooze, J.; Ip, E. A comparison of random forest variable selection methods for classification prediction modeling. Expert Syst. Appl. 2019, 134, 93–101. [Google Scholar] [CrossRef] [PubMed]
- Jackins, V.; Vimal, S.; Kaliappan, M.; Lee, M.Y. AI-based smart prediction of clinical disease using random forest classifier and Naive Bayes. J. Supercomput. 2021, 77, 5198–5219. [Google Scholar] [CrossRef]
- Ayyadevara, V.K. Gradient boosting machine. In Pro Machine Learning Algorithms: A Hands-On Approach to Implementing Algorithms in Python and R; Apress: Berkeley, CA, USA, 2018; pp. 117–134. [Google Scholar]
- Bentéjac, C.; Csörgő, A.; Martínez-Muñoz, G. A comparative analysis of gradient boosting algorithms. Artif. Intell. Rev. 2021, 54, 1937–1967. [Google Scholar] [CrossRef]
- Calderon-Uribe, U.; Lizarraga-Morales, R.A.; Guryev, I.V. Fault Diagnosis in Induction Motors through Infrared Thermal Images Using Convolutional Neural Network Feature Extraction. Machines 2024, 12, 497. [Google Scholar] [CrossRef]
- Shelke, C.; Mandale, A.; Anjimoon, S.; Asha, V.; Nijhawan, G.; Dhanraj, J.A. Optimized Machine Learning Techniques for Software Fault Prediction. In Natural Language Processing for Software Engineering; Scrivener Publishing: Austin, TX, USA, 2025; pp. 207–219. [Google Scholar]
- Parmar, A.; Katariya, R.; Patel, V. A review on random forest: An ensemble classifier. In Proceedings of the International Conference on Intelligent Data Communication Technologies and Internet of Things (ICICI), Coimbatore, India, 7–8 August 2018; Springer: Cham, Switzerland, 2019; pp. 758–763. [Google Scholar]
- De Ville, B. Decision trees. Wiley Interdiscip. Rev. Comput. Stat. 2013, 5, 448–455. [Google Scholar] [CrossRef]
- Salman, A.M.; Al-Nuaimi, B.T.; Subhi, A.A.; Alkattan, H.; Alfilh, R.H.C. Enhancing Cybersecurity with Machine Learning: A Hybrid Approach for Anomaly Detection and Threat Prediction. Mesop. J. CyberSecur. 2025, 5, 202–215. [Google Scholar] [CrossRef]
- Nielsen, A. Practical Time Series Analysis: Prediction with Statistics and Machine Learning; O’Reilly Media: Sebastopol, CA, USA, 2019. [Google Scholar]
- Bala, A.; Chana, I. Intelligent failure prediction models for scientific workflows. Expert. Syst. Appl. 2015, 42, 980–989. [Google Scholar] [CrossRef]
- Massaro, A. Artificial Intelligence Enabling Denoising in Passive Electronic Filtering Circuits for Industry 5.0 Machines. Machines 2024, 12, 551. [Google Scholar] [CrossRef]
- Rose, S. Machine Learning for Prediction in Electronic Health Data. JAMA Netw. Open 2018, 1, e181404. [Google Scholar] [CrossRef] [PubMed]
- Swartz, M.E.; Krull, I.S. Analytical Method Development and Validation; CRC Press: Boca Raton, FL, USA, 2018. [Google Scholar]
- Wang, H.-K.; Huang, H.-Z.; Li, Y.-F.; Yang, Y.-J. Condition-Based Maintenance with Scheduling Threshold and Maintenance Threshold. IEEE Trans. Reliab. 2015, 65, 513–524. [Google Scholar] [CrossRef]
- Jimenez, L. Reliability and Maintenance for Engineering Systems: Faulttrees, Degradation Modelling and Maintenance Optimization. Ph.D. Thesis, University of Twente, Enschede, The Netherlands, 2025. [Google Scholar]
- Yuan, Y.; Wu, L.; Zhang, X. Gini-impurity index analysis. IEEE Trans. Inf. Forensics Secur. 2021, 16, 3154–3169. [Google Scholar] [CrossRef]
- Muchai, E.; Odongo, L.; Kahiri, J. Comparison of Crisp and Fuzzy Classification Trees Using Chi-Squared ImpurityMeasure on Simulated Data. Eur. Sci. J. ESJ 2018, 14, 351. [Google Scholar] [CrossRef]
- Hu, S.; Yu, K. Learning Robust Rationales for Model Explainability: A Guidance-Based Approach. Proc. AAAI Conf. Artif. Intell. 2024, 38, 18243–18251. [Google Scholar] [CrossRef]
- Mohandoss, D.P.; Shi, Y.; Suo, K. Outlier prediction using random forest classifier. In Proceedings of the 2021 IEEE 11th Annual Computing and Communication Workshop and Conference (CCWC), Las Vegas, NV, USA, 27–30 January 2021; pp. 27–33. [Google Scholar]
- More, R.; Bradbury, J.S. Assessing data augmentation-induced bias in training and testing of machine learning models. arXiv 2025, arXiv:2502.01825. [Google Scholar]
- Ashfaq, M.; Nur, S. IoT Sensor Networks-Orchestrating Connectivity, Efficiency, and Intelligence Across Diverse Domains. Int. J. Innov. Res. Comput. Sci. Technol. 2024, 12, 154–161. [Google Scholar] [CrossRef]
- Mastromichalakis, O.M.; Dervakos, E.; Chortaras, A.; Stamou, G. Rule-Based Explanations of Machine Learning Classifiers Using Knowledge Graphs. Proc. AAAI Symp. Ser. 2024, 3, 193–202. [Google Scholar] [CrossRef]
- Fajgelj, A.; Ambrus, Á. Principles and Practices of Method Validation; Royal Society of Chemistry: London, UK, 2000. [Google Scholar]
- Li, Y.; Zhu, Z.; Kong, D.; Han, H.; Zhao, Y. EA-LSTM: Evolutionary attention-based LSTM for time series prediction. Knowl. Based Syst. 2019, 181, 104785. [Google Scholar] [CrossRef]
- Yu, Y.; Si, X.; Hu, C.; Zhang, J. A Review of Recurrent Neural Networks: LSTM Cells and Network Architectures. Neural Comput. 2019, 31, 1235–1270. [Google Scholar] [CrossRef]
- Yang, B.; Lei, Y.; Li, X.; Li, N.; Si, X.; Chen, C. A dynamic barycenter bridging network for federated transfer fault diagnosis in machine groups. Mech. Syst. Signal Process. 2025, 230, 112605. [Google Scholar] [CrossRef]

Disclaimer/Publisher’s Note: The statements, opinions and data contained in all publications are solely those of the individual author(s) and contributor(s) and not of MDPI and/or the editor(s). MDPI and/or the editor(s) disclaim responsibility for any injury to people or property resulting from any ideas, methods, instructions or products referred to in the content. |
© 2025 by the authors. Licensee MDPI, Basel, Switzerland. This article is an open access article distributed under the terms and conditions of the Creative Commons Attribution (CC BY) license (https://creativecommons.org/licenses/by/4.0/).