Article

A Novel Dynamic Characteristic for Detecting Breathing Cracks in Blades Based on Vibration Response Envelope Analysis

1
College of Intelligence Science and Technology, National University of Defense Technology, Changsha 410073, China
2
National Key Laboratory of Equipment State Sensing and Smart Support, National University of Defense Technology, Changsha 410073, China
*
Author to whom correspondence should be addressed.
Machines 2025, 13(5), 399; https://doi.org/10.3390/machines13050399
Submission received: 22 March 2025 / Revised: 2 May 2025 / Accepted: 6 May 2025 / Published: 10 May 2025

Abstract

Fatigue cracks in blades pose a significant threat to the safe operation of rotating machinery. Currently, the application of non-contact displacement sensors in blade vibration measurements has enabled the widespread analysis of nonlinear dynamic characteristics, such as natural frequency deviations and spectral anomalies, to enhance crack fault diagnosis in rotating machinery. However, these two dynamic characteristics are not distinguishable for crack changes, especially for incipient cracks, leading to potential misdiagnosis. In this paper, a dynamic characteristic called the envelope diagram image of vibration responses (EDIVR) was extracted from blade tip displacement signals collected during acceleration–deceleration cycles for crack diagnosis. Initially, considering the breathing effect of fatigue cracks, a structural dynamics finite element model of a blade containing a breathing crack is established to calculate its dynamic response under aerodynamic force. Subsequently, the sensitivity of three characteristics (natural frequency, frequency spectrum, and EDIVR) to crack fault changes is quantitatively compared based on the simulated response signals. Experimental validation confirms the accuracy of the proposed dynamic model and the effectiveness of the proposed feature. The study shows that under identical operational conditions, blades with cracks of equivalent depth and location exhibit maximum sensitivity to crack detection when EDIVR dynamic characteristics are employed as the fault diagnostic criterion. Moreover, this characteristic is less susceptible to signal noise interference compared to other dynamic characteristics, enhancing its potential for crack diagnosis in engineering applications.

1. Introduction

The fatigue crack of rotor blades is a typical failure caused by the high-cycle fatigue loads that the blades endure during the operation of the equipment [1]. To prevent blade fracture caused by crack propagation, it is crucial to identify cracks accurately and promptly at the initial stage. This is essential for ensuring the safe operation of large rotors, such as those in gas turbines, aero-engines, and steam turbines.
Vibration response signals are commonly used for blade fault diagnosis. Typical measurement methods of rotor blade vibration responses can be categorized into contact and non-contact types. For contact measurements, strain gauges are typically employed to measure blade vibrations by attaching them to the blades to obtain stress signals at the adhesion points [1]. Although strain gauge measurement [2] offers high precision, the complex installation structure of the strain gauge system can interfere with the mechanical structure of the rotor. Non-contact measurements, on the other hand, involve no physical contact between the sensor and the blade, effectively avoiding any influence on the mechanical properties of the blade and reducing sensor wear. This approach significantly extends the testing period. As a typical non-contact method, Blade Tip Timing (BTT) measurement [3,4,5] monitors blade displacement vibrations by measuring the displacement sequence of blade tips. This technique is cost-effective and can simultaneously monitor the vibration of all blades, making it a current research hotspot in online monitoring technology for aero-engine blades. Companies such as General Electric (GE), Rolls-Royce (RR), and Pratt & Whitney have already applied BTT measurement technology in engine production tests [6]. In summary, displacement response measurement proves effective in blade vibration monitoring, allowing for crack fault diagnosis through the analysis of the characteristics of displacement response signals.
During the vibrational cycles of a blade, a fatigue crack exhibits an alternating opening and closing behavior [7], leading to repeated contact and separation of its two crack surfaces. This phenomenon is known as the “breathing effect” [7]. The nonlinear characteristics observed in the dynamic response signals of blades are attributed to this breathing effect and have become a theoretical foundation for extensive research on crack diagnosis methodologies. Studies have shown that the breathing crack can lead to a reduction in the natural frequency of the blade. Cheng [8] and Zhang [9] investigated the dynamic response in the frequency domain of a cantilever beam with a fatigue crack by establishing a corresponding model. Saito [10] considered the opening and closing of the crack during the vibration of the beam, calculating the changes in frequencies and mode shapes due to local stiffness variations. Xiong [11] and Wang [12] developed a finite element model for cracked cantilever plates to describe the spring stiffness matrix of a breathing crack, comparing the calculated natural frequencies with experimental results. Frequency identification methods based on Blade Tip Timing (BTT) measurement have also been proposed for calculating the vibration frequency of rotating blades and detecting any abnormalities. Diamond [13] and Wu [14] used resonance frequencies and amplitudes of blade tips as indicators for crack diagnosis, applying the K-means cluster method to classify cracks. Cao [15] introduced a method for identifying cracked blades by calculating the natural frequency using a single probe. However, these studies collectively indicate that the natural frequency reduction caused by the breathing crack is not significantly distinguishable from that of intact blades. Therefore, to achieve accurate crack detection, it is necessary to investigate more sensitive diagnostic techniques further.
Several additional vibration characteristics have been identified for the recognition of breathing cracks, with the most significant being the detection of abnormal frequency components in the response signal spectrum. Studies indicate that subharmonic or superharmonic components may exist in the frequency response of cracked nonlinear dynamical systems [16]. Yang [17] proposed a novel nonlinear rotating cracked blade model to investigate the nonlinear dynamic behavior of rotating blades and introduced an indicator to quantitatively describe crack-induced superharmonic resonances. Zeng [18] analyzed the vibration response of blades during the run-up process and identified second- and third-order superharmonics caused by cracks. Xie [19] developed a stress-based breathing crack model and discovered a 2x frequency component in the frequency spectrum of the response signal. Xu [20] and Shen [21] transformed blade displacement signals into vibration power flow, thereby amplifying the power ratio of abnormal harmonic components caused by breathing cracks through the flow of vibration energy. Moreover, several studies have applied multi-frequency detection methods based on Blade Tip Timing (BTT) signals. Lin [22] and Pan [23] incorporated sparse representation theory into the reconstruction of blade tip vibration frequencies, successfully detecting various frequency components. However, precise spectral analysis remains challenging under conditions of high-speed blade operation and the presence of measurement noise.
To address the limitations of the aforementioned dynamic characteristics, this study introduces a novel feature termed the Envelope Diagram Image of Vibration Responses (EDIVR). This characteristic is derived by extracting the envelope of the blade tip vibration response signals as the blade passes through its resonance zone during the speed ramping processes and converting the signal envelope into a binary image. The EDIVR integrates the nonlinear dynamic behavior of the blade within the resonance zone and exhibits corresponding shape changes in response to crack-induced faults. Furthermore, a quantitative indicator known as the Distance of Fourier Descriptor (DFD) is introduced to define the shape variations in the EDIVR caused by cracks. Compared with traditional nonlinear dynamic behavior features, the EDIVR is more sensitive to crack changes and is less susceptible to noise interference. This enhanced sensitivity and robustness make the EDIVR a promising tool for crack detection in blade dynamics. This study presents three distinctive advancements:
(1)
A novel blade dynamic characteristic EDIVR is proposed. The correlation between EDIVR and blade crack faults is demonstrated through dynamic modeling, with the characteristic directly linked to crack-induced dynamic responses.
(2)
A novel indicator DFD is proposed to quantitatively characterize EDIVR features. This indicator exhibits enhanced fault sensitivity when implemented as a diagnostic criterion for crack detection.
(3)
The EDIVR characteristic and its DFD indicator effectively alleviate noise interference in crack diagnosis.
This paper is organized as follows: Section 2 establishes a dynamic model of the blade with breathing cracks to calculate the dynamic displacement responses of vibration. Section 3 defines the Envelope Diagram Image of Vibration Responses (EDIVR) and quantitatively compares it with other dynamic characteristics to evaluate its feasibility in breathing crack detection. Section 4 presents experimental results to validate the effectiveness of the proposed methods on two typical types of breathing cracks. Finally, conclusions are summarized in Section 5.

2. Feature Generation Methodology

In this section, a methodology for generating the EDIVR feature based on signal envelope curves is proposed. First, a finite element model is employed to compute the dynamic responses of blades with breathing cracks. Subsequently, the relationship between the shape characteristics of blade tip vibration envelope curves and cracked blades is systematically analyzed.

2.1. Dynamic Model of Blade with Breathing Crack

The blade was first modeled using the finite element method (FEM), discretized with 8-node hexahedral elements (Hex8), as illustrated in Figure 1. The global coordinate system (XYZ) and the excitation load F are explicitly labeled in the figure.
Assuming that the shear effect is not considered in the blade deformation, the mass matrix and stiffness matrix of the blade are assembled from the mass matrix and stiffness matrix of the Hex8 elements. The expression for the elemental mass matrix is given by [24]:
M e = V ρ N T N d V
where ρ is the density of the blade material, and N is the shape function of the element.
The stiffness matrix of the element can be written as follows [24]:
K e = V B T D B d V
where B is the strain–displacement matrix, and D is the elasticity matrix. The detailed expressions for the mass matrix and stiffness matrix can be found in the relevant literature [11]. Consequently, the global mass matrix of the blade MB and stiffness matrix KB are assembled from these elemental matrices.
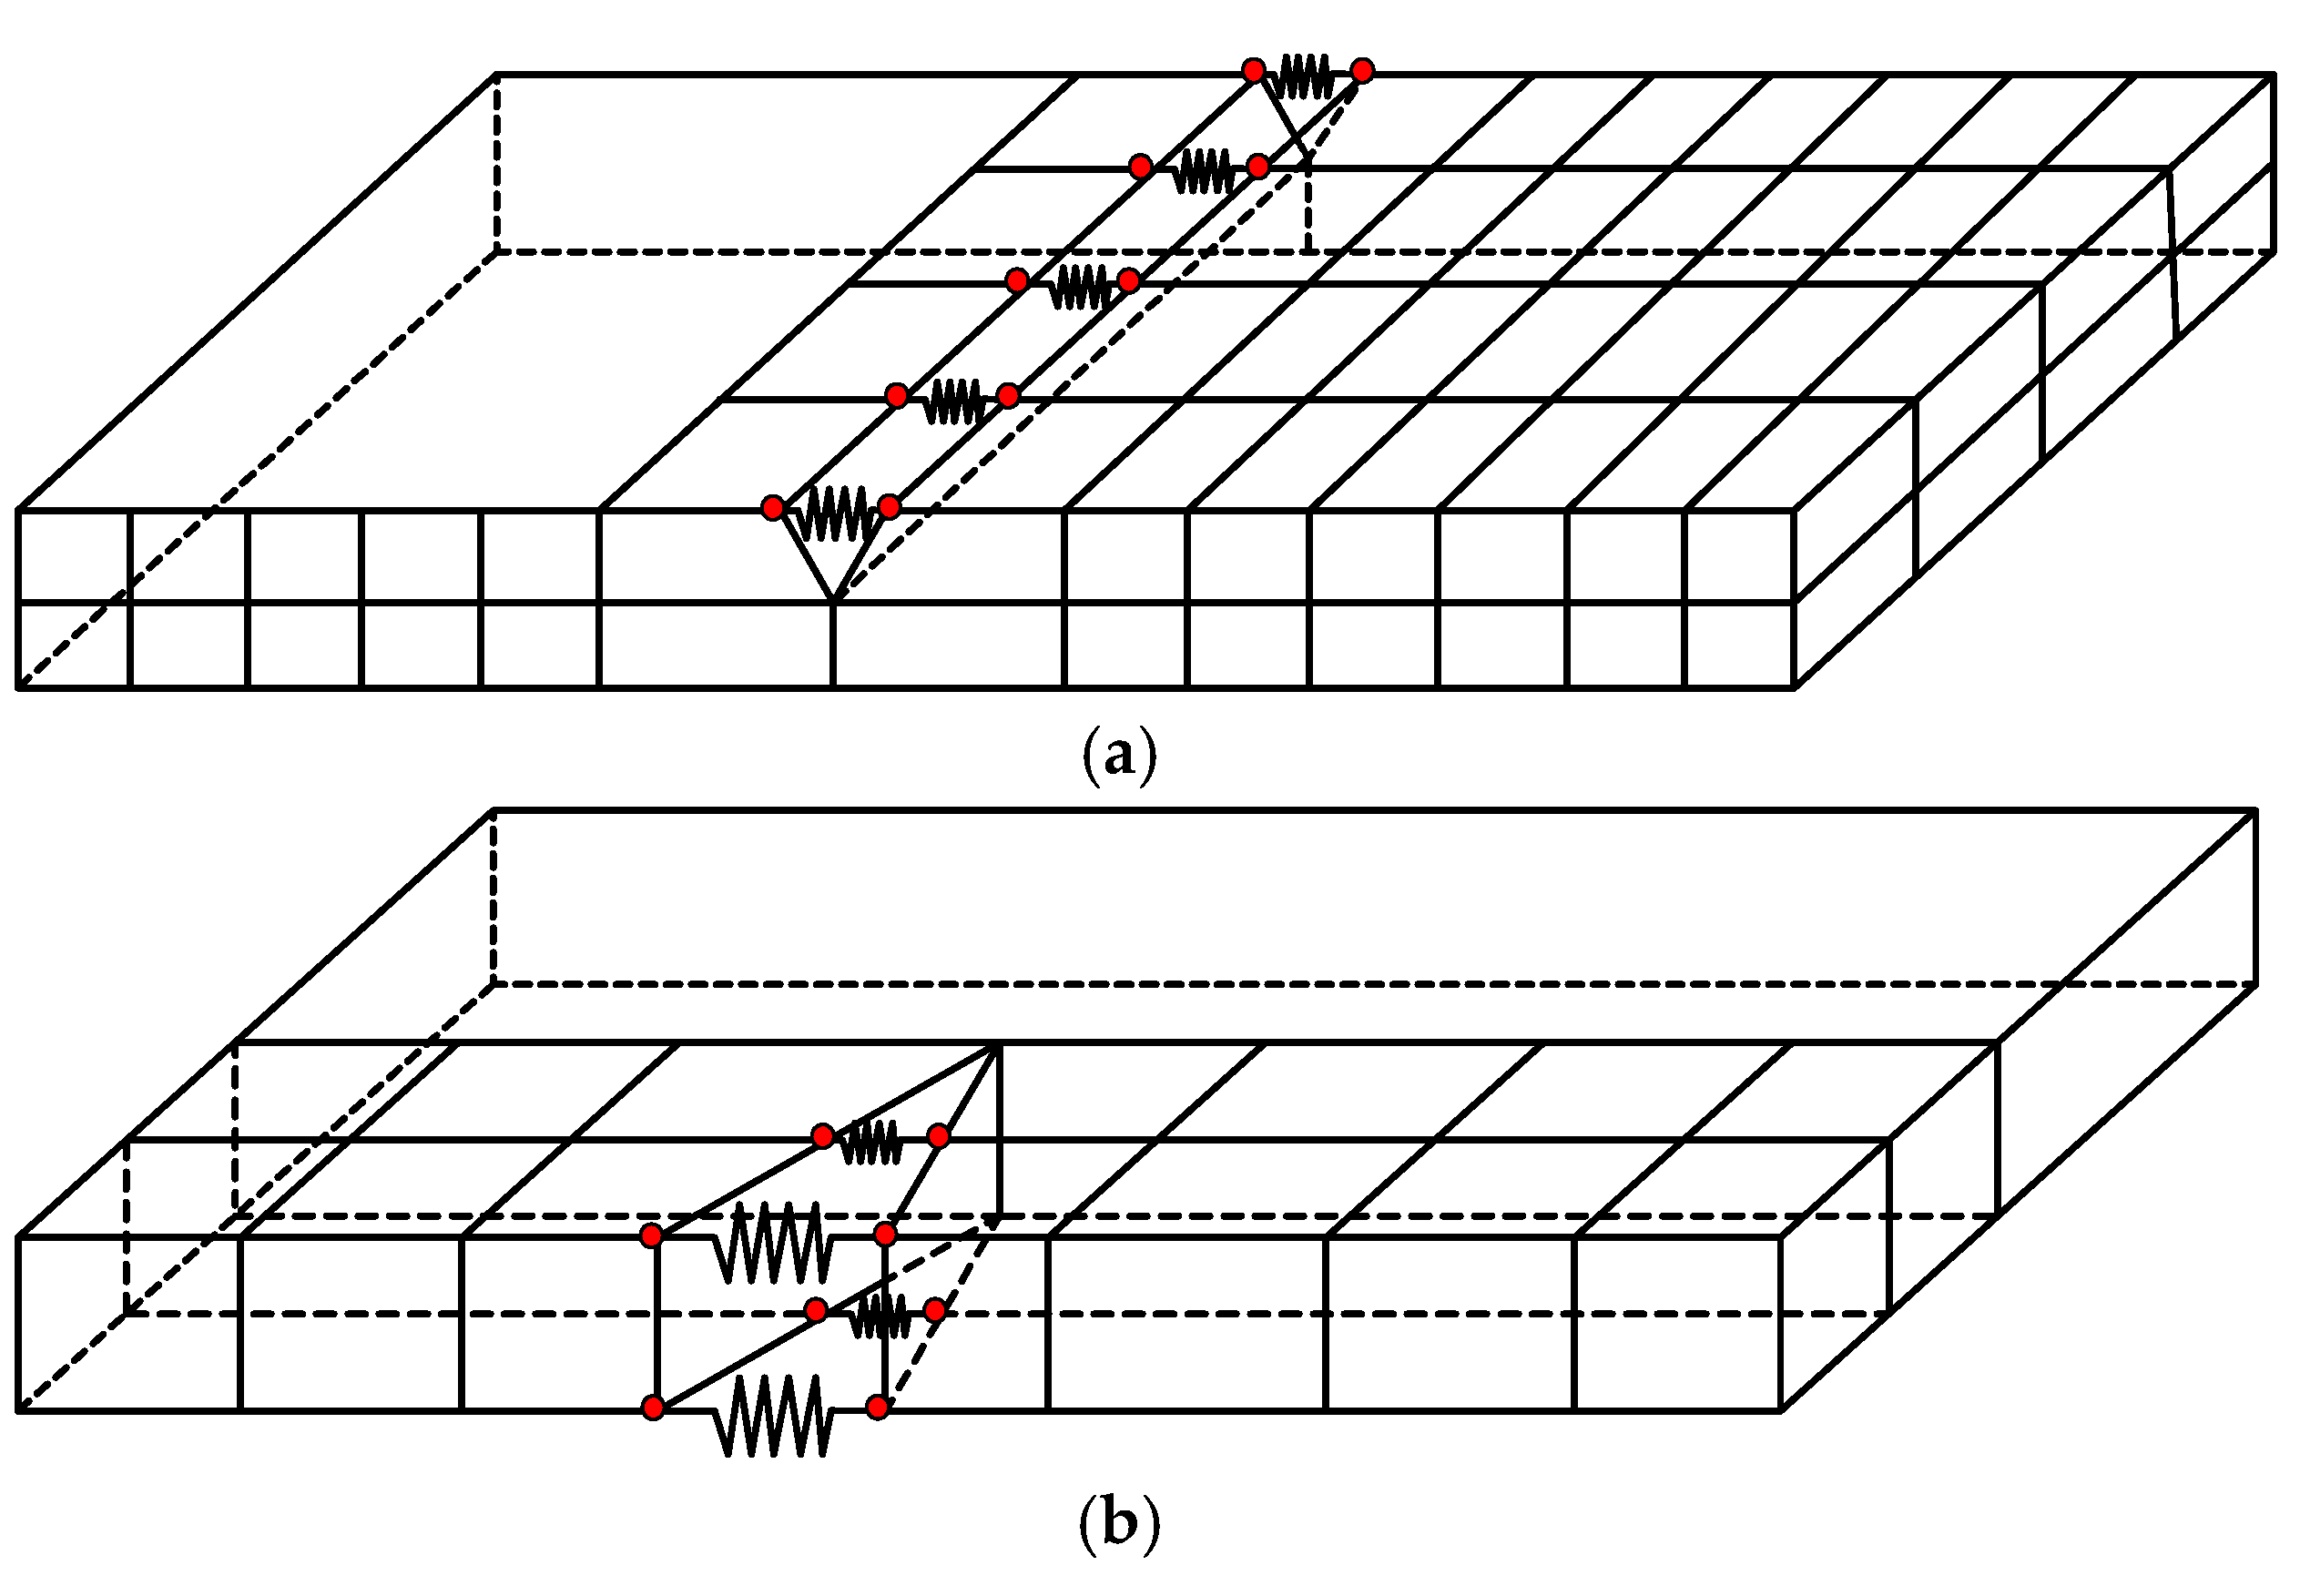
For cracked blades, it is assumed that crack propagation is negligible over the vibration monitoring period. The breathing effect is characterized by the periodic opening and closing of crack surfaces due to dynamic deformation during forced vibration, leading to changes in crack contact states and consequently inducing a nonlinear time-varying characteristic in local stiffness. As illustrated in Figure 2, this study demonstrates numerical simulation methods for breathing cracks by developing contact dynamics models for two typical types of defects: edge cracks and surface cracks [11].
For the breathing crack in the blade, it is assumed that the nodes on either side of the crack are connected by a massless spring element. A local magnification of this setup is shown in Figure 3. The stiffness of the spring element between nodes m and n on the two crack surfaces due to the breathing phenomenon is calculated as follows [12]:
K m n S p r i n g = K m n e ,   d n d m 0 0 ,   d n d m > 0
where K m n e represents the stiffness matrix between corresponding nodes obtained from Equation (2) for an uncracked element, d n and d m denote the displacements of nodes n and m in their dynamic responses. When d n d m , the surfaces of the fatigue cracks are closed, and the blade’s stiffness remains unchanged. When d n > d m , the surfaces of the fatigue cracks open, and there is no spring connection between the nodes on either side of the crack.
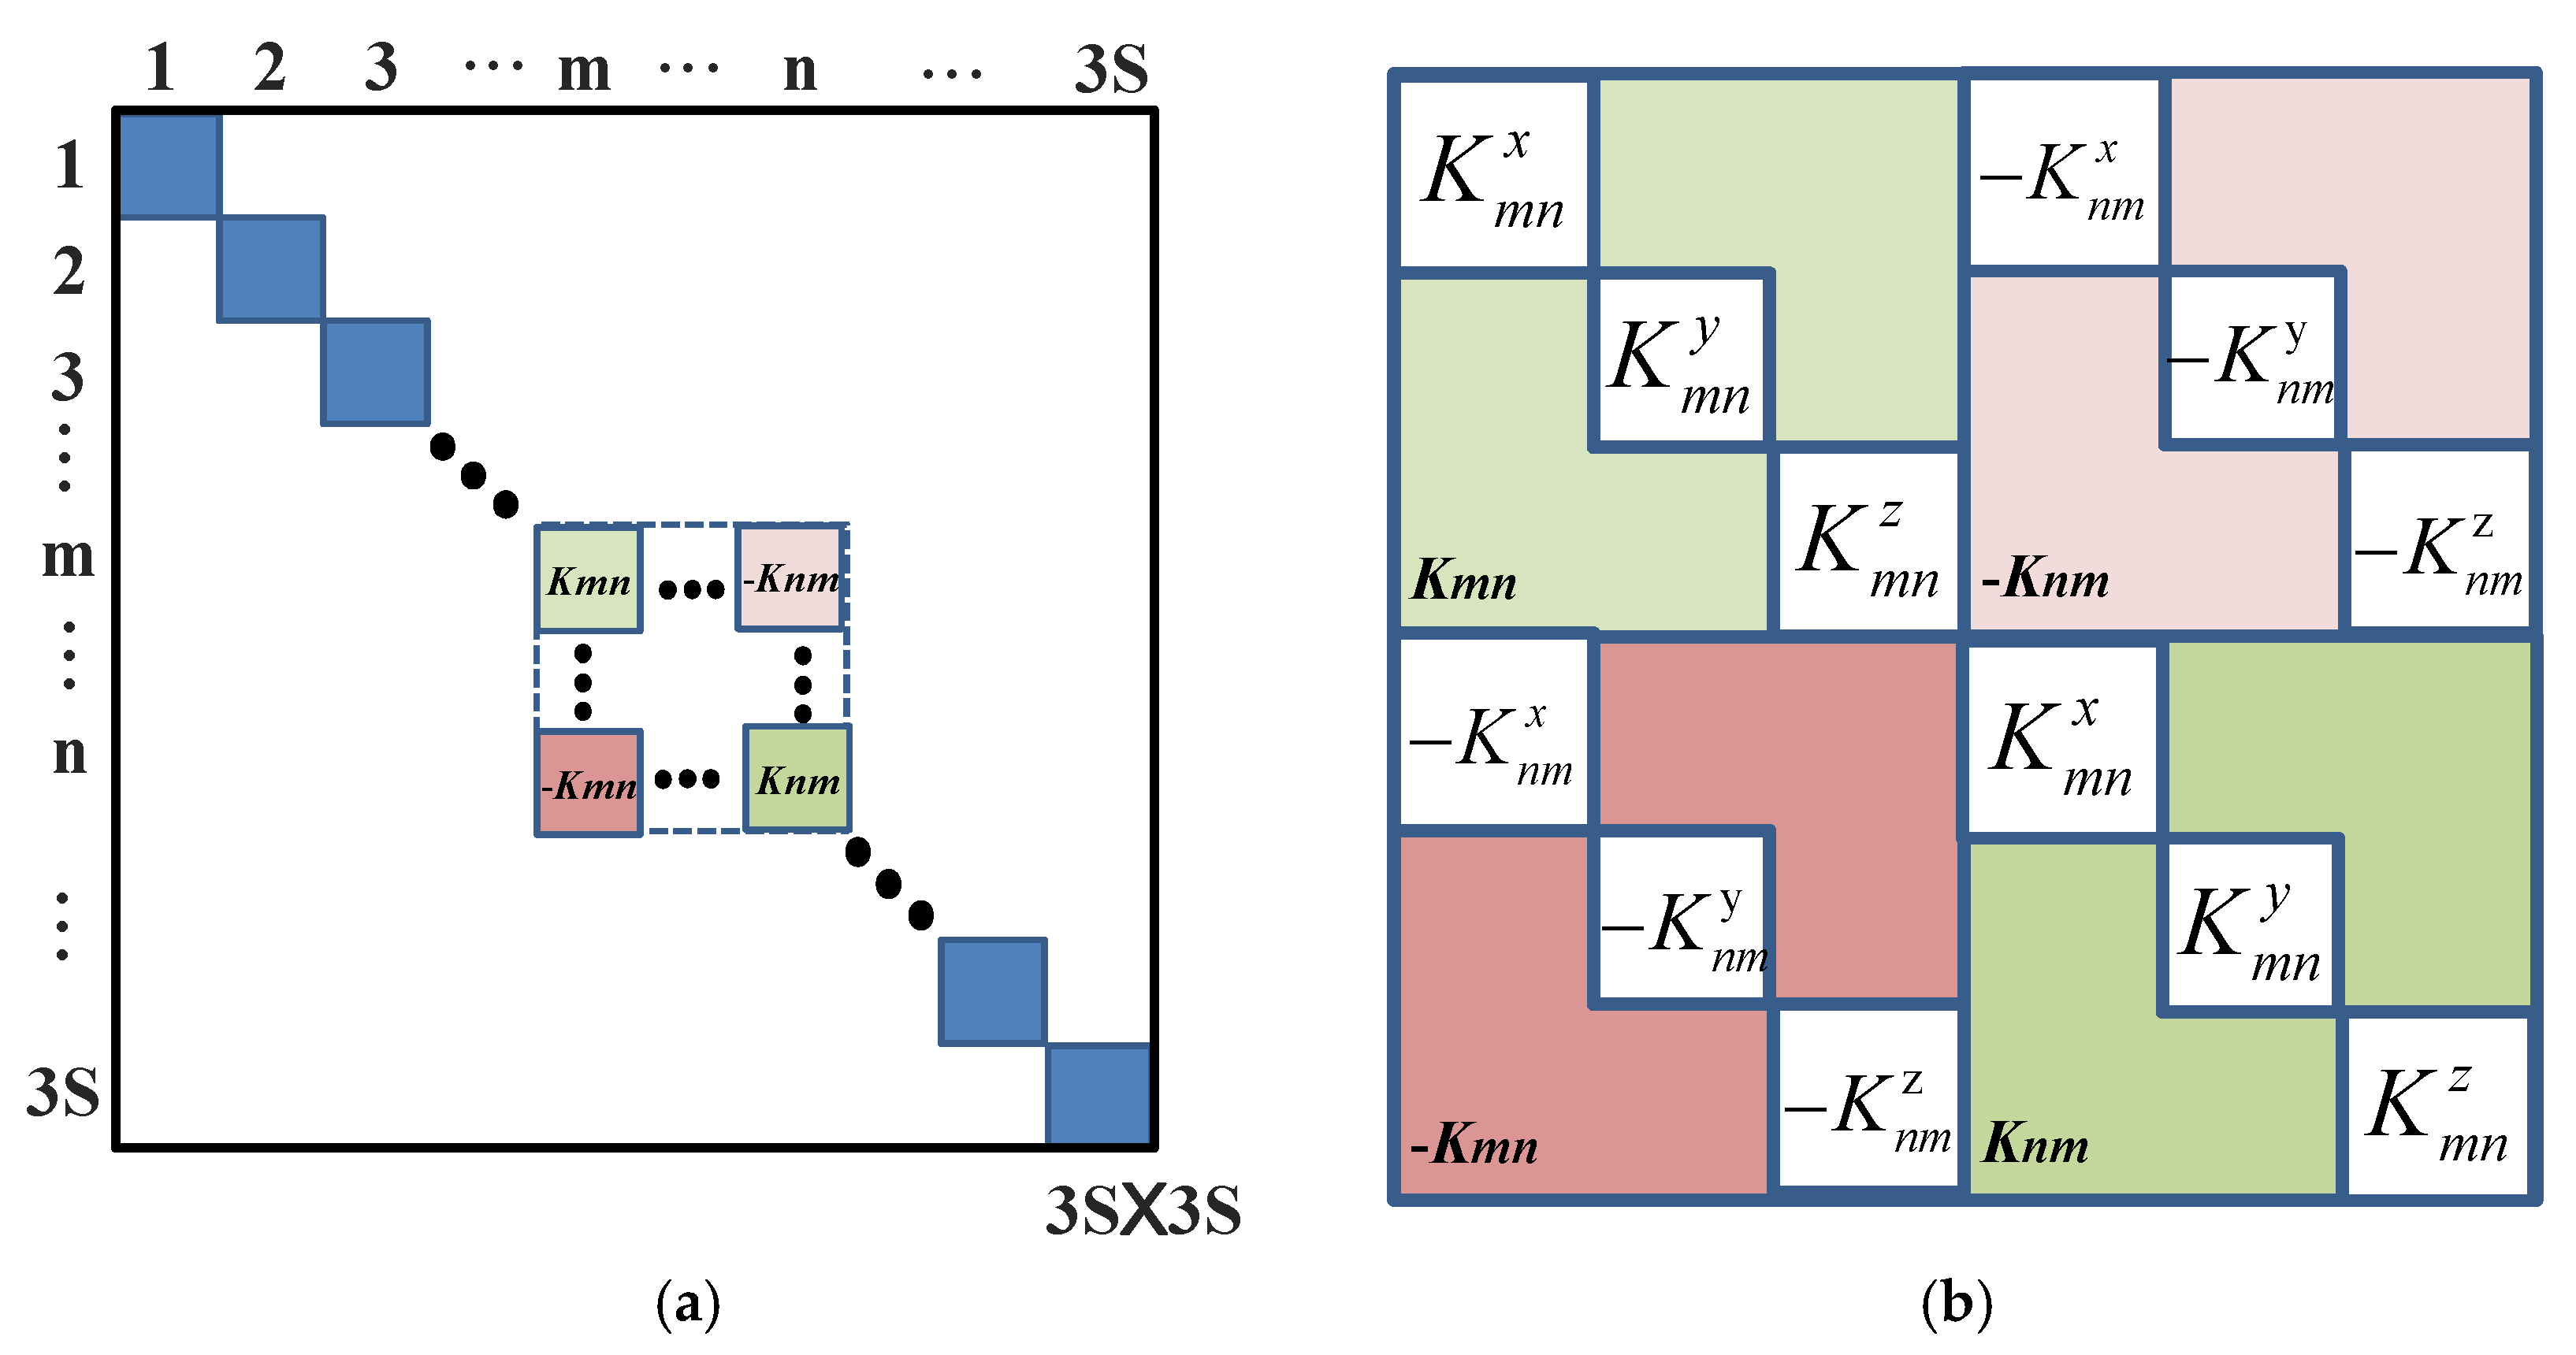
The crack interface experiences alternating contact and separation during blade vibration, resulting in nonlinear changes in the blade stiffness. Considering the breathing crack, the assembled stiffness matrix of the blade is illustrated in Figure 4. In this figure, S represents the total number of nodes after meshing the blade, and considering displacements in the x, y, and z directions, the total degrees of freedom for the system are 3S.
Assuming the centrifugal stiffening effect is neglected, the dynamic model of the cracked blade can be expressed as follows:
M B δ ¨ + C B δ ˙ + K B + K c r a c k δ = F t
where δ denotes the vibrational displacement vector of blade nodes. MB and KB represent the mass and stiffness matrices of the intact blade, respectively, while Kcrack is the combined stiffness matrix of spring elements at the crack interfaces. These matrices are integrated from the elemental matrices defined in Equations (1) and (2) through nodal degree-of-freedom connectivity. The damping matrix CB adopts Rayleigh damping [7]:
C B = α M B + β K B
α = 2 ξ ω 1 ω 2 ω 1 + ω 2
β = 2 ξ ω 1 + ω 2
where ξ denotes the damping ratio, determined by the blade’s material and structural properties. Crack propagation alters ξ due to energy dissipation changes. Coefficients α and β are derived from the first two natural frequencies (ω1 and ω2) of the intact blade. The external force F(t), primarily generated by the flow field in rotating blades, is formulated as follows:
F t = F 0 cos θ t
The phase function θ(t) depends on the operational conditions. For steady-state rotation (rotation speed is constant),
θ t = ω t + θ 0
where ω = i = 1 n ω i is the constant excitation frequency synchronized with the rotation speed. θ0 is the initial phase.
When the rotor operates under uniform acceleration/deceleration conditions, the phase function θ(t) during the process of uniform acceleration will be presented as follows:
θ t = 1 2 a t 2 + θ 0
where a is the rotational acceleration of the blade disk and θ0 is the original phase shift.
Given the specified blade geometry, material characteristics, and operational excitation parameters, the vibrational responses of blades can be computationally predicted by implementing numerical solutions derived from Equation (4). Established computational algorithms for resolving dynamic systems, such as the Newmark-β method [17] and similar computational schemes, are widely utilized for this purpose.

2.2. Envelope Analysis of Dynamic Response Signals

When the blade vibration is dominated by the first-order bending mode, the vibration displacement response at the tip node can be equivalently calculated using a single-degree-of-freedom model.
m x ¨ + c x ˙ + k x = F 0 cos ω t
where m, c, and k denote the equivalent mass, damping, and stiffness, respectively. For the single-degree-of-freedom model, the damping coefficient c can be simplified as follows:
c = 2 ξ m k
where ξ represents the damping ratio.
Although the single-degree-of-freedom equivalent model is less accurate compared to the finite element model in Equation (4), it can derive an analytical solution for the blade tip vibration response. Therefore, the effect of crack occurrence on the shape characteristics of the signal envelope curve is analyzed in this section using this model.
Near the resonance region, the excitation frequency ω can be considered constant within short time intervals. Under this assumption, the general solution of the dynamic model Equation (11) is expressed as follows:
x t = C e ξ k m t cos 2 m k 1 - ξ 2 t
where C is a constant related to the initial conditions.
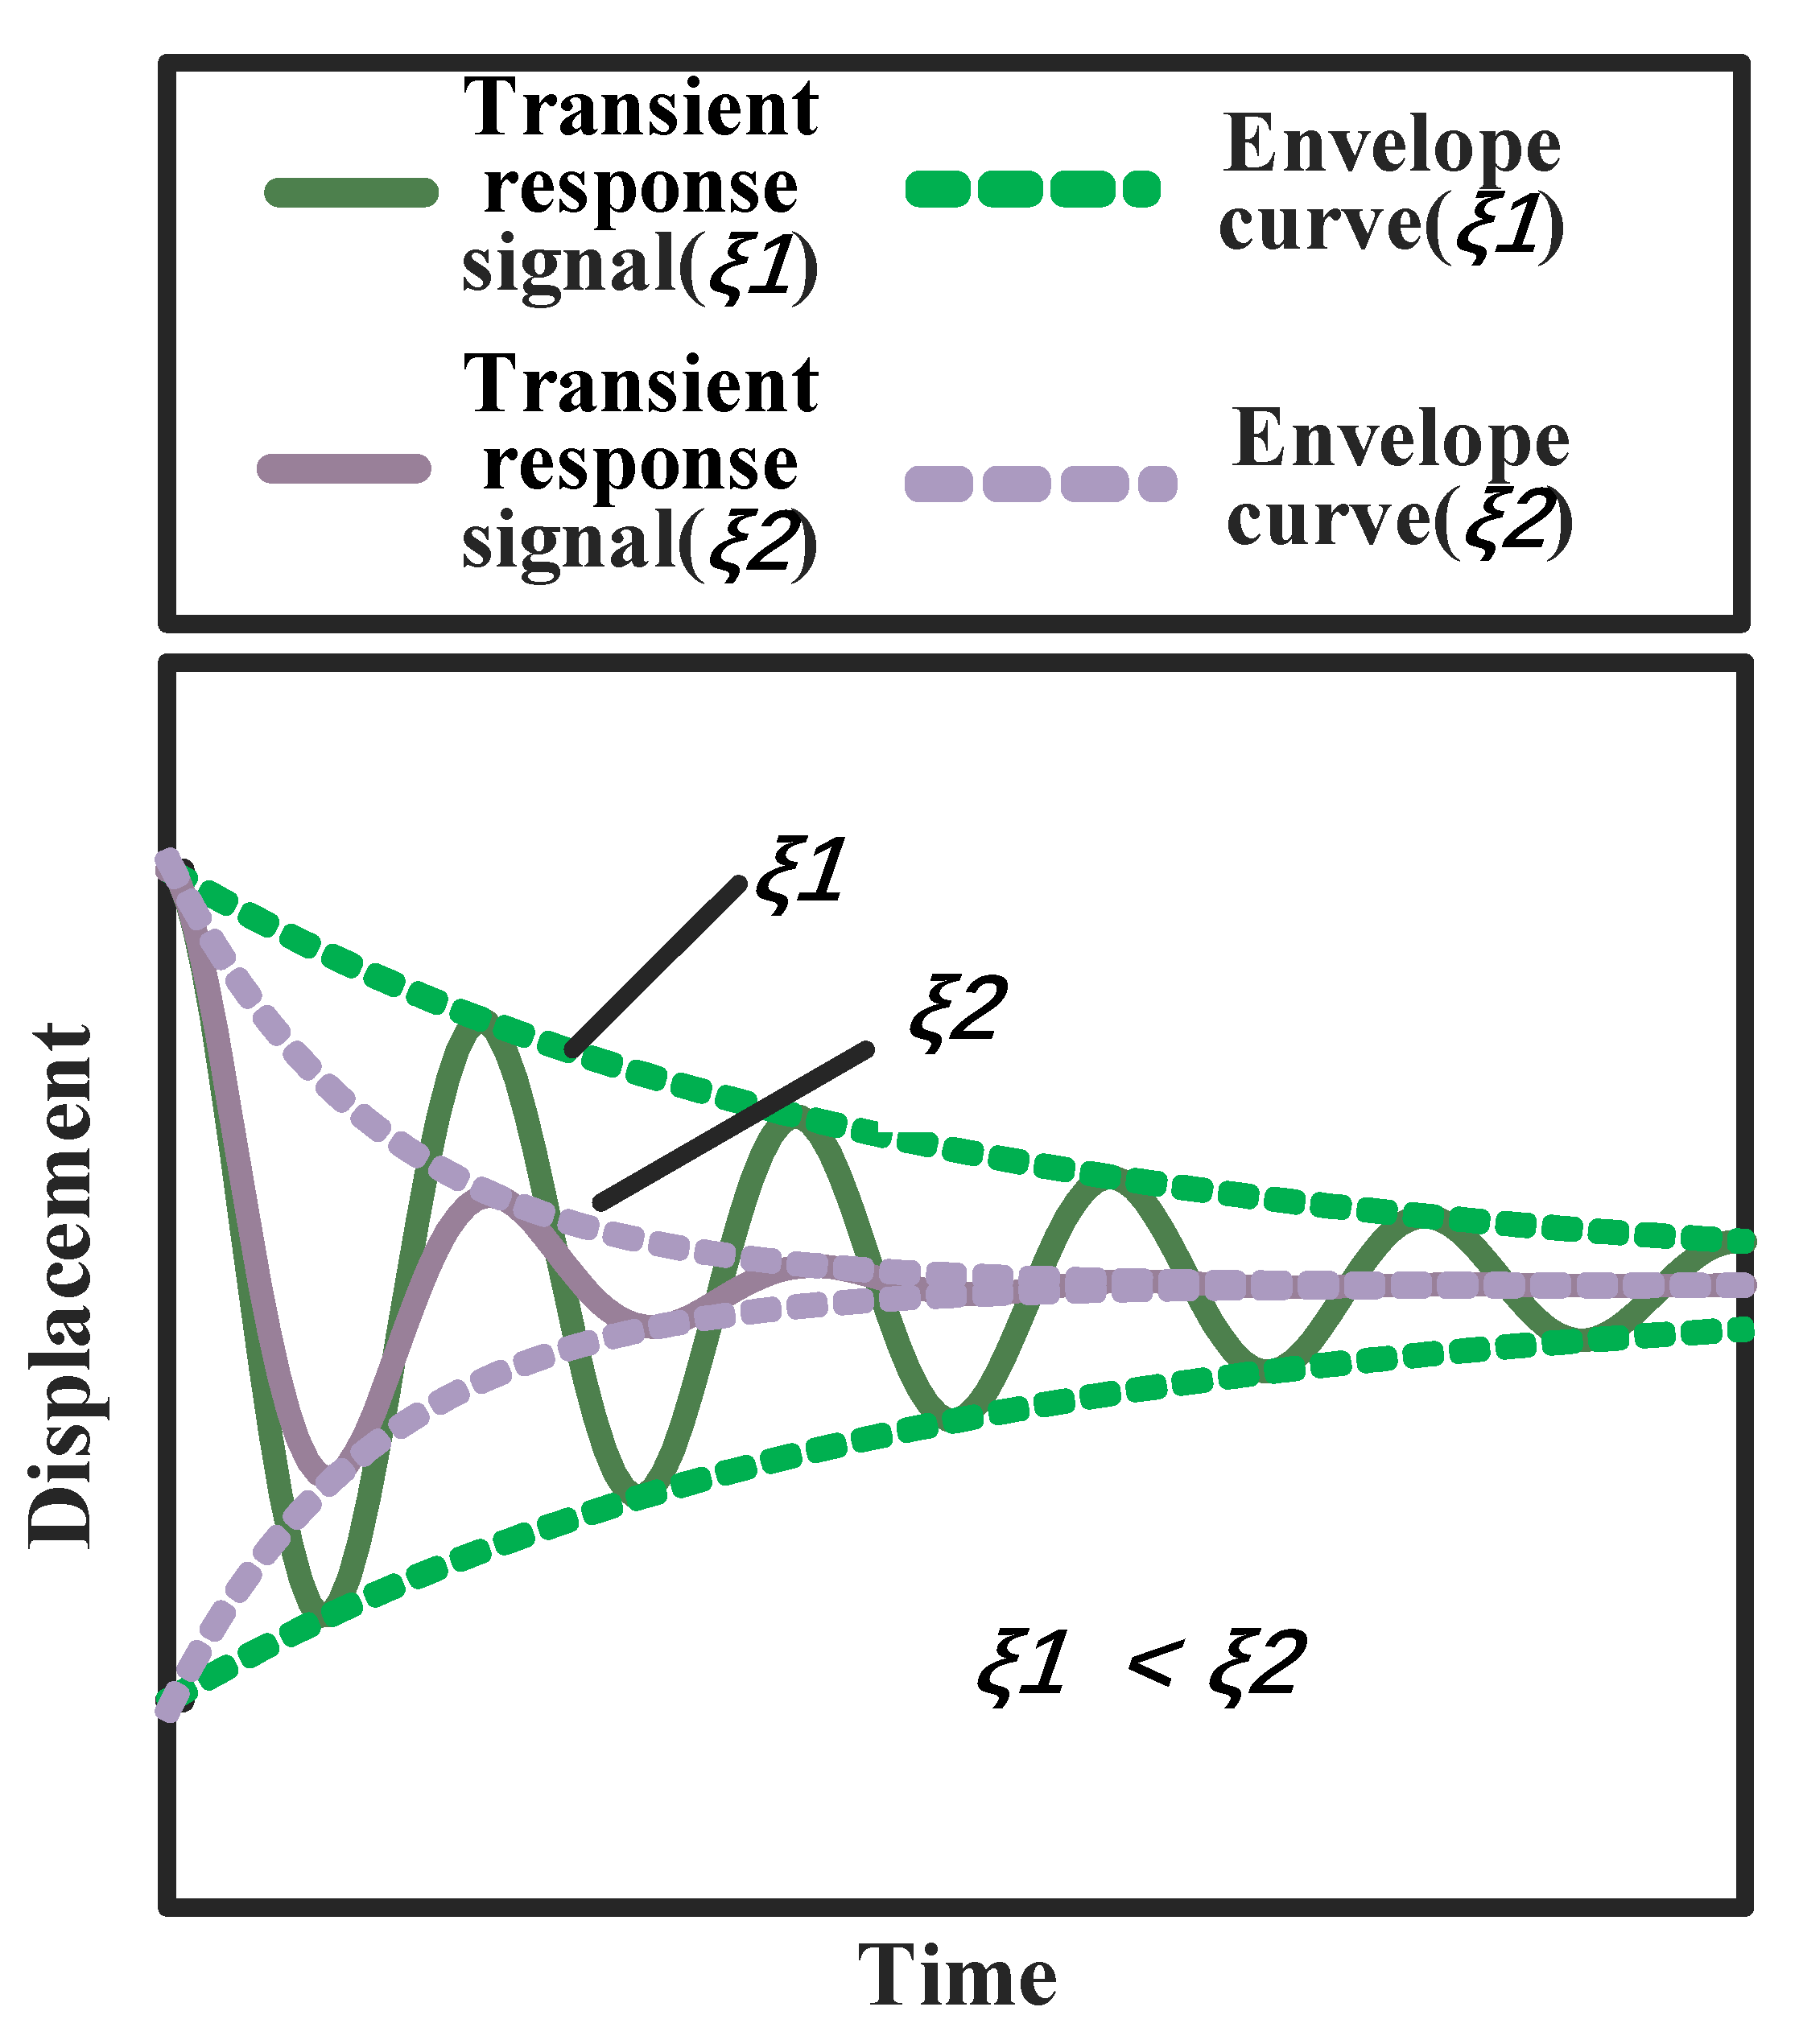
It is evident from the formula that the vibration response signal is expressed as a damped oscillatory equation, in which e ξ k m t determines the rate of oscillation decay. Figure 5 compares the transient response signals of two dynamic models with identical parameters except for their damping ratios. The results demonstrate that increasing the damping ratio enhances the decay rate of the response signals, which manifests as a steeper slope of the signal envelope.
The periodic opening and closing of the crack during vibration induces contact friction at the crack interfaces, thereby introducing additional energy dissipation [25]. This friction consumes vibrational energy, increasing the system damping, which is reflected as the damping ratio ξ. The damping ratio of the blade with the breathing crack will be calculated by adding the friction damping to the original damping ratio of the undamaged one [25]:
ξ = ξ 0 + Δ U c 4 π U 0
where ξ 0 is the damping ratio of the intact blade, Δ U c is the energy dissipated in the crack per vibration cycle, and U 0 is the strain energy of the beam. The detailed calculation processes of the friction damping have been described by many related scholars [25,26]. Many factors, such as material and crack depth, will cause changes in the friction damping. The damping ratio ζ determines a system’s transient oscillation characteristics, with higher values accelerating amplitude decay.
Due to the cyclic opening and closure of breathing cracks, a time-varying nonlinear stiffness matrix Kcrack is introduced into the blade dynamic system. For blades subjected to the excitation force in Equation (10), the uniform frequency ramping process causes the amplitude of the vibration response curve to exhibit characteristics similar to those of the amplitude–frequency response.
In the operation of rotating machinery, it is crucial to avoid sustained operation within the resonance region of the blades. Therefore, the common approach adopted during acceleration and deceleration processes is to traverse through these critical resonance zones.
For constant acceleration run-up and run-down processes, the solution to Equation (11) is expressed as follows:
x t = A ω cos ω t + φ
where the amplitude function is related to the varying excitation frequency ω:
A ω = F 0 ω 0 2 ω 2 2 + 4 γ 2 ω 2
where ω 0 is the system’s resonance frequency, which satisfies ω 0 = k m , γ = c 2 m
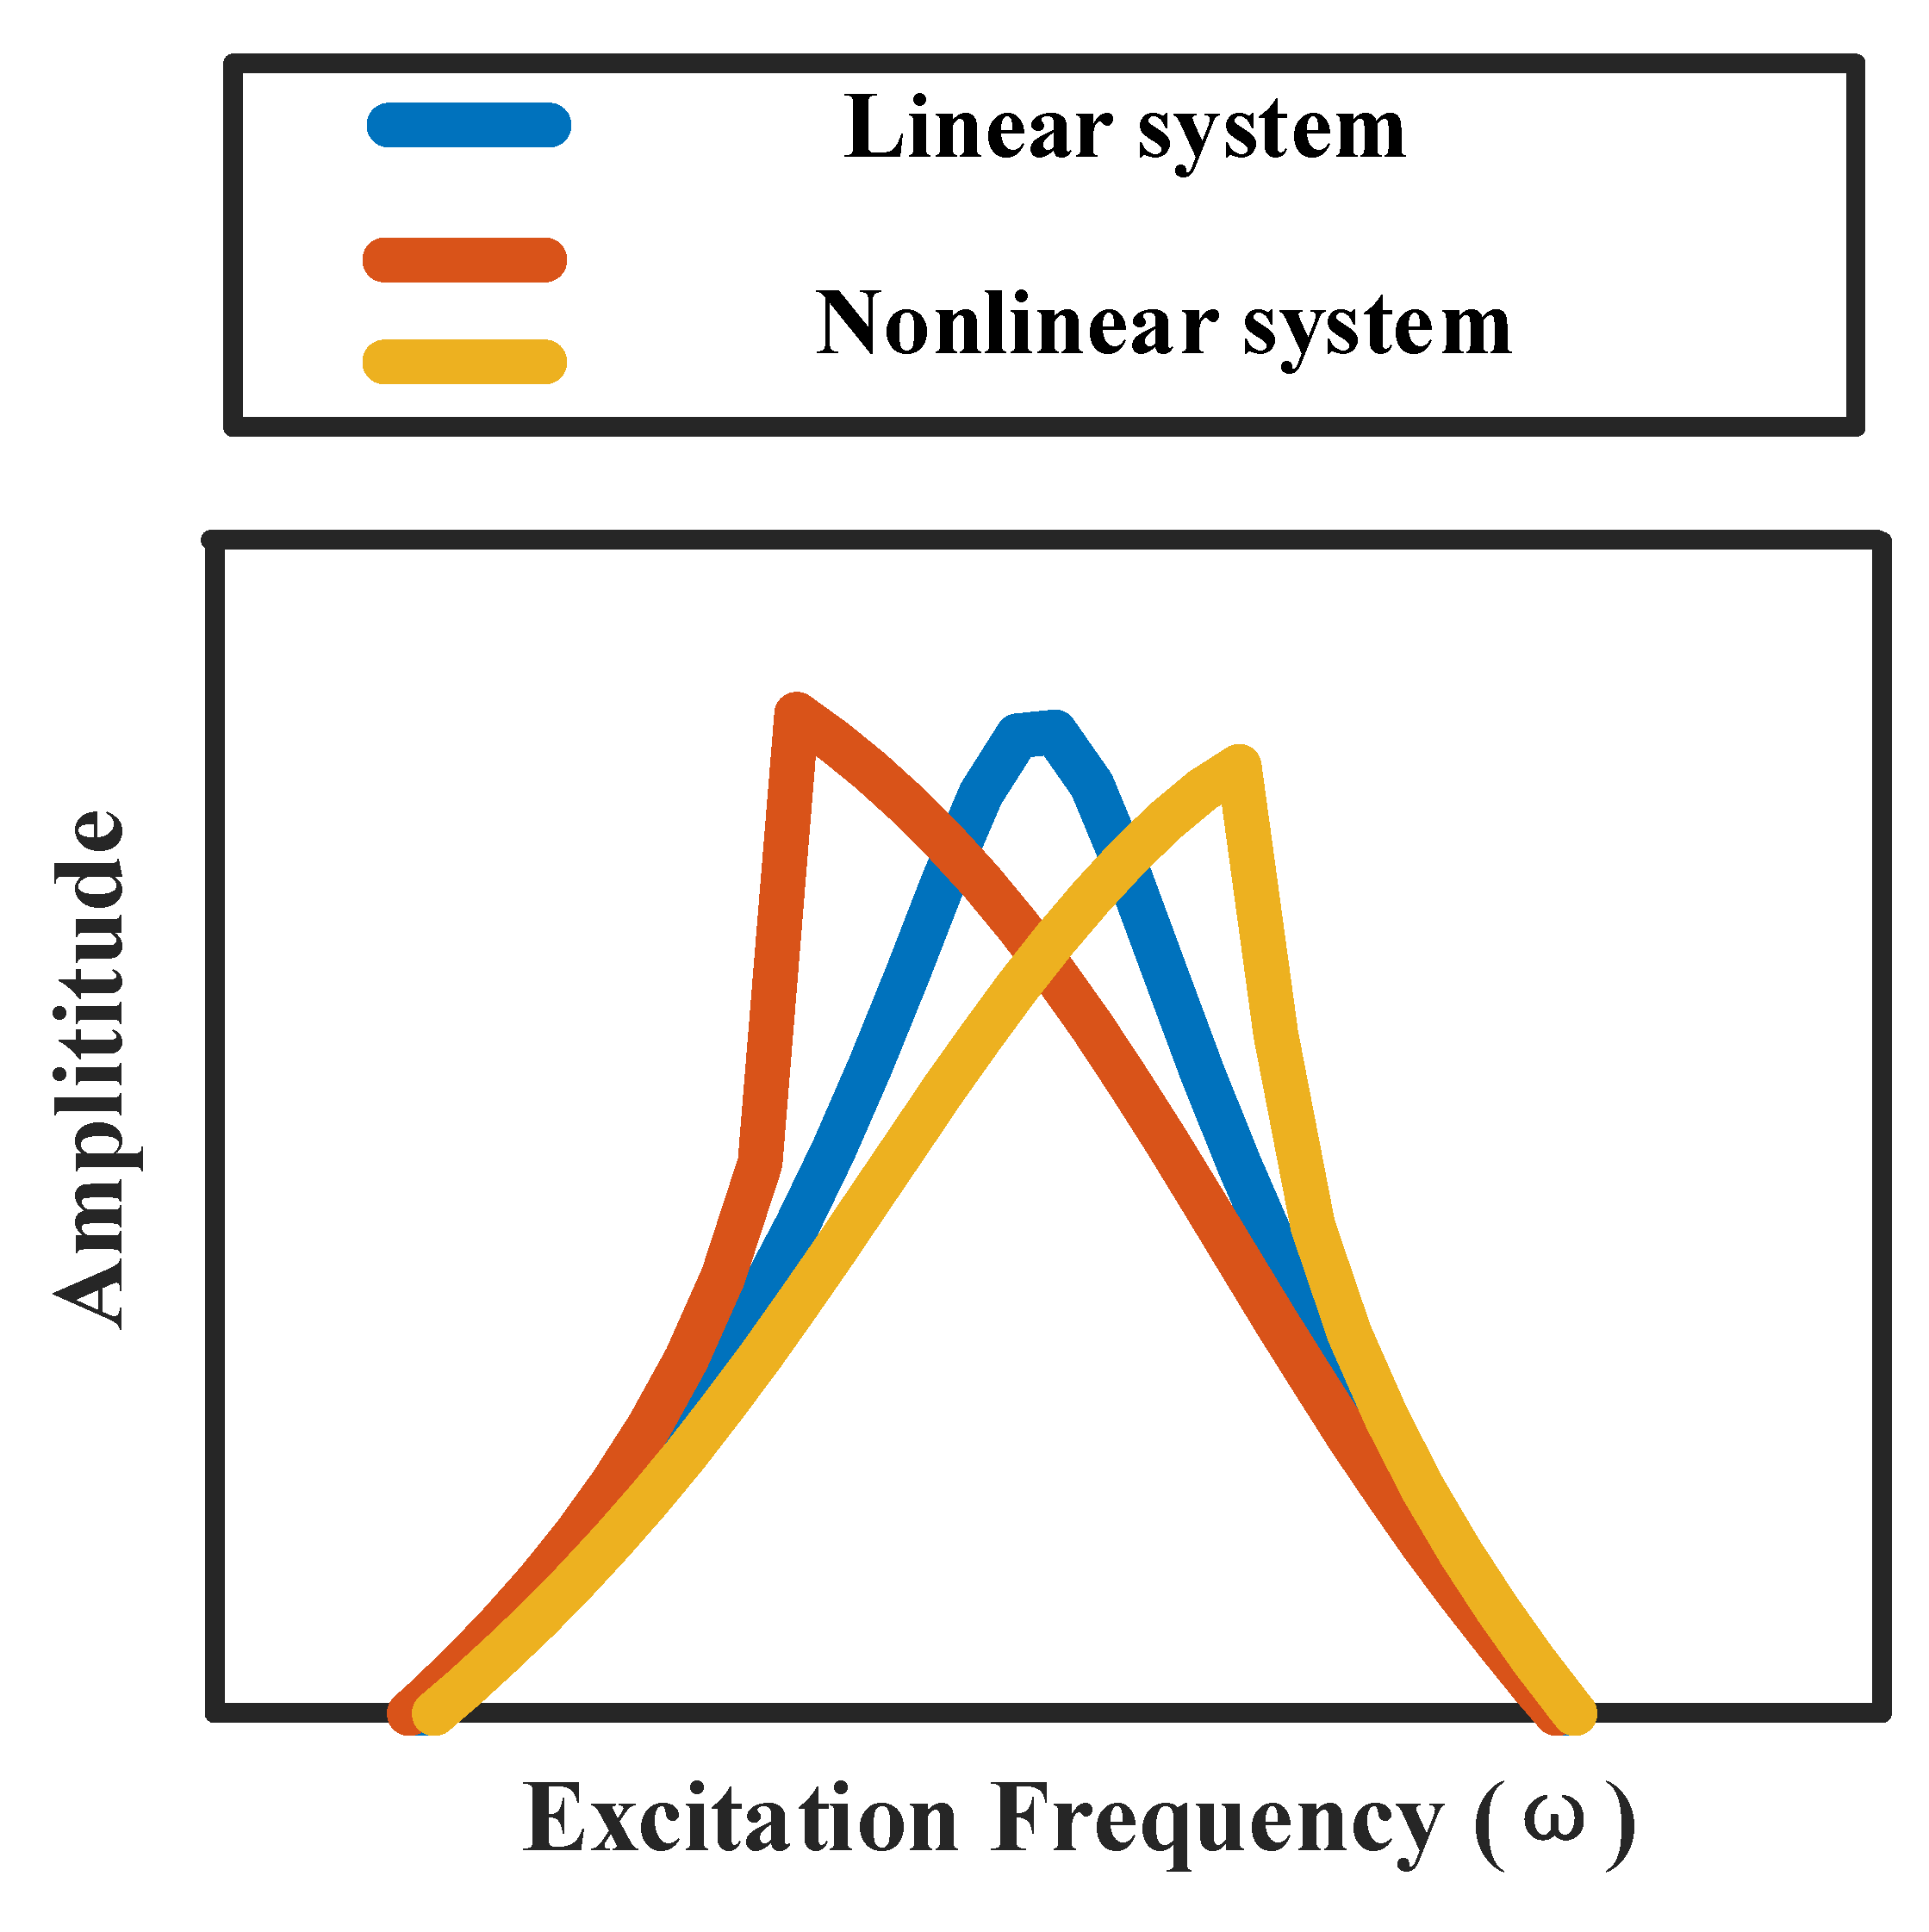
As indicated by the equation, the amplitude envelope of the vibration response curve exhibits symmetry about the natural frequency near the resonance peak. However, the crack-induced stiffness matrix Kcrack, generated by breathing cracks, causes the system stiffness k to become displacement- and time-dependent (k(x,t)) rather than constant. The introduction of nonlinear stiffness complicates the derivation of analytical solutions for the amplitude function. Nevertheless, numerical methods such as Runge–Kutta and Newmark-β algorithms enable the computational acquisition of amplitude–frequency responses for systems with nonlinear stiffness [27], as shown in Figure 6. The results reveal distinct amplitude–frequency characteristics between linear and nonlinear systems: linear systems display symmetrical bell-shaped peaks near the resonant frequency, while nonlinear systems exhibit asymmetric distortion in the resonance region. Furthermore, the resonant peak bends directionally under the influence of specific nonlinear stiffness terms.
The amplitude of complex vibration signals varies with time-dependent excitation frequencies, forming the signal’s “outer contour”—known as the signal envelope. Theoretically, the envelope of a signal can be obtained by performing a Hilbert transform to compute the modulus of the signal. In engineering practice, however, the envelope of a vibration response signal can be drawn by connecting the extremum points of the vibration signal. The envelope diagram image is created by selecting appropriate time windows around resonance regions and enclosing the area within the signal’s envelope curve. The area enclosed by the corresponding envelope curves constitutes the envelope diagram image of vibration responses (EDIVR). The specific method for generating an EDIVR is illustrated in Figure 7.
To explicitly demonstrate the effects of damping and nonlinear stiffness matrices on blade dynamic response signals, a specimen blade with dimensions 80 mm (length) × 40 mm (width) × 2 mm (thickness) was modeled. The material was defined as carbon steel. An identical specimen with an edge crack depth dc = 10 mm was analyzed to simulate the cracked blade. The excitation forces from Equations (8) and (10) (F0 = 10 N, frequency sweep rate a = 10 Hz/s) were applied to both intact and cracked specimens. The damping ratio of the cracked blade model was tripled to reflect crack-induced effects [25]. The calculated tip displacement responses are shown in Figure 7.
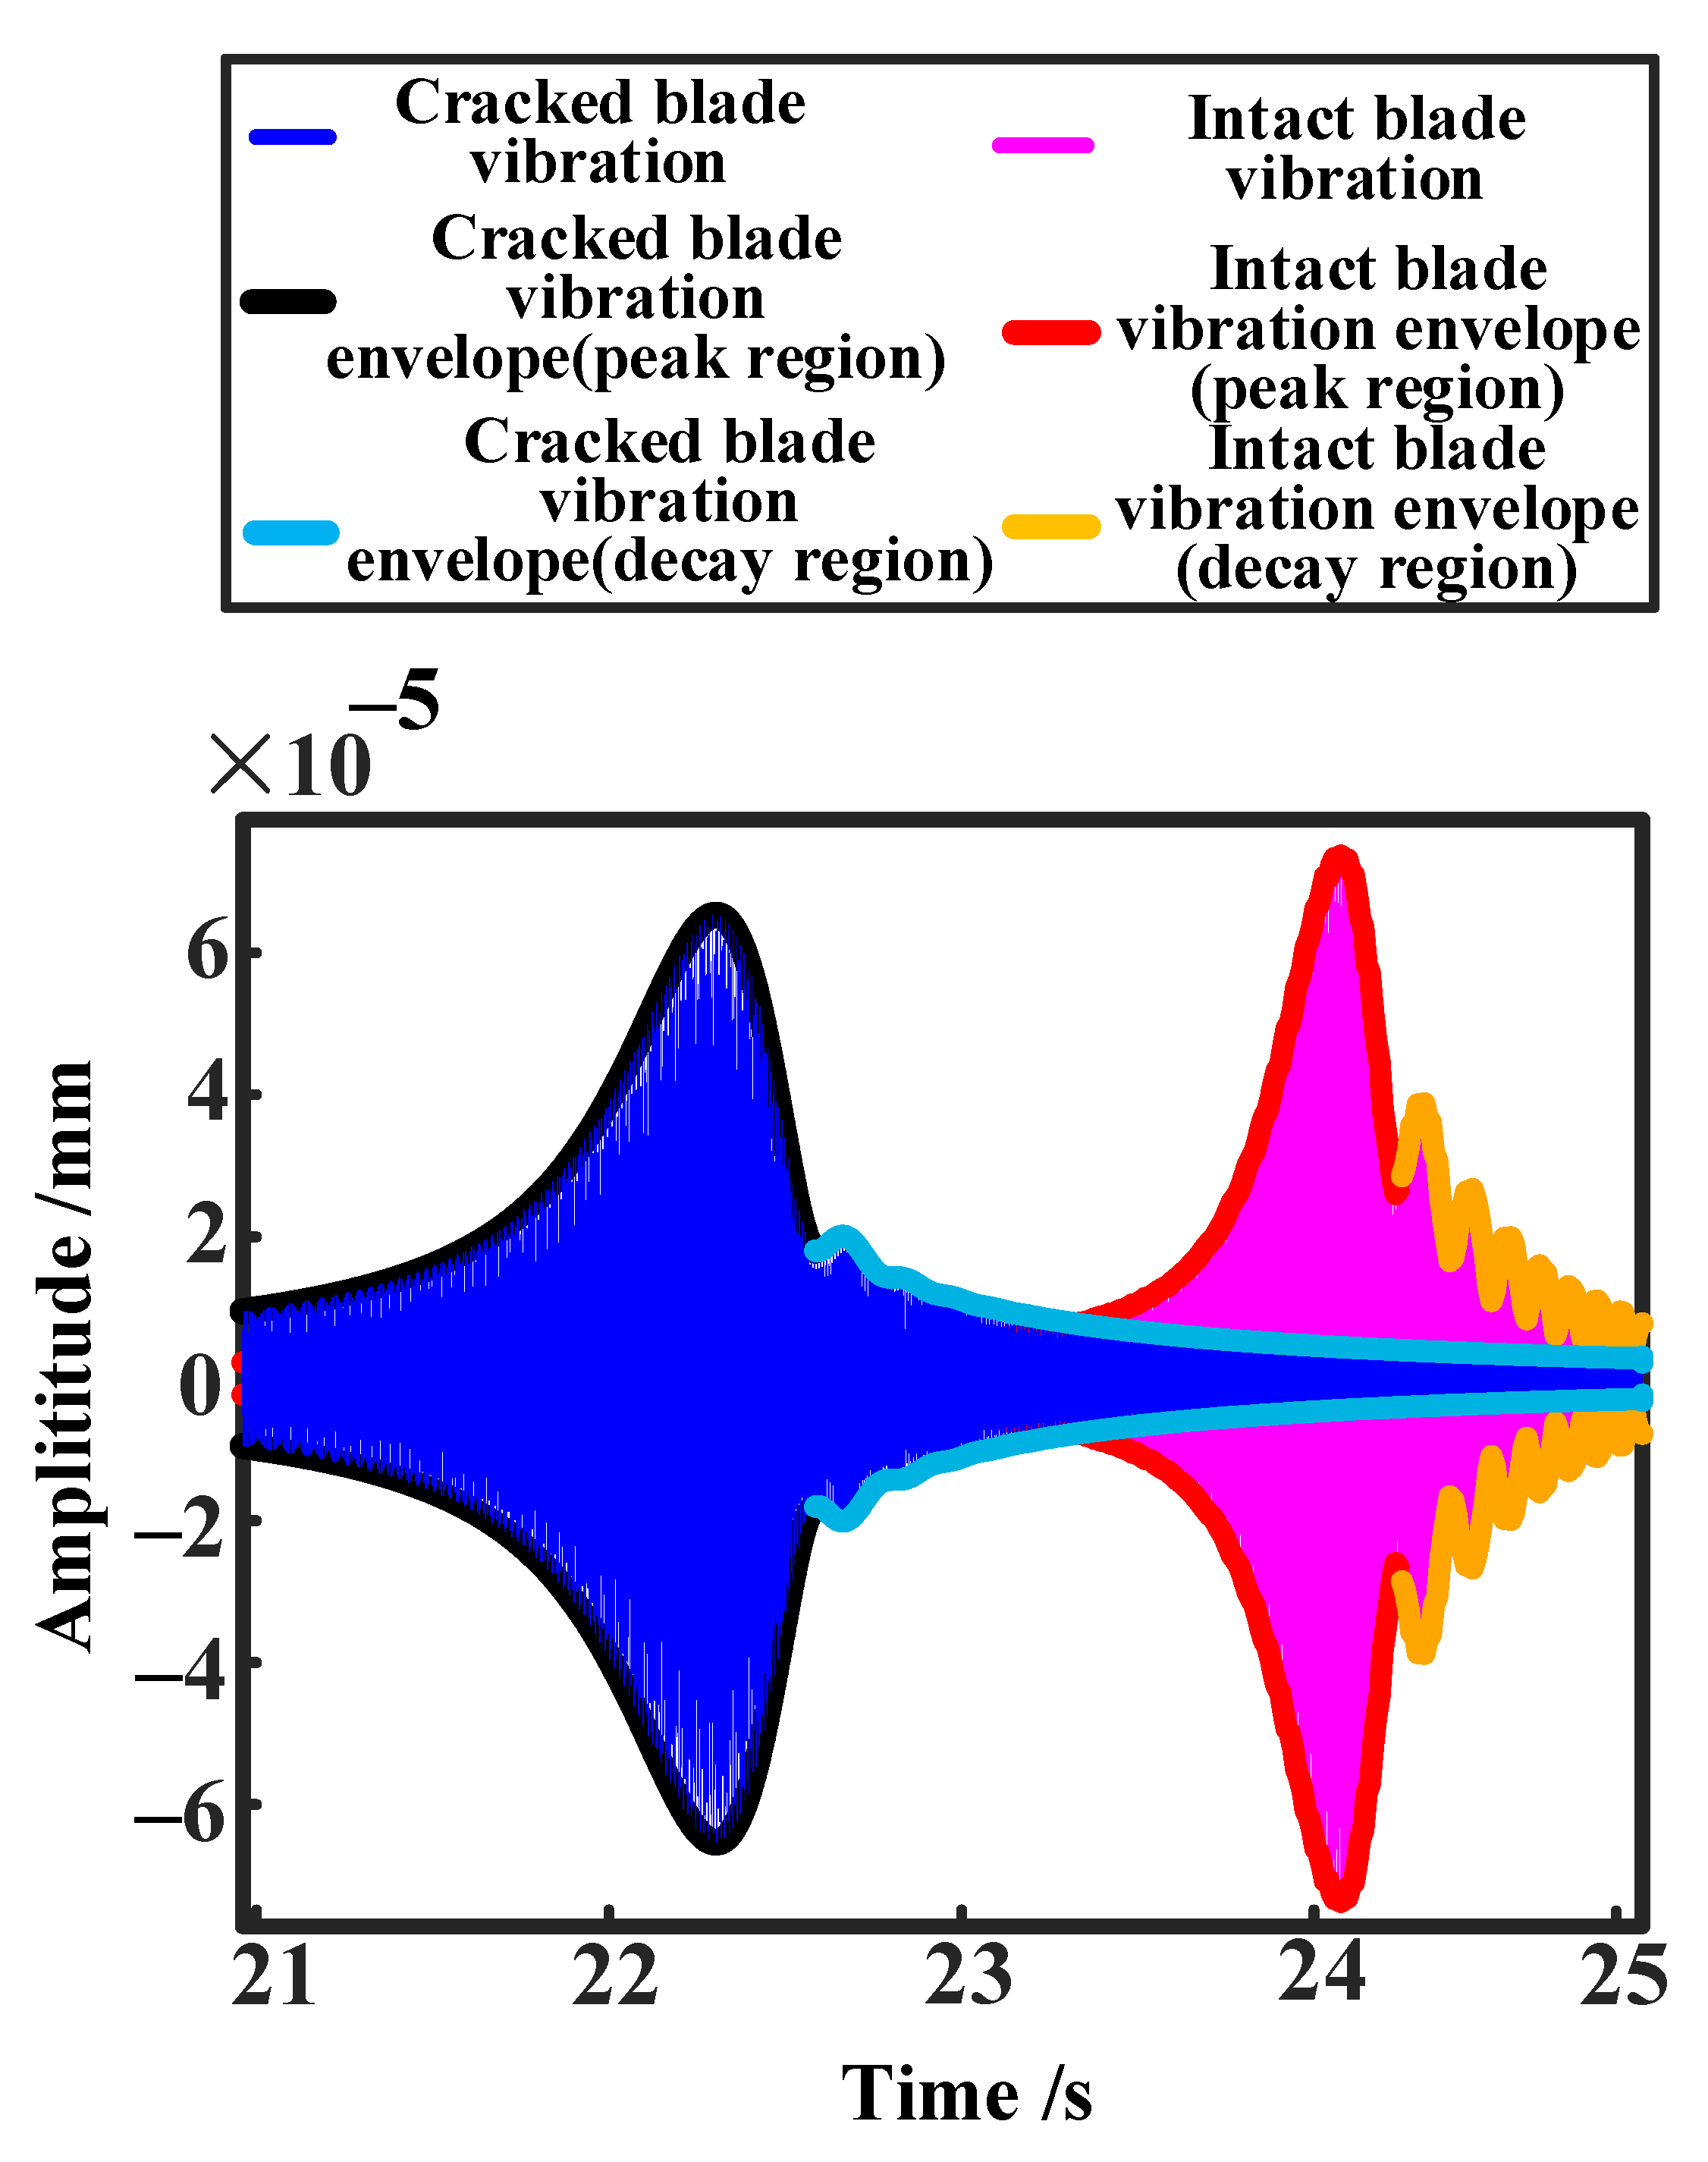
As shown in Figure 8, compared to the intact blade, the envelope of the cracked blade’s response signals exhibits asymmetric distortion in the resonance peak amplitudes (highlighted by the black trace) and a pronounced amplitude decay following the resonance peaks (highlighted by the blue trace). Consequently, the alterations in the blade’s dynamic response signals modify the shape of the signal envelope, which is directly correlated with crack-induced faults. These variations in the profile of envelope curves can thus serve as a diagnostic criterion for blade crack identification.

3. Numerical Simulation

In this section, the proposed characteristic EDIVR is comparatively evaluated against two conventional diagnostic characteristics: natural frequency and the frequency spectrum of response signals, focusing on crack detection performance. To quantify the differences in dynamic characteristics between cracked and intact blades, several indicators including DFD, FDR, and RHM were introduced. The results demonstrate that under identical noise interference and breathing cracks with equal depth and identical location, the EDIVR achieves superior fault detection sensitivity.

3.1. Quantitative Representation of Crack Effects on Dynamic Characteristics

According to the analysis in Section 2.2, the shape characteristics of the EDIVR can serve as a diagnostic criterion for distinguishing cracked blades from intact ones. However, due to the difficulty in obtaining an analytical solution for the crack dynamics model, only qualitative descriptions of these features are provided in this section. To quantitatively describe this characteristic, graphics-based analytical methods are employed. As illustrated in Figure 9a, the EDIVR is generated by selecting time windows to capture resonance-region response signals, extracting their envelope diagrams, and resizing the diagrams into fixed-pixel images for subsequent analysis.
The EDIVR characteristics are quantitatively characterized using the Distance of Fourier Descriptor (DFD), a digital image processing-based shape metric.
For the envelope diagram image shown in Figure 9b, the contour points starting from x 0 , y 0 are sequentially traversed in a counterclockwise direction to form a coordinate sequence s i = x i , y i , i = 0 , 1 , 2 , I 1 , where I is the total contour points, and each coordinate is represented as a complex number:
s i = x i + j y i
A discrete Fourier transform is applied to the coordinate sequence s i :
z u = i = 0 I 1 s i e j 2 π u i / I
where u = 0 , 1 , 2 , , I 1 , the vector Z, formed by complex coefficients z u , is termed the Fourier descriptors (FDs) [28] of the EDIVR. The FD exhibit rotation and translation invariance and are independent of the curve’s starting point. Normalization is applied to the FD as follows:
Z ^ = Z Z
The differences between the EDIVRs of different blades can be quantified using the Euclidean distance between their FDs:
d Z ^ I , Z ^ C = Z ^ I Z ^ C
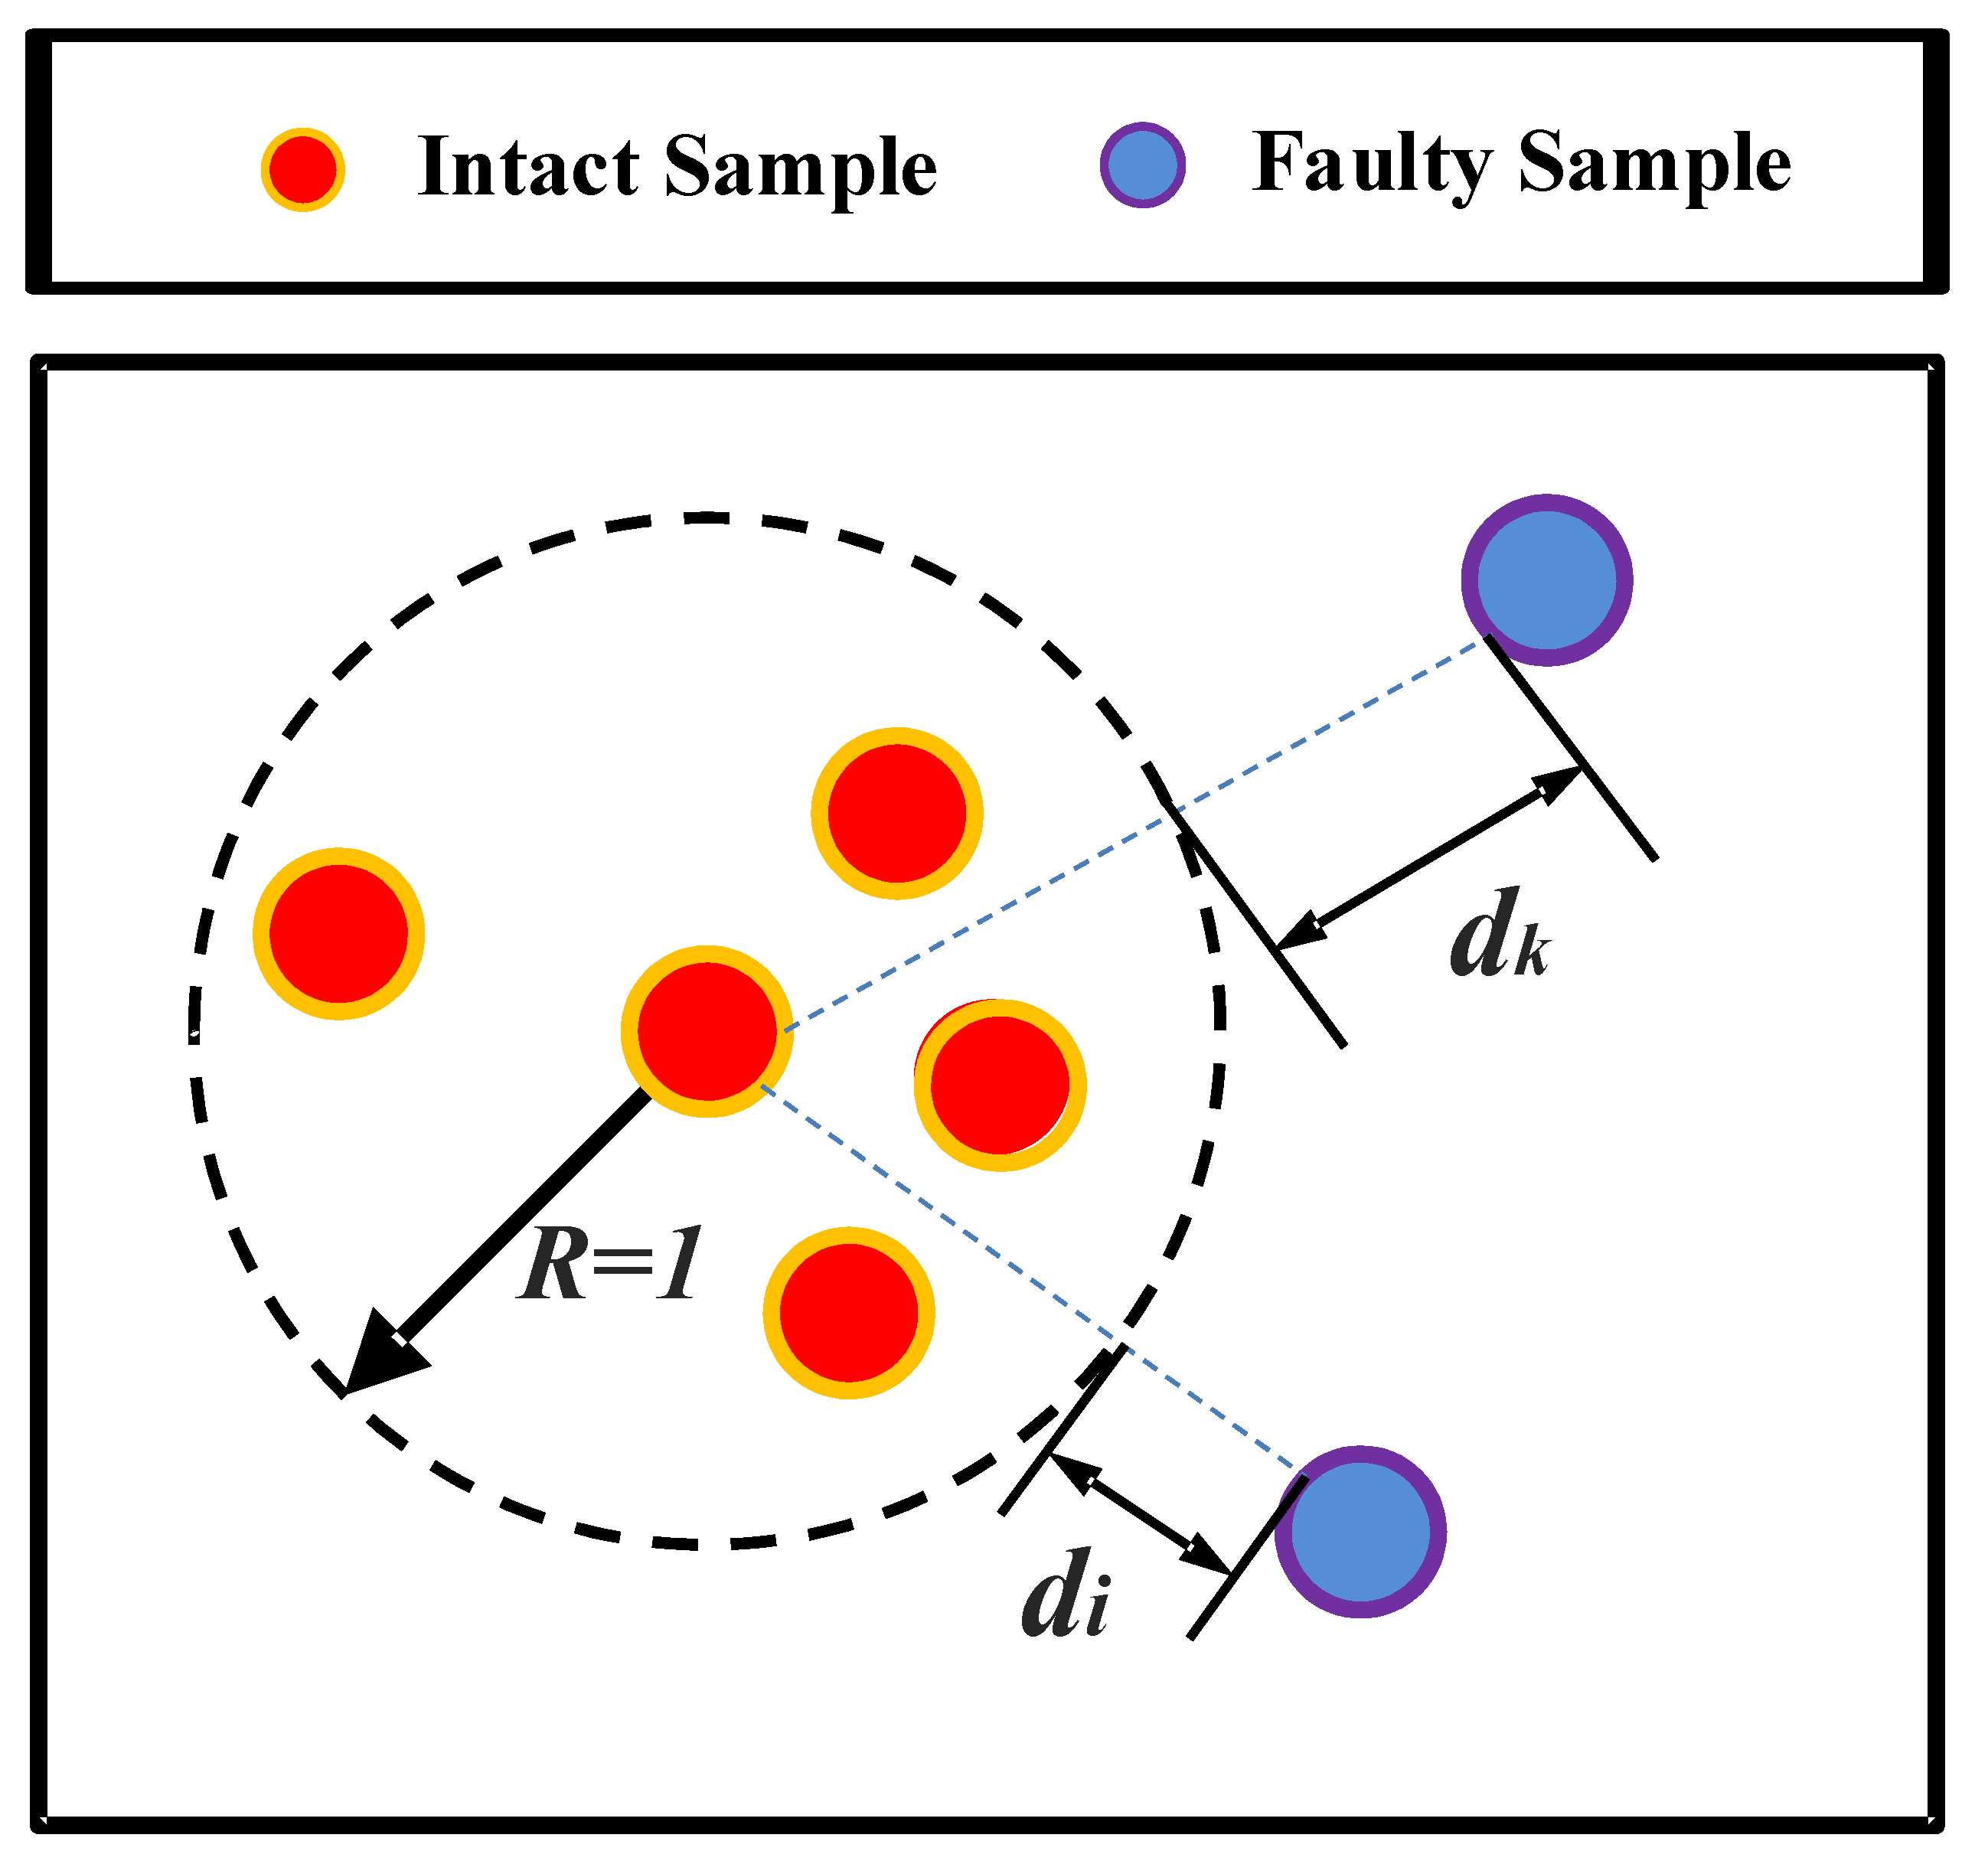
where Z ^ I and Z ^ C denote the Fourier descriptors of intact and cracked blades, respectively. For normalized FDs, a Euclidean distance threshold of 1 is established [28]: distances below this value indicate identical shape categories, whereas distances greater than 1 indicate different types of shapes. Consequently, to detect cracked blades, the Distance of Fourier Descriptor (DFD) is defined as follows:
D F D = d Z ^ I , Z ^ C 1
Based on the analysis in Section 2.2, the cracked fault blade shows a noticeable difference in the shape of the EDIVR compared to an intact blade. The DFDs of the intact and cracked fault blades are illustrated in Figure 10.
In fault diagnosis for cracked blades, two traditional dynamic characteristics are commonly utilized for crack identification. Firstly, the presence of a crack reduces the natural frequency of the blade [7]. Secondly, under harmonic excitation, the response signal of a cracked blade exhibits superharmonic or subharmonic components [17]. Therefore, two indicators are defined to quantify these characteristics:
The crack-induced natural frequency shift is defined as the Frequency Decline Ratio (FDR):
F D R = f c r a c k f 0 f 0
where fcrack and f0 denote the natural frequencies of intact and cracked blades, respectively.
To evaluate the amplitude ratios of superharmonic and subharmonic components relative to the fundamental frequency, the indicator Relative Harmonic Magnitude (RHM) is defined, with its schematic illustrated in Figure 11. The expression is formulated as follows:
R H M = i = 1 s A n i A b
where Ab is the amplitude of the basic harmonic component, Ani is the magnitude of super- or sub-harmonic components, s is the number of abnormal frequency components.
The three indicators defined in this subsection quantitatively characterize the crack-induced nonlinear dynamic features of blades, establishing a set of indicators for crack fault diagnosis.

3.2. Comparison of Dynamic Characteristics for Crack Detection

3.2.1. Effects of Crack Depth

This section investigates variations in three dynamic indicators for edge cracks and surface cracks under different depths. A steel blade (80 mm in length, 40 mm in width, and 2 mm in thickness) is modeled to calculate blade tip displacement responses, from which the dynamic indicators are derived. A frequency sweep test with a rate of 10 Hz/s is conducted to capture resonance-region displacement responses. When the blade’s excitation frequency matches its resonance frequency, the blade tip amplitude reaches peak values. Consequently, the frequency corresponding to the amplitude peak closely approximates the blade’s natural frequency. In engineering practice, for rotor blades, sensors such as Blade Tip Timing sensors and strain gauges can be used to record the moments when the blade’s vibration amplitude reaches its peak. Subsequently, algorithms like the circumferential Fourier method [4] or two-parameter methods [5] can be applied to calculate the blade’s vibration frequency at those moments. The natural frequency is determined as the peak frequency in the response spectrum. When the excitation frequency approaches half the natural frequency, pronounced superharmonic resonance becomes highly probable [29]. Therefore, a 120 Hz excitation is selected to compute the tip displacement response spectrum for obtaining the RHM.
Figure 12 illustrates the schematic configurations of blades with edge-penetrating cracks and surface cracks. A comparative analysis is conducted to evaluate variations in dynamic indicators (e.g., DFD, FDR, RHM) across different crack depths.
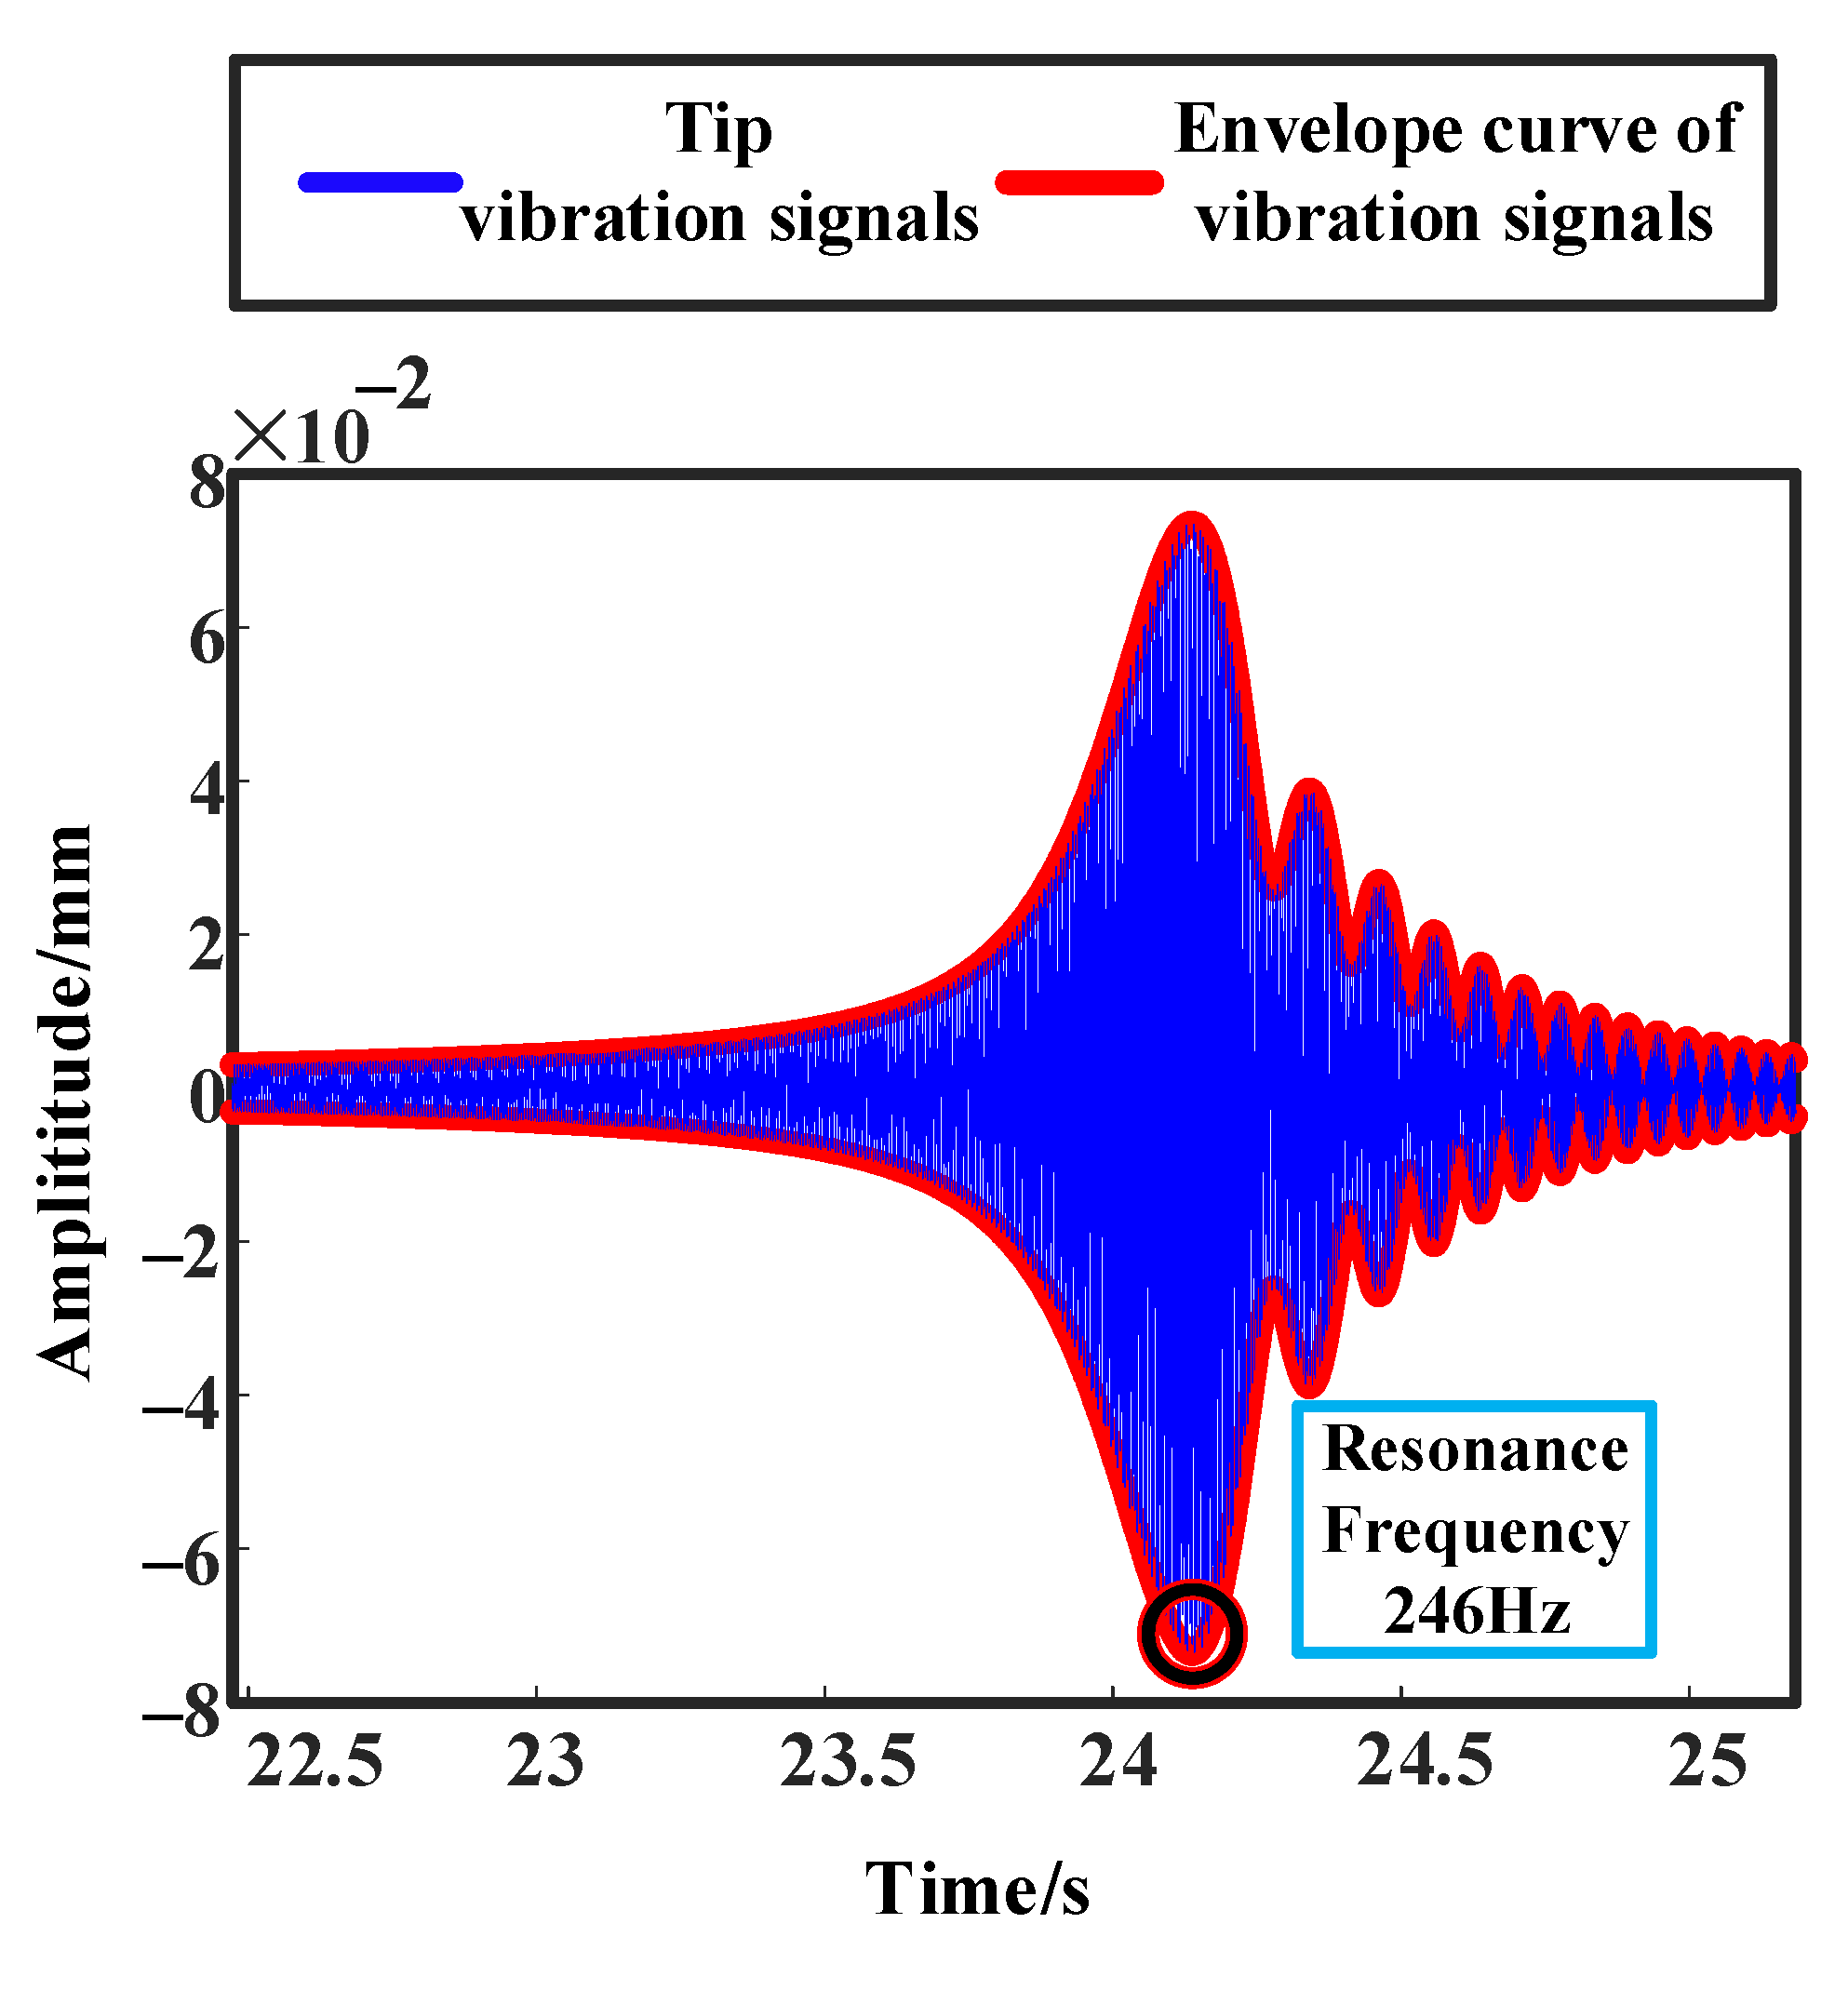
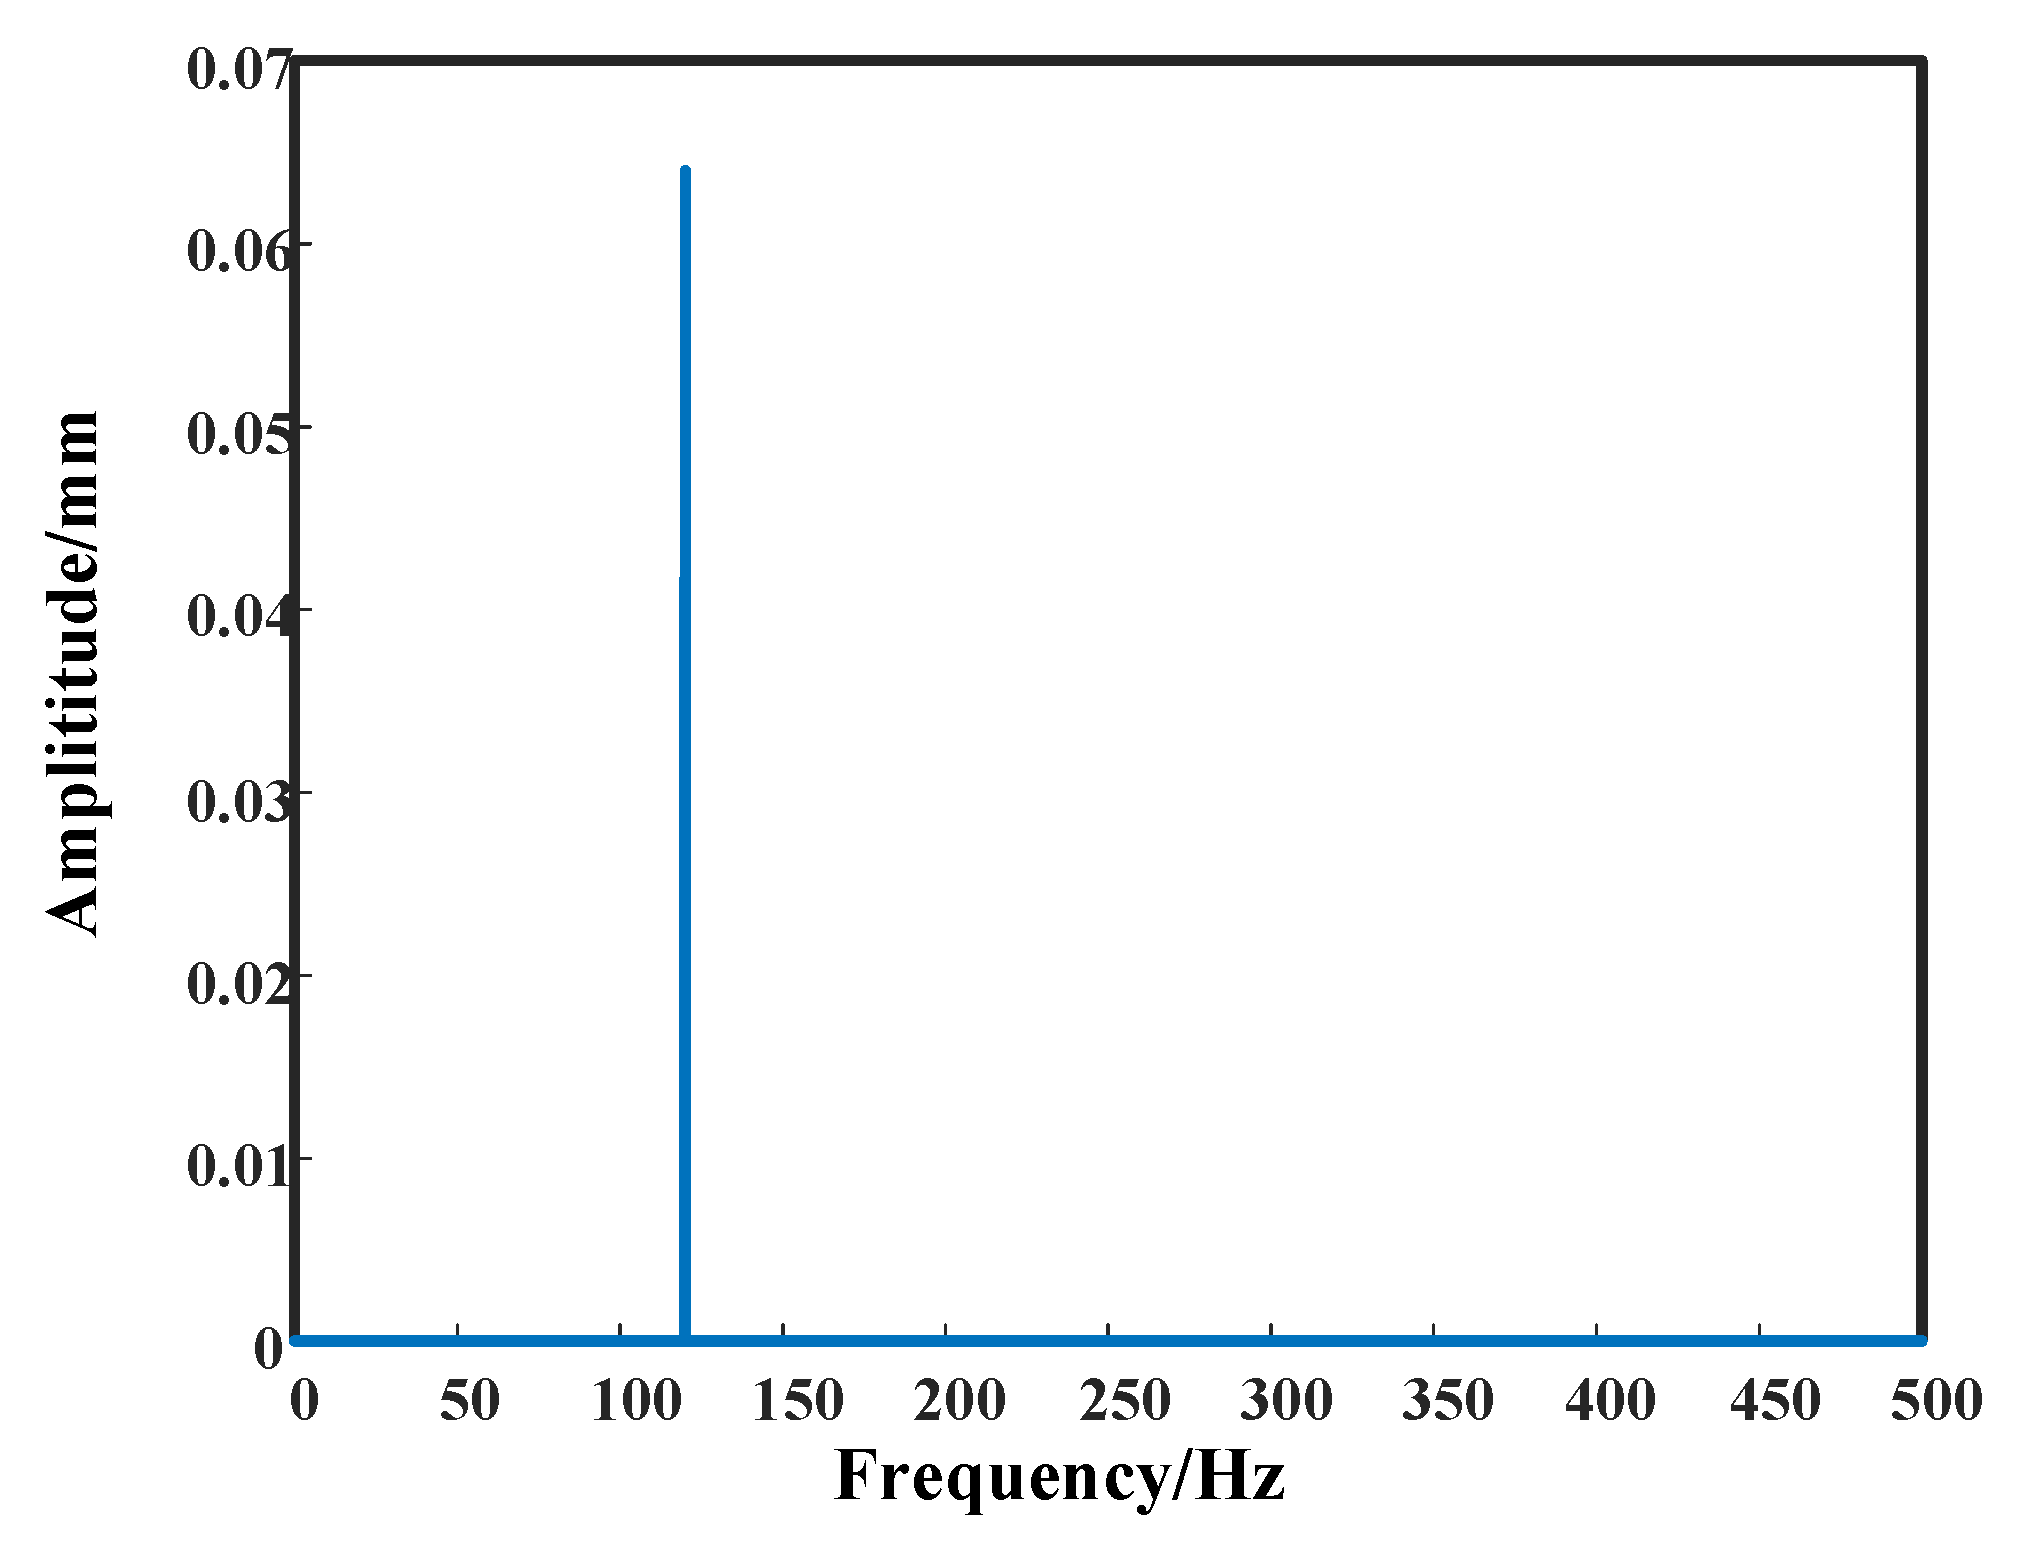
Initially, dynamic response analysis was performed on an intact blade. The vibration response under run-up conditions is shown in Figure 13, and the frequency spectrum of the response signal under single-frequency harmonic excitation is presented in Figure 14.
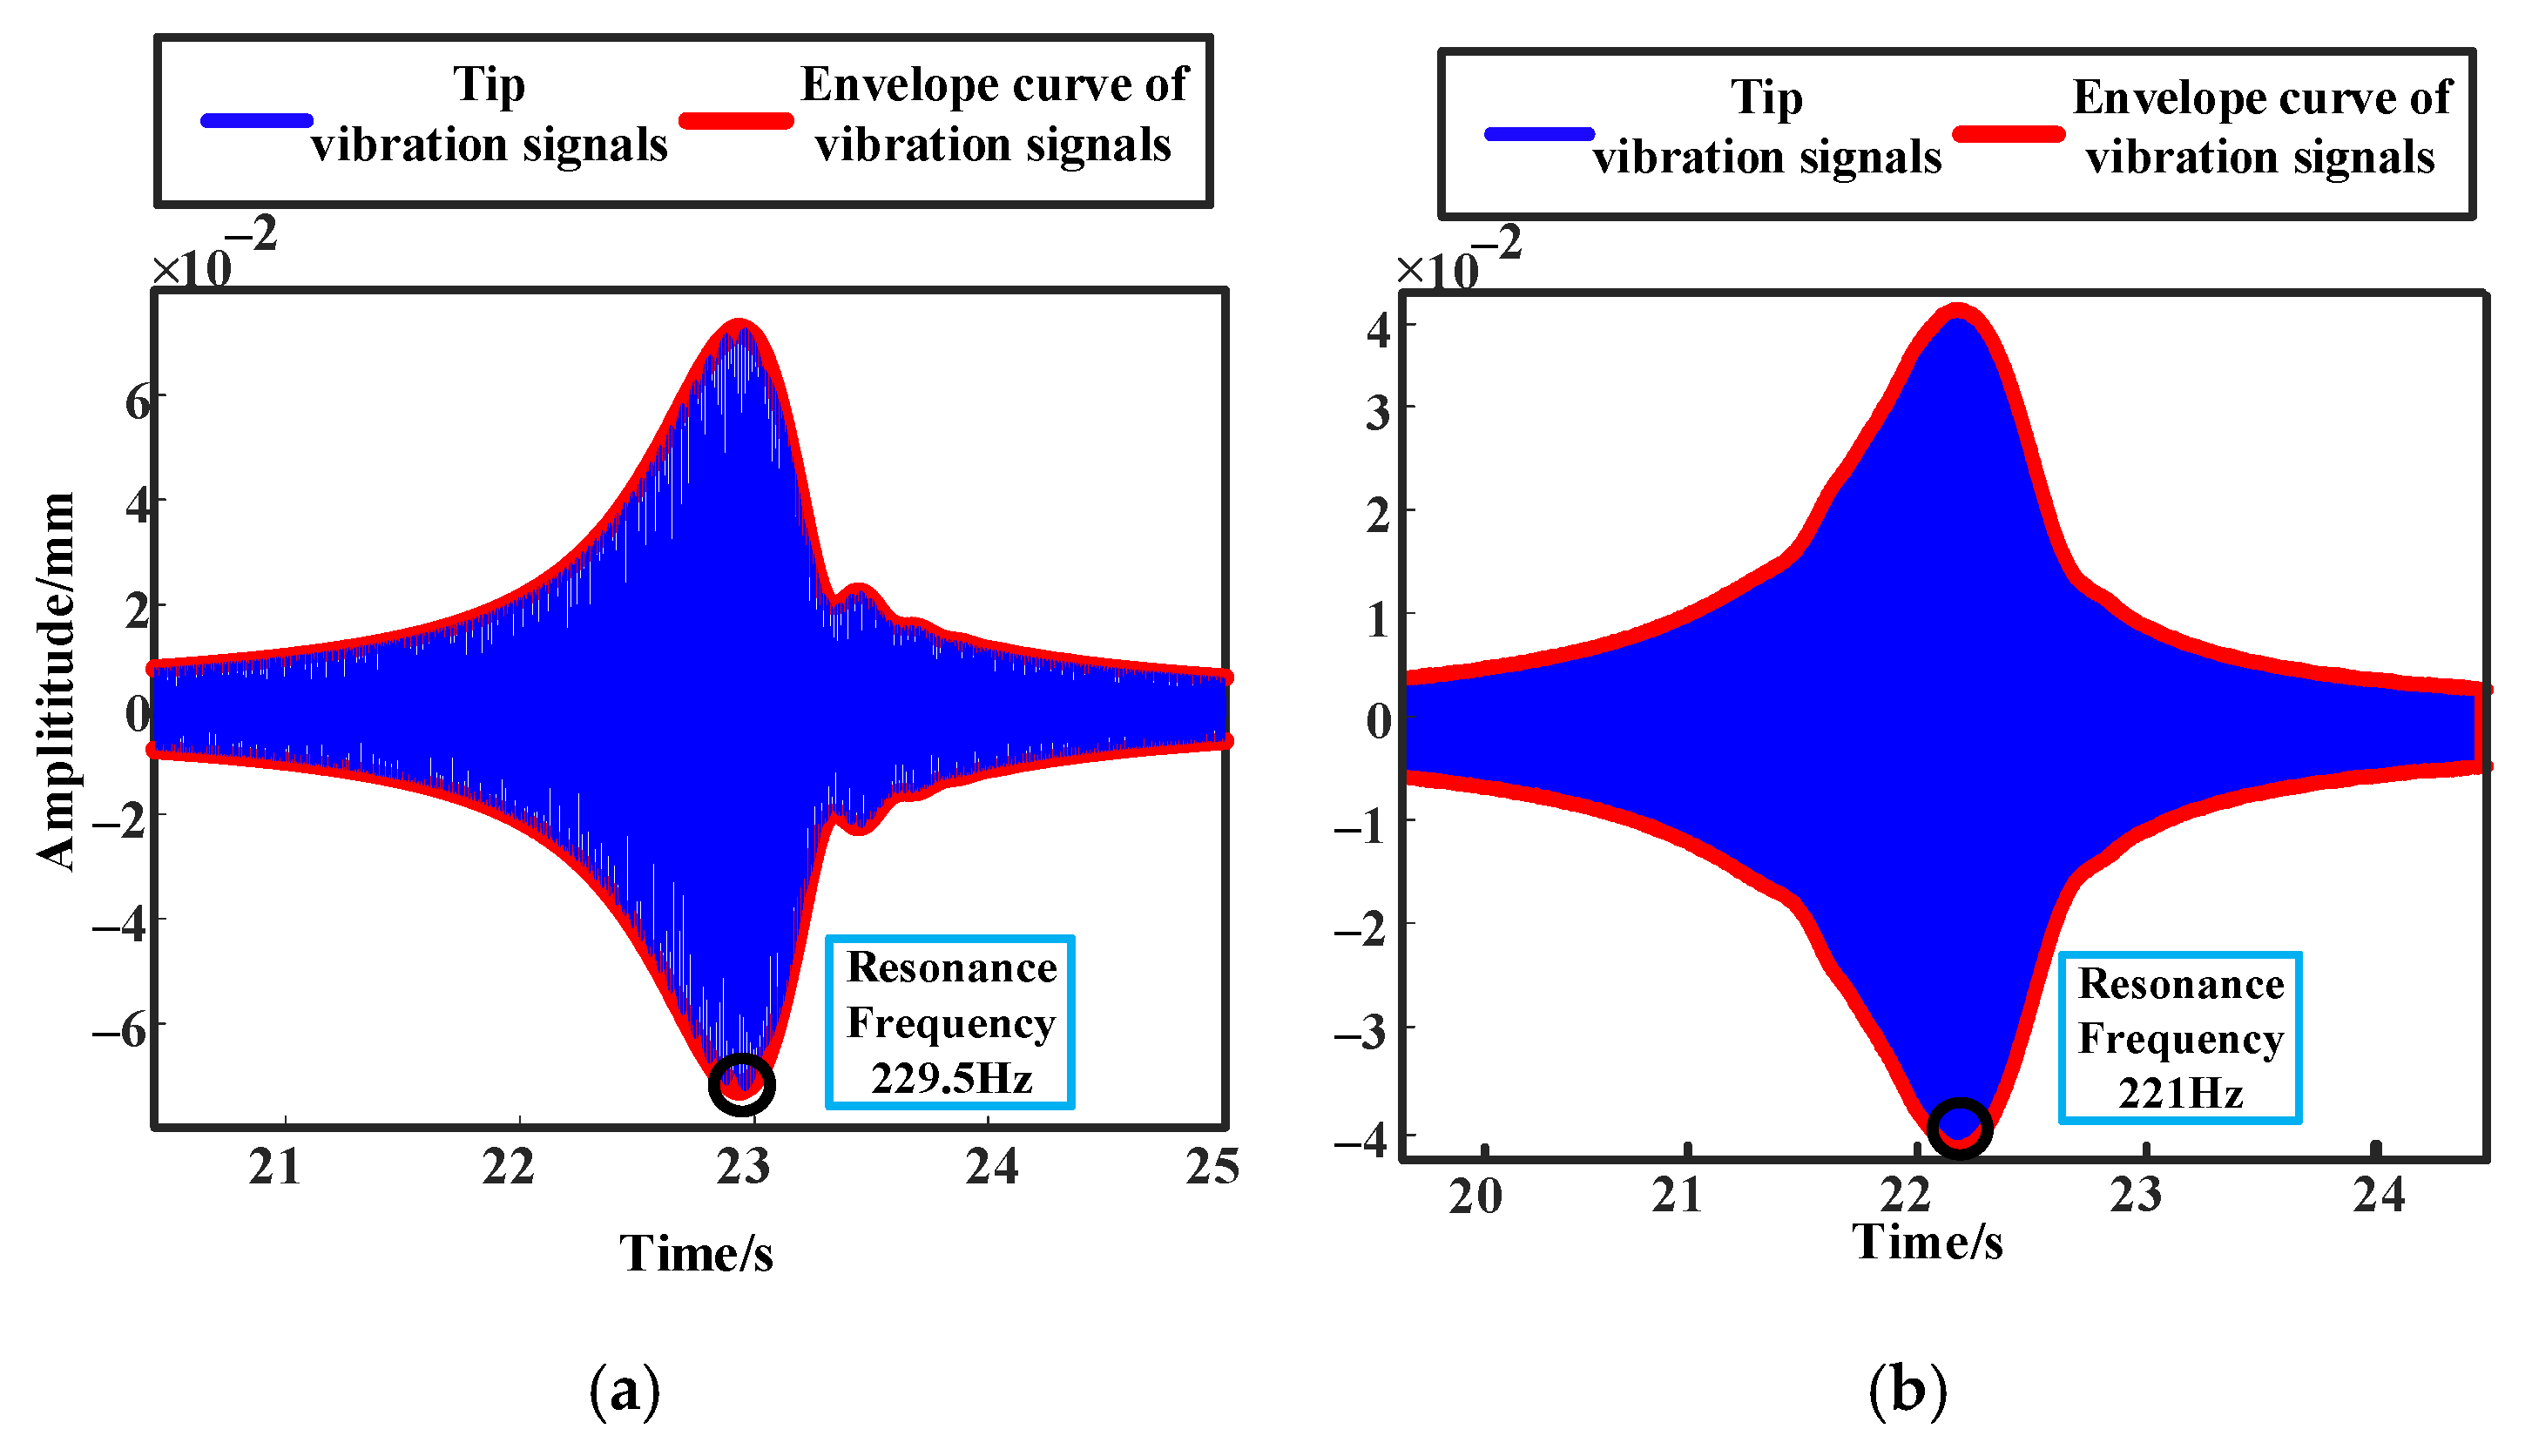
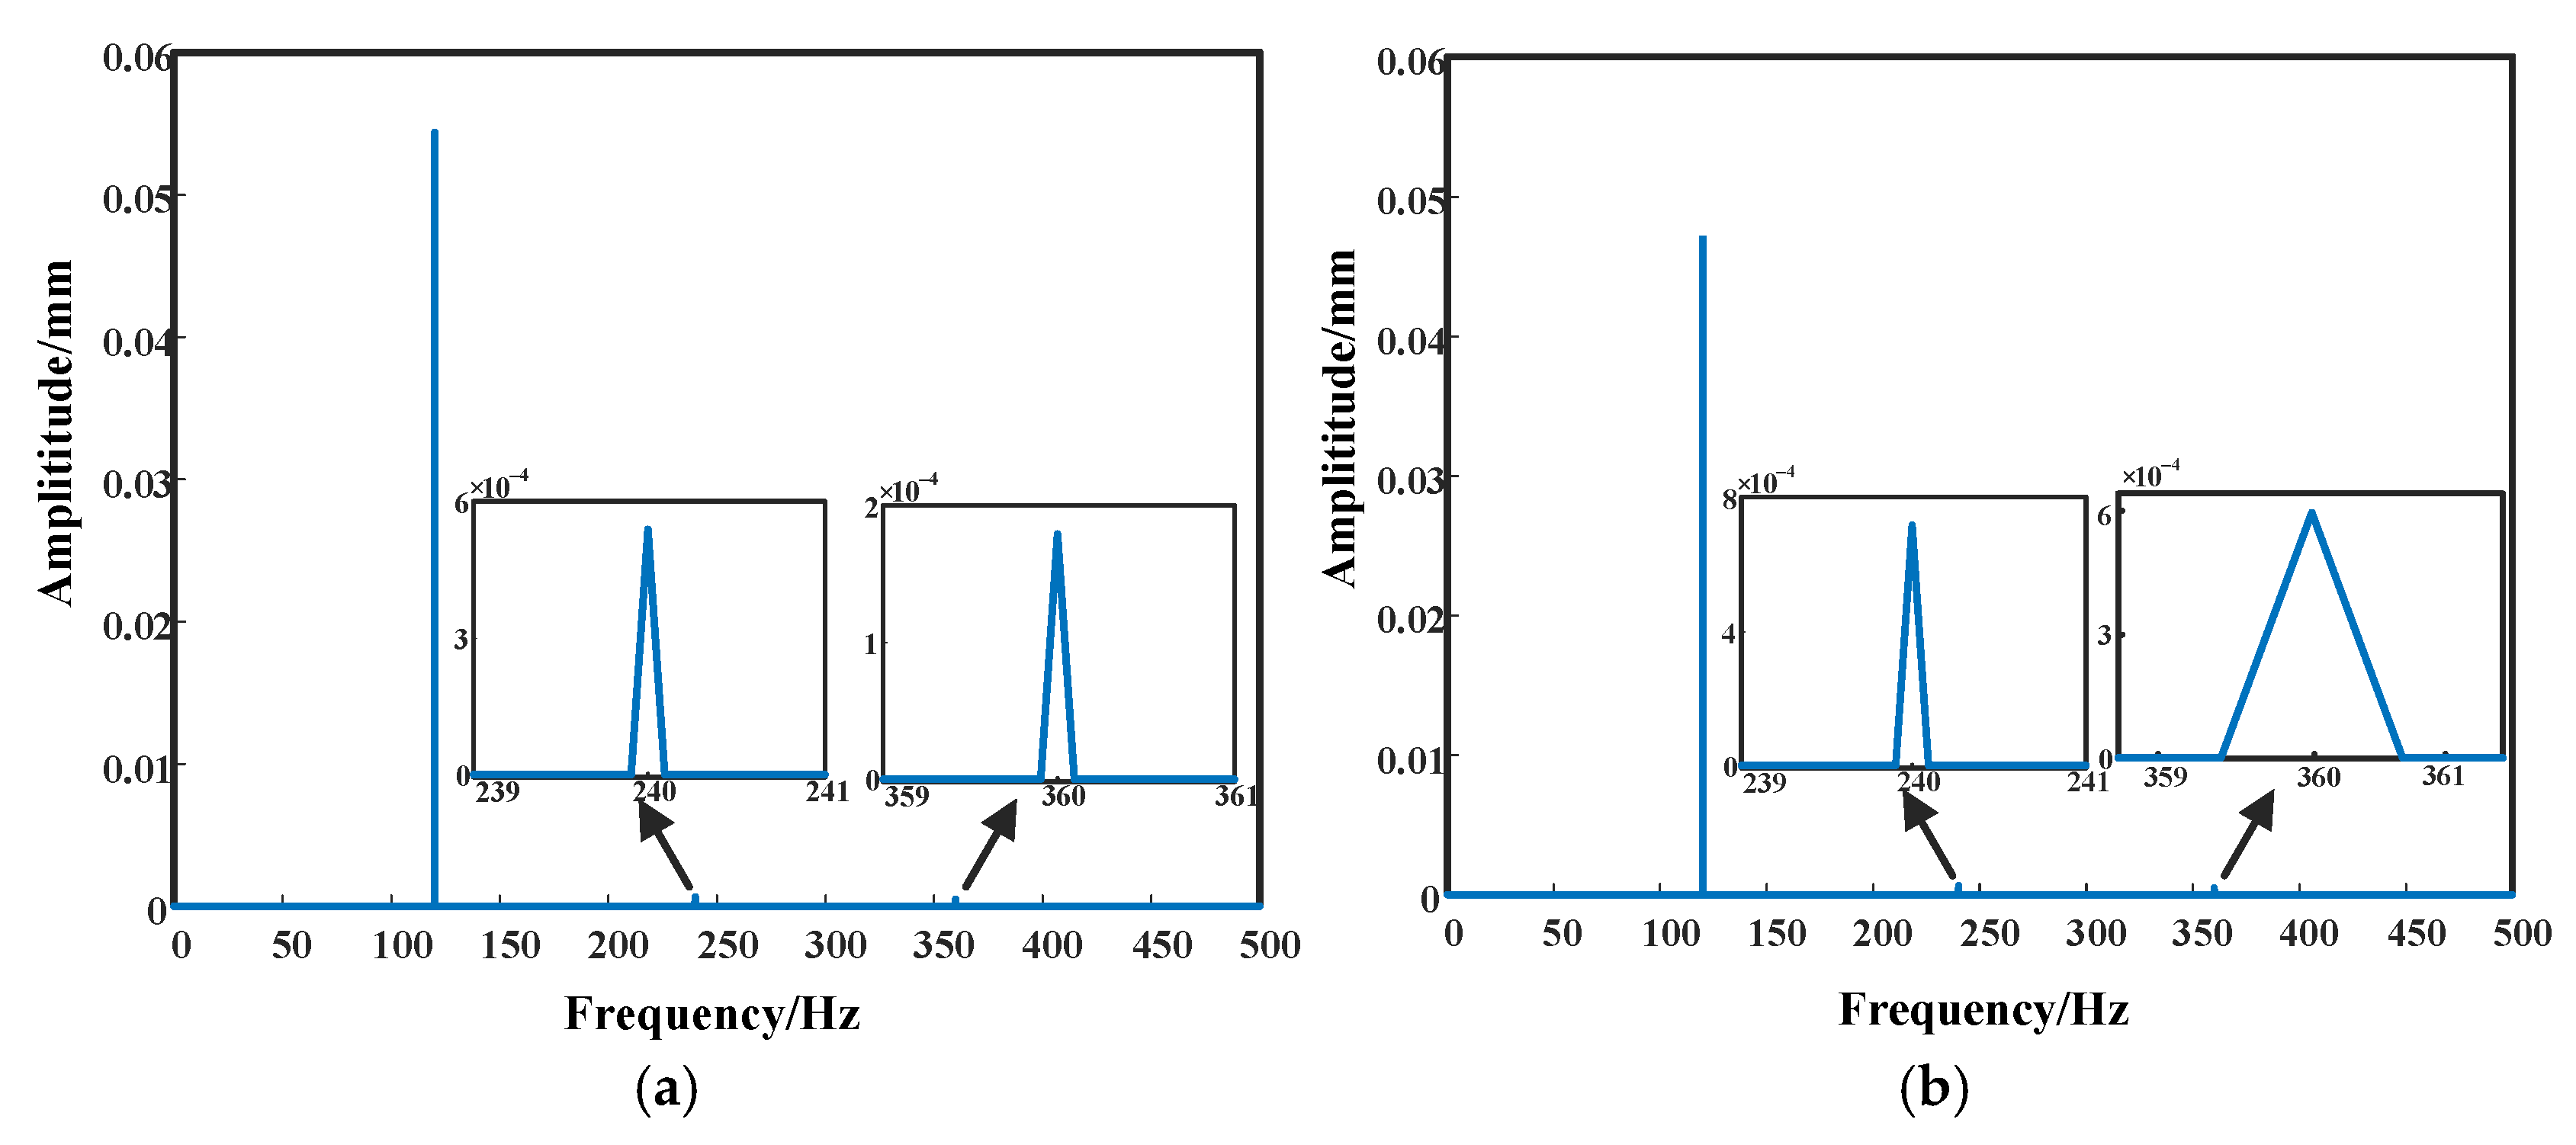
As shown in the above two figures, the envelope of the intact blade’s vibration response at resonance exhibits symmetry, with no additional frequency components beyond the excitation frequency in the spectrum. For cracked blades, the DFD was calculated using the Fourier descriptor distance between the envelope diagram images (as shown in Figure 10). The FDR was determined by comparing the peak response frequency with the intact blade’s reference frequency of 246 Hz. All cracks were positioned at γ = 1/2. Surface crack depths ranged from 0.5 mm to 1 mm in 0.25 mm increments, while edge crack depths increased from 2 mm to 10 mm in 2 mm increments. Dynamic characteristic parameters for each crack depth are summarized in Table 1. Corresponding response signal plots for both crack types across varying depths are shown in Figure 15, Figure 16, Figure 17 and Figure 18.
By integrating Figure 15, Figure 16, Figure 17 and Figure 18 and Table 1, the following conclusions are drawn.
(1)
Among the three indicators for crack diagnosis, the DFD exhibits the most significant variation under identical crack conditions. For a given crack type, increasing depth reduces the natural frequency (raising the FDR), induces superharmonic components (increasing the RHM), and distorts the resonance envelope shape (increasing the DFD). All three parameters grow with crack depth, validating their utility as diagnostic criteria. However, the value of DFD substantially exceeds those of the RHM and FDR, making it a more robust decision-making indicator to minimize misjudgment in engineering practice.
(2)
During initial crack stages, the DFD demonstrates superior sensitivity compared to the RHM and FDR. Envelope analysis reveals that crack depth primarily alters post-resonance oscillation shapes, while any crack presence causes asymmetry in the shape of resonance peak, elevating the DFD above 0.2. In contrast, the RHM remains negligible (merely 0.029 even at maximum surface crack depth). The FDR increases notably with deeper cracks (up to 0.101), but its sensitivity to incipient cracks is limited (only 0.033 for both surface and edge cracks).
(3)
With increasing crack depth in the blade, the decay rate of the vibration envelope beyond the resonance peak exhibits a corresponding acceleration. This phenomenon is identified as the primary factor contributing to distinct DFD among blades with varying crack depths. However, the shape of the envelope curve at the resonance peak demonstrates insensitivity to crack depth progression. Instead, it shows a pronounced deviation from the crack-free condition when a crack appears.

3.2.2. Effects of Crack Location

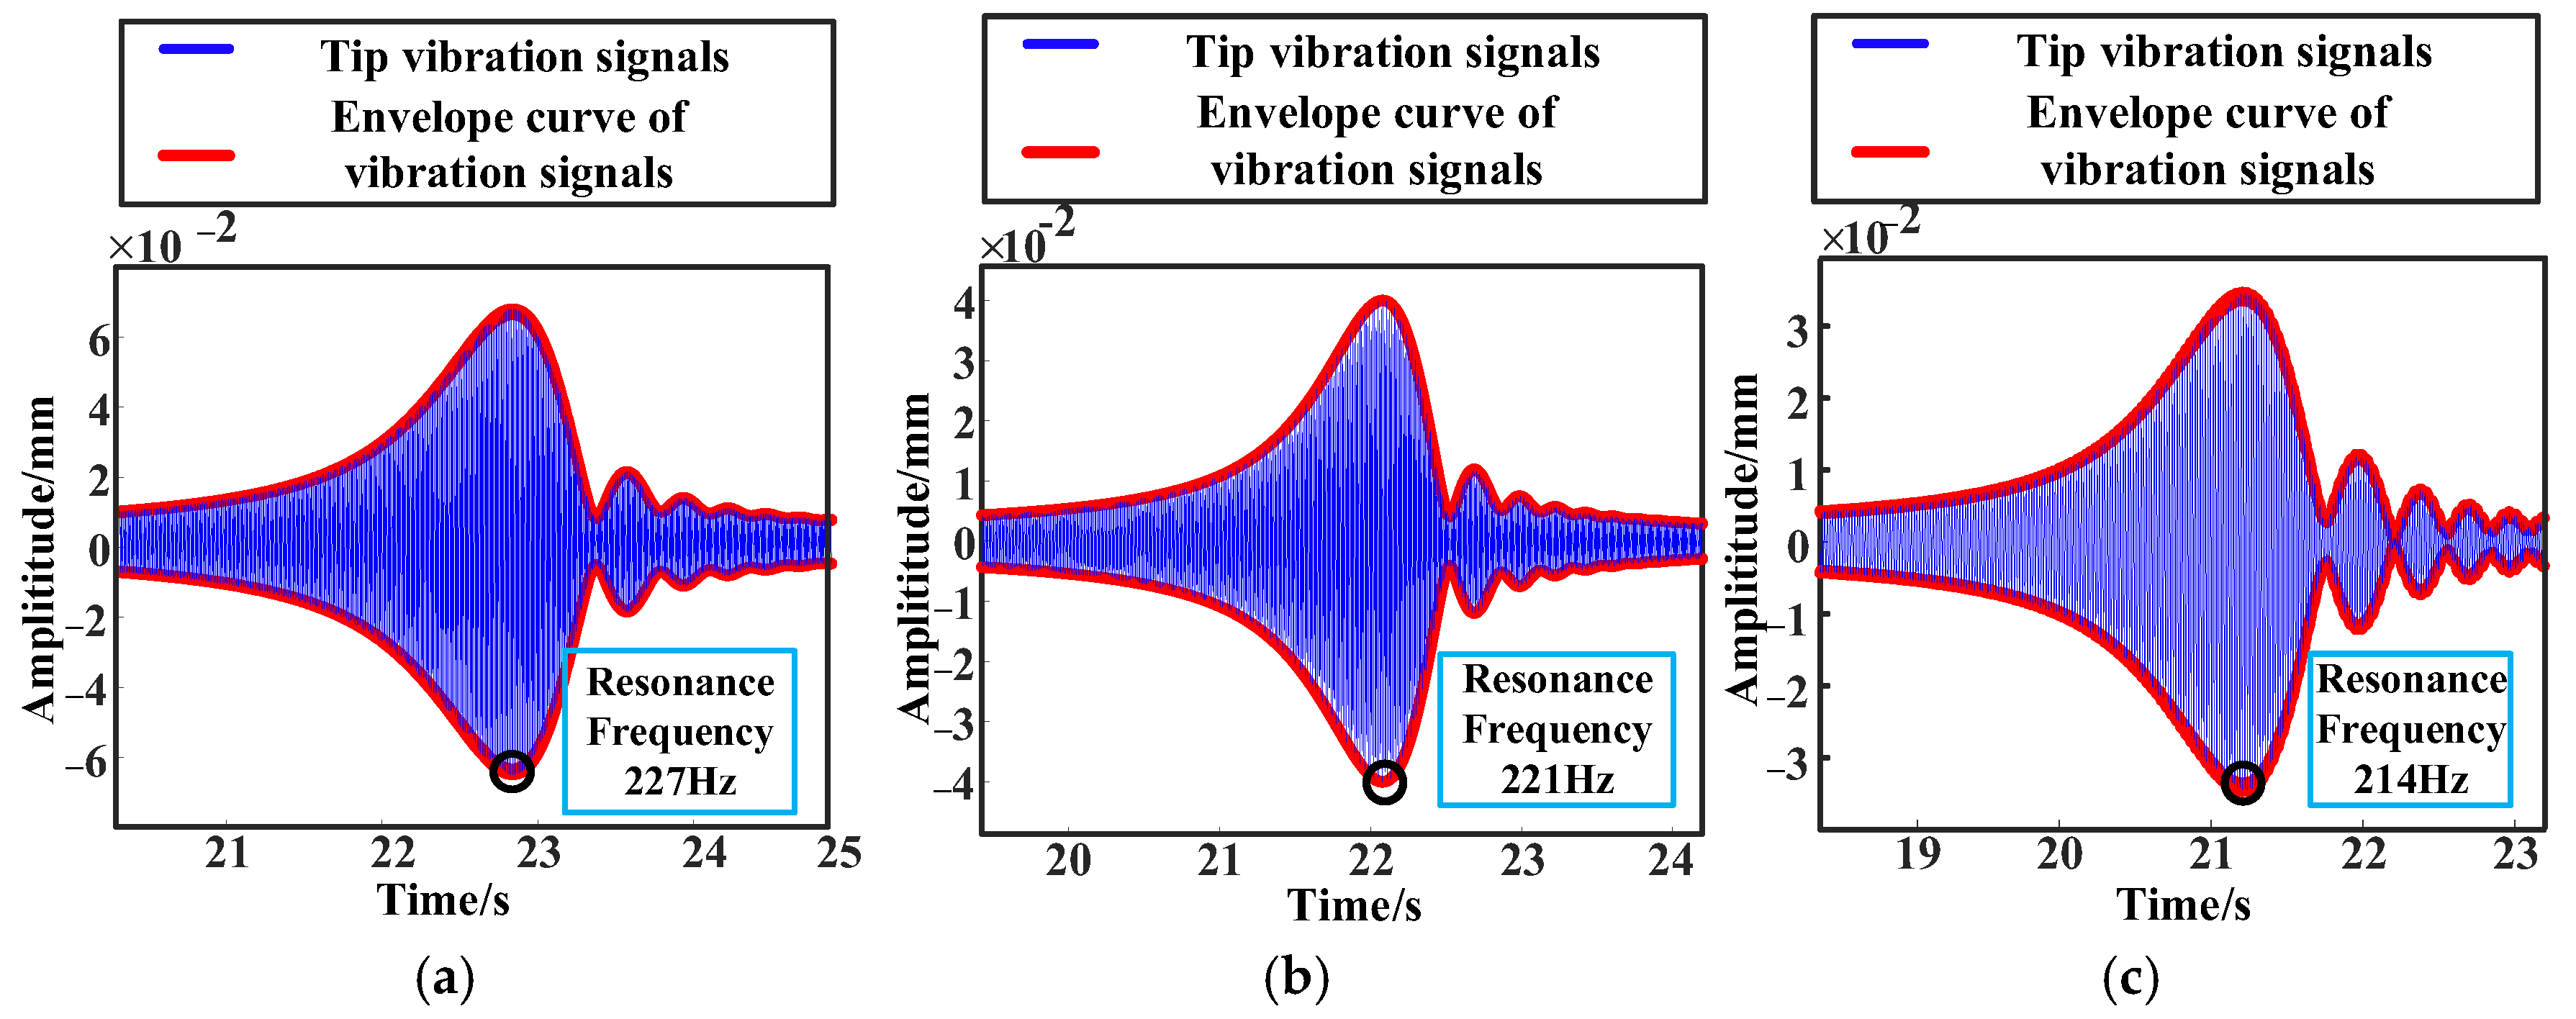
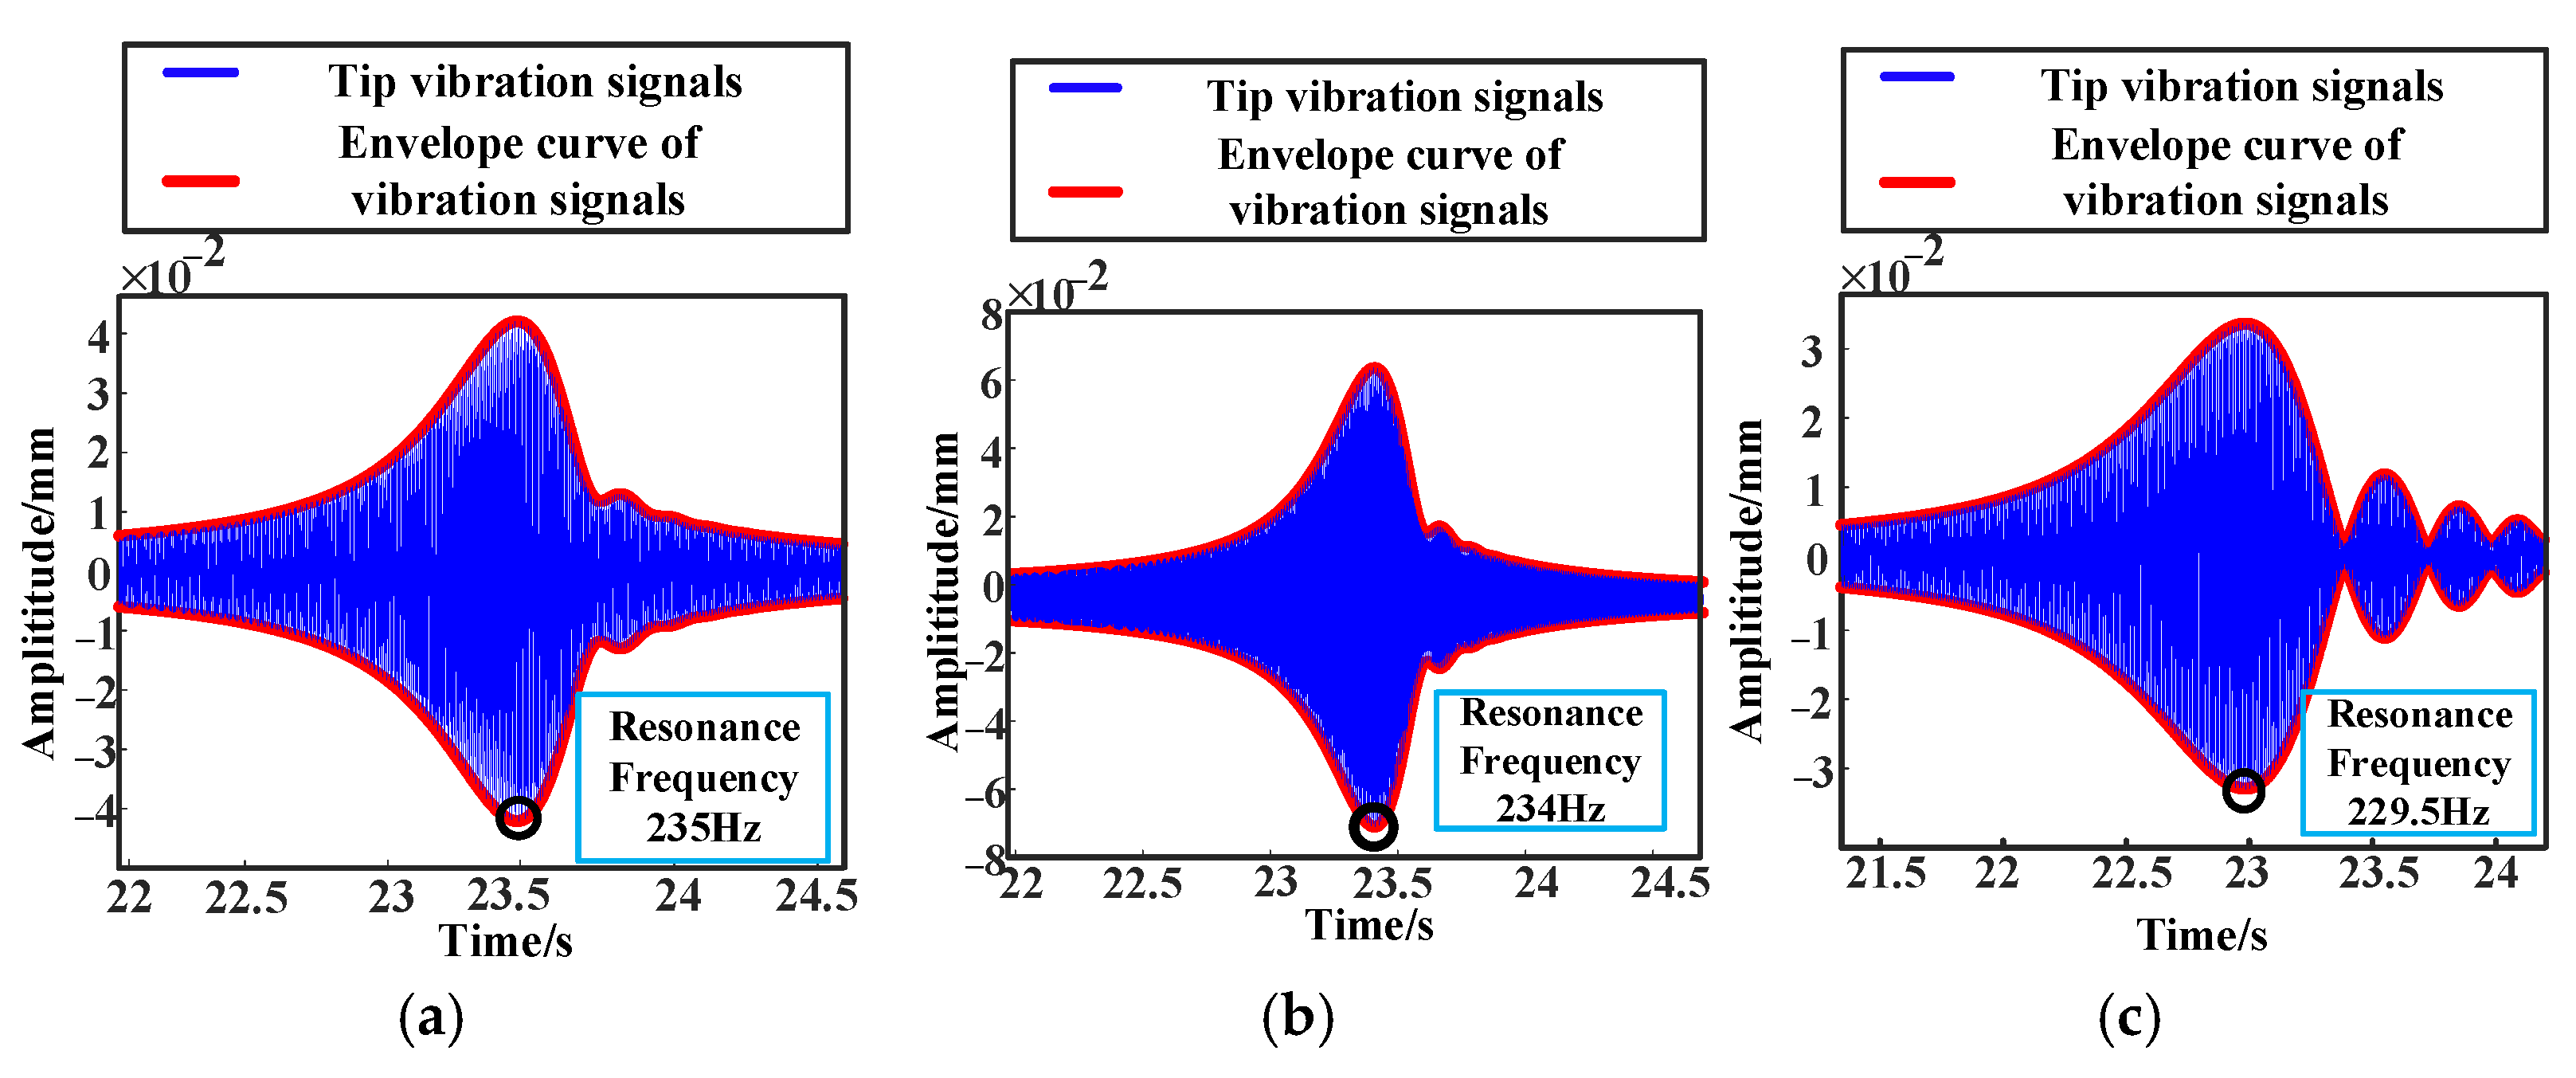
In this study, the variations in the dynamic characteristics of the same blade type under different crack positions were investigated. The crack location parameter γ ranges from 1/3 to 2/3, with blade excitation conditions consistent with Section 3.2.2. The resonance-region displacement responses and frequency spectra for blades with varying crack positions are shown in Figure 19, Figure 20, Figure 21 and Figure 22. The corresponding dynamic characteristic indicators are summarized in Table 2.
Based on Figure 19, Figure 20, Figure 21 and Figure 22 and Table 2, the following conclusions were summarized.
(1)
When cracks are located closer to the blade root (γ increasing from 1/3 to 2/3), all dynamic indicators increase. Notably, the value of DFD consistently retains the highest across different crack locations.
(2)
Compared to crack depth, positional variations induce smaller deviations in all three indicators. Sensitivity to crack position differs across indicators: the DFD shows minimal sensitivity, with only a 0.03 increase for surface cracks of identical depth moving from the blade tip (γ = 1/3) to the root (γ = 2/3). In contrast, the FDR demonstrates higher positional sensitivity, rising by 0.023 for edge cracks and 0.053 for surface cracks under equivalent positional shifts.
Regardless of crack type, depth, or position, the EDIVR characteristic (represented by DFD) provide the most effective criterion for crack diagnosis compared to natural frequency deviations and spectral anomalies.

3.2.3. Effects of Signal Noise

This section investigates the robustness of dynamic features under noise interference. Figure 23 displays the vibration response signal of a blade containing a 6 mm edge crack, which was simulated under noise-free conditions following the excitation load described in Section 3.2.3. White noise of varying intensities, corresponding to signal-to-noise ratios (SNR) ranging from 5 dB to 30 dB, was injected into the vibration signals. Since the natural frequency is an intrinsic property of the blade and independent of response signals, only the robustness of the DFD and RHM was analyzed here.
White noise was introduced into single-frequency excitation response signals, and the resulting frequency spectra are shown in Figure 24. Superharmonic frequency components, which serve as critical spectral signatures for crack detection, were increasingly dominated by noise at higher interference levels. This degradation directly prevents the extraction of the RHM, as shown in Figure 24. Consequently, relying on anomalous frequency components in single -frequency excitation responses for crack diagnosis demonstrates insufficient robustness, as significant measurement noise in engineering environments can lead to inaccurate diagnostic assessments.
As shown in Figure 25, the EDIVR characteristics of blades are presented under run-up working conditions with noise interference. The results reveal that the EDIVR characteristics exhibit strong robustness against such noise. Since these features are derived solely from the envelope diagrams of response signals, the overall contour shape remains minimally altered even at SNR = 5 dB, allowing for the clear visual identification of crack-induced EDIVR patterns.
The dynamic characteristic values corresponding to different SNR levels are summarized in Table 3. As shown in Table 3, for identical crack conditions, the EDIVR characteristics and their indicator DFD exhibit significantly superior diagnostic accuracy compared to the RHM under noise interference. Notably, the DFD retains a value of 0.21 even at SNR = 5 dB, surpassing the RHM (0.024) and FDR (0.067) values obtained under noise-free conditions. These results confirm the strong robustness of the proposed EDIVR features in crack diagnosis applications, particularly in noisy engineering environments.

4. Experimental Validation

In this section, the effectiveness and sensitivity of the EDIVR feature in detecting cracks are demonstrated through the preparation of two typical types of blade cracks: edge cracks and surface cracks. Vibration tests were conducted on the blades to record their displacement responses. Subsequently, a comparison was made between the dynamic response characteristics before and after the introduction of the cracks. This analysis confirms the utility of EDIVR as a diagnostic characteristic for identifying cracks in turbine blades.

4.1. Experiment Description

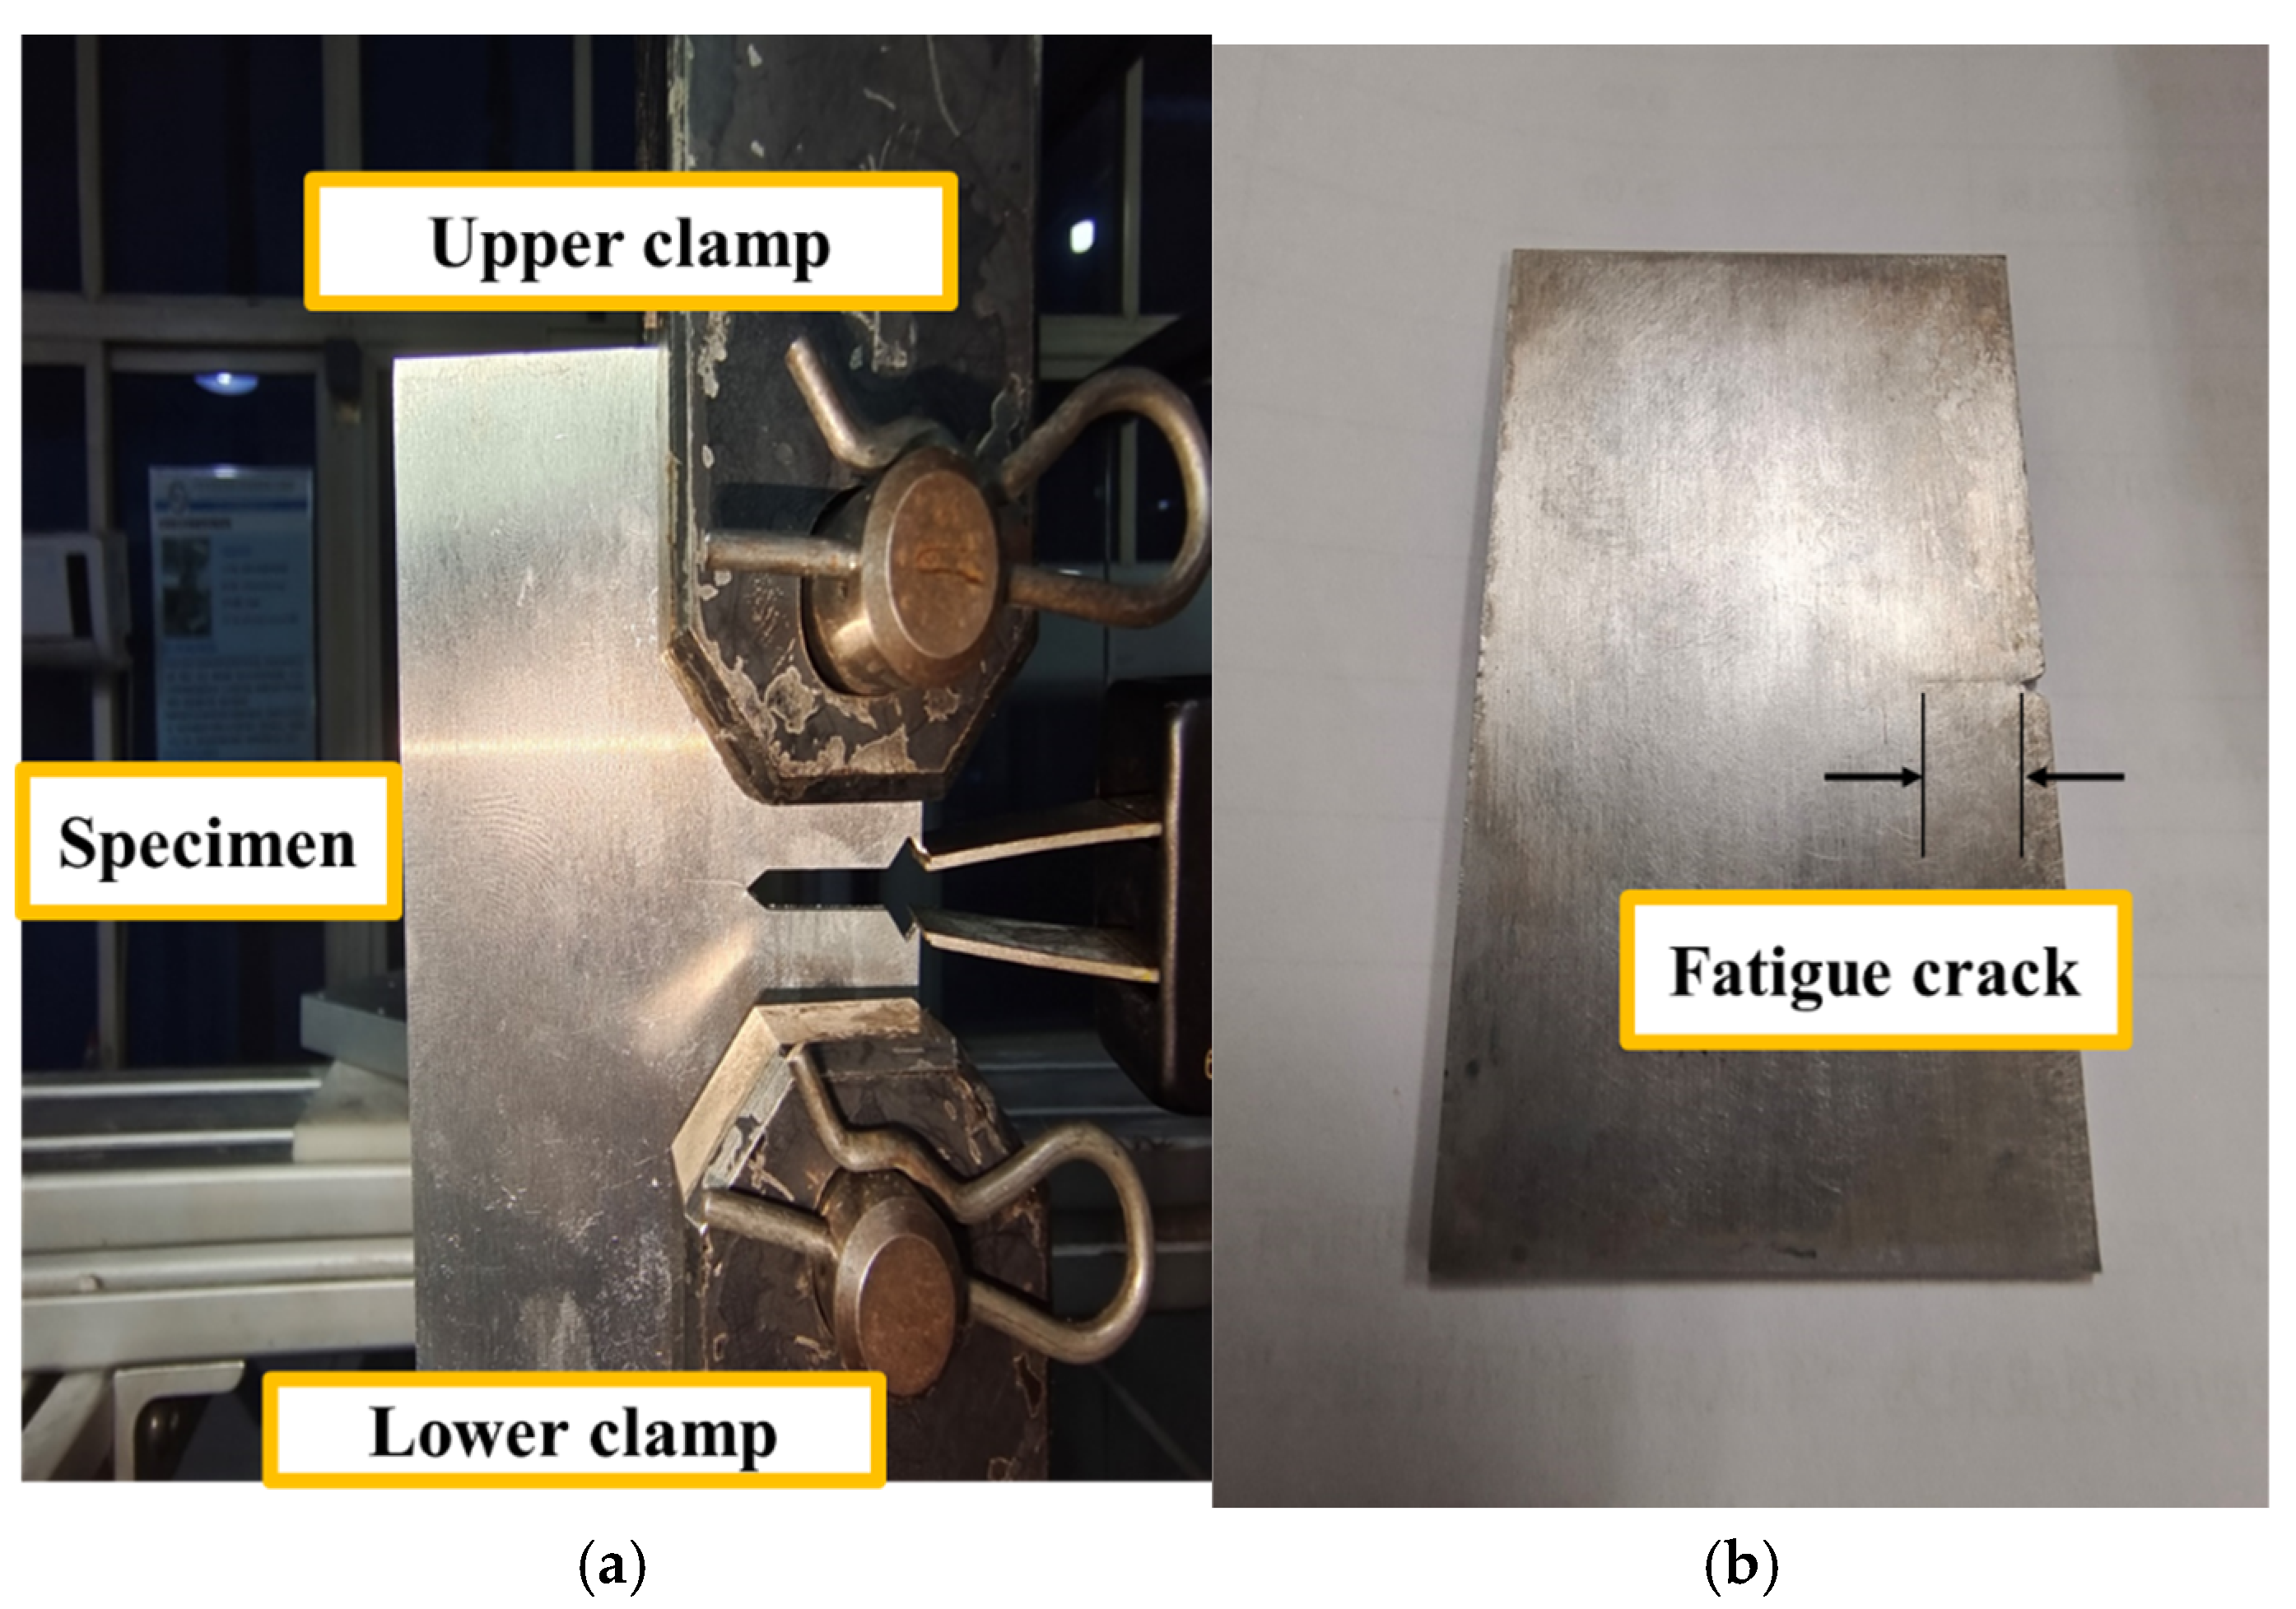
To validate the effectiveness of EDIVR features in blade crack diagnosis, vibration tests were conducted on blades containing two typical crack types: edge cracks and surface cracks. For edge crack preparation, fatigue tensile tests were performed using a MTS809 Axial/Torsional Test System. The blade specimen was clamped at both ends, and cyclic tensile loads were applied to propagate fatigue cracks from a pre-machined notch tip, as illustrated in Figure 26a. After achieving the target crack length, the specimen was cut into the required experimental dimensions as shown in Figure 26b.
The fabrication of the surface crack is illustrated in Figure 27, where two beams are spliced to simulate the contact interface of a breathing crack through the joint surface. As shown in the figure, the crack surfaces remain in contact without bonding, while other interfaces are fixed with cyanoacrylate adhesive [30]. Detailed experimental parameters of the tested cracked blade specimen are listed in Table 4.
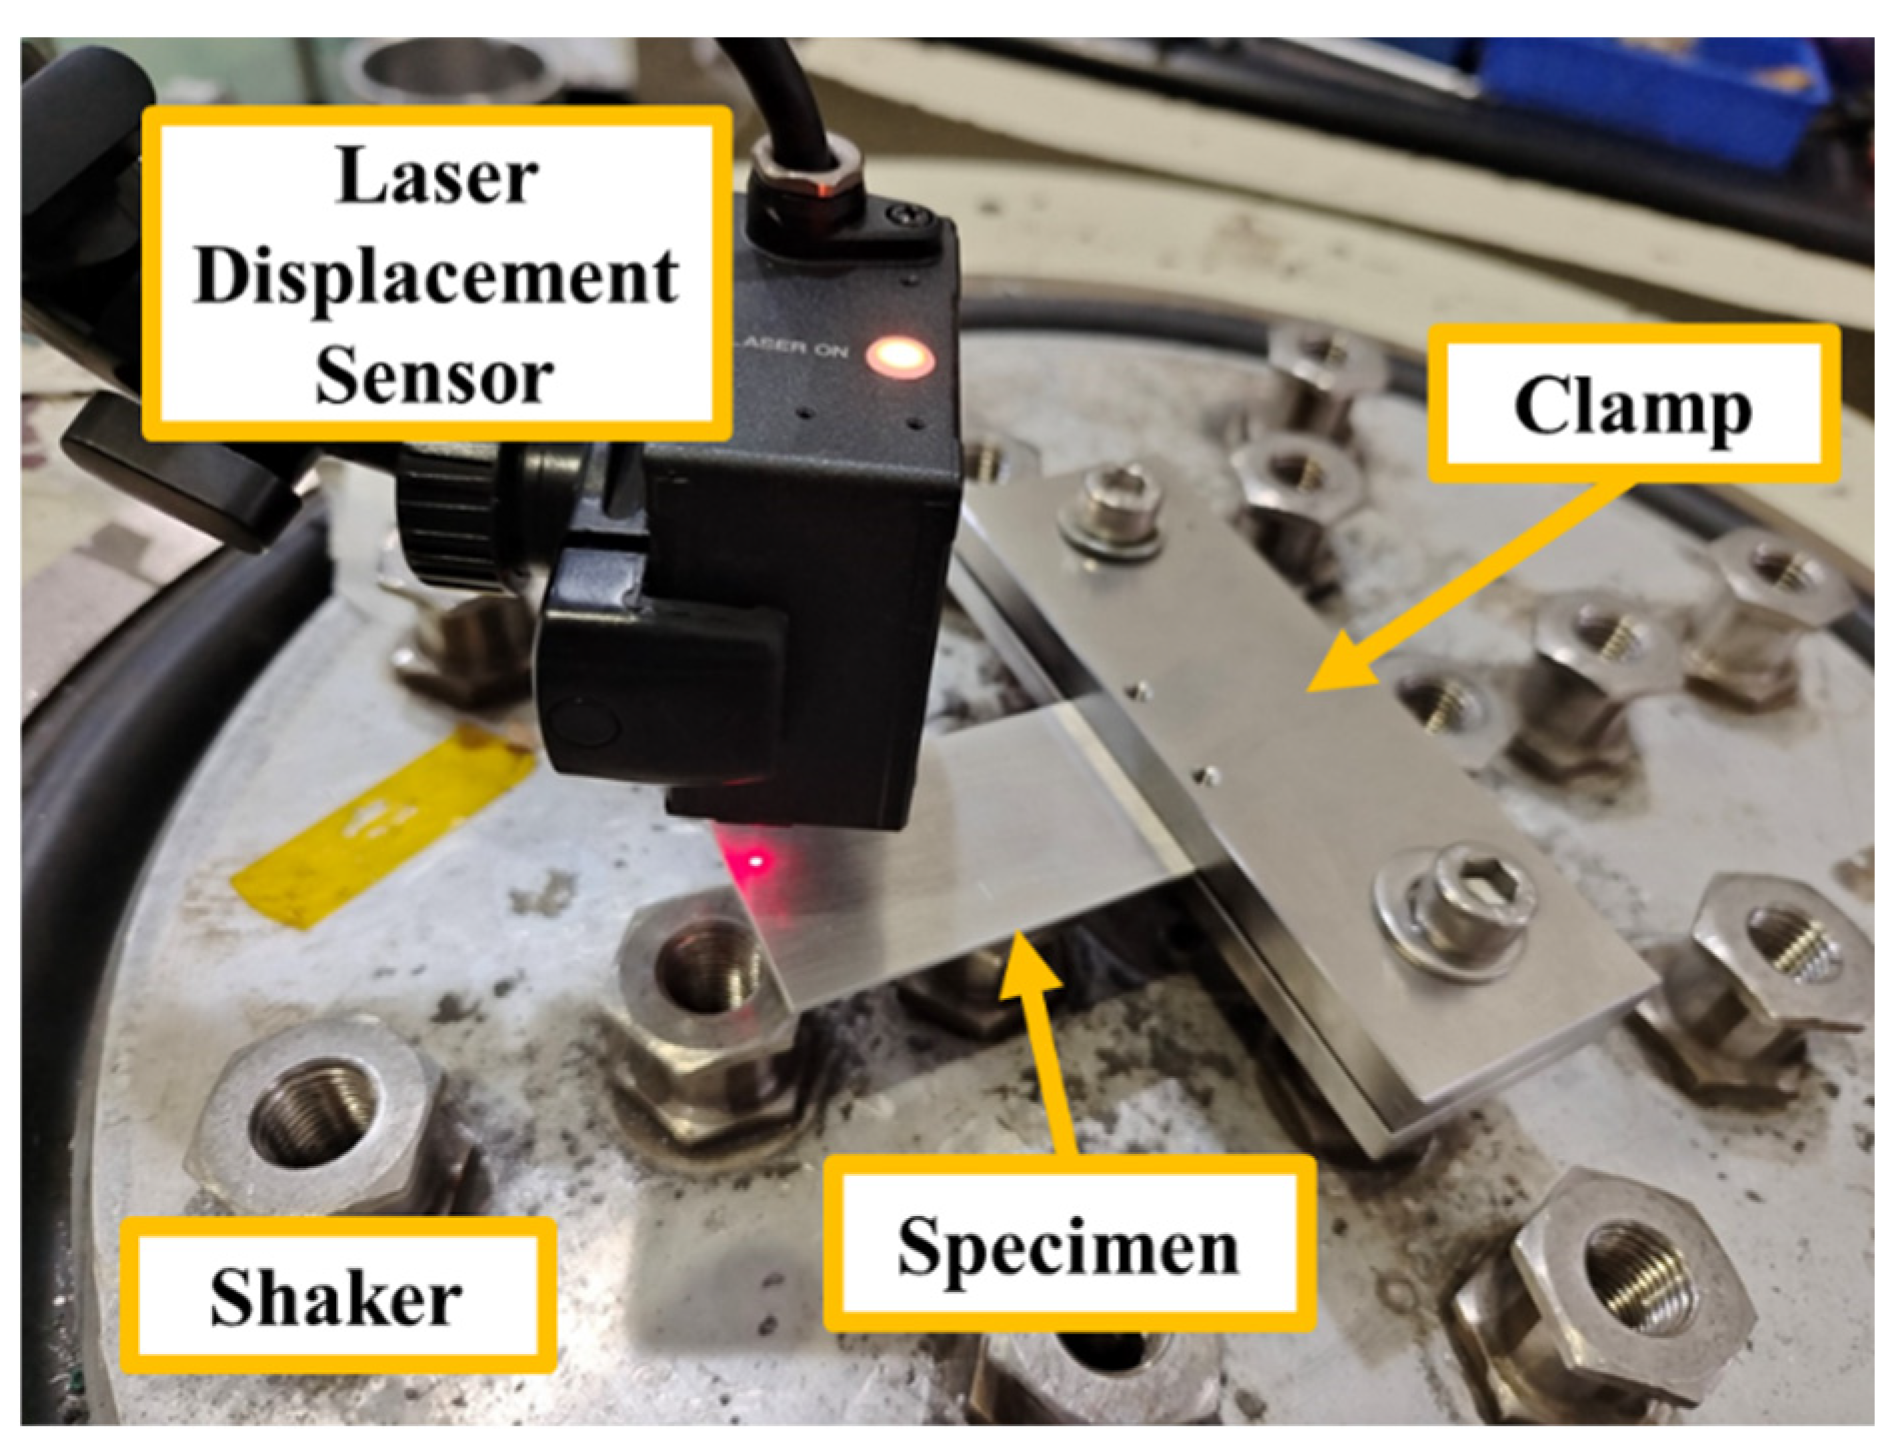
The blade was mounted on a DC-3200-36 electrodynamic shaker (Suzhou Sushi Testing Group CO.,LTD, Suzhou, China) for vibration testing, with the vibration signals at the blade tip acquired through a LK-G5000 laser displacement sensor(KEYENCE CORPORATION, Japan), as shown in the experimental setup configuration in Figure 28. The signal sampling frequency was 104 Hz, with a frequency resolution of no less than 1/60 Hz. To compare the performance of the three aforementioned dynamic features in crack diagnosis, both intact blades and each cracked blade specimen were subjected to the equal excitation procedure: (a) single-frequency excitation at 120 Hz was applied for 60 s, and (b) frequency sweep excitation from 0 to 400 Hz. All excitations were maintained at a controlled acceleration amplitude of 2g (g = 9.8 m/s2).

4.2. Validation of Crack Detection

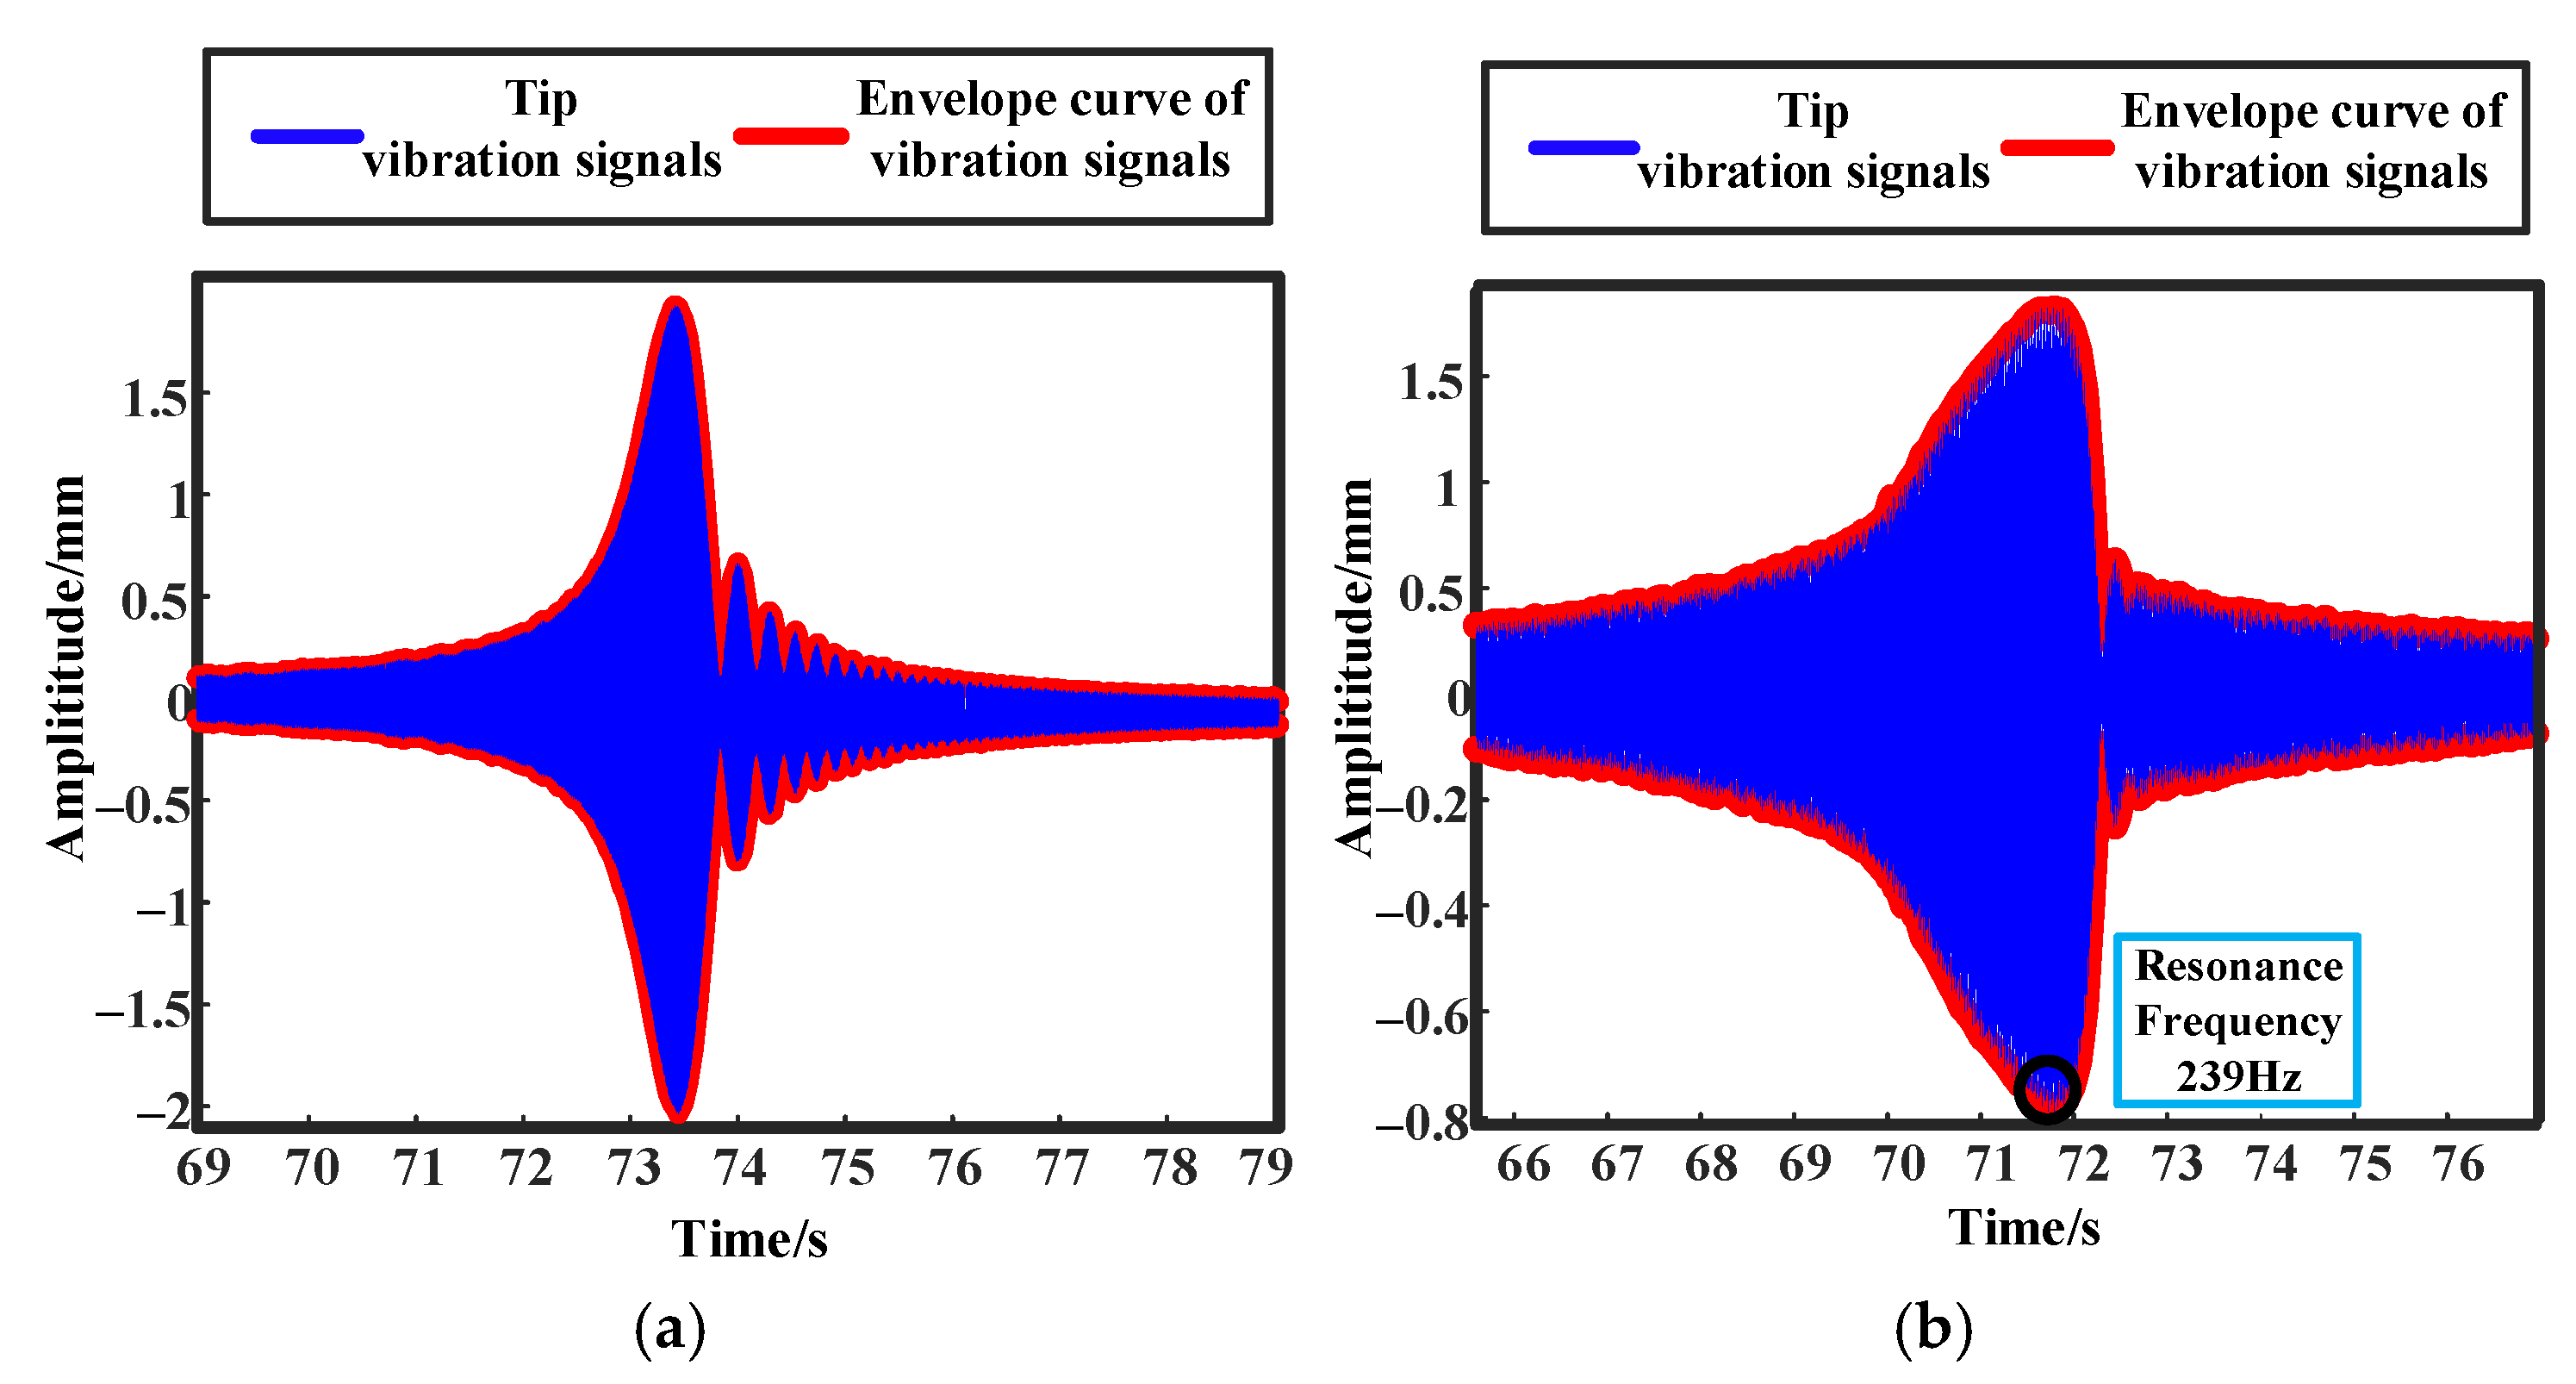
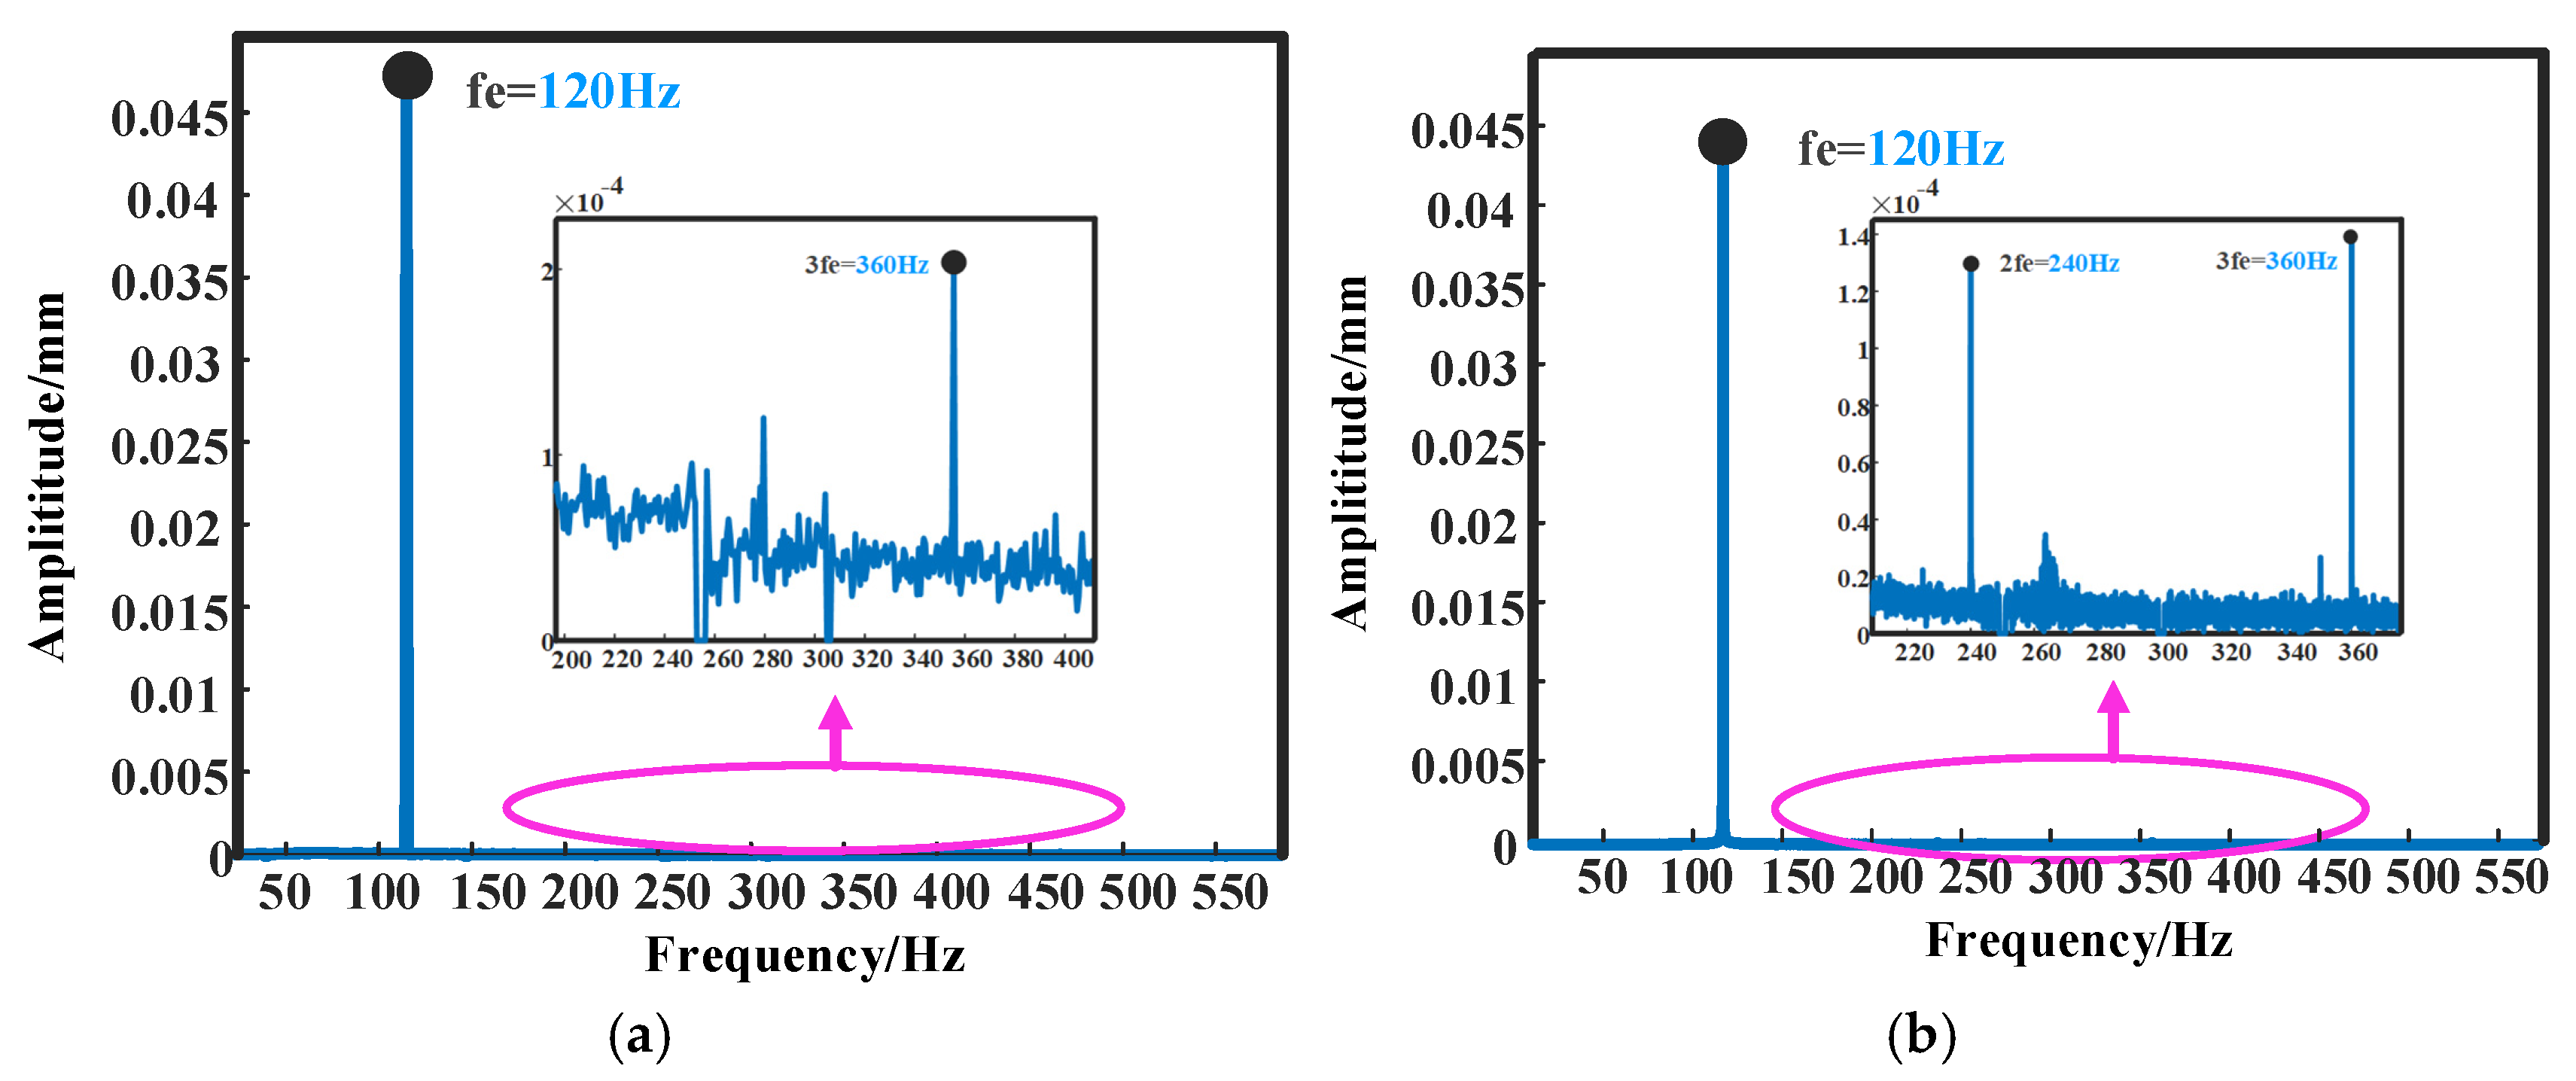
First, frequency sweep and single-frequency excitation tests were conducted on the intact blade, with the vibration responses at the blade tip recorded in Figure 29 and Figure 30, respectively. Subsequently, vibration tests were performed on the blade specimens with surface cracks. The displacement responses are shown in Figure 31, the spectral responses in Figure 32, and the calculated indicators of each dynamic characteristic are summarized in Table 5. Finally, under the same excitation conditions, vibration experiments were carried out on blade specimens with edge cracks. The resulting displacement response plots are presented in Figure 33, and the quantitative values of the dynamic features are listed in Table 6.
Based on the experimental data, the key conclusions are summarized as follows.
(1)
Among the quantitative indicators corresponding to the three dynamic characteristics of the blade, the DFD index of the EDIVR feature demonstrates the most significant variation in cracked blades. The measured values of DFD, RHM, and FDR under different crack depths exhibit close agreement with numerical simulations, validating the effectiveness of the dynamic model and proposed features. Specifically, significant peak shape deviations and accelerated oscillation decay are observed in the EDIVR profiles shown in Figure 31 and Figure 33. Both surface and edge cracks induce measurable natural frequency reductions compared to intact blades. The response spectrum under 120 Hz single-frequency excitation reveals detectable 2× and 3× harmonic components, as shown in Figure 30.
(2)
The EDIVR characteristic and its corresponding DFD indicator are critical for detecting incipient blade cracks. In the case of the 2 mm-depth edge crack (smallest crack shown in Table 6), values of FDR and RHM indicators are 0.014 and 0.035%, respectively. These values fall below typical noise thresholds in field environments, making them unreliable for practical diagnosis. In contrast, the DFD indicator achieves a robust value of 0.23, demonstrating discriminative sensitivity to early-stage cracks and outperforming conventional indicators in engineering applications.
(3)
The increase in crack depth induces pronounced and visually discernible variations in the shape features of the EDIVR. As the crack depth increases, the damping ratio of the blade vibration system rises, leading to a faster decay rate of the envelope, as seen in Figure 31 and Figure 33. This confirms the validity of the analysis in Section 2.2 regarding the characteristics of the signal envelope curves.

5. Conclusions

In this study, a novel dynamic characteristic termed the EDIVR was proposed to monitor blade health conditions. This method extracts the envelope diagram of blade tip vibration response signals during acceleration–deceleration cycles through resonance zones, establishing it as a nonlinear diagnostic feature. Based on computer graphics theory, a quantitative indicator named DFD was further defined to characterize the discrepancy between EDIVR features of cracked and healthy blades. The diagnostic capability of DFD-based criteria for blade crack identification was evaluated in this paper, with the key findings summarized as follows.
(1)
The presence of cracks induces waveform distortion in blade tip vibration response signals around resonance zones, as evidenced by changes in the envelope diagram shape (i.e., EDIVR characteristics). Finite element modeling of cracked blades, combined with dynamic simulations and experimental validations, confirms that EDIVR characteristics distinctly differentiate fatigue-cracked blades from healthy counterparts.
(2)
The DFD indicator derived from EDIVR characteristics serves as a distinguishable indicator for crack detection. Compared to conventional metrics, such as the FDR that reflects natural frequency shifts and the RHM that quantifies superharmonic resonance intensity, the DFD shows significantly higher sensitivity to cracks of identical locations and depths.
(3)
The EDIVR characteristic and its corresponding DFD indicator exhibit superior robustness against noise interference. For blades with identical cracks, superharmonic resonance signals are obscured by noise, whereas EDIVR features maintain diagnostic validity under equivalent noise levels, providing reliable crack detection criteria.
Future research directions are proposed as follows:
(1)
The distinct geometric discrepancies in the EDIVR characteristic between cracked and healthy blades can be used to train convolutional neural networks (CNNs), enabling intelligent high-accuracy crack identification in turbine blades.
(2)
Unsupervised learning methods should be developed to automatically detect differences in EDIVR features between blades with early-stage cracks and healthy blades of the same type. This approach would improve crack diagnosis accuracy when operating conditions change.

Author Contributions

Y.Y.: Writing—review and editing, validation, funding acquisition, formal analysis. M.P.: Writing—original draft, methodology, investigation, formal analysis, conceptualization. F.G.: Writing—review and editing, supervision, resources, project administration. H.H.: Formal analysis, data curation. Z.B.: Investigation, data curation. W.H.: Data curation. B.X.: Assist with the experiment. A.L.: Assist with the experiment. All authors have read and agreed to the published version of the manuscript.

Funding

This work was financially supported by the Key Laboratory Fund (WDZC20205250304).

Data Availability Statement

The data presented in this study are available on request from the corresponding author due to commercial confidentiality agreements with collaborating industrial partners.

Acknowledgments

We are deeply grateful to Xiaogang Wang and Xiangbo Hu from Hunan University for their invaluable assistance with the experimental work.

Conflicts of Interest

The authors declare no conflicts of interest.

References

  1. Chen, Z.; Sheng, H.; Xia, Y.; Wang, W.; He, J. A comprehensive review on blade tip timing-based health monitoring: Status and future. Mech. Syst. Signal Process. 2020, 149, 107330. [Google Scholar] [CrossRef]
  2. Ao, C.; Qiao, B.; Chen, L.; Xu, J.; Liu, M.; Chen, X. Blade dynamic strain non-intrusive measurement using L1/2-norm regularization and transmissibility. Measurement 2022, 190, 110677. [Google Scholar] [CrossRef]
  3. Andrenelli, L.; Paone, N.; Rossi, G.L. Large-bandwidth reflection fiber-optic sensors for turbomachinery rotor blade diagnostics. Sens. Actuators A Phys. 1992, 32, 539–542. [Google Scholar] [CrossRef]
  4. Liu, Z.; Duan, F.; Niu, G.; Ma, L.; Jiang, J.; Fu, X. An Improved Circumferential Fourier Fit (CFF) Method for Blade Tip Timing Measurements. Appl. Sci. 2020, 10, 3675. [Google Scholar] [CrossRef]
  5. Rigosi, G.; Battiato, G.; Berruti, T.M. Synchronous vibration parameters identification by tip timing measurements. Mech. Res. Commun. 2017, 79, 7–14. [Google Scholar] [CrossRef]
  6. Flotow, A.V.; Mercadal, M.; Tappert, P. Health monitoring and prognostics of blades and disks with blade tip sensors. In Proceedings of the Aerospace Conference, Big Sky, MT, USA, 25 March 2000. [Google Scholar]
  7. Wu, Z.Y.; Yan, H.; Zhao, L.C.; Yan, G.; Yang, Z.B.; Hu, H.F.; Zhang, W.M. Axial-bending coupling vibration characteristics of a rotating blade with breathing crack. Mech. Syst. Signal Process. 2023, 182, 109547. [Google Scholar] [CrossRef]
  8. Cheng, S.M.; Swamidas, A.S.J.; Wu, X.J.; Wallace, W. Vibrational response of a beam with a breathing crack. J. Sound Vib. 1999, 225, 201–208. [Google Scholar] [CrossRef]
  9. Zhang, K.; Yan, X. Multi-cracks identification method for cantilever beam structure with variable cross-sections based on measured natural frequency changes. J. Sound Vib. 2017, 387, 53–65. [Google Scholar] [CrossRef]
  10. Saito, A.; Castanier, M.P.; Pierre, C. Estimation and Veering Analysis of Nonlinear Resonant Frequencies of Cracked Plates. J. Sound Vib. 2009, 326, 725–739. [Google Scholar] [CrossRef]
  11. Xiong, Q.; Guan, H.; Ma, H.; Wu, Z.; Guo, X.; Wang, W. Dynamic characteristic analysis of rotating blade with breathing crack. Mech. Syst. Signal Process. 2023, 196, 110325. [Google Scholar] [CrossRef]
  12. Wang, H.; Ma, H.; Wang, W.; Guan, H.; Wu, Z. Analysis and experimental verification of dynamic characteristics of cantilever plate with fatigue crack. Eng. Fail. Anal. 2024, 157, 18. [Google Scholar] [CrossRef]
  13. Du Toit, R.G.; Diamond, D.H.; Heyns, P.S. A Stochastic Hybrid Blade Tip Timing Approach for the Identification and Classification of Turbomachine Blade Damage. Mech. Syst. Signal Process. 2018, 121, 389–411. [Google Scholar] [CrossRef]
  14. Wu, S.; Wang, Z.; Li, H.; Yang, Z.; Chen, X. Blade Crack Detection using Blade Tip Timing. IEEE Trans. Instrum. Meas. 2021, 70, 6502813. [Google Scholar] [CrossRef]
  15. Cao, J.; Sun, R.B.; Yang, Z.; Chen, X. Sampling Aliasing Frquency Distribution: Therory, Implementation, and Applicaiton. In Proceedings of the 2022 International Conference on Sensing, Measurement & Data Analytics in the era of Artificial Intelligence (ICSMD), Harbin, China, 30 November–December 2022; pp. 1–6. [Google Scholar]
  16. Lei, H.; Yushu, C.; Astronautics, S.O.; Technology, H.I.O. Analysis of 1/2 sub-harmonic resonance in a maneuvering rotor system. Sci. China 2014, 57, 203–209. [Google Scholar]
  17. Yang, L.; Ma, M.; Wu, S.; Chen, X.; Yan, R.; Mao, Z. An improved analytical dynamic model for rotating blade crack: With application to crack detection indicator analysis. J. Low Freq. Noise Vib. Act. Control 2021, 40, 1935–1961. [Google Scholar] [CrossRef]
  18. Zeng, J.; Chen, K.; Ma, H.; Duan, T.; Wen, B. Vibration response analysis of a cracked rotating compressor blade during run-up process. Mech. Syst. Signal Process. 2019, 118, 568–583. [Google Scholar] [CrossRef]
  19. Xie, J.; Zi, Y.; Zhang, M.; Luo, Q. A novel vibration modeling method for a rotating blade with breathing cracks. Sci. China 2019, 62, 163–178. [Google Scholar] [CrossRef]
  20. Xu, H.; Chen, Z.; Xiong, Y.; Yang, Y.; Tao, L. Nonlinear Dynamic Behaviors of Rotated Blades with Small Breathing Cracks Based on Vibration Power Flow Analysis. Shock. Vib. 2016, 2016, 4197201–4197203. [Google Scholar] [CrossRef]
  21. Shen, G.; Gu, F.; Yang, Y.; Hu, H.; Guan, F. Theoretical and experimental harmonic analysis of cracked blade vibration. Measurement 2023, 222, 11. [Google Scholar] [CrossRef]
  22. Lin, J.; Hu, Z.; Chen, Z.S.; Yang, Y.M.; Xu, H.L. Sparse reconstruction of blade tip-timing signals for multi-mode blade vibration monitoring. Mech. Syst. Signal Process. 2016, 81, 250–258. [Google Scholar] [CrossRef]
  23. Pan, M.; Yang, Y.; Guan, F.; Hu, H.; Xu, H. Sparse Representation Based Frequency Detection and Uncertainty Reduction in Blade Tip Timing Measurement for Multi-Mode Blade Vibration Monitoring. Sensors 2017, 17, 1745. [Google Scholar] [CrossRef] [PubMed]
  24. Hughes, T.J.R. The Finite Element Method: Linear Static and Dynamic Finite Element Analysis; Courier Corporation: Chelmsford, MA, USA, 2000; pp. 123–126. [Google Scholar]
  25. Bovsunovsky, A.P.; Surace, C. Considerations regarding superharmonic vibrations of a cracked beam and the variation in damping caused by the presence of the crack. J. Sound Vib. 2005, 288, 865–886. [Google Scholar] [CrossRef]
  26. Ma, H.; Wu, S.; Zeng, J.; Zhang, W.S. Damping Characteristic Analysis of Cantilever Beam with Straight Crack. J. Northeast. Univ. 2017, 38, 546–550. [Google Scholar]
  27. Zhou, C.; Sui, G.; Chen, Y.; Shan, X. A nonlinear low frequency quasi zero stiffness vibration isolator using double-arc flexible beams. Int. J. Mech. Sci. 2024, 276, 109378. [Google Scholar] [CrossRef]
  28. Lu, Z.G. Shape-based image retrieval using generic Fourier descriptor. Signal Process. Image Commun. 2002, 17, 825–848. [Google Scholar]
  29. Pugno, N.; Surace, C.; Ruotolo, R. Evaluation of the non-linear dynamic response to harmonic excitation of a beam with several breathing cracks. J. Sound Vib. 2000, 235, 749–762. [Google Scholar] [CrossRef]
  30. Prawin, J.; Rao, A.R.M. A method for detecting damage-induced nonlinearity in structures using weighting function augmented curvature approach. Struct. Health Monit. 2019, 18, 1154–1167. [Google Scholar] [CrossRef]
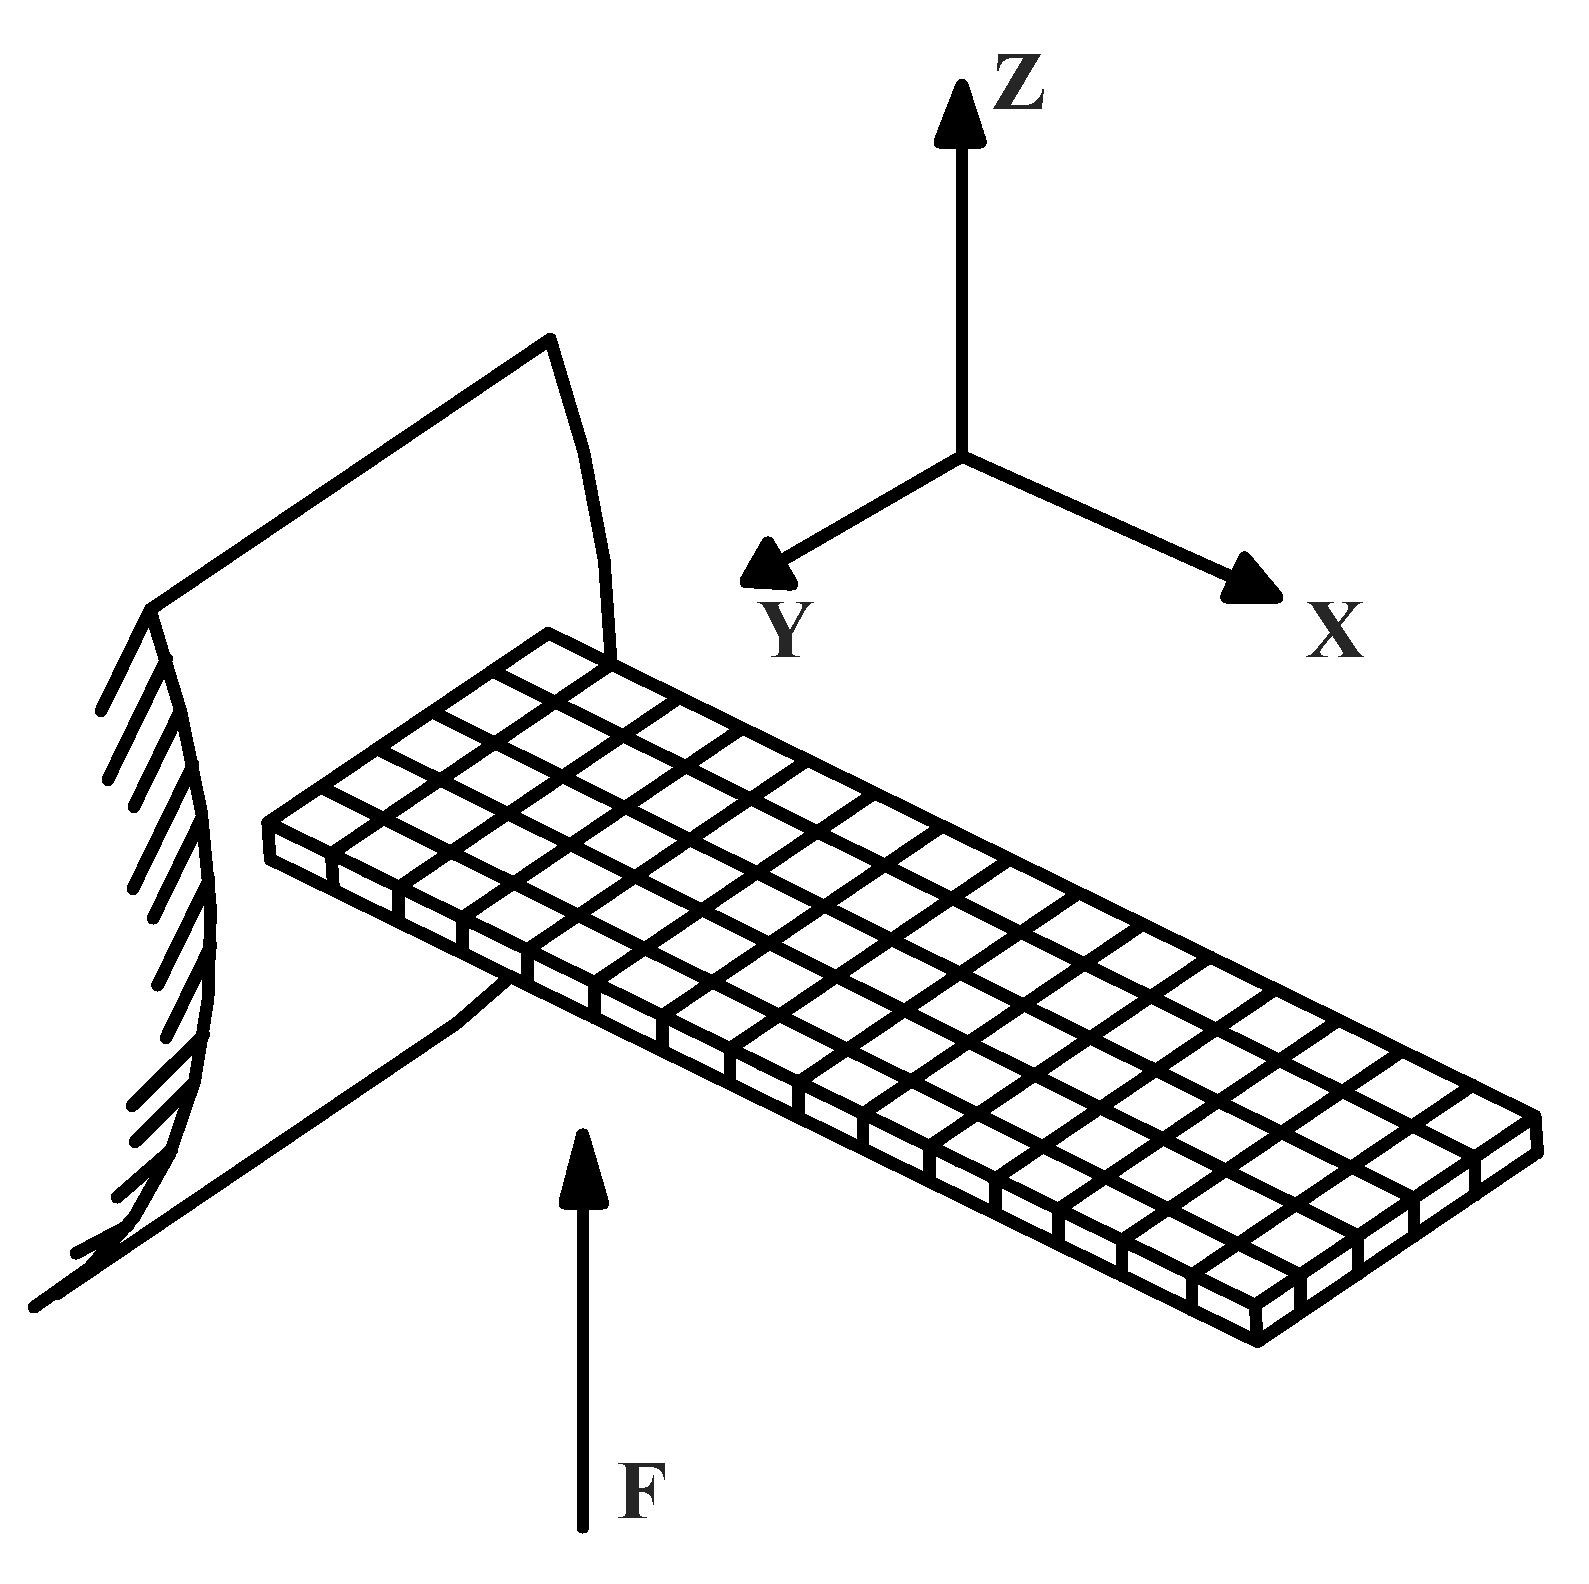
Figure 1. Schematic of the blade model with mesh discretization.
Machines 13 00399 g001
Figure 2. Local magnification of the breathing crack region in blades: (a) surface crack; (b) edge crack.
Machines 13 00399 g002
Figure 3. Localized crack contact–separation interface schematic.
Machines 13 00399 g003
Figure 4. Finite element modeling of cracked blade stiffness: (a) structural matrix assembly; (b) spring element representation of breathing crack interfaces.
Machines 13 00399 g004
Figure 5. Transient response diagram with different damping ratios.
Machines 13 00399 g005
Figure 6. Amplitude–frequency responses of the system under varying stiffness conditions.
Machines 13 00399 g006
Figure 7. Schematic diagram of the envelope generation methodology for blade vibration signal.
Machines 13 00399 g007
Figure 8. Vibration response envelope curves of the cracked blade and its corresponding intact blade.
Machines 13 00399 g008
Figure 9. Quantitative characterization of EDIVR features: (a) EDIVR feature extraction framework; (b) complex-number-based sequence representation of envelope boundaries.
Machines 13 00399 g009
Figure 10. Schematic diagram of crack identification based on DFD.
Machines 13 00399 g010
Figure 11. Frequency spectrum of cracked blade vibration responses.
Machines 13 00399 g011
Figure 12. Schematic diagrams of blade cracks: (a) edge crack; (b) surface crack. Symbols dc and γ = l/L denote crack depth and relative position, respectively.
Machines 13 00399 g012
Figure 13. Simulated displacement response of the intact blade under frequency sweep excitation.
Machines 13 00399 g013
Figure 14. Simulated frequency response spectrum of the intact blade under single-frequency excitation.
Machines 13 00399 g014
Figure 15. Simulated displacement response signals of blades with graded surface crack depths across resonance regions: (a) crack depth dc = 0.5 mm; (b) crack depth dc = 1 mm.
Machines 13 00399 g015
Figure 16. Simulated frequency response spectrum of blades with graded surface crack depths under single-frequency excitation: (a) crack depth dc = 0.5 mm; (b) crack depth dc = 1 mm.
Machines 13 00399 g016
Figure 17. Simulated displacement response signals of blades with graded edge crack depths across resonance regions: (a) crack depth dc = 2 mm; (b) crack depth dc = 10 mm.
Machines 13 00399 g017
Figure 18. Simulated frequency response spectrum of blades with graded edge crack depths under single-frequency excitation: (a) crack depth dc = 2 mm; (b) crack depth dc = 10 mm.
Machines 13 00399 g018
Figure 19. Simulated displacement response signals of cracked blades across resonance regions with varying crack locations: (a) surface crack location γ = 1/3; (b) γ = 1/2; (c) γ = 2/3.
Machines 13 00399 g019
Figure 20. Simulated frequency response spectrum of cracked blades with different crack locations under single-frequency excitation: (a) surface crack location γ = 1/3; (b) γ = 1/2; (c) γ = 2/3.
Machines 13 00399 g020
Figure 21. Simulated displacement response signals of cracked blades across resonance regions with varying crack locations: (a) edge crack location γ = 1/3; (b) γ = 1/2; (c) γ = 2/3.
Machines 13 00399 g021
Figure 22. Simulated frequency response spectrum of cracked blades with different crack locations under single-frequency excitation: (a) edge crack location γ = 1/3; (b) γ = 1/2; (c) γ = 2/3.
Machines 13 00399 g022
Figure 23. Vibration response of a cracked blade under noise-free conditions: (a) displacement response across the resonance region; (b) frequency spectrum under single-frequency excitation.
Machines 13 00399 g023
Figure 24. Response spectra of the blade contaminated by noise: (a) SNR = 15 dB; (b) SNR = 30 dB.
Machines 13 00399 g024
Figure 25. Schematic diagram of blade EDIVR characteristics across the resonance region with noise contamination: (a,b) displacement and envelope diagram for SNR = 15 dB; (c,d) displacement and envelope diagram for SNR = 5 dB.
Machines 13 00399 g025
Figure 26. Schematic of fatigue crack propagation setup and cracked blade specimen: (a) fatigue tensile tests; (b) cracked blade specimen.
Machines 13 00399 g026
Figure 27. Schematic of the blade surface crack.
Machines 13 00399 g027
Figure 28. Test rig for blade vibration experiments.
Machines 13 00399 g028
Figure 29. Experimental displacement response of the intact blade under frequency sweep excitation.
Machines 13 00399 g029
Figure 30. Experimental frequency response spectrum of the intact blade under single-frequency excitation.
Machines 13 00399 g030
Figure 31. Experimental displacement response signals of blades with graded surface crack depths across resonance regions: (a) crack depth dc = 0.5 mm; (b) crack depth dc = 1 mm.
Machines 13 00399 g031
Figure 32. Experimental frequency response spectrum of blades with graded surface crack depths under single-frequency excitation: (a) crack depth dc = 0.5 mm; (b) crack depth dc = 1 mm.
Machines 13 00399 g032
Figure 33. Experimental displacement response signals of blades with graded edge crack depths across resonance regions: (a) crack depth dc = 0 mm; (b) crack depth dc = 2 mm; (c) crack depth dc = 5 mm; (d) crack depth dc = 10 mm.
Machines 13 00399 g033aMachines 13 00399 g033b
Table 1. Effect of crack depth on nonlinear dynamic indicators.
Crack TypeInvariant ParametersVarying
Parameters
FDRRHMDFD
Surface crackBlade size (length, width, height):
(L,w,h) = (80 mm,40 mm,2 mm)
Material properties (density, Young’s modulus, Poisson’s ratio):
(ρ,E,υ) = (7.9 g/cm3,210 GPa,0.3)
Crack location:
γ = 1/2
dc = 0.5 mm

dc = 0.75 mm

dc = 1 mm
0.067

0.074

0.101
0.014

0.018

0.029
0.29

0.30

0.31
Edge crackBlade size (length, width, height):
(L,w,h)= (80 mm,40 mm,2 mm)
Material properties(density, Young’s modulus, Poisson’s ratio):
(ρ,E,υ)= (7.9 g/cm3,210 GPa,0.3)
Crack location:
γ = 1/2
dc = 2 mm

dc = 4 mm

dc = 6 mm

dc = 8 mm

dc = 10 mm
0.033

0.042

0.048

0.064

0.069
0.003

0.006

0.011

0.013

0.013
0.20

0.22

0.23

0.28

0.31
Table 2. Effect of crack location on nonlinear dynamic indicators.
Crack TypeInvariant ParametersVarying
Parameters
FDRRHMDFD
Surface crackCrack depth:
dc =1 mm
γ = 1/30.0770.0250.30
γ = 1/20.1010.0290.31
γ = 2/30.1300.0360.33
Edge crackCrack depth:
dc =6 mm
γ = 1/30.0440.010.21
γ = 1/20.0480.0110.23
γ = 2/30.0670.0240.29
Table 3. Effect of crack location on nonlinear dynamic indicators.
Reference BladeSignal Noise of Test BladeRHMFDR
Blade with edge crack
Crack depth:
dc = 6 mm
Crack location:
γ = 2/3
SNR = 5 dB0.21
SNR = 10 dB0.25
SNR = 15 dB0.25
SNR = 30 dB0.0170.28
None0.0240.29
Table 4. Experimental equipment parameters.
ItemEdge CrackSurface Crack
Materialaluminum alloy
h2 mm
w40 mm
L80 mm
γ1/2
dc2 mm; 5 mm; 10 mm0.5 mm; 1 mm
Table 5. Comparison of experimental measurement outcomes for surface cracks across different indicators.
Invariant ParametersVarying Parameters (Crack Depth)DFDRHMFDR
Crack location:
Frequency sweep rate: a = 200 Hz/min
Excitation frequency: f0 = 120 Hz
dc = 0.5 mm0.220.00430.082
dc = 1 mm1.560.00680.104
Table 6. Comparison of experimental measurement outcomes for edge cracks across different indicators.
Invariant ParametersVarying Parameters (Crack Depth)DFDRHMFDR
Crack location:
Frequency sweep rate: a = 200 Hz/min
Excitation frequency: f0 = 120 Hz
dc = 2 mm0.230.000350.014
dc = 5 mm0.2880.000390.026
dc = 10 mm0.360.000550.052
Disclaimer/Publisher’s Note: The statements, opinions and data contained in all publications are solely those of the individual author(s) and contributor(s) and not of MDPI and/or the editor(s). MDPI and/or the editor(s) disclaim responsibility for any injury to people or property resulting from any ideas, methods, instructions or products referred to in the content.