Article

On the Specimen Design, Physical Properties and Geometry Effect on Heat Generation and Thermal Gradient in Ultrasonic Fatigue

by
Felipe Klein Fiorentin
1,*,
Rita Dantas
2,3,4,
Jorge Wolfs Gil
2,3,
Andrea Piga Carboni
1,
Thiago Antonio Fiorentin
1 and
Abílio Manuel Pinho de Jesus
2,3
1
Department of Mobility Engineering, UFSC (Federal University of Santa Catarina), Joinville 89219-600, Brazil
2
Institute of Science and Innovation in Mechanical and Industrial Engineering, Campus da FEUP, Dr. Roberto Frias Street, 4200-465 Porto, Portugal
3
Faculty of Engineering, University of Porto, Dr. Roberto Frias Street, 4200-465 Porto, Portugal
4
Institute for Sustainable Construct, 4200-465 Porto, Portugal
*
Author to whom correspondence should be addressed.
Machines 2025, 13(5), 380; https://doi.org/10.3390/machines13050380
Submission received: 24 February 2025 / Revised: 28 March 2025 / Accepted: 2 April 2025 / Published: 30 April 2025
(This article belongs to the Special Issue Recent Developments in Machine Design, Automation and Robotics)

Abstract

Performing fatigue characterisation is often an expensive task, being both time consuming and expensive. Taking that into account, ultrasonic fatigue testing is an interesting solution, since it can be thousands of times faster than traditional experiments. In ultrasonic fatigue testing, excitation frequencies are in the order of magnitude of 20 kHz, while common fatigue testing frequencies are typically approximately a few hundreds of Hz. Although promising, ultrasonic fatigue testing has some challenges, like high strain rates, heat generation and complex specimen design. Regarding the latter, since the working principle of ultrasonic fatigue tests relies on exciting the specimen in one of its natural frequencies, finding a specimen geometry to resonate at this given frequency might be challenging. Additionally, some materials often present challenges associated with high temperature during tests. The goal of this paper is to provide guidelines for specimen design, encompassing the effects of critical factors and their impact on important test parameters, like temperature and dimensions. The proposed methodology developed a parameter able to quantify the heat generation severity during ultrasonic fatigue testing for several materials based on their physical properties. Moreover, the effects of the geometry and material properties in the temperature during loading cycles, with special focus on thermal gradients were enumerated.

1. Introduction

In order to understand material behaviour after being subjected to a very high number of cycles, from 107 to 1010 (or beyond), different machines and testing techniques have to be developed, leading to so-called ultrasonic fatigue testing (alternative names are used like very-high-cycle fatigue testing, VHCF, or gigacycle fatigue testing). In order to achieve such large numbers of cycles, testing frequencies have to be greatly increased—otherwise, the testing times would be prohibitive. For example, a standard fatigue machine operating at 20 Hz would take more than 1.6 years to perform 109 cycles in only one specimen. Machines operating using servo hydraulic actuators or electrical drives (e.g., rotating bending machines) are typically not able to reach frequencies above 1 kHz. Consequently, ultrasonic fatigue testing systems typically use another excitation device, a piezo-electric actuator. Such systems are able to achieve frequencies above tens of kHz, with 20 kHz being the most common excitation frequency [1]. However, in order to maximise stress amplitudes, these systems excite the specimen in one of its resonance frequencies. This intrinsic characteristic of ultrasonic fatigue testing leads to some challenges regarding specimen design, due to the resonance constraint and stress analysis, since there is no external loading on the specimen, and the stresses are a consequence of the specimen’s inertial forces. Due to this working principle, total fracture of the specimen typically does not occur, since the specimen’s natural frequency is reduced by the crack length (which reduces the cross-section stiffness) [2].
Due to the high excitation frequencies, with some machines operating at dozens of kHz, specimens may experience significant heat generation and excessive temperature during fatigue tests. Some authors reported noticeable heat generation for certain materials, like cast iron, and temperatures during tests above 150 °C [3]. The impact of temperature in fatigue properties is well known, requiring specimen cooling during testing in such conditions.
Additionally, since the specimen must be cooled, temperature gradients are present at the testing sections of the specimens (regions where the stress amplitudes are at a maximum), which can be very abrupt for some materials. High temperatures will also change the mechanical properties of the materials, like the elasticity modulus, and density, which will change the specimen’s natural frequency [4]. This is especially critical in ultrasonic fatigue testing, since the machine can only operate within a certain narrow frequency range, and the test will stop if the specimen’s natural frequency is outside this range.
The heat generation is directly associated with the elastic energy available. A fraction of this energy will be dissipated and converted into heat [5]. This dissipative term is proportional to a material damping property, like the damping ratio or loss factor. For some materials, this damping property is nearly invariant within the elastic energy [6]. However, other materials present significant variations with increments in stress amplitudes, where this dissipative term can increase by one or two orders of magnitude. This is critical for ultrasonic fatigue testing, since higher stress amplitudes will lead to severe heat generation during tests. A comprehensive study was developed by Visnapuu et al. [7], where several steel and cast-iron alloys were analysed. Some materials, like the AISI 1045, presented a nearly constant damping ratio, virtually independent of stress levels. Other materials, like AISI 4140 and a grey cast iron, presented abrupt variations in damping parameters (more than 10 times) with an increase in stress levels. The authors found a strong relation between localised plasticity (more intense in higher stresses) and the increase in the damping ratio. This damping variation due to stress amplitudes was also observed during ultrasonic fatigue testing for a cooper specimen [8]. The authors have measured the damping ratio using the exponential decay during free vibration. They have observed that if a shorter period of time was used for measuring the damping ratio (higher average stress amplitudes), the measured damping ratio would be higher than when measurements were performed for longer periods (smaller average amplitudes). Variations larger than 25% in the damping ratio were observed depending on the total measurement time. Similar results were observed for a nickel superalloy and 316L stainless steel specimens [9], where higher damping ratios were measured for higher stress amplitudes during ultrasonic fatigue testing.
In order to reduce the effect of high temperatures and its impact on the fatigue results, different approaches might be applied. One of the most popular is intermittent testing, where the specimen is loaded for a certain period, experiences heat generation and a temperature increase, and a stop for a determined time in order to cool down (idle) [10]. This waiting time (machine off) may vary from a few hundred milliseconds to several seconds, the latter for materials experiencing severe heat increasing during tests. Some authors have observed that specimens subjected to longer waiting times, and lower temperatures as a consequence, presented superior fatigue performance than specimens with shorter idling times [11]. Other interesting work observed severe temperatures during tests of the 316L austenitic steel [12], and very long waiting times (5 s) were applied in order to avoid excessive heating during tests and its impact on the fatigue results.
Alternative methods are related to specimen cooling, where heat is extracted by convection. The most widely used method is cooling the specimen testing section (the region where the temperatures are higher) with compressed air. However, for severe cases, this cooling method is not enough, and some works applied different solutions, like liquid nitrogen cooling or water, although it is important to understand and avoid the impact of the cooling system in the fatigue properties. For example, water cooling is not suitable for materials with low corrosion resistance, since the specimen is subjected to this corrosive environment for extended periods of time.
The increments in temperature typically have a negative impact on the fatigue behaviour of a material (except for cryogenic conditions) [13]. Therefore, it is essential to have information regarding the temperature during fatigue tests. The temperature distribution is also an impacting factor in fatigue [14]. Some authors have found that the temperature gradient has a strong effect on the initiation and propagation of fatigue cracks [15], and this damage mechanism is often referred to as temperature gradient mechanical fatigue (TGMF) [16]. In an interesting study conducted by Sun et al. [17], the authors compared the fatigue behaviour of a nickel superalloy for two specimen geometries, one with a very uniform temperature gradient, and the other presenting a much greater temperature gradient (approximately 20 °C/mm). The specimens were subjected to the same loading levels and maximum temperatures, and they found that the specimens with the higher temperature gradients presented a much shorter fatigue life (by an entire order of magnitude). High temperature gradients can occur during ultrasonic fatigue testing, especially for materials with lower thermal conductivities, and are exacerbated during the convection cooling (typically used during ultrasonic tests), making the surface temperature much cooler than the inner region.
Since excessive heat generation is a frequent problem during ultrasonic fatigue characterisation, mainly associated with the high excitation frequencies, the main goal of this research is to provide a guideline regarding specimen design, with special emphasis on the heat generation. In addition, it is intended to provide basic information regarding materials most susceptible to the excessive heat generation. Moreover, based on analytical formulation, a discussion regarding the effect of each material parameter effect on the resonance frequencies and specimen geometry will be drawn. While the main focus of the present work is related to metallic materials, some examples regarding polymers will be presented. Additionally, the present discussion may be expanded for non-metallic materials, like ceramics and composites.

2. Analytical Formulation and Discussion

The present section will provide a discussion regarding the material property effect on the specimen dimensions (especially constrained by the natural frequency requirement for ultrasonic fatigue), and on the energy dissipated during fatigue cycles. Additionally, a discussion encompassing the effect of specimen dimensions on the temperature field during fatigue cycling will also be presented. For this analysis, a FEM model will be used to present the effect of several parameters on the temperature distribution.

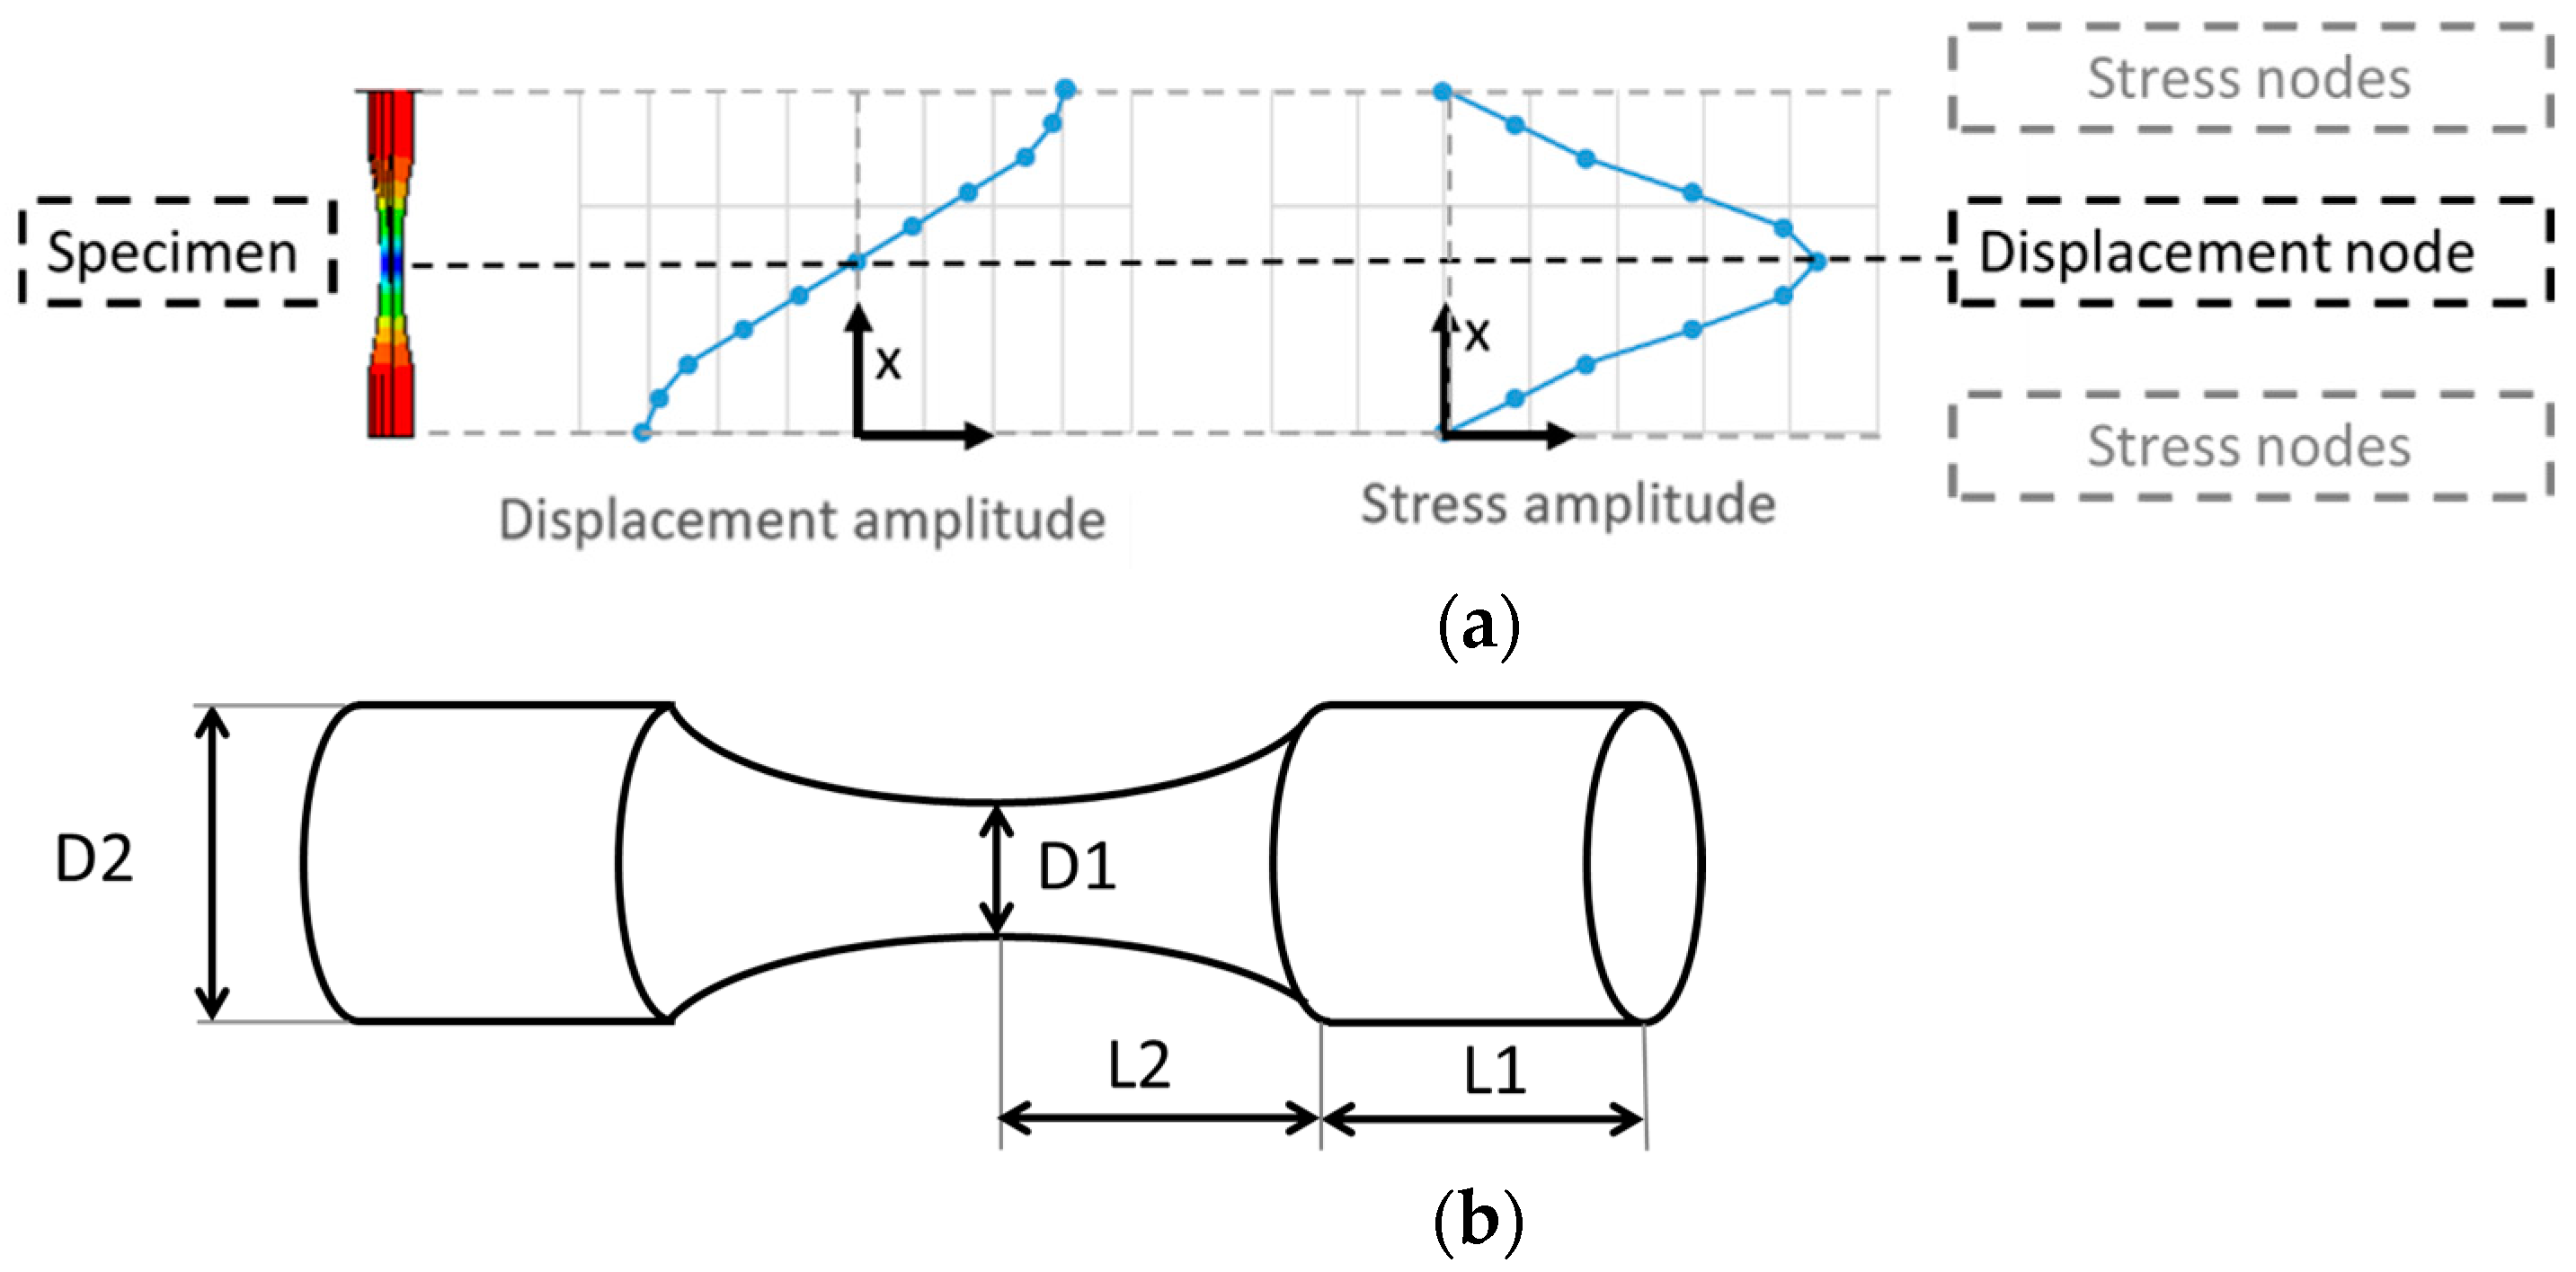
2.1. The Effect of Specimen Geometry on the Specimen’s Natural Frequency

Due to its working principle, the ultrasonic fatigue specimen must be designed to have one of its natural frequency coincident to the excitation frequency of the machine. Typically, the 1st longitudinal frequency of a specimen is the one of interest, and during tests, this vibration mode will be excited. Figure 1a presents the stress and displacement field for a typical hourglass specimen (1st longitudinal vibration mode), based on [1], while its main dimensions are present in Figure 1b. Even though the present discussion will focus on the hourglass specimens, an analogous analysis could be performed for dog-bone, flat or other specimen geometries.
Analytical formulations for hourglass specimens regarding their dimensions, stress, strain and displacement fields for a desired resonance frequency are available (for example, the study in [1] presents formulations for finding L1 to reach a desired resonance frequency, fn). The contribution of each dimension can be analysed by simply using the natural angular frequency equation for a 1 degree-of-freedom (D.O.F.) system
ω n = K M ,
where K is the stiffness, and M is the mass. Looking at the stress and displacement fields in Figure 1a, it can be observed that the central portion of the specimen is associated with higher stress amplitudes, and lower displacement amplitudes. Therefore, this region will have a higher impact on the stiffness component, K, of natural frequency. On the other hand, the outer portions of the specimens are the regions with higher displacement amplitudes, while the stress ones are the smallest. Therefore, the outer region of the specimen will have a greater impact on the inertial terms (M).
Moreover, the stiffness of a bar (axial tension/compression loading only) can be written as
K = E A L ,
where E is the elasticity modulus, A represents the cross-section area and L is the total length. Each specimen dimension impact can be summarised as:
  • D1: Increasing D1 will greatly improve specimen stiffness, resulting in a higher natural frequency. Moreover, increasing D1 will also increase the specimen cross section, reducing its stress amplitudes.
  • D2: When D2 is incremented, it will increase the specimen inertial term (associated with M), therefore decreasing its natural frequency. Moreover, a higher D2 will increase the stress levels of the specimen, since it will be subjected to a higher force (higher inertial component).
  • L1: A higher L1 will result in a less stiff specimen (the stiffness of a bar is inversely proportional to its length, as Equation (2) shows); therefore, it will reduce the specimen’s natural frequency. Moreover, it will also increase the specimen mass, reducing its resonance frequency even further. This additional mass will also lead to an increase in stress levels at the central section of the specimen.
  • L2: By being at the central section of the specimen, L2 will have a greater impact on the specimen stiffness component. A larger L2 will lead to a lower natural frequency, due to its inverse impact on the specimen stiffness. It is important to avoid very small values of L2, since this can lead to high stress concentration levels due to the abrupt changes in the cross section (from D2 to D1 in a short length).
It is important to emphasise that when changing one dimensions, other dimensions (at least one) will have to be adjusted, in order to maintain the desired resonance frequency.

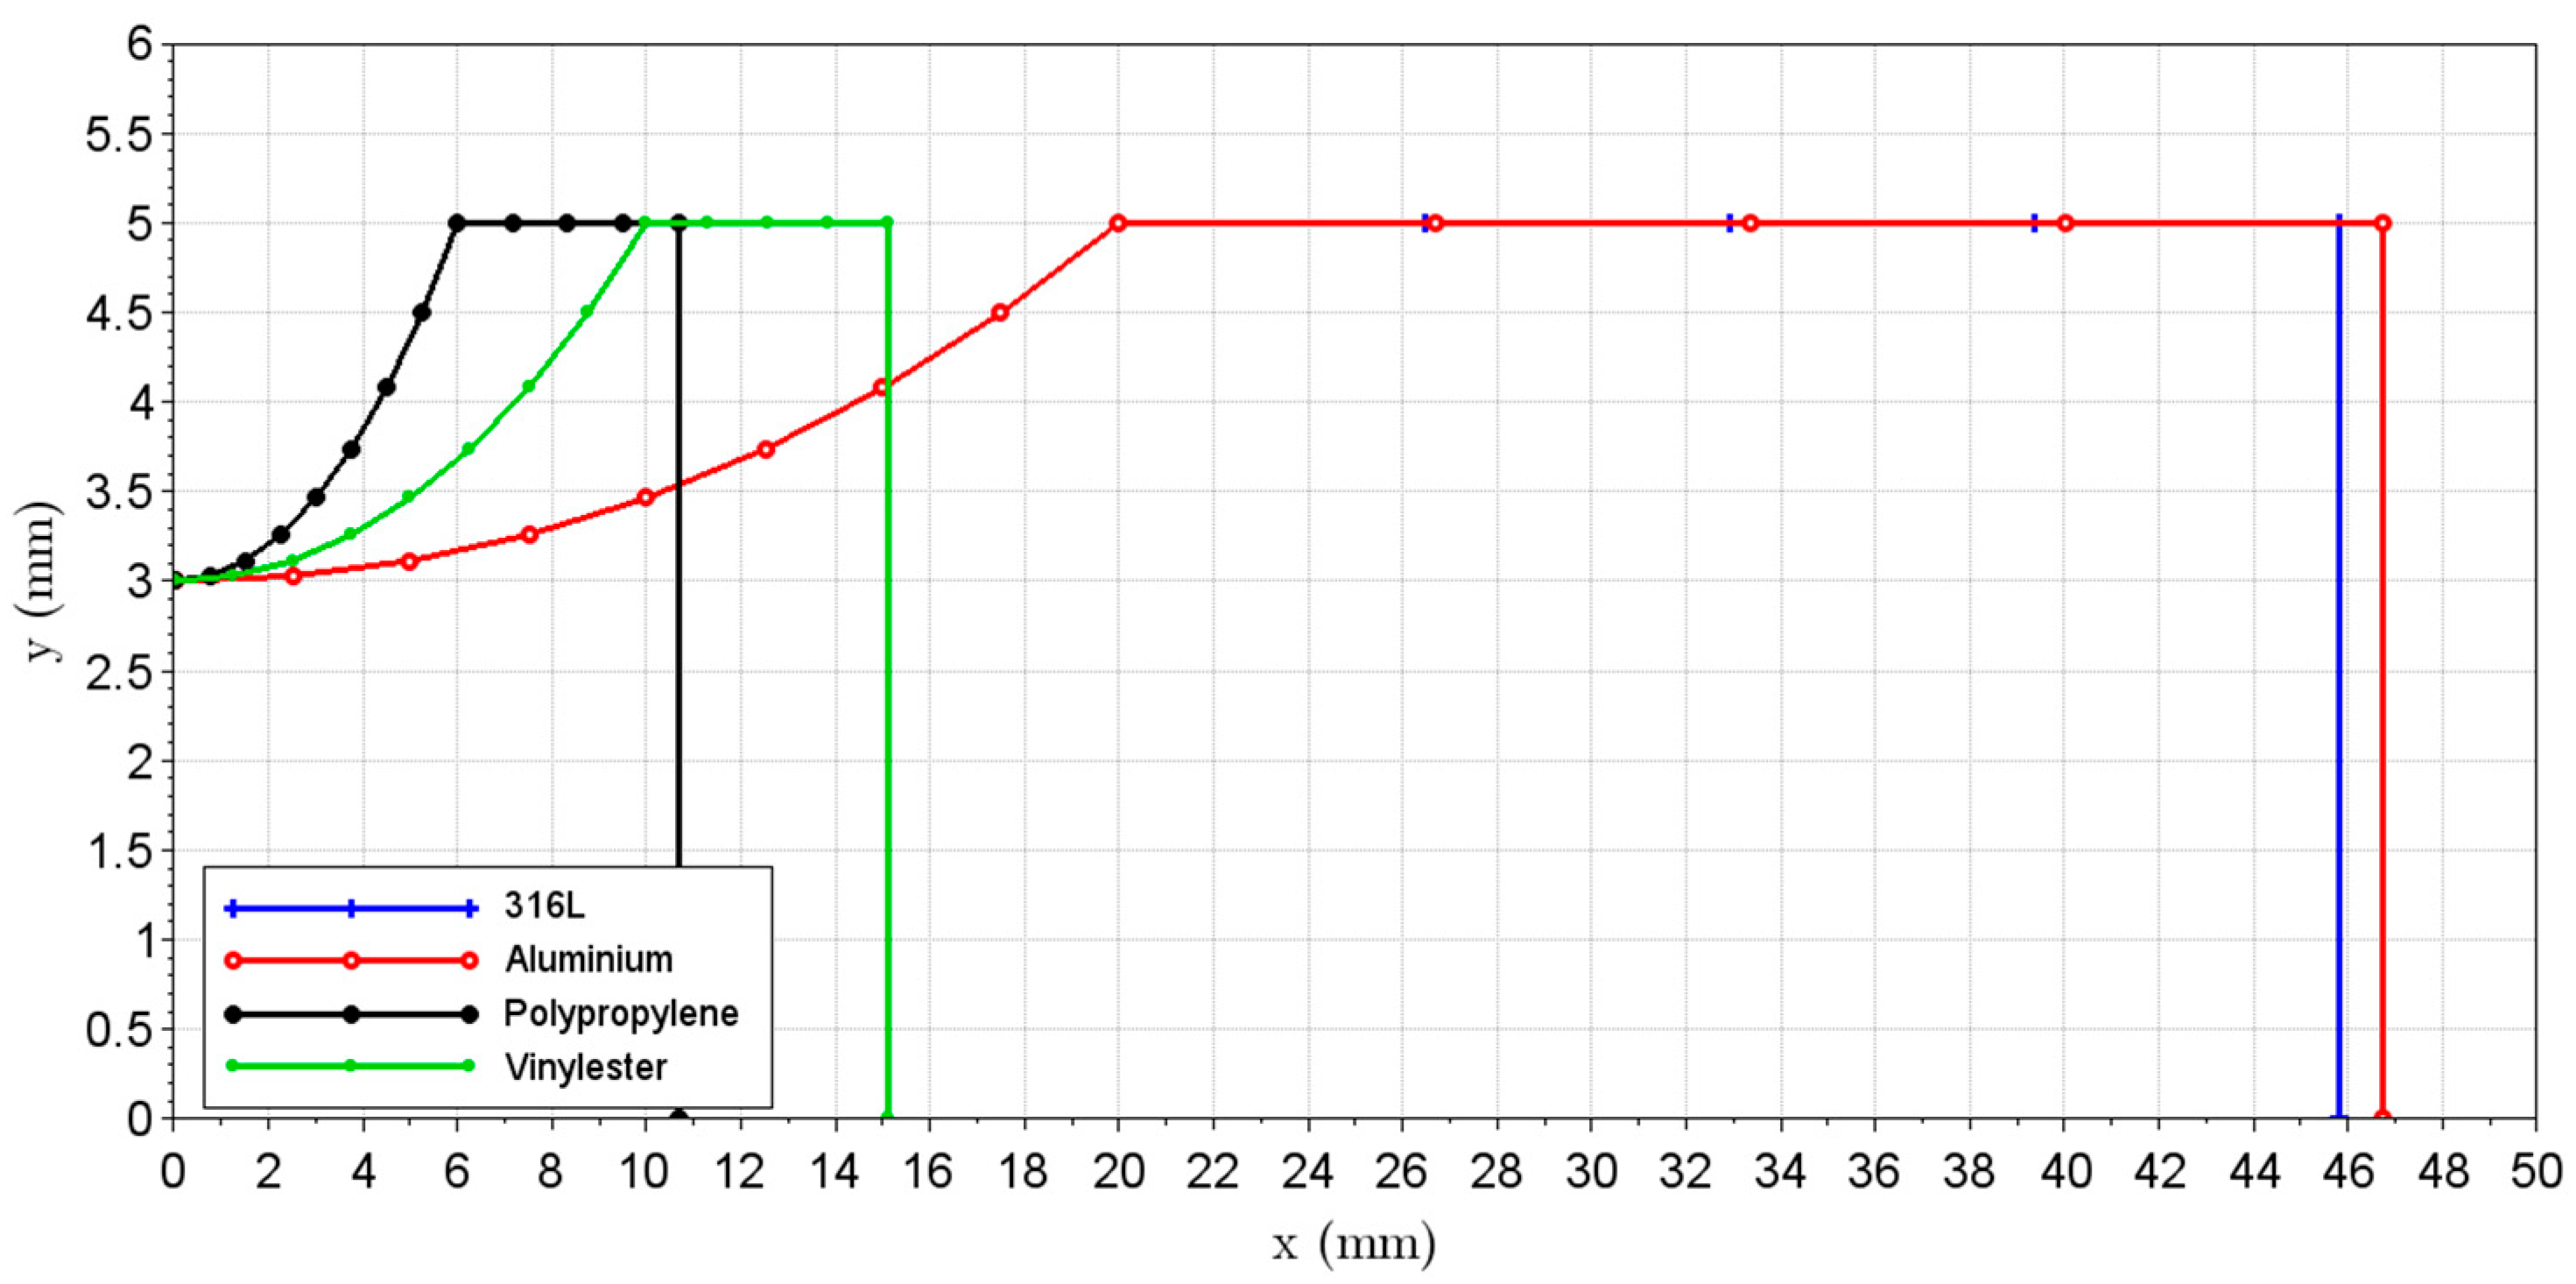
2.2. The Effect of Material Properties on the Specimen’s Natural Frequency

Only two material properties are influent in the specimen’s natural (undamped) frequency [1]: the elasticity modulus, E, and the density, ρ. The stiffness of a specimen is directly proportional to its elasticity modulus. Therefore, a higher elasticity modulus will lead to stiffer specimens, which will lead to higher natural frequencies, as shown in Equation (1). On the other hand, the material density will have an opposite effect; a higher density will lead to lower natural frequencies, since it increases the inertial component (M). Moreover, higher-density materials will also increase the stress levels at the specimen testing section for a given geometry, since the inertial component is increased.
When incorporating the damping component, the damped natural frequency can be written as
ω d = ω n   1 ξ 2   ,
where ξ is the damping ratio. Since the damping ratio for metals is typically a value much smaller than 1, and this component contribution is squared, ω d is very close to ω n , and for most applications they are considered equal.

Material Properties and Specimen Geometry

The present section aims to provide some discussion regarding the effect of material properties in the ultrasonic fatigue specimen dimensions. For the present comparison, a 20 kHz longitudinal frequency will be used for design. Moreover, the same testing section diameter was used for all specimens, 6 mm.
Four materials were analysed, with two of them metals, one representing steel and other representing aluminium alloys, and the remaining two polymers, polypropylene and vinylester. These materials with very discrepant properties were chosen in order to make more noticeable their impact on the specimen final geometry. Table 1 presents the material properties used for the specimen design, following the analytical approaches proposed in [1], the elasticity modulus (or the flexural modulus for polymers) and density.
Figure 2 presents the obtained geometries for all four materials, where y is the profile (radius), and x is the specimen coordinate (starting at centre). For simplicity, only half of the length of the specimen was drawn (symmetric). The most notable difference can be seen between metallic and polymeric materials. Due to their relatively low elastic modulus, for a certain geometry, these materials would result in components with lower stiffness (by one or two orders of magnitude), as shown in Equation (2). Therefore, the geometry must be shortened in order to increase its overall stiffness. The lower density (when comparing to metals) has an opposite effect—it will increase the specimen’s natural frequency (for a given geometry), as shown in Equation (1). However, since the differences in the elastic modulus are much greater than in the density, the overall consequence will be a shorter specimen. For example, polypropylene has a density approximately 10 times lower than steel, but its elasticity modulus is more than 100 times lower than the steel.
When comparing aluminium and steel, a fascinating behaviour can be seen, as the specimens geometries are very similar to each other. This can be explained by looking at the material properties, Table 1, and the natural frequency equation, Equation (1). Stiffness (K) is proportional to the elasticity modulus, and mass (M) varies linearly with the specimen density. Therefore, the natural frequency will vary according to the square root of the elasticity modulus and density ratio. Since the elasticity modulus of steel is approximately 3 times that of aluminium, with the same pattern the density, this relation will remain similar to both materials. Consequently, for a given geometry, steel and aluminium specimens will present a very similar natural frequency.
Table 2 presents the total specimen length for all four materials (not encompassing the additional thread length, present in some ultrasonic fatigue systems). Moreover, the maximum possible stress amplitude was also computed. For that case, a maximum displacement amplitude of 50 μm was used (common value for some commercial ultrasonic machines). When comparing steel and aluminium, even though the specimen dimensions are very similar, the maximum stress amplitude for the steel specimen is nearly 3 times higher than that of aluminium. When looking at the material properties, Table 1, it can be seen that the steel density is approximately three times higher than that of aluminium. Consequently, steel will present higher inertial forces (for the same geometry), increasing the maximum stress amplitude at the testing section. For example, if higher stress amplitudes were desired for testing an aluminium alloy, changes in the specimen geometries must be performed, like reducing the testing section diameter.
When looking at polymeric materials, since the obtained geometries were smaller, a lower inertial contribution will be presented. The inertial term is decreased even further by the lower density (when comparing with the analysed metals, for example). The obtained maximum stress amplitudes for the polymeric materials (for the present geometry and material properties) are an entire order of magnitude lower those of the metal. It is worth mentioning thin the present analysis only encompasses the material property effects on the specimen geometries, and changes in specimen geometries might be necessary to achieve the necessary stress levels for performing VHCF tests in these materials.

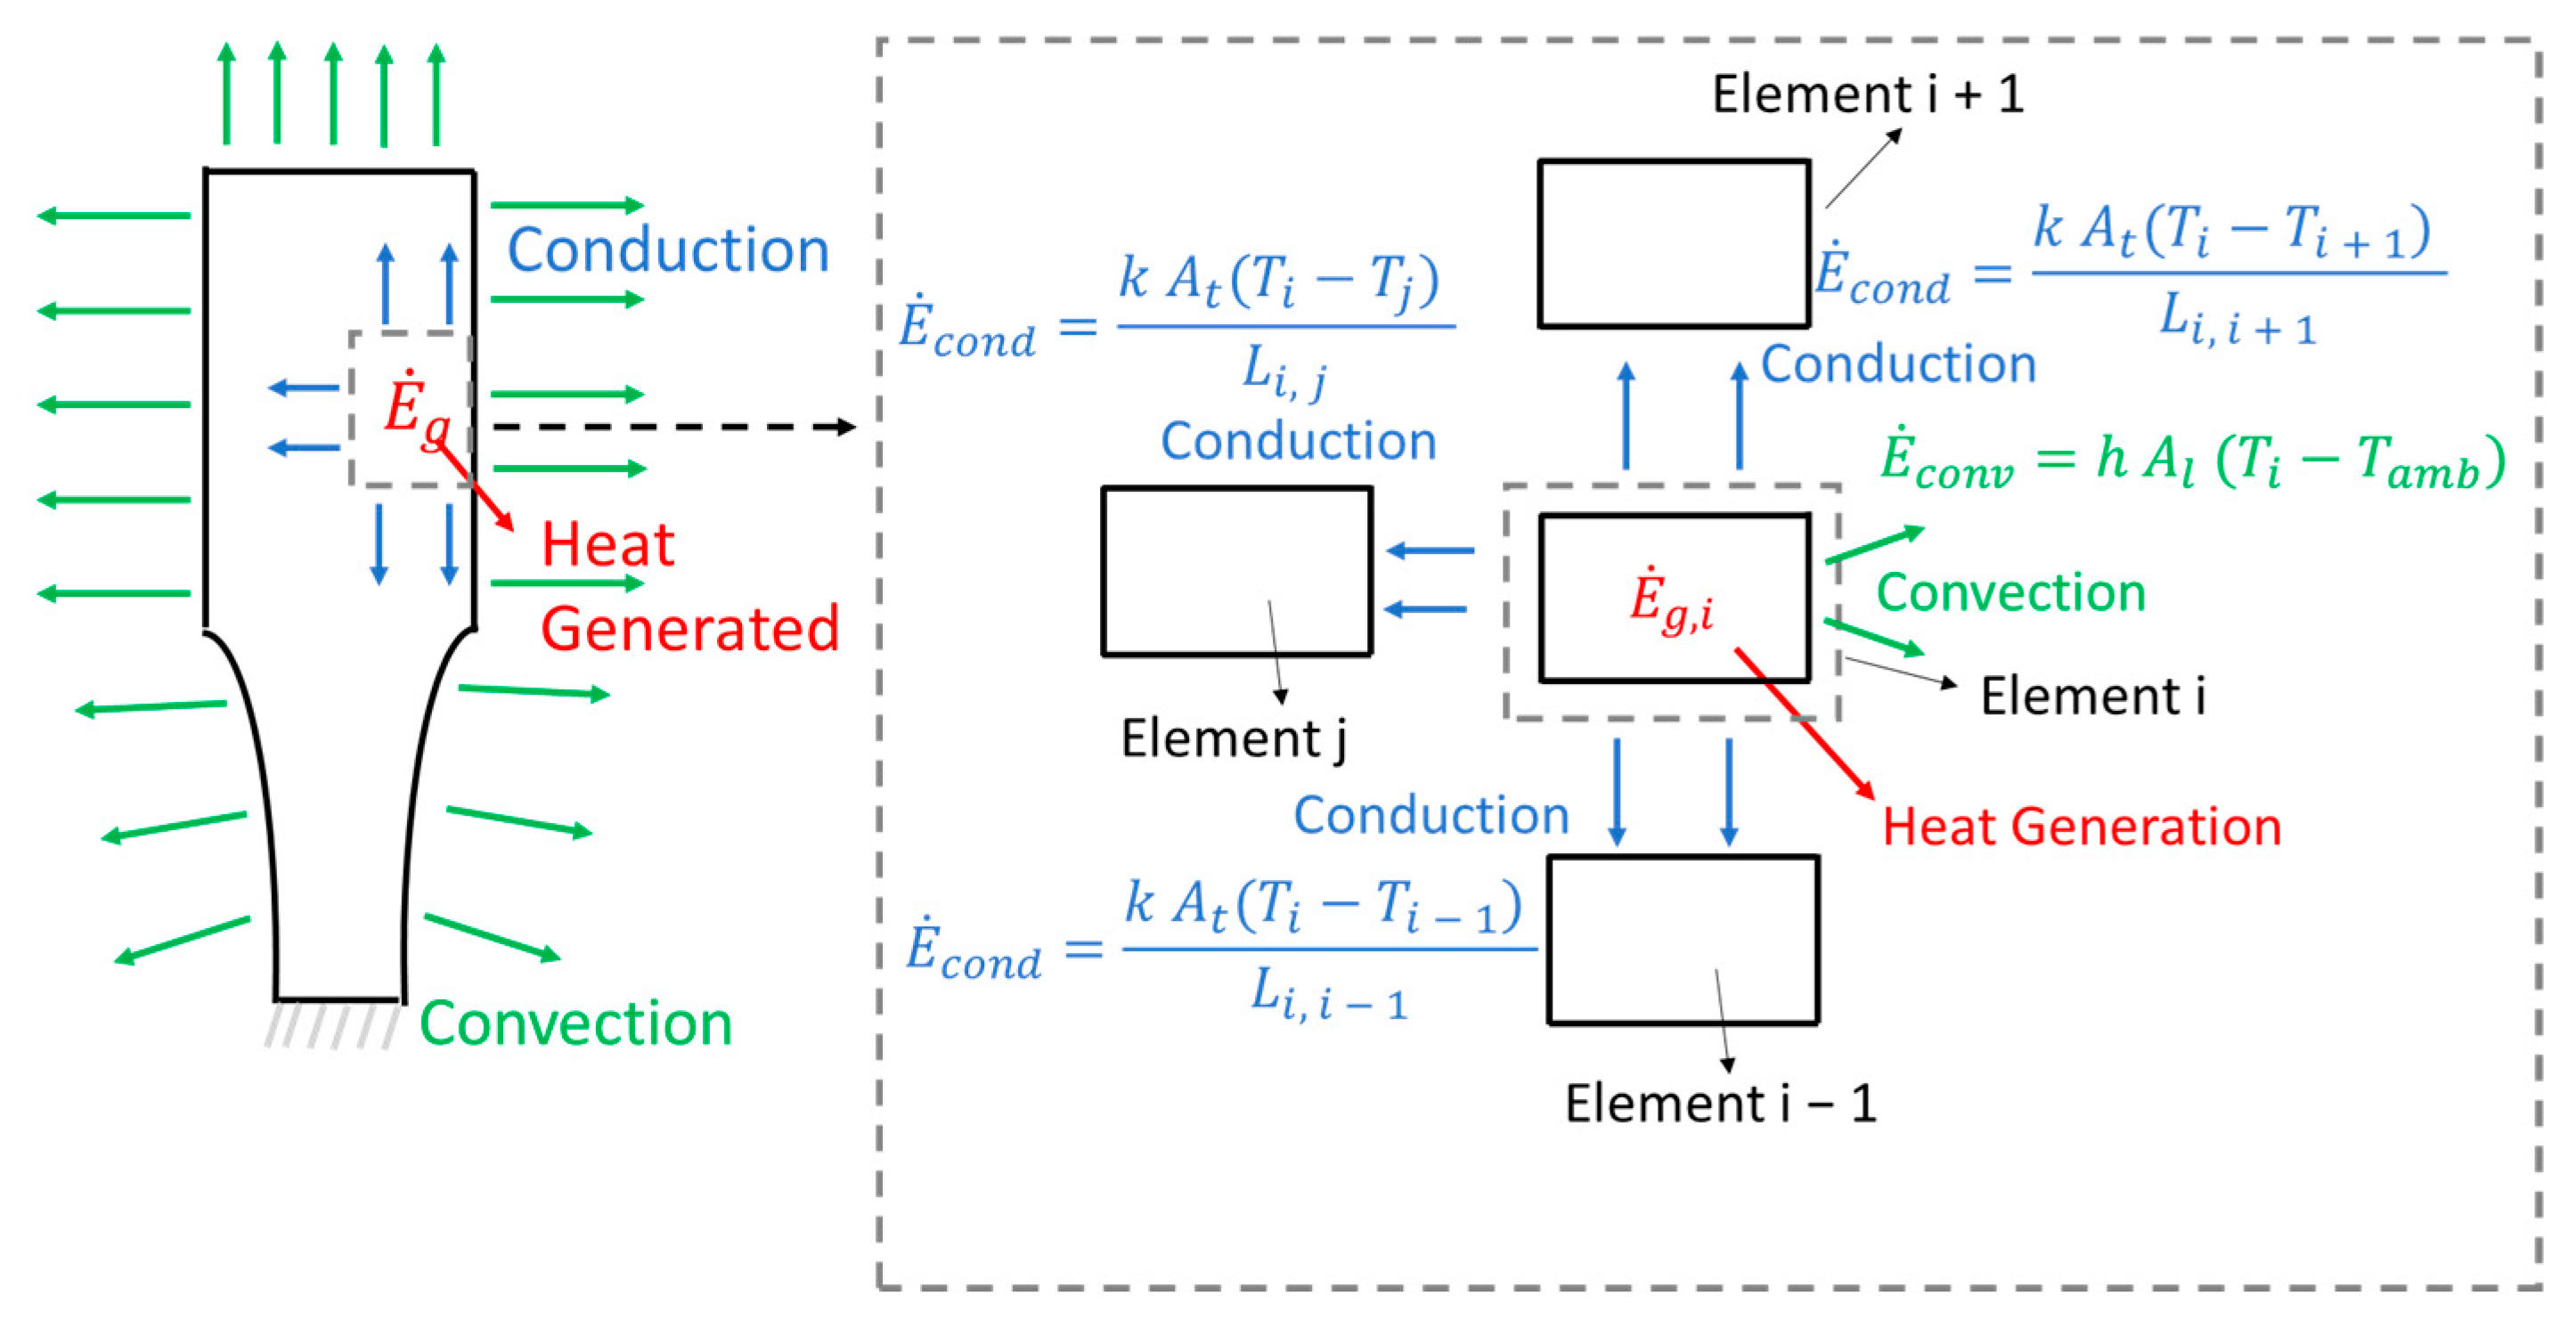
2.3. Important Parameters Affecting Heat Generation and Specimen Temperatures

Energy dissipation is an intrinsic characteristic of real-life systems. Fatigue systems are no different. Every loading cycle encompasses stored energy, a certain quantity of which is dissipated per cycle. Materials subjected to loads under the elastic regime presents an elastic potential energy (per unit of volume) described as
E e = σ ε 2 ,
where σ and ε are the stress and strain amplitudes, respectively. According to Hooke’s law, at the linear elastic regime, the stress can be written as a function of the elasticity modulus and strain, as
σ = E   ε .
Therefore, the elastic energy can be written only as a function of stress and the elasticity modulus,
E e = σ 2 2   E .
The dissipated energy per cycle can be written as function of the available elastic energy, E e , and a material dissipation property, loss factor ( η ), as
E d = 2 π η E e .
For low values of damping, the loss factor can be directly associated with the damping ratio [21],
η = 2 ξ .
In most mechanical systems, due to relatively low damping (small values of zeta), the dissipated energy is often ignored, since it does not lead to significant dissipative effects (like an increase in temperature or noise). However, in ultrasonic fatigue tests, these dissipative effects are often very significant. Figure 3 presents an example of the elastic energy (blue) and the dissipated energy for a given value of the damping ratio (green). The ordinate axis represents the sum of elastic (Fe) and dissipative forces (Fd), while abscissas represents the displacement during a cycle. Although the dissipated energy per cycle is very low (compared to the total elastic energy available), typical excitation frequencies exceed thousands of cycles per second. Most ultrasonic fatigue machines operate at 20 kHz; consequently, the low, dissipated energy per cycle became very relevant due to the high number of cycles in short periods of time. Looking at Equations (4)–(8), the dissipated energy per unity of volume and per cycle can be written only as a function of a material damping property (like the loss factor, for example), and the stress level. Moreover, the dissipated energy per unit of time (power) is also known if material volume and frequency are both known during ultrasonic fatigue tests.
Figure 4 presents a schematic view of the heat generation and transfer of an ultrasonic fatigue specimen. A symmetry condition at the central portion of the specimen was used for simplicity. The dissipated elastic energy is mainly converted into heat. Since the central portion of the specimen presents higher stress levels, this will also lead to higher energy generated at these regions. The generated energy will be transferred to other parts of the specimen by conduction, where the material thermal conductivity (k) plays a major role. Moreover, at the specimen surface, energy will be dissipated via convection, where the convection coefficient (h), surface and ambient temperature (Ti and Tamb, respectively) and surface area (Al) will dictate how much heat is transferred. If high surface temperatures are present, it is also important to take into account the radiation, which will not be covered in the present analysis. Often, forced convection is used in order to cool down the specimen during ultrasonic fatigue tests. Compressed air is the most common solution regarding cooling. However, in severe cases, liquid nitrogen can be used.
Additional material properties are relevant for transient heat transfer analysis, like the density (ρ) and specific heat (cp). A higher specific heat will require more energy to increase the temperature of a certain portion (mass) of a material. When comparing two materials with the same specific heat, a higher density, as the property implies, will increase the amount of material mass for a given volume, which will also increase the amount of energy required to increase the temperature.

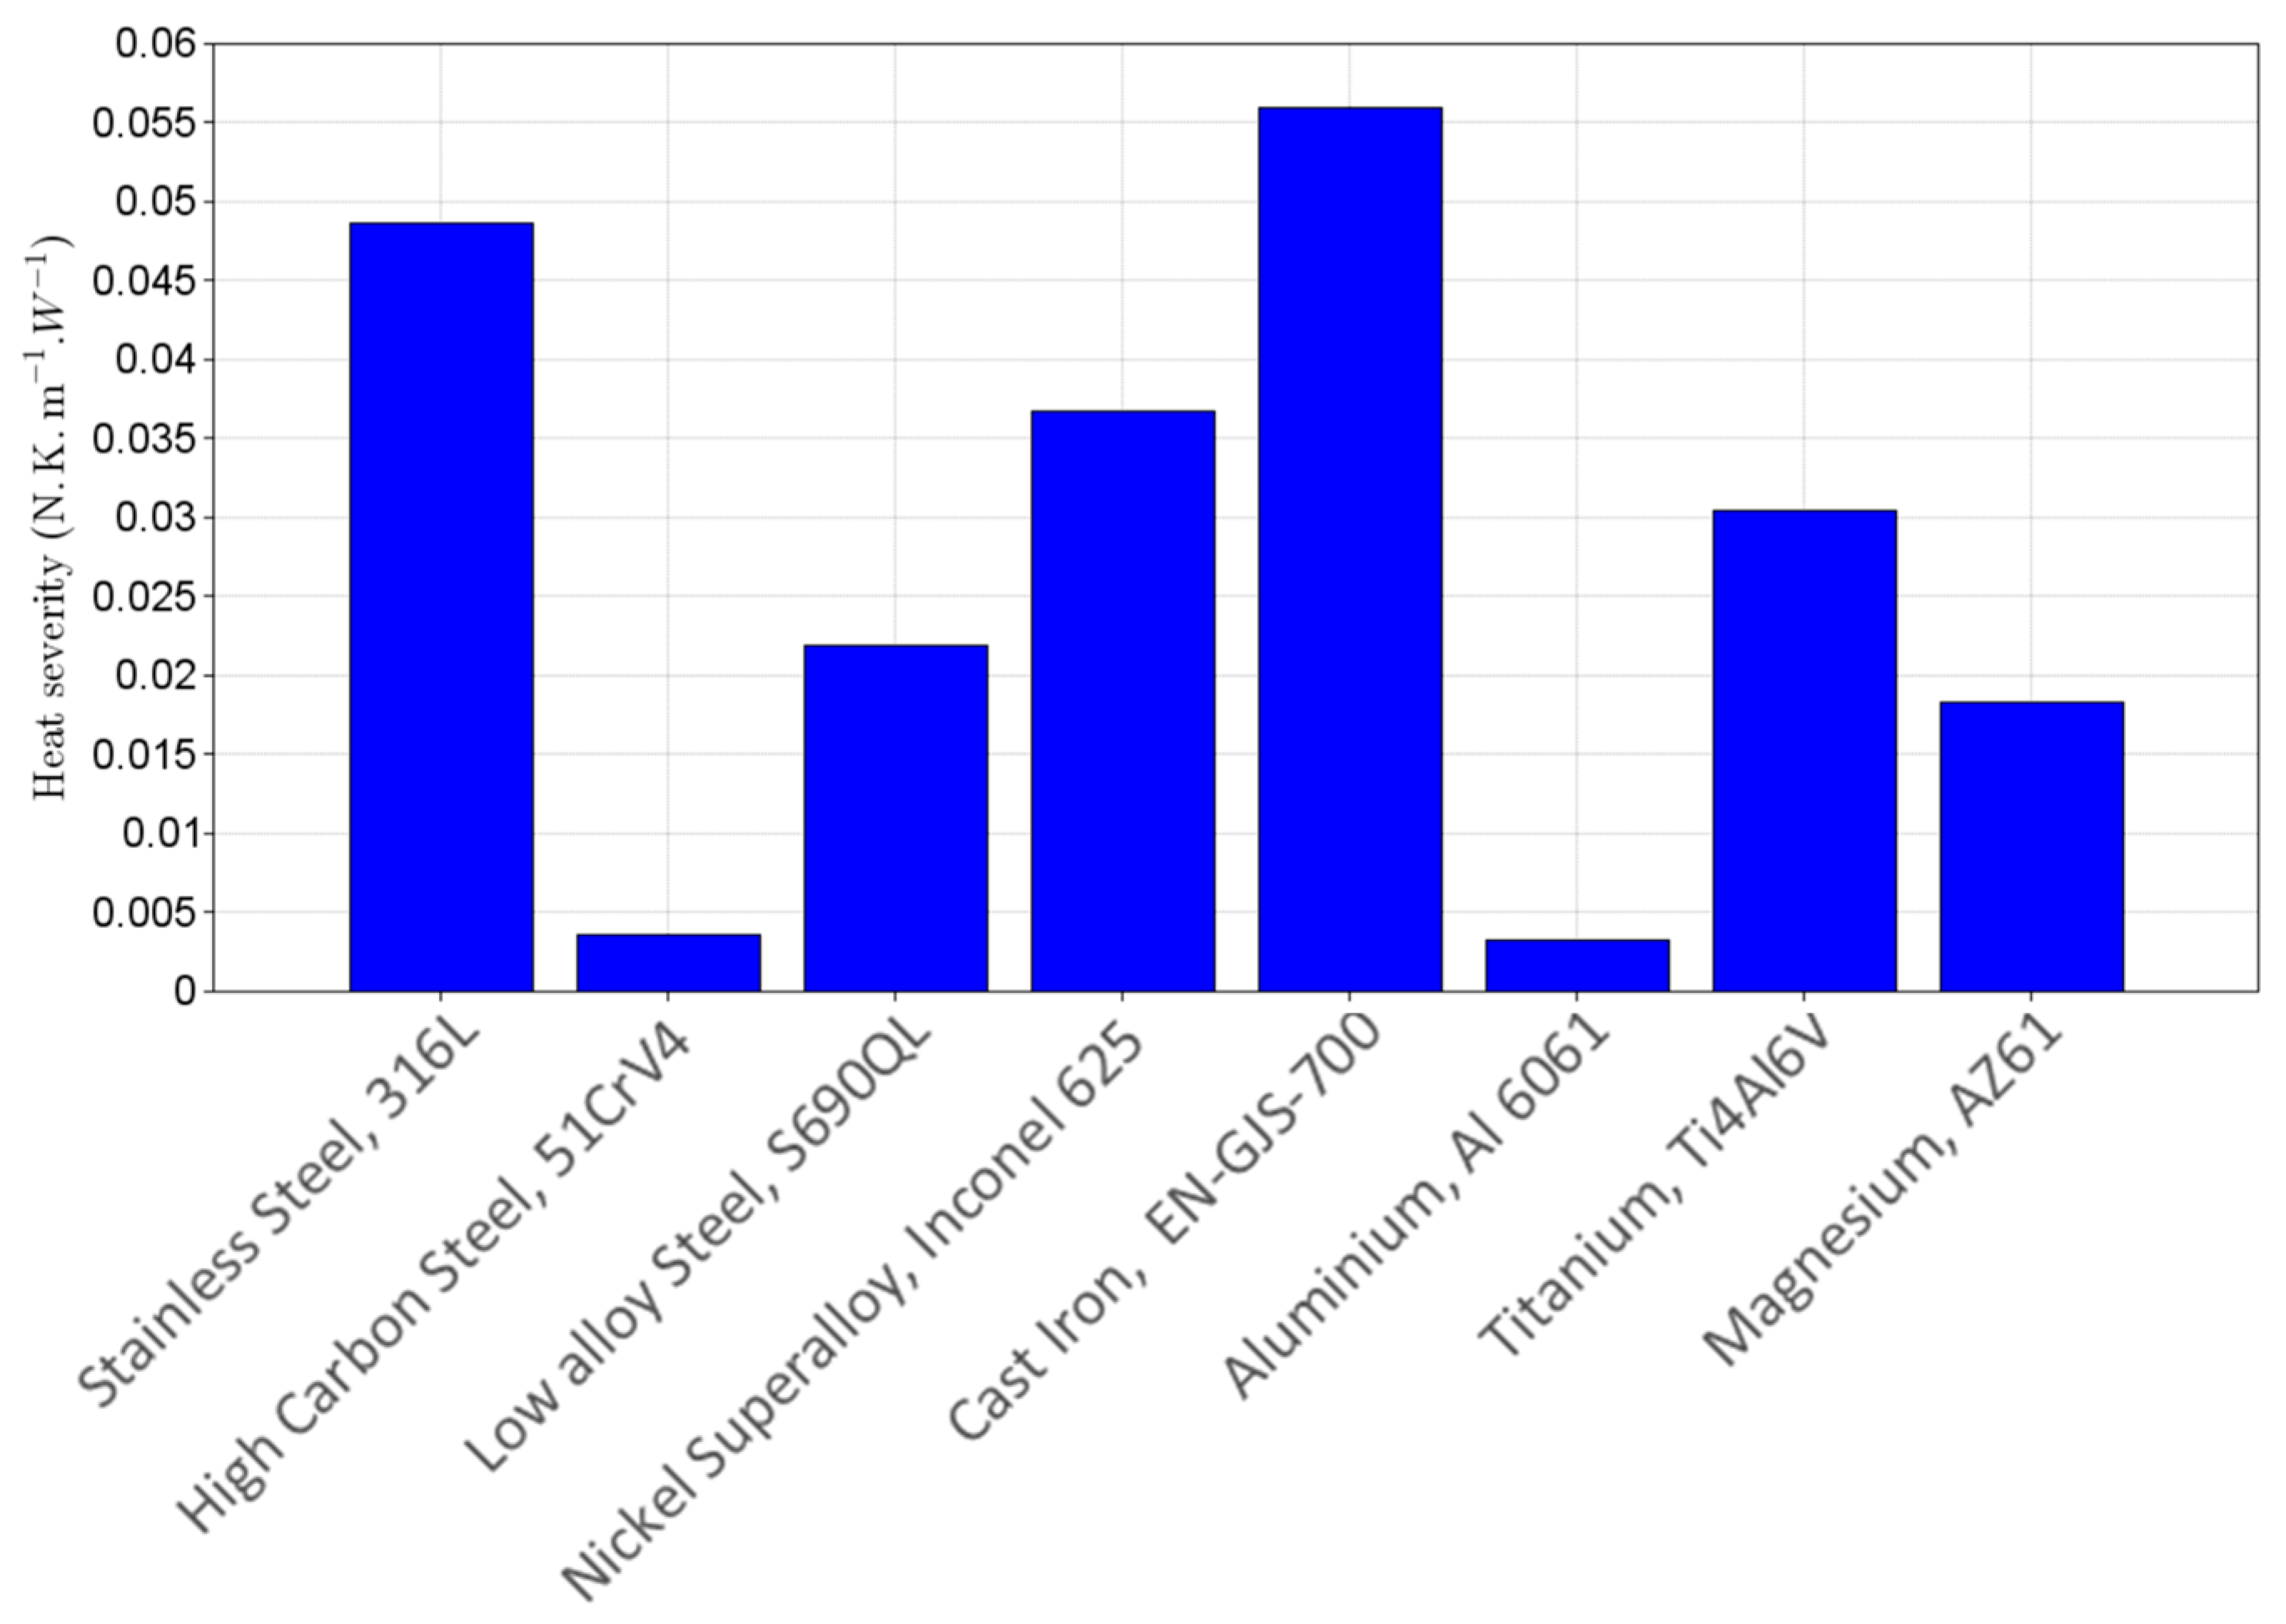
Heat Generation Severity for Different Materials

As previously discussed, the heat generation during ultrasonic fatigue tests and temperatures are a function of several material properties, and the specimen geometry too. The main goal of the present section is to provide a guideline regarding how critical a given material is regarding the heat generation during ultrasonic fatigue testing. Moreover, as previously discussed, material properties (namely the elasticity modulus and density) will affect the heat generation and temperature distribution; therefore, this effect should not be neglected. However, the present section will not encompass the geometry effect on heat generation and the temperature field.
In order to quantify this heat severity, a material parameter was developed, being a function of material properties, which will be referred here as Hs. For simplicity, three material properties were used, namely:
  • Loss factor, η: the amount of dissipated mechanical energy (and converted into heat) is proportional to the product of the elastic energy and the loss factor. When a material presented a high loss factor, a larger amount of the available mechanical energy will be converted into heat. Alternatively, the damping ratio could be used, since there is a linear relation between it and the loss factor.
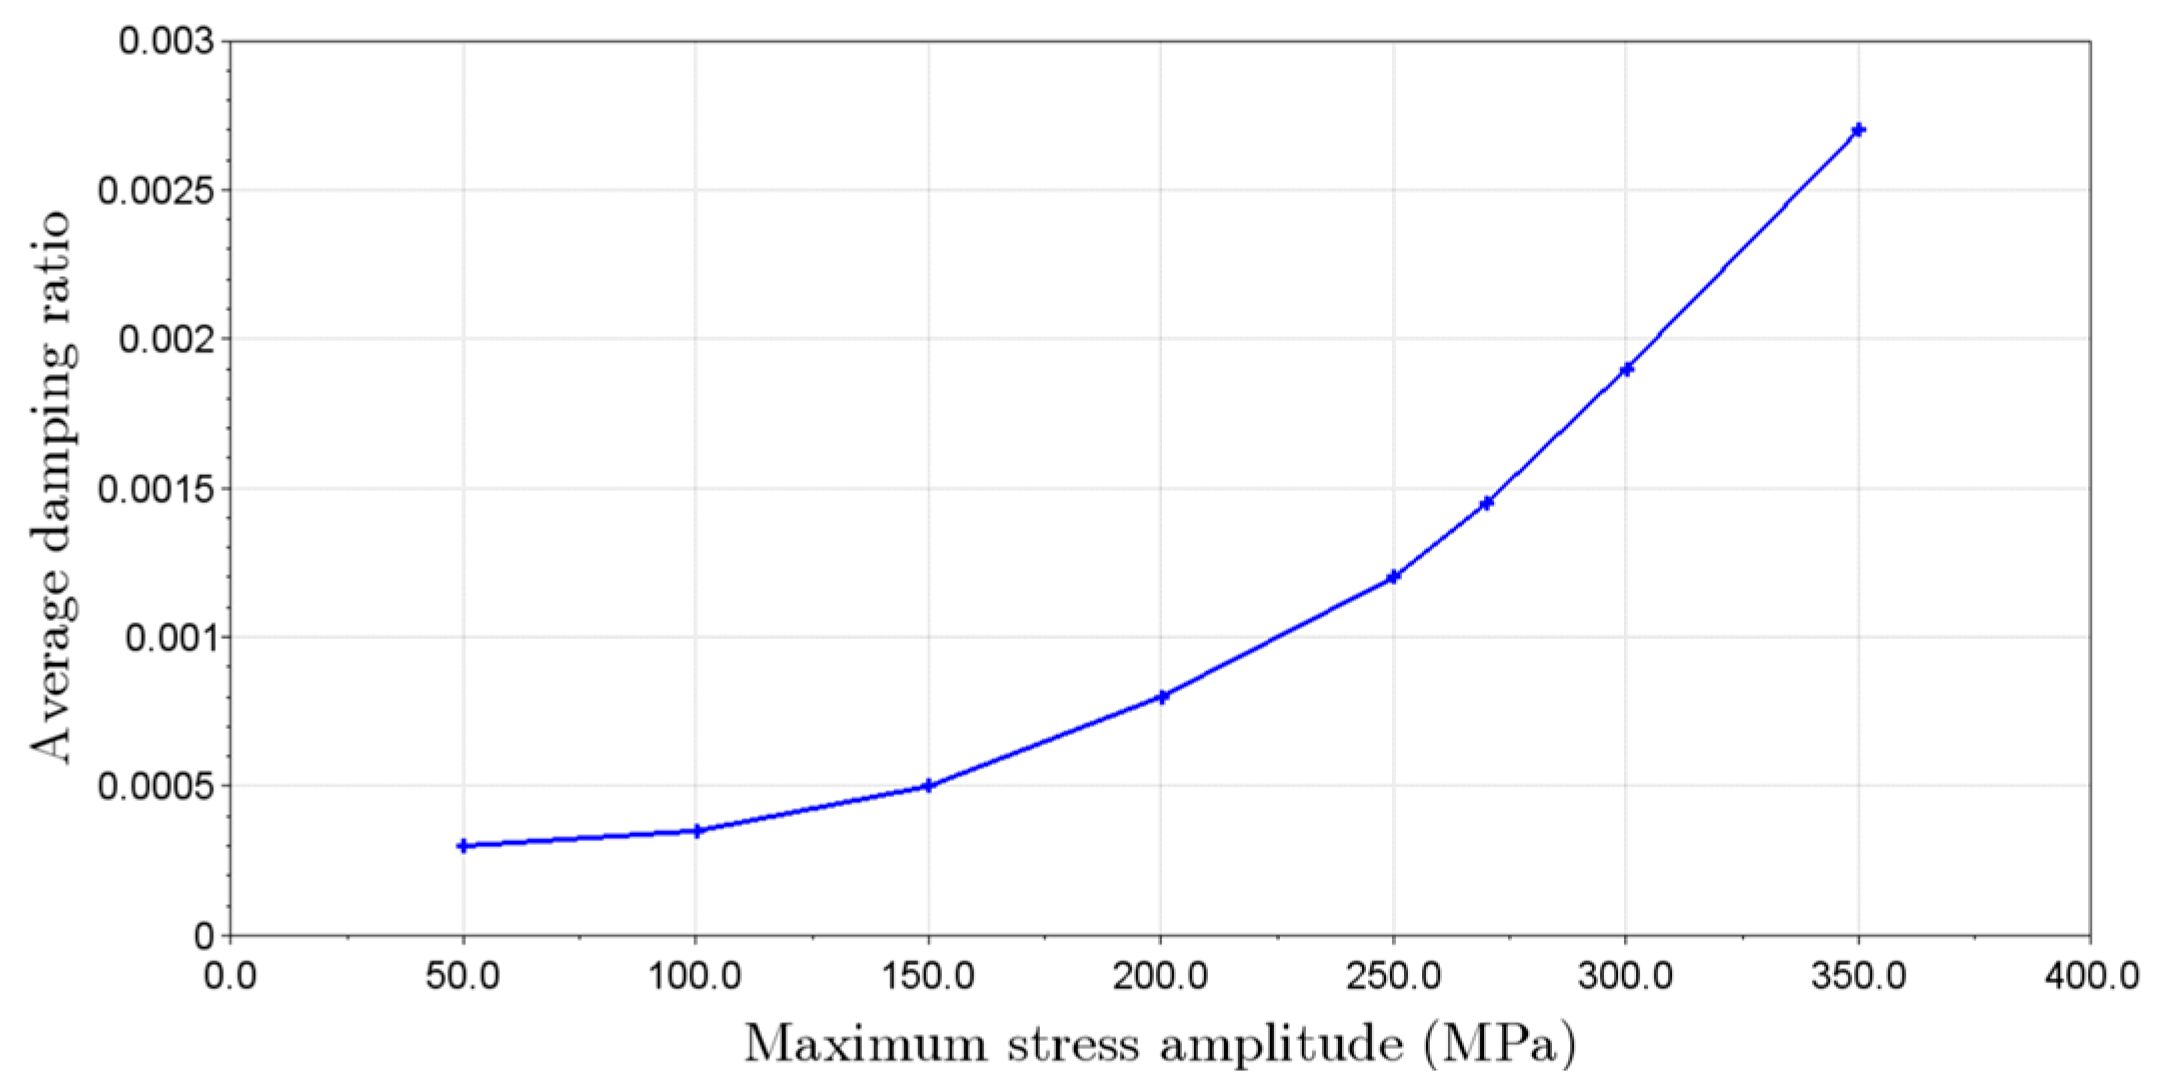
  • Fatigue limit, S f : As was observed in Equations (4)–(6), the elastic energy is proportional to the square of the stress levels. Therefore, a higher stress level will result in higher elastic energy, and due to the dissipative terms, a higher amount of energy will be converted into heat. Materials with a higher fatigue limit will have to be subjected to high stress amplitudes during tests in order to present fracture (or a crack nucleation and growth up to a macroscopic size) during ultrasonic fatigue tests.
  • Thermal conductivity, k: This parameter is directly related to how thermal energy can be transferred within a given material. A high thermal conductivity is beneficial for ultrasonic fatigue tests, since the heat generated at the testing section (higher stress levels) is easily transferred from this region.
Since higher values of fatigue limit and loss factor contribute to heat generation, these material parameters were added to the upper portion (dividend) of the heat severity parameter, Hs, as
H s = η   S f k .
On the other hand, the thermal conductivity was positioned as a divisor, since a higher value will be beneficial for the heat transfer, reducing the temperatures during tests. Other material properties, like the specific heat, could be included in a more complete analysis. For materials presenting a strong variation in damping ratios due to stress levels, it is important to use proper values of ξ , according to the test amplitudes during ultrasonic fatigue testing.
In order to understand how some materials might present high heat generation and temperatures during tests, a few metallic alloys were analysed and compared with each other using the heat severity parameters, Hs. A total of eight materials were selected, and are presented in Table 3. Three steels were used, encompassing a high strength one, 51CrV4, a structural steel, S690, and an austenitic stainless steel, 316L. Additionally, a nickel superalloy, a cast iron, an aluminium, a titanium and a magnesium alloy were analysed. All material properties were obtained from an engineering database [22], except when referred otherwise.
Figure 5 presents the obtained results for heat generation severity for the eight analysed materials, obtained using Equation (9). The cast iron EN-GJS-700 was computed as the most severe regarding “testability” in ultrasonic fatigue, mainly due to its very high damping properties (such property makes cast iron strong candidates for application in vibrating systems [18], for example) and moderate fatigue limit (leading to high stress amplitudes during fatigue tests). Next, 316L appeared as the second most severe case, mainly associated with its low conductivity (common for austenitic stainless steels) and high loss factor. This observation is in good agreement with the literature [12], where some researchers related high waiting times between loading cycles (idle) in order to avoid excessive heating.
Inconel 625 also presented one of the highest heat severity parameters during tests, due to a combination of low thermal conductivity and high mechanical properties. Once more, the literature data reporting this characteristic are also available, on researchers related issues regarding the heat generation for this alloy [26], where a specific water-cooling system was developed in order to perform ultrasonic fatigue tests in this super alloy. On the other side of the spectrum, aluminium alloy Al 6061 and high-strength steel 51CrV4 presented the lowest heat severity parameter for ultrasonic fatigue testing. The first is mainly associated with the high thermal conductivity of the aluminium, and a relative low fatigue limit (leading to moderate stress amplitudes during tests). The second, although presenting high mechanical properties, presented a very low loss factor, leading to only a small amount of the elastic energy being converted into heat.
It is important to emphasise that the goal of the present list is to provide a guideline, and some properties, especially the fatigue limit and damping ratio, might change significantly for a given alloy due to differences in its microstructure due to different heat treatments (presence of martensitic or ferritic structures for example). Residual stresses will also result in differences in these properties.

3. FEM Analysis

In order to quantify and better represent how certain material properties, specimen geometry aspects and surrounding ambient conditions affect the temperature and its distribution along the specimen, FEM analysis will be used. Since the stress/strain field and loading frequency (which is equal to the natural specimen frequency in the ultrasonic fatigue test, 20 kHz in the present case) are known, the heat generated at each specimen section can be computed and will be used as an input for the heat transfer analysis. A steady-state analysis will be performed, using axisymmetric condition. Second-order quadrilateral elements (Quad8) were used, with eight nodes. Regarding the mesh, an average size of 0.1 mm was used. Figure 6 presents a schematic view of the boundary conditions, combining convection boundaries at the outer surfaces (yellow) and isolated edges due to symmetry (red). Moreover, heat generation due to the previously discussed dissipative term was used, as a function of the stress amplitudes (variable along the specimen length) and excitation frequency. A total of 12 subregions were used regarding the heat generation (each of them having an average heat generation for that area), with 8 of them located at the variable cross section (higher stress levels and higher heat generated, consequently) and 4 at the outer region (smaller stress amplitudes). Regarding the latter, 20 kHz will be used, since it is the most used frequency in ultrasonic fatigue specimens.
Regarding material properties, convection parameters and testing conditions, Table 4 presents the baseline that will be used. A stainless steel, 316L, was used as the baseline for material properties. In order to understand the material property effect, like the thermal conductivity of a high-carbon steel, for example, or the effect on the thermal distribution, only that property will be changed. Moreover, all simulations will be performed using the same specimen geometry, except when the change in geometry is the main focus of this study. The same is valid for testing condition (excitation frequency and stress amplitude).
In order to analyse the temperature variation at the central section of the specimen (where the maximum stresses and temperatures are present), a ratio between the surface temperature ( T s ) and the inner section (core, T c ) of the specimen will be analysed, written as
R t = T s T c
where a R t value closer to 1 represents a relatively homogeneous temperature distribution at the centre (region of interest, due to the maximum stress amplitudes). For the present work, the ratios were computed using temperatures in °C.

3.1. The Effect of Specimen Diameter

Two specimen geometries were used for comparison. The first have a testing section diameter of 6 mm, which will often be referred simply as “D6”. This geometry will also be used for all other comparison cases. Regarding the second geometry, a testing diameter of 3 mm was used, referred to as “D3”. As stated before, due to the resonance frequency condition, it is not possible to only change one dimension, since it would lead to a different natural frequency. Therefore, other dimensions were also changed. The specimens were designed to resonate at 20 kHz (1st longitudinal vibration mode) using the formulation provided by Bathias and Paris [1]. Table 5 presents the specimen dimensions used, following the notation presented in Figure 1b.
Regarding the analytical stress and displacement fields, Figure 7 presents their amplitudes along the specimen length (being x = 0 the central portion of the specimen). As stated before, the maximum stress amplitude was defined as 350 MPa. It is important to emphasise that, due to differences in specimen dimensions, the specimen will naturally present different displacement amplitudes for the same stress levels. This is an important parameter in ultrasonic fatigue testing, often referred to as specimen gain (frequently written in MPa/μm), providing the relation (for a given geometry and material properties) of the applied displacement and the resulting stress.

3.2. The Effect of Convection

The main objective of the present section is to quantify the effect of the cooling conditions in the specimen temperature. Two convention coefficients were used, 10 W⋅m−2 ⋅°C−1, representing the natural coefficient and 10,000 W⋅m−2⋅°C−1, representing force convection (typical value found for compressed air at the testing section of the specimen). Being convection the main contributor for heat exchange during fatigue tests, the present analysis aims to observe the differences between surface and inner temperatures of the specimens. Moreover, the effects of the convection coefficient will also be analysed in combination with other parameters, such as the material thermal conductivity, which will be detailed in the following section. Both D3 and D6 specimens will be analysed and compared.

3.3. The Effect of Thermal Conductivity

The effect of thermal conductivity in the temperature distribution of a specimen will be analysed. The first case will be carried out using a thermal conductivity of 10 W⋅m−1⋅°C−1, a typical value associated with stainless steels with low conductivity. The second case will be analysed for a thermal conductivity of 70 W⋅m−1⋅°C−1, common values for high-carbon steels, but considerably lower than good conductors, like cooper (values of approximately 400 W⋅m−1⋅°C−1). The specimens with testing section diameters of 6 and 3 mm will be investigated.

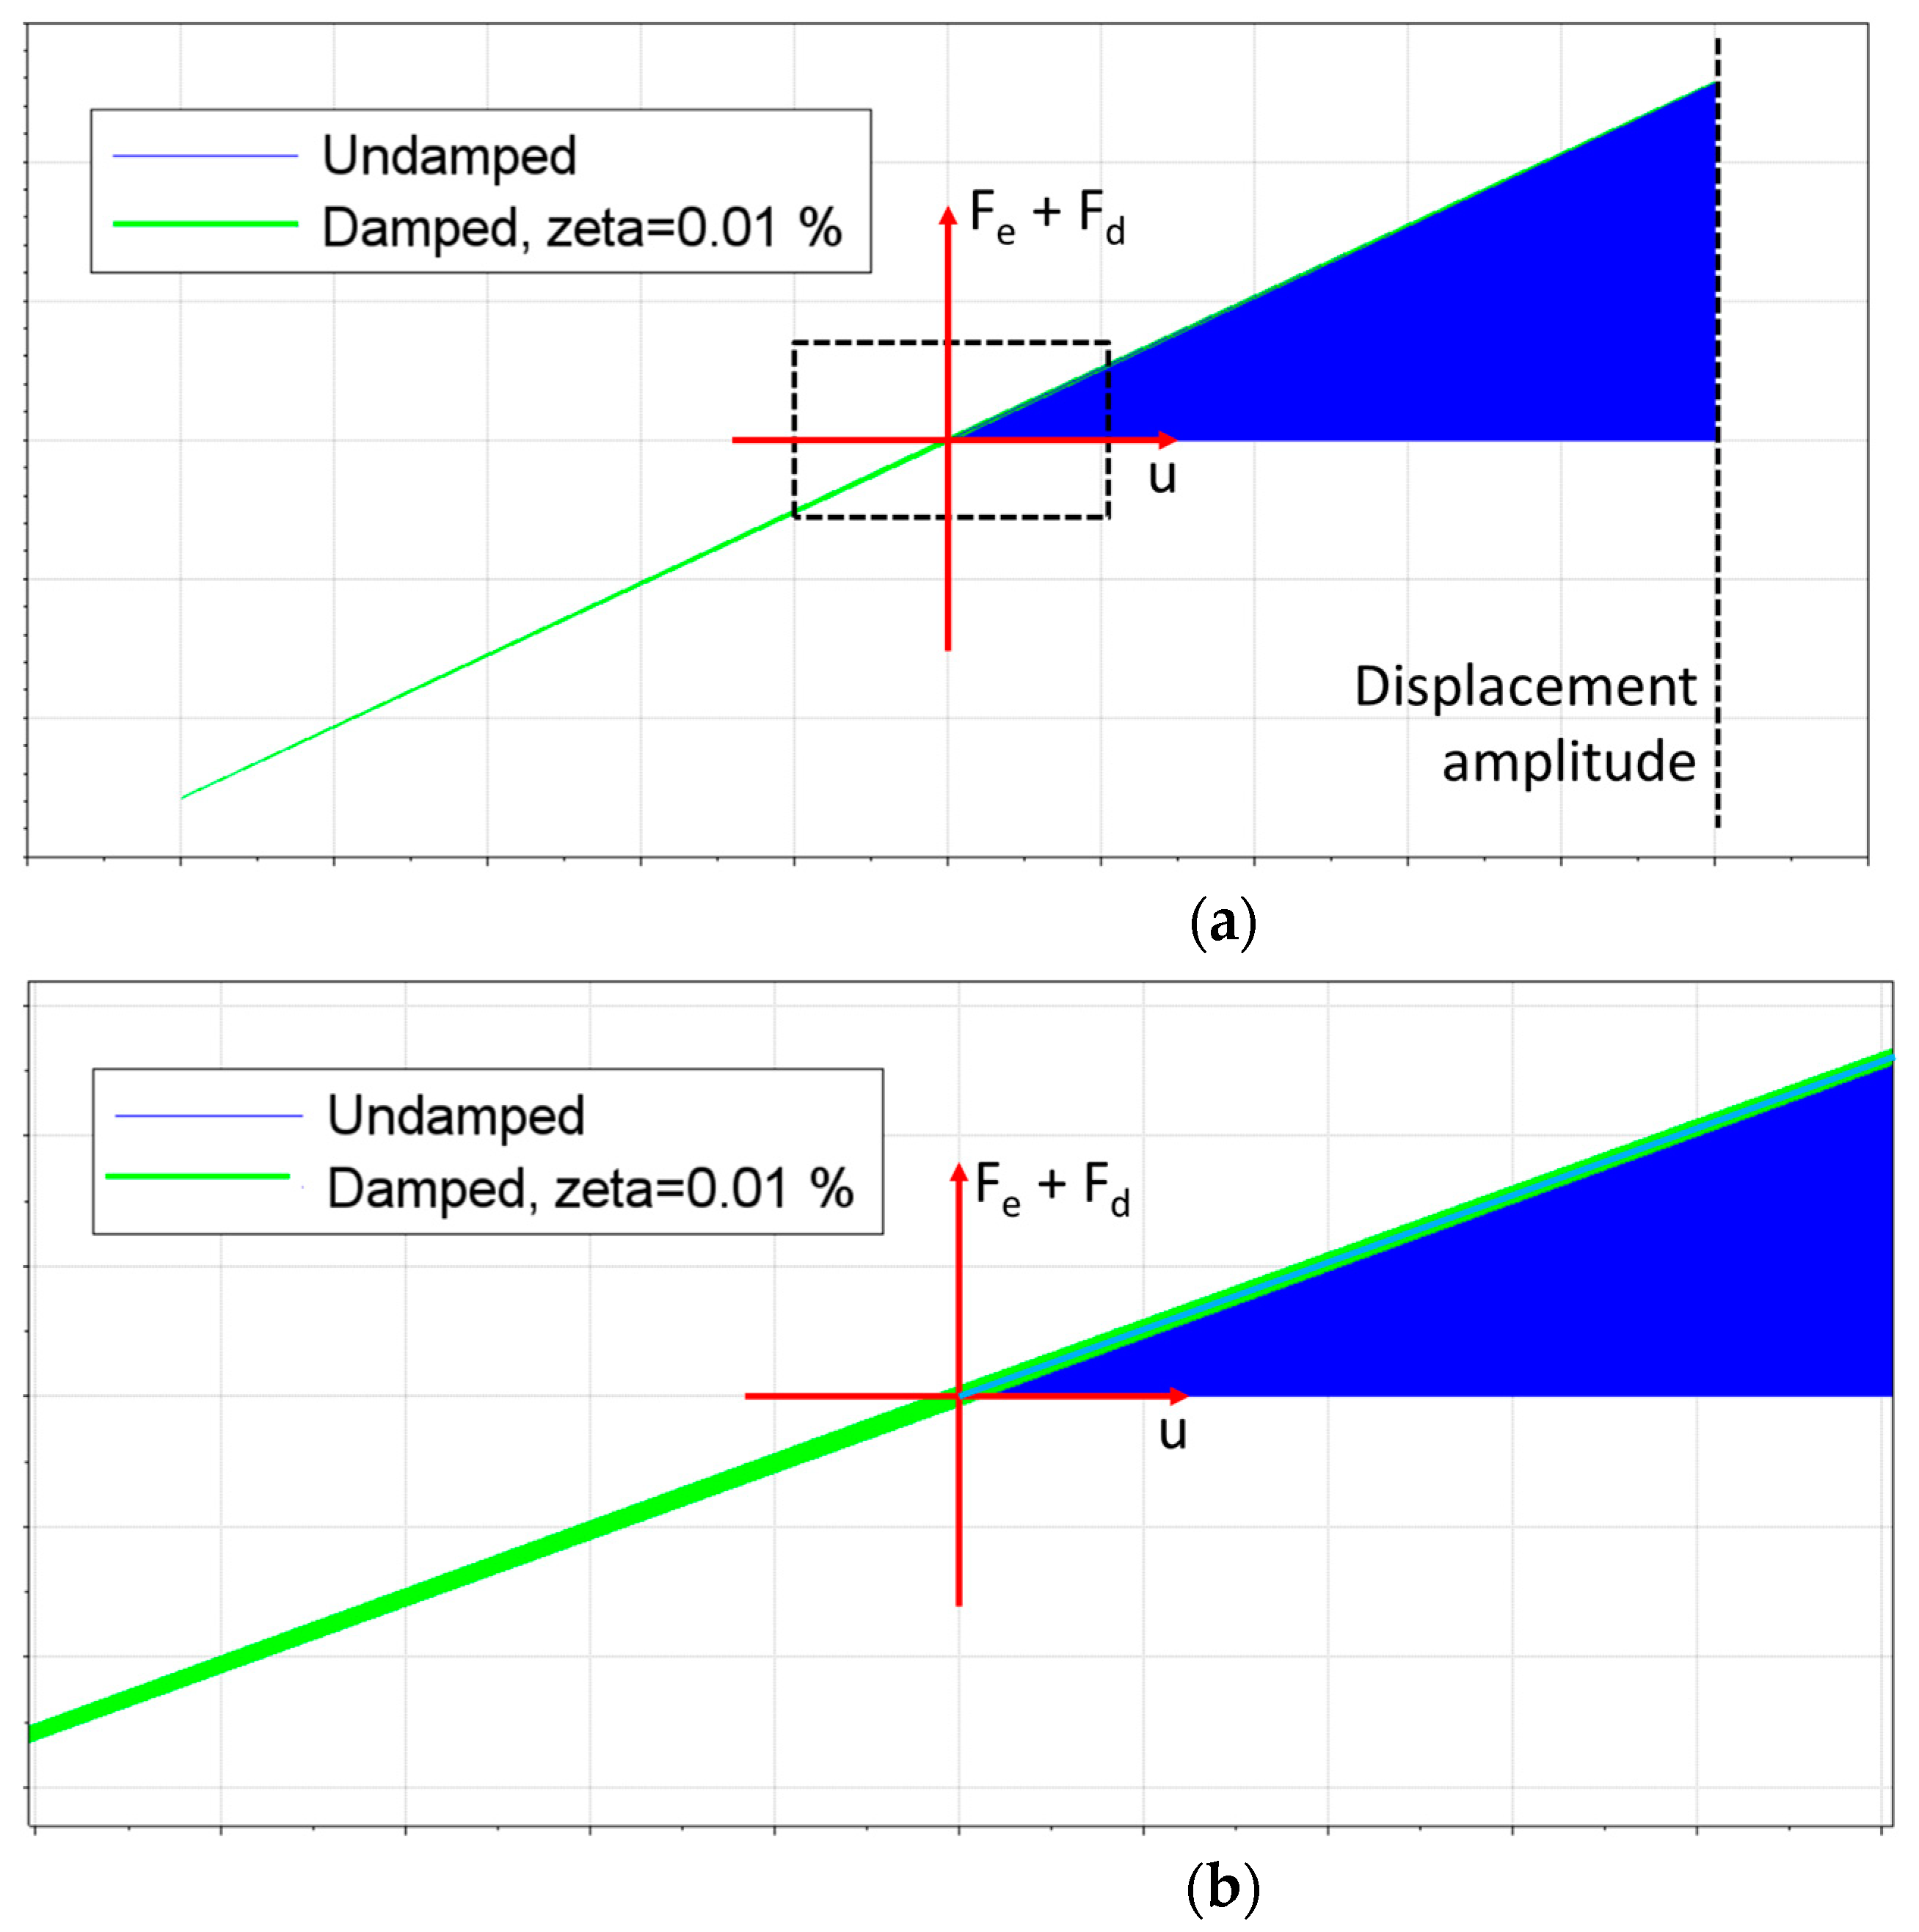
3.4. The Effect of Stress Levels and the Damping Ratio

As previously discussed, based on the analytical formulation of dissipated energy, from Equations (4)–(8), the elastic energy is a function of stress levels, while the dissipated energy depends on this elastic energy and a dissipative material property, like the damping ratio or the loss factor. Moreover, it was observed that for some materials, the damping ratio greatly increases according to the increment in stress amplitudes.
Figure 8 was developed based on the measured damping ratio (using the exponential decay) for a 316L ultrasonic fatigue specimen, as observed by Fiorentin et al. [9]. The main goal of the present analysis is to provide a comparison between three cases. The first (case 1) was a lower stress amplitude, 175 MPa (half the maximum stress cases), and a damping ratio of 0.7 × 10⁻³, as shown in Figure 8. The other two cases will present the same maximum stress amplitude, 350 MPa, but will present different damping ratios. We will consider a damping ratio independent of the stress amplitude; therefore, the same 0.7 × 10⁻³ will be used (case 2), while the remaining case will encompass the effects of a variable damping ratio, with a value of 2.7 × 10⁻³ for the maximum stress amplitude (case 3). All cases will be performed using the larger VHCF specimen (D6), with forced convection (h = 10,000 W⋅m−2⋅°C−1).

4. Numerical Results and Discussion

The present section will provide the obtained numerical results, encompassing the impact of material properties, specimen dimensions, testing parameters and cooling conditions in the specimen heat generation and temperatures.

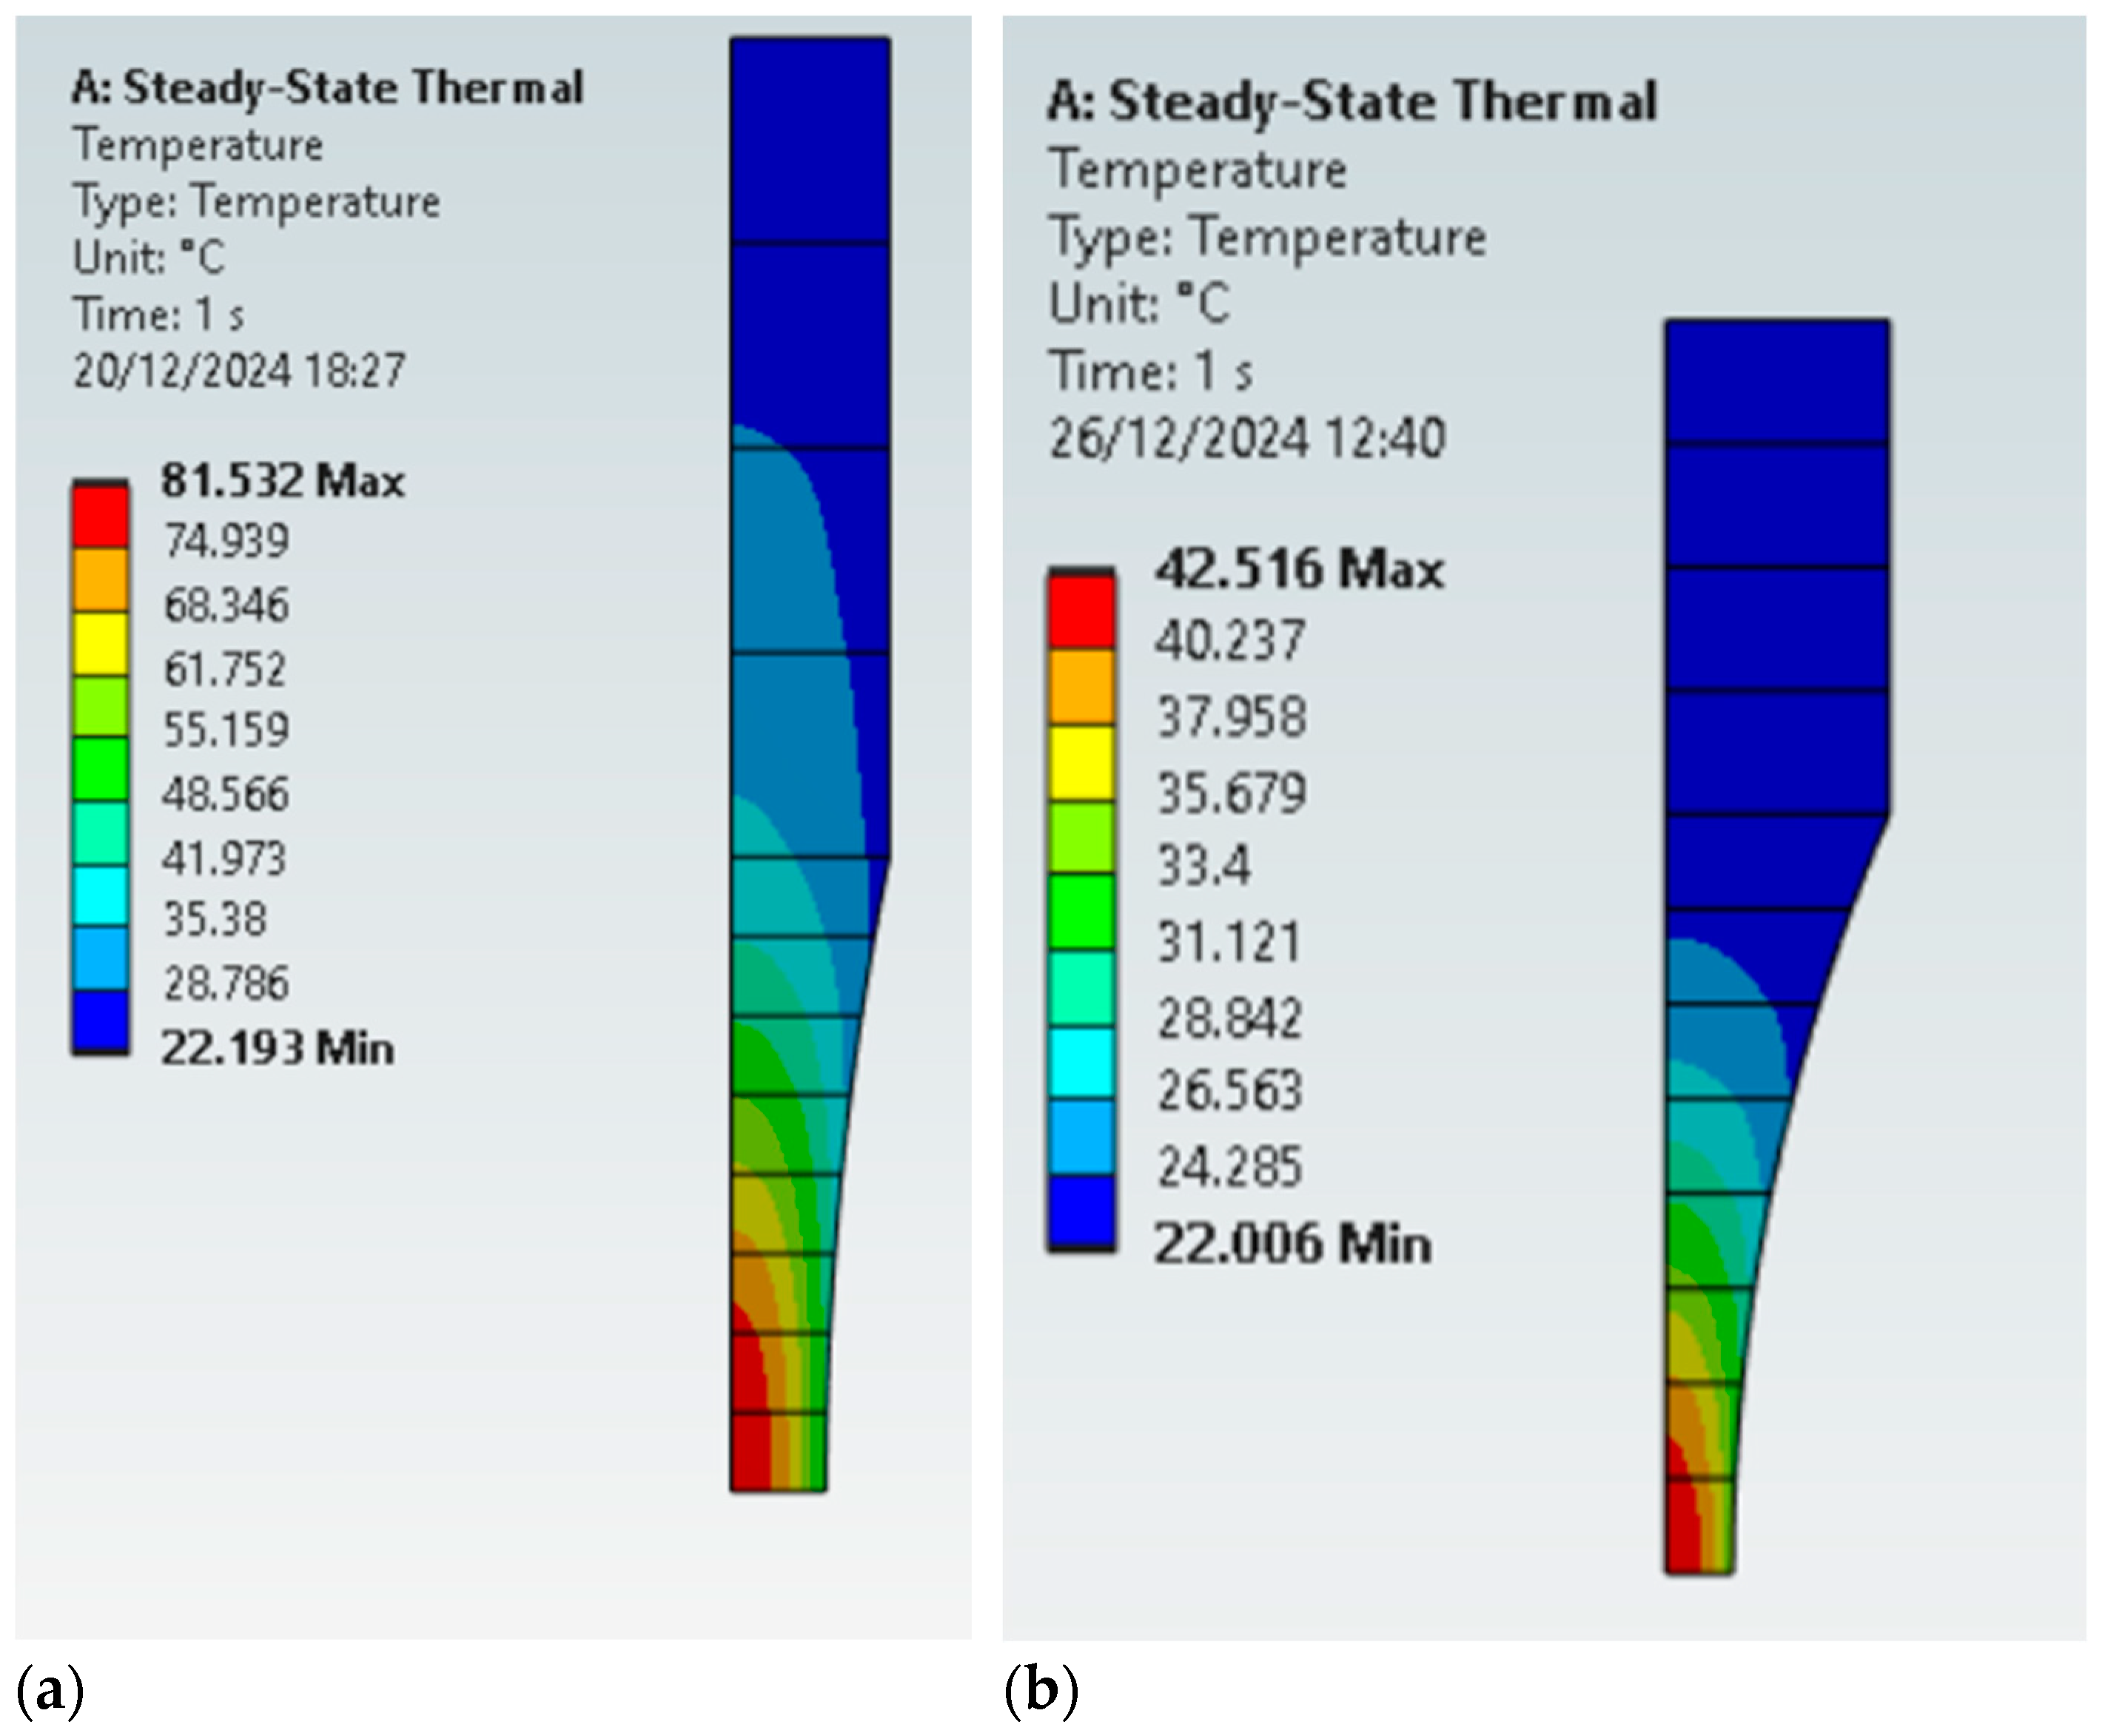
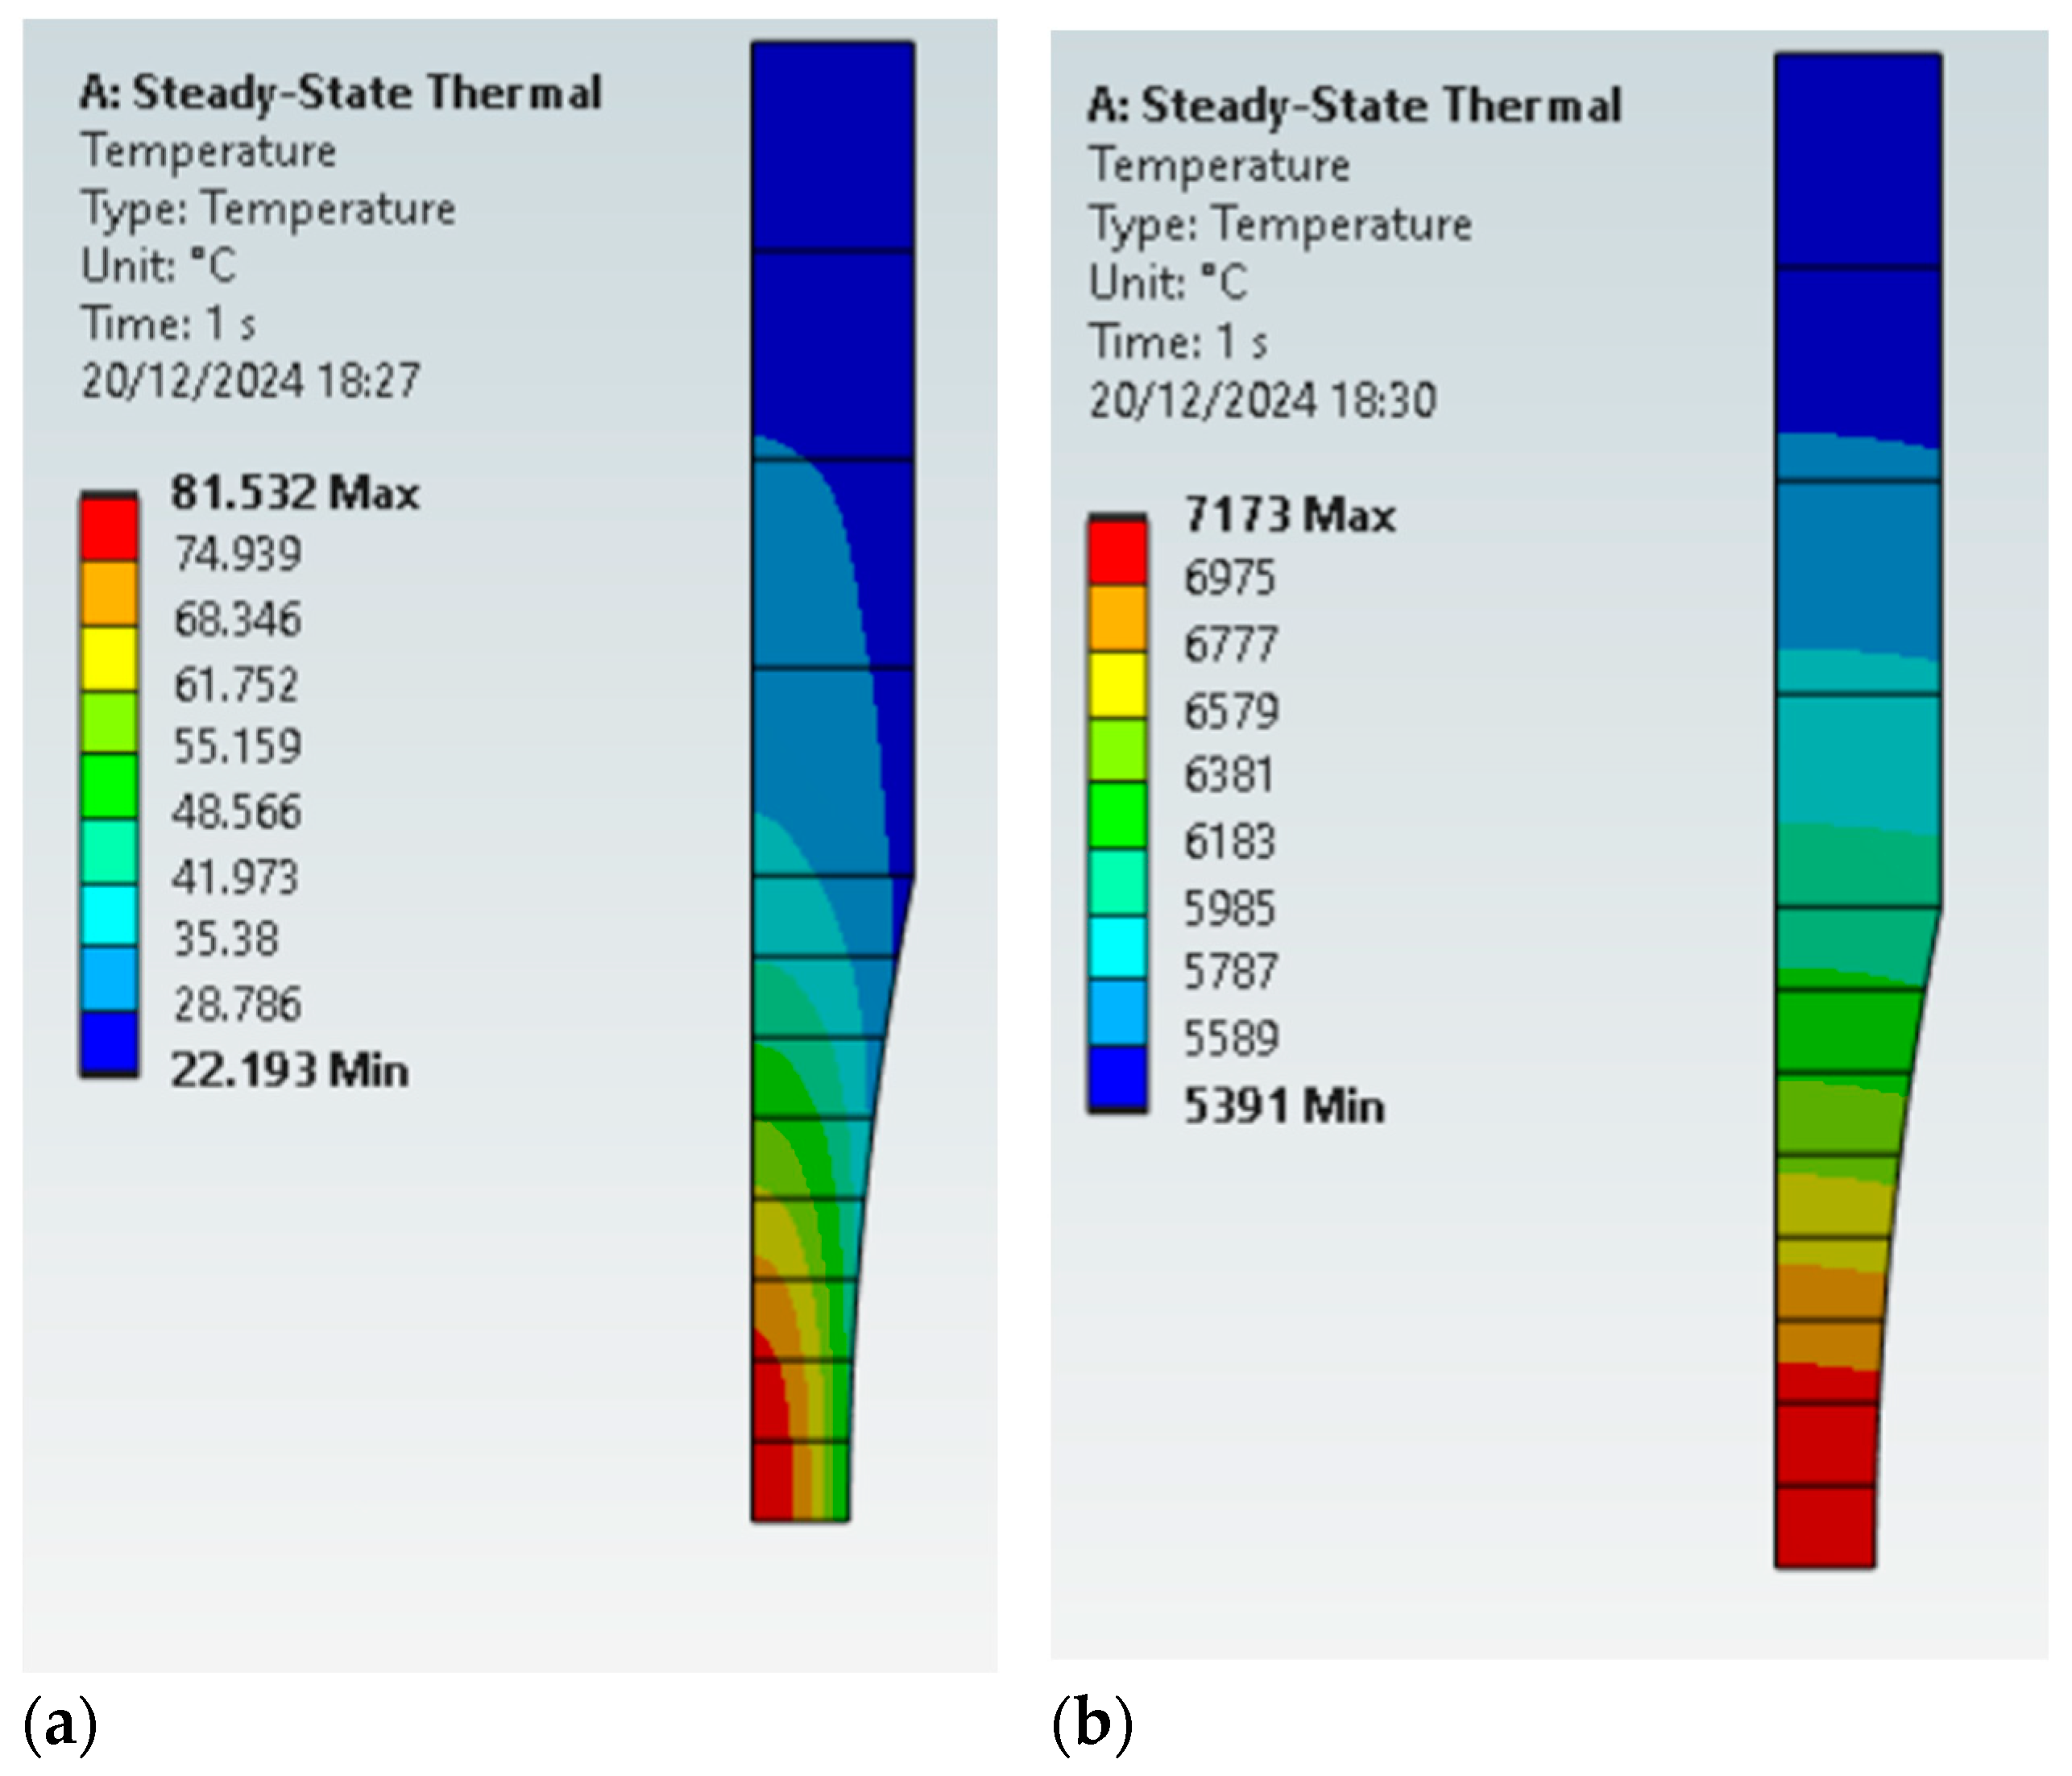
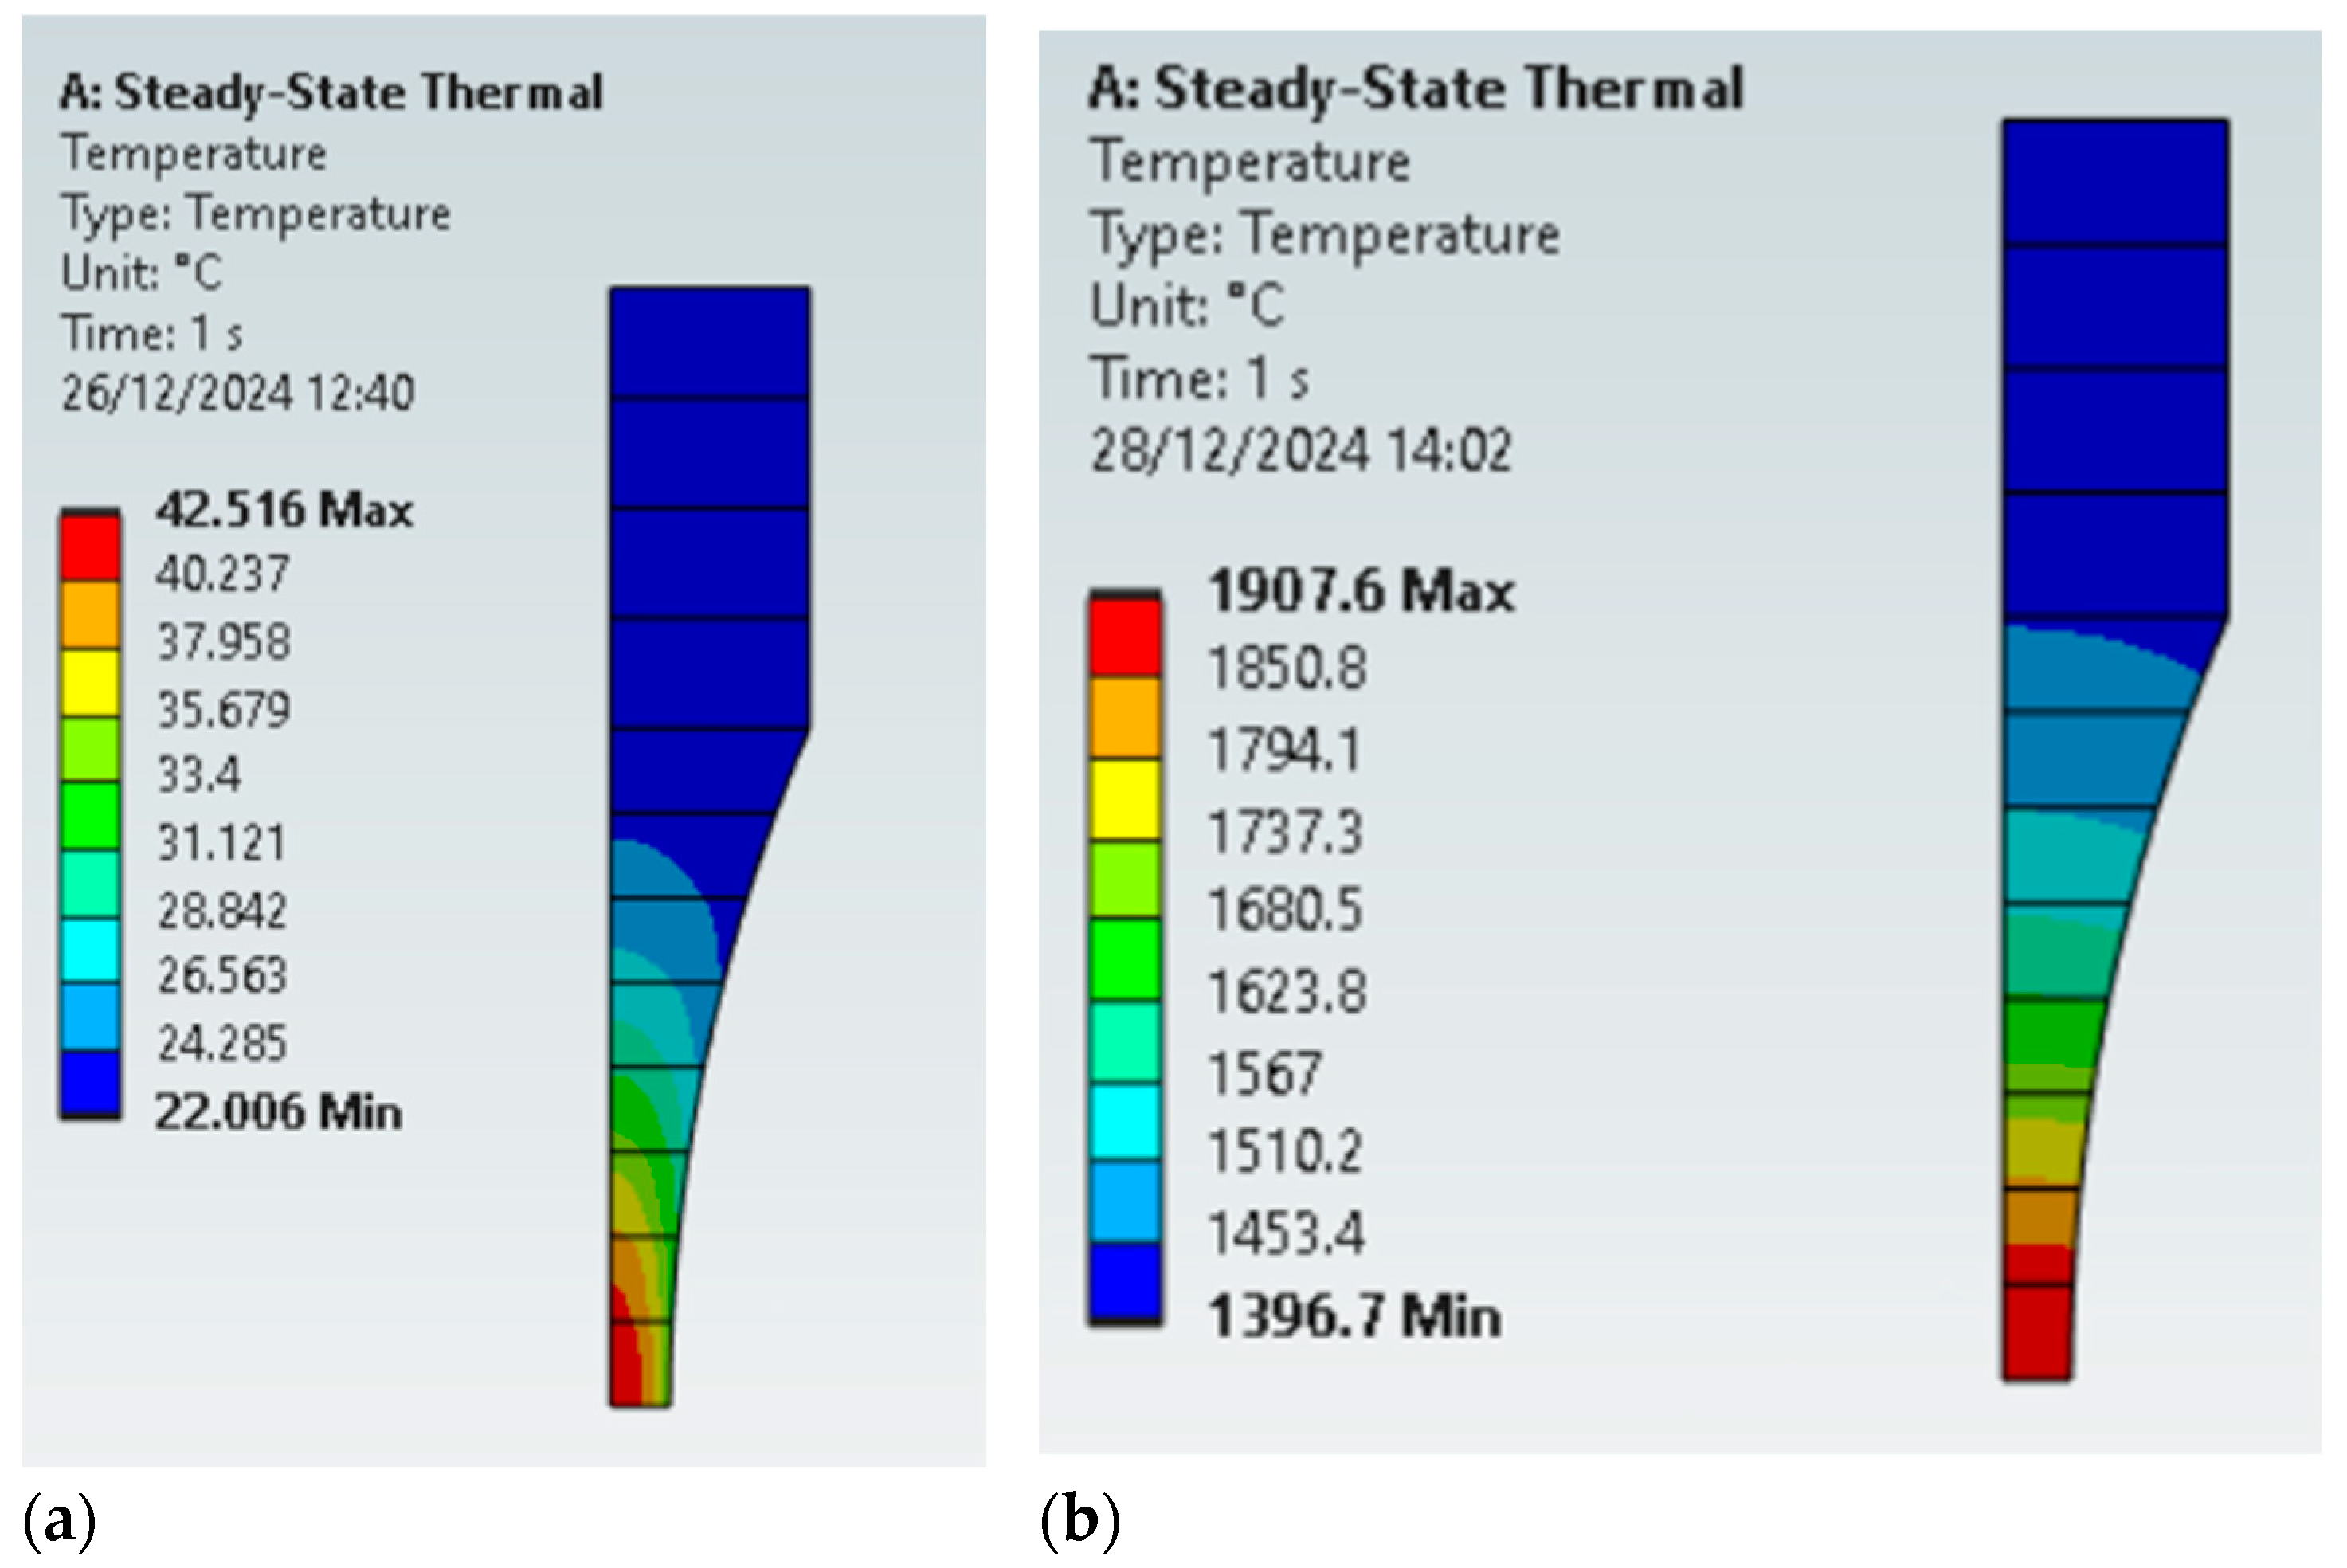
4.1. The Effect of Testing Section Diameter in the Specimen Temperature Distribution

Figure 9a,b present the thermal field for the specimens with testing section diameters of 6 and 3 mm, respectively. Although the maximum stress amplitudes were the same (and consequently the same dissipated energy per volume), with that of the specimen being D3 much smaller, this will lead to a lower total heat generated. Moreover, the heat cannot be transferred efficiently from the inner section of the larger specimen. The maximum temperature for the large specimen was 81 °C (at its inner section of the central portion of the specimen), while the smaller specimen presented a maximum temperature of 42 °C. When analysing the ratio between surface and core temperatures ( R t ) , the smaller specimen (D3) presented a more homogeneous temperature distribution at the maximum stress amplitude region, R t = 0.79, while the larger specimen presented large differences, R t = 0.58. Depending on how severe these temperature differences are, crack nucleation might occur at different locations than what it was expected for some materials, like in the specimen centre (regions with the highest temperatures).
It is important to emphasise that, even though a smaller specimen can be beneficial when looking at the heat generation and temperature aspects, reducing the specimen size will have stronger implications at the fatigue results. There is a known size effect on fatigue, where typically smaller specimens will present longer fatigue lives, since there is a smaller portion of the specimen subjected to higher stress amplitudes, and this smaller region will present lower probability of occurrence of larger defects (detrimental to fatigue life). Therefore, when designing a specimen, its dimensions must be representative (large enough), but the thermal factor must be taken into account for some materials. Moreover, drastically reducing the specimen cross section will also decrease its stiffness in the other direction (for example, the specimen will be prone to bending or lateral vibration), which can cause vibration in unwanted directions/modes.

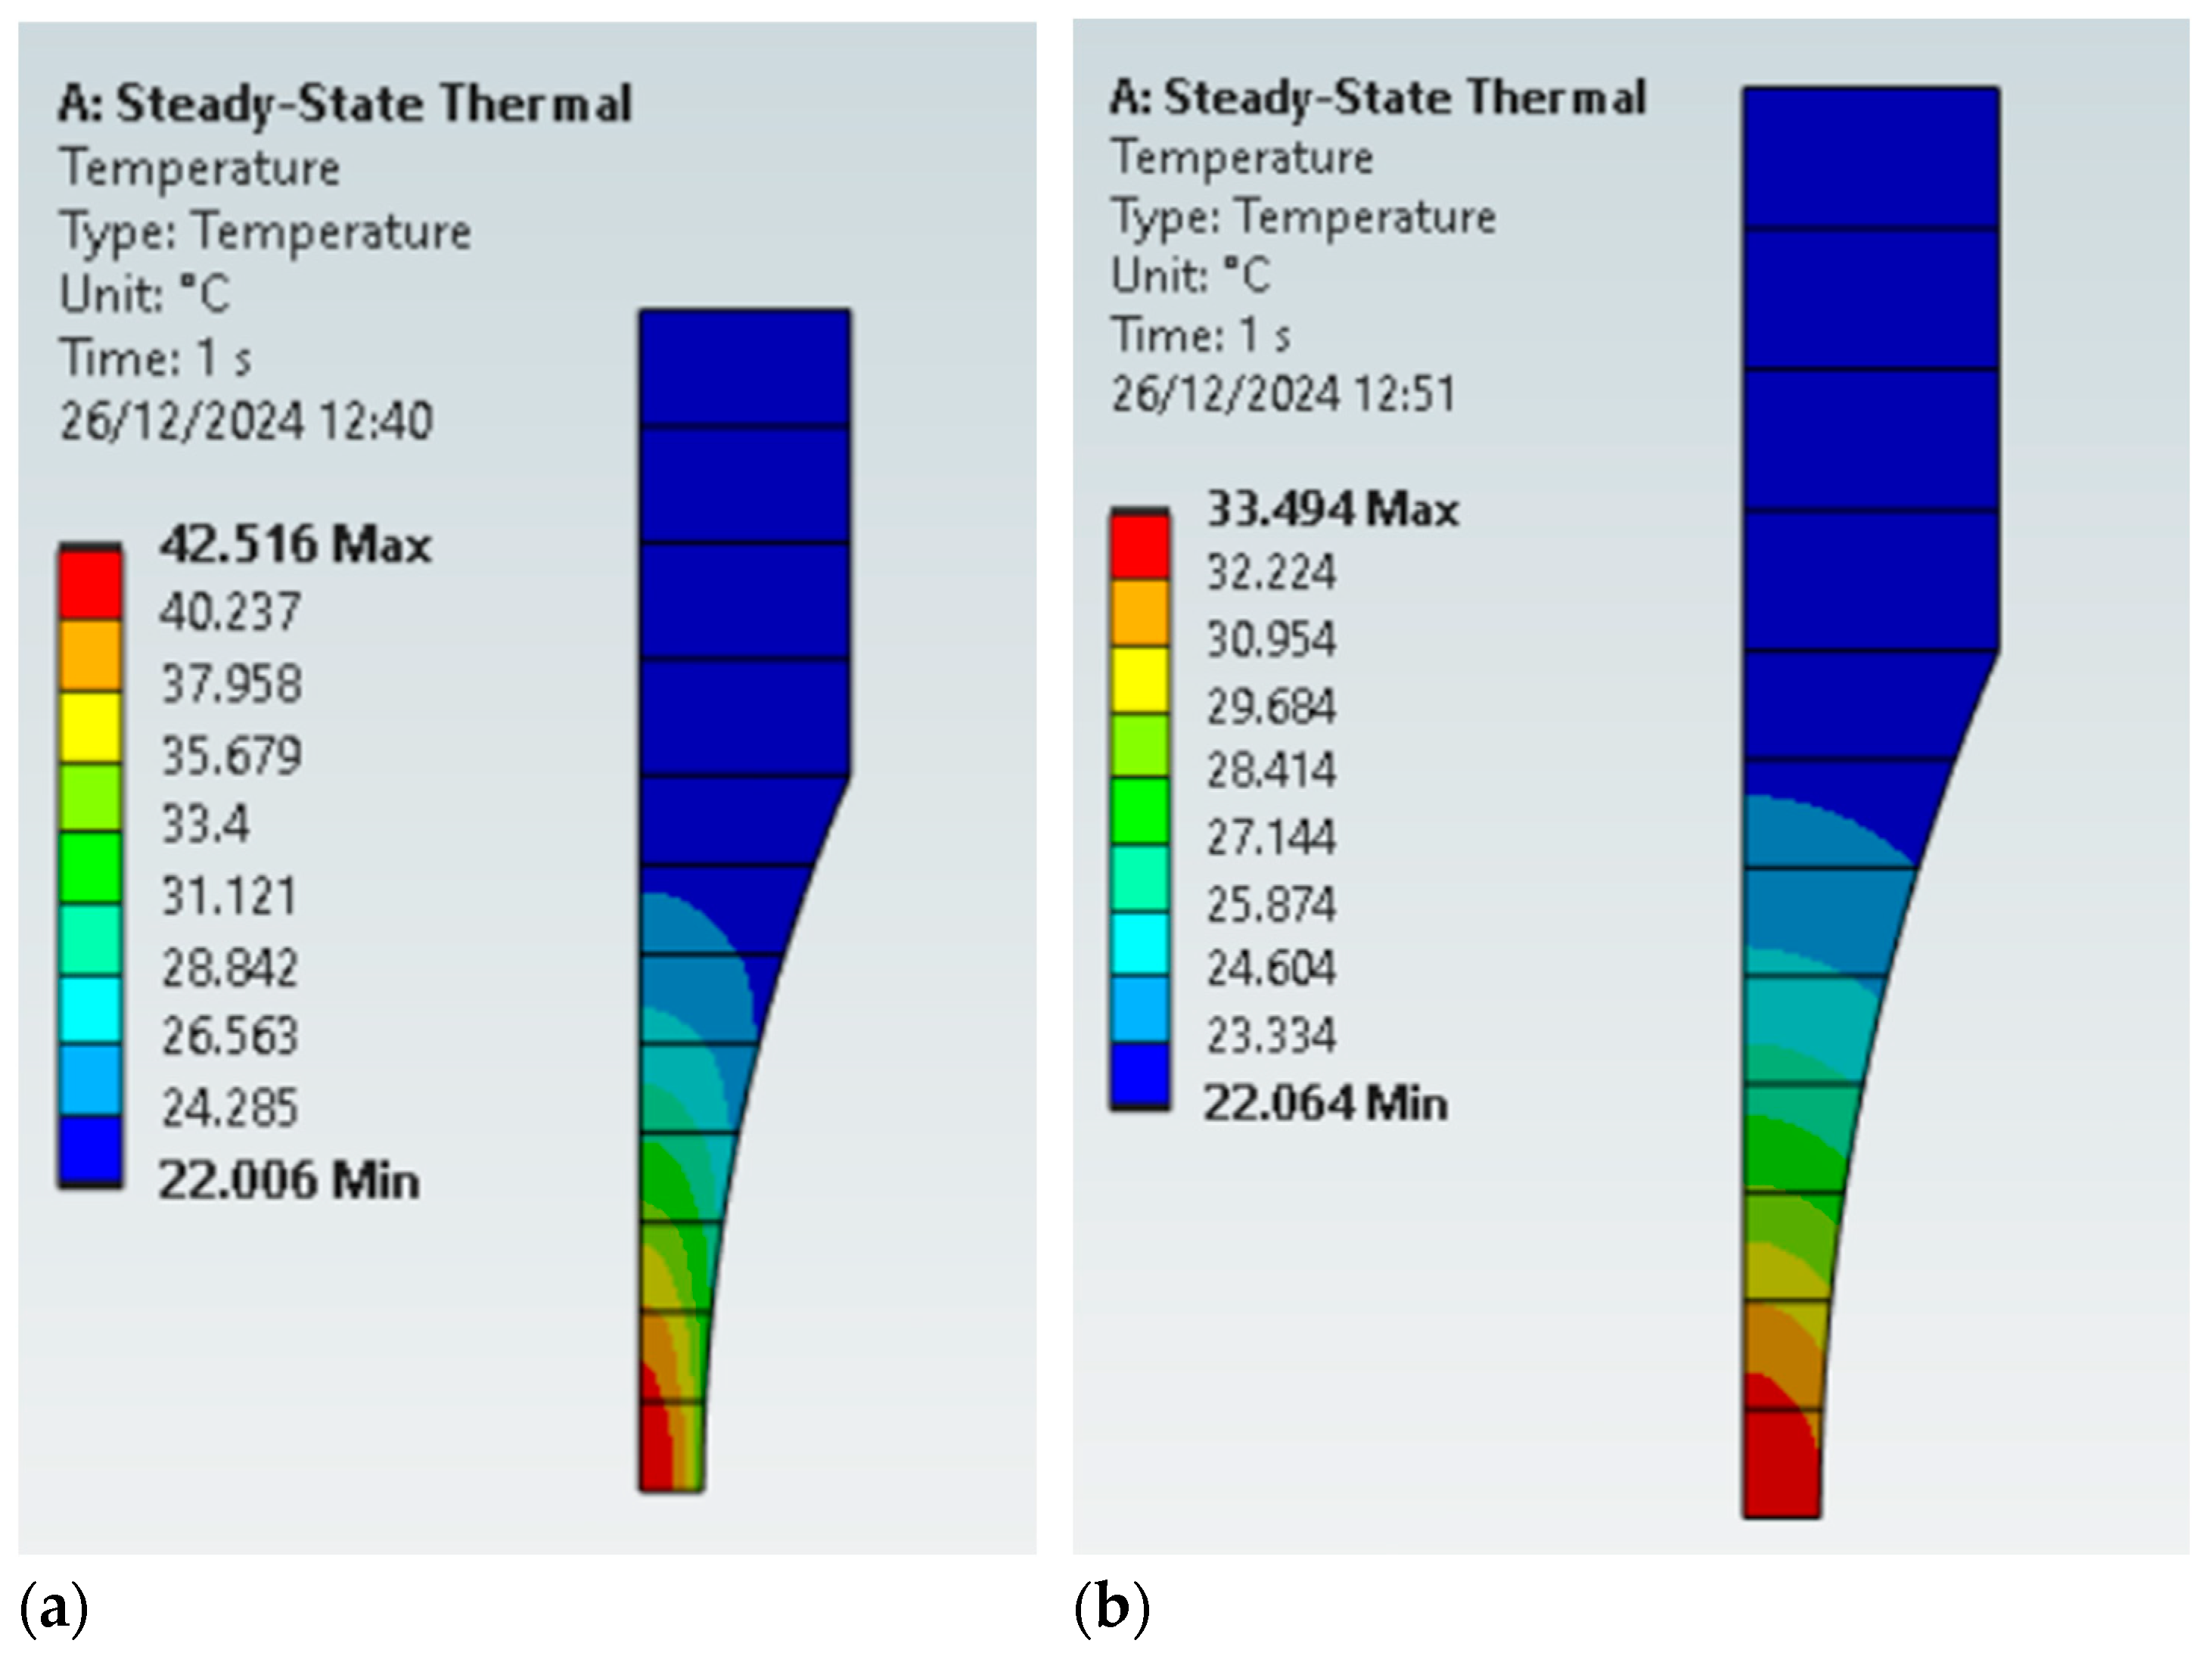
4.2. The Effect of Convection in the Specimen Temperature Distribution

The present section will provide a brief discussion regarding the effect of natural and force convection in the specimen temperature during tests. It is important to note that ultrasonic fatigue tests using natural convection are often not practical, and the goal of the present analysis is only to demonstrate the effects of cooling and convection at the temperatures during tests, and its distribution, and how important an effective specimen cooling is.
Figure 10a,b present the temperature fields for a forced and natural convection, respectively, for the D6 specimen. It can be seen that, for such levels of heat generation, relying on natural convection for specimen cooling is not feasible. Due to the relatively low heat extraction due to natural convection, a homogeneous temperature at the central section can be found, with a relation between surface and inner temperature very close to 1 ( R t = 0.99).
An analogous investigation was performed for the smaller specimen, D3, and the comparison between force and natural convection is presented in Figure 11a and Figure 11b, respectively. Once more, when comparing the larger and smaller specimens, the latter presented lower temperatures in all the analysed cases. In most cases, temperature increases in the ultrasonic fatigue testing are seen as a disadvantage when the goal is to characterise the material in ambient temperature. However, this intrinsic characteristic of ultrasonic fatigue testing might be beneficial in some cases. Some materials will generate so much heat that it is possible to perform tests in high temperatures using only the specimen dissipated energy, without the need for an external heating device, if an efficient temperature measurement and control system is present.

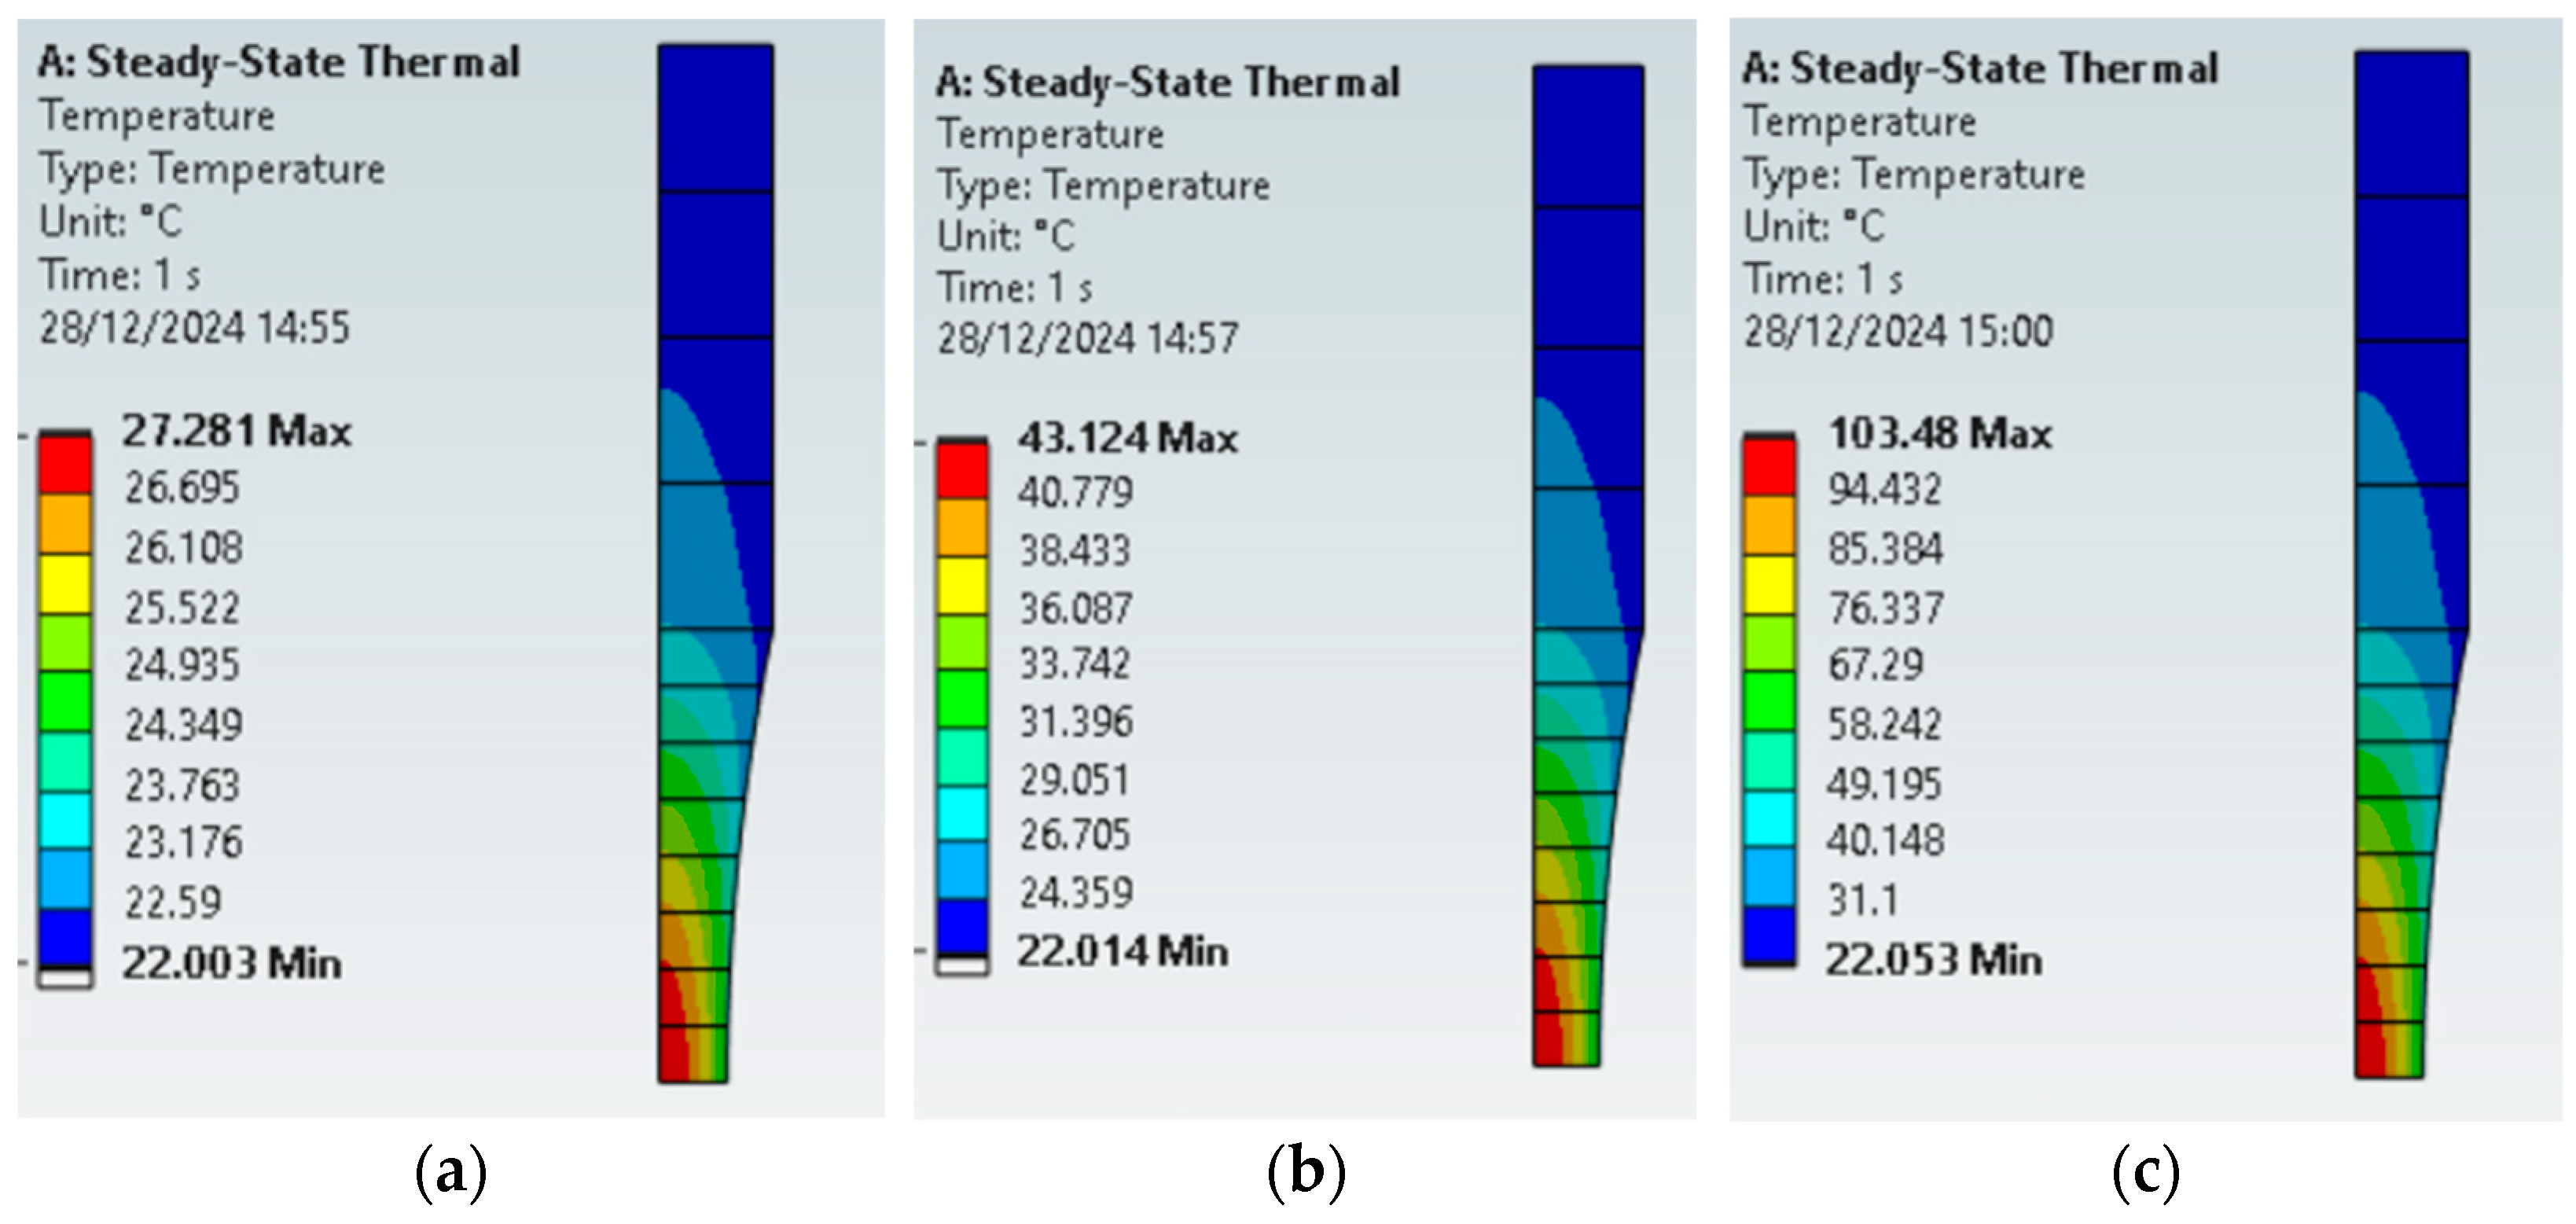
4.3. The Effect of Thermal Conductivity on the Specimen Temperature Distribution

Next, an analysis encompassing the effects of thermal conductivity in the specimen distribution will be performed. All analyses were performed using the forced convection coefficient. Figure 12a,b present the temperature field for low and high thermal conductivity, respectively, for the larger specimen. When looking at the high conductivity case, lower temperatures were found. Moreover, at the testing section, the surface and inner temperature are much closer to each other, resulting in an R t = 0.90, while the lower conductivity resulted in a R t = 0.58.
When monitoring specimen temperature during tests, these measurements are performed using the surface of the specimen, by using pyrometers or thermocouples, for example). For materials with low thermal conductivity, the measurements (surface) might be very discrepant for some specimen temperatures, especially its core. Therefore, it is important to be aware of these discrepancies, which became greater as the thermal conductivity of the specimen material is reduced.
Regarding the smaller specimen, Figure 13a,b present the temperature field for lower and higher thermal conductivity, respectively. A very homogeneous temperature field was observed for the larger value of k, resulting in a ratio between the surface and inner temperature of 0.97.

4.4. The Effect of Stress Amplitude and Damping Properties in the Specimen Temperature

The effect of stress amplitude and the damping ratio will be discussed in the present section. Results from the simulations are presented in Figure 14. When comparing cases 1 and 2, where the only changes happen at the stress levels (the same damping ratio), Figure 14a and Figure 14b, respectively, show where the maximum temperature increased by approximately 50% (27.3 °C for the lower stress level and 43.1 °C for the higher amplitude). The elastic energy increased by a factor of 4, since the stress levels were duplicated, and Equation (6) shows that the elastic energy varies with the squared stress amplitude. However, more heat is also extracted via convection, since the temperatures are higher. When the comparison is performed between a constant damping ratio approach and a variable one (dependent on stress levels), Figure 14b and Figure 14c, respectively, it is clear that large errors in temperature estimates will be present if the wrong assumption regarding the damping ratio is used (more than 100% for the present case, when looking at maximum temperatures).

5. Conclusions and Future Work

The present work quantified the influence of certain material properties on heat generation and temperature increments during ultrasonic fatigue tests. Material property, like the damping ratio and thermal conductivity, effects on temperature increases and distribution during tests were discussed and quantified. Moreover, the effect of specimen dimensions and cooling characteristics on the temperature field distribution was investigated. By combining analytical approaches and numerical simulations, the present work was able to quantify the contribution of each material parameter and specimen main dimensions in the dissipated energy and temperature generated during tests.
By analysing the contribution of each material parameter on the heat generation during tests, it was possible to develop a guideline for specimen design and testing. The main contributions of the present work can be summarised as:
  • Heat generation severity: a material parameter (based on relevant material properties) was developed to quantify whether a given material is prone to present high temperatures during ultrasonic fatigue tests. Such information might provide valuable data for engineers during the design of specimens, avoiding unpredicted challenges, which would only be detected after specimen manufacturing and during fatigue tests.
  • Thermal gradient: The observation of high-temperature variations within the testing section (differences from the inner section of the specimen, higher temperatures, and the surface, lower temperatures) for low-conductivity materials may raise awareness regarding diverging fatigue results due to the temperature gradient effect. Moreover, higher cooling rates due to convection (forced convection and/or colder fluids, like liquid nitrogen) will also lead to a heterogeneous temperature field.
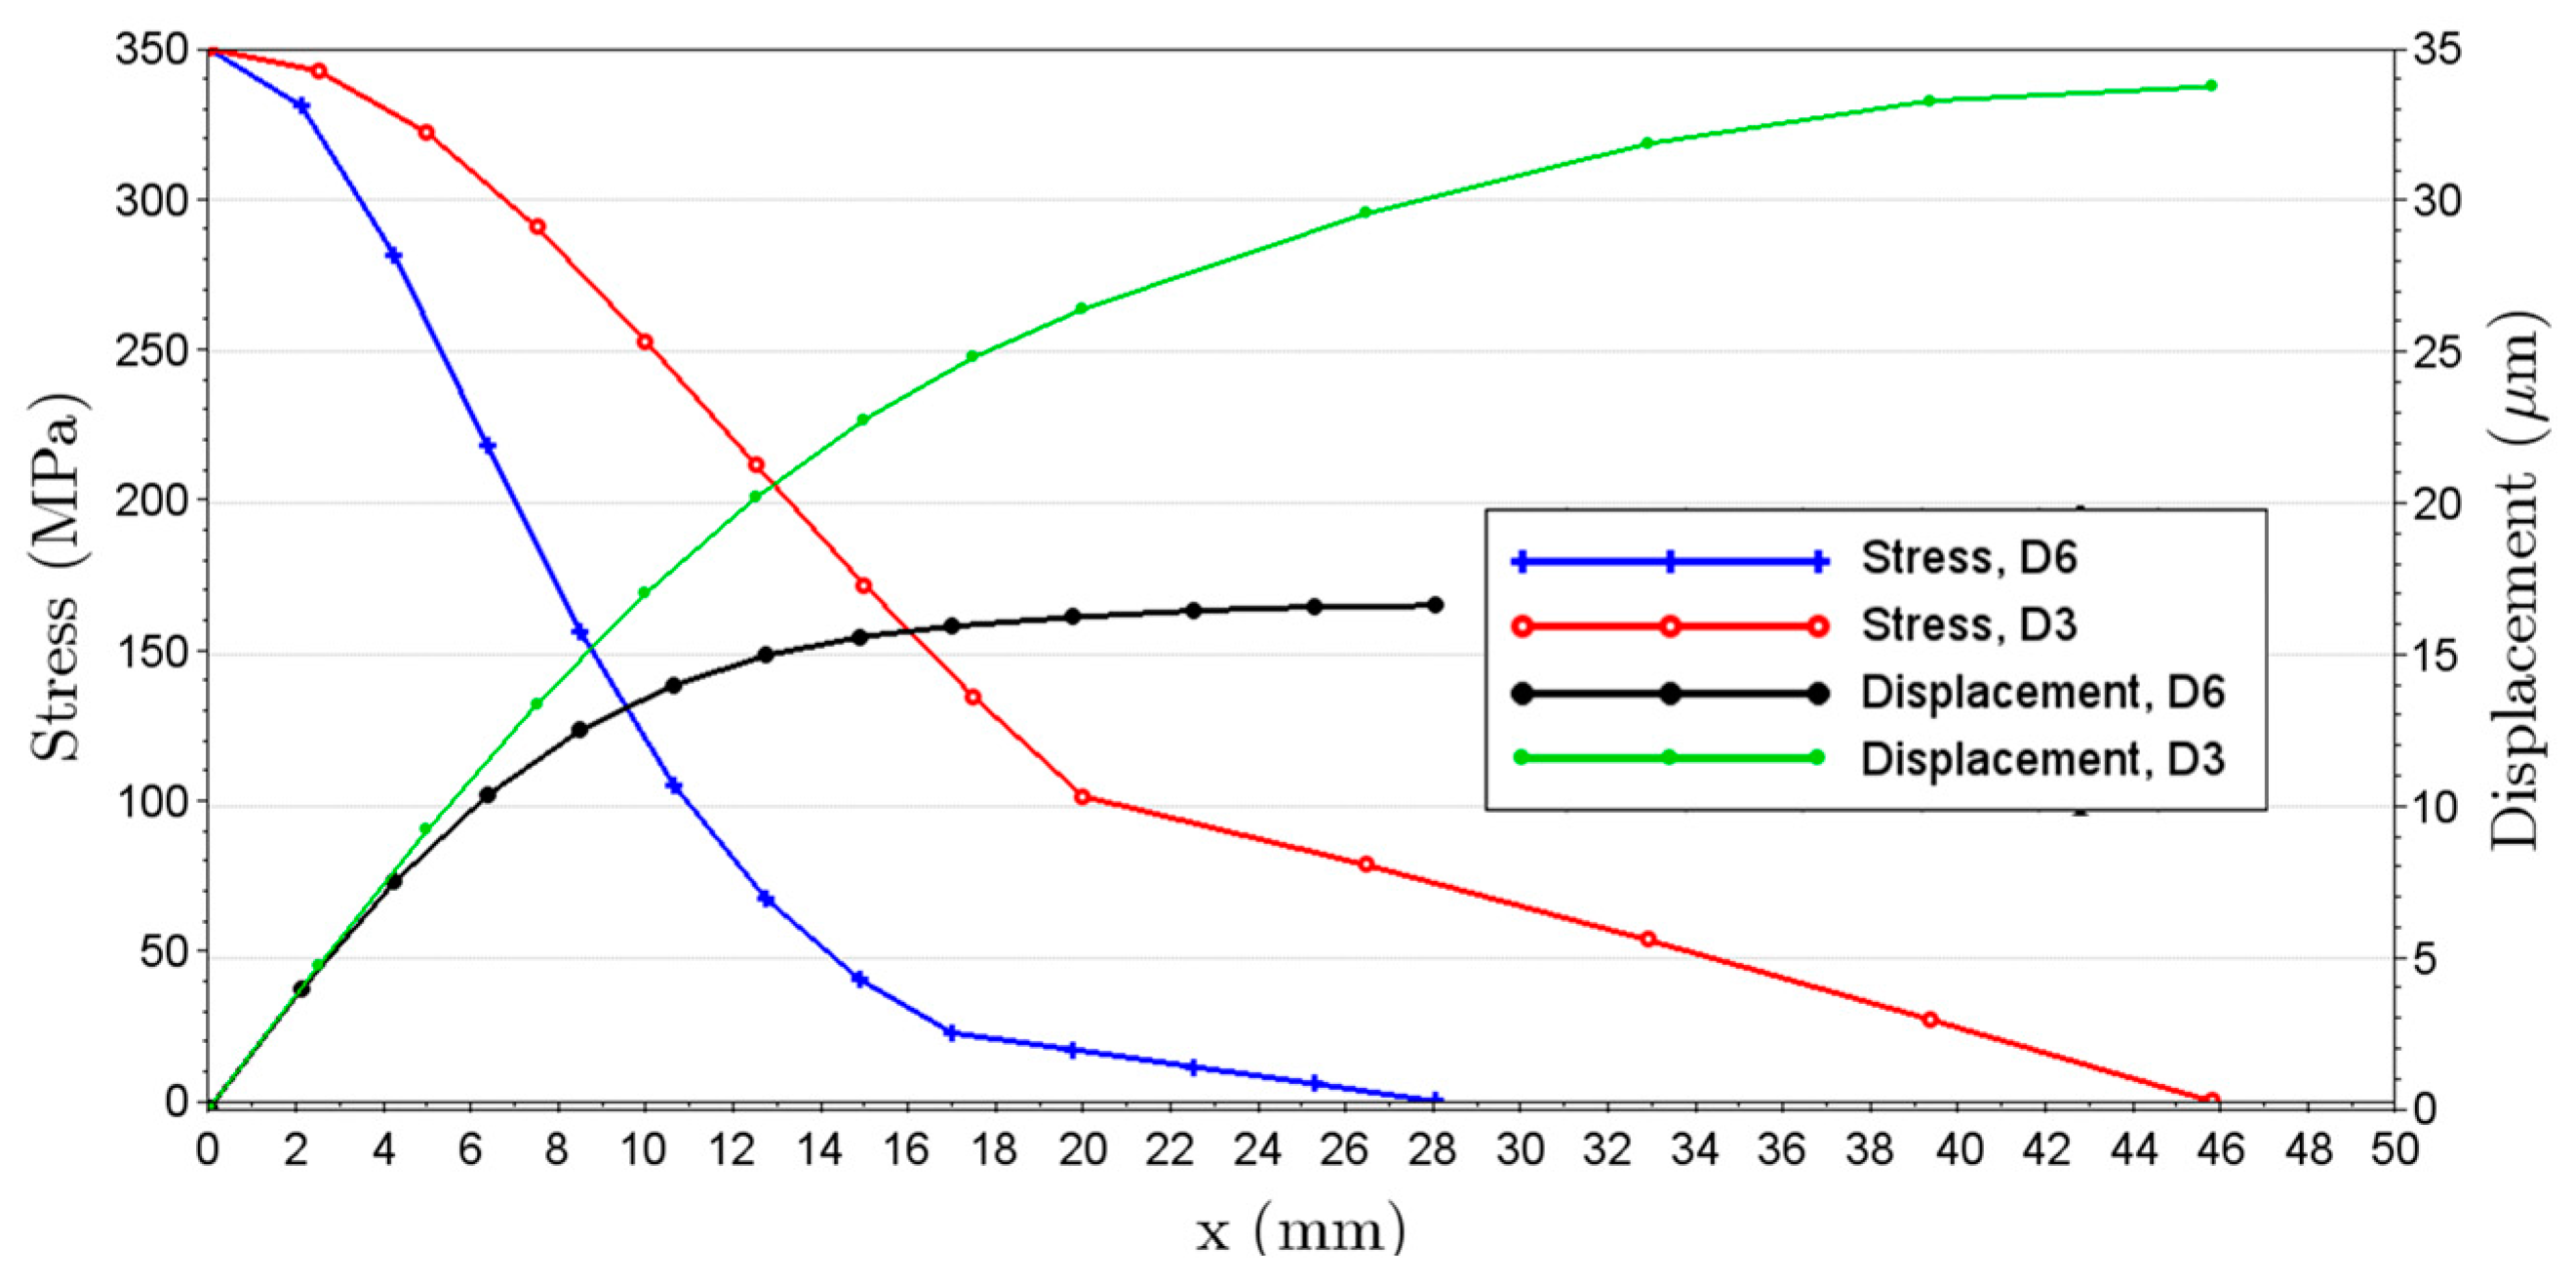
  • The specimen geometry effect on temperature: The maximum temperatures and temperature gradients are strongly dependent on the specimen geometries. Larger specimens are more prone to higher temperature gradients, with the inner section of the specimens reaching the highest temperatures. This is especially critical because, temperatures are measured at the surface of the specimens, leading to underestimations of the temperatures during tests.
For future work, it would be interesting to expand the material analysis beyond metals, providing further guidelines and insights for polymeric and composites materials, for example. Moreover, the damping ratio dependence of stress levels is not fully well understood (possibly due to localised/microsplasticity), but its impact on the temperatures during tests cannot be neglected; therefore, further investigation for several materials is needed. Additionally, encompassing more material parameters that affect the severity of heat generation during the ultrasonic fatigue testing would be interesting, where different weights could be used for parameters presenting higher influences on the heat generation and thermal distribution.
Furthermore, analysing the effects of severe temperature gradients found in some material (for example, a very hot inner portion of the specimen for a material with low thermal conductivity) could provide valuable information regarding the crack nucleation phenomenon for different temperatures. Last, the excessive heat generation observed in some metals could be used to perform high-temperature tests without needing an external heat source device.

Author Contributions

Conceptualisation, F.K.F. and A.M.P.d.J.; methodology, R.D. and A.P.C.; investigation, F.K.F., R.D. and A.P.C.; writing—original draft, F.K.F. and R.D.; software, J.W.G.; formal analysis, J.W.G.; writing—review and editing, J.W.G., A.P.C. and T.A.F.; funding acquisition, A.M.P.d.J.; resources, T.A.F. and A.M.P.d.J.; supervision, A.P.C., T.A.F. and A.M.P.d.J. All authors have read and agreed to the published version of the manuscript.

Funding

This research was funded by FEDER and National Funds (FCT), reference PTDC/EME-EME/31307/2017, through the Add.Strength project entitled “Enhanced Mechanical Properties in Additive Manufactured Components”. In addition, this research was also funded by FEDER and National Funds (FCT), reference PTDC/EME-EME/7678/2020, through the GCYCLEFAT project entitled “Giga-Cycle Fatigue Behaviour of Engineering Metallic Alloy”. Moreover, this research was also funded by the Hi-rEV project (reference C644864375-00000002)—entitled “Recuperação do Setor de Componentes Automóveis” cofinanced by Plano de Recuperação e Resiliência (PRR), República Portuguesa through NextGeneration EU.

Institutional Review Board Statement

This study does not contain any studies with human or animal subjects performed by any of the authors.

Data Availability Statement

Data available on request due to restrictions, e.g., privacy or ethical.

Conflicts of Interest

All authors declare that they have no conflicts of interest.

References

  1. Bathias, C.; Paris, P.C. Gigacycle Fatigue in Mechanical Practice; CRC Press: Boca Raton, FL, USA, 2004. [Google Scholar]
  2. Fiorentin, F.K.; Dantas, R.; Darabi, R.; Lesiuk, G.; Figueiredo, M.A.V.; de Castro, P.T.; Jesus, A.M.P. Relation Between Striations Spacing and Fatigue Crack Growth Rates for Additive Manufactured Inconel 625. Fatigue Fract. Eng. Mater. Struct. 2024, 48, 454–466. [Google Scholar] [CrossRef]
  3. Xue, H.; Wagner, D.; Ranc, N.; Bayraktar, E. Thermographic analysis in ultrasonic fatigue tests. Fatigue Fract. Eng. Mater. Struct. 2006, 29, 573–580. [Google Scholar] [CrossRef]
  4. Grigorescu, A.; Hilgendorff, P.-M.; Zimmermann, M.; Fritzen, C.-P.; Christ, H.-J. Cyclic deformation behavior of austenitic Cr–Ni-steels in the VHCF regime: Part I–Experimental study. Int. J. Fatigue 2016, 93, 250–260. [Google Scholar] [CrossRef]
  5. Ono, K. Dynamic Viscosity and Transverse Ultrasonic Attenuation of Engineering Materials. Appl. Sci. 2020, 10, 5265. [Google Scholar] [CrossRef]
  6. Galuppo, W.C.; Santana, P.; Alves, F.; Nóbrega, J.M. Extending the Finite Area Method for enhanced simulation of deformable membranes and its application to extrusion blow moulding. Thin-Walled Struct. 2024, 203, 112184. [Google Scholar] [CrossRef]
  7. Visnapuu, A.; Nash, R.W.; Turner, P.C. Damping Properties of Selected Steels and Cast Irons; US Department of the Interior, Bureau of Mines: Pittsburgh, PA, USA, 1987; Volume 9068.
  8. Lage, Y.; Cachão, H.; Reis, L.; Fonte, M.; Freitas, M.D.; Ribeiro, A.A. A damage parameter for HCF and VHCF based on hysteretic damping. Int. J. Fatigue 2014, 62, 2–9. [Google Scholar] [CrossRef]
  9. Fiorentin, F.K.; Reis, L.; Lesiuk, G.; Reis, A.; Jesus, A.M.P. A Predictive Methodology for Temperature, Heat Generation and Transfer in Gigacycle Fatigue Testing. Metals 2023, 13, 492. [Google Scholar] [CrossRef]
  10. Mayer, H. Recent developments in ultrasonic fatigue. Fatigue Fract. Eng. Mater. Struct. 2016, 39, 3–29. [Google Scholar]
  11. Yu, Y.; Gu, J.; Xu, L.; Shou, F.L.; Bai, B.Z.; Liu, Y.B. Very high cycle fatigue behaviors of Mn–Si–Cr series Bainite/Martensite dual phase steels. Mater. Des. 2010, 31, 3067–3072. [Google Scholar] [CrossRef]
  12. Xiong, Z.; Naoe, T.; Futakawa, M. Effect of artificial defects on the very high cycle fatigue behavior of 316L stainless steel. Metals 2019, 9, 412. [Google Scholar] [CrossRef]
  13. Juijerm, P.; Altenberger, I. Effect of temperature on cyclic deformation behavior and residual stress relaxation of deep rolled under-aged aluminium alloy AA6110. Mater. Sci. Eng. A 2007, 452–453, 452–475. [Google Scholar] [CrossRef]
  14. Xu, J.; Lu, J.; Yuan, H. Effects of temperature gradients on thermomechanical fatigue of nickel-based supearlloy. Int. J. Fatigue 2024, 184, 108297. [Google Scholar] [CrossRef]
  15. Jones, J. Thermo-Mechanical Fatigue—In the Gas Turbine Engine. Encycl. Mater. Met. Alloys 2022, 1, 476–484. [Google Scholar]
  16. Sahith, M.S.; Giridhara, G.; Kumar, R.S. Development and analysis of thermal barrier coatings on gas turbine blades—A Review. Mater. Today Proc. 2018, 5, 2746–2751. [Google Scholar] [CrossRef]
  17. Sun, J.; Yuan, H.; Vormwald, M. Thermal gradient mechanical fatigue assessment of a nickel-based superalloy. Int. J. Fatigue 2020, 135, 105486. [Google Scholar] [CrossRef]
  18. Ashby, M.F. Materials Selection in Mechanical Design; Butterworth-Heinemann: Oxford, UK, 1999; p. 433. [Google Scholar]
  19. Ahmed, T.; Mobarak, Y. Predictable Models and Experimental Measurements for Electric Properties of Polypropylene Nanocomposite Films. Int. J. Electr. Comput. Eng. 2016, 6, 120–129. [Google Scholar]
  20. Salamt-Talab, M.; Delzendehrroy, F.; Akhavan_Safar, A.; Safari, M.; Bahrami-Manesh, H.; da Silva, L.F.M. Environmental effects on mode II fracture toughness of unidirectional E-glass/vinyl ester laminated composites. Sci. Eng. Compos. Mater. 2021, 28, 382–393. [Google Scholar] [CrossRef]
  21. Petrone, G.; D’Alessandro, V.; Franco, F.; de Rosa, S. Damping evaluation on eco-friendly sandwich panels through reverberation time (RT60) measurements. J. Vib. Control. 2015, 21, 3328–3338. [Google Scholar] [CrossRef]
  22. Matweb. Matweb. MatWeb, LLC, 2024. Available online: https://www.matweb.com/ (accessed on 30 December 2024).
  23. Chen, W.; Spätig, P.; Seifert, H.P. Fatigue behavior of 316L austenitic stainless steel in air and LWR environment with and without mean stress. In Proceedings of the MATEC Web of Conferences, Poitiers, France, 27 May–1 June 2018. [Google Scholar]
  24. Gomes, V.M.G.; Fiorentin, F.K.; Dantas, R.; Silva, F.G.A.; Correia, J.A.F.O.; Jesus, A.M.P. Probabilistic Modelling of Fatigue Behaviour of 51CrV4 Steel for Railway Parabolic Leaf Springs. Metals 2025, 15, 152. [Google Scholar] [CrossRef]
  25. Dantas, R.; Gouveia, M.; Silva, F.G.A.; Fiorentin, F.; Correia, J.A.C.; Lesiuk, G.; Jesus, A.M.P. Notch effect in very high-cycle fatigue behaviour of a structural steel. Int. J. Fatigue 2023, 177, 107925. [Google Scholar] [CrossRef]
  26. Fiorentin, F.K. High-Cycle and Ultra-High Cycle Fatigue Behaviour of Directed Energy Deposited Inconel 625. Ph.D. Thesis, Universidade do Porto, Porto, Portugal, 2023. [Google Scholar]
  27. Bleicher, C.; Wagener, R.; Kaufmann, H.; Melz, T. Fatigue strength of nodular cast iron with regard to heavy-wall applications. Mater. Test. 2015, 57, 723–731. [Google Scholar] [CrossRef]
  28. Colakoglu, M. Factors effecting internal damping in aluminium. J. Theor. Appl. Mech. 2004, 42, 95–105. [Google Scholar]
  29. Lee, Y.Y.; Welsch, G. Young’s modulus and damping of Ti6Al4V alloy as a function of heat treatment and oxygen concentration. Mater. Sci. Eng. A 1990, 128, 77–89. [Google Scholar] [CrossRef]
  30. Chamos, A.N.; Pantelakis, S.G.; Haidemenopoulos, G.N.; Kamoutsi, E. Tensile and fatigue behaviour of wrought magnesium alloys AZ31 and AZ61. Fatigue Fract. Eng. Mater. Struct. 2008, 31, 812–821. [Google Scholar] [CrossRef]
Figure 1. Hourglass ultrasonic fatigue specimen: (a) stress and displacement distribution along specimen length; (b) main dimensions.
Machines 13 00380 g001
Figure 2. Specimen geometry (profile and length) for different materials.
Machines 13 00380 g002
Figure 3. Hysteresis loop, energy dissipation: (a) Elastic and dissipated energy, overview; (b) Zoomed view.
Machines 13 00380 g003
Figure 4. Heat generation and transfer.
Machines 13 00380 g004
Figure 5. Heat generation severity during ultrasonic fatigue testing.
Machines 13 00380 g005
Figure 6. Heat transfer model and boundary conditions: (a) boundary conditions; (b) heat generation regions.
Machines 13 00380 g006
Figure 7. Stress and displacement amplitudes along specimen length, for specimens D6 and D3.
Machines 13 00380 g007
Figure 8. The damping ratio according to stress amplitudes for a 316L stainless steel.
Machines 13 00380 g008
Figure 9. The effect of specimen dimensions in the temperature field during tests for: (a) a 6 mm diameter, D6; (b) a 3 mm diameter, D3.
Machines 13 00380 g009
Figure 10. The effect of forced and natural convection in the temperature field during tests, specimen D6: (a) forced convection; (b) natural convection.
Machines 13 00380 g010
Figure 11. The effect of forced and natural convection in the temperature field during tests, specimen D3: (a) forced convection; (b) natural convection.
Machines 13 00380 g011
Figure 12. The effect of thermal conductivity in the temperature field during tests, specimen D6: (a) k = 10 W.m−1.°C−1; (b) k = 70 W.m−1.°C−1.
Machines 13 00380 g012
Figure 13. The effect of thermal conductivity in the temperature field during tests, specimen D3: (a) k = 10 W⋅m−1.⋅°C−1; (b) k = 70 W⋅m−1⋅°C−1.
Machines 13 00380 g013
Figure 14. The effect of stress amplitudes and the damping ratio in the temperature field during tests, specimen D6: (a) stress amplitude of 175 MPa; (b) stress amplitude of 350 MPa, constant damping ratio; (c) stress amplitude of 350 MPa, variable damping ratio.
Machines 13 00380 g014
Table 1. Material properties for ultrasonic fatigue specimen design.
MaterialFlexural or Elasticity Modulus (GPa)Density (kg/m3)
Steel [9]185.08000
Aluminium [18]65.02700
Polypropylene [19] 1.2910
Vinylester [20]3.01120
Table 2. Specimen total length and maximum stress amplitudes.
MaterialSpecimen Total Length (mm)Maximum Stress (MPa),
@ Max. Disp. of 50 μm
Steel91.6350.0
Aluminium93.4121.6
Polypropylene21.310.2
Vinylester30.314.1
Table 3. Material properties for heat severity analysis.
MaterialThermal Conductivity (W⋅m−1⋅°C−1)Loss FactorFatigue Limit (MPa)
Stainless Steel, 316L144.0 × 10−3170 [23]
High Carbon Steel, 51CrV4 452.4 × 10−4660 [24]
Low alloy Steel, S690QL198.0 × 10−4520 [25]
Nickel Superalloy, Inconel 625 108.0 × 10⁻⁴ [9]450 [26]
Cast Iron, EN-GJS-700316.0 × 10−3290 [27]
Aluminium, Al 60611675.6 × 10−3 [28]97
Titanium, Ti4Al6V74.0 × 10−4 [29]510
Magnesium, AZ61708.0 × 10−3160 [30]
Table 4. Material properties, test condition and convection information.
PropertyValue
Elasticity modulus (GPa)185
Density (kg⋅m−3)7960
Thermal conductivity (W⋅m−1⋅°C−1)10
Damping ratio (%)0.2
Ambient temperature (°C)21
Convection coefficient (W⋅m−2⋅°C−1)10,000
Excitation frequency (kHz)20
Maximum stress amplitude (MPa)350
Table 5. Specimens main dimensions.
DimensionsGeometry 1, D6Geometry 2, D3
D1 (mm)6.03.0
D2 (mm)10.010.0
L1 (mm)25.811.0
L2 (mm)20.017.0
Disclaimer/Publisher’s Note: The statements, opinions and data contained in all publications are solely those of the individual author(s) and contributor(s) and not of MDPI and/or the editor(s). MDPI and/or the editor(s) disclaim responsibility for any injury to people or property resulting from any ideas, methods, instructions or products referred to in the content.

