3.1. Fabrication
As shown in
Figure 4a, the 3D-printed reducer had customized slits at regular intervals so that it could be assembled with the heat sink fins. The reducer manufactured in this study had slits with a slope angle of 2.5°. The slits ensured a stable assembly between the reducer and heat sink, as shown in
Figure 4b. The reducer could be designed with various thicknesses and sizes to minimize vibration diffusion. Three-dimensional printing was performed using a 1.75 mm polylactic acid (PLA) filament. The PLA used in 3D printing has an appropriate balance of strength and hardness, so it can actively reduce vibration when attached to dynamic structures [
22]. In addition, PLA’s low coefficient of thermal expansion has the advantage of reducing the deformation of the reducer and preventing warping even when heat is generated due to microscopic friction in contacts [
23]. In 3D printing, a higher infill density increases structural strength, while a lower density enhances vibrational energy absorption. A thinner layer thickness improves interlayer bonding due to the greater number of deposited layers, whereas thicker layers may weaken adhesion and increase the risk of structural failure. Although higher printing speeds reduce fabrication time, they may compromise the bonding quality and damping performance. To balance damping performance and structural integrity, the infill density was set to 40% during 3D printing. Although lower infill ratios tend to increase energy absorption by providing internal damping, they compromise structural strength. Therefore, 40% was chosen as an optimal trade-off to ensure both mechanical stability and effective vibration attenuation [
24]. In
Figure 4c, we show the assembly of the printed reducer onto the heat sink using finger force and a rubber hammer. Because both parts had semi-solid properties, it was vital to eliminate the gap between the fin and the reducer. Had the reducer been manufactured with dimensions larger than the design dimensions, the assembly with the heat sink would have been imperfect.
Figure 4d provides a close-up view of the forced assembly. The red highlighted area indicates where the fin’s vibration was suppressed. In this experiment, the surfaces had tiny air cavities, as shown in
Figure 4e, which depicts the microscale structure. Because 3D printing creates a reducer by stacking filaments, the layers form wrinkles. These wrinkles, when assembled with the flat fin, have line contacts. The air cavities can be modified by the surface polishing of the 3D-printed reducer. The more perfect the contact between these surfaces, the better the vibration suppression and, thus, the more efficient the noise reduction.
3.2. Mechanical Analysis
Through the mechanical analysis using this vibration sensing, we proved that the 3D-printed reducer was effective in suppressing vibration. As explained in the theoretical background in
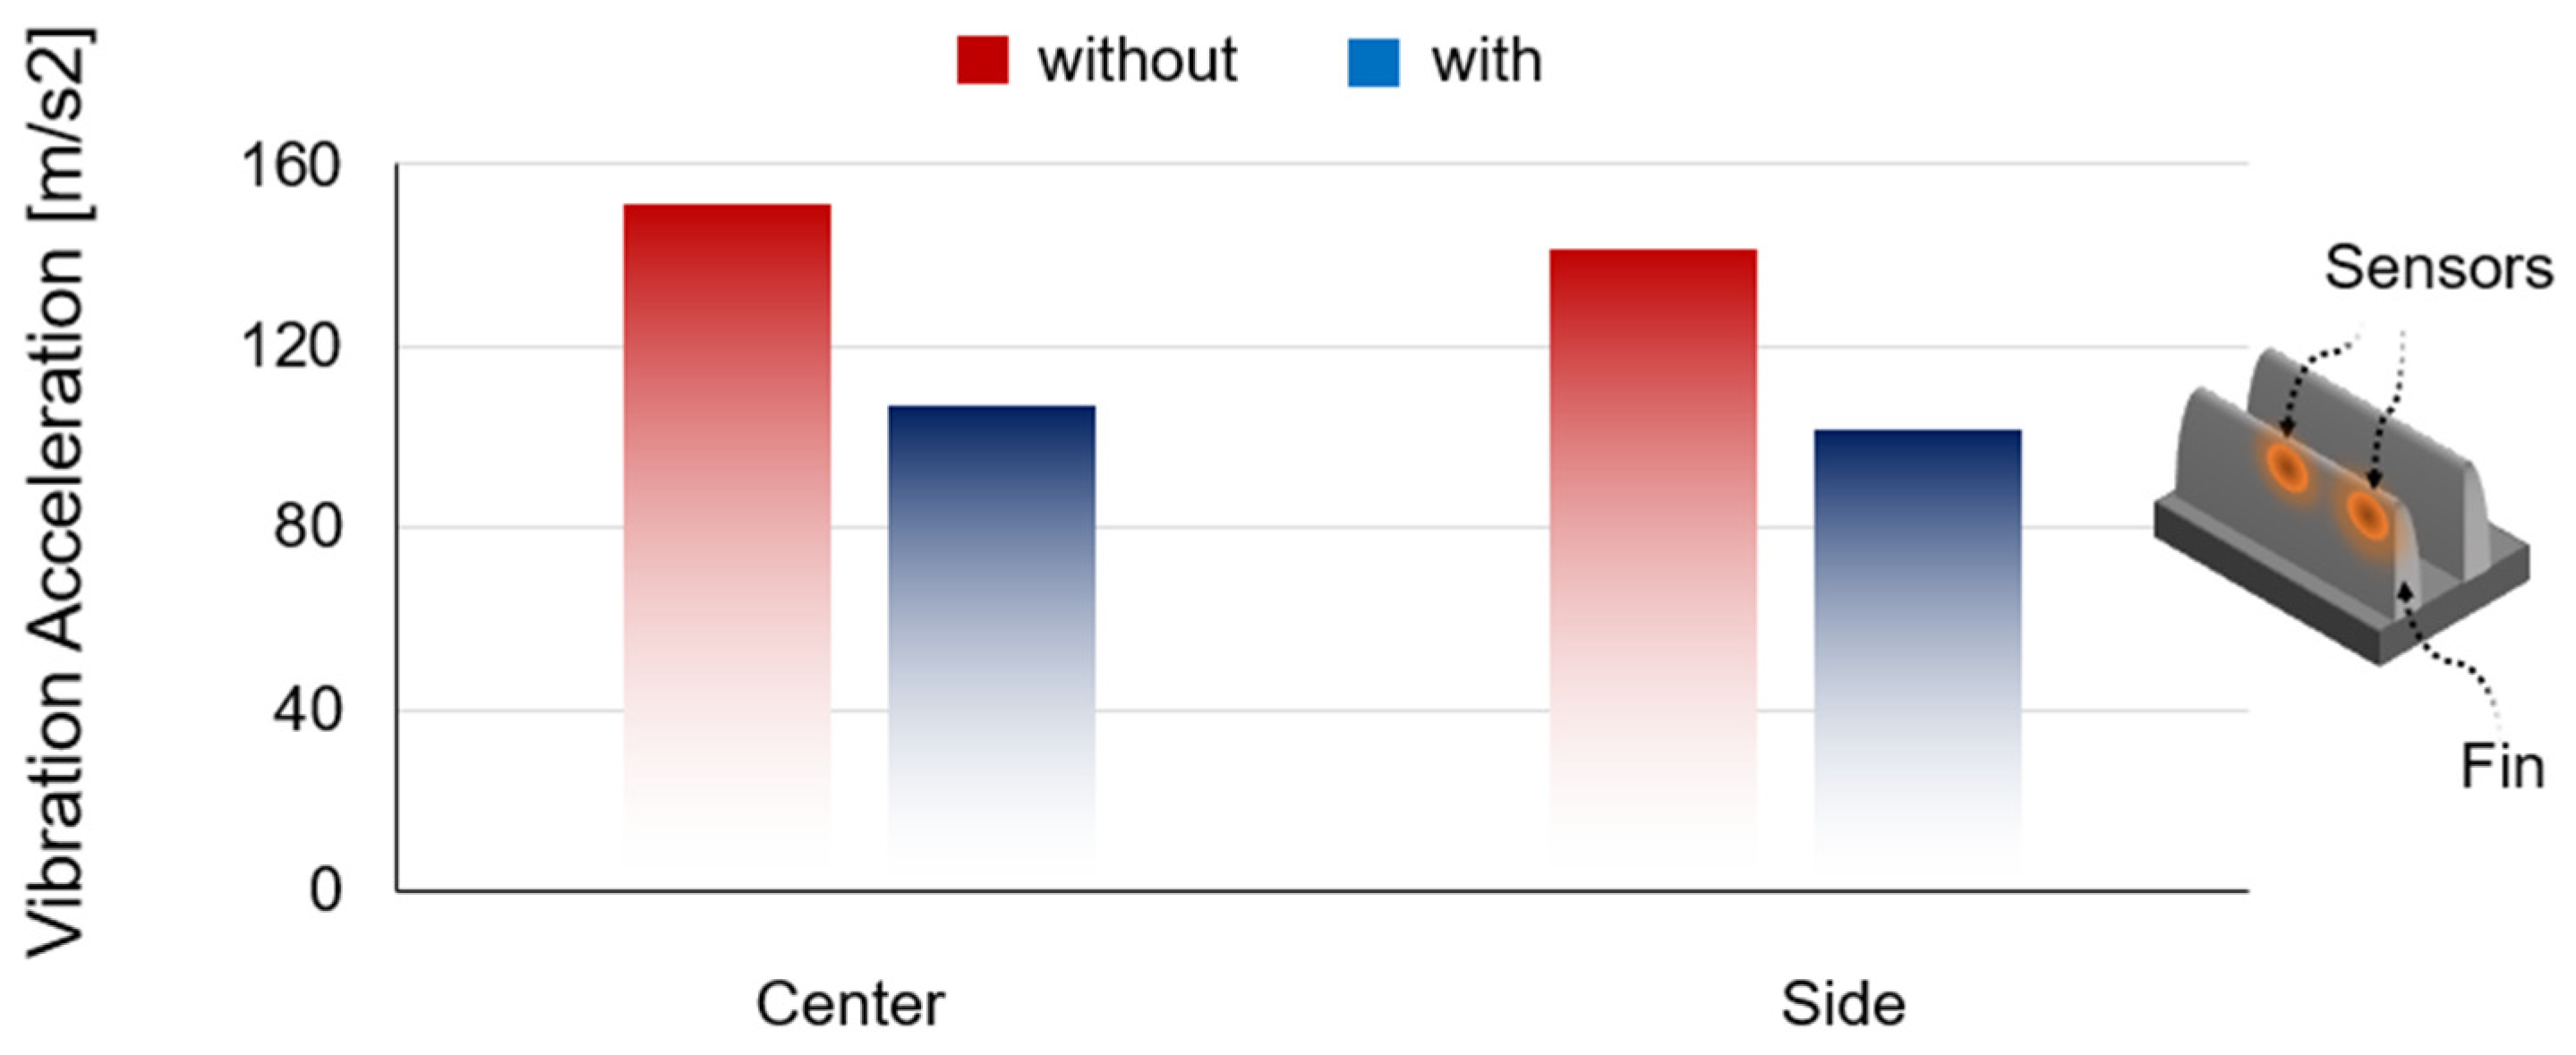
Section 2.4, the noise reduction capability of the reducer could be verified by measuring the vibration acceleration applied to the thin fin of the heat sink. In the experiment, the vibration of the heat sink was generated by machining. The milling machine’s spindle rotation speed was set to 1200 rpm. A vibration meter was used to measure the vibration acceleration. As shown in
Figure 5, sensors were attached to the center and side of the fins. As a result, the vibration acceleration of the center of the fin was 151.5 m/s
2 when machining without the reducer. After assembling the 3D-printed reducer, the vibration acceleration was 107.1 m/s
2. It was reduced by 44.4 m/s
2 (30%). On the side, the vibration acceleration was 141.7 m/s
2, with a reduction of approximately 30% achieved by using the reducer.
3.3. Simulation
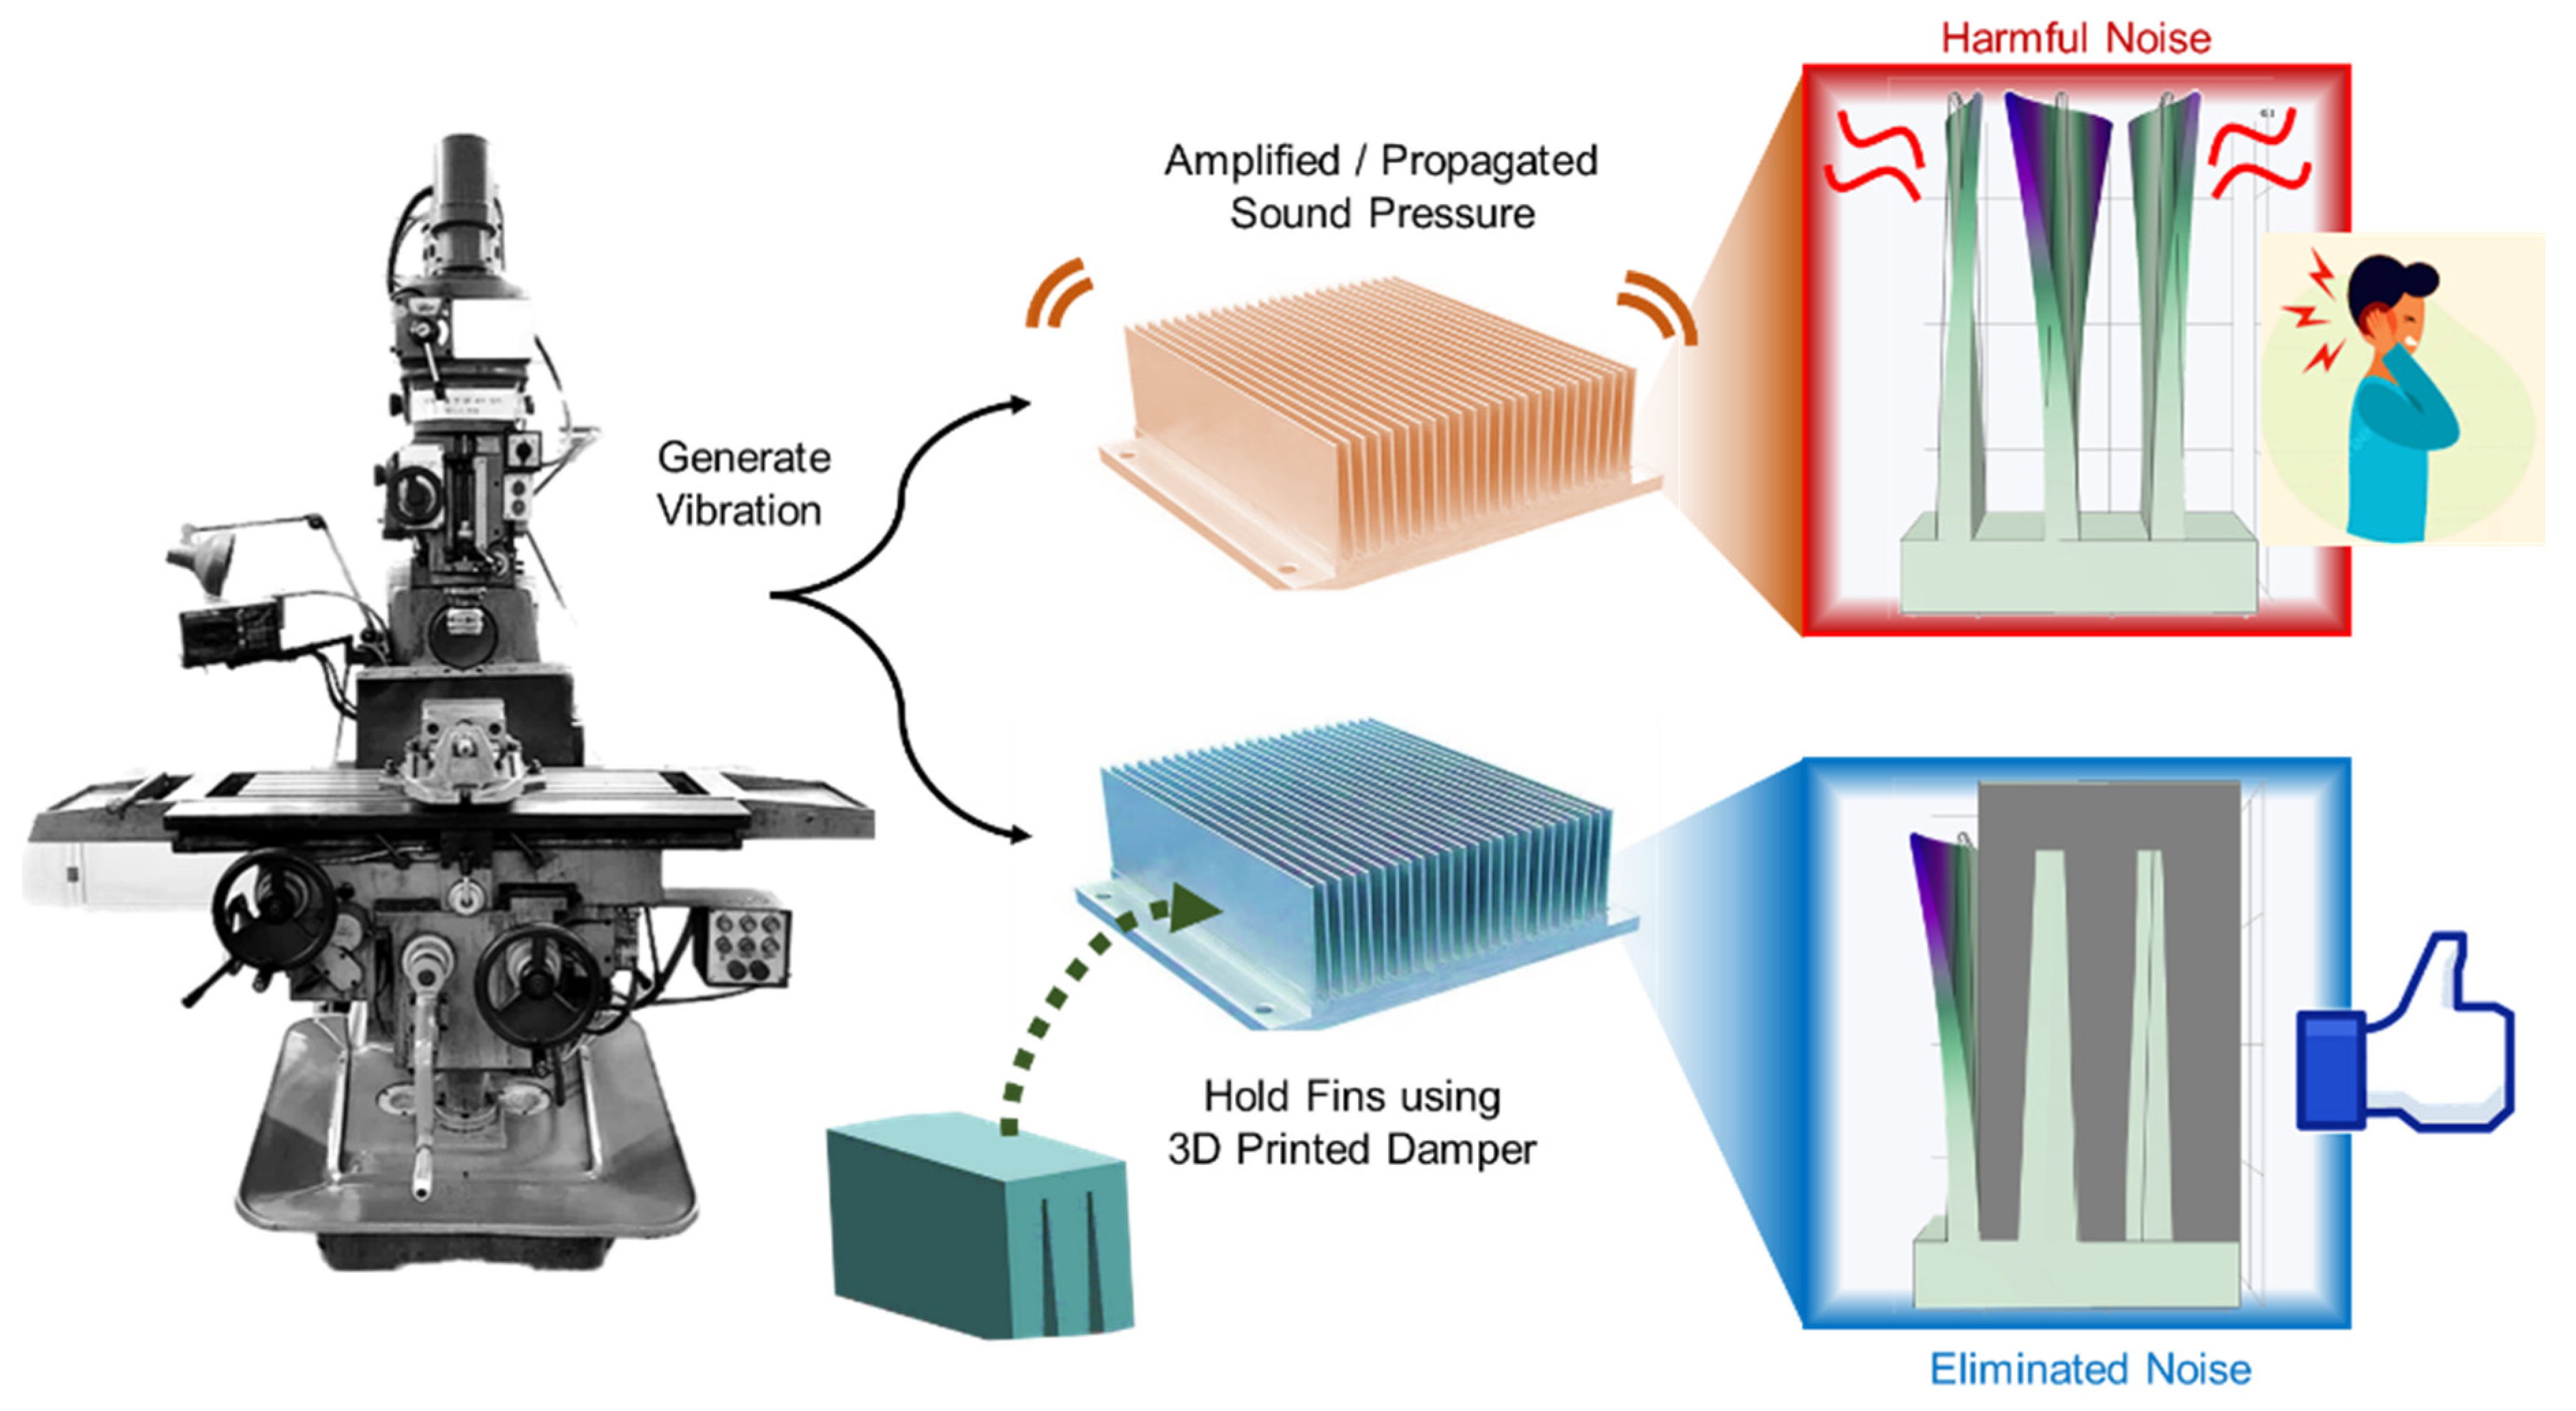
To test the feasibility of the proposed idea, we utilized an acoustic simulation. The multiphysics modules can predict the quantitative sound pressure level generated by fin vibration during substrative machining. The analysis employed the acoustic wave equation, which describes mechanical vibration noise.
is the density of the medium, an important physical property related to the propagation speed of sound.
is the total pressure, defined as the sum of the pressure generated by the sound and the background pressure, allowing the measurement of the magnitude of the pressure produced by the source of vibration.
represents an externally generated vibration source, describing the vibrational energy produced during a machine’s milling process.
is the equivalent wavenumber.
represents the acoustic energy emitted at a specific frequency.
The equation is a pressure component, where
is the acoustic pressure and
is the background pressure.
is the frequency and is the speed of sound in the medium. For simulation prediction, the heat sink and reducer were modeled. An air medium was applied to the 3D space around the heat sink. Based on the user scene where a milling machine contacted the heat sink’s base, vibration was input. The vibration transmitted to the fins was diffused through the air, and the diffusion phase was analyzed through sound pressure leveling.
As shown in
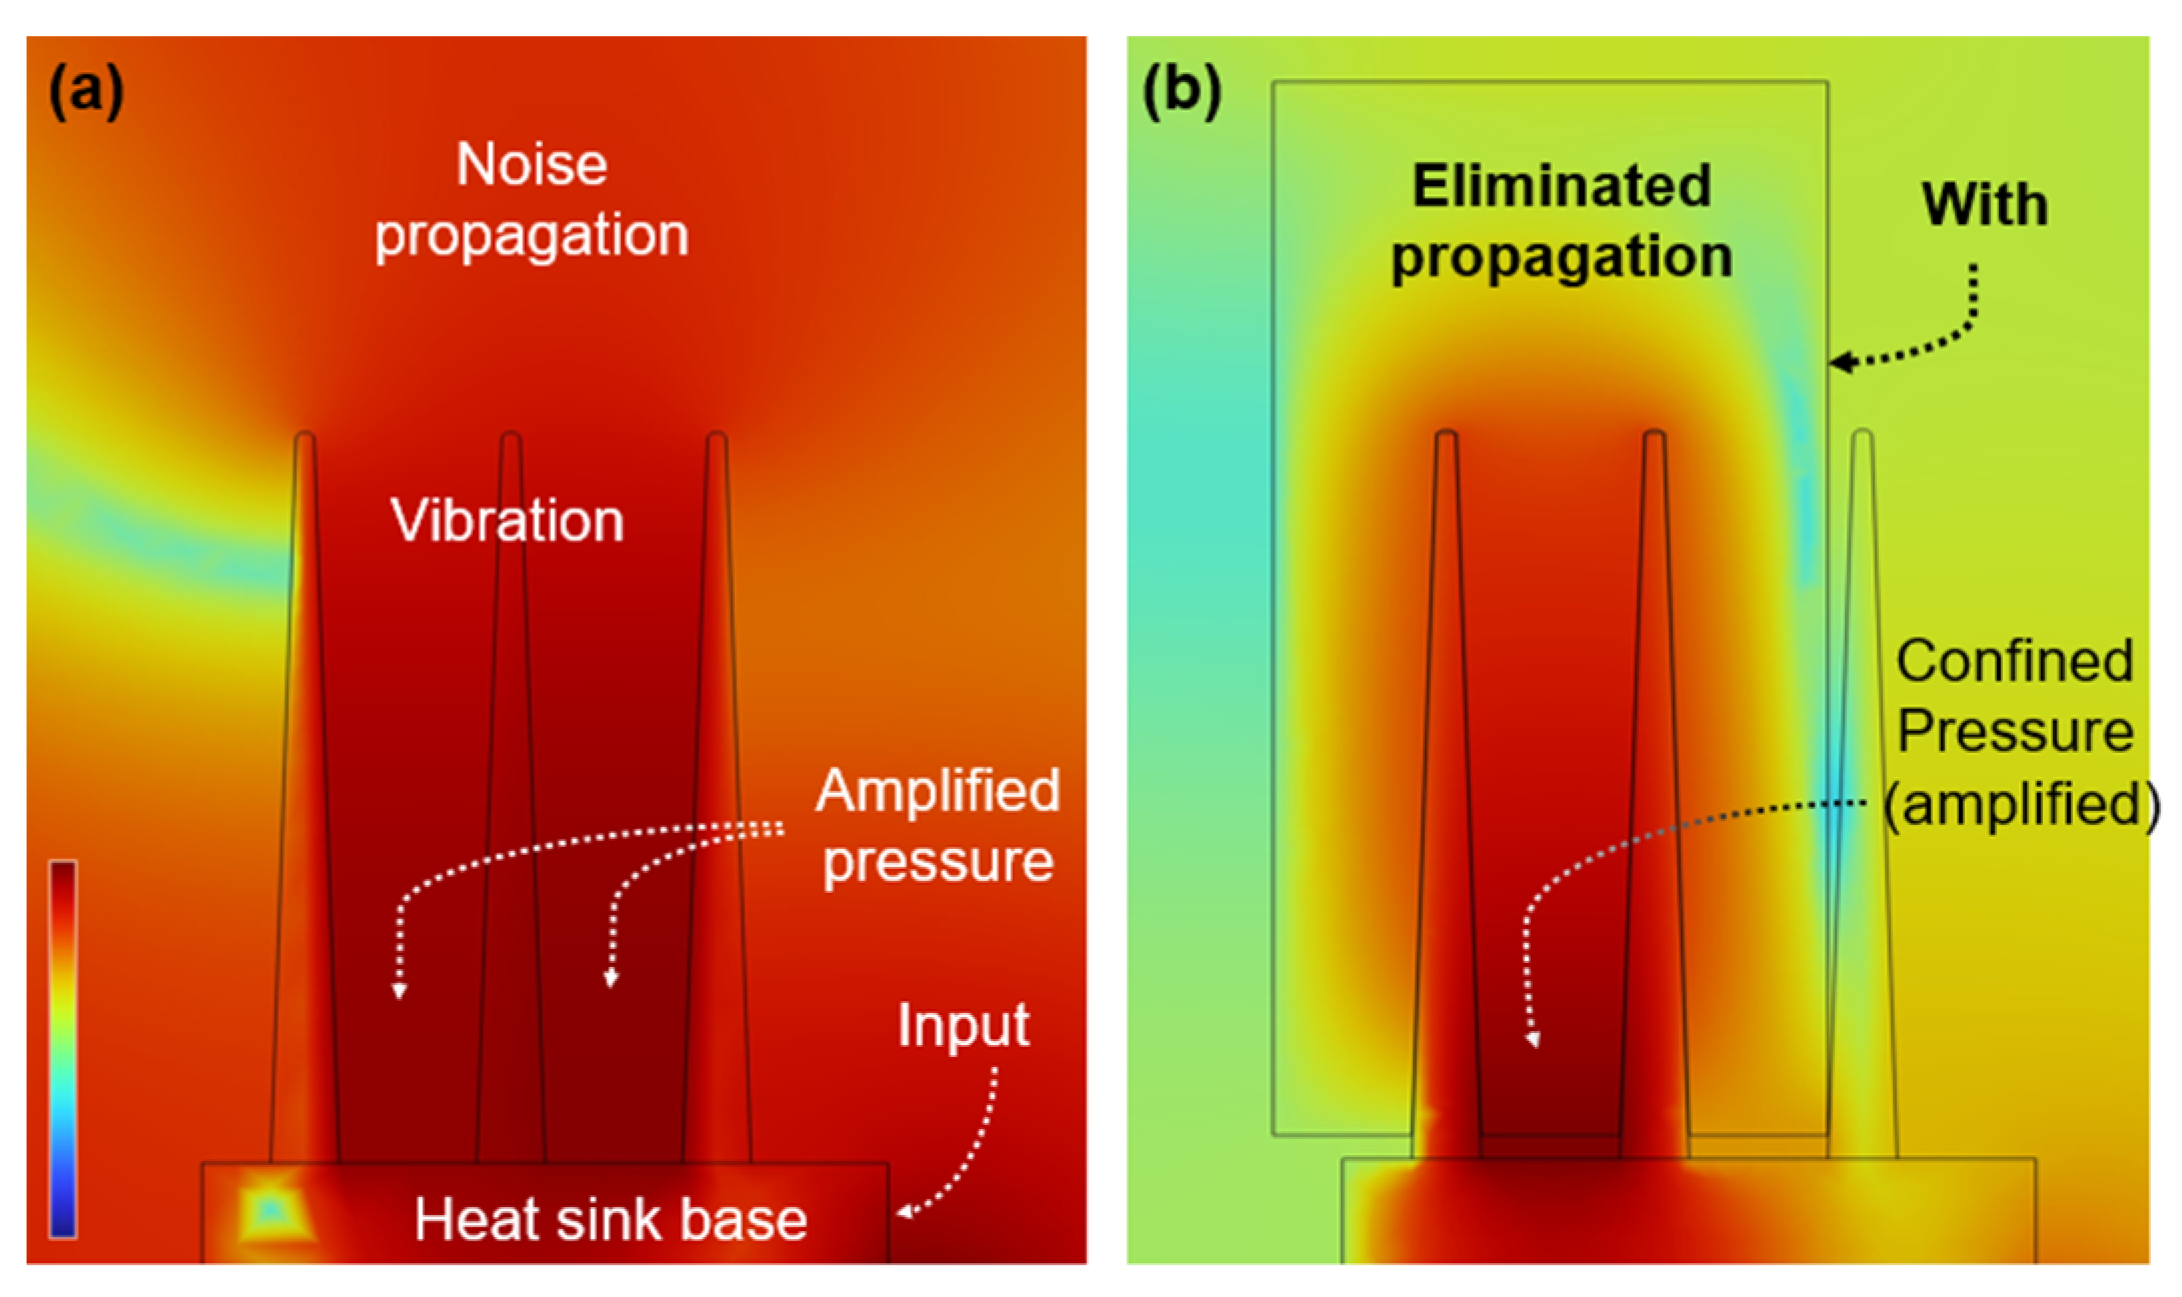
Figure 6a, first, a heat sink without a reducer was simulated. In particular, vibrations in the air medium between fins interfered with each other, leading to outstanding acoustic amplification. Thus, a tough sound pressure was produced between the fins. Noise generated by the heat sink is evenly transmitted through an air medium with uniform density. If the reducer can confine the sound pressure amplified between the fins, it means that the noise propagating around the processing machine can be eliminated more effectively. As shown in
Figure 6b, second, we set the mode with a reducer attached to the heat sink. The simulations compared the effect of the reducer with the same boundary conditions, such as input frequency, materials, and normal temperature. As a result, the generation and propagation of sound pressure were suppressed due to the vibration attenuation and barrier function of the reducer. Note that the intensity of the sound pressure generated on the fin surface was reduced, which means that the reducer diminished the vibration at the noise source. This result supports the idea that the sound pressure can be lowered by reducing the shaking of the fins. In addition, the propagation of the vibration generated between the fins was blocked by the reducer. Despite the reduced vibration, the maximum sound pressure was 121 dB, which is higher than the 105 dB pressure achieved when there was no reducer. This is because the confined vibration was further amplified. This means that the reducer isolates the noise in the local area between the heat sink bases. The simulation supports the claim that the proposed idea can reduce the vibration of the fin and reduce the noise dispersion into the atmosphere.
As shown in
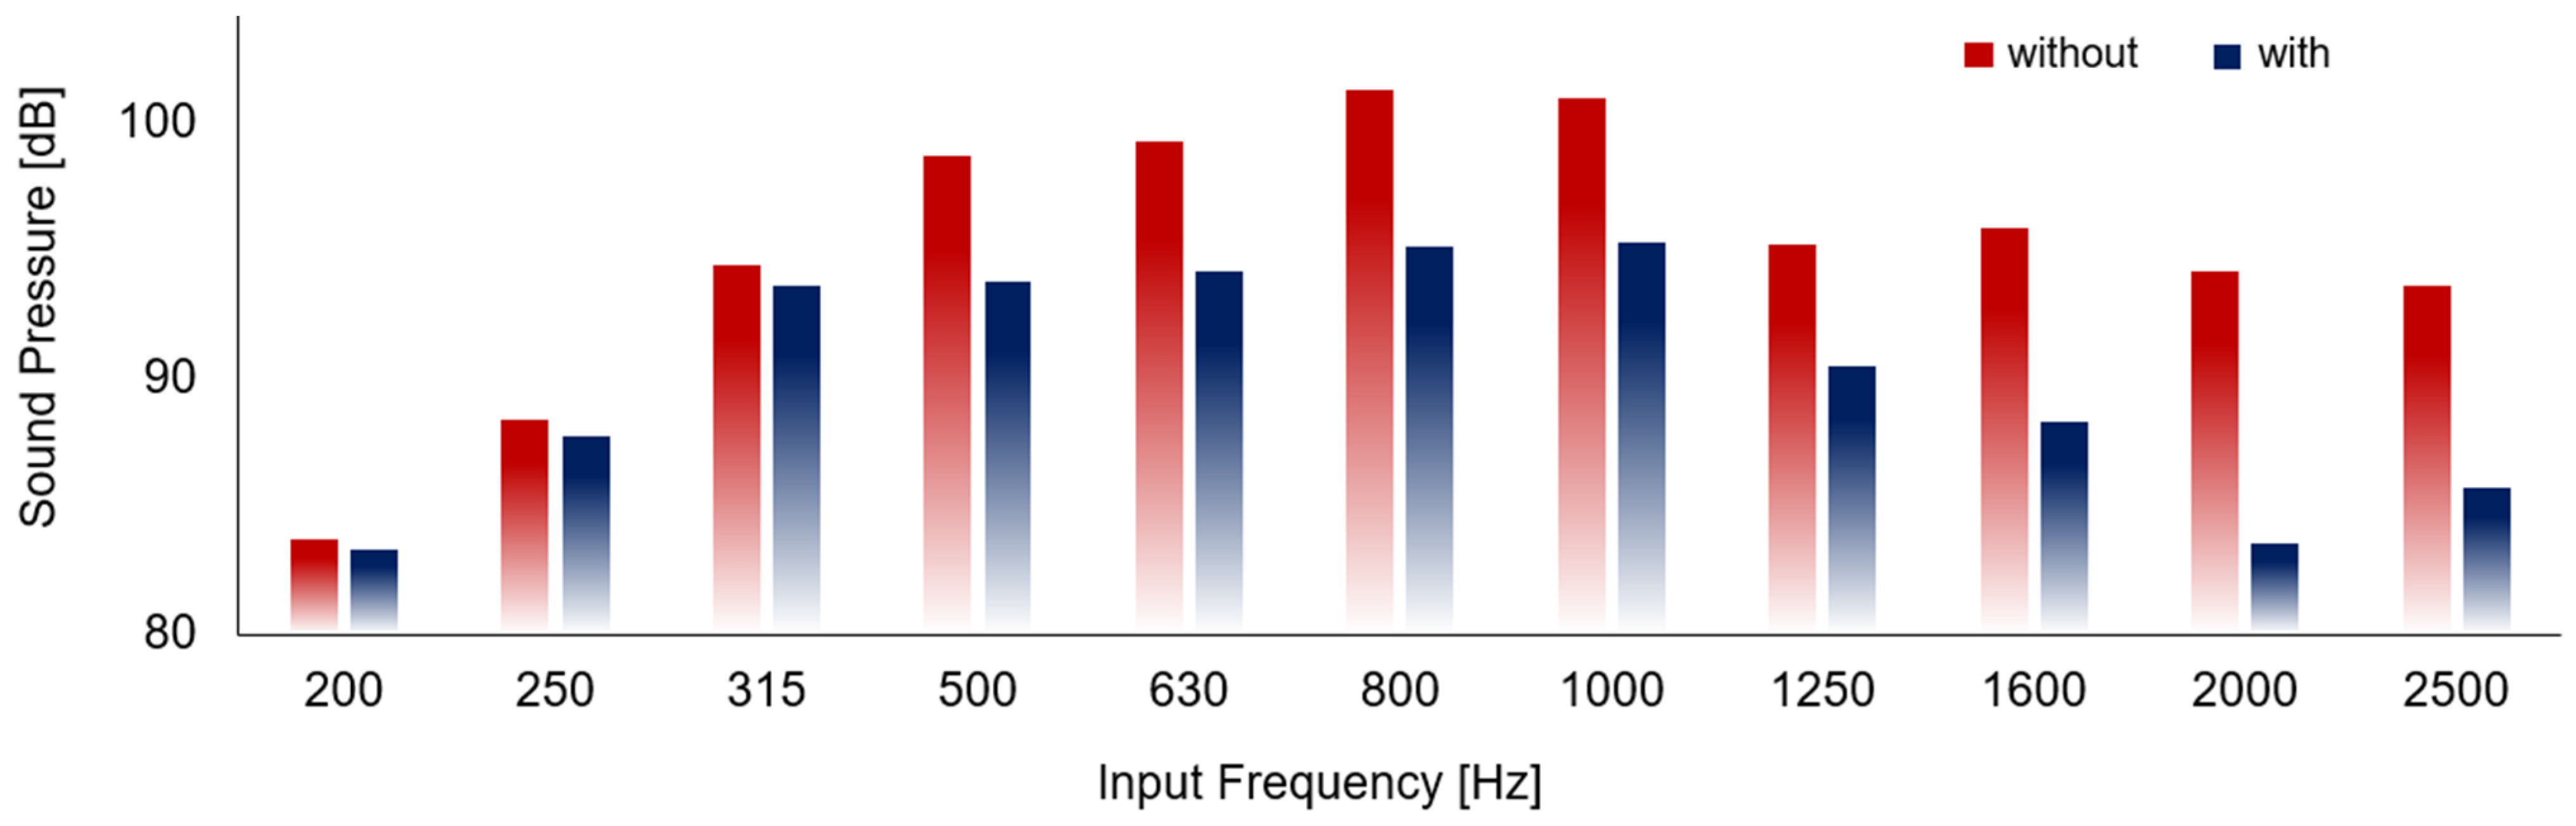
Figure 7, the effectiveness was further evaluated using a parametric sweep simulation. The frequency range was set as a variable, and results were obtained as its value changed incrementally within the specified range. Because the vibrating sources are very diverse in the actual manufacturing process, we targeted the vibration input in the simulation to the range of 200~2500 [Hz]. As a result, the reducer was effective above 500 Hz, with its performance improving as frequency increased. The initial sound pressure reduction was about 1~3% in the 200 Hz to 315 Hz range. It had an average sound pressure reduction capability of about 5~6% in the 500 Hz to 1250 Hz range. It had an average sound pressure reduction capability of about 7.8% above 1600 Hz. As with general physical phenomena, the sound pressure produced by vibration could be observed to be amplified as the vibration frequency increased. Conversely, the sound pressure decreased by about 4.7 dB in the range of 1250 Hz or higher. The decrease occurred when the input frequency matched the heat sink’s natural frequency, causing resonance. At this point, vibrations exhibited weak damping as the amplitude increased [
25]. The reduction phenomenon can also be seen as the sound-absorbing ability of the reducer at a certain frequency. Therefore, when the reducer was assembled on the fin, the effect of the reducer and the sound-absorbing ability of the heat sink was boosted, further lowering the sound pressure level. The prediction through simulation suggested that the reducer was effective in noise reduction.
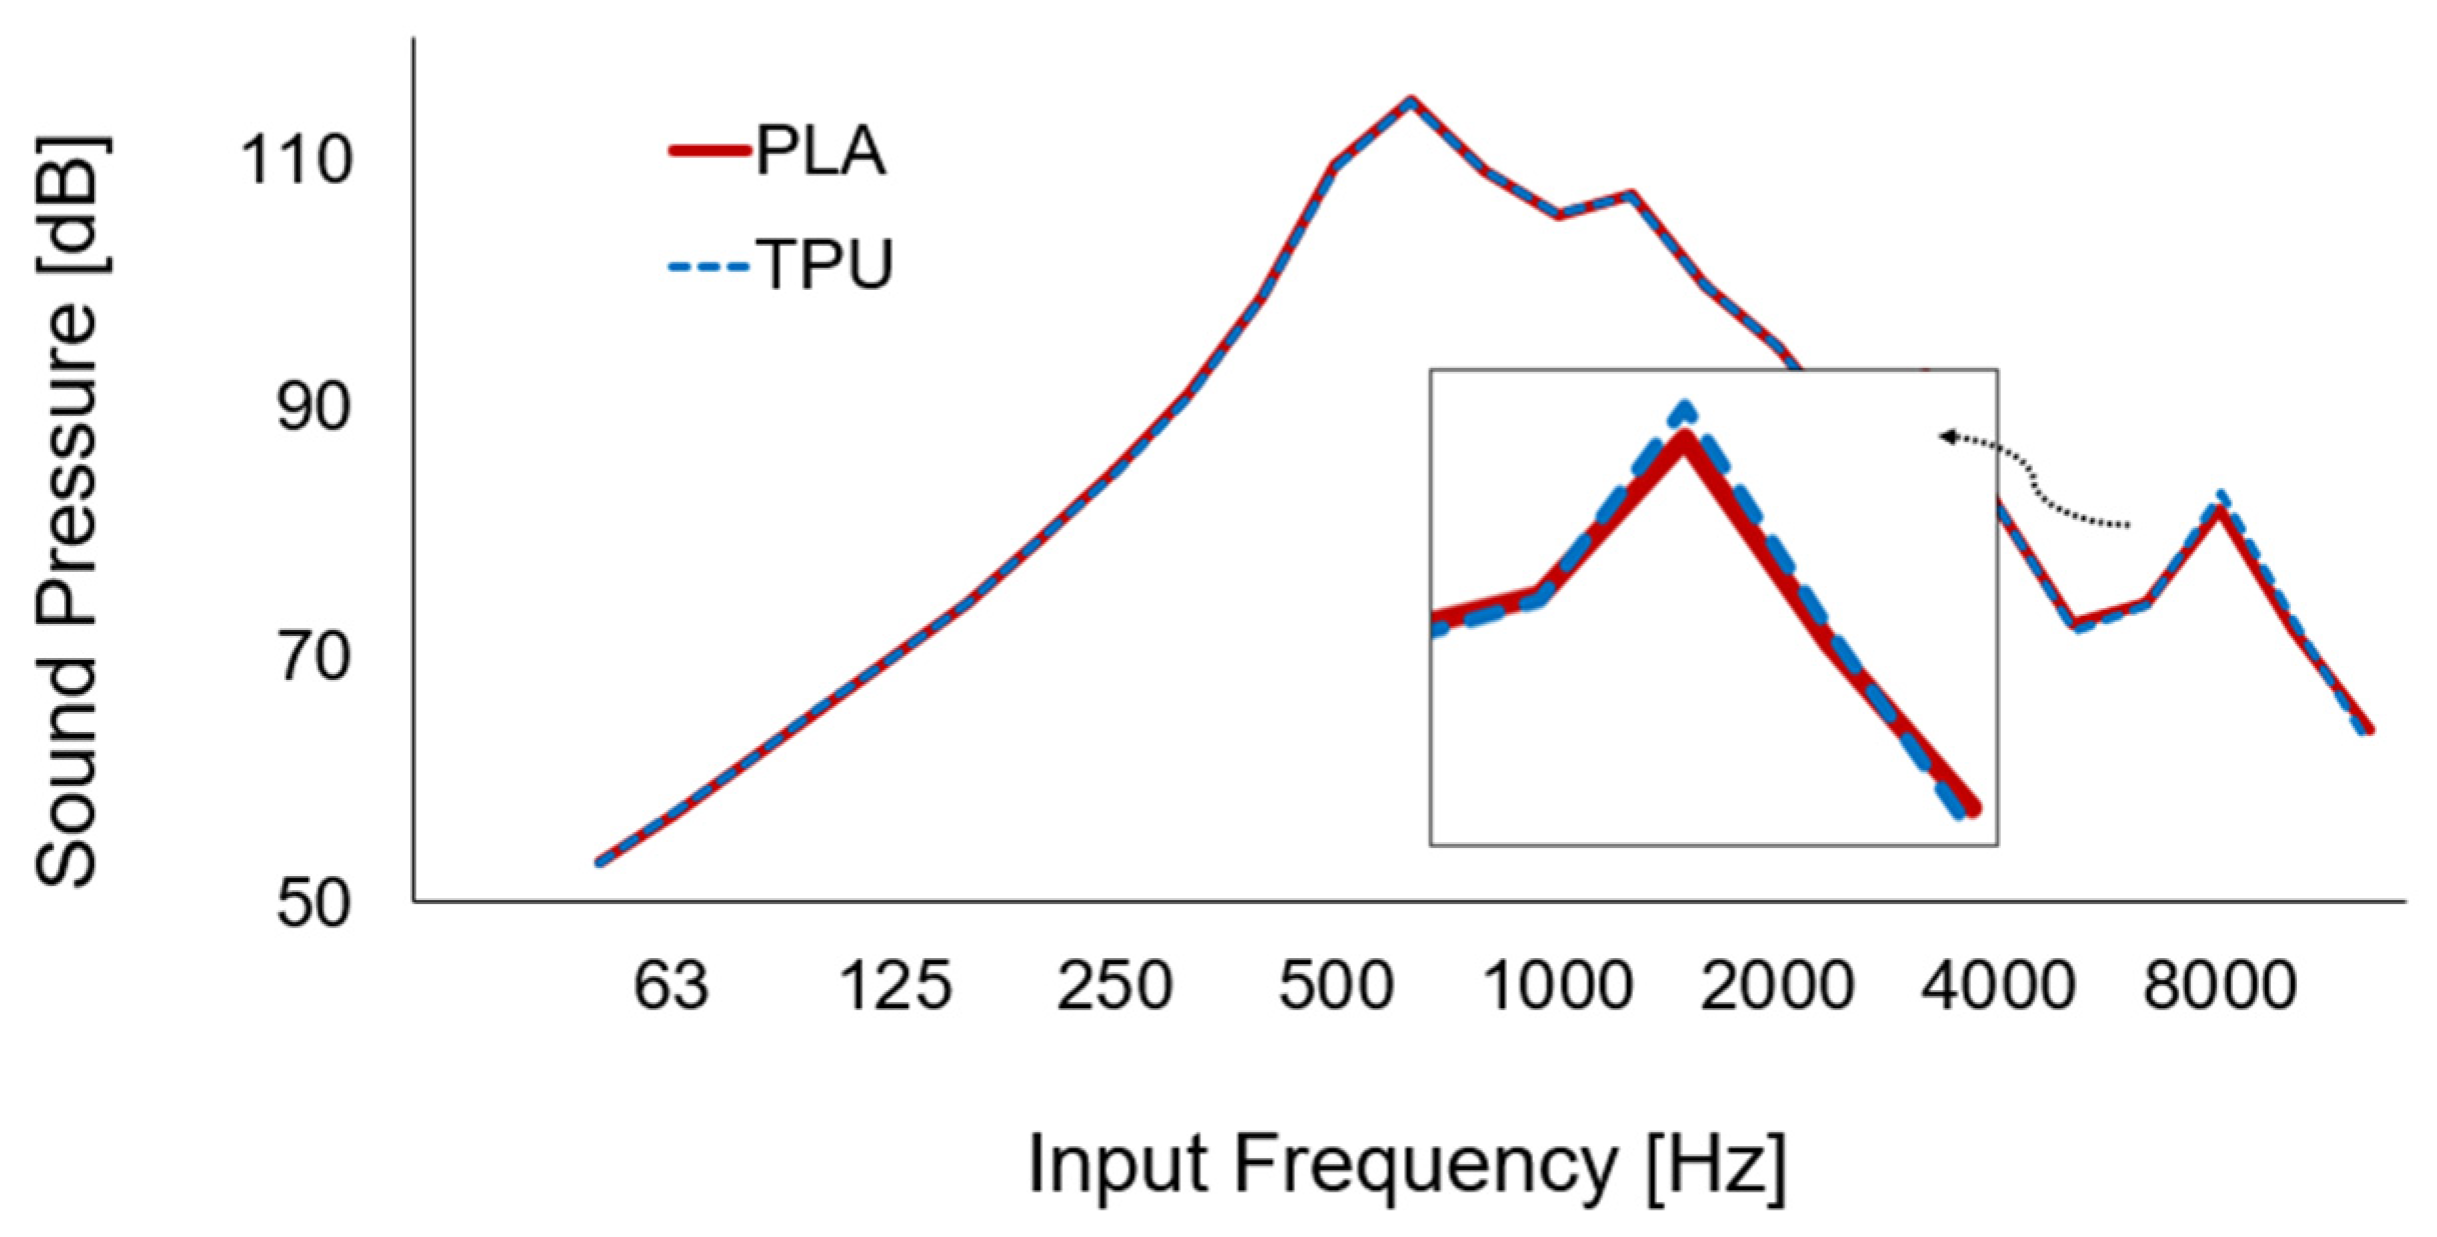
In
Figure 8, the appropriateness of materials is analyzed. To evaluate the noise reduction performance by material, reducers made of thermoplastic polyurethane (TPU) and PLA materials were considered and simulated. Additionally, various frequencies ranging from 50 Hz to 10,000 Hz were applied. Overall, the sound levels showed no significant differences, which means that there is freedom in material selection. However, at a high range of 4000 Hz and above, the sound level of the PLA reducer was 1.84% lower than that of the TPU reducer. The rubbery properties of TPU can be considered to have a low ability to suppress fin vibration at high frequencies. Although the difference in noise suppression performance between PLA and TPU was small and could be ignored, in this study, we selected PLA, with its higher performance in some frequency ranges. In the computer simulation, however, the slits of the reducer were in contact with the fins of the heat sink without a gap, so the vibration could be ideally suppressed. Thus, the effect may vary depending on the manufacturing precision for the actual heat sink and reducer.
3.4. Acoustic Measurement and Analysis
Figure 9 shows the spatial noise analysis. As shown in
Figure 9a, three locations on a 2D plane equal to the heat sink machining height were selected to set the sound meter: front (A, a 100 mm distance from the heat sink), left (B), and right (C). Therefore, the noise propagation levels in the x and y directions of the machined heat sink could be measured and analyzed simultaneously. As shown by the sound pressure levels in
Table 1, the heat sink without the reducer assembly, as shown in
Figure 9b, had sound pressures of 92.8, 92.3, and 91.6 dBA at positions A, B, and C, respectively. The fins provide an average of 92.2 dBA of noise through the air medium. The relatively high sound pressure at A, the front of the machine, is due to noise reflected by the machine body contributing to the amplification. The negative pressures at B and C, measured symmetrically left and right relative to the machine center, were similar to what we predicted.
As shown in
Figure 9c–e, to analyze the effect of the position where the reducer was assembled on the fin, reducers were assembled at various positions, and the noise level at each position was measured. This is because producing large-sized reducers requires expensive large-scale 3D printers, which can impose a financial burden on small and medium-sized companies manufacturing heat sinks. Thus, partially mounting small-sized reducers could enable effective production using smaller, more accessible 3D printers. When a reducer was functionalized at the center of the
x-axis length of the fins, the sound pressures were 91.4, 91.6, and 92 dBA at locations A, B, and C, respectively. The average noise level was 91.7 dBA, which was a 0.55% decrease compared to the noise level in the machine without a reducer. In addition, when a reducer was functionalized at the end of the
x-axis of the fin, the sound pressures were 91.5, 92.8, and 91.7 dBA at locations A, B, and C, respectively. The average noise level was 92 dBA, a 0.22% decrease compared to the noise level in the machining process without a reducer. Based on the experimental results, single reducers insufficiently reduced the sound pressure. Thus, the effect of the reducer’s length on the fin’s vibration reduction was evaluated. Reducers with
x-axis lengths of 30 and 90 mm were prepared by 3D printing. Measurements with a sound level meter indicated that the 30 mm long reducer showed an average level of 92 dBA, and the 90 mm reducer showed a level of 91.7 dBA. Considering the tolerance accuracy of the sound level meter of ±1.5 dB, it reduced noise, but its effect was limited. Therefore, sequential experiments were performed to confirm that using a single reducer could reduce noise. However, this did not appear to be effective enough to eliminate harmful noise for users. The dual reducer’s notable effectiveness will be explained in the next section.
As shown in
Figure 9e, significant noise reductions were obtained when two reducers were assembled at both ends of the heat sink fin. The sound pressure at locations A, B, and C decreased by 74.1, 76.7, and 76.1 dBA, respectively. This marked 20.2%, 17%, and 16.9% decreases. The average noise level was 75.6 dBA, an 18.1% decrease compared to the 92.2 dBA observed without reducers. As with the measurement data described in the previous section, the heat sink without reducers resulted in an average of 92 dBA. When the single reducer was used, the sound pressure level remained at 91 to 92 dBA. However, dual reducers reduced the pressure level to 74~76 dBA. These results indicate that when one reducer is assembled, the free area of the fins still vibrates, so noise is generated. Two reducers symmetrically assembled on both sides of the heat sink can reduce the vibration of the fin evenly, making more effective noise reduction possible.
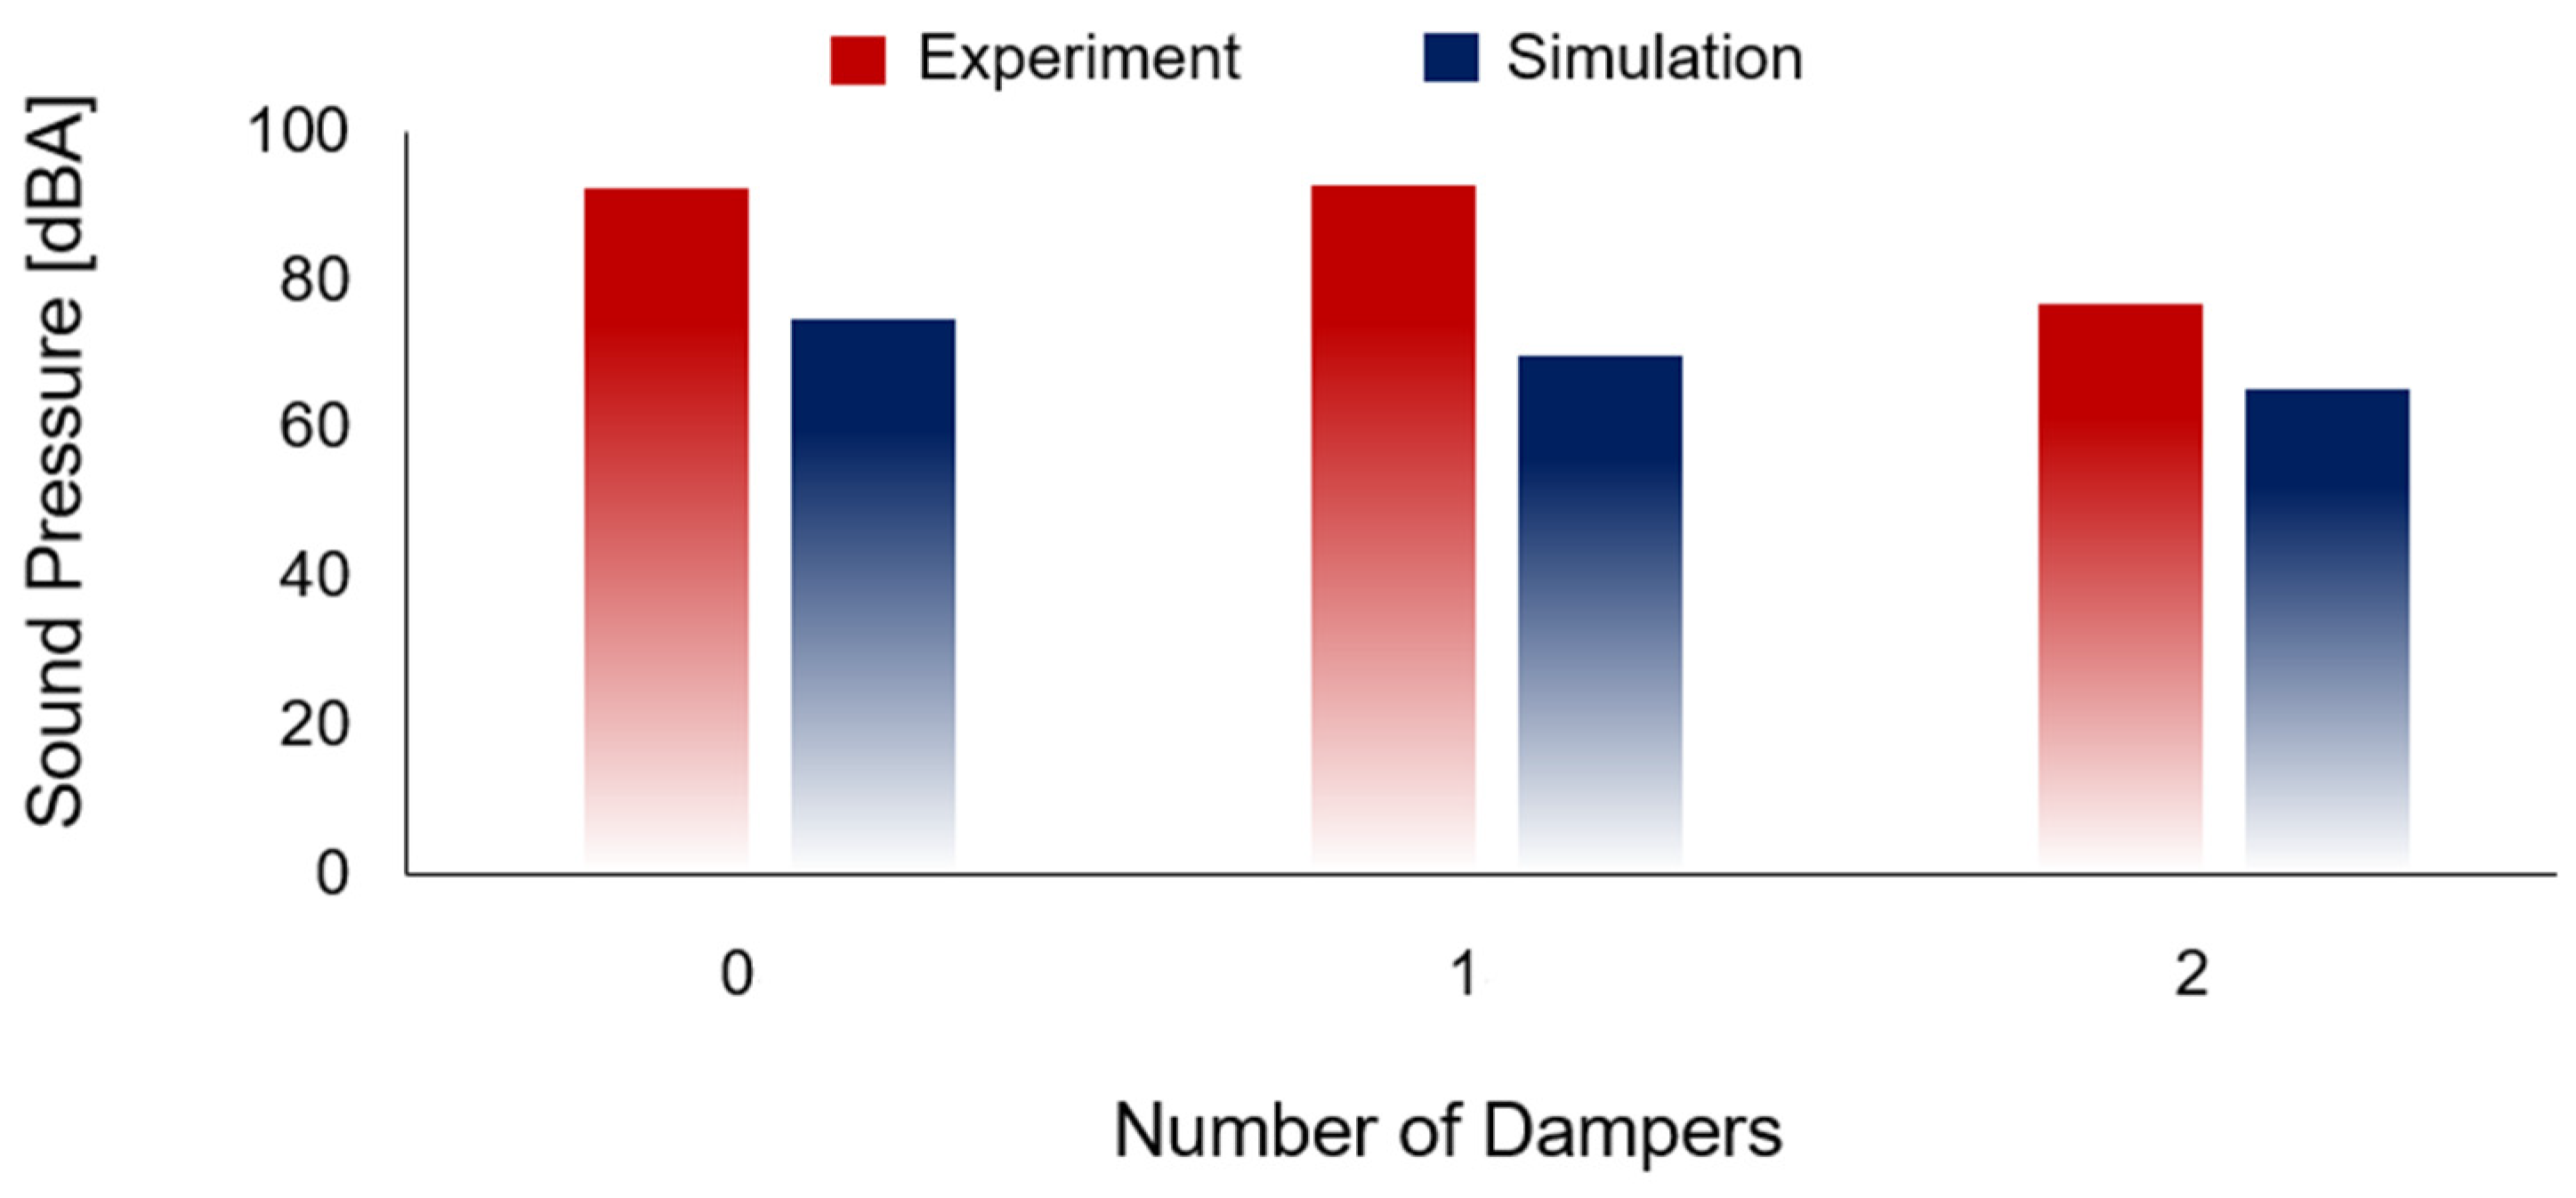
Figure 10 shows the sound level measurement and simulation according to the number of reducers, which facilitated a comparative analysis of the study’s findings. The simulation predictions were different from the experimental results. When the reducer was not assembled, 72 dBA was expected. When one reducer was assembled, 69 dBA was expected, and when two reducers were assembled, 65 dBA was expected. The results were 4.2% and 10% reductions compared to the case without reducers, respectively. The overall trend of sound pressure reduction with the addition of reducers was consistent between the simulation and experimental results, supporting both the concept and findings. However, the simulation exhibited a more idealized linear relationship, whereas the experimental data showed slight variations due to real-world conditions.
These differences can be interpreted as resulting from discrepancies in the conditions between the simulation and experiment. In particular, the simulation was based on idealized assumptions, which likely contributed to the deviation from real-world results. In the ideal simulation scenario, it was assumed that the contact surfaces were perfectly contacted without any gaps, leading to a higher damping performance. However, in reality, as depicted in
Figure 4e, the surface of the 3D-printed filament layers includes microscopic roughness that is not reflected in the simulation model. Therefore, if the surface roughness of the printed component were to be incorporated into the simulation or if the damping coefficient were to be calibrated using experimental data, the simulation results could be brought closer to the actual behavior. In addition, the dimensional tolerance of the 3D-printed reducer may reduce the reducer’s influence on the system’s vibration. Note that the vibration reduction was ideal when the heat sink fins and the reducer were assembled without a gap [
26]. Based on experiments and simulations, it has been argued that, for effective noise reduction, it is important to place multiple reducers symmetrically rather than simply increasing the length of the reducer. Furthermore, it has been argued that making the contact area fine or manufacturing the shape precisely so that all the joints are tightly engaged can improve performance.
3.5. Verification: Visualizing Noise Reduction
To verify the research, the reducer was demonstrated via visualization. As shown in
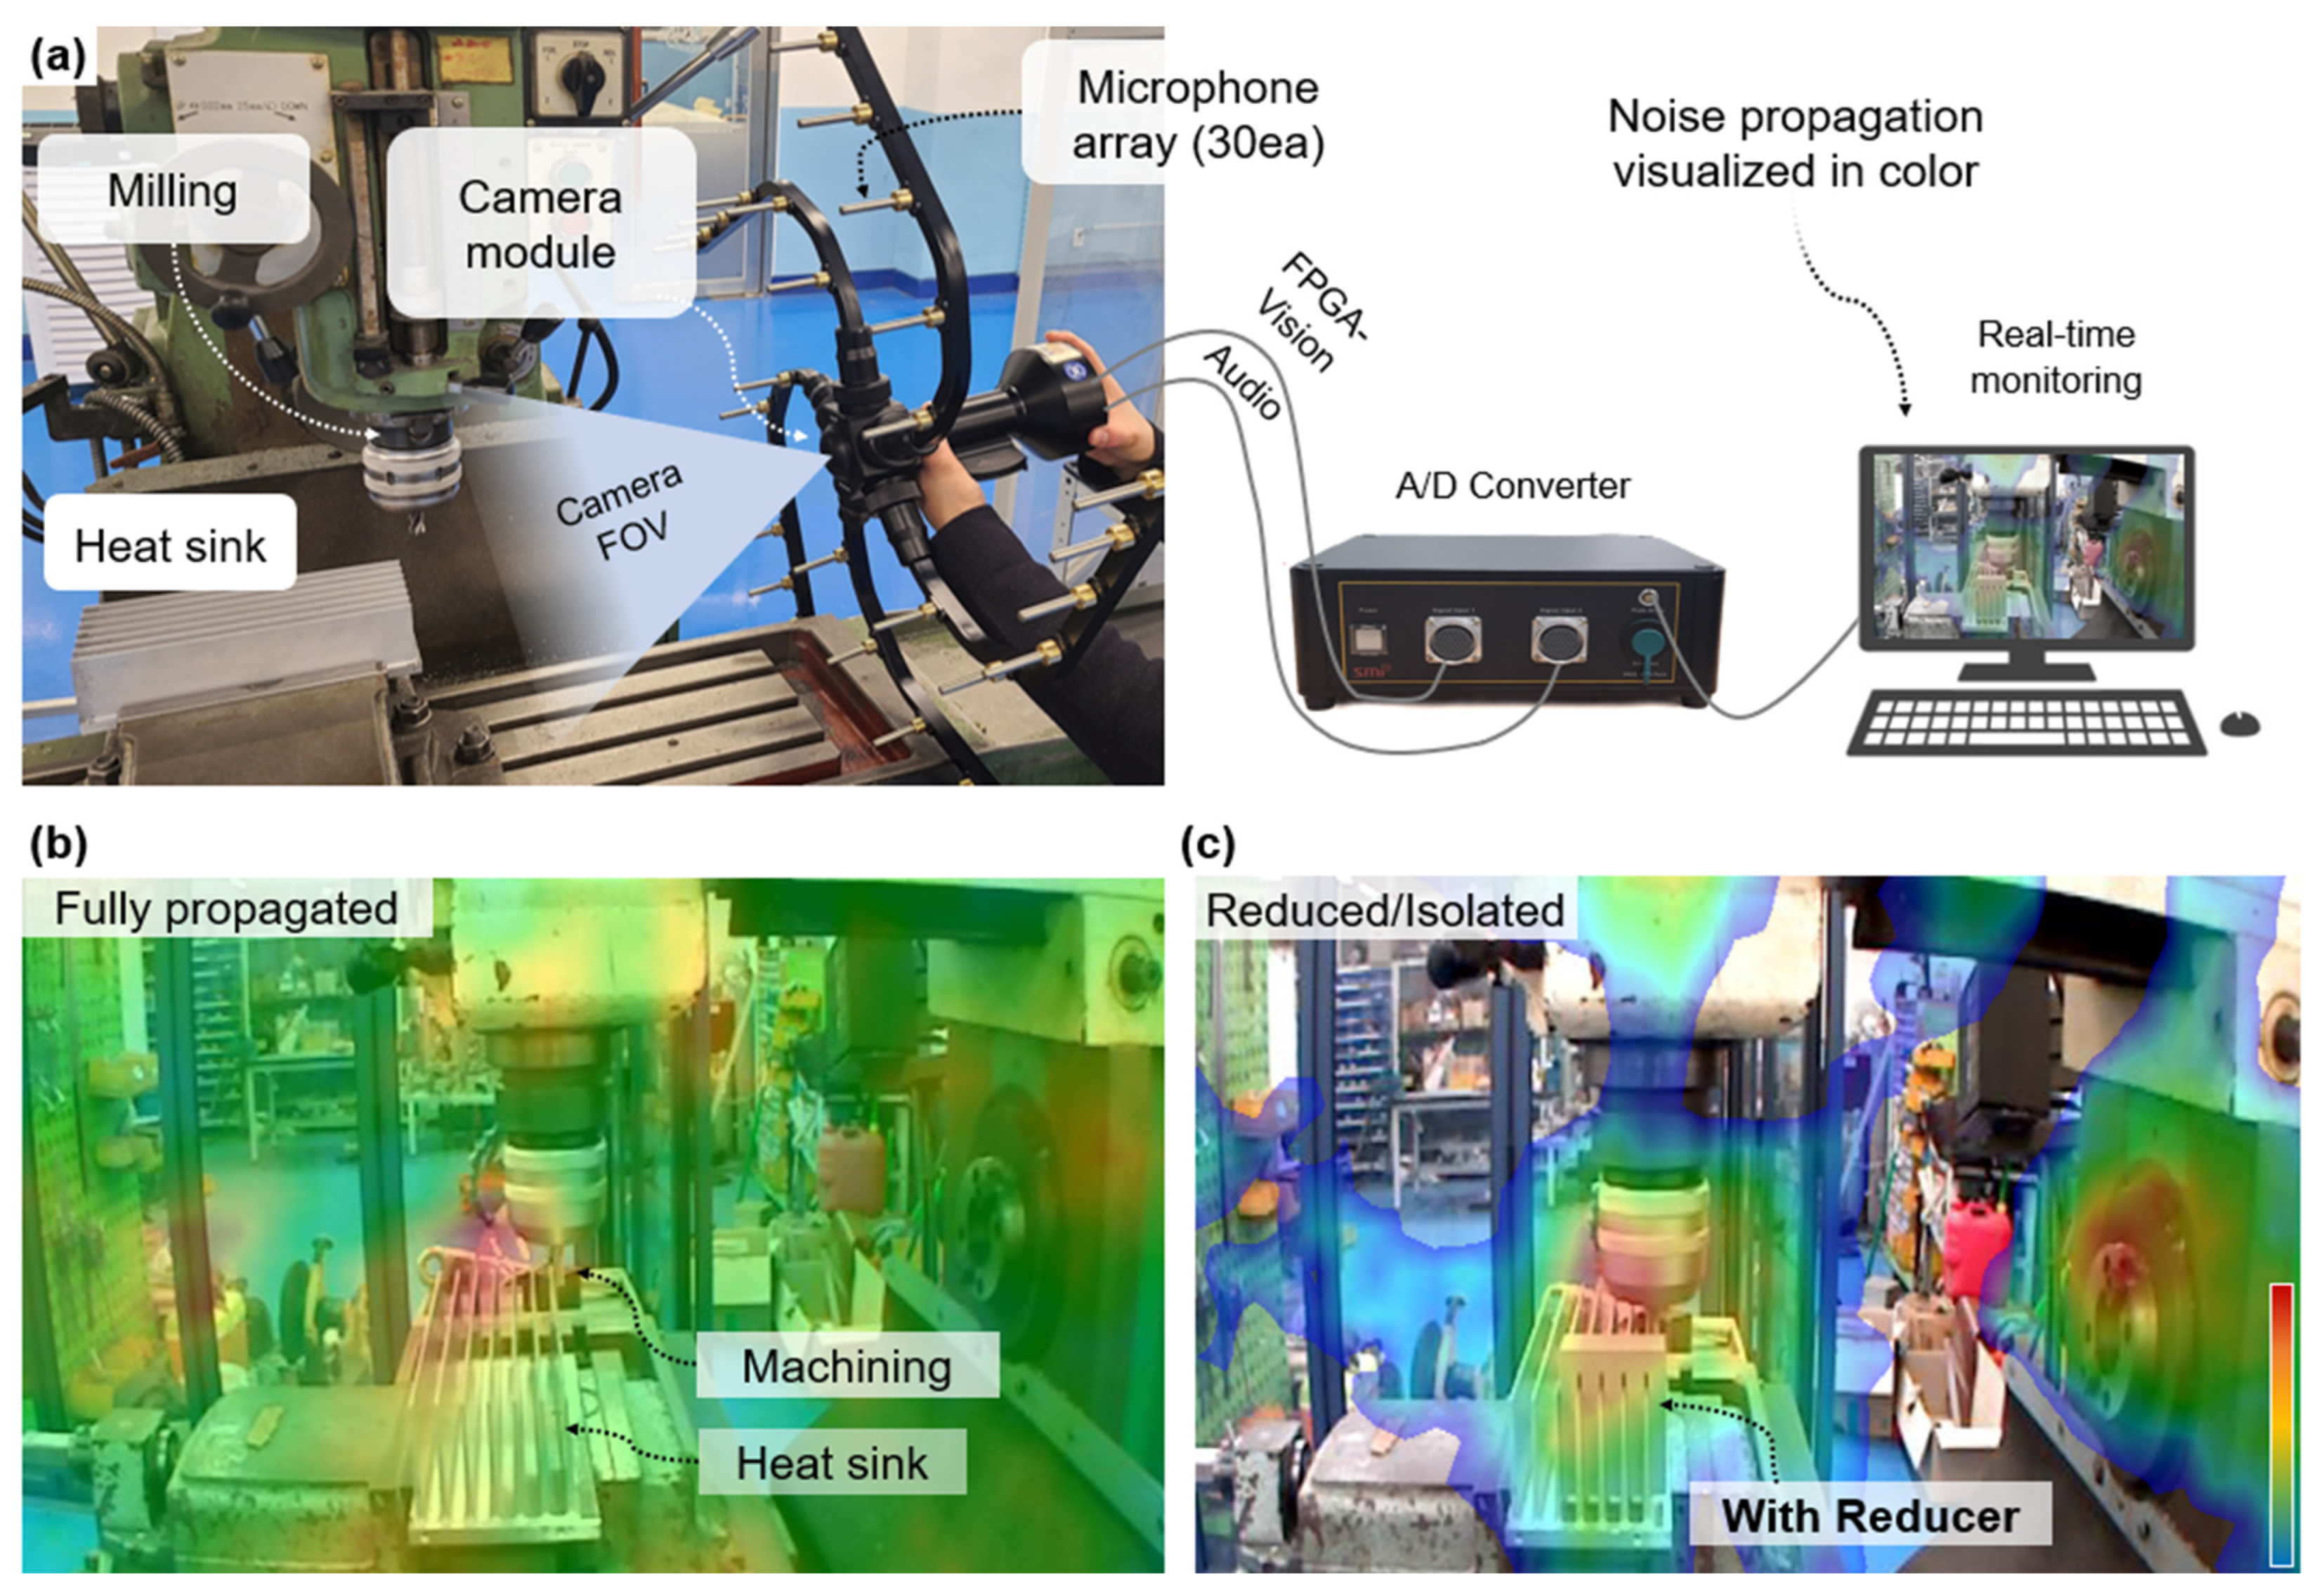
Figure 11a, the effect of the reducer was measured and examined using an acoustic camera. The acoustic camera had an array of 30 microphones in a radial form and acquired sound pressure matching the field of view (FOV) range of the camera module on the center of the tool. The acoustic camera combines vision and audio data at high speed through FPGA beamforming. The location and level of sound pressure were precisely calculated and transmitted to the video screen in real time through data processing. As a result, the area of noise propagation and the sound pressure transmitted through the air could be graphically demonstrated.
Figure 11b visualizes the propagation of sound pressure in an actual machining environment using the acoustic camera. The FOV included a milling machine, heat sink, and reducer. The distance between the acoustic camera and the workpiece was 153 mm, sufficient for detecting the sound pressure in the atmosphere. The rotation speed of the milling tool was set to 1200 rpm. During milling on the heat sink, the red area indicates that high sound pressure appeared between the fins and at the contact with the mill. According to a study in the literature on milling, chatter generated from the workpiece causes the machining system to lose dynamic stability, resulting in large amplitude vibration and noise [
26]. The vibration is transmitted to the fins. The fins with multiple large areas effectively dissipate the noise in more diverse directions. The green area indicates relatively low sound pressure, meaning that the noise was still dispersed and transmitted to the surroundings. The noise was propagated throughout the FOV, which meant that the vibration was evenly transmitted via the air.
Figure 11c shows the remarkable reducer. There are two red islands in the image. Significant acoustic pressure was still generated at the contact point between the milling tool and the heat sink. However, the amplified intensity was reduced as the red island became blurred. Unlike in the experiment without the reducer, the acoustic propagation was reduced because the reducer controlled the isolation. On the right side of the image, the noise generation in the milling machine body was due to the built-in high-power DC motor. As a result, the noise transmitted through the air was reduced, isolating the acoustic pressure within a certain region of the FOV. Therefore, there are regions where the color representing the sound is not layered on the image. The verification clearly supports the idea and simulation prediction that a reducer designed with a vibration control structure would reduce noise generation and suppress acoustic pressure propagation by impeding the vibration energy generated from the fin.


