Abstract
Impact absorbers are needed in many different areas in terms of energy absorption and crashworthiness. While the design of these structures is expected to increase mechanical performance, they are expected to be lightweight, and when evaluated in this context, lattice structures come to the fore. In this study, impact absorbers, also known as crash boxes, consisting of lattice structures designed to increase energy absorption performance were fabricated by a new manufacturing method, metal powder additive manufacturing, and their mechanical performance was experimentally investigated under quasi-static axial loading, and energy absorption data were obtained. The specimens were designed from Ti6Al4V, INC 718, and AISI 316L materials by forming 18 matrix structures with square and hexagonal geometries. According to this study, the lattice structures absorbed up to 4.5 times more energy than the shell structures of a similar material group. According to the normalized values among all samples, the hexagonal sample made of Ti6Al4V material showed 4.3 times higher energy absorption efficiency. The AISI 316L material showed the best crushing performance due to its ductile structure.
1. Introduction
With the ever-increasing number of vehicles and the high rates of traffic accidents associated with them, the design of safe vehicles has become critical to minimize these accidents or reduce their negative effects [1,2]. Over the years, there has been a significant increase in the number of vehicles [3,4,5]. For instance, while the total number of motor vehicles in Turkey was approximately 12 million in 2012, this figure has now increased to nearly 30 million [6]. Similarly, the number of passenger cars in Europe increased by more than 9.8% between 2015 and 2020 [7]. This increase led manufacturers to develop vehicle security systems and made these systems an important part of the sector [8,9,10]. The need to create safer systems has resulted in numerous studies and research, along with significant investments dedicated to the development of these technologies.
Vehicle safety is one of the most important areas of research in the transportation sector, as effective safety systems help protect passengers and minimize the damage caused by traffic accidents [11]. Crash boxes, considered in this study, are placed behind the front bumper and play a vital role in minimizing the impact of the accident on the passenger compartment [12,13]. Traffic accidents range from axle collisions to rollovers and side collisions, requiring highly efficient safety systems to minimize potential risks.
Safety, one of the most basic requirements of vehicle design, is important for passengers and the environment. Two safety systems stand out in safer vehicle design. These systems are active safety systems (ABS, ESP, ASR), which are intended to prevent an accident from occurring [14,15,16,17,18], and passive safety systems (seat belts and airbags, front and rear bumpers, energy absorbers), which will be activated when an accident is inevitable and will minimize the possible effects of the accident and ensure that the user and the environment are minimized [19,20,21]. In traffic accidents, frontal collision is one of the most common types of accidents and poses a significant threat to occupant safety. Therefore, the development of energy-absorbing parts is an essential step in improving vehicle safety [22]. In this context, energy-absorbing parts minimize the impact of the collision on the chassis and cabin, thereby reducing potential injuries [23].
In terms of crash box designs, researchers have worked on many different materials, geometries, and methods. Three-dimensional printing has been widely used in the creation of geometrically complex structures, including sandwich core structures, for improved energy absorption properties [24,25,26]. Wang et al. [27] filled unstable honeycomb structures produced from PLA material as filler between structures produced from 6063-T6 material, Zeng et al. [28] designed lattice structures with different cell numbers and element sizes from thermoplastic materials in filament form, and Chapkin et al. [29] filled and tested lattice structures formed using Ti6Al4V material with Polydimethylsiloxane (PDMS) and Polyurethane (PU). Çetin et al. [30] conducted research to improve the energy absorption performance of structures with AlSi10Mg powder in their studies. Tancogne-Dejean et al. [31] investigated the mechanical behavior of the octet lattice structure formed from AISI 316L material by the SLM method. It was found that the cages with cylindrical supports approached the optimum structure, and the yield strength increased up to 50% as the support thickness increased from 0.8 mm to 8 mm. Hussain et al. [32] examined the effects of geometry on energy absorption performance, examining different geometries and trigger types. The study revealed that structures with decagonal geometries exhibited the best performance, with square, cylindrical, hexagonal, and decagonal geometries demonstrating varying levels of performance. The remaining geometries exhibited hexagonal, cylindrical, and square structures, respectively. Lalitendu Tripathy and Wen Feng Lu investigated the performance of thin-walled hollow impact absorber boxes and cage structure boxes with hybrid structures made of plastic-based and AISI 316L stainless steel [33]. Researchers found that the efficiency increased with the increase in the number of cells in the structure, and the peak impact force decreased by 30–50% in the cage structures compared to the thin-walled hollow structure. In the study conducted, the energy absorption capabilities of structures composed of PLA and PLA/CF (PLA and carbon fiber) materials in triangular, cubic, linear, and honeycomb configurations at varying densities were examined. The findings indicated that the honeycomb configuration yielded optimal outcomes. While the compression modulus exhibited an increase with increasing density, the specific energy absorption values experienced a decline, and the total energy absorption values attained a maximum at 60% density [34]. In another recent study, the performance of hybrid structures with different densities produced from AlSi10Mg powder under axial load was investigated. It was determined that the performance of hybrid structures under load was better compared to empty structures [35].
In another study, within the scope of studies using additive manufacturing technique, an experiment was conducted to investigate the mechanical behavior of cells with different filling geometries (Octet, Gyroid, and Cross) having dimensions of 5 × 5 × 5 (mm) and 50%, 30%, and 20% relative density values. These cells were molded from a thermoplastic material using the melt casting method, and it was found that the mechanical properties deteriorated in all geometries as the relative density increased [36]. In addition, it was observed that the highest tensile strength was obtained in Octet geometry, and the highest deformation was obtained in the cross-filling geometry. In another study on thermoplastic 3D printing, the performance of honeycomb composites with different size and height characteristics was examined using ABS and PLA. The experiment centered on studying the response of these composites under compression loading. The results showed that PLA, which has better mechanical properties than ABS, performed better under compression [37].
This study aims to add a larger volume to the literature and contribute to future developments by enabling the comparison of different materials and geometries together. In this study, unlike the literature studies, the energy absorption performance of 18 different samples formed from lattice systems with different geometrical structures using three different metal powders in the same experiment was examined together with microstructure analyses. The study is the only known study to date in terms of the materials and lattice structures used.
2. Materials and Methods
Additive manufacturing is a manufacturing technique that started to be developed in the 1980s in order to increase the production capacity of parts with complex geometric structures and to meet the rapid prototyping needs of the manufacturing industry [38,39]. In traditional methods, the final product is achieved by removing chips from the part, whereas in additive manufacturing, the final product is achieved by adding material layer by layer to the part. Thanks to this method, raw material consumption and tool and machine variety have been minimized, and high precision in dimensional tolerances has been achieved. First developed for rapid prototyping, additive manufacturing offers the time and cost advantages provided by analysis and design software in the design phase and also in the production phase [40,41,42].
Selective laser melting (SLM), an additive manufacturing method used in this study, fuses materials placed in powder form on the production table by melting them with a laser beam at melting temperature. In the SLM process, the powder is completely melted and fused together. During the melting process, which is carried out by selecting the coordinates of the part to be formed with the laser beam, unmelted, uncoordinated powders serve as support and are cleaned after the process, and the final product is obtained [43,44].
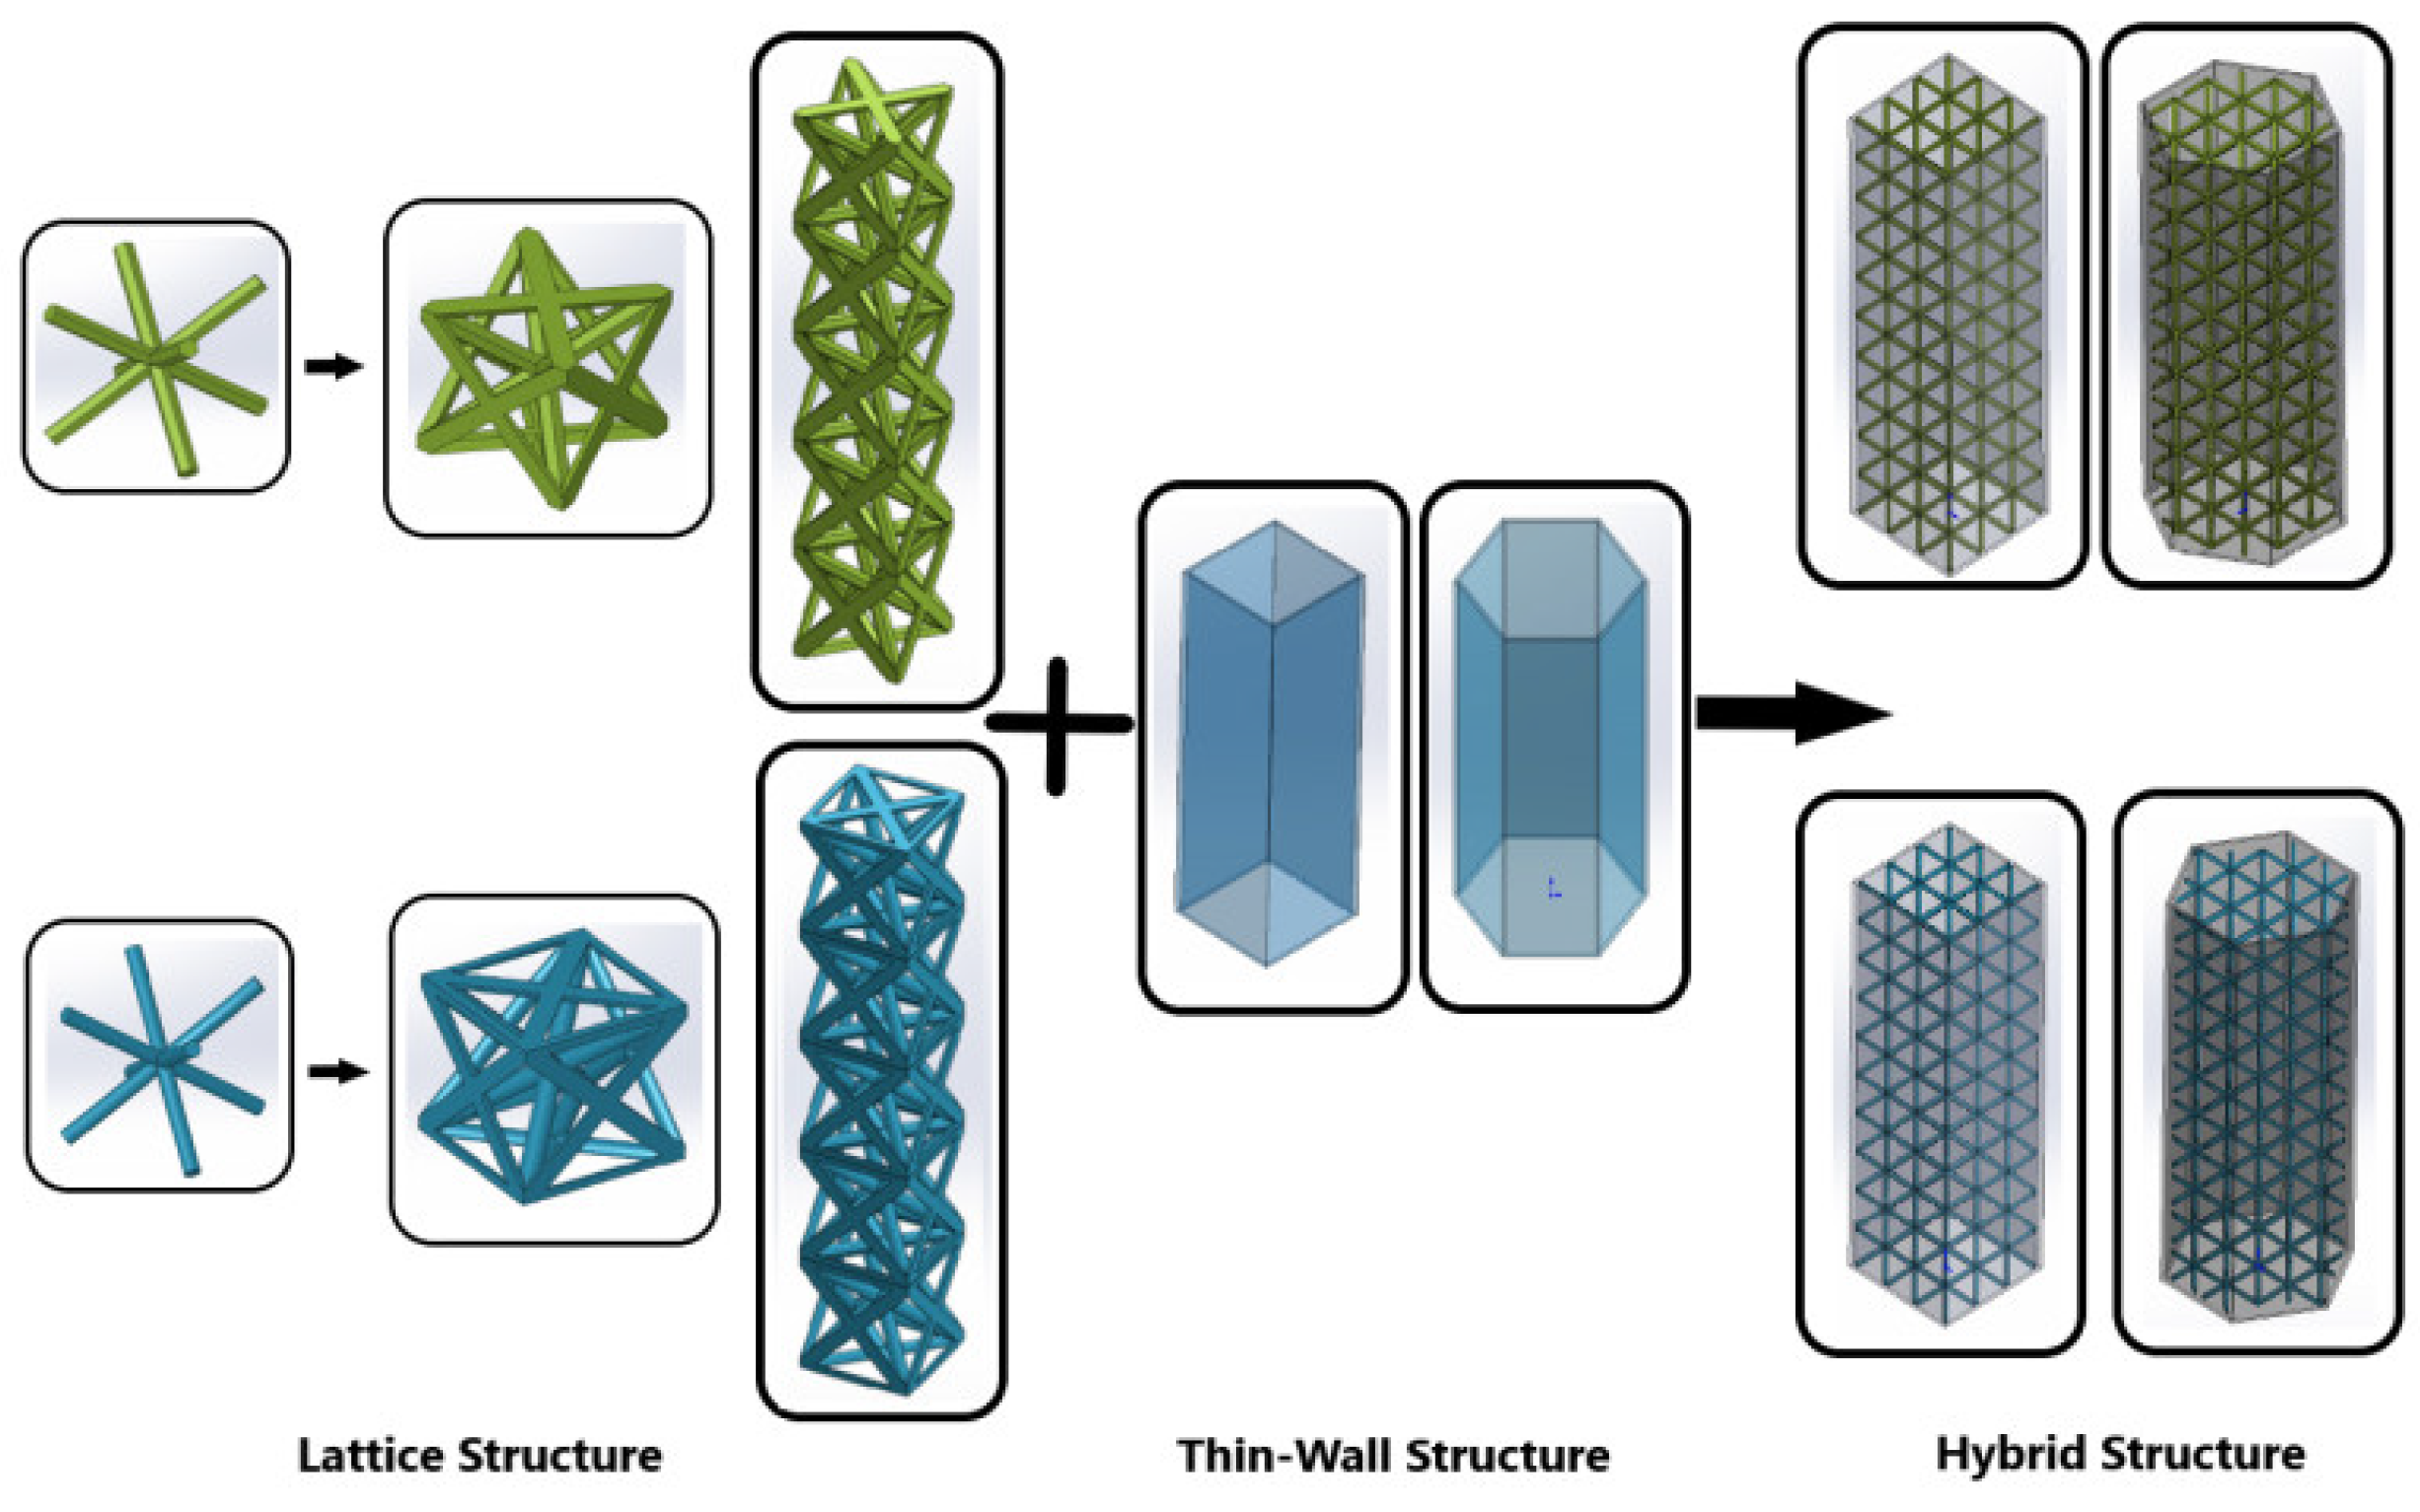
In this study, a hybrid structure was designed from body-centered cubic (BBC) lattice structures and thin-walled shell structures using 3 different materials and varying their geometric parameters, as shown in Figure 1. The designed structures were produced using the selective laser melting (SLM) 3D printing method. Mechanical tests were carried out, and their performance under axial load was investigated. Dimensional controls of the produced samples were performed with a 3D scanning device. In addition, the powder particles of the materials used and the morphological structures of the produced samples were analyzed by electron microscopy.

Figure 1.
Schematic diagram of hybrid structure.
2.1. Structure Description
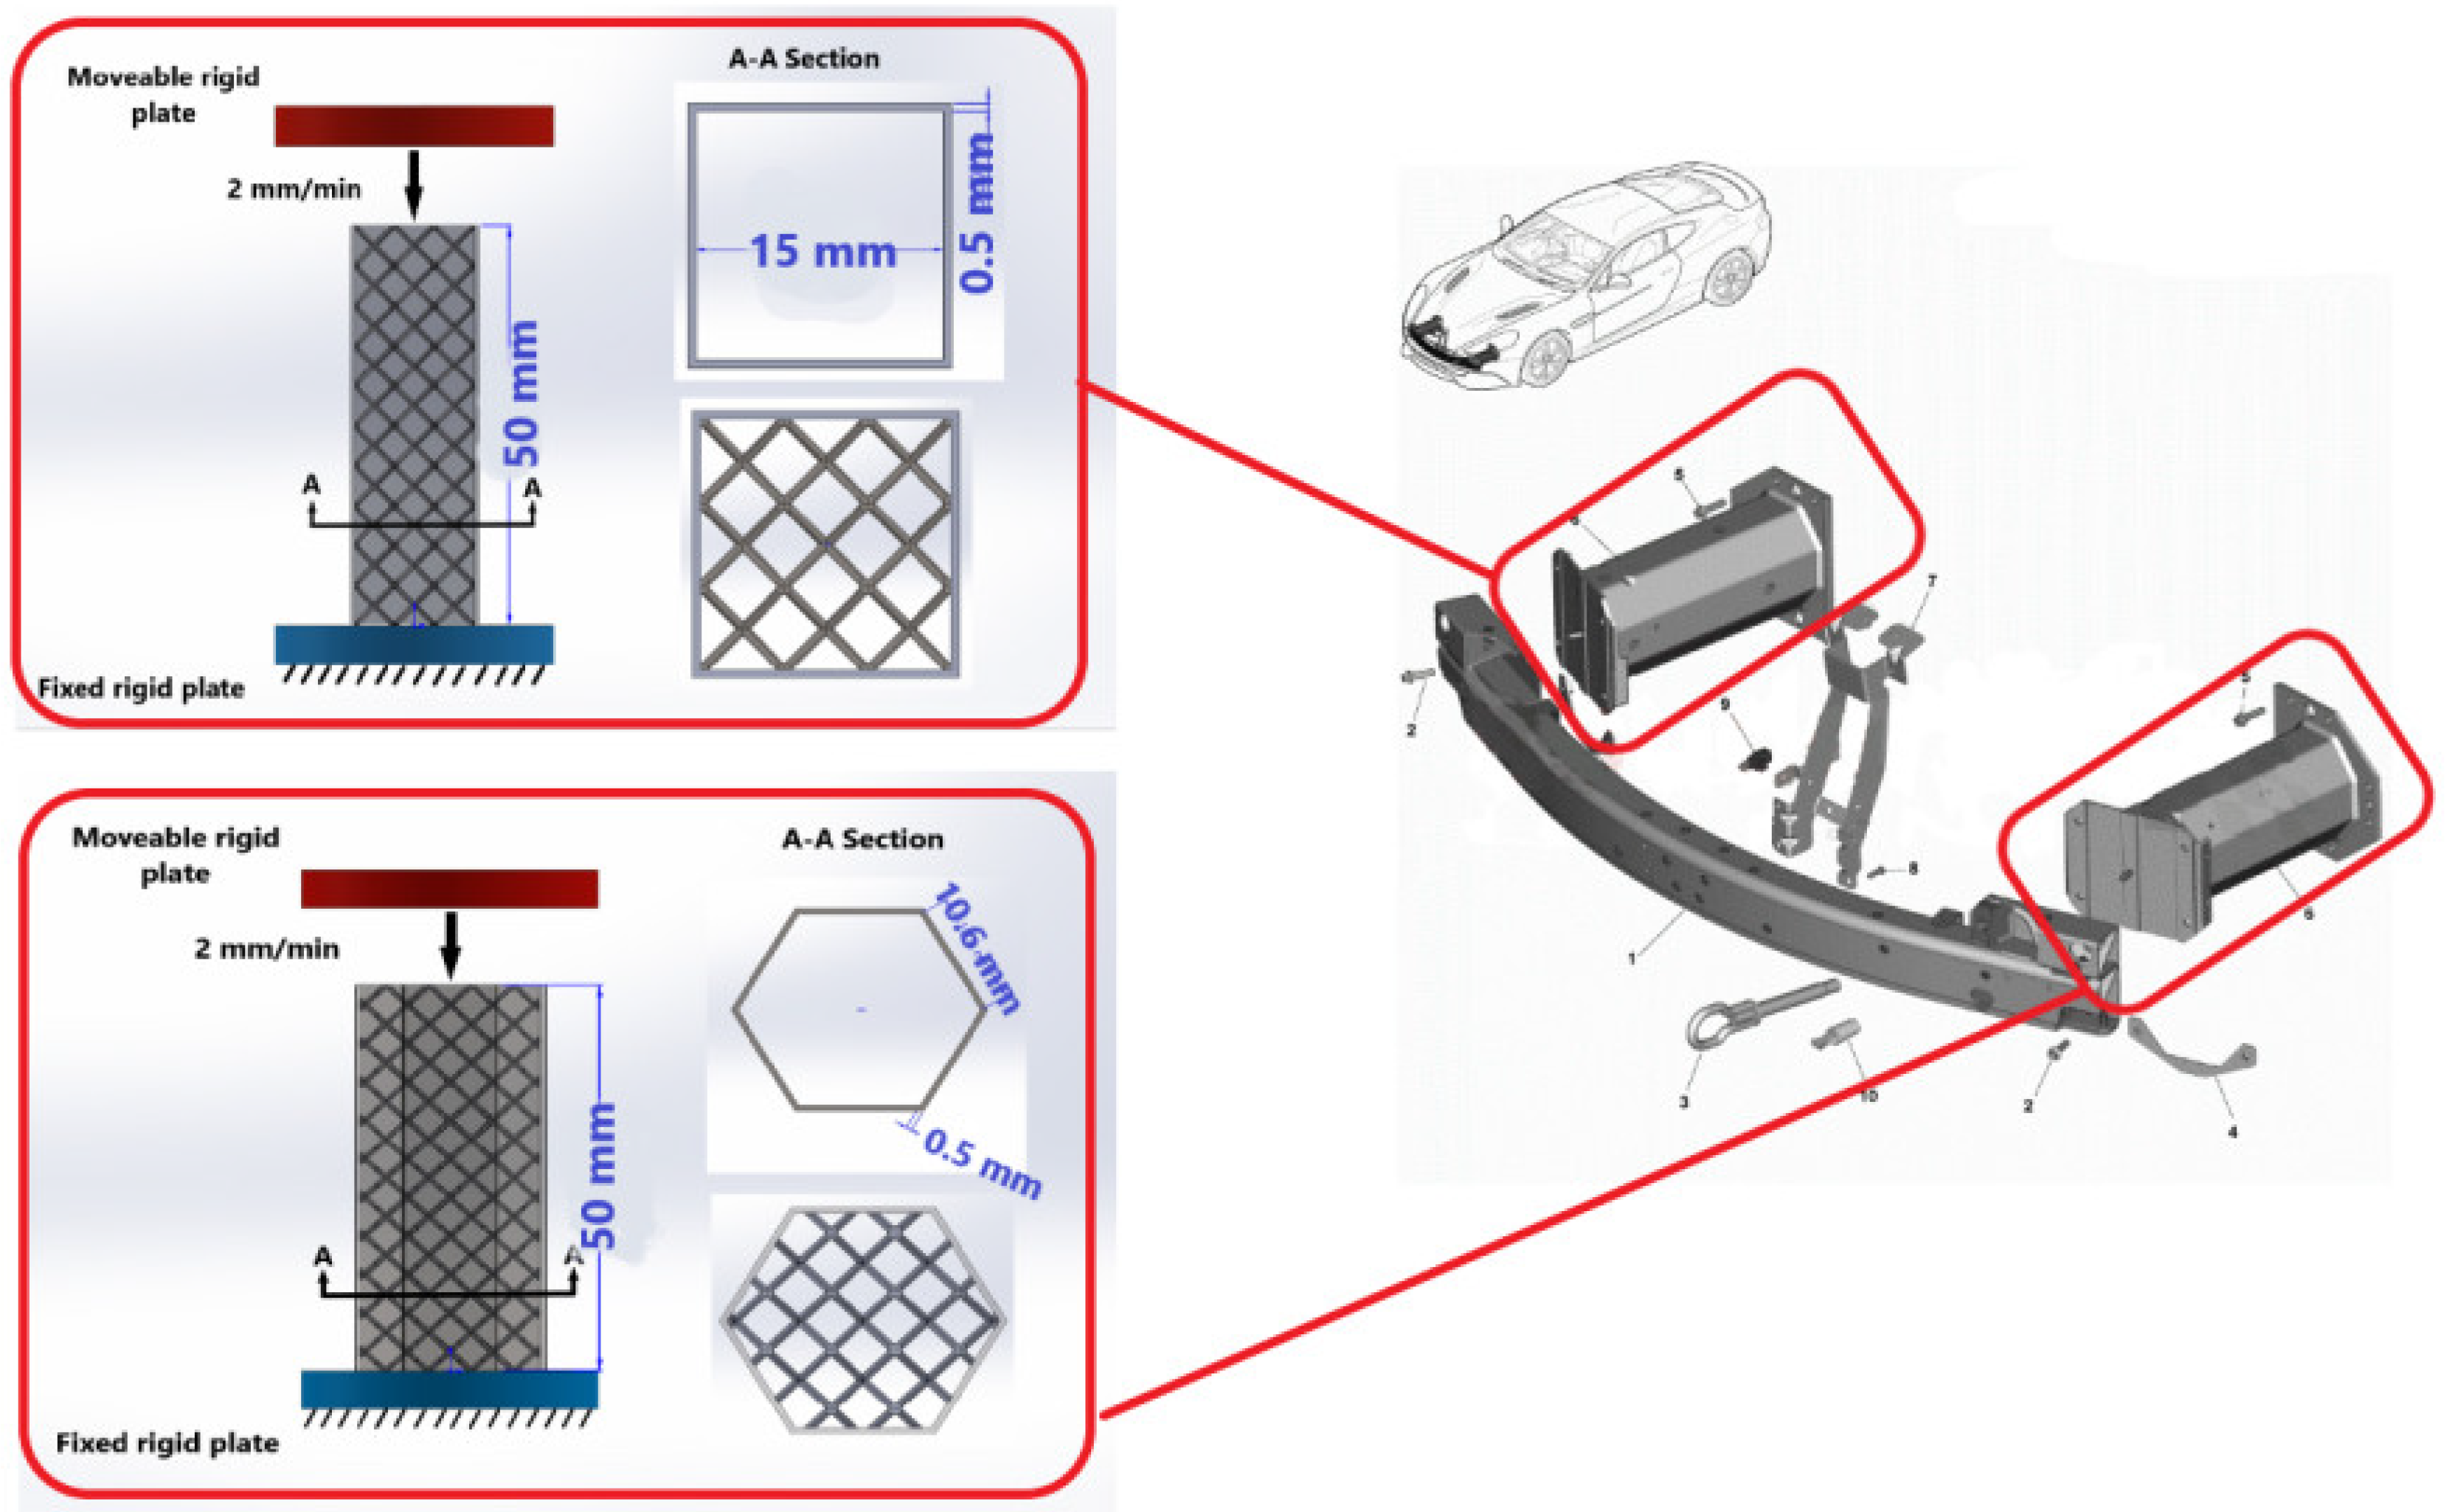
In this study, the performance of 18 distinct hybrid structures consisting of hexagonal and square thin-walled structures made of three different materials, Ti6Al4V, AISI 316L, and Inconel 718, with two different cell element geometries, hexagonal and circular, against axial compression was investigated. The parameters of the cell geometry of the lattice structure (diameter and geometry of the cell element) were varied, while the width, length, and height parameters of the structure were kept constant. The effect of hybrid structures with different geometry and filling on the energy absorption performance of thin-walled hollow tubes was investigated. As demonstrated in Figure 2, one end of the structure is placed on a fixed, rigid surface and subjected to axial compression with a moving rigid plate at the other end. The structure is simulated for axial load on crash boxes in passenger cars, which are designed at smaller scales due to manufacturing costs and time constraints.
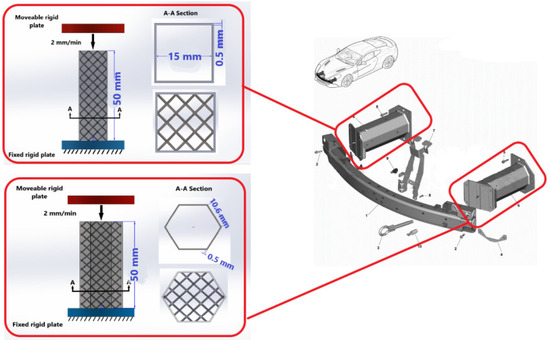
Figure 2.
Schematic diagram of a simplified car energy absorption box model.
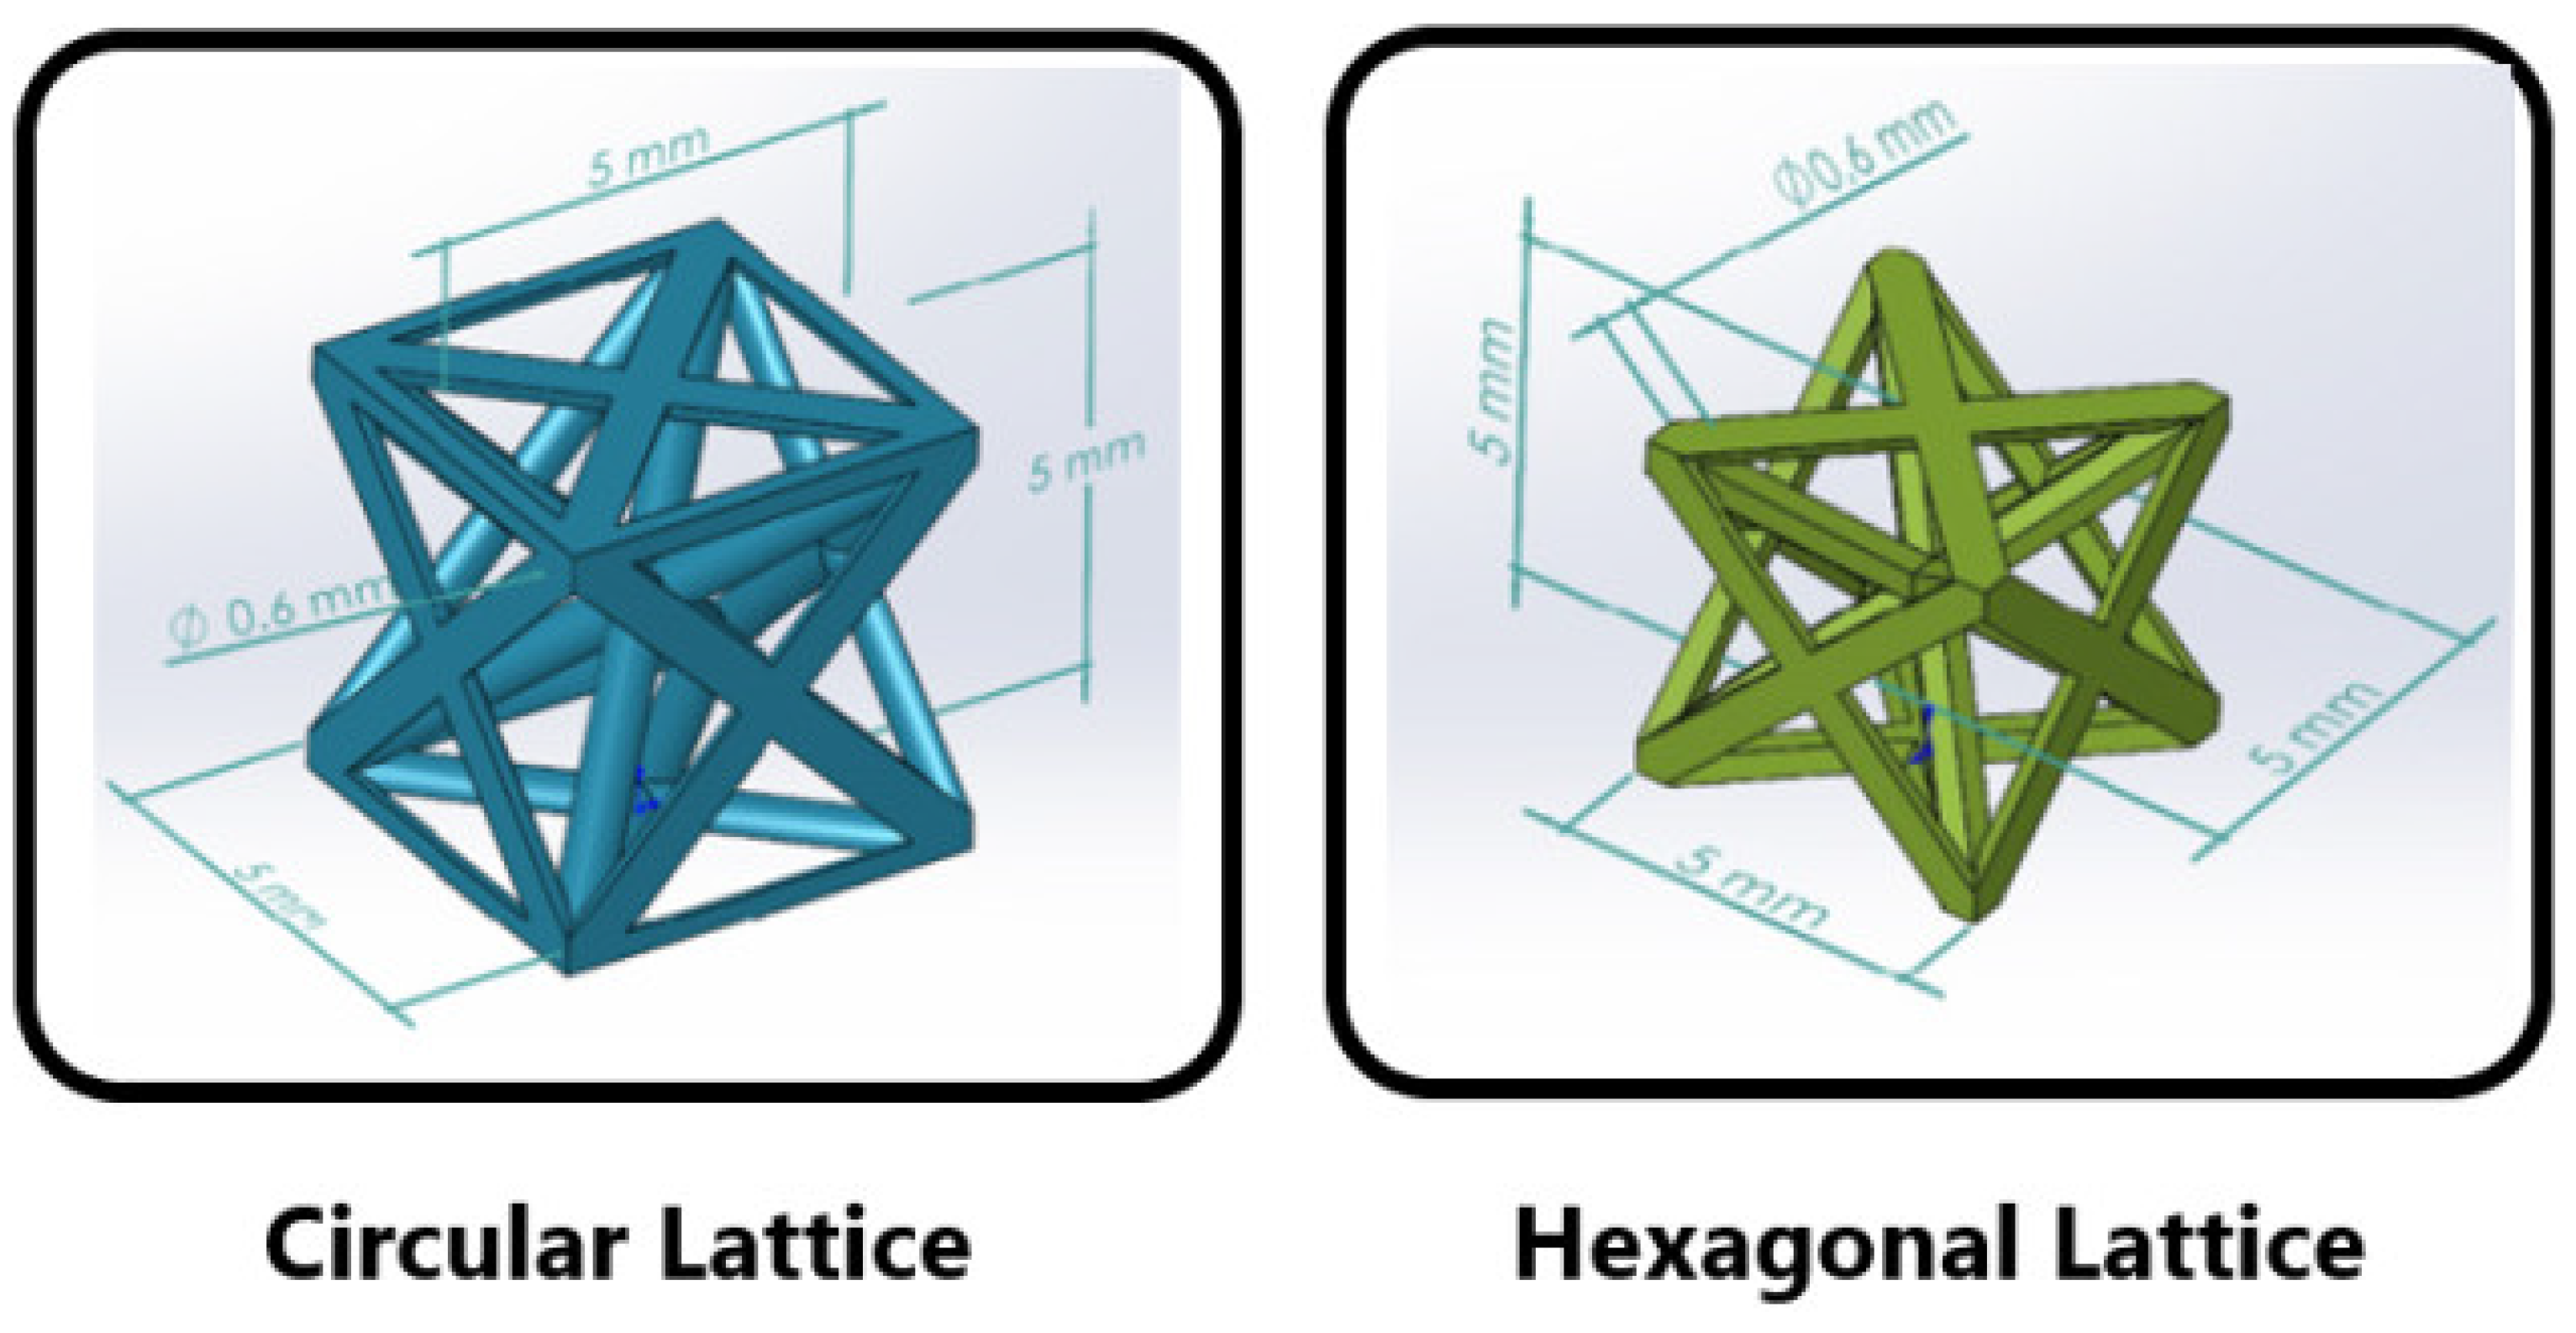
The design parameters for a healthy and correct product that can be produced with the additive manufacturing method were as follows: cell element diameter 0.6 mm and thin wall thickness 0.5 mm. The cellular structure formed by cell elements was designed as a 5 mm cube with 5 mm height and 5 mm × 5 mm width-length dimensions (Figure 3). The cell elements were placed symmetrically and at equal angles. During the design process, the angles and diameters of the element rods were maintained constant while the geometry transitioned from a circular to a hexagon configuration.
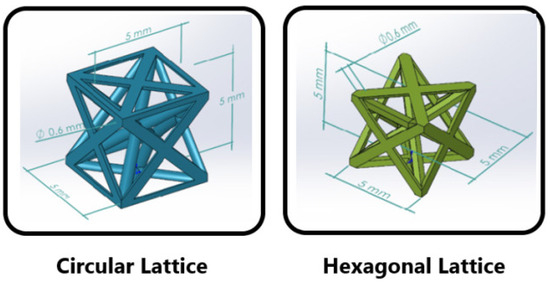
Figure 3.
Lattice structure unit elements.
Gravitational acceleration represents a significant challenge in the context of the SLM method. Given that the manufacturing process entails the sequential addition of material layers, the utilization of support elements becomes imperative to establish the structural connection and ensure the integrity of the component. The removal of these support elements from the part is known to induce complications during the manufacturing process, as evidenced by this study. To address this challenge, the design is executed through the utilization of the pyramid method, which incorporates the support elements within the design itself, thereby eliminating the requirement for external support elements.
Each hybrid structure is composed of ten rows of cellular elements and is transformed into 50 mm-long structures. The wall geometry of the hybrid structures consists of a square structure with a side length of 15 mm and a hexagonal structure with a side length of 10.6 mm. The lattice structures were characterized as homogeneous and symmetrically placed and stacked in the tube to meet loads evenly and gradually.
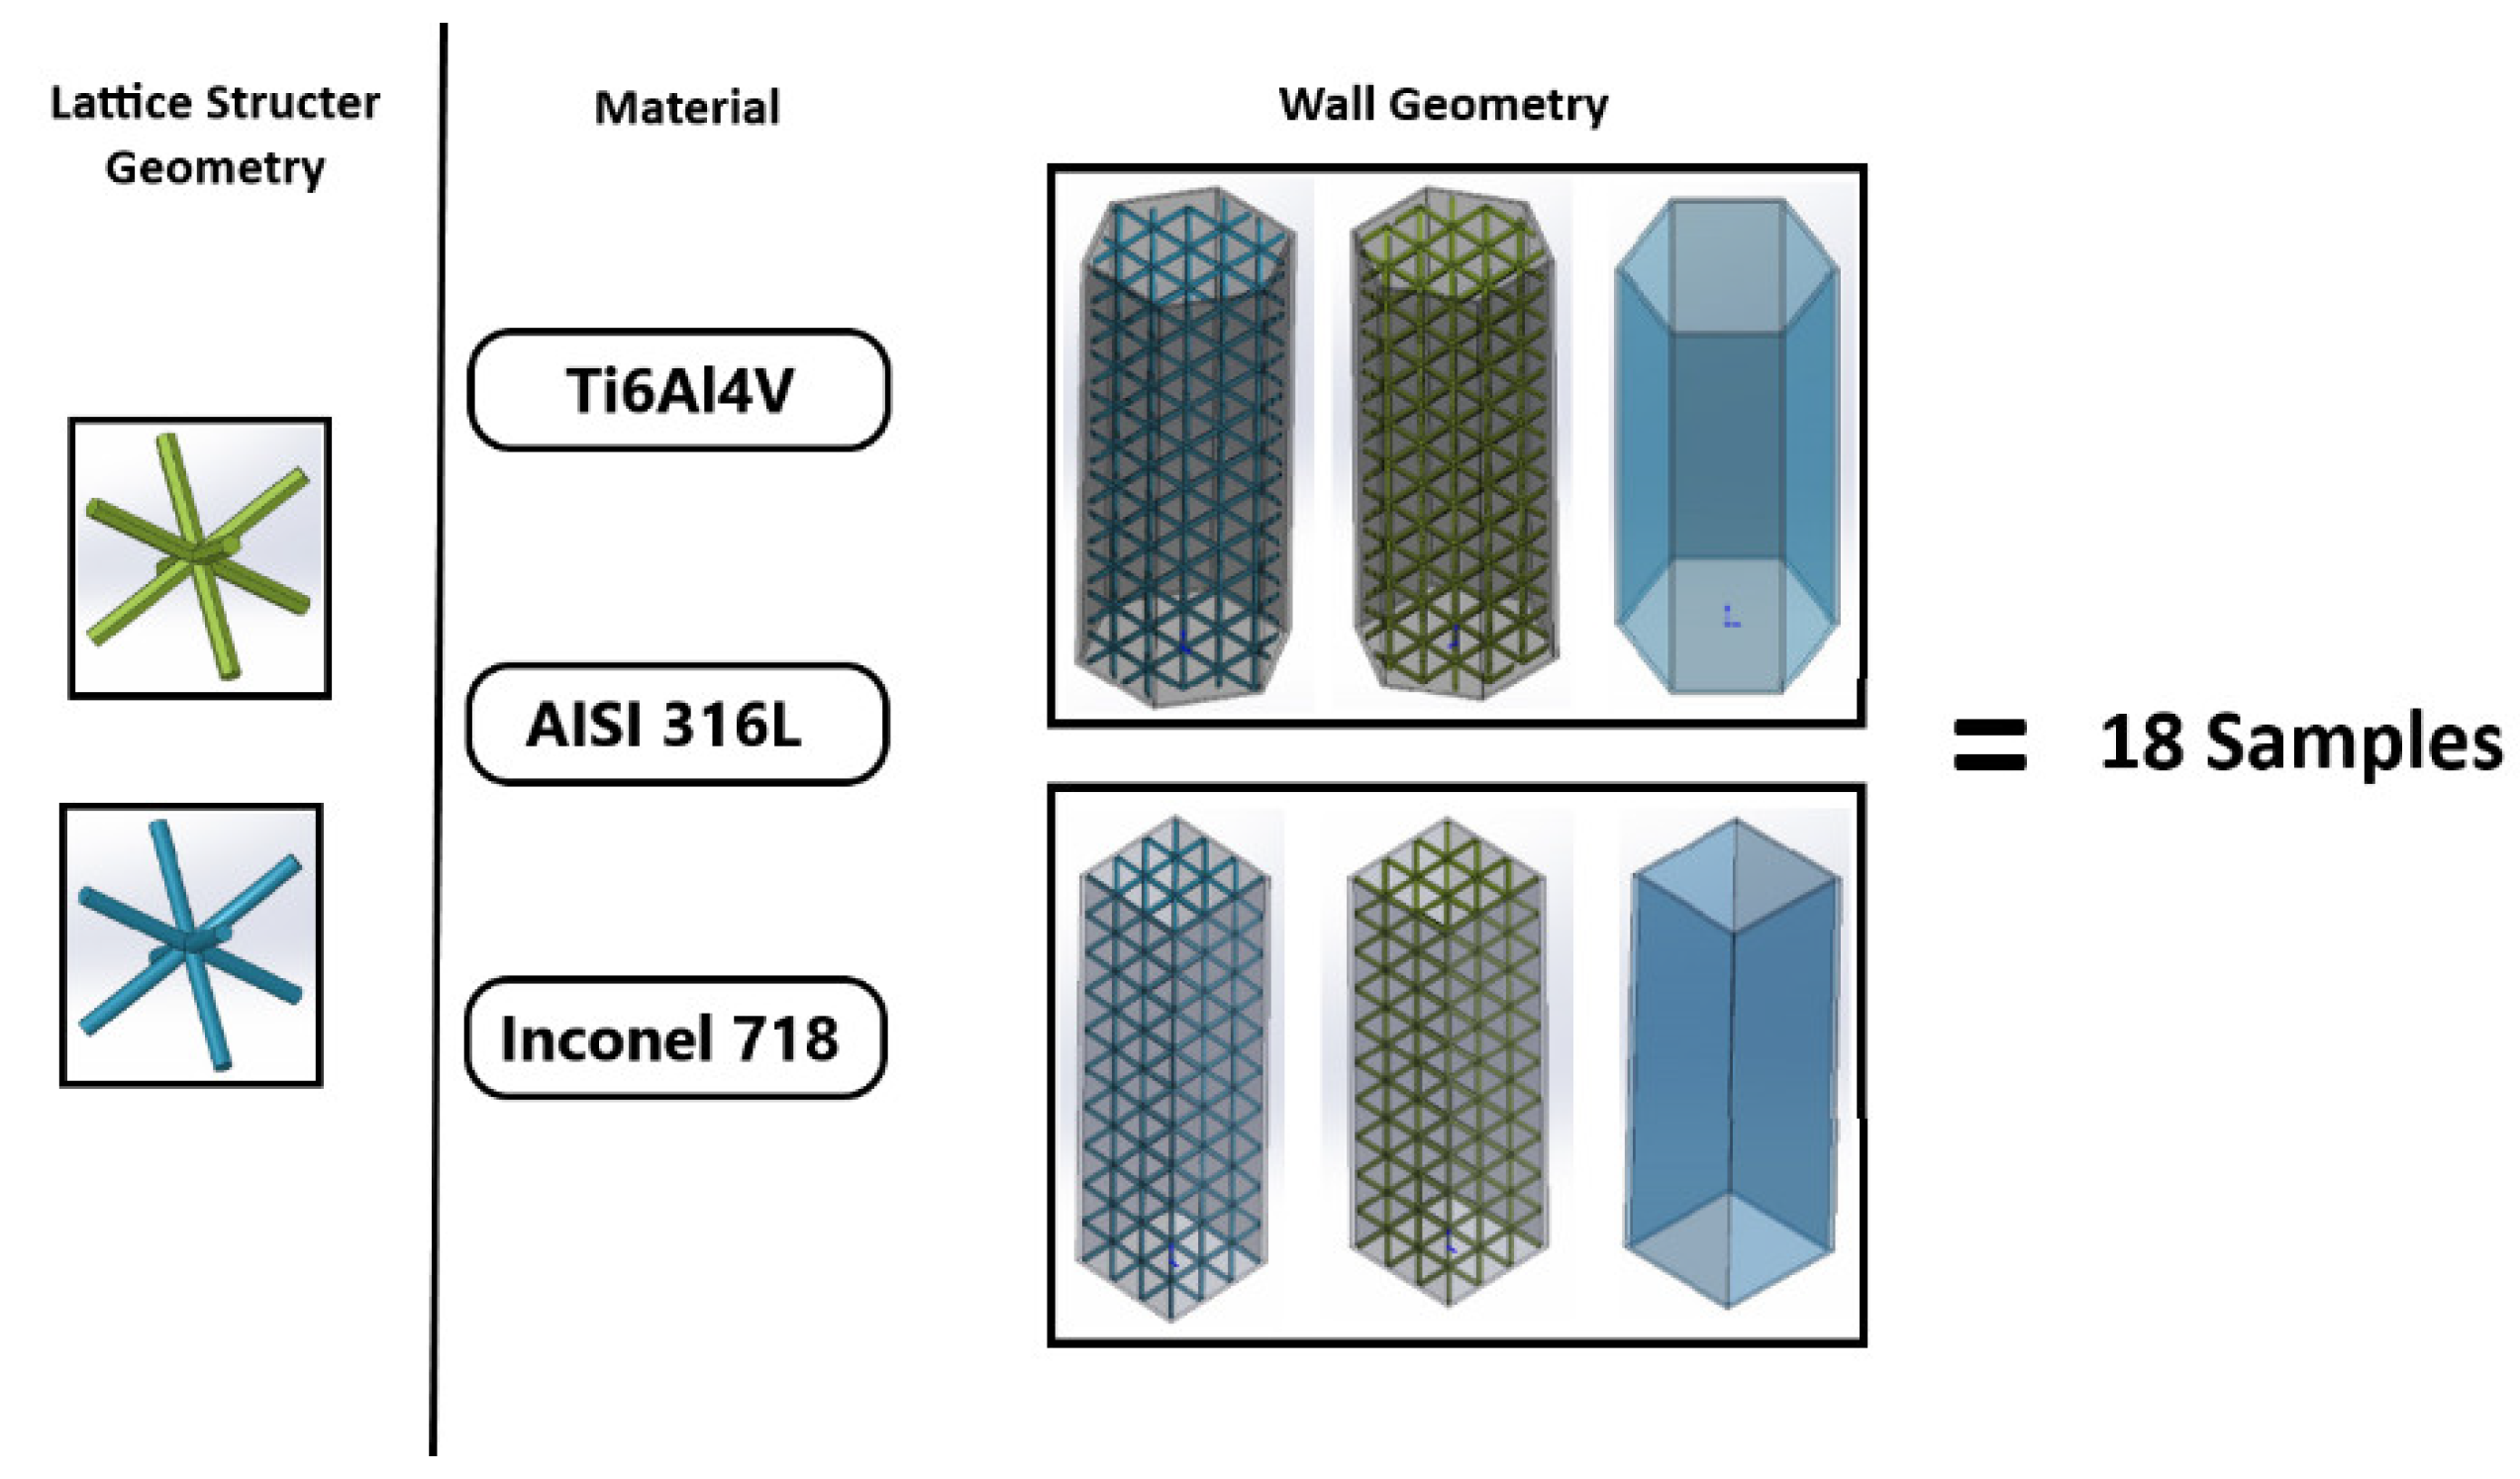
The experimental matrix was designed as 18 pieces from three primary variables: the geometry of the lattice structure, the material used, and the thin wall geometry. Figure 4 presents these three variables, while Table 1 shows the test matrix.
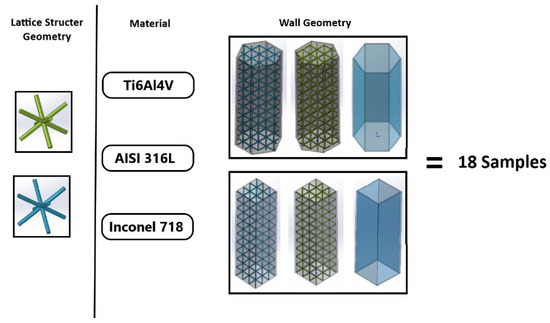
Figure 4.
Creation of test matrix.

Table 1.
Test matrix.
2.2. Material and Manufacturing
In the present study, the fabrication of hybrid structures was conducted through the utilization of Ti6Al4V titanium alloy, AISI 316L stainless steel, and Inconel 718 nickel alloy powder by means of the selective laser melting (SLM) method. These materials, which are extensively employed in the additive manufacturing method, find application in a multitude of industrial domains, including defense, medicine, aerospace, and automotive industries, due to their high mechanical properties.
The additive manufacturing method involves the sequential deposition of layers of material on a manufacturing table, where each layer is melted by the application of a power source. In this study, the selective laser melting method was used, where a laser beam was used as the power source to melt the material. The morphological structure of the powder used in this method is of great importance. The morphological structure of the powder includes parameters such as particle size, powder shape, and surface roughness of the particles. These properties are crucial in achieving minimum layer thickness and targeted density [45]. A powder with an optimum morphology is conducive to high-quality production, improved particle bonding, and a denser structure. This helps minimize dislocations and cracks to meet production requirements. Powder structure can facilitate precise and tolerant manufacturing, which is a design requirement.
A number of analyses were carried out to determine the characteristic properties of the metal powders used in the study. The first of these analyses is a microstructural analysis, which examines the morphological properties of the powder material, such as surface roughness, particle geometry, and particle size. However, although the geometric shapes and sizes of the particles can be analyzed in detail using SEM microstructure analysis, it is very difficult to determine the particle size distribution using this method. The particle size distribution of metal powders is of great importance for quality control and the applicability of the powders. Therefore, two different particle size distribution analyses were carried out in this study.
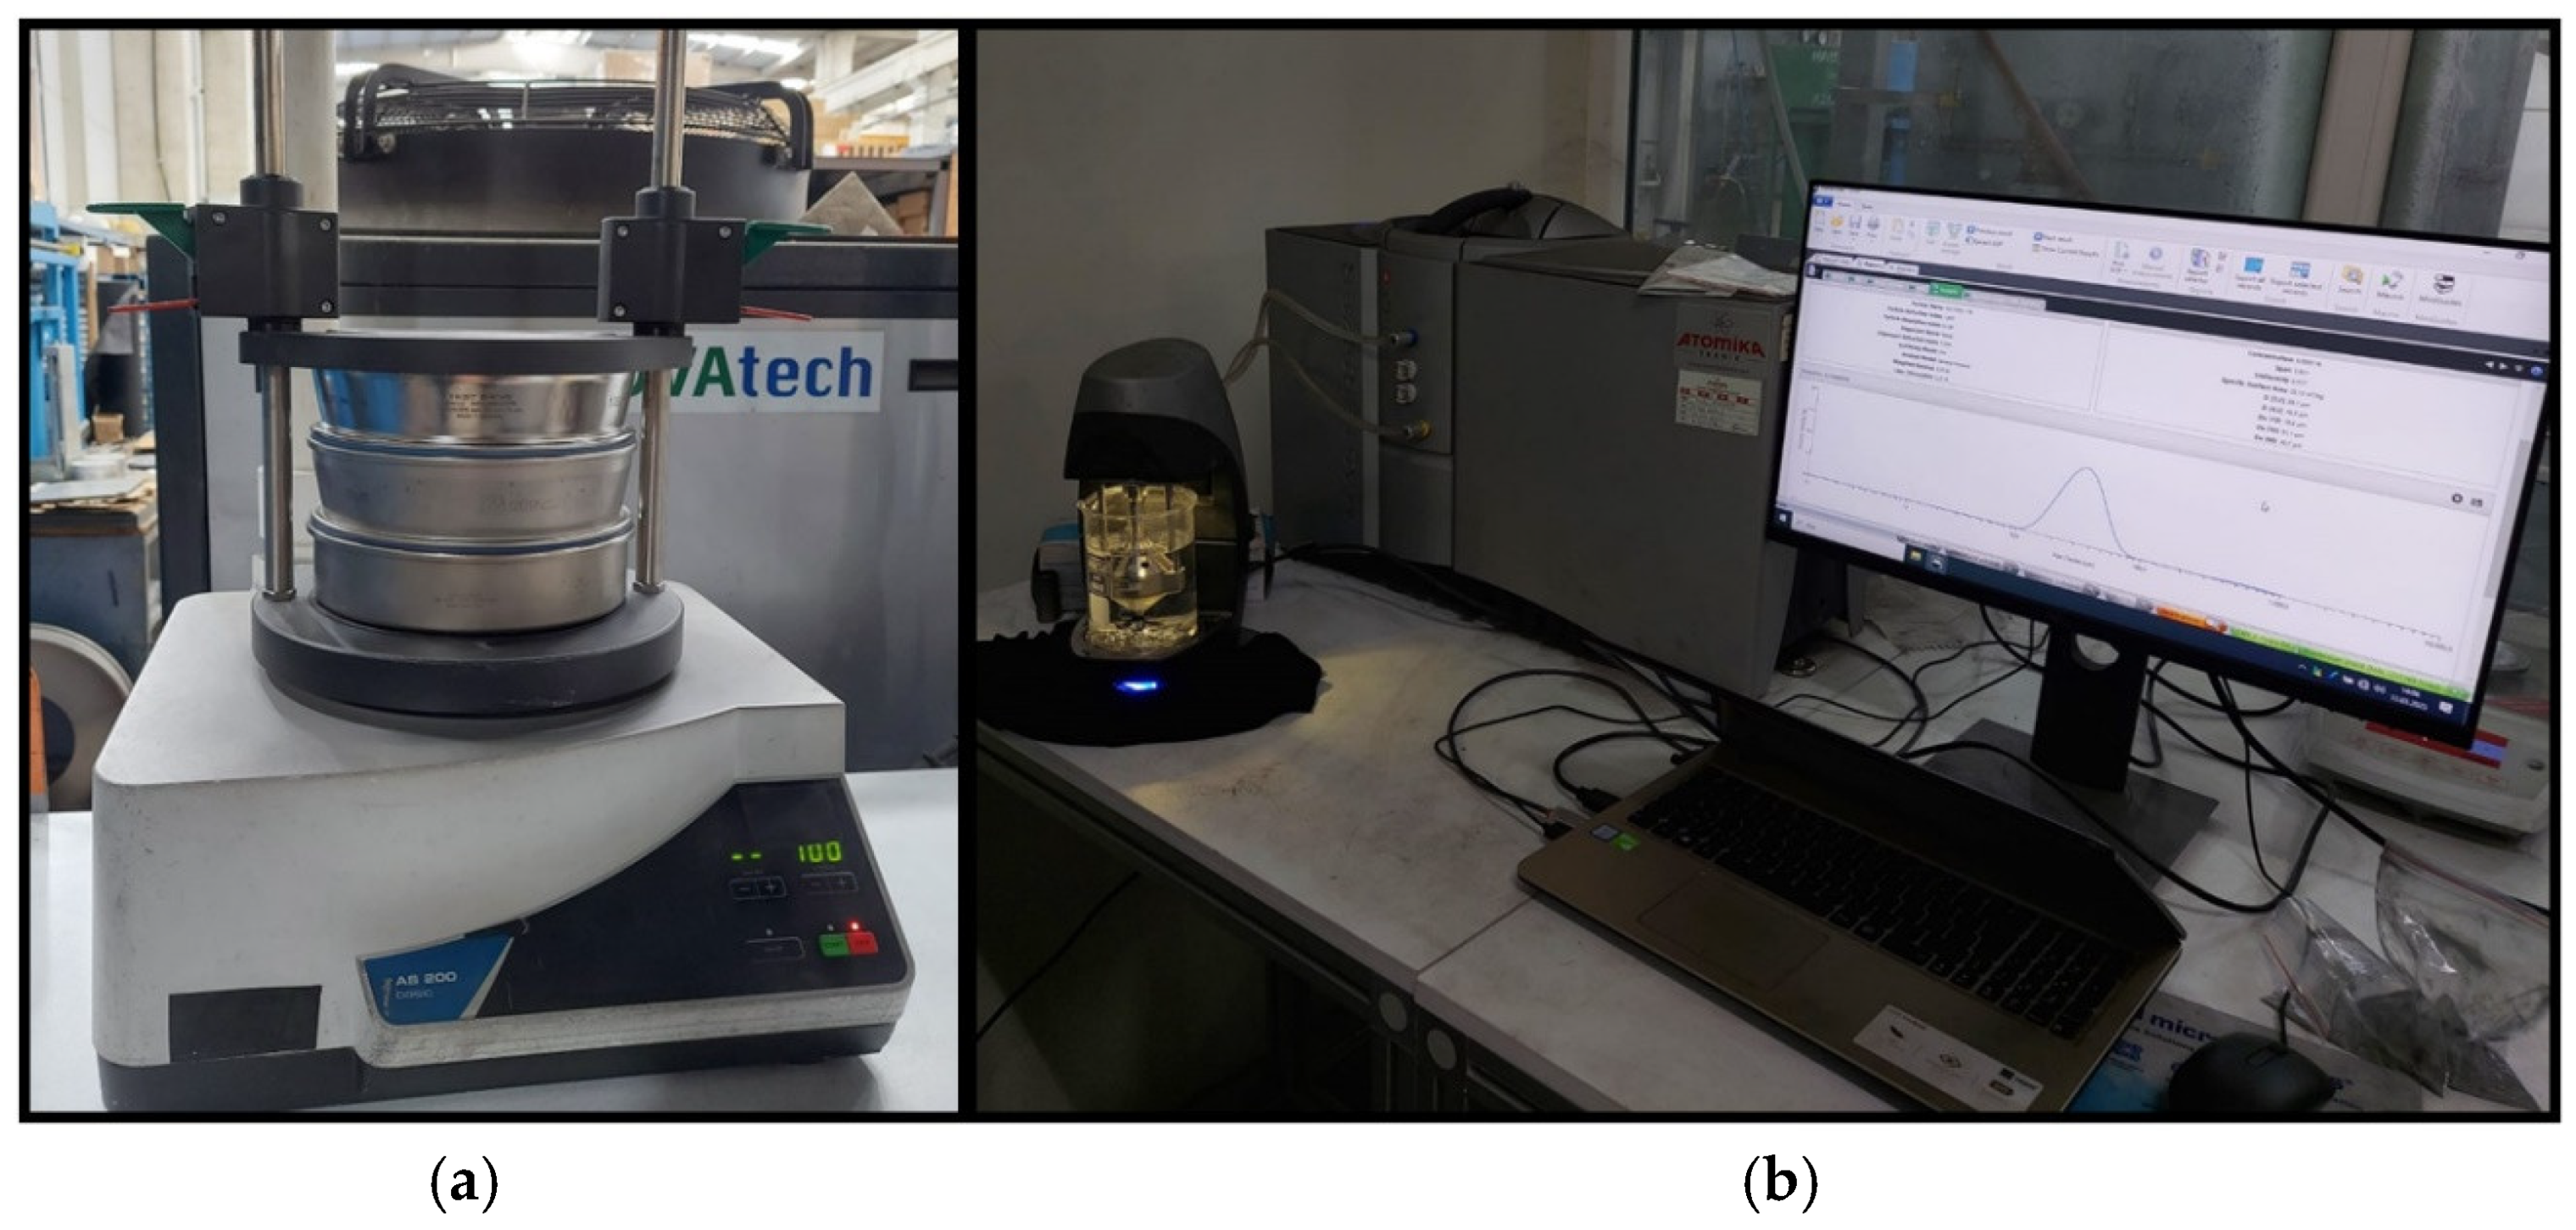
Firstly, according to the ASTM B214 standard [46], the distribution of powders larger and smaller than 45 µm was determined using the AS 200 Basic vibrating sieve machine (Retsch GmbH, Haan, Germany) shown in Figure 5a. In this method, the powder placed in the sieve is sieved by means of vibration and separated by passing through sieves of different sizes. Another method is analysis according to the ASTM B822 standard [47] using the Mastersizer 3000E particle size analyzer (Malvern Panalytical—Malvern, Worcestershire, UK) shown in Figure 5b. The ASTM B822 standard provides accurate measurements in the range of 0.4 to 2000 microns by analyzing the size distribution of metal powders using light scattering.

Figure 5.
(a) Dry sieve device for particle distribution analysis, (b) laser diffraction particle size analyzer.
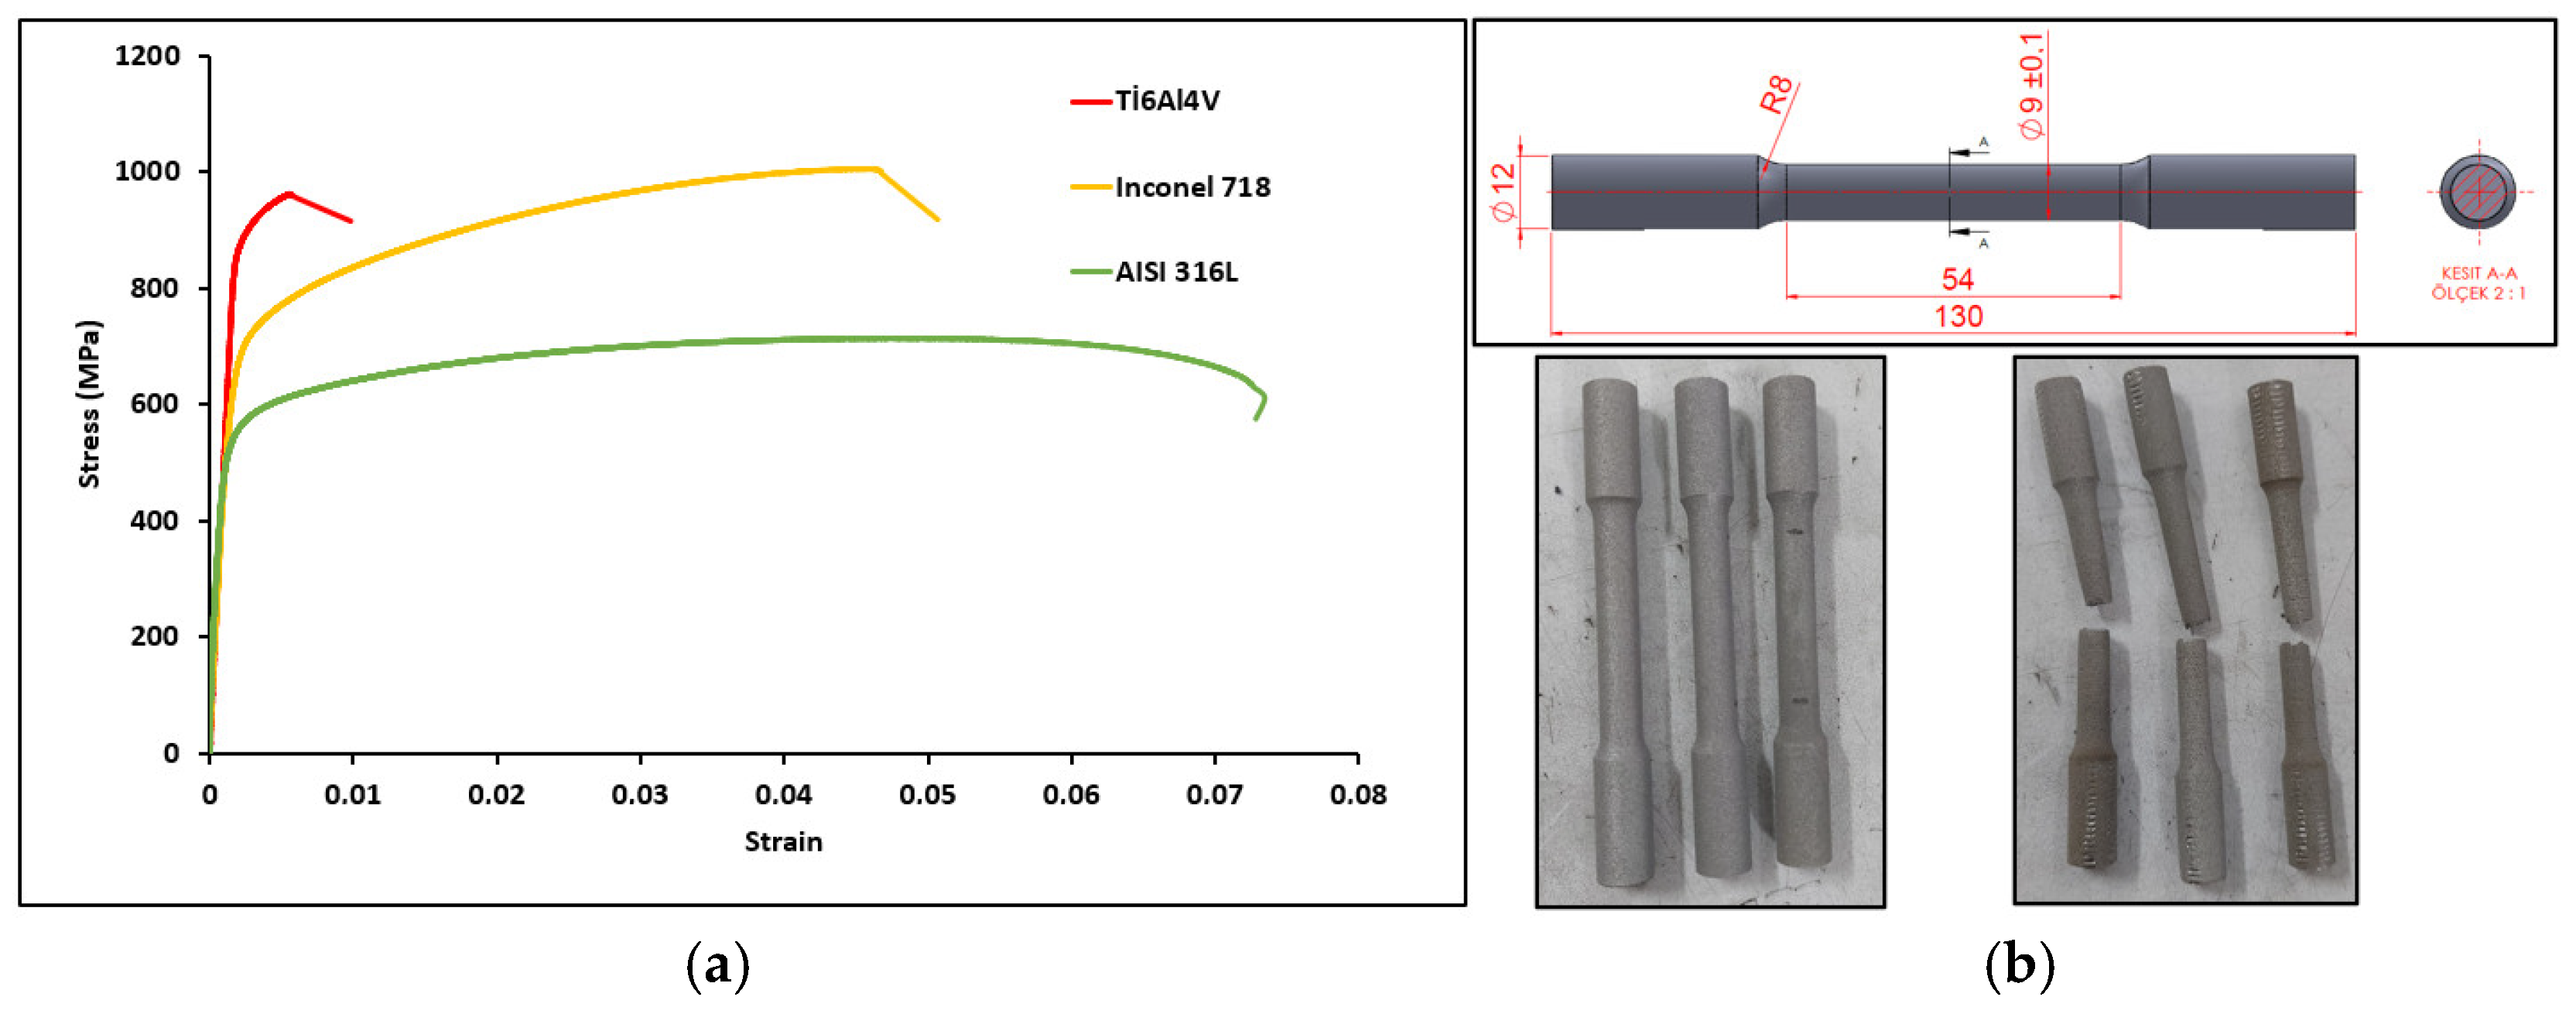
Tensile specimens were prepared in accordance with the ASTM E8/E8M standard [48] to obtain the material mechanical properties of the additive manufactured specimens, and tensile tests were performed at a speed of 3 mm/s using a UVE MRN200 universal testing machine (UVE Measurement Equipment-Nilüfer/Bursa, Türkiye) with 200 kN tensile capacity and 0.001 mm/min test speed. The actual stress-strain and tensile specimens for all three materials and testing equipment are shown in Figure 6.
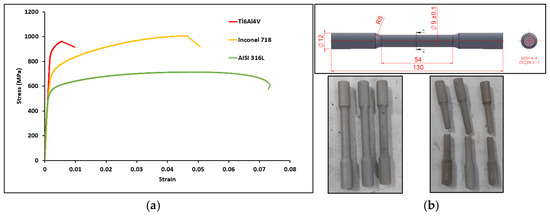
Figure 6.
(a) Tension-stress graphs of materials, (b) tensile test specimens.
2.2.1. Ti6Al4V (Titanium Alloy Grade 5)
Titanium is a material of choice in many industrial fields, especially in the aerospace industry, due to its high strength, good corrosion resistance, low specific gravity, biocompatibility, and biomechanical properties. It is a preferred material in the manufacture of complex turbine and engine parts and in the production of medical implants. Despite the disadvantages of limited availability and higher cost compared to other materials, titanium is often preferred in additive manufacturing due to its high strength values and low material losses. The mechanical properties of Ti6Al4V are shown in Table 2.
Table 2.
Mechanical properties of Ti6Al4V (ASTM E8/E8M).
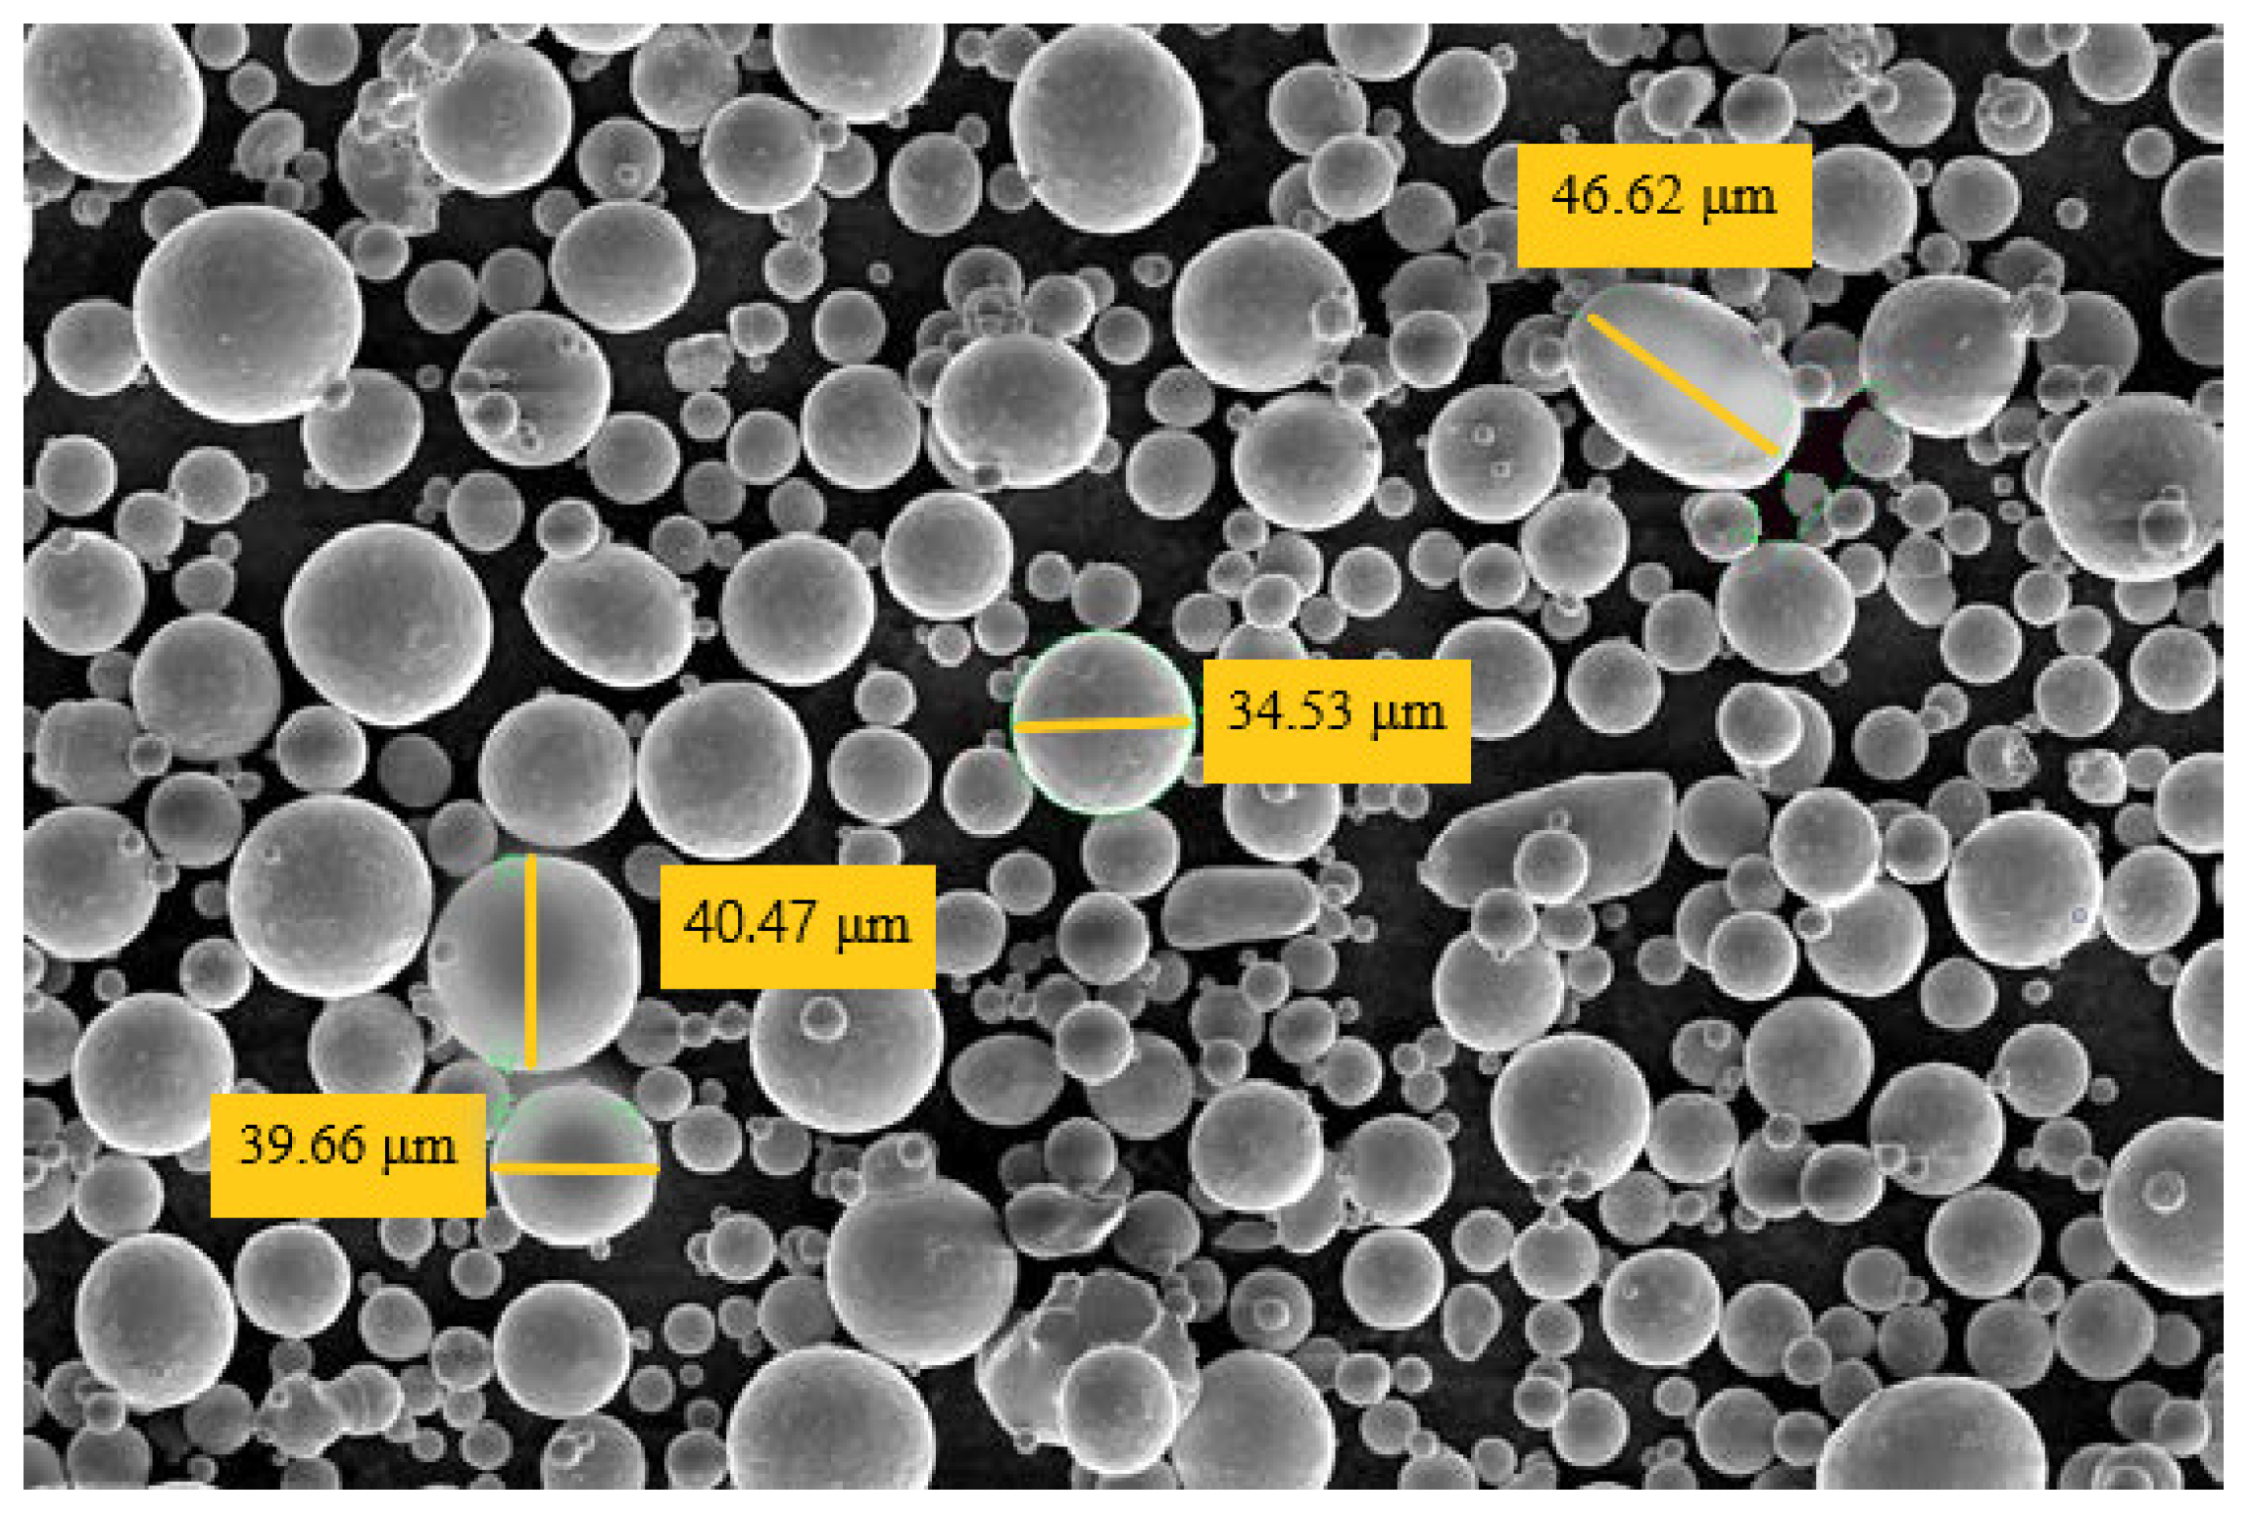
The microstructure analysis images of the Ti6Al4V powder used in the study are presented in Figure 7. The powder particles, which are in good condition in terms of morphological structure, are spherical and have a grain size of 20–45 μm.

Figure 7.
Microstructure (SEM) analysis of Ti6Al4V powder.
As a result of the size distribution analysis of the Ti6Al4V material shown in Table 3, it was determined that 98.4% of the sample taken consisted of metal powder below 45 µm. These values are very important for a homogeneous distribution of the powder on the production table and for quality production.
Table 3.
Ti6Al4V powder characterization (Size per particle ASTM B214).
Table 4 shows the size distribution data for the Ti6Al4V material. The analysis shows that 10% (D10) of the particles in the sample are smaller than 18 µm, 50% (D50) are smaller than 31 µm, and 90% (D90) are smaller than 43 µm. These data show that the powder is suitable for sintering behavior and intended use in the production process. The smaller the powder size, the better the penetration and the quality of production.
Table 4.
Ti6Al4V powder characterization (Size per particle ASTM B822).
2.2.2. AISI 316L (Stainless Steel)
AISI 316L is considered one of the most corrosion-resistant austenitic stainless steel. In addition, AISI 316L is an alloy with high weldability, so it is often preferred, especially in corrosive environments. Studies have shown that the tensile strength of parts produced from full-density AISI 316L stainless steel material with the SLM method is higher than that of AISI 316L parts produced by conventional methods [50]. AISI 316L material, whose mechanical properties are given in Table 5, can maintain good mechanical properties and high strength values at high temperatures. It also has a more ductile structure than the other two materials used in the study.
Table 5.
Mechanical properties of AISI 316L (ASTM E8/E8M).
The microstructure analysis of the AISI 316L powder material utilized in this study is depicted in Figure 8. The AISI 316L metal powder exhibits an optimal morphological structure. The grains manifest a spherical morphology, with grain sizes ranging from 20 to 45 μm. The components with a smooth surface structure facilitate a high-quality production process characterized by these features.
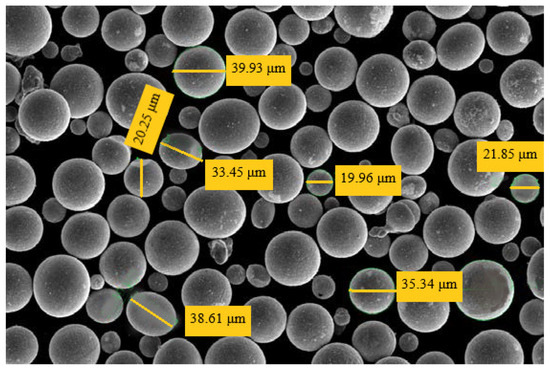
Figure 8.
Microstructure (SEM) analysis of AISI 316L powder.
As a result of the size distribution analysis of the AISI 316L material shown in Table 6, it was determined that 98.7% of the sample taken consisted of metal dust less than 45 µm in size.
Table 6.
AISI 316L Powder Characterization (Size per particle ASTM B214).
Table 7 shows the size distribution data for the AISI 316L material. The analysis shows that 10% (D10) of the particles in the sample are smaller than 18 µm, 50% (D50) are smaller than 31 µm, and 90% (D90) are smaller than 42 µm.
Table 7.
AISI 316L powder characterization (Size per particle ASTM B822).
2.2.3. Inconel 718 (Nickel Alloy)
Inconel 718 is a nickel alloy that exhibits excellent resistance to high temperatures and corrosion at these temperatures. It is particularly favored in numerous industrial applications, including gas turbines, shafts, and blades. The mechanical properties of Inconel 718 components manufactured using the additive manufacturing method are comparable to those produced by cast-forging methods, and these high strength values enable precise production. The following Table 8 provides a summary of the mechanical properties of Inconel 718.
Table 8.
Mechanical properties of Inconel 718 (ASTM E8/E8M).
The microstructure of the Inconel 718 powder used in this study was analyzed by electron microscopy, shown in Figure 9. The powder exhibited a grain size ranging from 15 to 45 µm, a spherical grain geometry, and sufficient surface roughness. The ability of the material to maintain a homogeneous structure is attributed to the spherical grain geometry.
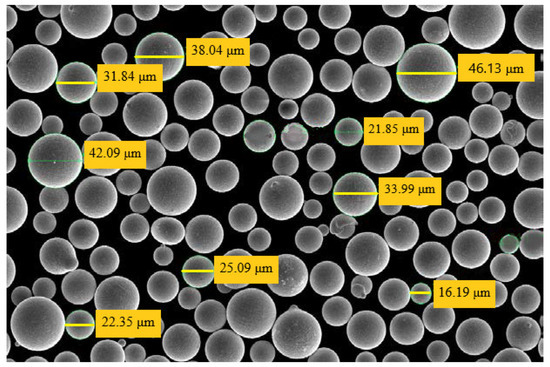
Figure 9.
Microstructure (SEM) analysis of Inconel 718 powder.
As a result of the size distribution analysis of the Inconel 718 material shown in Table 9, it was found that 97.9% of the sample taken consisted of metal dust below 45 µm. These values are also very important for quality production.
Table 9.
Inconel 718 powder characterization (Size per particle ASTM B214).
Table 10 shows the size distribution data for Inconel 718 material. As a result of the analysis, 10% (D10) of the particles in the sample are smaller than 22 µm, 50% (D50) are smaller than 33 µm, and 90% (D90) are smaller than 44 µm.
Table 10.
Inconel 718 powder characterization (Size per particle ASTM B822).
2.3. Manufacturing Process of Samples
The specimens were designed using Computer-Aided Design (CAD) software according to the test matrix and were then 3D printed using the selective laser melting (SLM) method as a whole on an additive manufacturing machine. Powder materials of Ti6Al4V, AISI 316L, and Inconel 718 were selected for the fabrication of the specimens. The SLM process was carried out with an Enavision 165 additive manufacturing machine (Ermaksan Makina Sanayi ve Ticaret A.Ş.—Nilüfer/Bursa, Türkiye, https://www.ermaksanadditive.com/tr-TR/3d-yazicilar/enavision-165, accessed on 10 March 2025) with a 300 W fiber laser and a laser beam diameter of 85 μm. The optimum data determined by the manufacturer and vary according to the properties of the material are listed in Table 11. The production parameters of 2100 layers, 30 μm layer thickness, and 100 μm scanning interval are the same for all materials.
Table 11.
Production parameters.
The oxidation of gases produced during the melting process of the material is of particular significance. The utilization of gases such as Argon and Nitrogen in the production cabin is dictated by the type of material, with the objective of ensuring the integrity of the production quality. Argon gas is utilized in Ti6Al4V and Inconel 718 to prevent oxidation during production and to enhance purity quality, while Nitrogen gas is employed in AISI 316L to augment the homogeneous structure and surface strength of the steel. Given the reduced specific gravity of Ti6Al4V, the flow rate of this gas mixture is distinct.
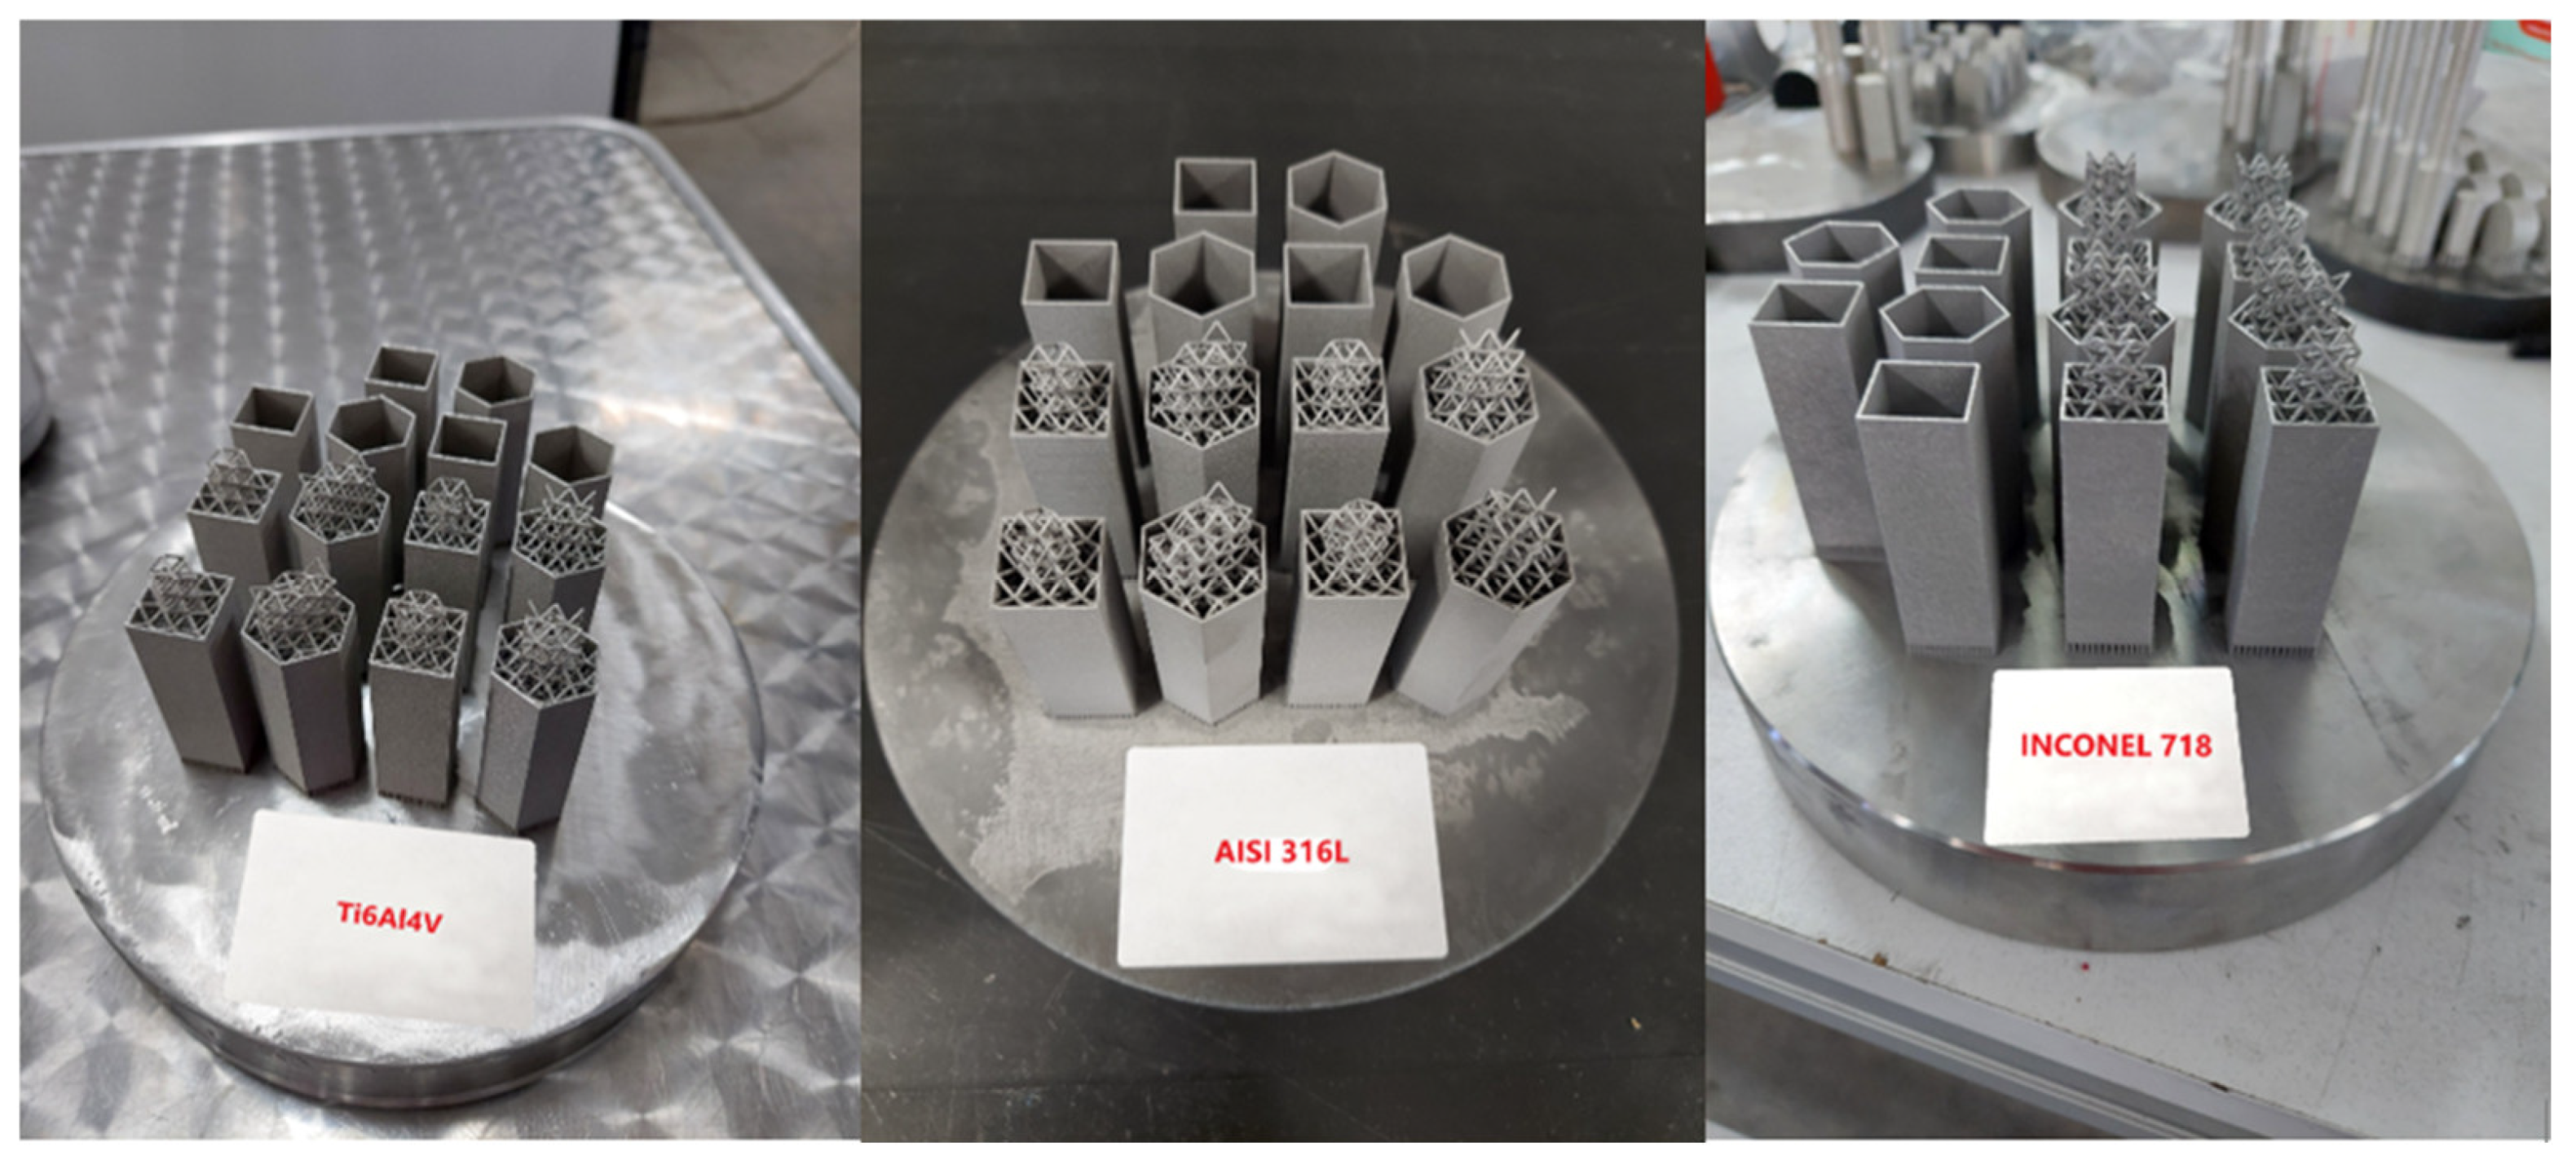
As illustrated in Figure 10, the images depict the fabricated hybrid structures. The specimens were fabricated to a high standard and were found to be free of defects, such as cracks and curvature. It was determined that the SLM method is a suitable technique for the fabrication of BCC lattice structures.
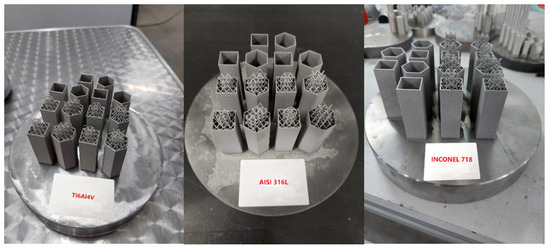
Figure 10.
Sample views after fabrication.
As is the case with a considerable number of manufacturing processes, the implementation of additive manufacturing necessitates a number of secondary processes. These include the application of heat treatment, the purpose of which is to remove internal stresses that occur during the production process. In addition, sandblasting is employed to remove surface defects that occur after the production process has been completed. Furthermore, support parts are cut away in order to remove the parts from the production table.
In the context of this project, three distinct heat treatment methodologies were employed for components characterized by varying properties fabricated from three distinct metal powders. These methodologies are as follows:
The Inconel718 material was subjected to a two-stage heat treatment in accordance with the Aerospace Material Specification (AMS) 5662. For each thickness of 25 mm, the material underwent solution annealing at 980 °C for 1 h, followed by air/argon cooling. In the second stage, following an eight-hour soak at 718 °C, the furnace temperature was reduced to 621 °C, where it was maintained for a duration of 18 h, followed by cooling in an air/argon environment.
For Ti6Al4V material, the process was carried out in a vacuum (1.3 × 10⁻³–1.3 × 10⁻⁵ mbar) at a temperature of 800 °C (±10 °C) for a period of 120 day-cycles (±30 min). The material was then cooled under argon. It was observed that the mechanical properties of the material showed minimal sensitivity to changes in heating and cooling rates. However, it was noted that extended process sequences can cause a decrease in strength and an increase in elongation.
For AISI 316L, the furnace of the samples was heated to 900 °C and maintained at this temperature for a period of four hours. The samples were then rapidly cooled by immersion in water.
Another secondary process after heat treatment was sandblasting. The shot blasting process allows the surfaces to be cleaned from defects such as slag, burrs, and residual dust by spraying small metal balls onto the part with pressure. In this study, shot blasting was performed at a pressure of 6 bar and a flow rate of 3 m3/h.
After shot blasting, the fabrication supports of the shot blasted specimens shown in Figure 11 and the lattice structure prepared for microstructure analysis were separated from the fabrication table using a wire erosion machine. These components were then separated from the samples. Thus, the manufacturing process of the part was completed.

Figure 11.
Sample creation scheme according to tests.
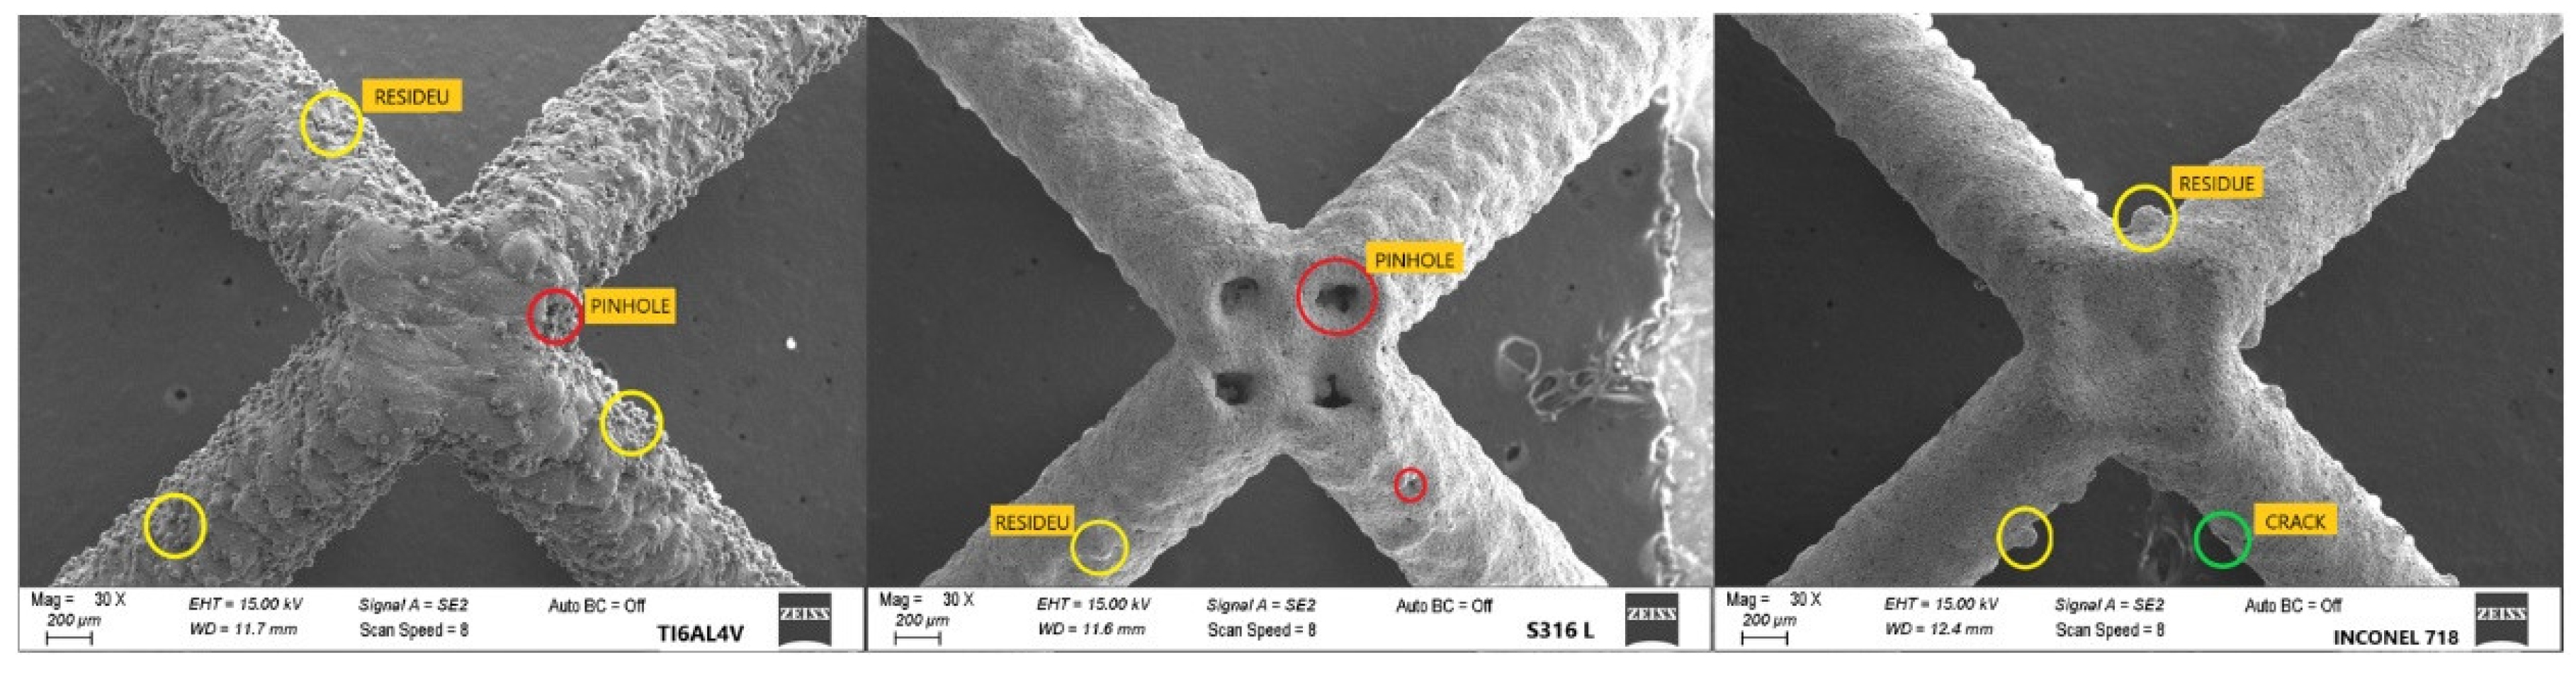
The microstructural analysis of the lattice structures is presented in Figure 12 for Ti6Al4V, AISI 316L, and Inconel 718 materials, respectively. The SEM images illustrate unmelted powders and rough structures adhering to the sample. This is attributable to insufficient laser energy and rapid cooling, which prevents the dust particles from melting sufficiently. The presence of small pores in the sample is attributed to the residual gases produced during the manufacturing process, with insufficient melting leading to the generation of dust, which in turn can compromise the dimensional accuracy of the structure. Additionally, the presence of voids, resulting from pore formation and non-penetration, can adversely impact the part’s strength and potentially lead to larger cracks under load.
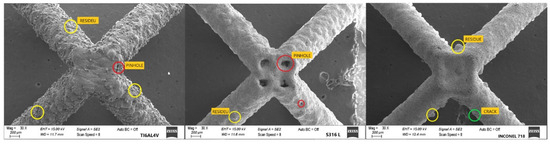
Figure 12.
SEM image of Ti6Al4V-AISI 316L-Inconel 718 Powders-200 µm-30×.
Samples of all three materials were scanned using a FaroArm (Faro Technologies—Lake Mary, FL, USA, https://www.faro.com/en/Products/Hardware/Quantum-FaroArms accessed on 10 March 2025) Quantum M ScanArm 3D laser scanner with a scan deviation of 0.046 mm. The scanned data were processed using ControlX software (https://oqton.com/geomagic-controlx/ accessed on 10 March 2025), and dimensional checks were performed. Figure 13 shows examples of dimensional checks; according to the color map generated with a tolerance of ±0.1 mm, the regions shown in green are within the tolerance range of ±0.1 mm. Deviations in the wall structure were generally in the range of ±0.07–0.004, while deviations in the cell element were found in the range of ±0.05–0.01. As a result, it was determined that the manufacturing process was successful, and the dimensions were within tolerance.
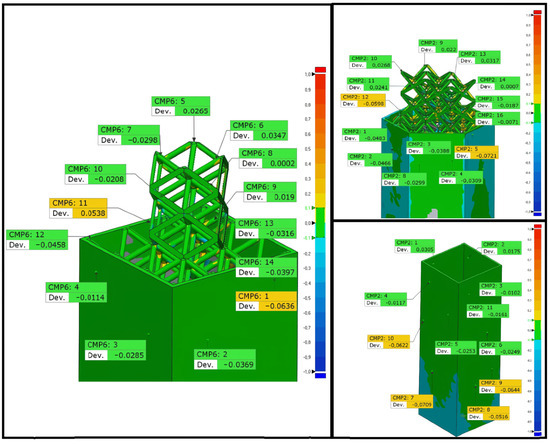
Figure 13.
Dimensional control is realized with a 3D laser scanner.
3. Experimental Setup
In this chapter, quasi-static axial loading tests are conducted to investigate the mechanical behavior and energy dissipation performance of the hybrid structure under axial loading conditions. Furthermore, mathematical equations are defined for the analysis and evaluation of the test data.
3.1. Static Compression Tests
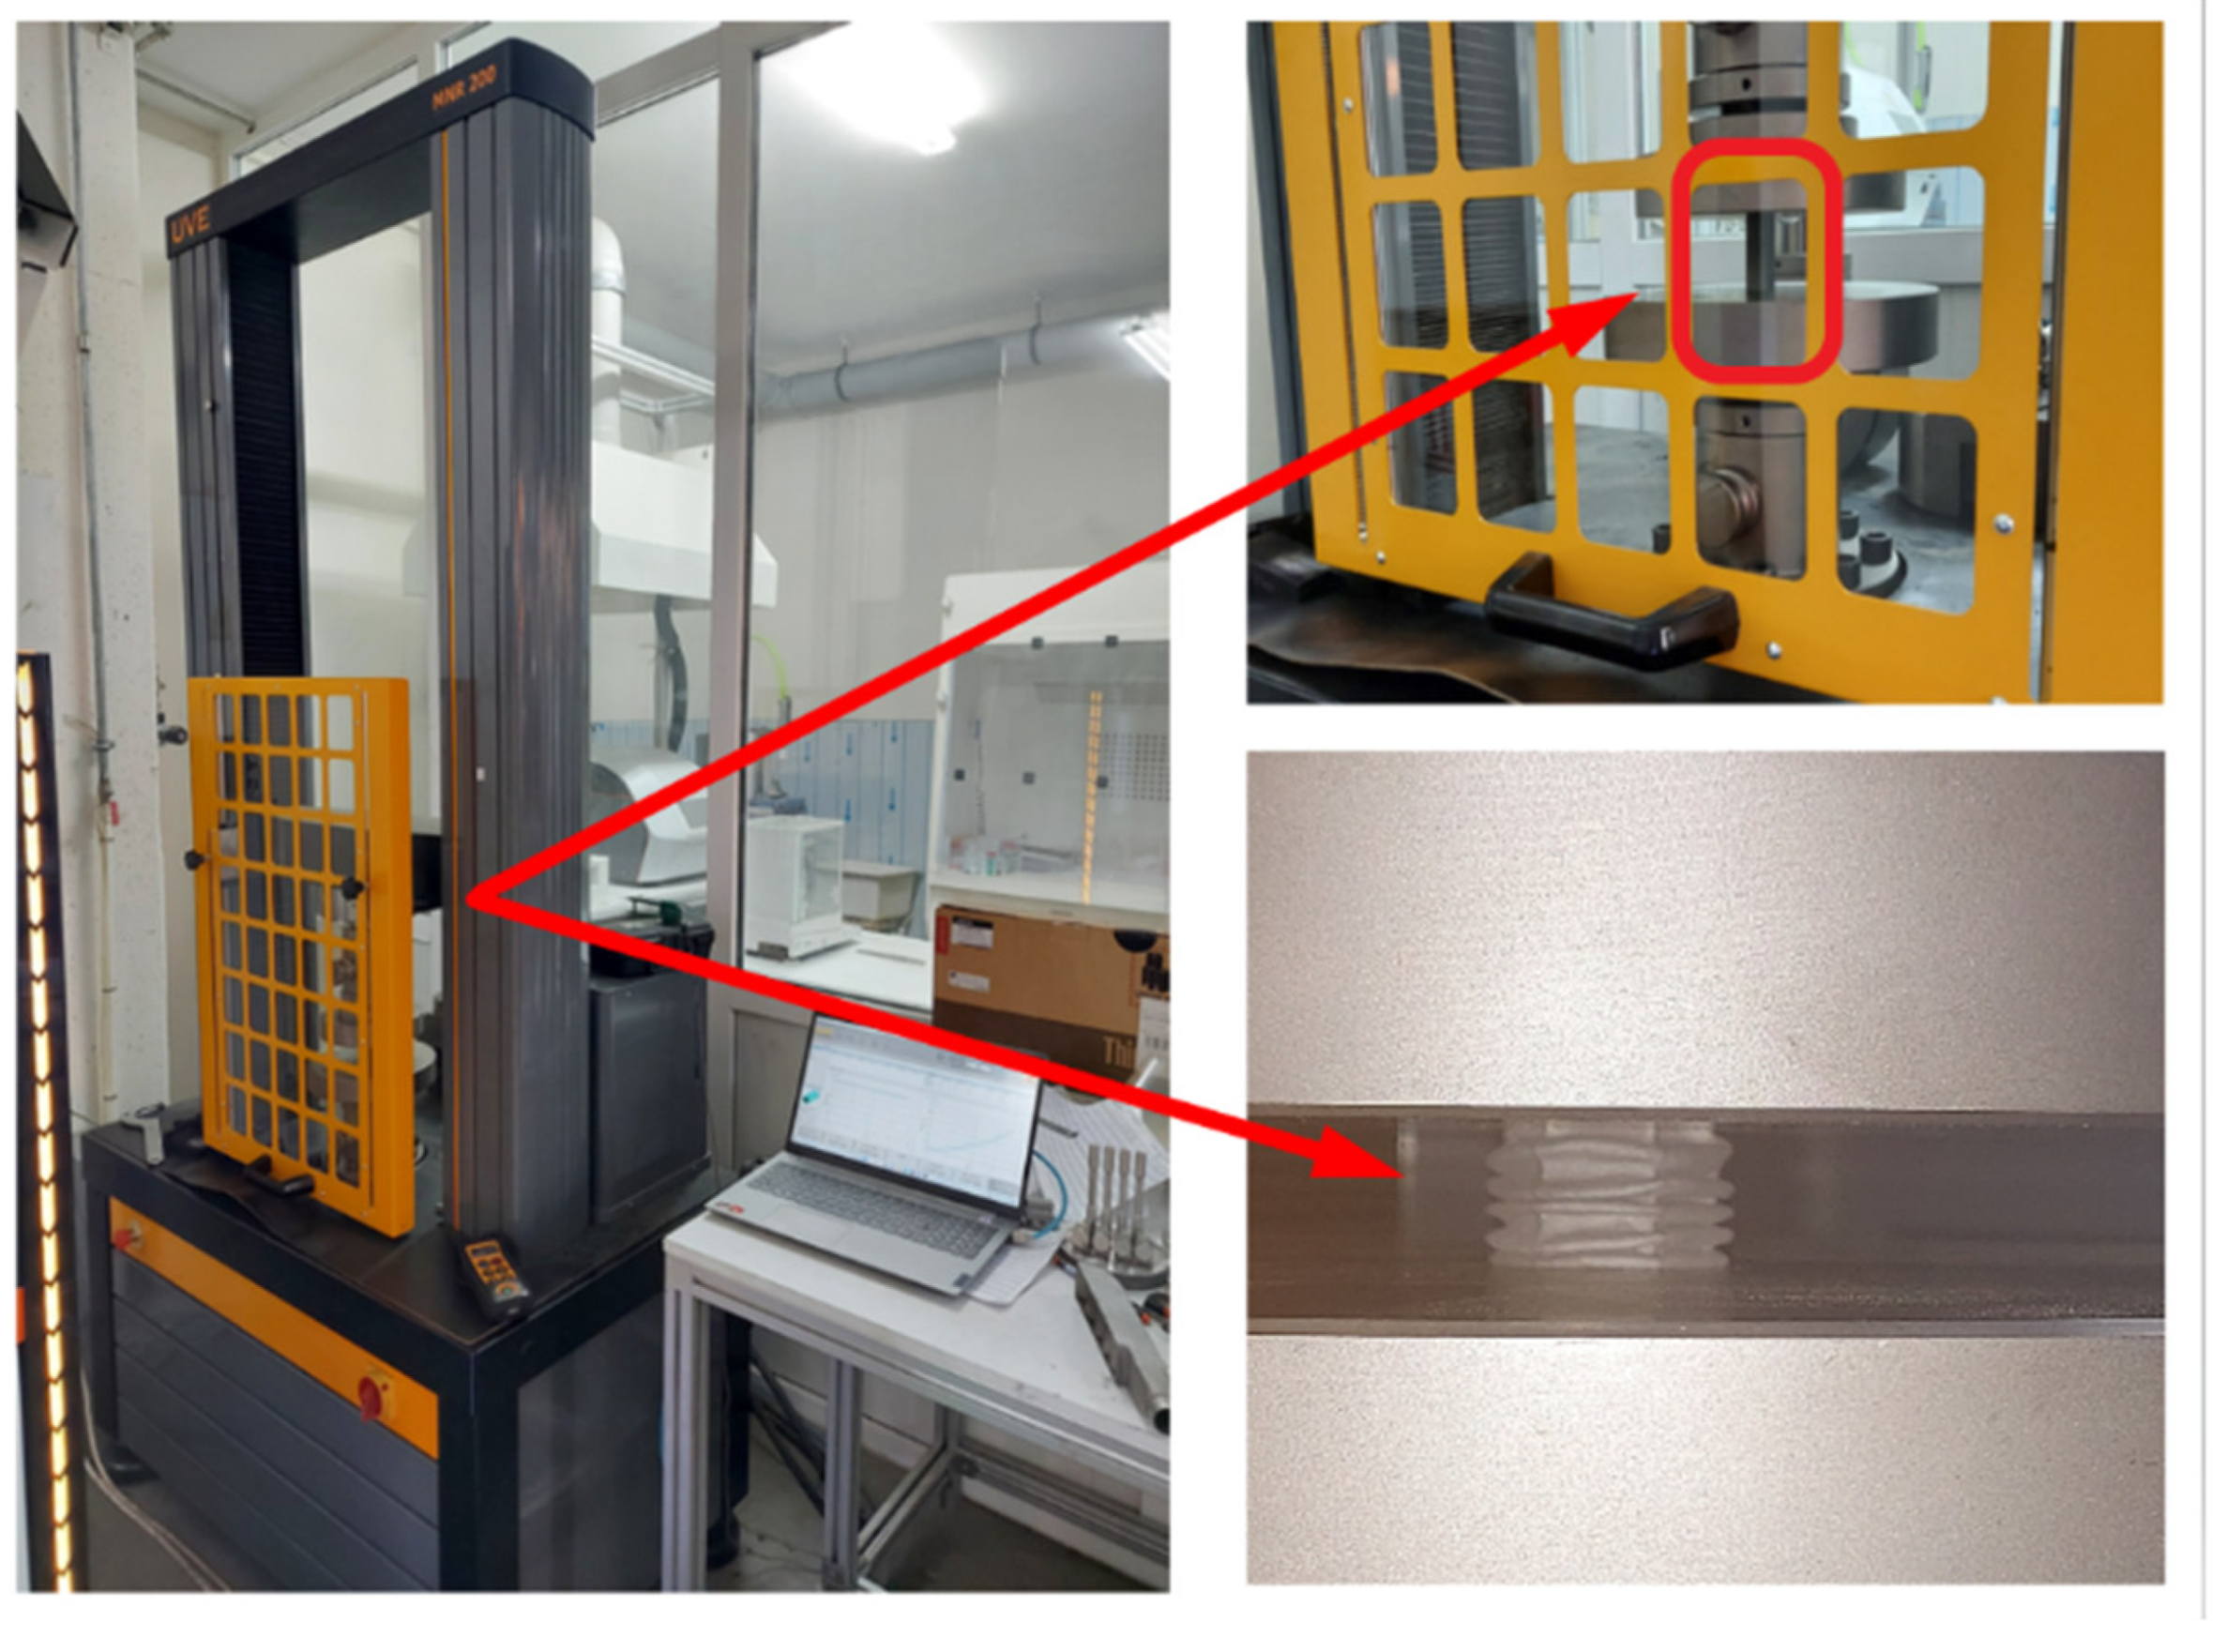
In order to examine the mechanical behavior and deformation performance of all hybrid structures designed and manufactured in this study, quasi-static axial loading was performed with the universal compression testing machine, which has a loading capacity of 200 kN and a test speed of 0.001 mm/min (Figure 14). The specimens were positioned between two rigid plates, one fixed and one movable, and compression tests were conducted with a compression speed of 2 mm/min at a displacement limit of 35 mm.
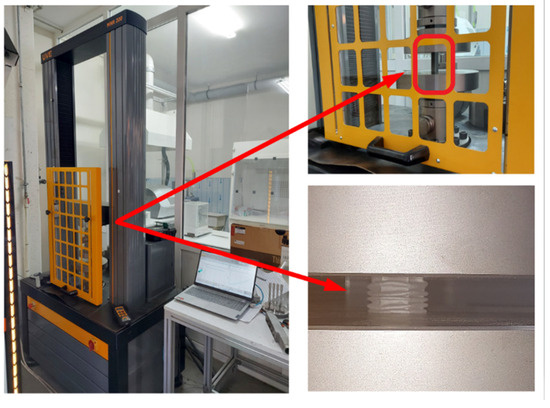
Figure 14.
Quasi-Static compression experimental system.
The data obtained during the experimental trials were processed by the designated apparatus, thus yielding force–time and displacement–time graphs. The force–displacement curve was then derived from these two diagrams with a view to acquiring energy absorption data. Subsequent to this, an evaluation of the performance of the hybrid structure under axial load was conducted on the basis of the aforementioned curves.
3.2. Impact Resistance Index
In order to ascertain the performance of the hybrid structures under investigation, the load, time-dependent force, and displacement graphs were constructed. The generation of these graphs necessitated the use of a number of mathematical equations, the purpose of which was to obtain the aforementioned graphs and utilize the results. The following equations facilitate the calculation of structural parameters such as energy absorption amount, energy absorption efficiency, initial peak force, average compressive force, and crushing performance.
The effectiveness of energy damping is contingent on parameters such as mass and strength. However, this does not provide a comprehensive assessment of the structure’s energy-damping performance. In such instances, a more rigorous evaluation of energy-damping efficiency is necessary to ensure a comprehensive understanding of the system’s capabilities.
Another parameter, the initial peak force value, is defined as the peak force in the early compression phase of the force–displacement curve. For energy absorbers, it is imperative that this value is minimized in order to achieve effective protection and improve performance.
The total energy absorbed by a shock absorber at the moment of impact is defined as the work performed by the crushing force. This energy can be calculated by Equation (1) [32].
where, TEA is the total energy absorbed, F is the compression force in the impact direction, and d is the compression distance.
The mean compression force is the average compression force over the compression distance and is calculated as follows:
where MCF is the mean compression force.
To evaluate the loading efficiency and carrying capacity, the Compression Force Efficiency (CFE) obtained from the ratio of the average compression load MCF to the Peak Compression Force (PCF) was considered as in Equation (3). The closer the CFE is to 1, the more efficient the energy absorption and structural protection are.
Specific Energy Absorption: By dividing the energy absorbed by a shock absorber by the mass of the shock absorber in its undeformed state, the energy absorbed per unit mass, i.e., the specific energy absorption, is calculated as in Equation (4).
For energy absorbers, the higher the SEA value, the better the damping performance. Reducing masses in designs increases energy efficiency and design requirements can be met with improvements in this direction.
4. Results and Discussion
In this study, the energy absorption performance of 18 energy absorber specimens with different design geometries and materials was experimentally investigated by compression testing. Crush efficiency, initial peak force, energy dissipation efficiency, and total damping values were determined for each specimen as a result of the compression tests. Material groups and similar structural geometries were analyzed together to facilitate the comparison of results.
4.1. Experiments on Ti6Al4V Powder
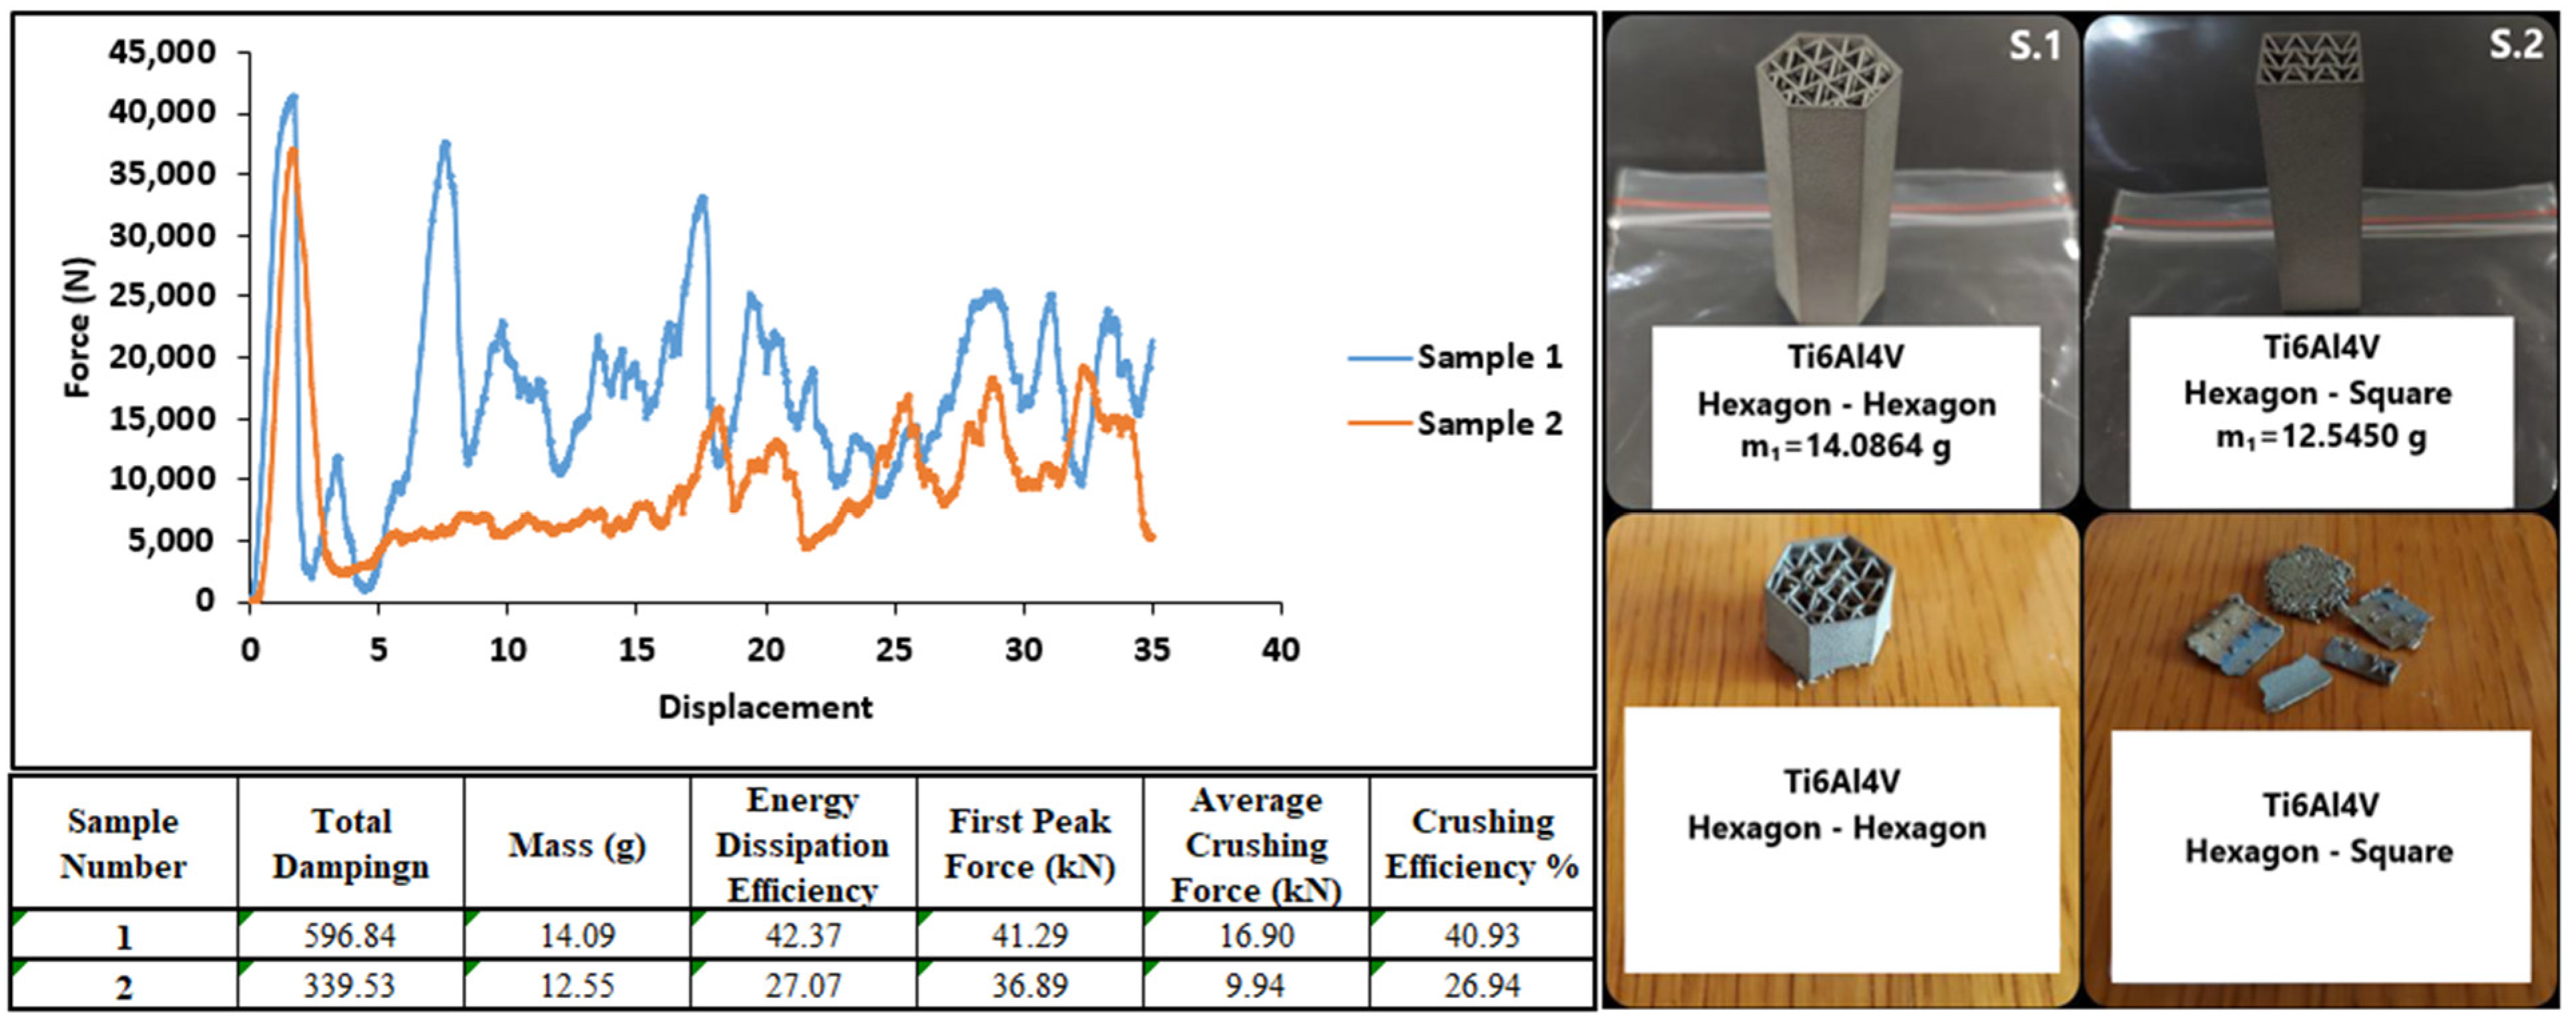
In the static axial compression tests performed at a speed of 2 mm/min, Ti6Al4V specimens generally have a brittle structure, resisted displacement, and fractured. Fragmentation generally occurred in the outer shell, and the lattice structure was compressed in the axial direction.
Figure 15 shows the images of specimens one and two before and after the test. Although there are fractures in the shell structure of both specimens due to the brittle material structure, the amount of energy absorbed increased by compressing the lattice structures.
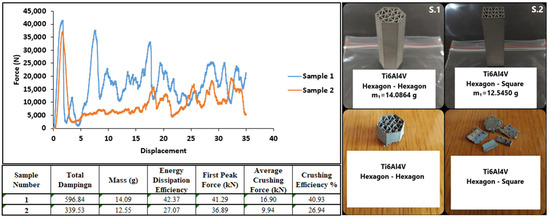
Figure 15.
Result graphs and before and after images of samples 1–2.
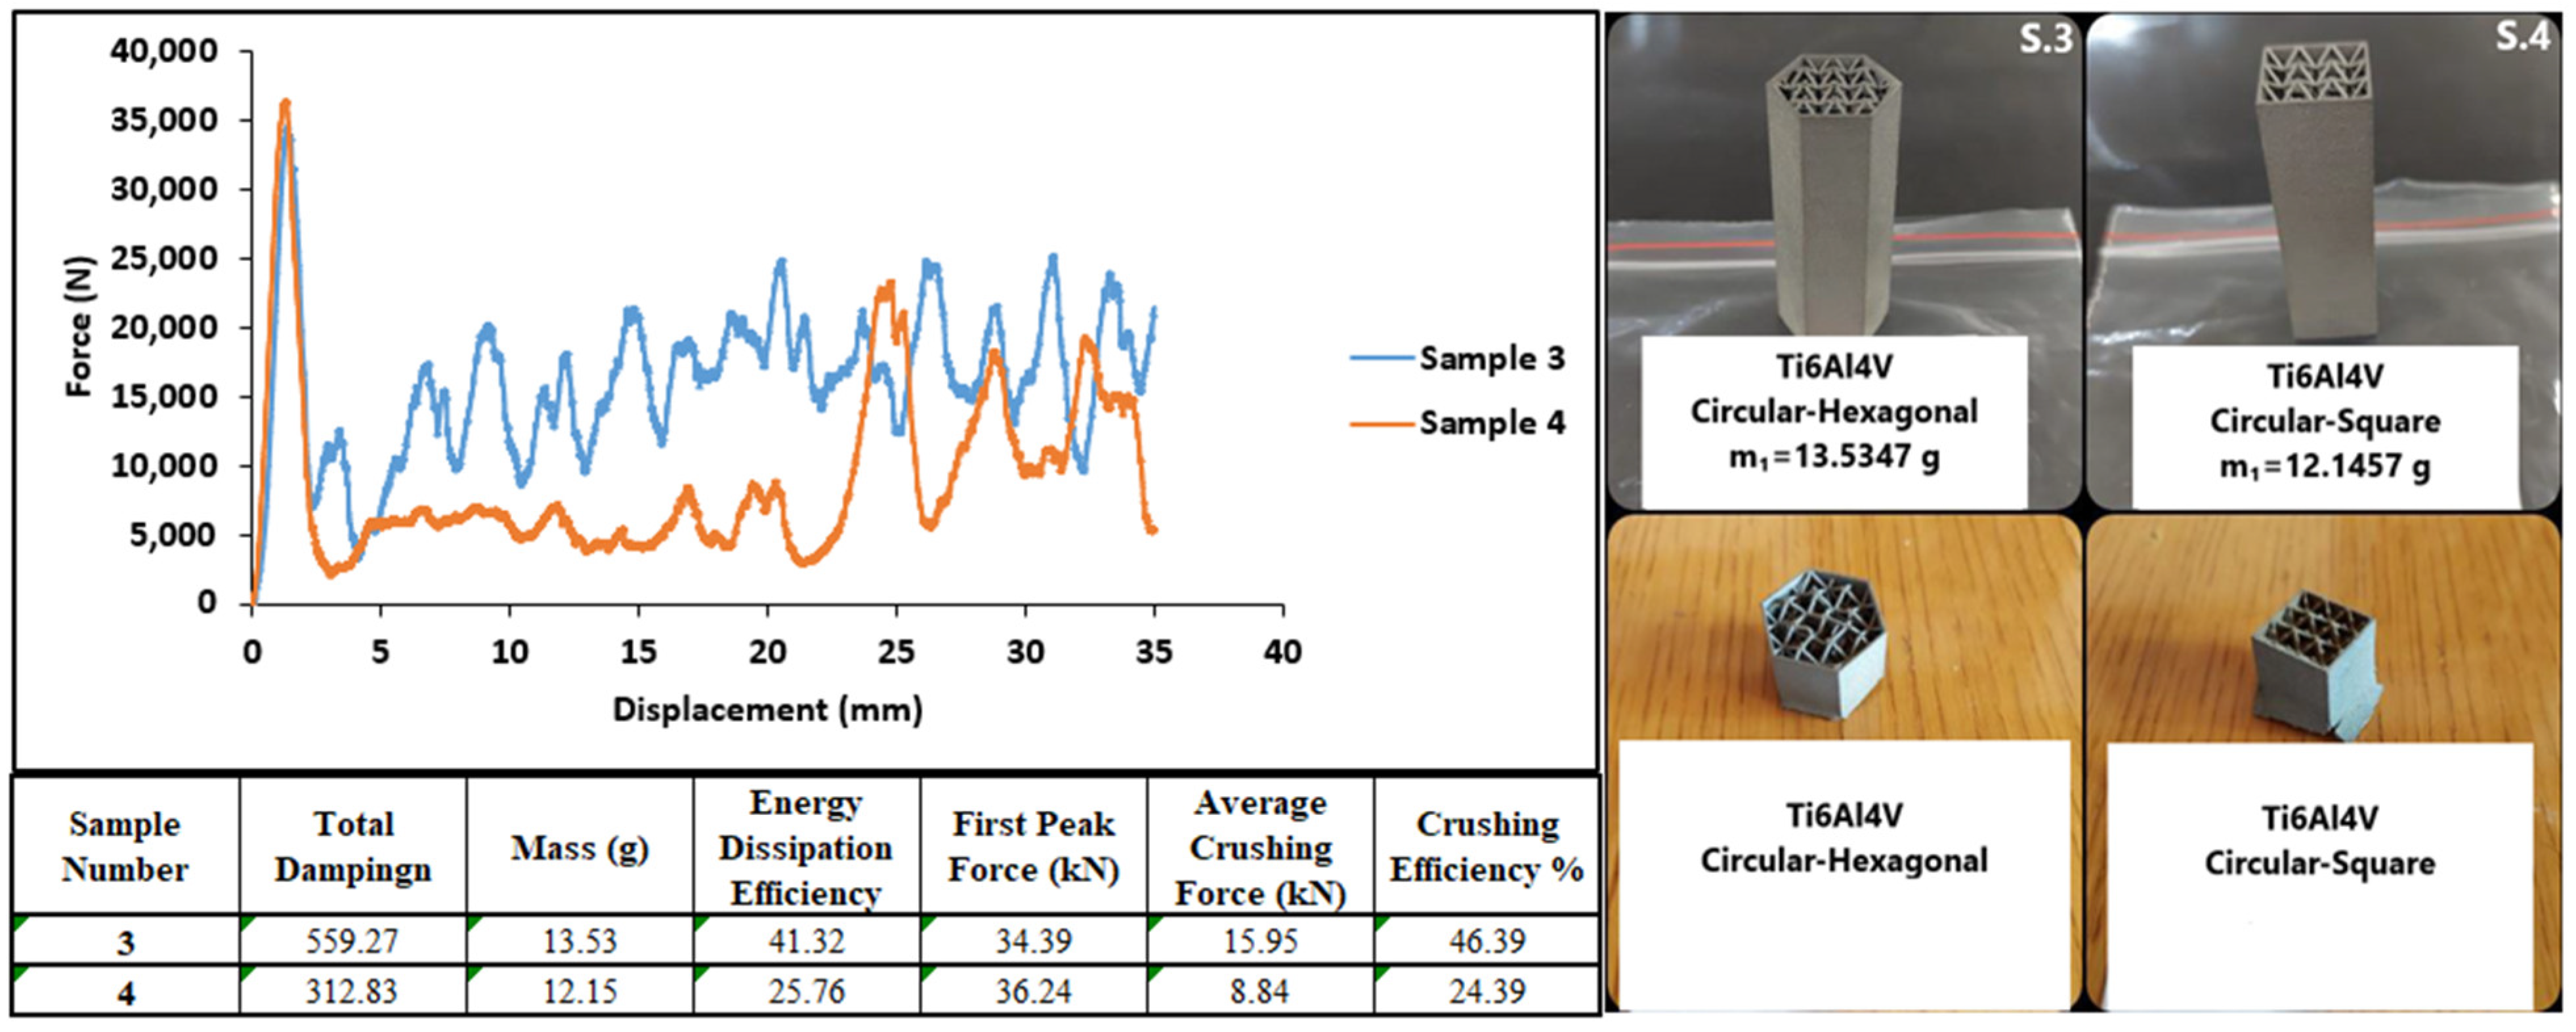
Pre and post-test images and test graphs of specimens three and four are shown in Figure 16. The structure showed a brittle behavior and fractured against the compressive force and separated from the whole. According to the data, they showed a similar performance up to the first peak force. However, specimen number three generated high peak forces due to its hexagonal structure, thus providing 1.6 times more energy absorption efficiency.
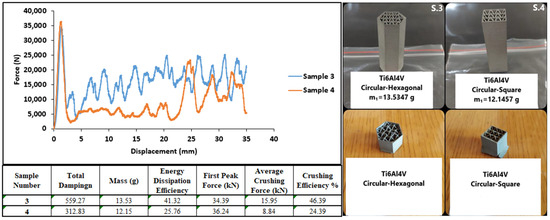
Figure 16.
Result graphs and before and after images of samples 3–4.
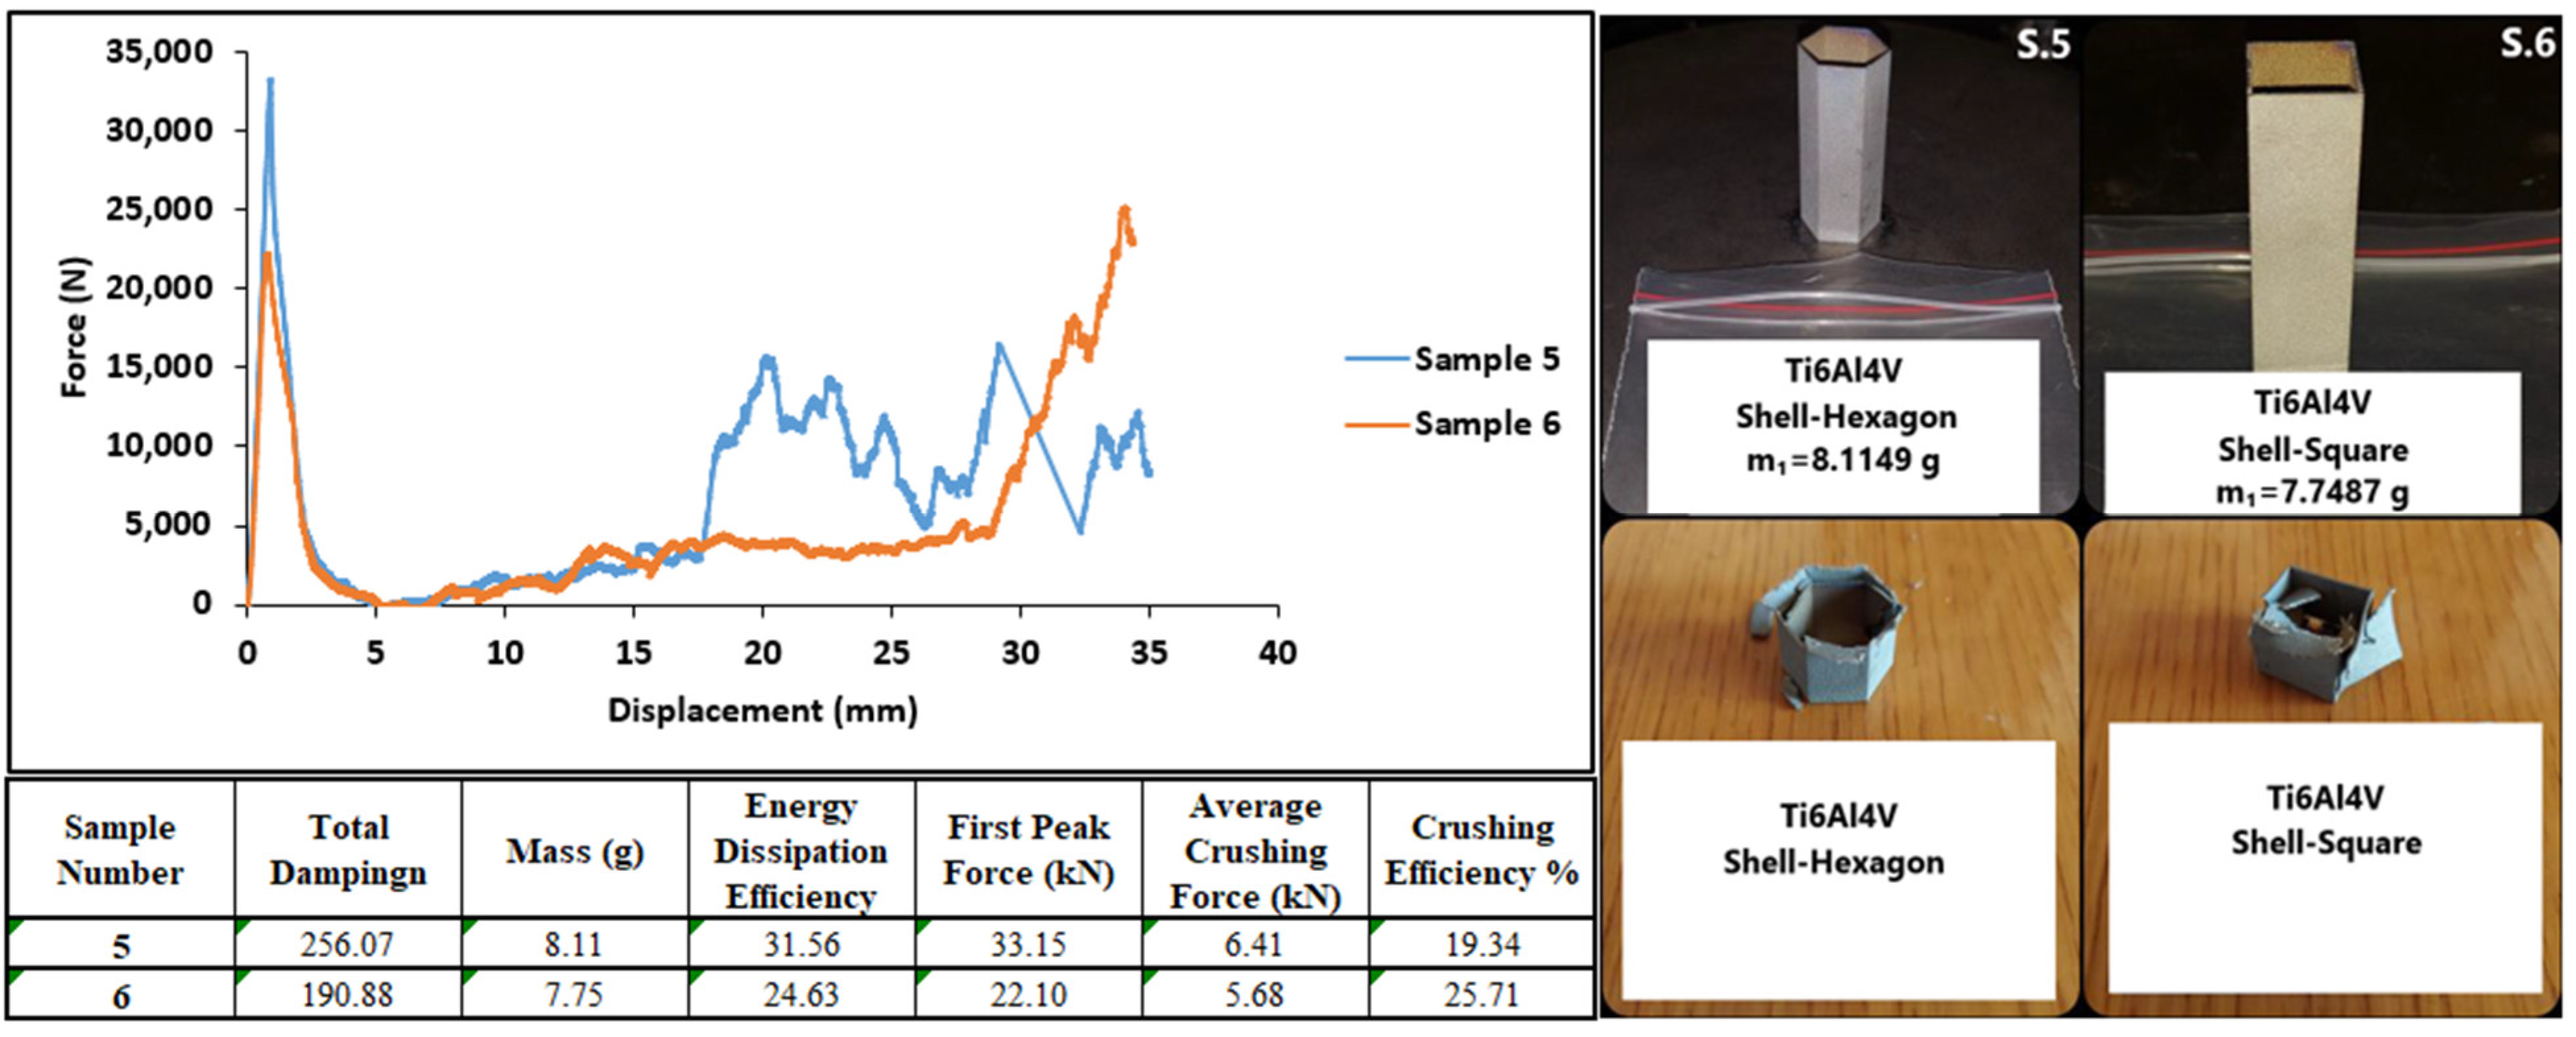
Pre and post-test images and test curves of specimens five and six are shown in Figure 17. The specimens showed a brittle structure similar to other Ti6Al4V specimens. In the initial peak forces, specimen five achieved higher values due to its hexagonal structure. However, after 17 mm displacement, they showed different performances due to irregular fractures. Specimen six, which has a square geometry, showed much worse performance than the other specimen because it did not crack from the corners. After 30 mm displacement, it showed a good performance and increased energy absorption due to the folded layers.
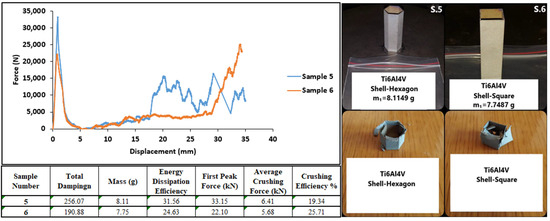
Figure 17.
Result graphs and before and after images of samples 5–6.
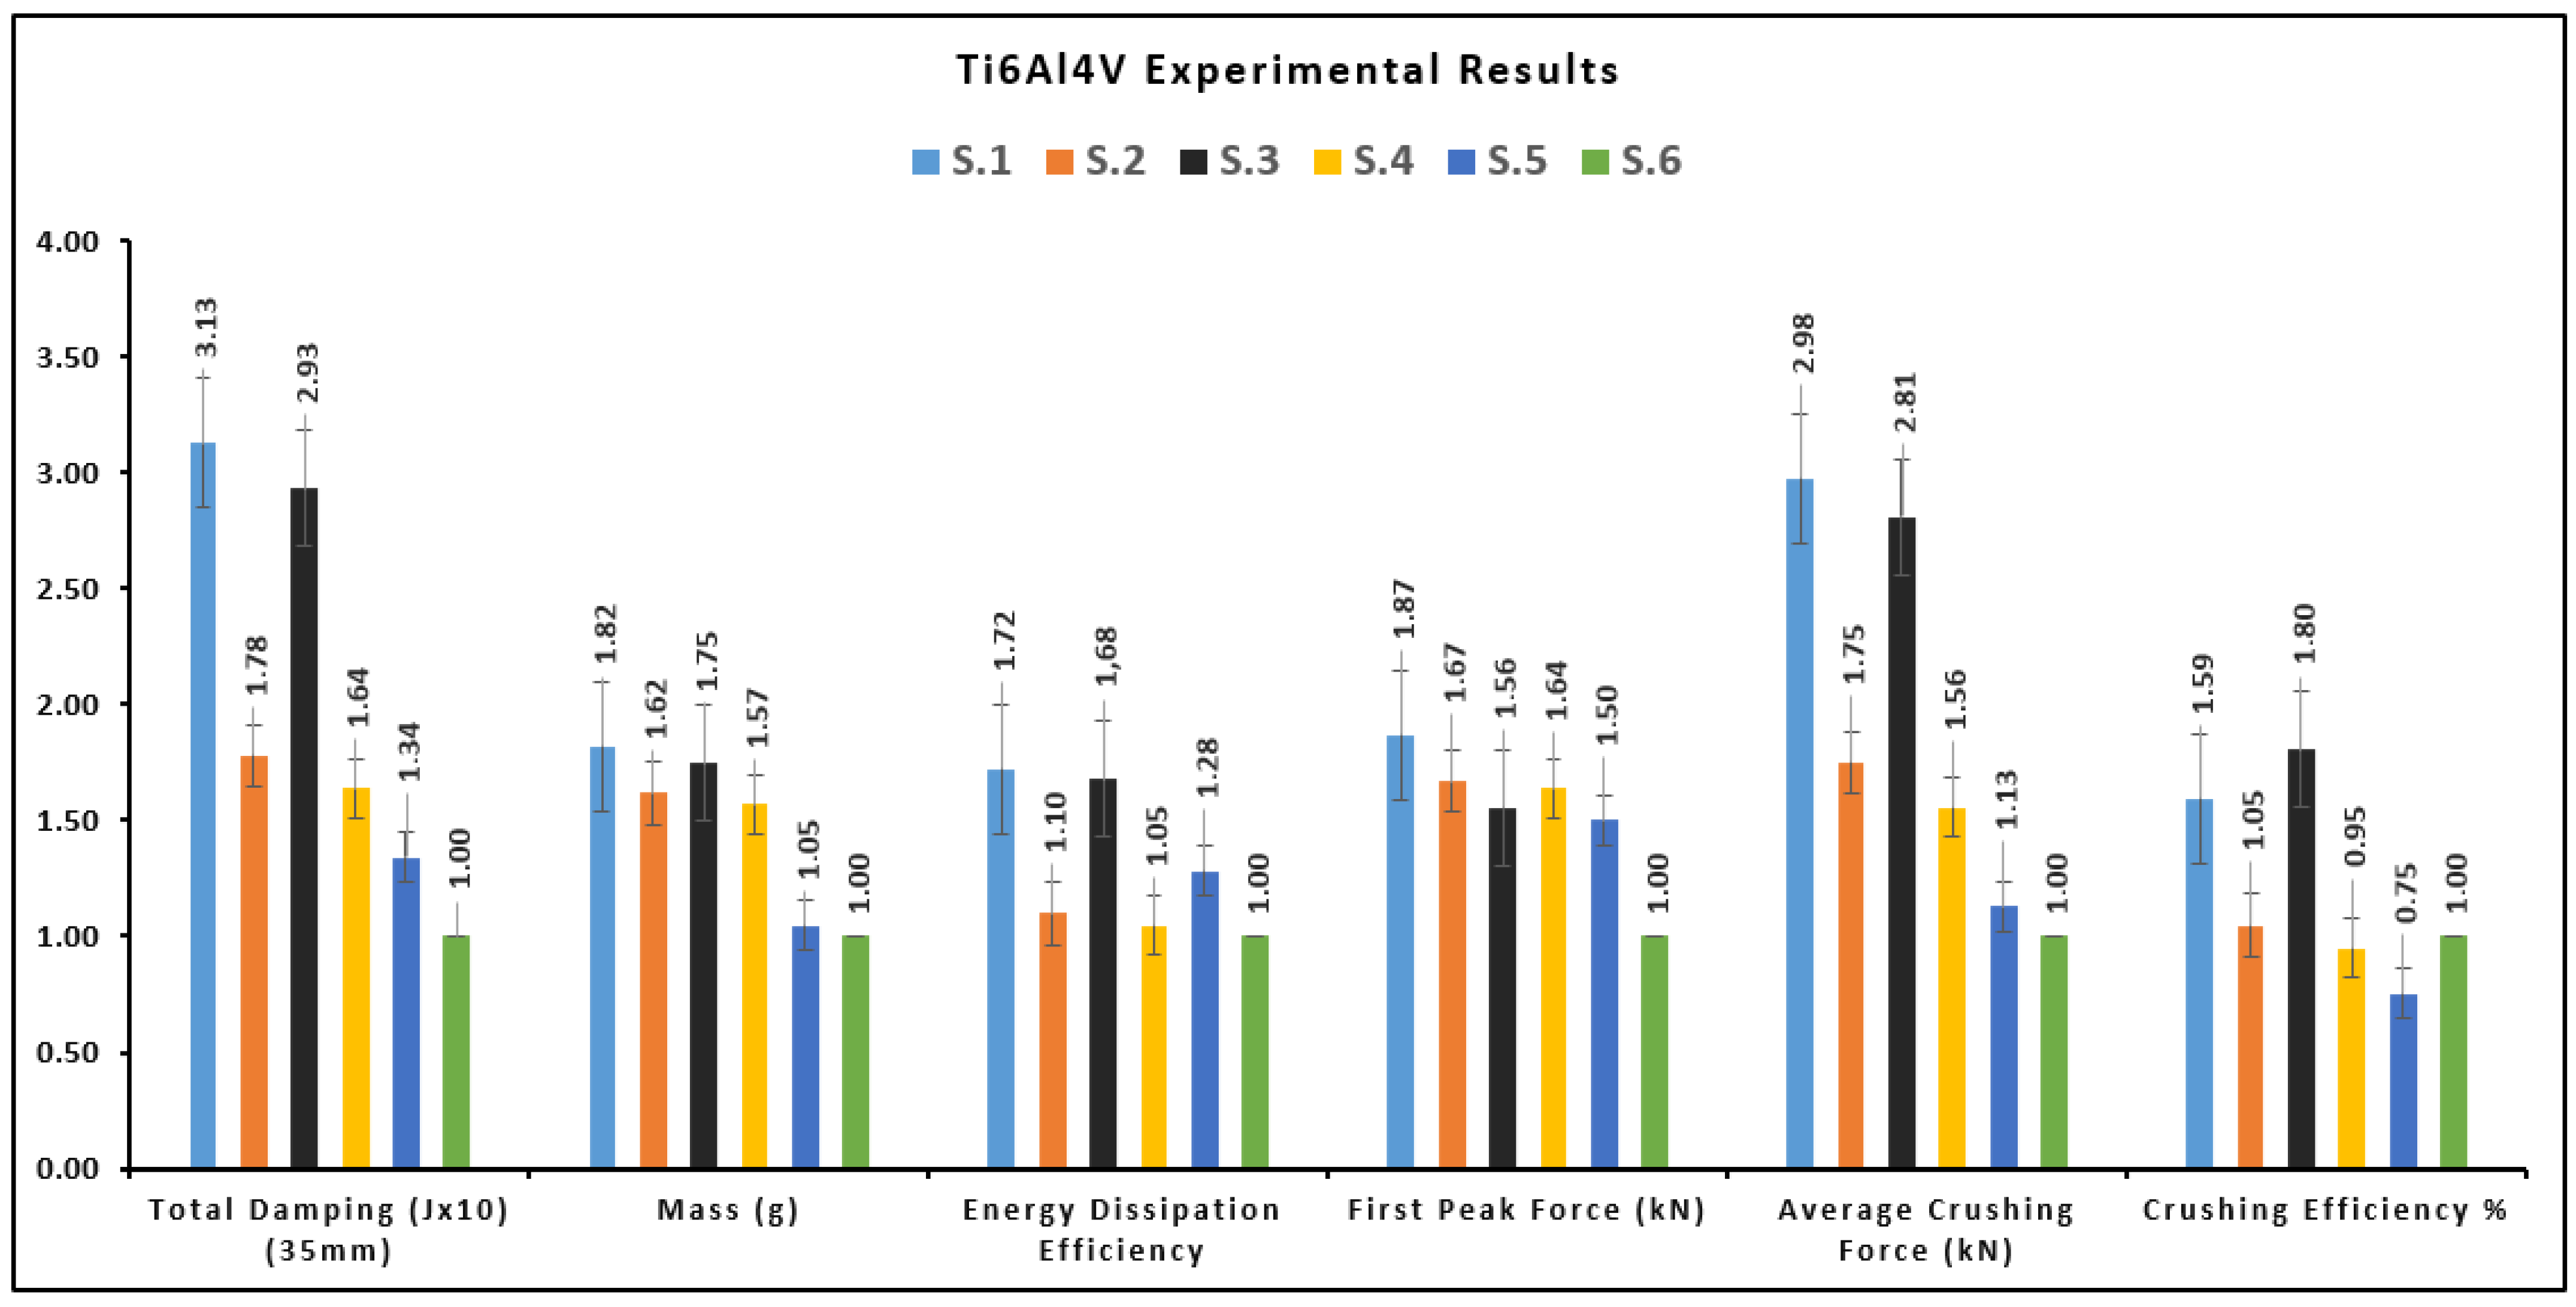
Figure 18 shows the test results for all Ti6Al4V powder specimens. According to the geometry, the highest energy absorption performance was shown by samples one, three, and two, respectively. Due to their brittle nature, all titanium alloys showed similar peak strength. In terms of energy absorption efficiency, all hexagonal structures showed better performance. When the geometry of the cell element was analyzed, the hexagonal structure gave higher results than the circular structure in all groups. The data are normalized with respect to the sample with square-wall structure number six, which has the lowest energy absorption performance. Sample one had three times more energy absorption capacity and 1.7 times more energy absorption efficiency.
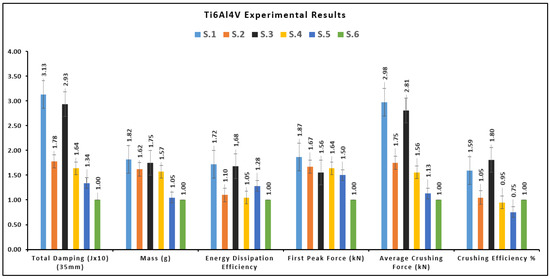
Figure 18.
Experimental results of Ti6Al4V group.
4.2. Experiments on AISI 316L Powder
In static axial compression tests performed at a speed of 2 mm/min, AISI 316L specimens collapsed and folded in the axial direction without breaking due to their ductile structure. Specimens made of AISI 316L material showed the best folding performance in terms of geometry.
Before and after test images and test graphs of specimens with sample numbers seven and eight are shown in Figure 19. Due to their ductile nature, the folding occurred as a whole, and the folding was relatively symmetrical, resulting in a smoother graph and no force waves. Specimen eight collapsed on a more regular axis than the others. The folds caused by the folding had a positive effect on the energy absorption performance.

Figure 19.
Result graphs and before and after images of samples 7–8.
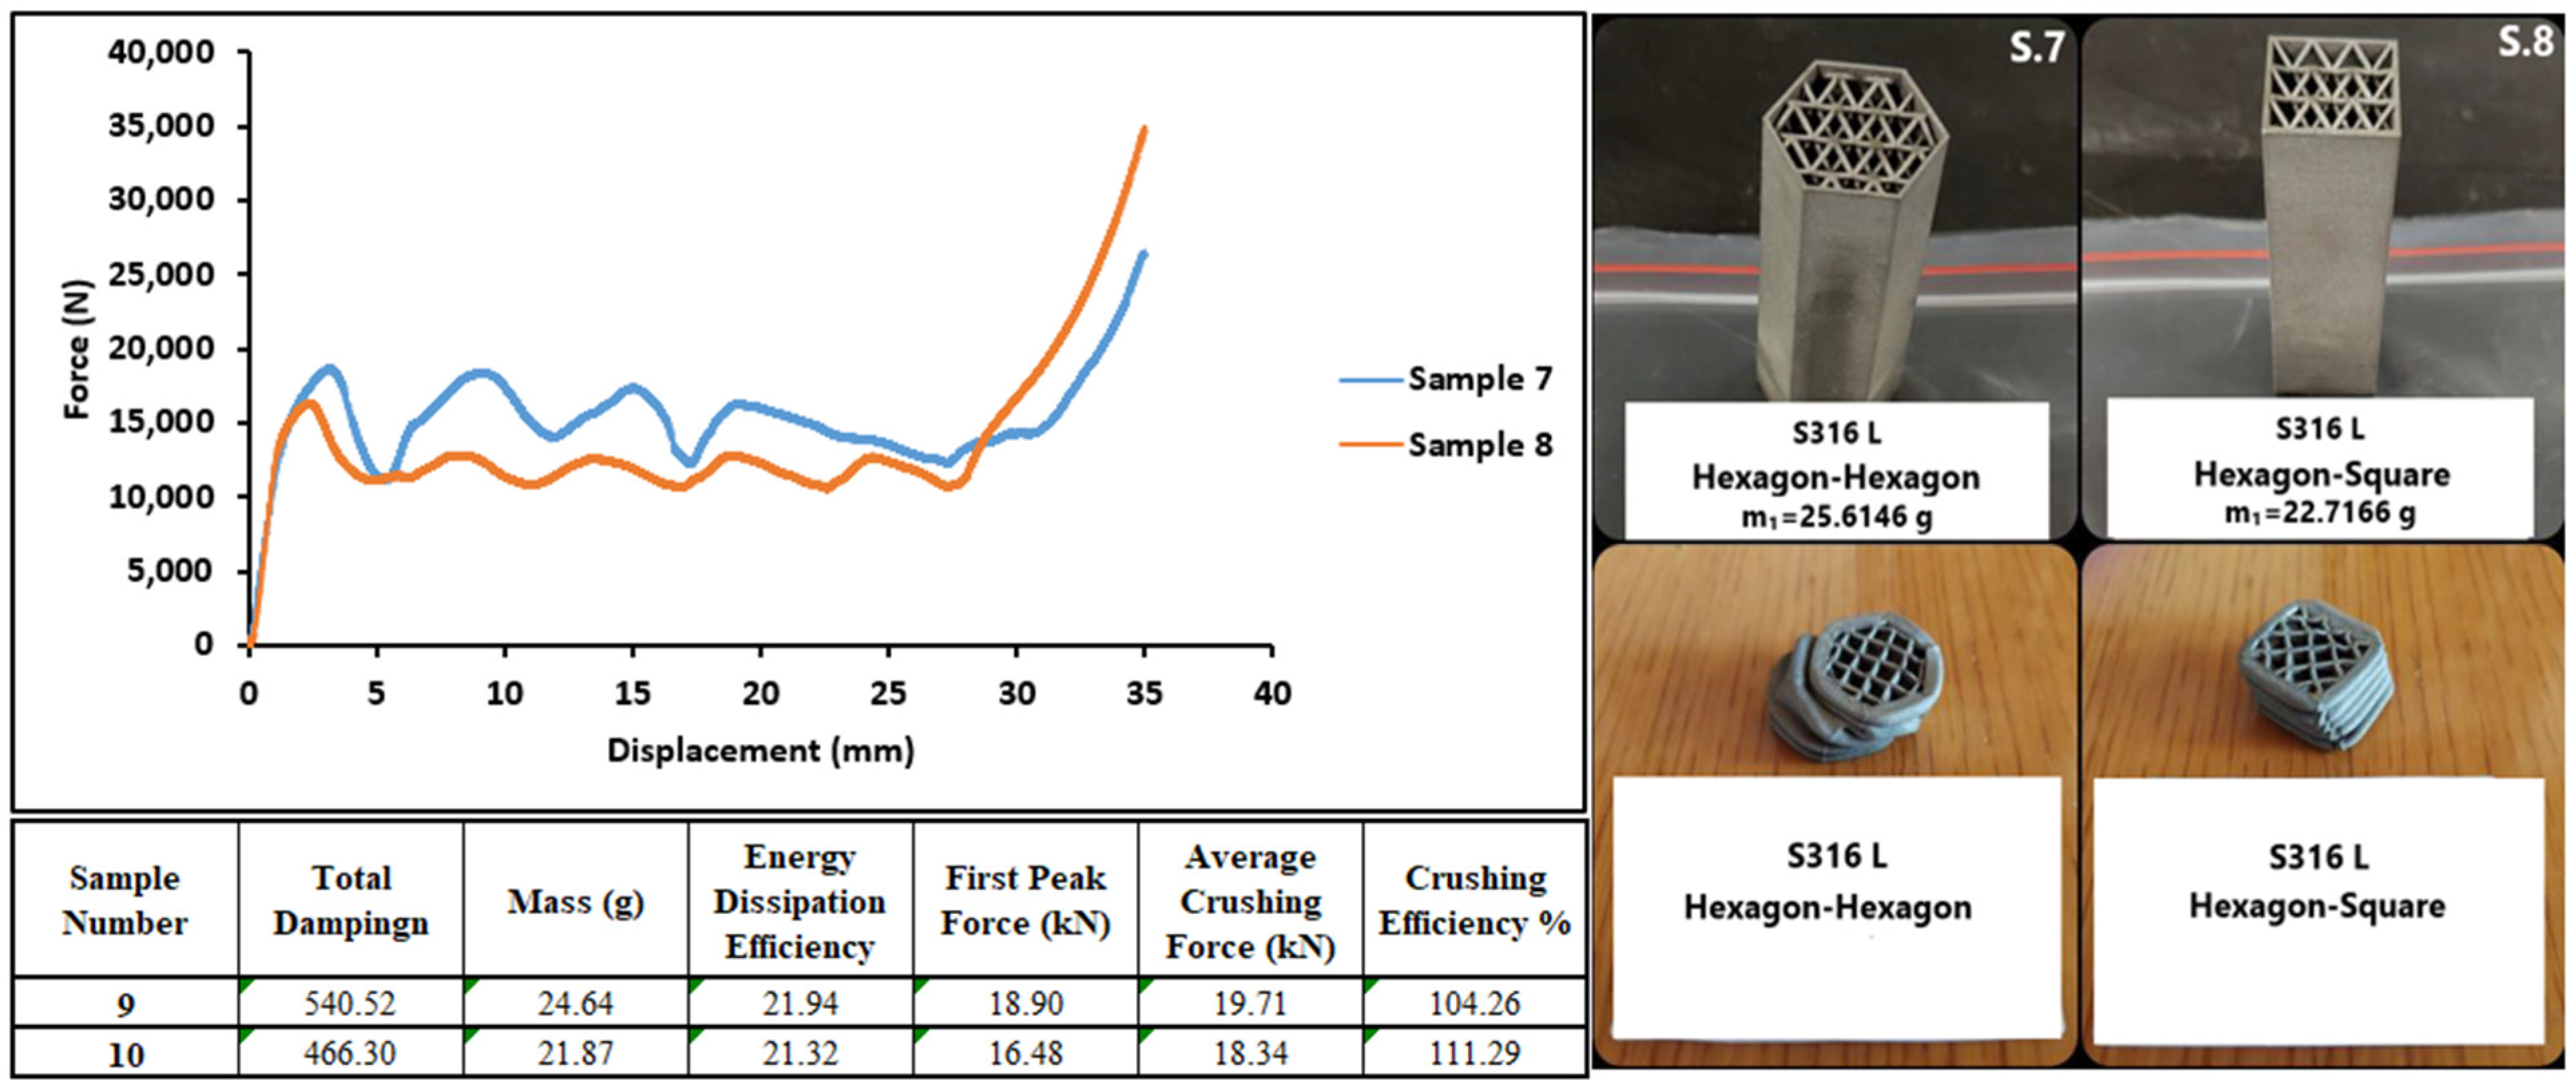
Figure 20 shows the force-displacement graph of the specimens at the 35 mm displacement limit and the results table and pictures before and after the test. Specimen number nine showed better reaction forces. The peak forces of specimen number nine occurred at each 5 mm displacement. Considering that the minimum cell height is 5 mm, the peak forces can be evaluated as the reaction forces of the structure as a result of the collapse of each cell block. Both samples showed high crushing efficiency. Sample number nine, which was able to achieve higher reaction forces due to its geometric structure, showed a better crushing performance.
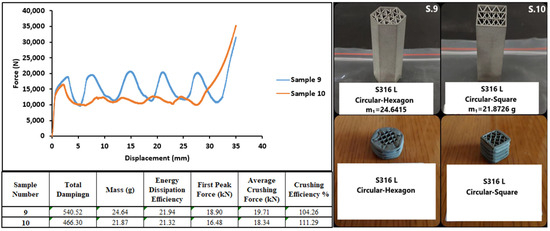
Figure 20.
Result graphs and before and after images of samples 9–10.
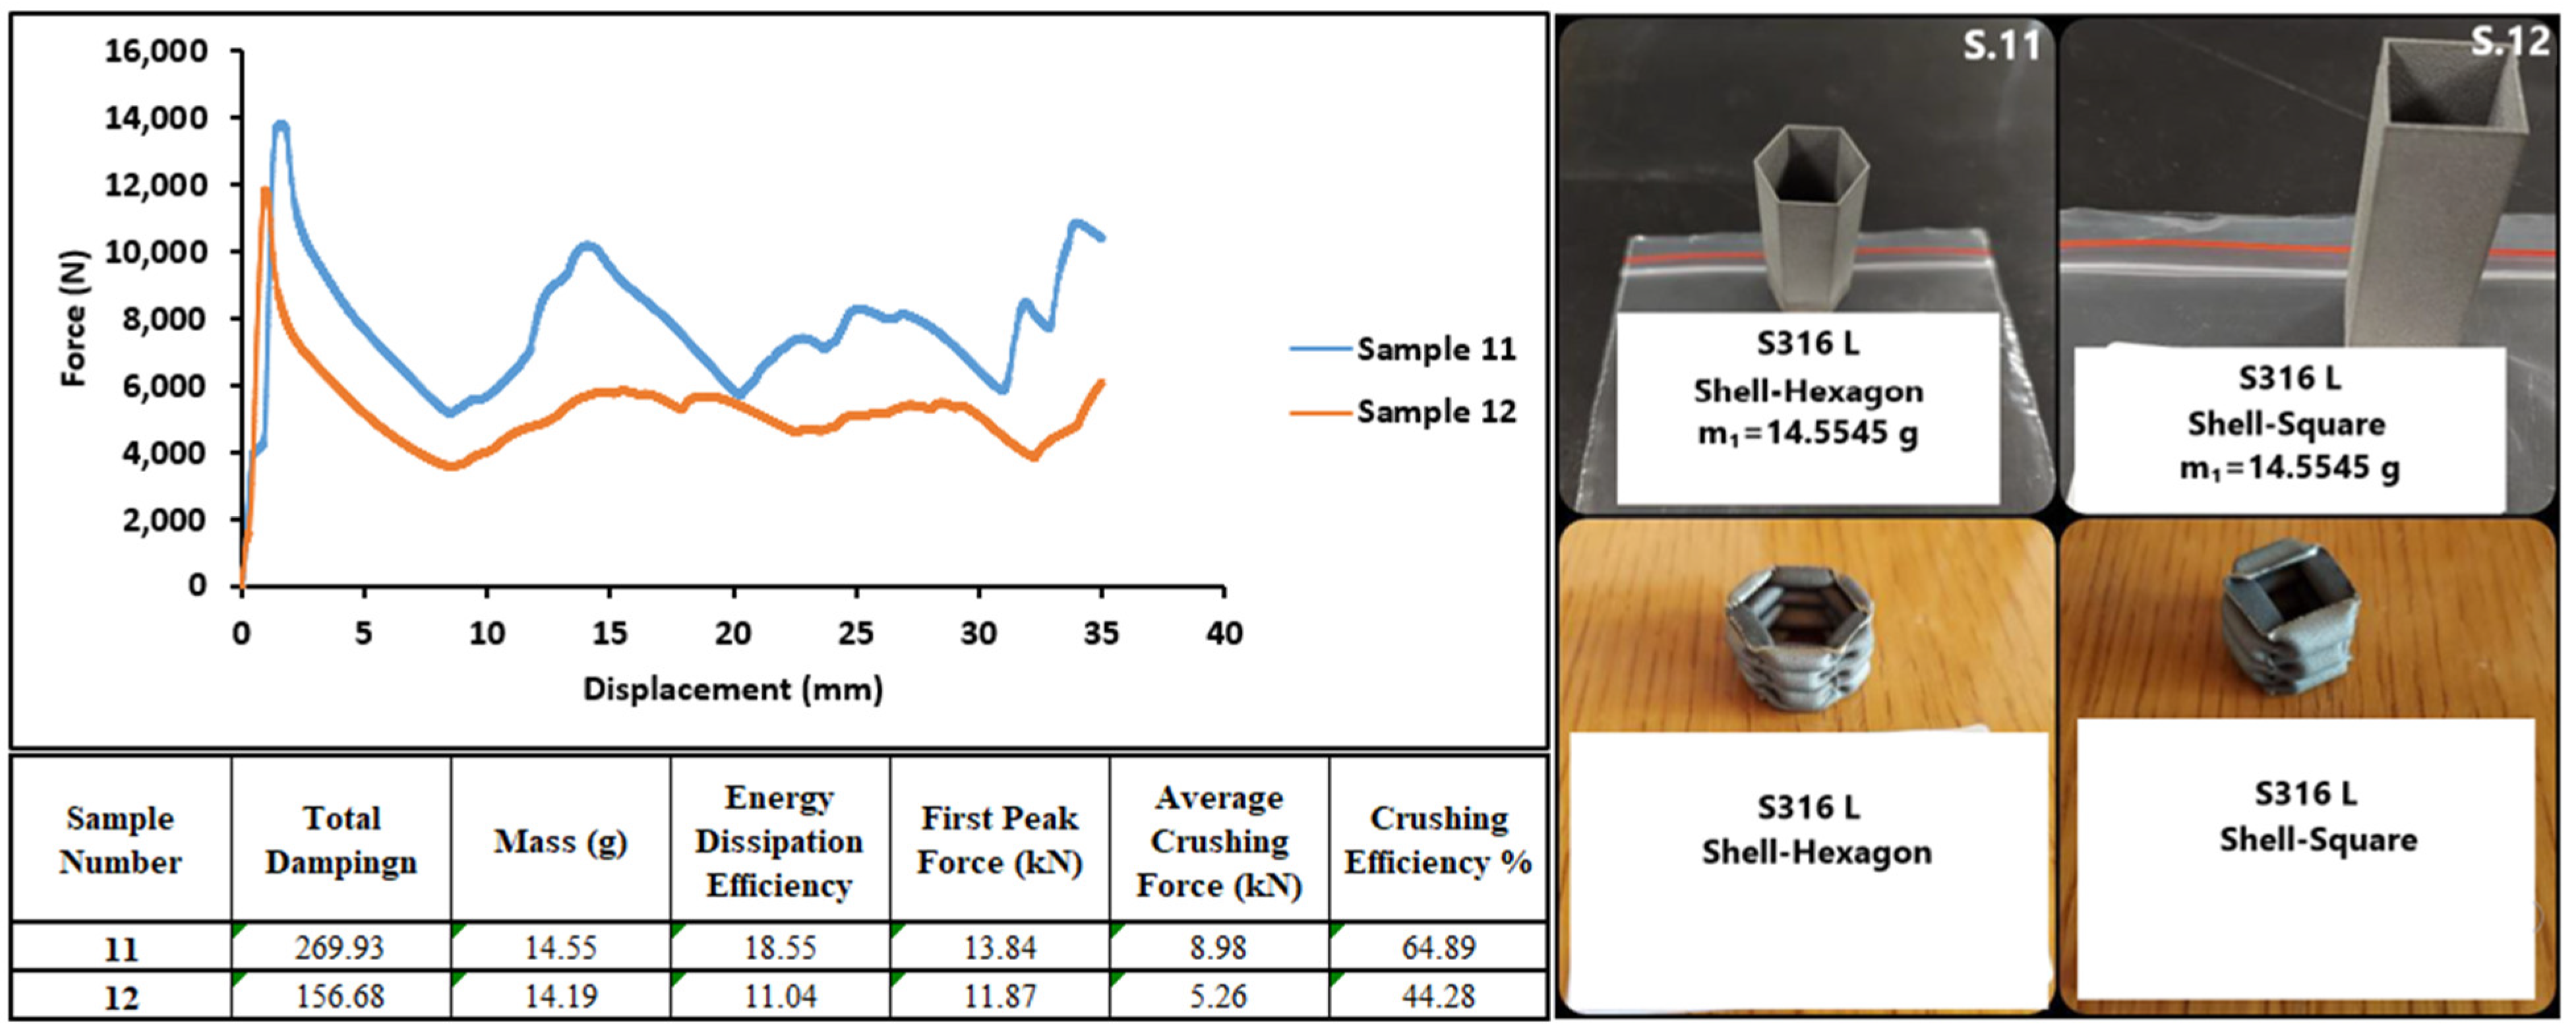
Figure 21 shows pre and post-test images and test result data for specimens with sample numbers 11 and 12. As with other AISI 316L powder structures, these specimens showed similar ductility performance and achieved full axial collapse. The thin wall structures showed significantly lower energy absorption and reaction force performance than the hybrid structures. As with the other AISI 316L tests, the hexagonal specimens performed better in all evaluation criteria.
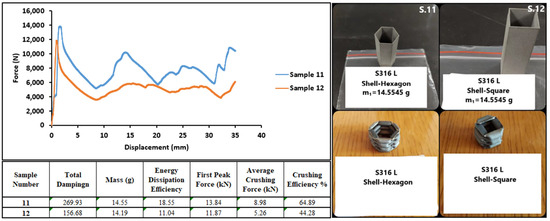
Figure 21.
Result graphs and before and after images of samples 11–12.
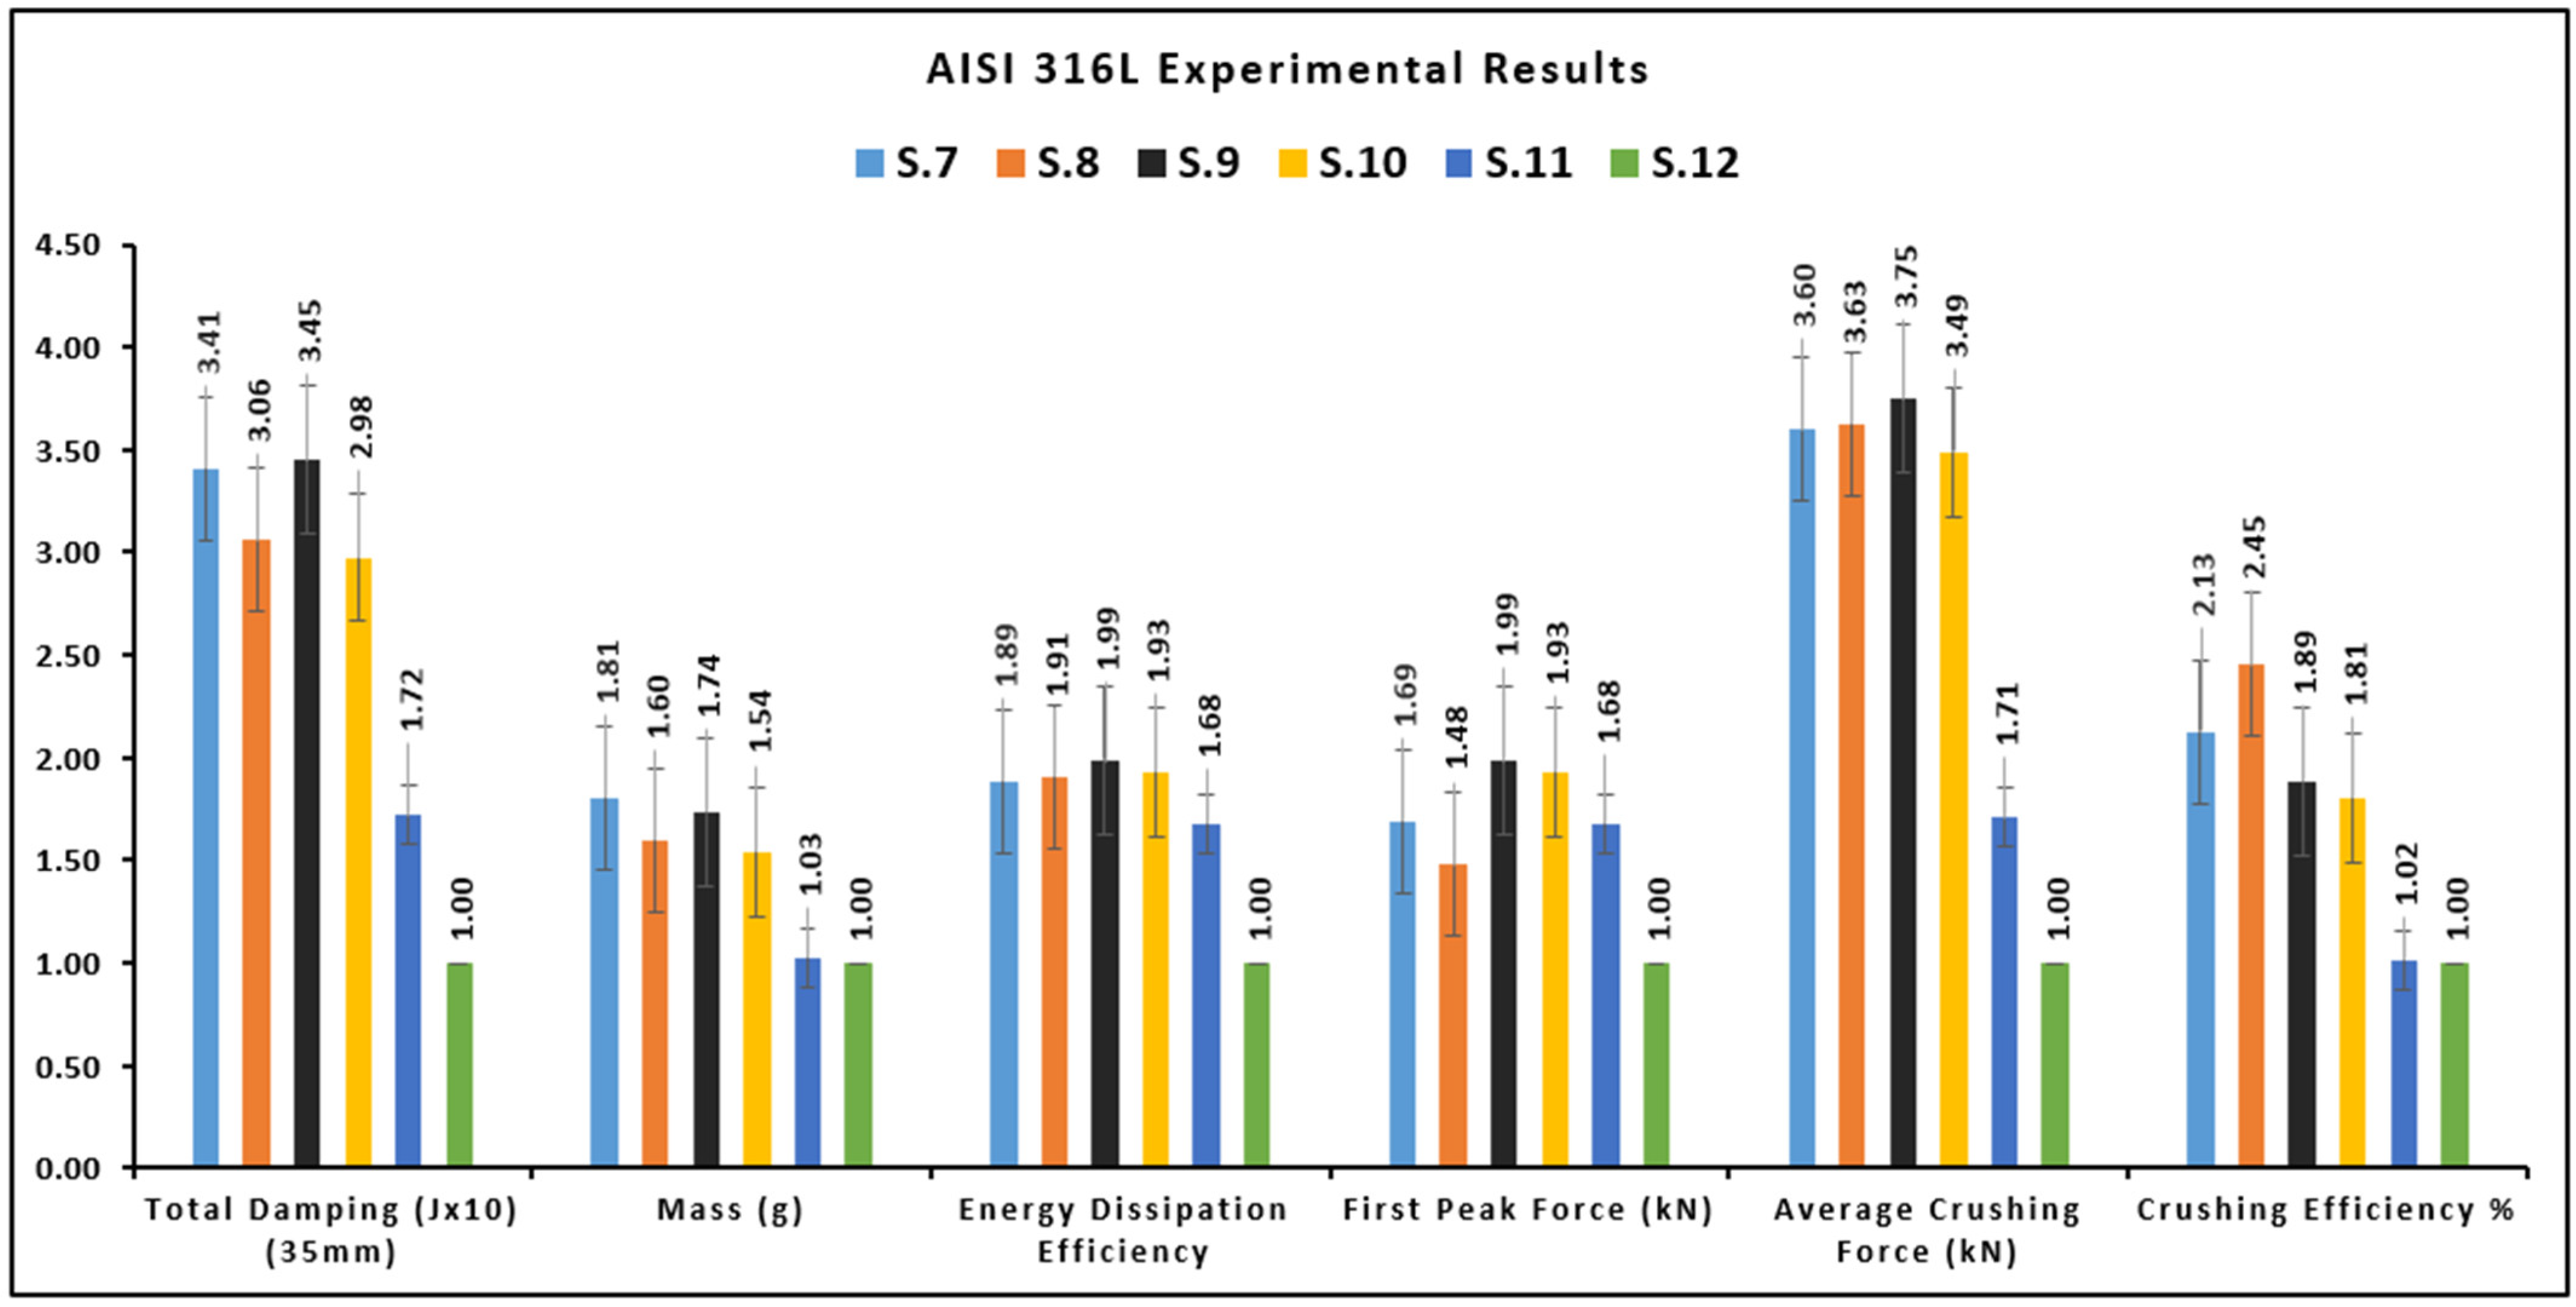
Figure 22 shows the test results for all AISI 316L powder specimens. AISI 316L specimens showed very good crushing performance due to their ductile structure. The results were more consistent due to the generally linear and excellent crush shape, making it easier to interpret the design criteria. Cellular hybrid systems with hexagonal structures achieved better energy absorption efficiency by generating higher reaction forces. When the data were normalized with respect to specimen 12, with a square wall structure, which had the lowest damping efficiency, specimen 9, with a circular-hexagonal structure, which had the highest energy absorption efficiency, showed twice the energy absorption efficiency.
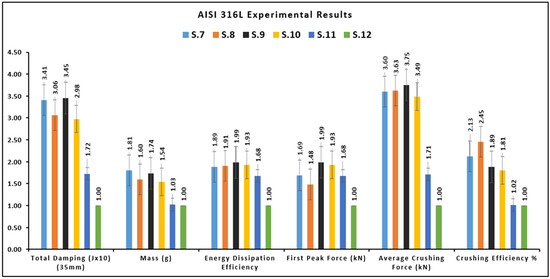
Figure 22.
Experimental results of AISI 316L group.
4.3. Experiments on Inconel 718 Powder
In static axial compression tests performed at a rate of 2 mm/min, Inconel 718 specimens exhibited fracture and cracking similar to Ti6Al4V powder due to its low ductility.
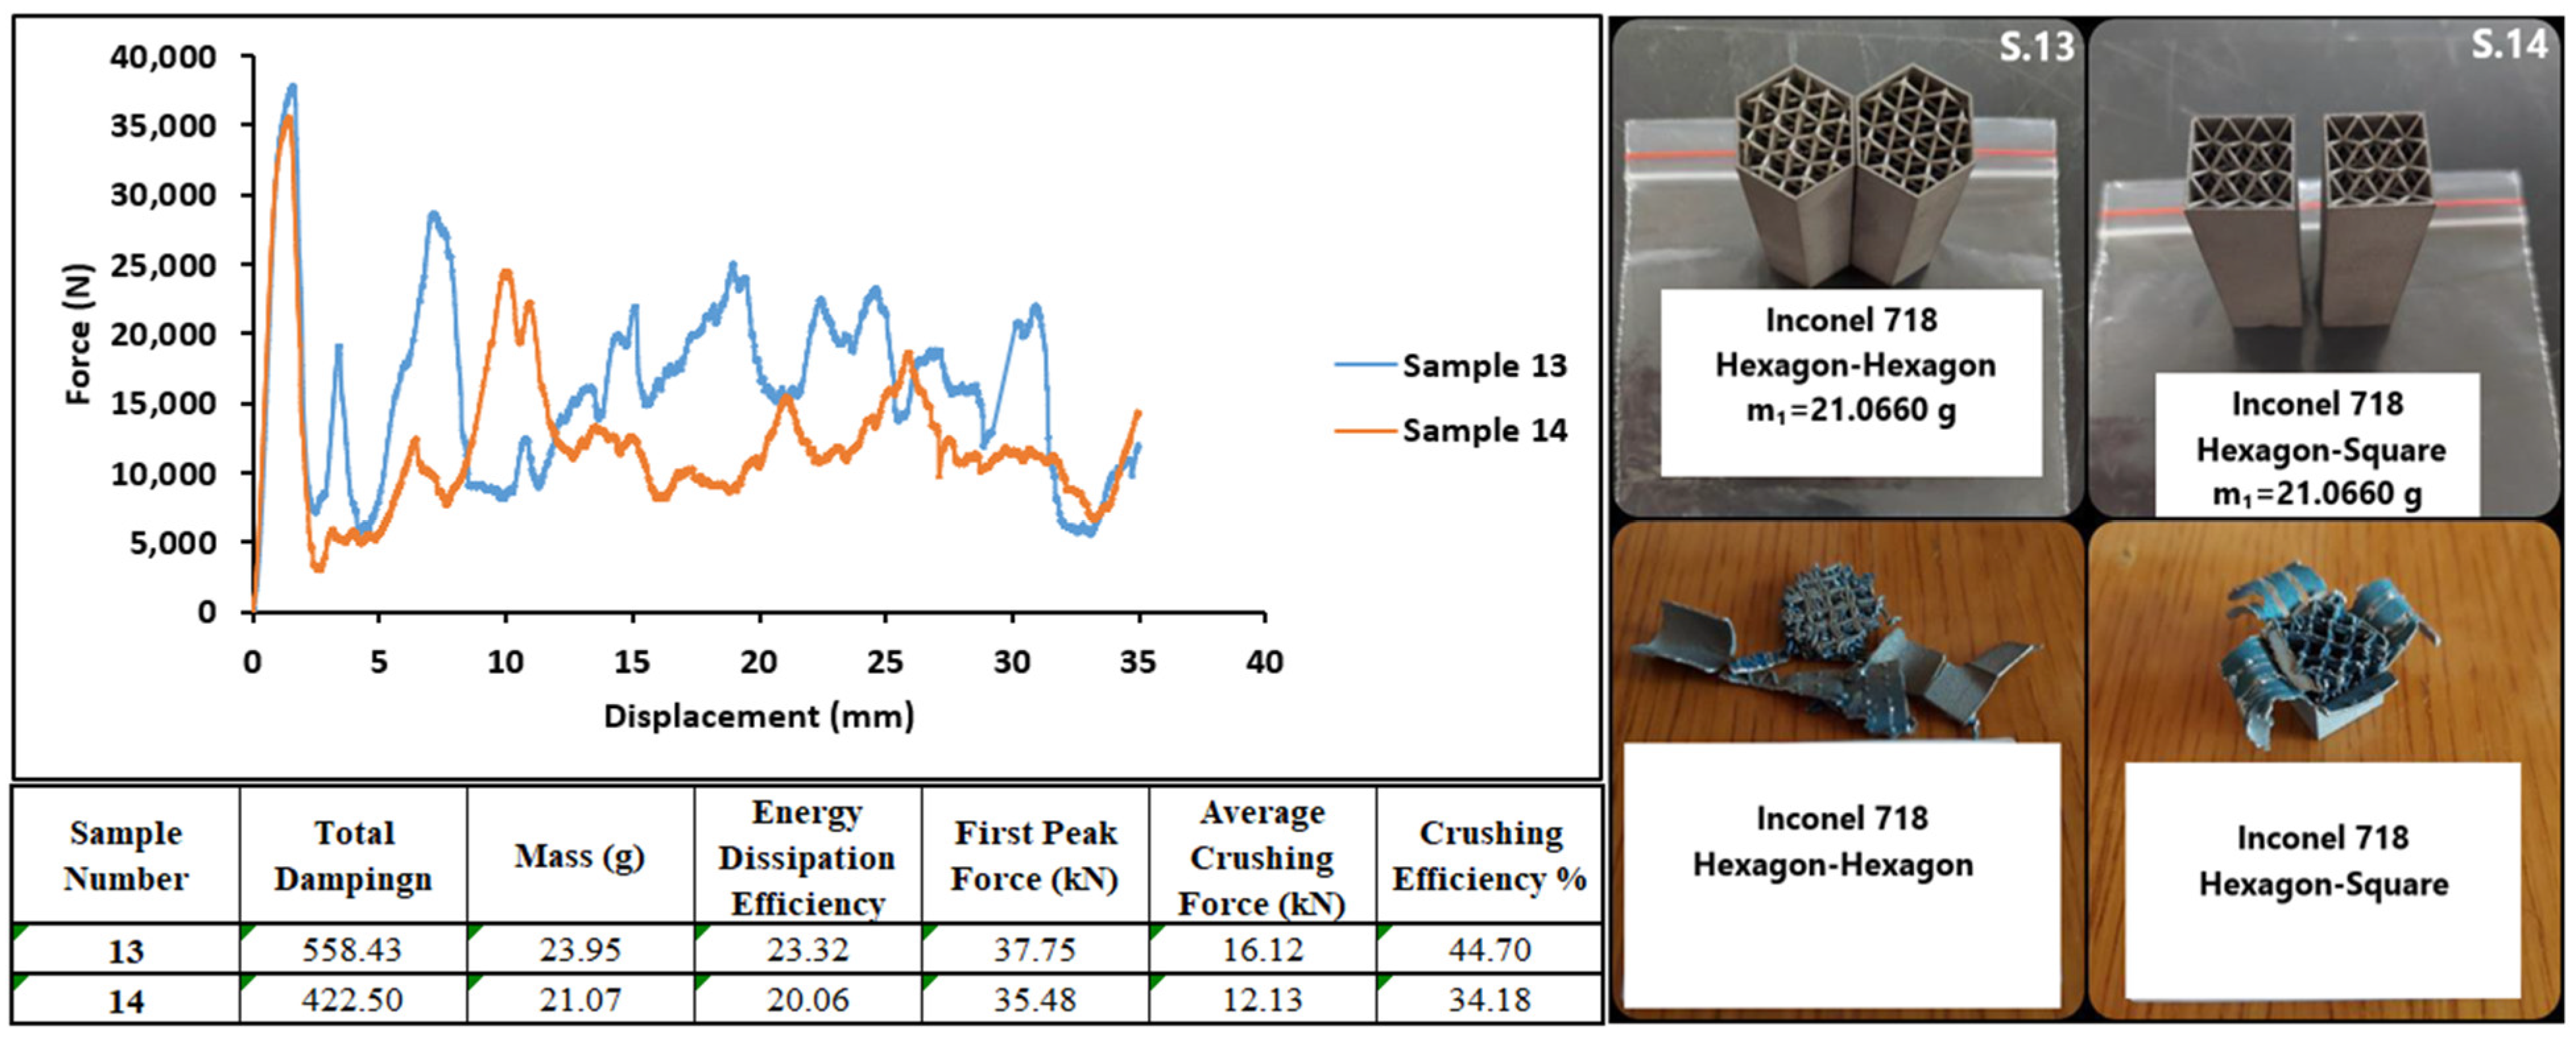
Figure 23 shows pre and post-test images and test result data for samples with design codes 13 and 14. As can be seen from the images, fractures occurred mainly in the shell sections due to their brittle structure. Inconel 718 is a brittle, high-strength alloy material. Although its high strength enabled it to achieve high reaction forces during compression, it was subject to fracture and could not ensure the continuity of the reaction force it generated.
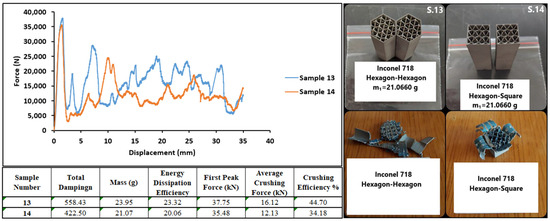
Figure 23.
Result graphs and before and after images of samples 13–14.
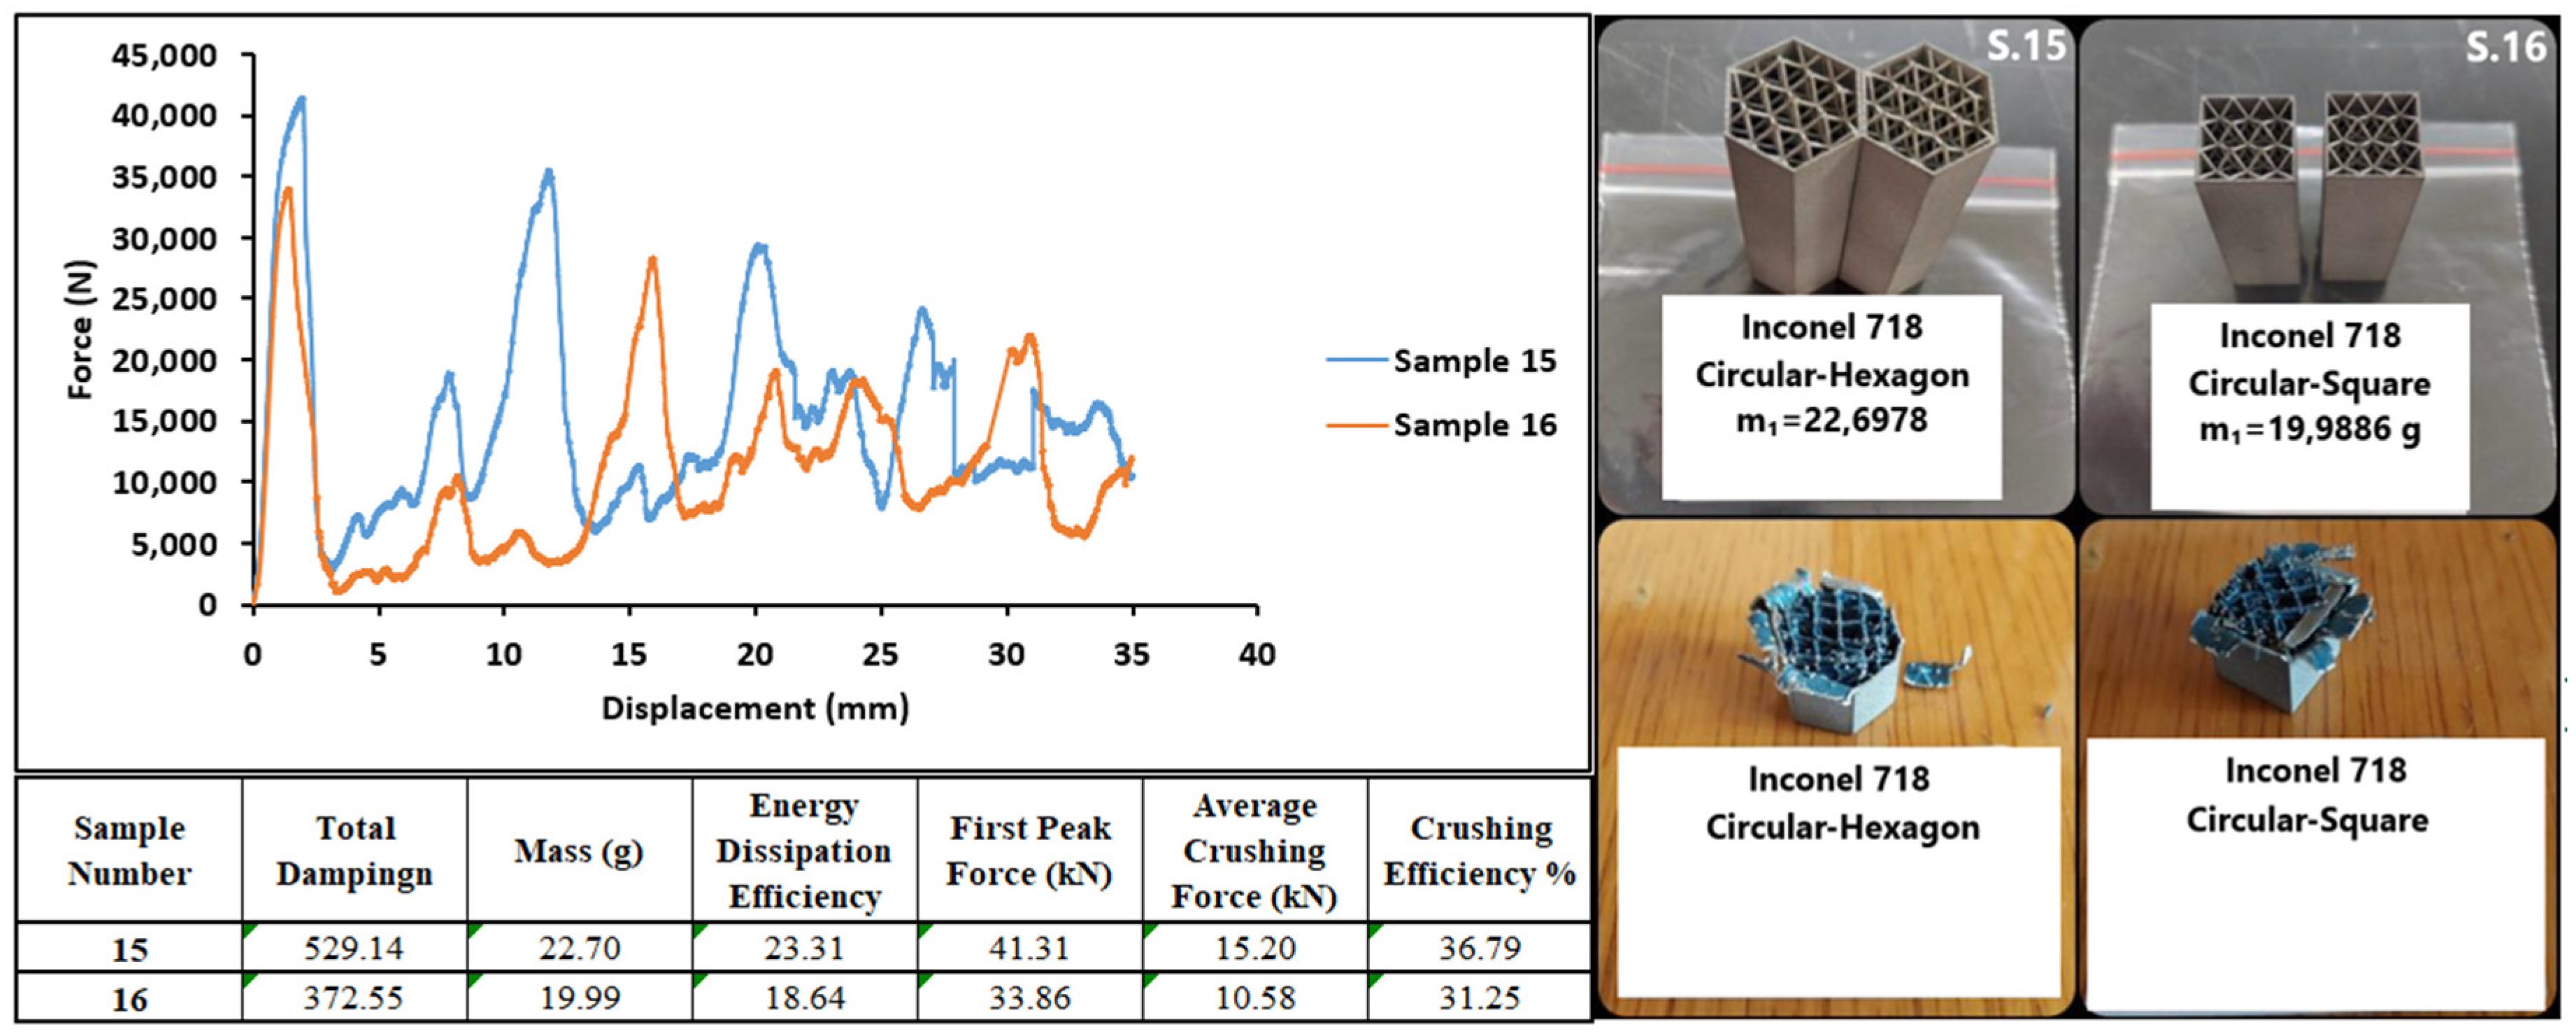
Figure 24 shows graphs of the test results of the 15th and 16th Inconel 718 specimens. The specimens showed brittle behavior during the axial compression test. However, as the wall structure was not separated from the whole, high reaction forces were generated. Due to the hexagonal structure geometry, sample number 15 withstood higher forces and showed better damping performance.

Figure 24.
Result graphs and before and after images of samples 15–16.
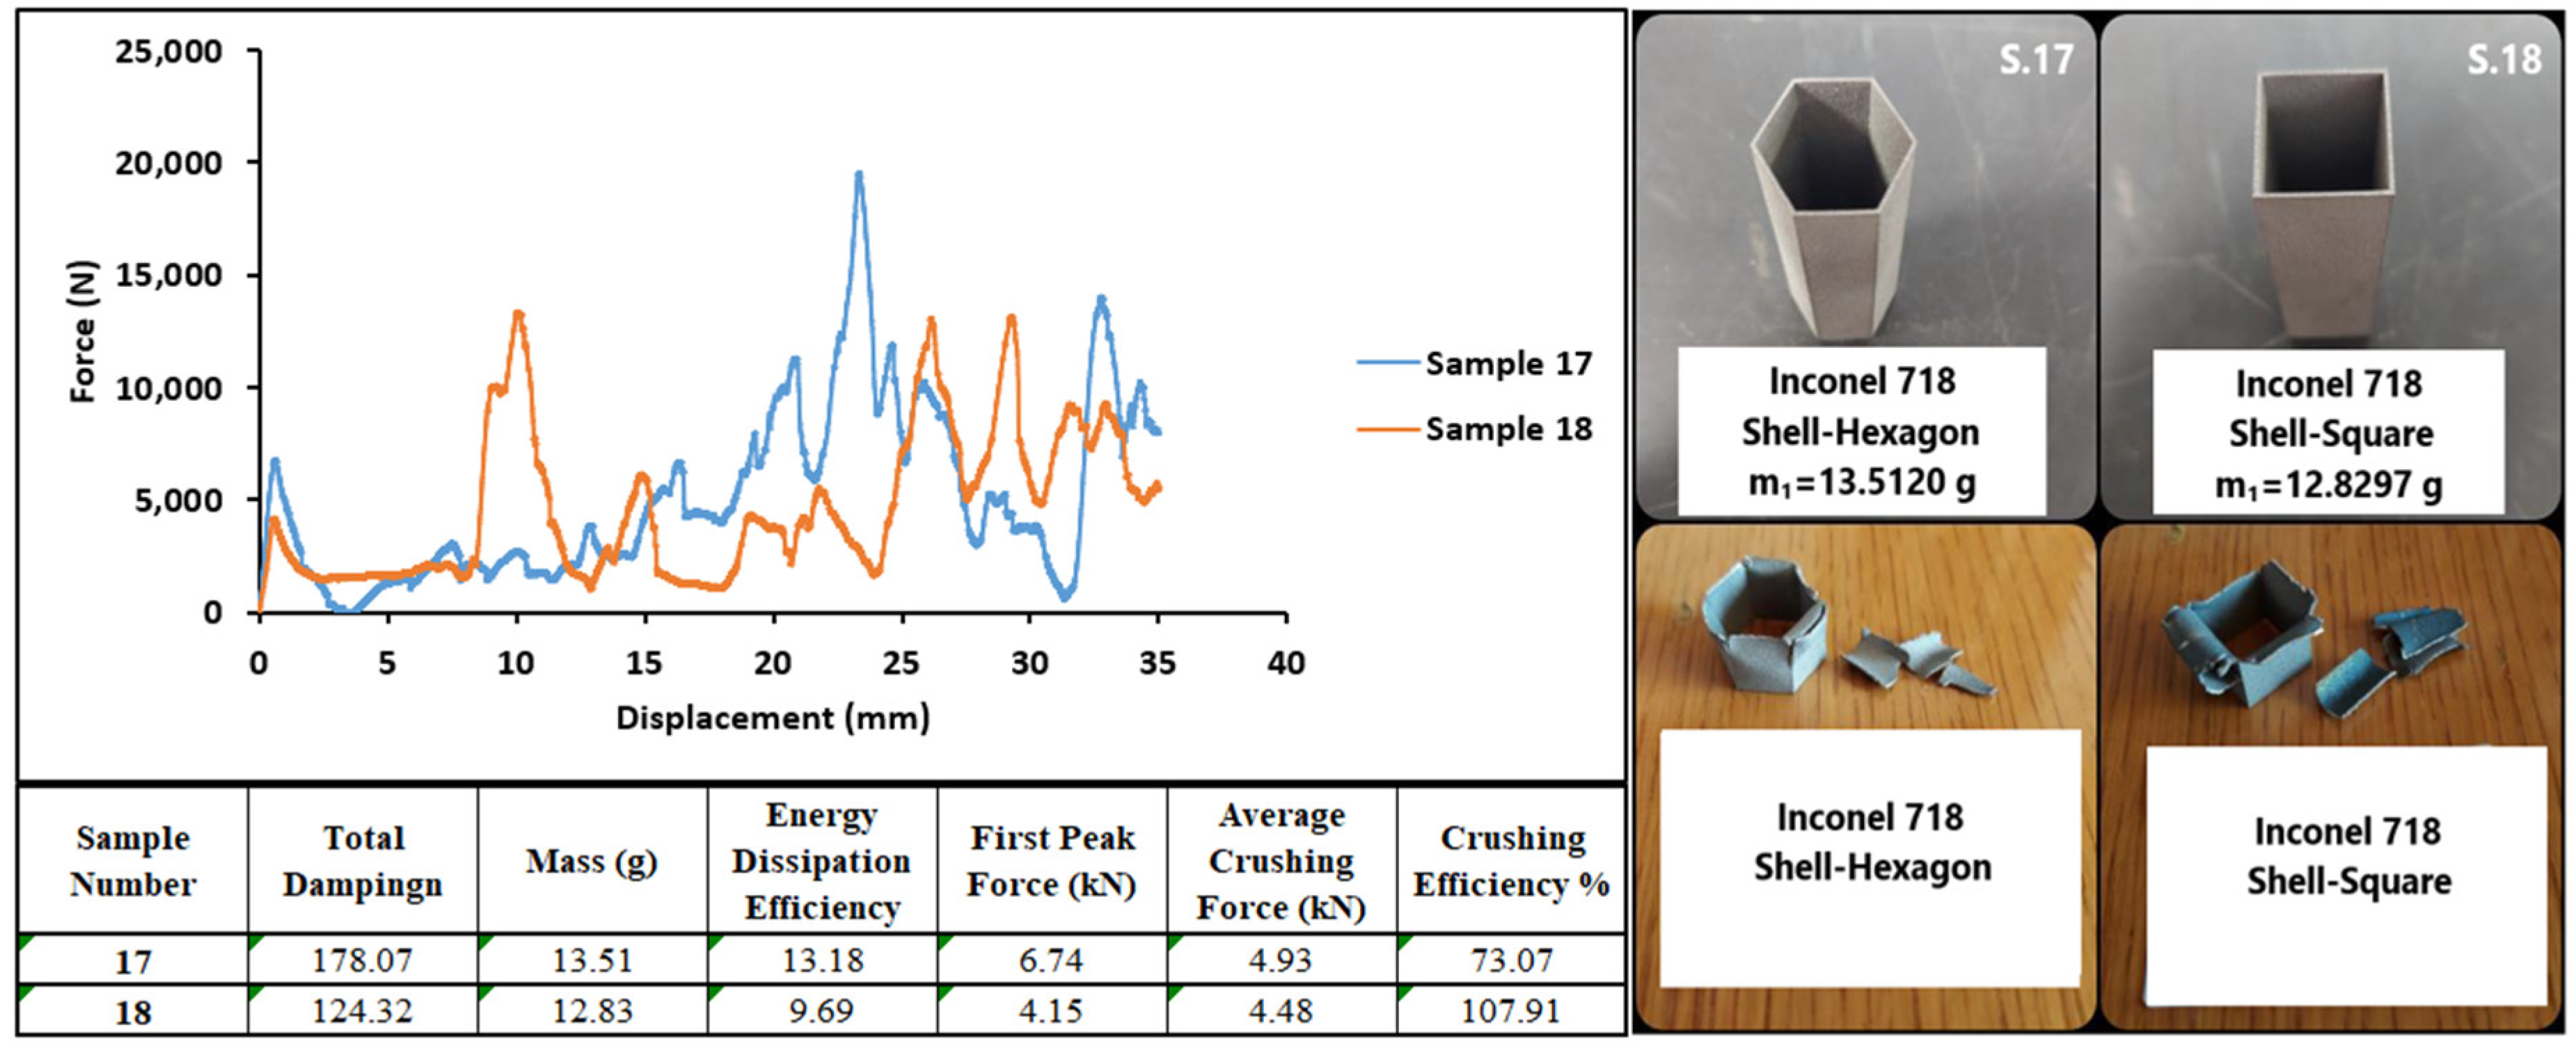
Figure 25 shows the test images and results for samples 17 and 18. These specimens showed different behavior from the other tests. They showed maximum reaction forces at forward displacement points, the reason being that they broke against the force due to their brittle structure. The structure broke before the maximum reaction force occurred, and the displacement continued to change as the piston moved. This unstable behavior showed that thin wall structures are much more uncontrolled than hybrid structures.
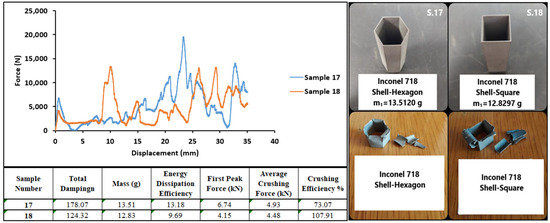
Figure 25.
Result graphs and before and after images of samples 17–18.
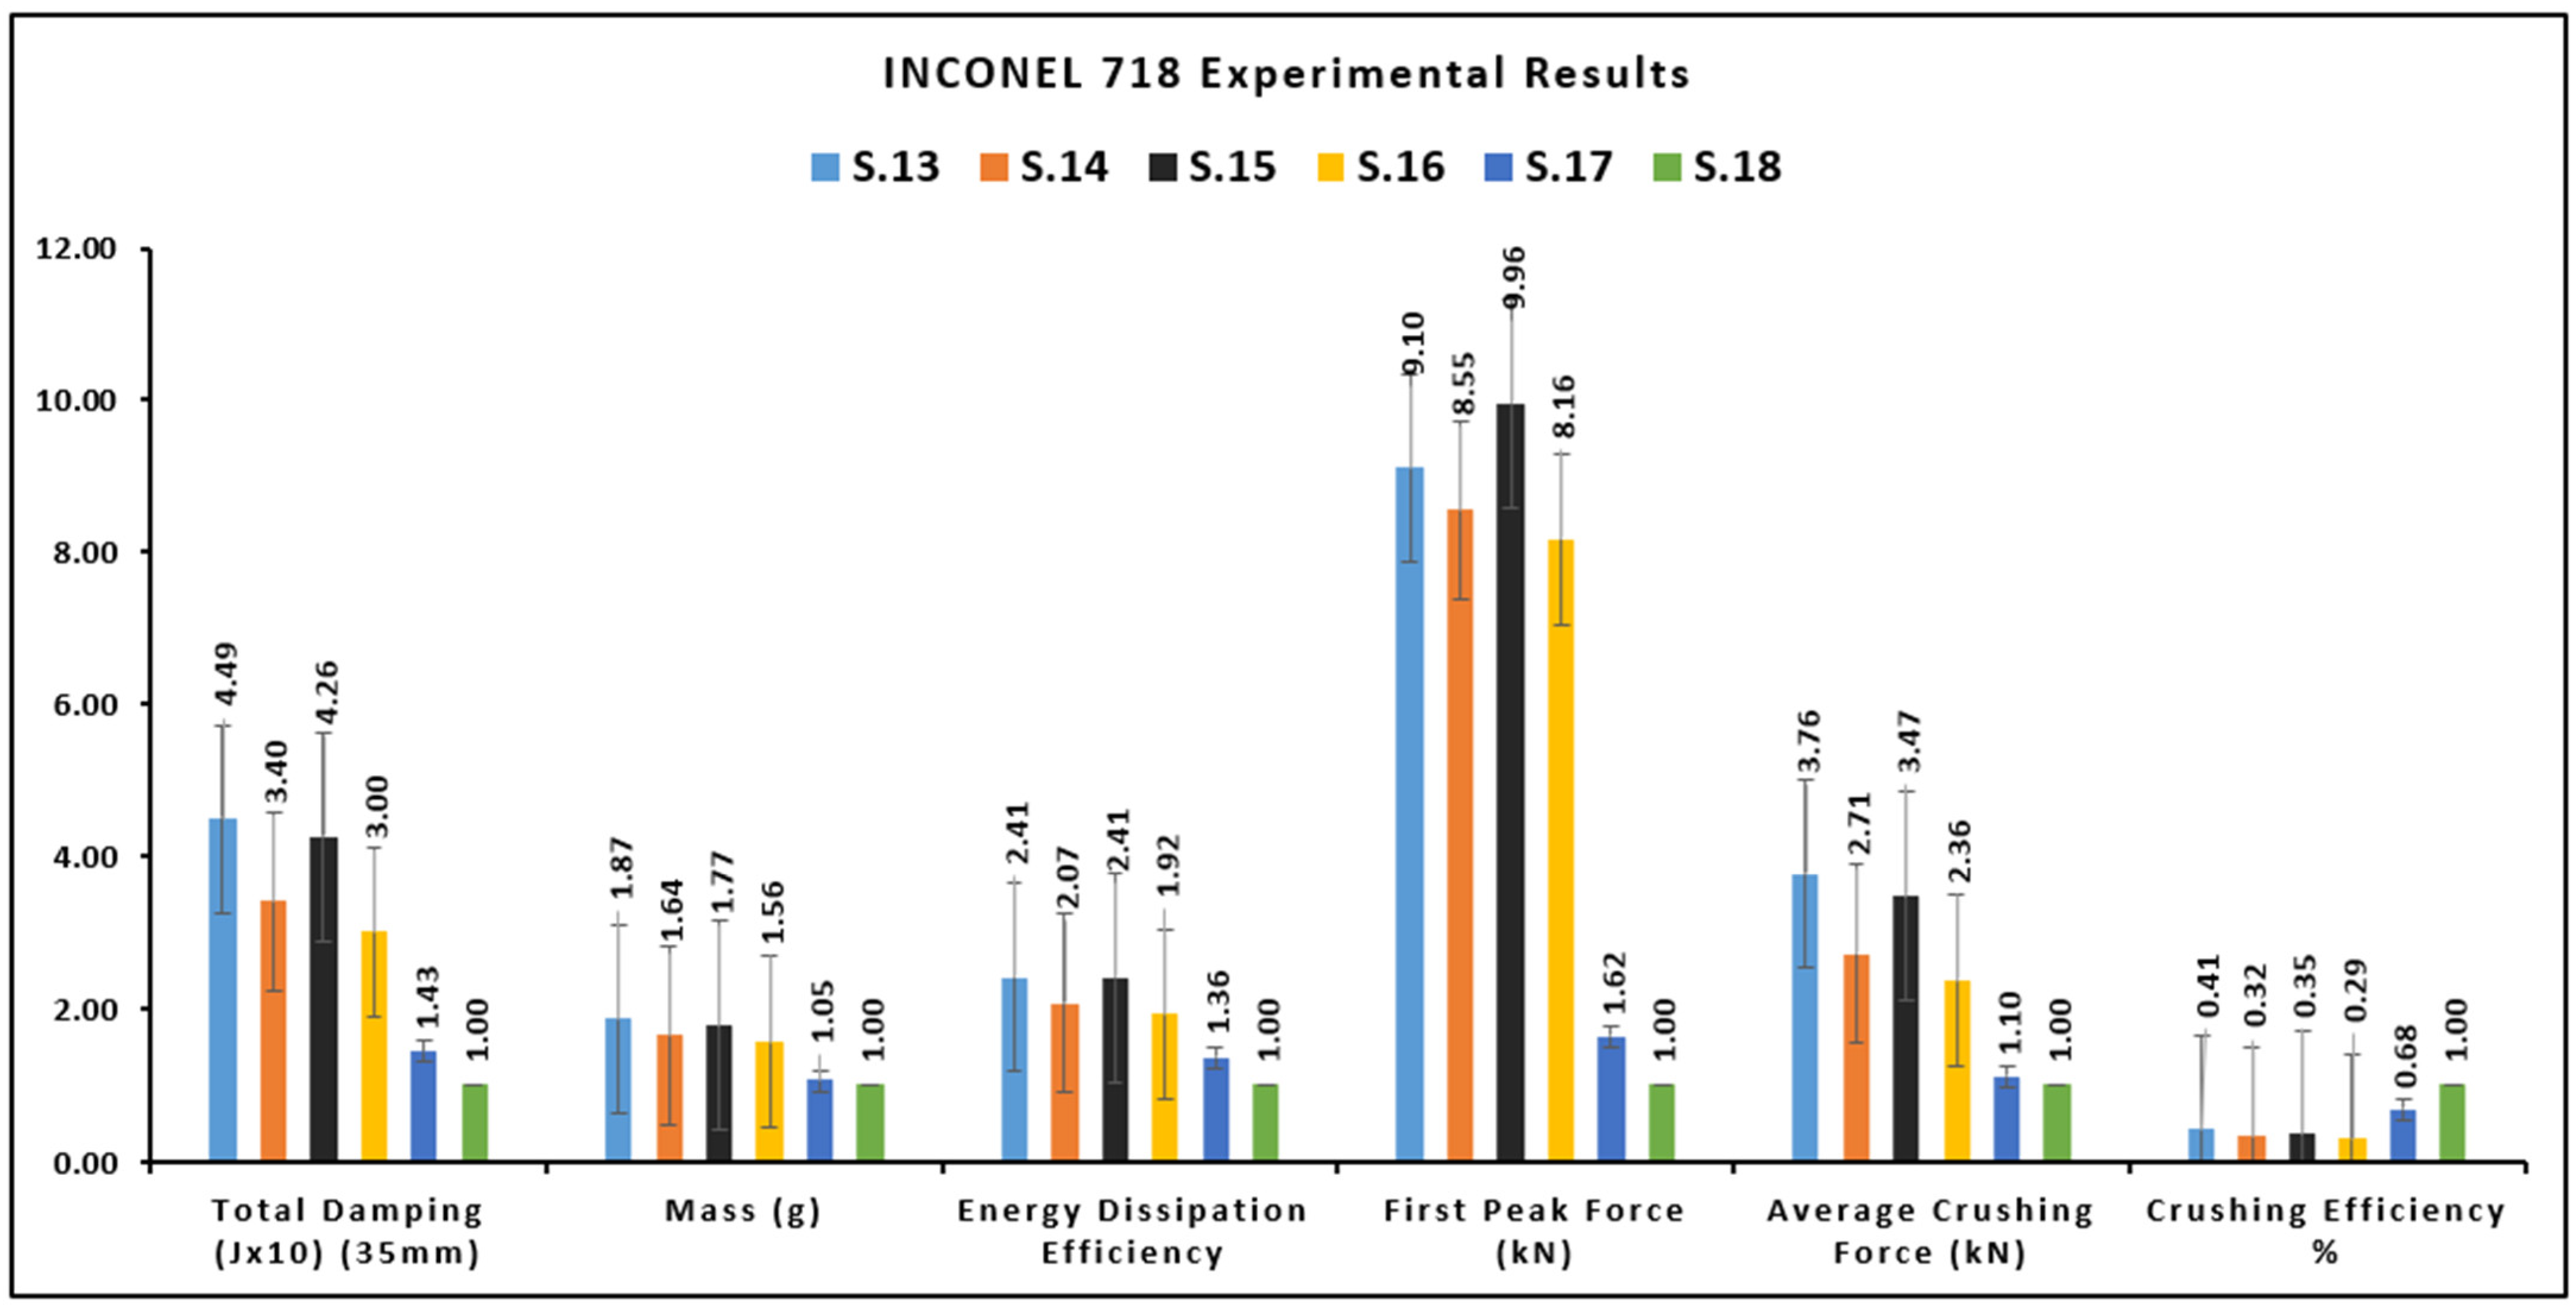
Figure 26 shows the test results for all Inconel 718 powder specimens. When the data are normalized with respect to the square wall structure No. 18, which has the lowest energy absorption performance, it is observed that the hexagonal–hexagonal structure sample No. 13 provides 2.5 times more energy absorption efficiency and 9 times more counterforce in the initial reaction force.

Figure 26.
Experimental results of Inconel 718 group.
5. Conclusions
In this study, 18 different hybrid structures, which are very difficult to fabricate by conventional methods, were fabricated by the selective laser melting (SLM) method. The performance of the fabricated structures under axial load has been analyzed, and their performance against load has been compared. In this study, which was carried out on three different materials, Ti6Al4V, AISI 316L, and Inconel 718 powder materials commonly used in the SLM process, the manufacturing quality of the materials was compared by microstructural analyses, and their mechanical performances were examined under axial load. The performance of hexagonal and square outer shell geometry against axial load was evaluated. The effect of the geometry of the unit cell element forming the cage structure on energy absorption and crushing efficiency was analyzed.
As in this study, the performance of the specimens against load increases with increasing strength. However, this causes an increase in mass, and this design criterion is of high importance in many areas. In terms of design efficiency, maximum strength should be obtained with minimum mass increase. In this study, energy absorption efficiency, which is a mass-dependent variable, is evaluated in this context. Thus, the energy absorption performance of the design is compared independently of the mass.
The resulting data of the 18 specimens constituting the entire test matrix were normalized with respect to the lowest damping performance of specimen 18 in the square-wall structure of Inconel 718 powder.
- When the study was evaluated in terms of production performance, good production was achieved for all powders. Surface defects and dislocations were realized at a minimum level. It is understood that the quality of the samples produced from Ti6Al4V and Inconel 718 powders is better than AISI 316L. Deep cracks formed in the cell joints of AISI 316L material caused lower forces against axial load. With better production quality, the amount of force and energy absorption of AISI 316L materials can be increased.
- In terms of energy absorption and crushing efficiency, hybrid structures performed better than thin-wall structures in all materials. This shows that hybrid structures have a better performance in energy absorption.
- The materials belonging to Ti6Al4V powder generally absorbed more energy than the other samples in terms of energy absorption efficiency due to their low specific gravity. The normalized hexagonal–hexagonal structure No. 1 showed 4.3 times higher energy absorption efficiency.
- According to the normalized values, the hexagonal–hexagonal structures of Ti6Al4V and Inconel 718 materials generated a reaction force up to 10 times higher in terms of the initial peak force.
- One of the most important criteria in the behavior of structures under pressure is the mechanical behavior of the material. For this reason, the specimens produced from AISI 316L material provided better performance than other specimens in terms of crushing performance, thanks to their ductile structure, and showed a regular fracture graph. And it gave up to four times better results in average crushing force.
- In all experimental groups, hexagonal wall geometry showed better performance in terms of energy absorption than square structures. Since hexagonal structures can distribute the load evenly and can do so on more surfaces, they have shown better performances.
- Since the geometry of the cell elements forming the cellular structures is compared in terms of its effect on the strength of the structure, it is determined that the hexagonal structure performs relatively better than the circular structure. Since the diameters of the structures in question are 0.6 mm, the difference is small, but it is obvious that it will create more differences when the structure is enlarged.
- Hybrid structures are very difficult to produce with traditional methods. In terms of production performance, the additive manufacturing method allowed precise and accurate production within tolerances. Dimensional checks with a 3D scanner confirmed that the samples were successfully manufactured within tolerances of ±0.07–0.004 in general.
Author Contributions
Conceptualization, Ö.F.Ç. and M.E.; methodology, M.E.; formal analysis, M.E.; investigation, Ö.F.Ç.; writing—original draft preparation, Ö.F.Ç.; writing—review and editing, M.E.; visualization, M.E.; supervision, M.E.; All authors have read and agreed to the published version of the manuscript.
Funding
This research received no external funding.
Data Availability Statement
Data are contained within the article.
Acknowledgments
This manuscript has been extracted from an MSc dissertation conducted at Kütahya Dumlupınar University. All data, models, and data codes generated or used during the study appear in the published article.
Conflicts of Interest
The authors declare no conflicts of interest.
Abbreviations
The following abbreviations are used in this manuscript:
| ABS | Anti-lock Brake System |
| ESP | Electronic Stability Program |
| ASR | Acceleration Slip Regulation |
| PLA | Polylactic Acid |
| PDMS | Polydimethylsiloxane |
| CAD | Computer Aided Design |
| SLM | Computer Aided Engineering |
| SEM | Scanning Electron Microscopes |
References
- Furlan, A.D.; Kajaks, T.; Tiong, M.; Lavalliere, M.; Campos, J.L.; Babineau, J.; Haghzare, S.; Ma, T.; Vrkljan, B. Advanced vehicle technologies and road safety: A scoping review of the evidence. Accid. Anal. Prev. 2020, 147, 105741. [Google Scholar] [CrossRef]
- Goniewicz, K.; Goniewicz, M.; Pawlowski, W.; Fiedor, P. Road accident rates: Strategies and programmes for improving road traffic safety. Eur. J. Trauma Emerg. Surg. 2016, 42, 433–438. [Google Scholar] [CrossRef] [PubMed]
- Castillo-Manzano, J.I.; Castro-Nuño, M.; Fageda, X. Exploring the relationship between truck load capacity and traffic accidents in the European Union. Transp. Res. Part. E Logist. Transp. Rev. 2016, 88, 94–109. [Google Scholar] [CrossRef]
- Palkovics, L.; Fries, A. Intelligent electronic systems in commercial vehicles for enhanced traffic safety. Veh. Syst. Dyn. 2001, 35, 227–289. [Google Scholar]
- Rahimi, E.; Shamshiripour, A.; Samimi, A.; Mohammadian, A.K. Investigating the injury severity of single-vehicle truck crashes in a developing country. Accid. Anal. Prev. 2020, 137, 105444. [Google Scholar] [CrossRef]
- Trafik Kazaları Özeti. 2025. Available online: https://www.kgm.gov.tr/SiteCollectionDocuments/KGMdocuments/Trafik/TrafikKazalariOzeti2023.pdf (accessed on 28 January 2025).
- Dąbrowski, F.; Grzejszczyk, Z.; Rzymkowski, C.; Wiśniewski, P. Frontal Impact Energy Absorbers for Passenger Cars. Sensors 2024, 24, 6563. [Google Scholar] [CrossRef]
- Achiri, A.T.; Mbue, I.N.; Merlin, A.; Gerard, A. Automobile Crash Investigation Based on Vehicle System Related Causes: Systematic Literature Review. World J. Eng. Technol. 2022, 10, 139–157. [Google Scholar] [CrossRef]
- Lv, X.; Xiao, Z.; Fang, J.; Li, Q.; Lei, F.; Sun, G. On safety design of vehicle for protection of vulnerable road users: A review. Thin-Walled Struct. 2023, 182, 109990. [Google Scholar] [CrossRef]
- Nagai, M. The perspectives of research for enhancing active safety based on advanced control technology. Veh. Syst. Dyn. 2007, 45, 413–431. [Google Scholar] [CrossRef]
- Jeong, E.; Oh, C. Evaluating the effectiveness of active vehicle safety systems. Accid. Anal. Prev. 2017, 100, 85–96. [Google Scholar] [CrossRef]
- Bhutada, S.; Goel, M. Crashworthiness parameters and their improvement using tubes as an energy absorbing structure: An overview. Int. J. Crashworthiness 2022, 27, 1569–1600. [Google Scholar]
- Reddy, P.K.; Thakan, A. A Comprehensive Analysis of the Design and Functionality of Regenerative Shock Absorbers: A Review. In Advances in Manufacturing and Materials: Select Proceedings of FLUTE 2023; Springer Nature: Singapore, 2024; p. 285. [Google Scholar]
- Ahangarnejad, A.H.; Radmehr, A.; Ahmadian, M. A review of vehicle active safety control methods: From antilock brakes to semiautonomy. J. Vib. Control 2021, 27, 1683–1712. [Google Scholar]
- Jarašūniene, A.; Jakubauskas, G. Improvement of road safety using passive and active intelligent vehicle safety systems. Transport 2007, 22, 284–289. [Google Scholar]
- Li, L.; Tian, S.; Zhou, W.; Wang, F. Application of driving simulators in the validation test for vehicle active safety system. Int. J. Crashworthiness 2023, 28, 159–169. [Google Scholar]
- Raith, A.; Sattler, K.; Ertlmeier, R.; Brandmeier, T. Networking and integration of active and passive safety systems. In Proceedings of the 2011 Ninth International Workshop on Intelligent Solutions in Embedded Systems, Regensburg, Germany, 7–8 July 2011; pp. 75–80. [Google Scholar]
- Zhao, Z.; Fan, X. Review of vehicle active safety systems and their coordinated control. Recent Pat. Mech. Eng. 2021, 14, 4–17. [Google Scholar]
- Ferenczi, I.; Helmer, T.; Wimmer, P.; Kates, R. Recent Advances in Effectiveness Analysis and Virtual Design of Integrated Safety Systems. In Proceedings of the 24th International Technical Conference on the Enhanced Safety of Vehicles (ESV), Gothenburg, Sweden, 8–11 June 2015; p. 7. [Google Scholar]
- Gobbi, M.; Haque, I.; Papalambros, P.; Mastinu, G. A critical review of optimization methods for road vehicles design. In Proceedings of the 11th AIAA/ISSMO Multidisciplinary Analysis and Optimization Conference, Portsmouth, VA, USA, 6–8 September 2006; p. 6998. [Google Scholar]
- Udugu, K.; Saddala, V.R.; Lingan, S. Active and Passive Safety: An Overview on Establishing Safety Assessment Standards in India; SAE Technical Paper 2016-28-0244; SAE International: Warrendale, PA, USA, 2016. [Google Scholar]
- Abdullah, N.; Sani, M.; Salwani, M.; Husain, N. A review on crashworthiness studies of crash box structure. Thin-Walled Struct. 2020, 153, 106795. [Google Scholar]
- Doğan, U.Ç. Effect of Strain History on Simulation of Crashworthiness. Master’s Thesis, Middle East Technical University, Ankara, Türkiye, 2009. [Google Scholar]
- Goh, G.D.; Neo, S.J.C.; Dikshit, V.; Yeong, W.Y. Quasi-static indentation and sound-absorbing properties of 3D printed sandwich core panels. J. Sandw. Struct. Mater. 2022, 24, 1206–1225. [Google Scholar]
- Sarvestani, H.Y.; Akbarzadeh, A.; Niknam, H.; Hermenean, K. 3D printed architected polymeric sandwich panels: Energy absorption and structural performance. Compos. Struct. 2018, 200, 886–909. [Google Scholar]
- Zhou, X.; Qu, C.; Luo, Y.; Heise, R.; Bao, G. Compression behavior and impact energy absorption characteristics of 3D printed polymer lattices and their hybrid sandwich structures. J. Mater. Eng. Perform. 2021, 30, 8763–8770. [Google Scholar]
- Wang, S.; Zhang, M.; Wang, Y.; Huang, Z.; Fang, Y. Experimental studies on quasi-static axial crushing of additively-manufactured PLA random honeycomb-filled double circular tubes. Compos. Struct. 2021, 261, 113553. [Google Scholar]
- Zeng, C.; Liu, L.; Bian, W.; Leng, J.; Liu, Y. Compression behavior and energy absorption of 3D printed continuous fiber reinforced composite honeycomb structures with shape memory effects. Addit. Manuf. 2021, 38, 101842. [Google Scholar]
- Chapkin, W.A.; Simone, D.L.; Frank, G.J.; Baur, J.W. Mechanical behavior and energy dissipation of infilled, composite Ti-6Al-4V trusses. Mater. Des. 2021, 203, 109602. [Google Scholar]
- Cetin, E.; Baykasoğlu, C. Energy absorption of thin-walled tubes enhanced by lattice structures. Int. J. Mech. Sci. 2019, 157, 471–484. [Google Scholar]
- Tancogne-Dejean, T.; Spierings, A.B.; Mohr, D. Additively-manufactured metallic micro-lattice materials for high specific energy absorption under static and dynamic loading. Acta Mater. 2016, 116, 14–28. [Google Scholar]
- Hussain, N.N.; Regalla, S.P.; Rao, Y.V.D. Low velocity impact characterization of glass fiber reinforced plastics for application of crash box. Mater. Today Proc. 2017, 4, 3252–3262. [Google Scholar]
- Tripathy, L.; Lu, W.F. Evaluation of axially-crushed cellular truss structures for crashworthiness. Int. J. Crashworthiness 2018, 23, 680–696. [Google Scholar]
- Ma, Q.; Rejab, M.; Kumar, A.P.; Fu, H.; Kumar, N.M.; Tang, J. Effect of infill pattern, density and material type of 3D printed cubic structure under quasi-static loading. Proc. Inst. Mech. Eng. Part. C J. Mech. Eng. Sci. 2021, 235, 4254–4272. [Google Scholar]
- Tao, C.; Zhou, X.; Liu, Z.; Liang, X.; Zhou, W.; Li, H. Crashworthiness Study of 3D Printed Lattice Reinforced Thin-Walled Tube Hybrid Structures. Materials 2023, 16, 1871. [Google Scholar] [CrossRef]
- Yeşiloğlu, R. Eklemeli İmalat İle Üretilen Farklı Dolgu Geometrisi ve Yoğunluğa Sahip PLA Esaslı Yapıların Mekanik Davranışlarının Deneysel Olarak Araştırılması. Master’s Thesis, Karabük Üniversitesi, Ankara, Türkiye, 2022. [Google Scholar]
- Solmaz, M.; Çelik, E. Investigation of compression test performances of honeycomb sandwich composites produced by 3d printing method. Sci. Eng. J. Firat Univ. 2018, 30, 277–286. [Google Scholar]
- Bourell, D.; Kruth, J.P.; Leu, M.; Levy, G.; Rosen, D.; Beese, A.M.; Clare, A. Materials for additive manufacturing. CIRP Ann. 2017, 66, 659–681. [Google Scholar]
- Laleh, M.; Sadeghi, E.; Revilla, R.I.; Chao, Q.; Haghdadi, N.; Hughes, A.E.; Xu, W.; De Graeve, I.; Qian, M.; Gibson, I. Heat treatment for metal additive manufacturing. Prog. Mater. Sci. 2023, 133, 101051. [Google Scholar] [CrossRef]
- Chituc, C.-M. XML interoperability standards for seamless communication: An analysis of industry-neutral and domain-specific initiatives. Comput. Ind. 2017, 92, 118–136. [Google Scholar]
- Sun, C.; Wang, Y.; McMurtrey, M.D.; Jerred, N.D.; Liou, F.; Li, J. Additive manufacturing for energy: A review. Appl. Energy 2021, 282, 116041. [Google Scholar] [CrossRef]
- Yalçın, B.; Ergene, B. Endüstride yeni eğilim olan 3-D eklemeli imalat yöntemi ve metalurjisi. Uluslararası Teknol. Bilim. Derg. 2017, 9, 65–88. [Google Scholar]
- Singh, S.; Ramakrishna, S.; Singh, R. Material issues in additive manufacturing: A review. J. Manuf. Process. 2017, 25, 185–200. [Google Scholar] [CrossRef]
- Strano, G.; Hao, L.; Everson, R.M.; Evans, K.E. Surface roughness analysis, modelling and prediction in selective laser melting. J. Mater. Process. Technol. 2013, 213, 589–597. [Google Scholar] [CrossRef]
- Karakilinç, U.; Yalçın, B.; Ergene, B. Toz Yataklı/Beslemeli Eklemeli İmalatta Kullanılan Partiküllerin Uygunluk Araştırması ve Partikül İmalat Yöntemleri. Politek. Derg. 2019, 22, 801–810. [Google Scholar] [CrossRef]
- ASTM B214-16; Standard Test Method for Sieve Analysis of Metal Powders. ASTM International: West Conshohocken, PA, USA, 2016.
- ASTM Standard B822-20; Standard Test Method for Particle Size Distribution of Metal Powders and Related Compounds by Light Scattering. ASTM International: West Conshohocken, PA, USA, 2020.
- ASTM Standard E8E8M-22; Test Methods for Tension Testing of Metallic Materials. ASTM International: West Conshohocken, PA, USA, 2022.
- ISO 3369:2006; Impermeable Sintered Metal Materials and Hardmetals—Determination of Density. International Organization for Standardization: Geneva, Switzerland, 2006.
- Duman, B.; Kayacan, M.C. Doğrudan metal lazer sinterleme/ergitme yöntemi ile imal edilecek parçanın mekanik özelliklerinin tahmini. Tek. Bilim. Derg. 2017, 7, 12–28. [Google Scholar]


Disclaimer/Publisher’s Note: The statements, opinions and data contained in all publications are solely those of the individual author(s) and contributor(s) and not of MDPI and/or the editor(s). MDPI and/or the editor(s) disclaim responsibility for any injury to people or property resulting from any ideas, methods, instructions or products referred to in the content. |
© 2025 by the authors. Licensee MDPI, Basel, Switzerland. This article is an open access article distributed under the terms and conditions of the Creative Commons Attribution (CC BY) license (https://creativecommons.org/licenses/by/4.0/).