Abstract
Extended operation in complex environments characterized by high temperatures, pressures, and hydrogen exposure can lead to performance degradation for S32168 stainless steel welds of hydrogenation reactors, which significantly impacts the reliability of hydrogenation reactors. The impact of the grinding process on the grinding temperature and force of S32168 steel welds is studied in this paper based on the W-M fractal dimension. A multi-grain grinding simulation model was built, and grinding experiments were conducted. The results show that the grinding speed and depth increased as the grinding temperature increased. At a speed of 20 m/s and depth of 15 μm, the temperature peaked at 1073 °C. Increasing the grinding depth increased both the temperature and force, while increasing the speed increased the temperature but reduced the force. When the depth was 15 μm and speed was 20 m/s, the maximum temperature was 939.1 °C. At a 15 μm depth and 10 m/s speed, the normal and tangential grinding forces peaked at 11.68 N and 9.33 N, respectively. When the depth was 5 μm and the speed was 20 m/s, the grinding forces were the lowest with normal and tangential forces of 0.93 N and 1.72 N, respectively. Comparing the simulated and experimental temperature results through nine sets of experiments, the error range was 6.97–14.2% with an average of 9.37%. The simulation model effectively simulated the grinding process.
1. Introduction
Due to the swift advancement of hydrogen energy technology, hydrogen is widely used in various fields, which has caused an increase in the demand for hydrogen, meaning that reactors that produce hydrogen are widely used. S32168 stainless steel has excellent corrosion resistance and stable high-temperature mechanical properties, so it is often used as the inner wall material of hydrogen reactors. However, S32168 stainless steel welds leave microcracks and other defects on the surface, and the high-temperature and high-pressure extreme conditions in the reactor can lead to crack expansion in the weld area. The surface defects of the weld are prone to hydrogen corrosion, hydrogen embrittlement cracking, and other phenomena under hydrogen-exposed conditions, leading to the deterioration of the performance of the weld area, thus impacting the safety of the hydrogen reactor during its working process. Therefore, the grinding process of the surface of S32168 stainless steel weld material plays a crucial role in the hydrogen reactor manufacturing process, which is conducive to improving the wear resistance and compressive properties of the container and enhancing the stability of its overall structure [1].
The simulation analysis of grinding wheel grinding must take into account the effect of abrasive grain characteristics in the workpiece’s grinding surface. A crucial step in the simulation of this grinding process is the development of a model for the surface topography of the grinding wheel. Researchers both domestically and internationally have conducted extensive studies in this area. Some scholars have developed a three-dimensional representation of the surface morphology of the grinding wheel using actual measurement data. This model facilitates the analysis of abrasive grains and the wheel’s movement mechanisms, enabling further exploration of the grinding process. Additionally, relevant experiments have been conducted to validate the established model.
Liu et al. [2] observed the surface appearance of the grinding wheel using a microscope and constructed a model of a truncated octahedral abrasive grinding wheel randomly distributed in space based on the observation. Zhao et al. [3] utilized the method of normal random functions to create a grinding wheel model that incorporates virtual polyhedral abrasive grains. This was achieved by meticulously measuring the surface topography of the grinding wheel and the surface appearance of the workpiece, which served as a preparation for grinding simulations. Chen et al. [4] proposed a numerical generation method for the grinding wheel morphology considering parameters such as the diameter and the spacing of abrasive grains. Chen et al. [5] created a simulation model to analyze the surface morphology of grinding wheels, investigating how various grinding process parameters and wheel dressing techniques influence the grinding effectiveness. They conducted relevant grinding tests and validated the efficacy of the established model by comparing the experimental results with the simulation outcomes. Koshy et al. [6] employed stochastic simulation techniques to model the surface topography of diamond grinding wheels. Their approach considered various factors, including the size and concentration of abrasive grains. Through their analysis, they successfully derived important results, such as the abrasive grain spacing distribution and the percentage of the projected area of abrasive grains relative to the cutting edge. Hou et al. [7] developed a model for the surface of a grinding wheel, which was defined by the normal distribution of the positions of the abrasive grits. They then examined several key parameters, including the minimum diameter of the dynamically effective abrasive particles and the efficiency of material removal during the grinding process at a predetermined depth of cut. Xiao et al. [8] built a simulation model that incorporated the actual morphological features of the grinding wheel. This model was used to study the influence of the grain sizes on the movement of the grain and the thickness of the chips. Gao et al. [9] built a three-dimensional thermal analysis model to study the relationship between grinding wheel geometry, material removal characteristics, and grinding temperature in the grinding area. Wu et al. [10] built a simulation model that considers the size and distribution of abrasive grains in the grinding wheel to improve the precision of grinding force predictions. Additionally, they conducted nanoindentation and tribological experiments to evaluate the micromechanical characteristics of both the abrasive grains and the workpiece. The accuracy of the built model was validated. Zhang et al. [11] built a model for multi-grain grinding wheels and simulated the grinding process of carbide workpieces. They predicted the grinding forces involved and validated their predictions through experiments. Li et al. [12] built a grinding force model specifically designed for reaction-bonded silicon carbide ceramics. This model takes into account different grinding conditions and the random distribution of wheel geometries. Liu et al. [13] built a thermomechanical coupled multi-grain grinding finite element simulation model based on the Johnson–Cook constitutive equation, and they used it to analyze the grinding process of curved bevel gears. The simulations revealed that the built model facilitates the analysis of the temperature distribution on the tooth surface and the difference in grit wear under various working conditions. The simulation results were validated through experimental testing. Zhao et al. [14] built a simulation model based on current research findings and investigated the influence of the grinding wheel morphology on grinding force, grinding temperature and material removal rate. The simulation revealed that the temperature error between the results derived from the simulation, which incorporated the grinding wheel surface morphology, and the experimental results were relatively small. Liu et al. [15,16] built a three-dimensional rough surface based on the W-M fractal dimension. Utilizing the ABAQUS finite element software’s UMESHMOTION user subroutine, they built a numerical model of torsional micro-movement under the conditions of a three-dimensional rough sphere. They studied the influence of initial surface roughness on the friction and wear process during torsional micro-movement and validated the accuracy and effectiveness of the numerical model in predicting wear resulting from torsional micro-movement. Wang et al. [17] built a three-dimensional transient sliding contact model based on the W-M fractal dimension, considering the thermal coupling of mutual mechanical interactions and friction. By using ABAQUS software, they simulated the friction characteristics of the mechanical seal friction pair under dry operating conditions. Qin et al. [18] used the W-M function to construct rough contact surfaces and built a finite element model for the planar cylindrical structure for experimental research, they studied the effect of surface roughness on the temperature rise distribution during the steel-to-steel contact friction process.
Numerous scholars have conducted comprehensive simulations and experiments to explore the influence of different process factors, including the grinding speed and grinding depth on the grinding temperature and grinding force throughout the grinding process.
Wang et al. [19] utilized Deform-3D software to analyze the process of machining GH4169 alloy by using single cubic boron nitride abrasive grain. They studied the influence of the grinding depth on the grinding temperature, grinding force, and the residual stresses produced during the grinding process. Jun et al. [20] built a new CBN grinding wheel simulation model based on the findings of Ding et al. [21] regarding the surface morphology of real grinding wheels, and they conducted simulations by using Deform-3D simulation software to analyze the influence of the grinding parameters on grinding force during the profile grinding process of turbine disks. Yin et al. [22] conducted grinding experiments using the SG and CBN grinding wheels to investigate the influence of the grinding parameters on the surface integrity of high-strength steel during the grinding process. Paknejad et al. [23] utilized an infrared camera to assess the distribution of grinding temperature and analyzed the influence of grinding speed and grinding depth on the maximum temperature in the grinding zone. Cheng [24] studied the grinding process of high-temperature alloys using single abrasive grain, and they found that within a specified grinding depth, there is an inverse relationship between the grinding force and the grinding speed. Han et al. [25] built a finite element model for the temperature field of high-temperature alloy grinding processing based on the parameters of the grinding wheel. They verified the processing quality by analyzing the surface morphology and investigated the effects of grinding depth, workpiece speed, and other parameters on the grinding temperature. Shi et al. [26] conducted grinding force experiments using a white corundum wheel to address the issues related to grinding burns and cracks in the carbonitriding layer of 16Cr3NiWMoVNbE steel. The experimental results demonstrated that the grinding force increased with both the cutting depth and workpiece feeding rate, while it decreased with the increase in the grinding wheel speed. Anderson et al. [27] conducted scribing experiments on AISI 4340 steel using custom-made spherical abrasive grains with a radius of 0.508 mm to investigate the influence of grinding speed on both the grinding force and the material property changes. Wan et al. [28] conducted high-speed grinding experiments, demonstrating that increased grinding depth elevated grinding temperatures, resulting in more severe grinding burn. Esmaeilt et al. [29] conducted the evaluation of the grinding speed and grinding depth to determine the influence on the grinding force and grinding temperature. The study identified the optimal grinding parameters through experimental results. Jiang et al. [30] studied the influence of grinding parameters on grinding temperature and related phenomena by conducting the single-grain grinding simulation and experiments.
In current research, the randomness in the shape, size, and distribution of the abrasive grains in grinding wheels makes the grinding process complex, which, consequently, makes it difficult to observe and analyze the grinding process from the experimental perspective. Most researchers study the influence of grinding parameters on grinding forces, grinding temperatures, and other related factors during the grinding process by conducting single abrasive grain grinding simulation or experiments, while there are few studies that focus on the influence of the surface morphology and structure of the grinding wheel. The grinding process of a grinding wheel is a multi-abrasive grain grinding process; in order to simulate and analyze the actual grinding process effectively, it is an effective method to construct a randomly distributed rough surface to simulate the distribution of abrasive grains in the grinding wheels. The W-M fractal dimension is characterized by its self-similarity and continuity, which could effectively generate the randomly distributed abrasive grains on the surface of the grinding wheel. Therefore, a grinding wheel model was built based on the W-M fractal dimension theory, which accurately represents the actual surface roughness of the grinding wheel. Moreover, the simulation and experiments were conducted to study the influence of the grinding parameters on the grinding temperature and grinding force during the multi-particle grinding process, which provides a new method for grinding theory research.
2. Multi-Grit Grinding Simulation Modeling
2.1. Simulation Material Parameters
The Johnson-Cook (J-C) model is adopted in this paper due to its high accuracy and versatility across various metallic materials [31]:
where is the constant force (MPa), is the equivalence effect, is the dimensionless equivalent plastic strain rate, A is the material’s yield strength under quasi-static tensile testing at room temperature (MPa), B is the strain-hardening coefficient of the material under quasi-static tensile testing at room temperature (MPa), n is the strain hardening index for materials subjected to quasi-static tensile conditions at room temperature, C is the strain rate sensitivity coefficient measured in tensile tests for various tensile conditions at room temperature, T is the material temperature at high-temperature stretching (°C), Tm is the material melting temperature (°C), Tr is the reference temperature (°C), and m is the temperature-softening coefficients for quasi-static tensile conditions across different temperatures.
The Johnson–Cook failure criterion is expressed by the following equation:
where is the equivalent plastic failure strain, D1 is the fracture failure strain during tensile fracture in notched tensile tests, D2 and D3 introduce the relationship between the equivalent stress and equivalent strain, D4 is the strain rate-sensitive parameters, D5 is the temperature-sensitive parameters, and is the stress triaxiality of a plate member.
The data in the tables of this paper come from our previous research [32]. The J-C failure model and constitutive model parameters of S32168 stainless steel welding material were derived from tensile tests conducted for use in the simulation. The specific parameters are shown in Table 1 and Table 2 [32]. The tensile tests were conducted according to the test standard “Tensile Test of Metallic Materials Part 1: Room Temperature Test Methods” (ISO 6892-1: 2009) [33] and “Destructive Test on Welds in Metallic Materials-Fracture test” (ISO 9017: 2017) [34].

Table 1.
J-C failure model parameters for S32168 stainless steel welds.
Table 2.
J-C model parameters for S32168 steel welds.
Jmatpro 7.0 software was used to calculate the specific heat capacity, thermal conductivity, thermal conductivity, modulus of elasticity and thermal expansion of S32168 stainless steel weld in the temperature range of 20–1500 °C and other thermal performance parameters. The thermodynamic performance parameters are shown in Table 3 [32].
Table 3.
Workpiece material thermodynamic performance parameters.
The grinding wheel material used in the simulation is the white corundum. Table 4 shows the mechanical property parameters of the white corundum [32].
Table 4.
Mechanical property parameters of white corundum.
2.2. Establishment of Grinding Model of Multi-Particle Grinding Wheel
Due to the irregular distribution of abrasive grains attached to the surface of the grinding wheel, it is difficult to directly model the surface of the grinding wheel. In this paper, the surface roughness of the grinding wheel was detected by using the 3D morphometry, and a model surface of the wheel was built, which possesses the same roughness characteristics as the actual wheel surface by using the W-M fractal dimension model. The fractal dimension of the W-M model’s expression is as follows:
where Cn is the scale dimension, which is a random number that follows a normal distribution with a mean of 0 and a variance of 1, An and Bn are random numbers independent of each other that obey the uniform distribution on [0, 2π], Ds is the theoretical fractal dimension 2 < Ds < 3; is a characteristic parameter, which is a constant greater than 1, usually taken as 1.5; and n is a natural sequence number.
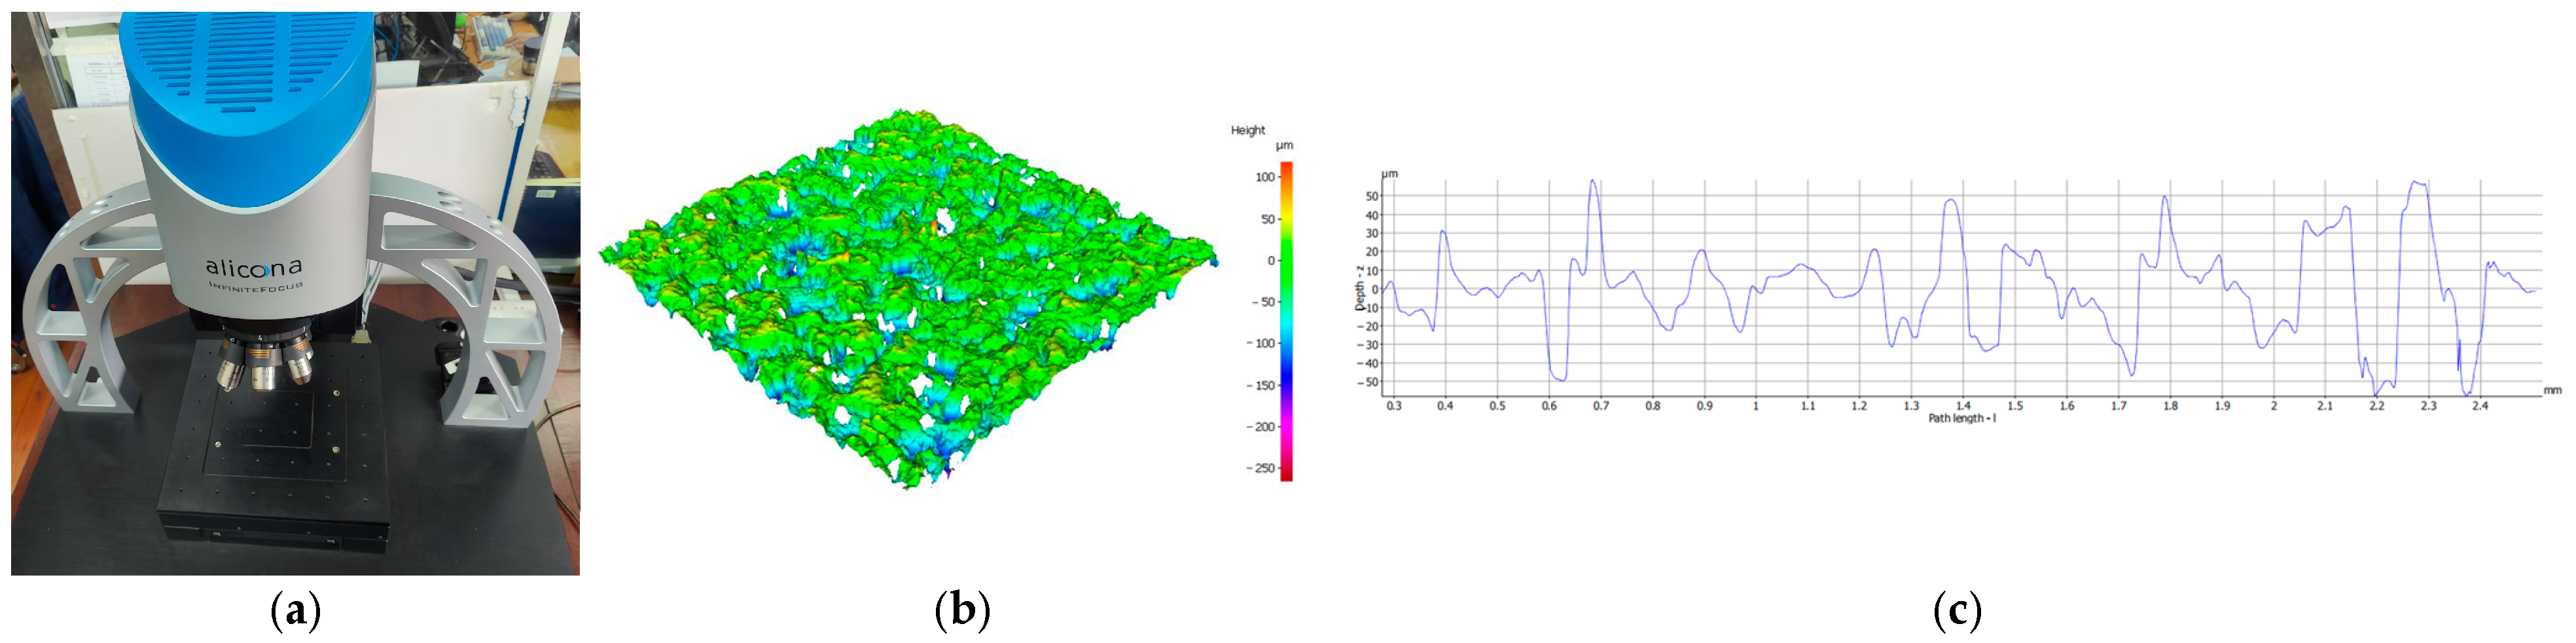
The surface roughness of the grinding wheel was measured by using the three-dimensional morphometry, and the detection device is illustrated in Figure 1a. Due to the uniformity in the overall size and distribution of the abrasive grains of the grinding wheel, the measurements were carried out on the side of the grinding wheel. The surface morphology of the grinding wheel obtained from the measurements is shown in Figure 1b. Based on the surface roughness measurements, the grinding wheel exhibits a surface roughness of Ra 11.7 μm, and the measurement result is shown in Figure 1c. The random spline curve was generated by varying the fractal dimension and the scale dimension during the building process of the fractal surface of the grinding wheel. When the scale dimension is set to 0.04, the surface roughness of the spline curve is Ra 11.7 µm, which matches the surface roughness of the grinding wheel. The generated spline curves are converted into a 3D solid model with a specific surface roughness by using SolidWorks 2018 software. Ultimately, the generated rough surface 3D solid model was imported into the finite element simulation software and converted into the finite element simulation model.

Figure 1.
Test equipment and test results: (a) three-dimensional profilometer; (b) three-dimensional topographic map; (c) grinding wheel 2D topography.
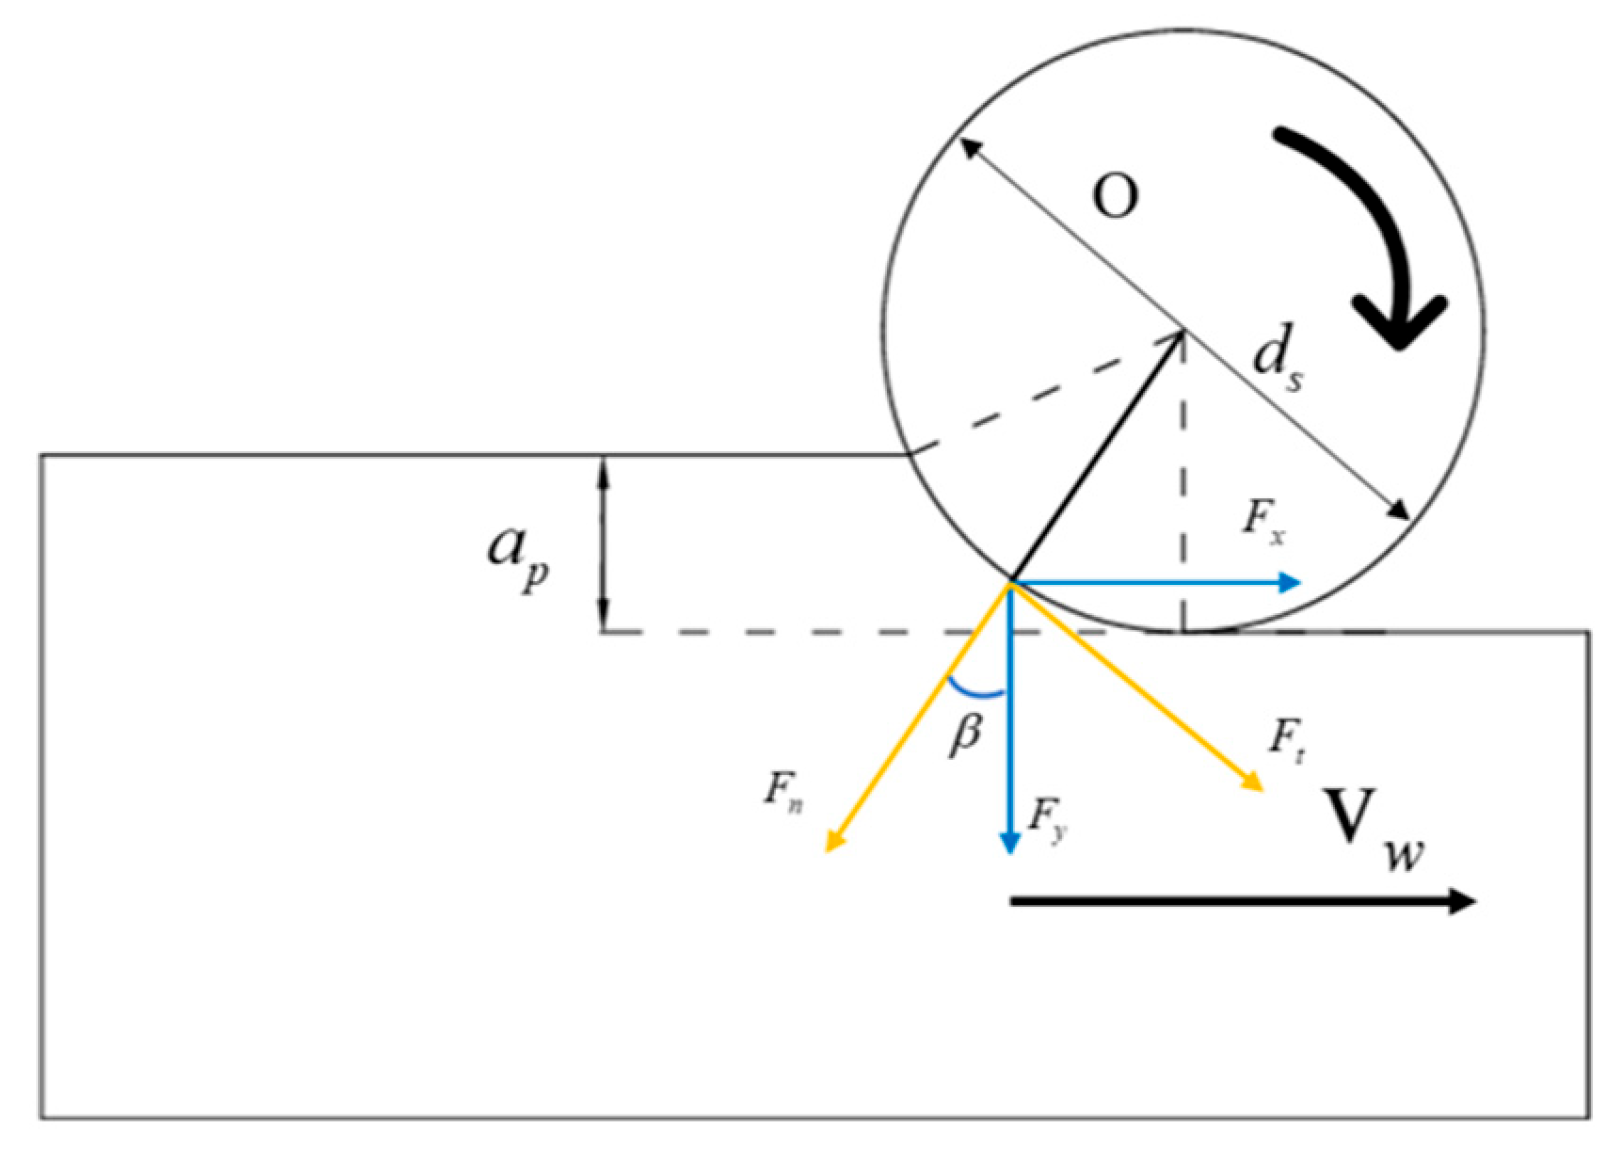
Figure 2 illustrates the schematic diagram of the grinding process for the grinding wheel. The grinding force is primarily generated by the friction between the grinding wheel and the workpiece material during the grinding process. The grinding force is divided into three main components: the tangential force (Ft), the normal force (Fn), and the axial force (Fa). The axial force is well constrained during the grinding process and exhibits good stability, resulting in relatively small variations in the axial grinding force. Therefore, the grinding force is primarily influenced by the tangential force (Ft) and the normal force (Fn) during the grinding process. Based on the kinematic relationship, the simplified grinding simulation model is illustrated in Figure 3a. Fy is the vertical grinding force; Fx is the horizontal grinding force; β is the angle between the normal grinding force and the vertical grinding force; ds is the diameter of the grinding wheel; ap is the grinding depth of the grinding wheel. Meanwhile, to ensure the validity of the precision, the grinding wheel’s arc lengths at different grinding depths are calculated based on the theory of the grinding process. The calculation is performed using the formula for the grinding arc length:
where L is the arc length of single-abrasive grain (mm), D is the grinding wheel’s diameter, and ap is the grinding depth (μm).
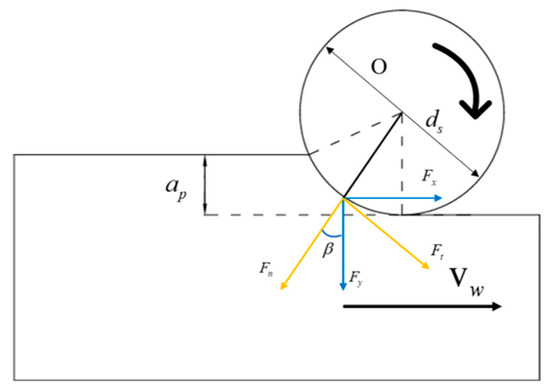
Figure 2.
Schematic diagram of the grinding process of the grinding wheel.
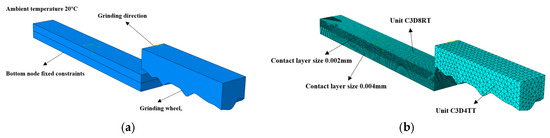
Figure 3.
Build multi-abrasive grain simulation: (a) multi-abrasive grain simulation load constraint; (b) multi-abrasive grain simulation mesh partitioning.
The grinding distances under different grinding depths were calculated based on Equation (4), and the specimen models matching different grinding depths were built based on the calculated distances. The size of the built multi-abrasive grain model was 1 mm × 0.125 mm × 0.1 mm, and the dimensions of the corresponding specimens were 0.948 mm × 0.2 mm × 0.08 mm, 1.34 mm × 0.2 mm × 0.08 mm, and 1.64 mm × 0.2 mm × 0.08 mm when the grinding depths were 5 μm, 10 μm, and 15 μm.
In the built multi-abrasive grain grinding simulation model, the multi-abrasive grain model was set as a rigid body. The interaction between the multi-abrasive grain model and the workpiece was defined as “face-to-face” contact configuration; meanwhile, the specimen model was also configured as generalized contact. During the grinding simulation process, due to the ratio of the grinding wheel rotational speed and the workpiece feed speed exceeding 2000, the influence of horizontal feed speed on the simulated grinding temperature could be ignored during the grinding process. Consequently, the bottom of the specimen model was fully fixed, as shown in Figure 3a. During the grinding process, the multi-abrasive grain model was set to grind the surface with grinding depths of 5 μm, 10 μm, and 15 μm and the grinding speeds of 10 m/s, 15 m/s, and 20 m/s, respectively.
To enhance the accuracy of the simulation results for abrasive grain grinding, a hierarchical mesh refinement was applied along the depth direction of the specimen. Specifically, the mesh size in the contact region of the specimen was set to 0.002 mm, while the mesh size in the non-contact region was 0.004 mm. The C3D8RT mesh type was adopted by both regions. Similarly, the mesh type C3D8RT was also adopted by the grinding wheel model with a mesh size of 0.02 mm, and the mesh partitioning effect is illustrated in Figure 3b.
3. Multi-Abrasive Grain Simulation Analysis
3.1. Analysis of the Effect of the Grinding Process on the Variation in Grinding Temperature
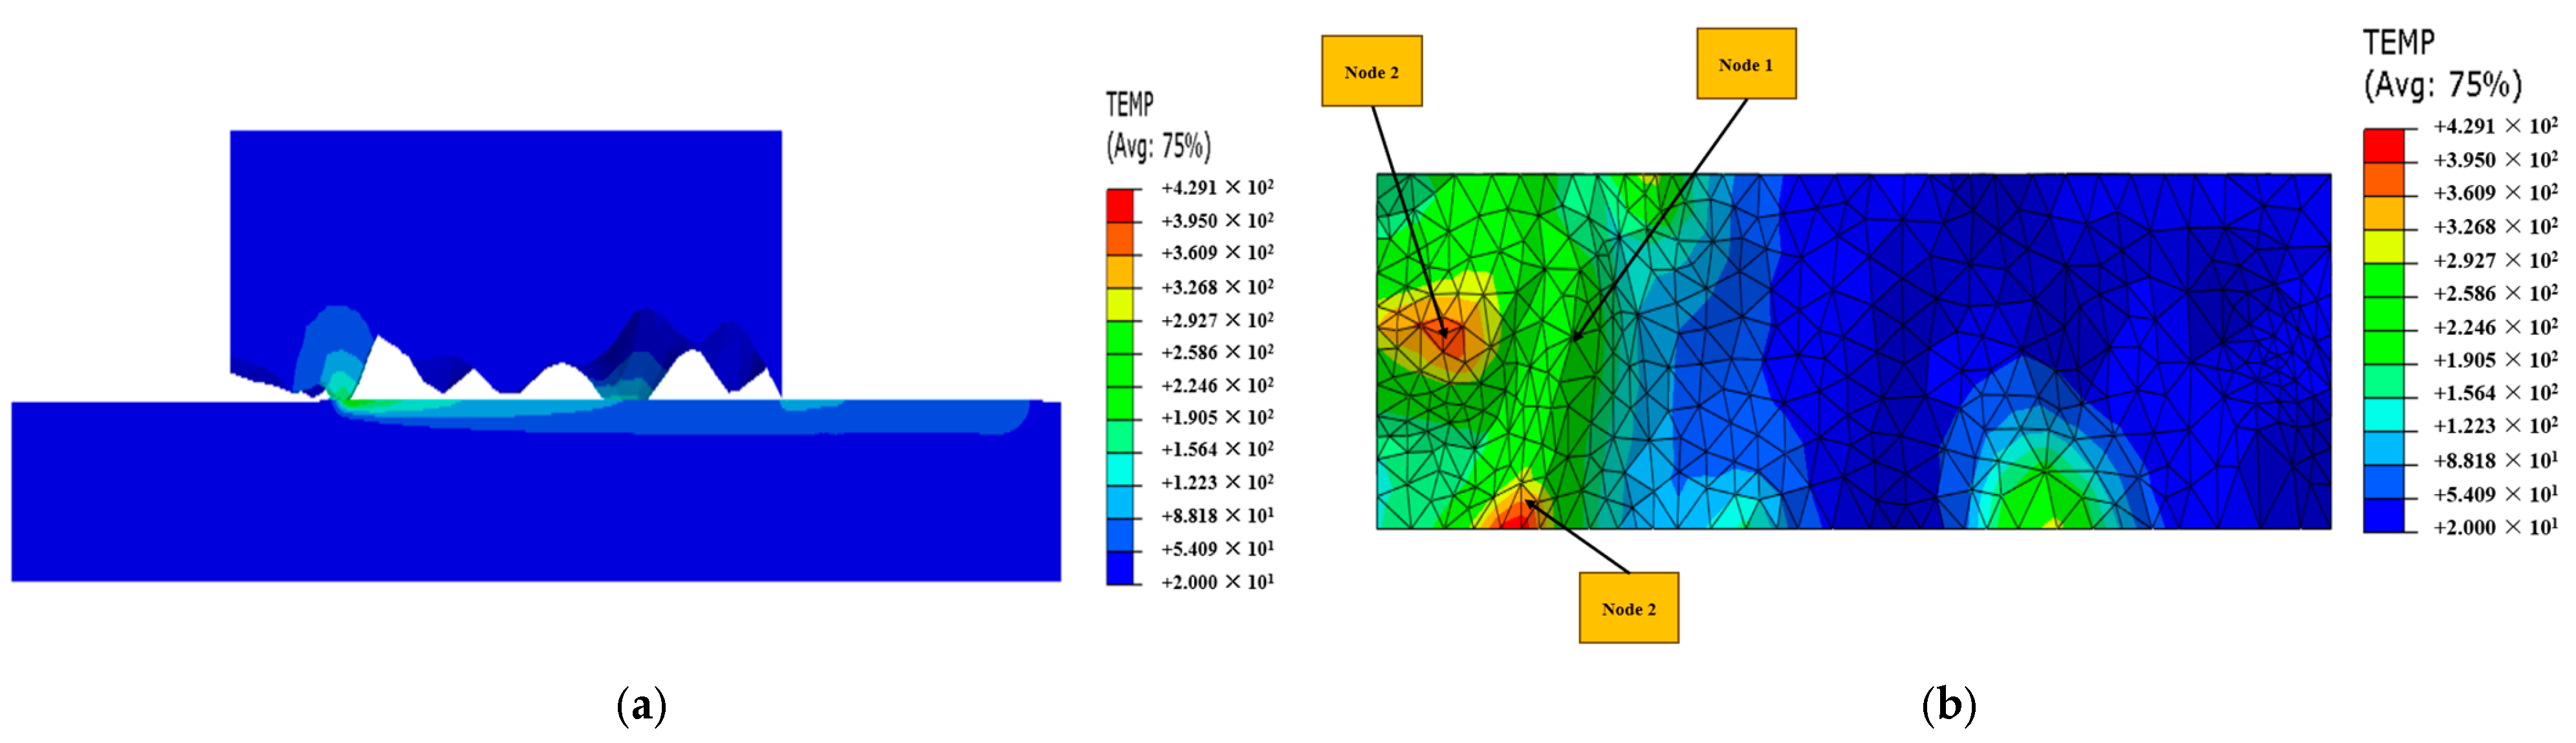
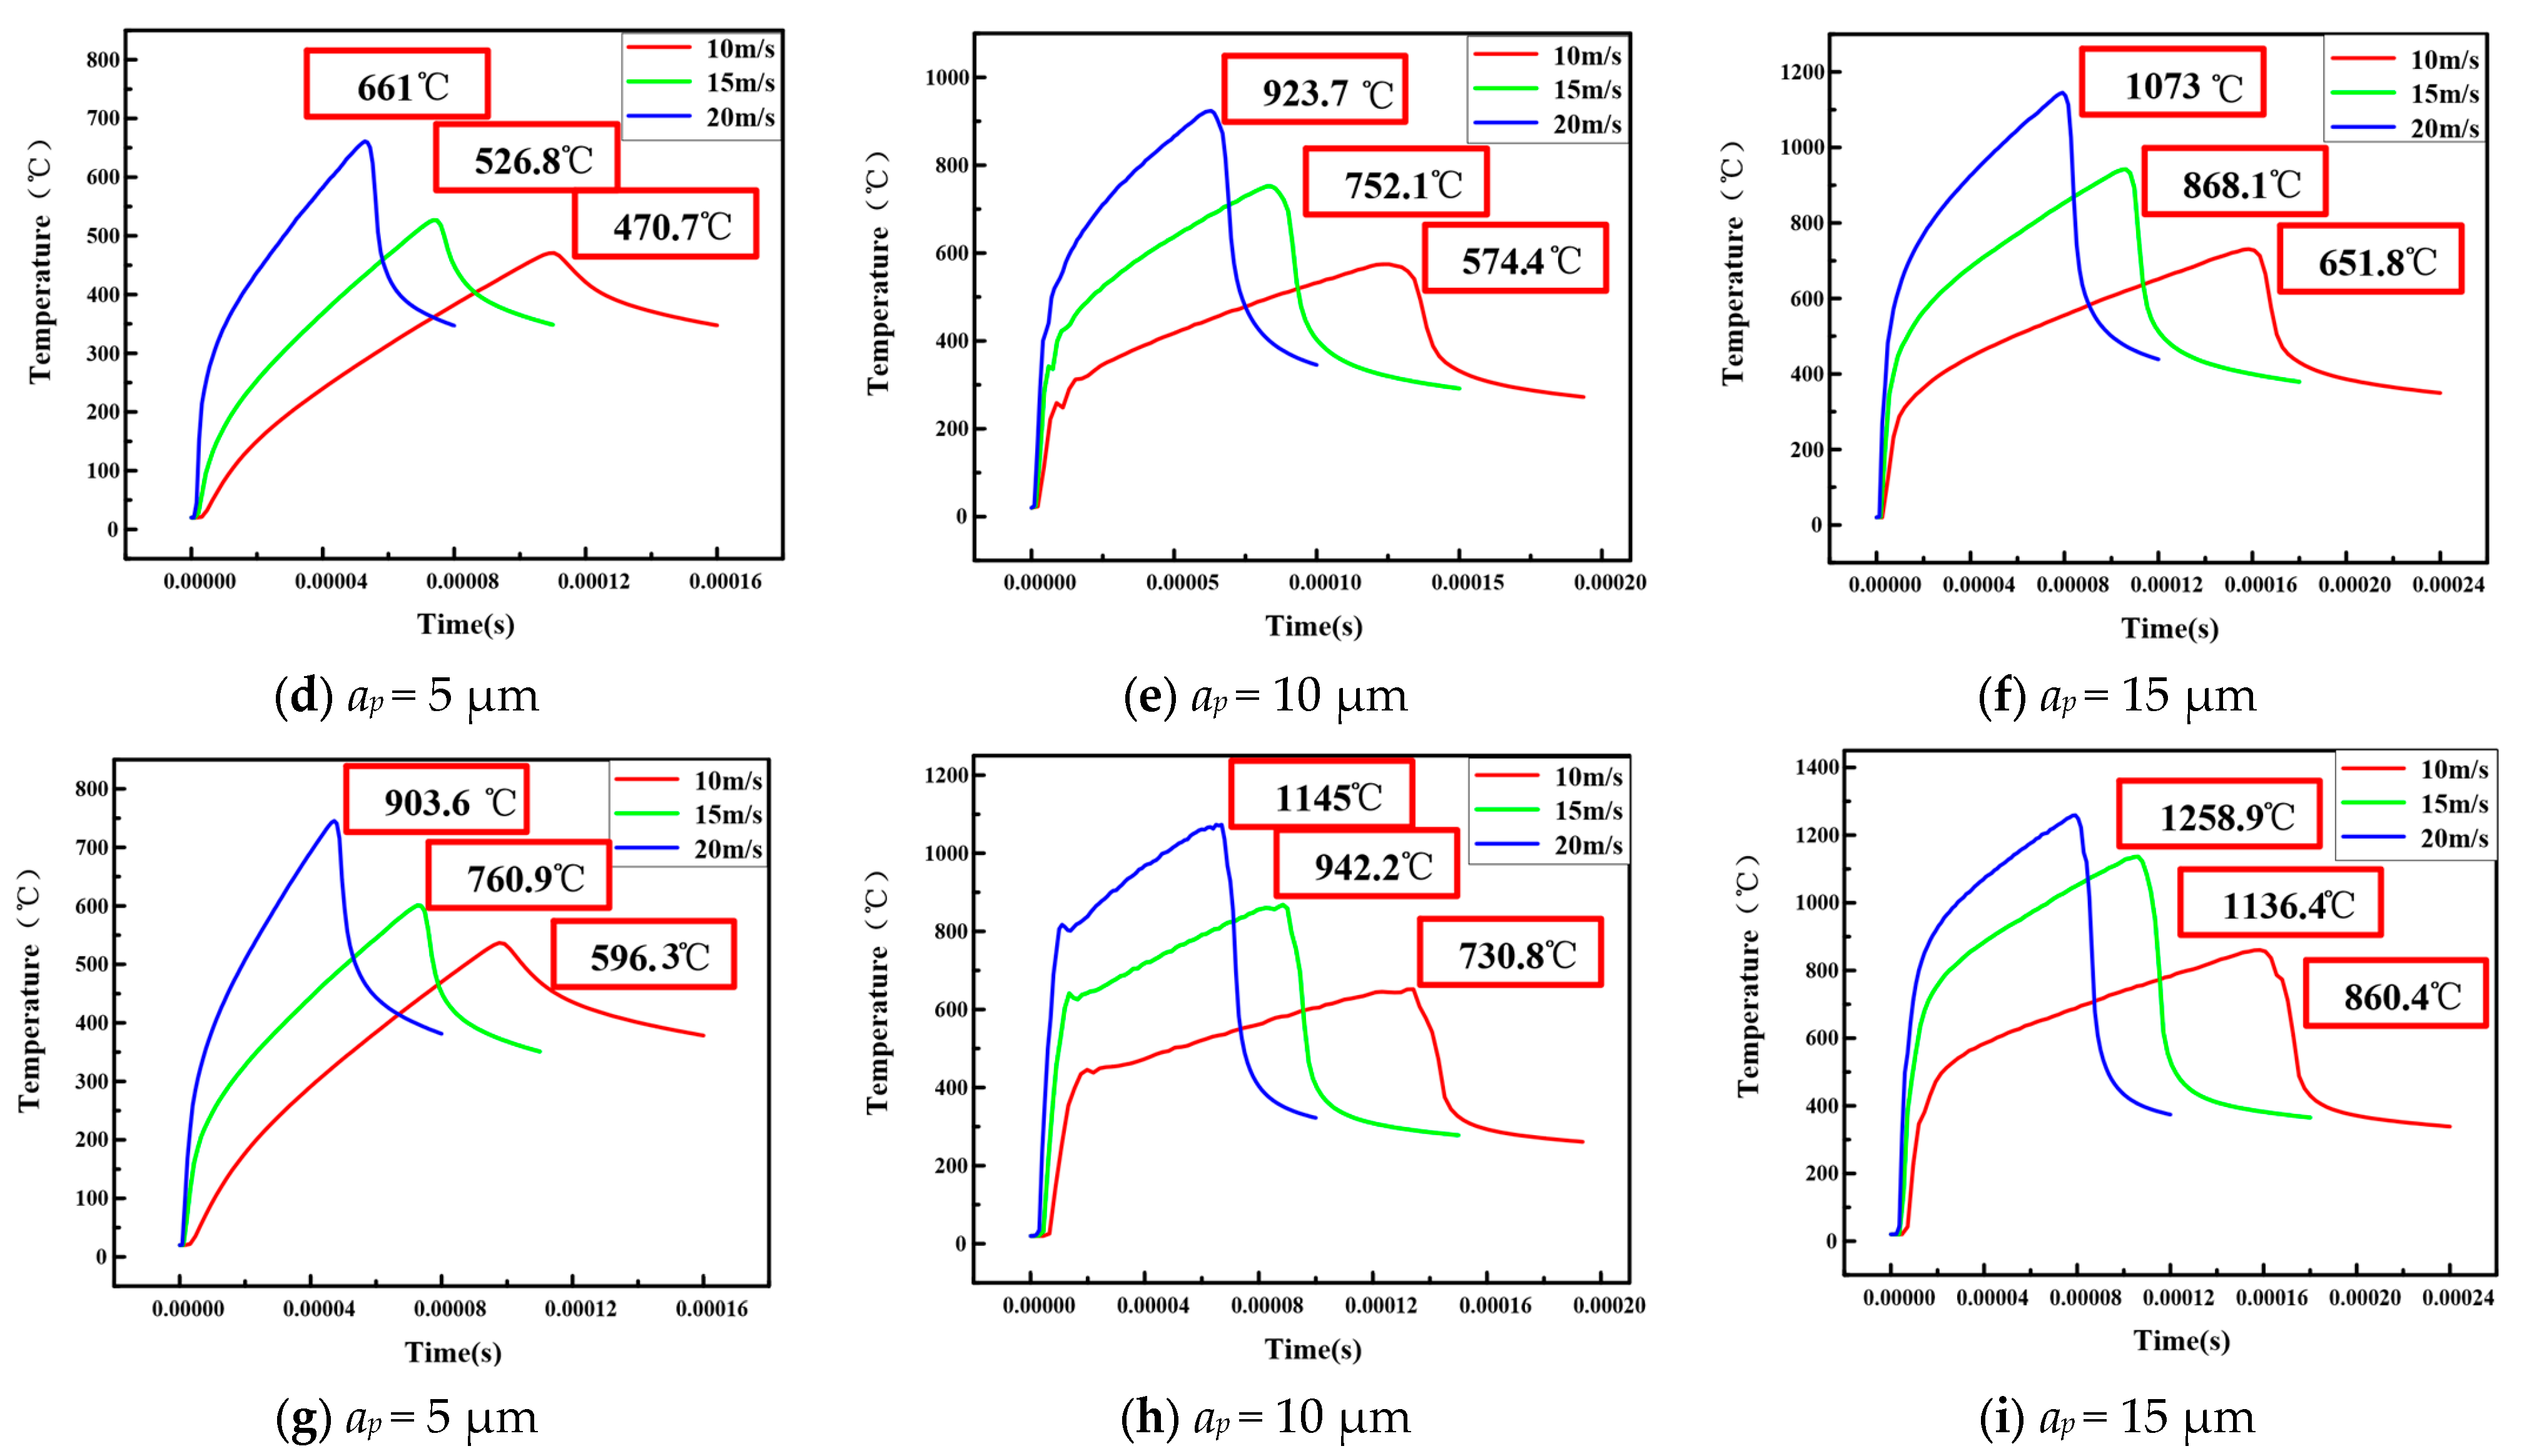
To investigate the influence of process parameters on grinding temperature, the temperature distribution across the grinding wheel surface was analyzed. To reduce the influence of the randomness of particle distribution on the simulation results, the higher temperatures in a specific region on the surface of the grinding wheel model were focused by this paper. The temperatures at the abrasive grain tip were selected and analyzed during the grinding process. The multi-abrasive grain grinding process is illustrated in Figure 4a. Three positions of the node on the surface of the multi-abrasive grain wheel were selected for temperature analysis, which are illustrated in Figure 4b. The final temperature trends acquired during the grinding process under various processing conditions are illustrated in Figure 5.

Figure 4.
Temperature cloud of multi-abrasive grain models: (a) multi-abrasive grain grinding process; (b) grinding wheel junction temperature.
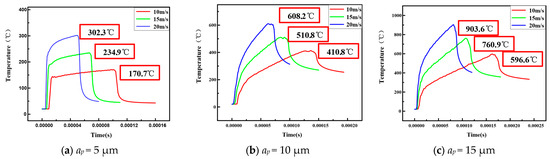
Figure 5.
Temperature trends of different grinding speeds at depths of cut of 5 μm, 10 μm and 15 μm. (a) Node 1 at grinding depths of 5 μm; (b) node 1 at grinding depths of 10 μm; (c) node 1 at grinding depths of 15 μm; (d) node 2 at grinding depths of 5 μm; (e) node 2 at grinding depths of 10 μm; (f) node 2 at grinding depths of 15 μm; (g) node 3 at grinding depths of 5 μm; (h) node 3 at grinding depths of 10 μm; (i) node 3 at grinding depths of 15 μm.
Due to the significant amplitude of temperature fluctuations during the cutting-in and cutting-out stages of the grinding wheel, and the differences in temperature due to the position, the shape and the height of different abrasive grains, the temperature node unit is only selected from the abrasive grains with higher grinding temperatures, and the average values of the highest temperature of the stable grinding stage were selected to analyze the temperature trend, which are shown in Figure 5.
Figure 5a–c show the trend of grinding temperatures at different grinding speeds for node 1 with the grinding depths of 5 μm, 10 μm, and 15 μm. Figure 5d–f show the trend of grinding temperatures at different grinding speeds for node 2 with the grinding depths of 5 μm, 10 μm, and 15 μm. Figure 5g–i show the trend of grinding temperature at different grinding speeds for node 3 with grinding depths of 5 μm, 10 μm, and 15 μm.
As illustrated in Figure 5, the temperature variations of the three nodes in the multi-abrasive grain grinding wheel model with different parameters during the grinding process exhibit trends of first increasing and then decreasing. During the early phase of grinding, numerous abrasive grains contact with the workpiece, and the grinding temperature sharply increases with increase in the grinding time. The increasing trend continues until reaching the peak temperature, after which the temperature stabilizes. Subsequently, as the abrasive grains disengage from the workpiece, the temperature decreases significantly, eventually reaching a stable state. Furthermore, comparative analysis reveals that under the same grinding depth, the temperatures observed at node 1 consistently remain the lowest, while the temperatures at node 3 consistently remain the highest.
The comparison of the temperature trend at the three nodes shows that due to the different locations, the moment at which each node reaches its max temperature is different. From Figure 4, it could be seen that during the grinding process of the workpiece, node 2 contacts with the workpiece before node 1 and node 3, so the temperature at node 2 rises earlier. Due to the random height distribution in the built multi-abrasive grain grinding wheel model, there is a significant difference in the max temperatures at these three points during the grinding process. During the grinding process, the height of the abrasive grains at node 1 is significantly lower than the average level; meanwhile, node 3 is located at the edge region of the multi-abrasive grains grinding wheel. Due to the mentioned positional characteristics, during the actual grinding process, these two nodes are more likely to cause excessive deformation of the workpiece edge when they contact with the workpiece, comparing with other regions. The excessive deformation of the workpiece edge region significantly interferes the conduction and distribution of the heat, which also have a substantial impact on the simulation temperature results. By considering the inherent properties of the material and focusing on avoiding material burn caused by factors such as grinding heat, the node with the highest temperature value is selected as the key research object. Therefore, node 2 was selected as the temperature node for grinding simulation and analysis.
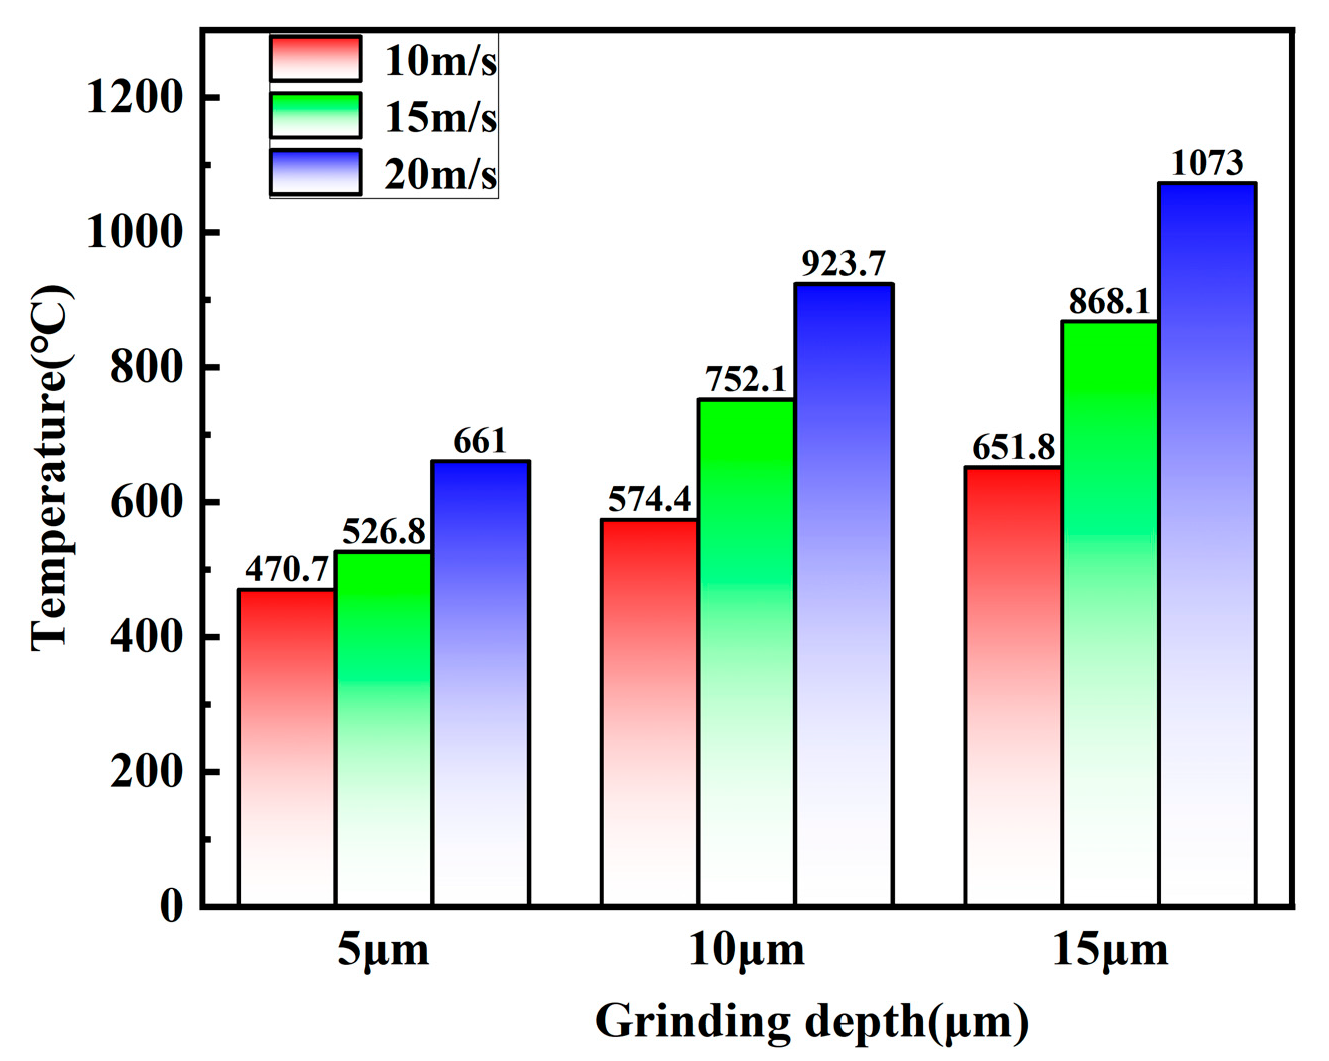
Figure 6 illustrates the trend of grinding temperature at node 2 under different grinding process parameters. As depicted in Figure 6, when the grinding depth is 5 μm, the highest temperature recorded during the grinding process increases from 470.7 °C to 661 °C as the grinding speed increases, reflecting an increase of 40.5%. At a grinding depth of 10 μm, the highest temperature increases from 574.4 °C to 923.7 °C as the grinding speed increases, resulting in a substantial increase of 60.1%. When the grinding depth is 15 μm, the maximum temperature during the grinding process sharply increased from 651.8 °C to 1073 °C with the increase in the grinding speed, amounting to an increase of 64.6%. This notable temperature increase could be attributed to the friction and the frictional heat generated during the grinding process; this is influenced by the abrasive grains and the surface of the workpiece’s contact interaction. At a fixed grinding depth, the increase in grinding speed leads to a relative high velocity between the abrasive grains and the workpiece surface, thereby intensifying the frictional heat generated and the material temperature. Additionally, the friction area interacts with the workpiece per unit of time, resulting in a more rapid accumulation of heat. This means that the amount of the released heat per unit of time relatively reduces, while the amount of heat generated by grinding increases. This results in the accumulation of frictional heat, which consequently causes a significant increase in temperature throughout the grinding process.
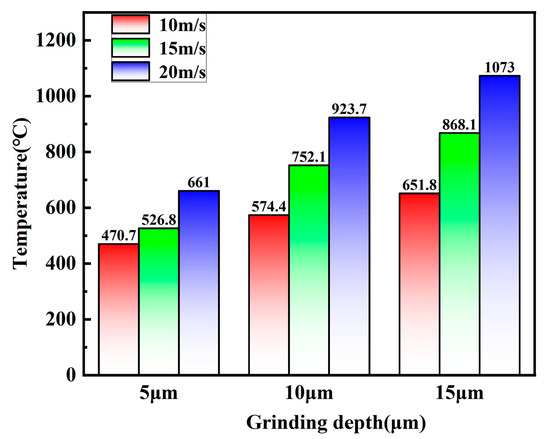
Figure 6.
Temperature trend of node 2.
When the grinding speed is 10 m/s, the highest temperature observed during the grinding process rises from 470.7 °C to 651.8 °C as the grinding depth increases, representing a substantial increase of 38.5%. When the grinding speed is 15 m/s, the max temperature observed during the grinding process rises from 526.8 °C to 868.1 °C as the grinding depth increase, representing a substantial increase of 64.8%. With a grinding speed of 20 m/s, the max temperature observed during the grinding process rises from 661 °C to 1073 °C as the grinding depth increases, representing a substantial increase of 62.3%. This phenomenon occurs because at a consistent grinding speed, more abrasive grains participate in the process; consequently, both the heat input during the grinding process and the frictional contact area between the abrasive grains and the workpiece increase. This increase results in a larger accumulation of grinding heat within the contact zone per unit time, which ultimately causes the grinding temperature to increase as the grinding depth becomes deeper.
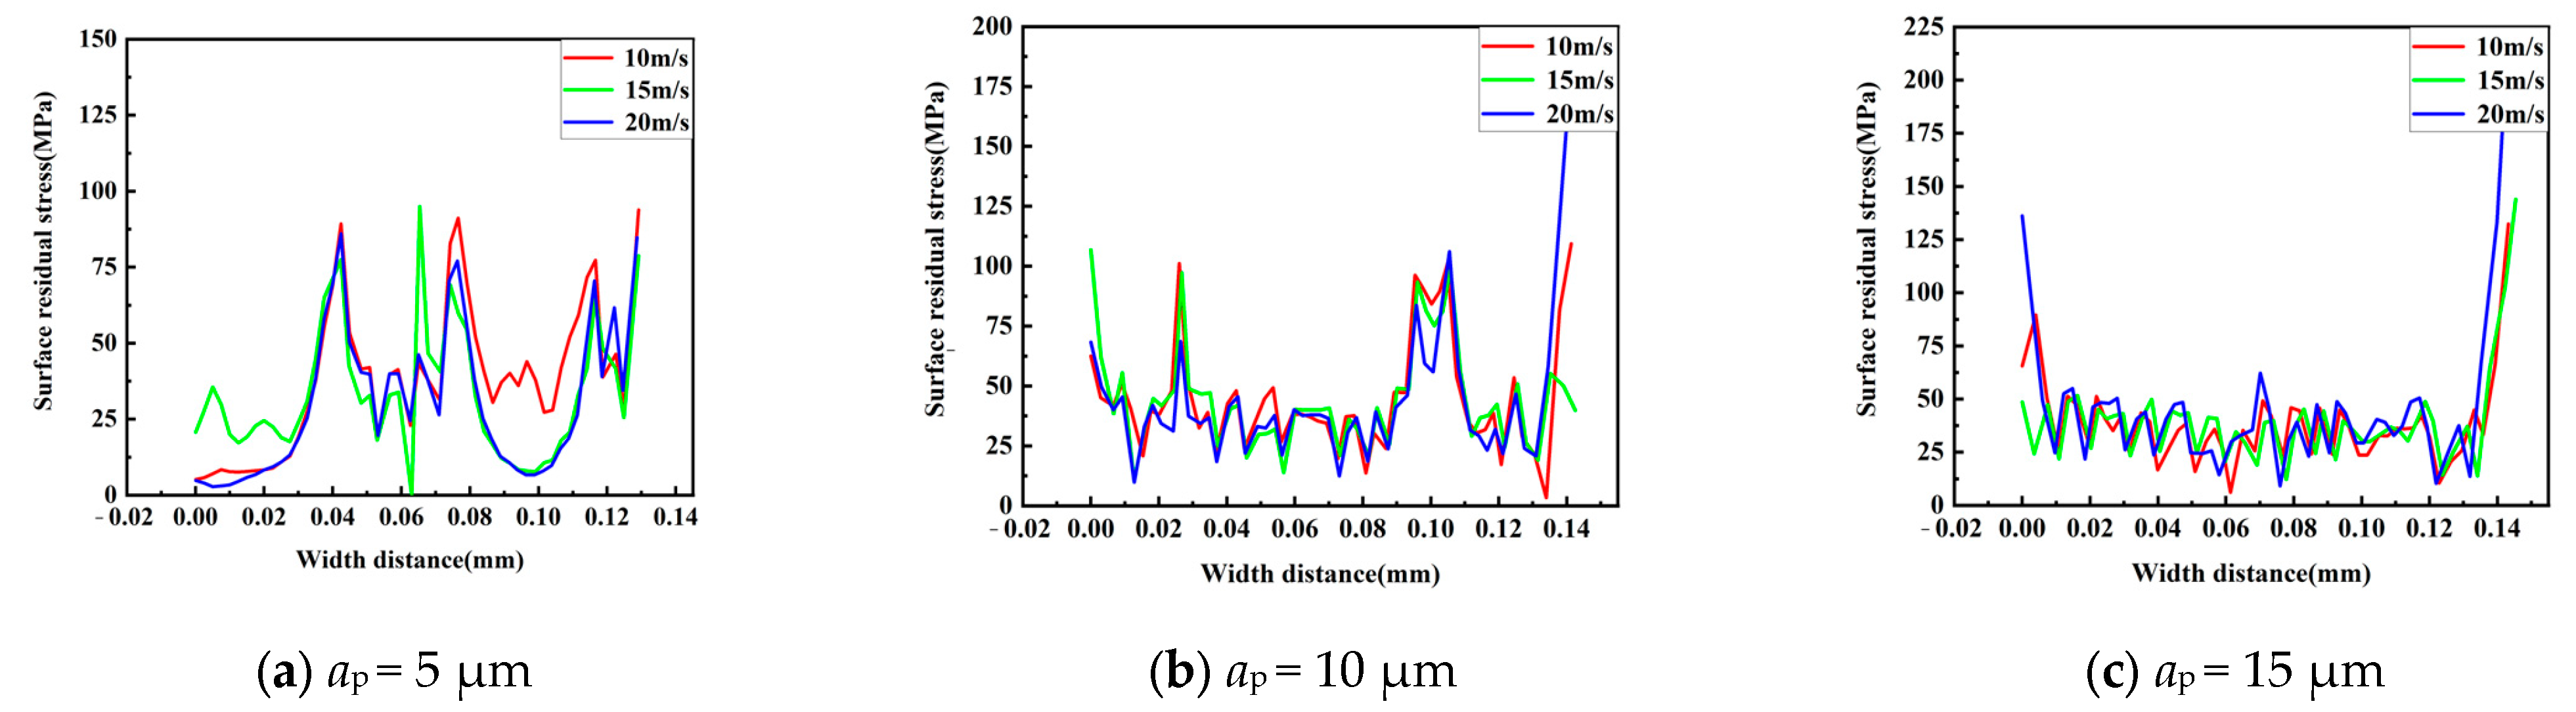
3.2. Analysis of the Effect of the Grinding Process on the Variation in Surface Residual Stress
Since it is difficult to compare the distribution and variation trends of residual stress on the surface of workpieces under different grinding process parameters, the surface residual stress was extracted from the surface of the workpiece along the grinding axial direction. Figure 7 illustrates the distribution of residual stress on the ground surface under different grinding process parameters. As shown in Figure 7a, when the grinding depth is 5 μm, the stress at the center of the workpiece surface is particularly large under different grinding speeds. This is because at a relatively low grinding depth, the number of abrasive grains in contact with the workpiece surface is limited, leading to significant residual stress in the contact area between the abrasive grains and the workpiece. At this stage, the surface residual stress of the workpiece ranges from 6.7 to 94.9 MPa. Figure 7b shows that when the grinding depth increases to 10 μm, the number of abrasive grains in contact with the workpiece surface increases significantly. Due to the random distribution of the abrasive grains in height, those with greater height have a larger contact depth, and the number of abrasive grains participating in grinding increases. The same area is repeatedly compressed and cut by multiple abrasive grains, which causes the overall residual stress on the weld surface to increase. The surface residual stress of the workpiece ranges from 12.4 to 106.1 MPa. As shown in Figure 7c, when the grinding depth increases to 15 μm, the contact arc length between the abrasive grains and the workpiece increases, and the max cutting thickness also increases. Meanwhile, the number of abrasive grains in contact with the arc length surface increases. The subsequent abrasive grains perform secondary grinding on the grooved surface, reducing the grinding depth of individual abrasive grains, which leads to a decrease in the surface residual stress. In addition, the temperature rises sharply within a short period of time, further reducing the surface residual stress of the workpiece, and it steadies between 6.1 and 62.2 MPa. As shown in Table 2, the yield strength of the weld is 270 MPa, while the current surface residual stresses of the workpiece are all below this value. Therefore, it could be concluded that the influence of the residual stress on the safety of the workpiece during the grinding process is relatively small.
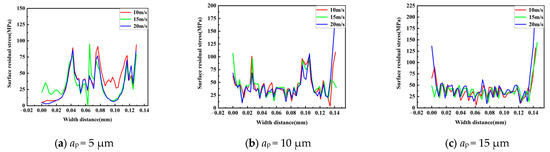
Figure 7.
Surface residual stress on weld grinding surfaces. (a) Grinding depths of 5 μm; (b) grinding depths of 10 μm; (c) Grinding depths of 15 μm.
4. Analysis of Grinding Tests
4.1. Design of the Test
4.1.1. Pretreatment of Workpieces
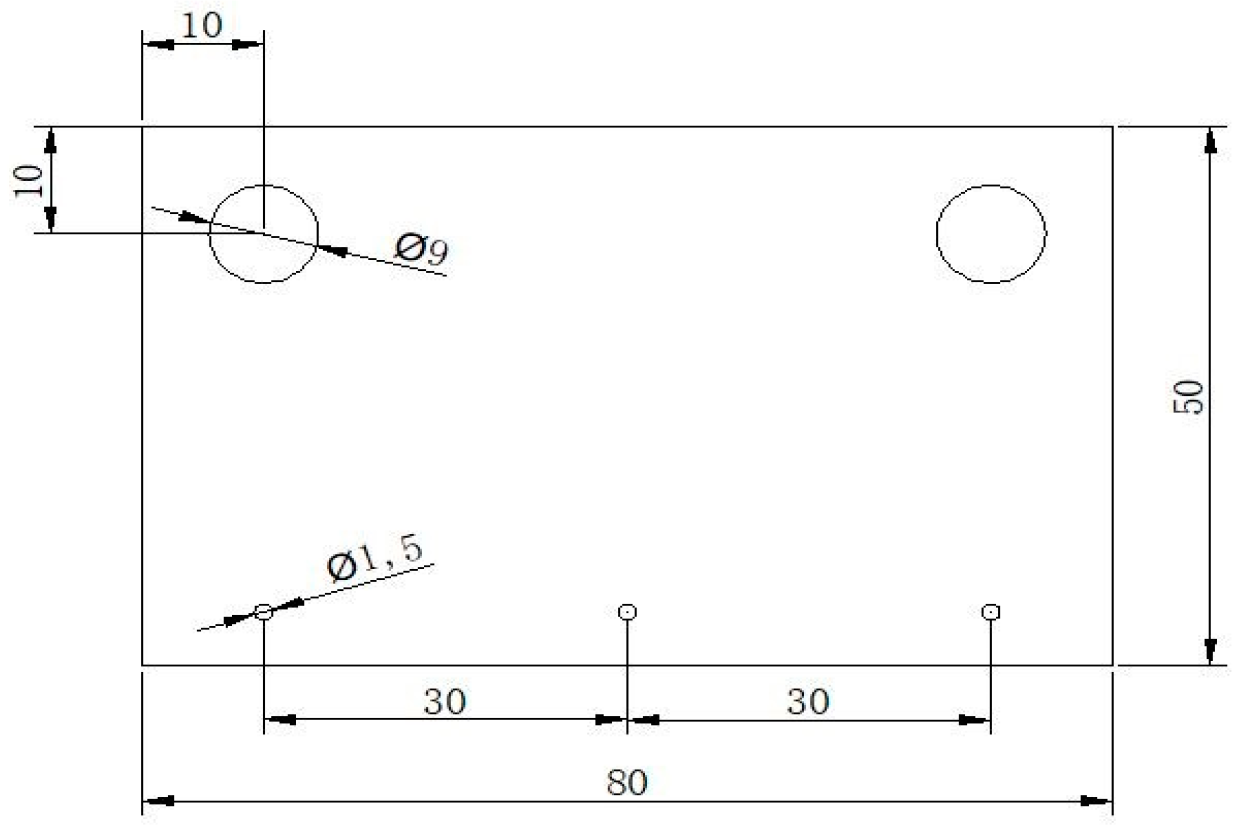
The S32168 weld was welded by a submerged arc welding machine before the experiment. After welding, the weld was polished to remove the residual height, and finally, the S32168 weld was cut into a grinding specimen with a size of 80 mm × 50 mm × 10 mm by an EDM wire-cutting machine. Three blind holes with a depth of 9.95 mm and diameter of 2 mm at intervals of 30 mm were made by an EDM piercing machine to fix the workpieces with thermocouples, a dynamometer, and other testing equipment. The shape and size of the pre-processed workpiece are illustrated in Figure 8.
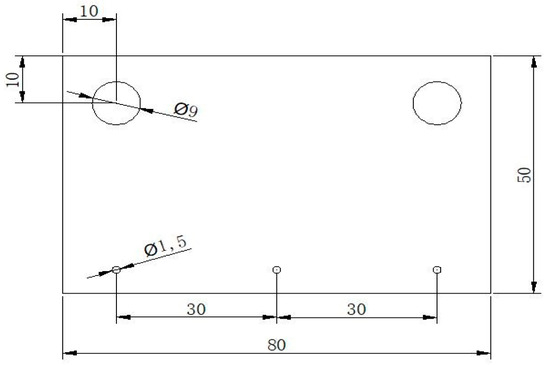
Figure 8.
The shape and size of workpieces (mm).
4.1.2. Experimental Plans
The grinding experiments were conducted using a 120-mesh white corundum grinding wheel with grinding speeds of 10 m/s, 15 m/s, and 20 m/s and grinding depths of 5 μm, 10 μm, and 15 μm. Nine sets of grinding experiments were designed by combining the three levels of grinding speeds and grinding depths, and the experimental plans are shown in Table 5 [32]. The grinding condition was set to dry grinding.
Table 5.
Grinding test program.
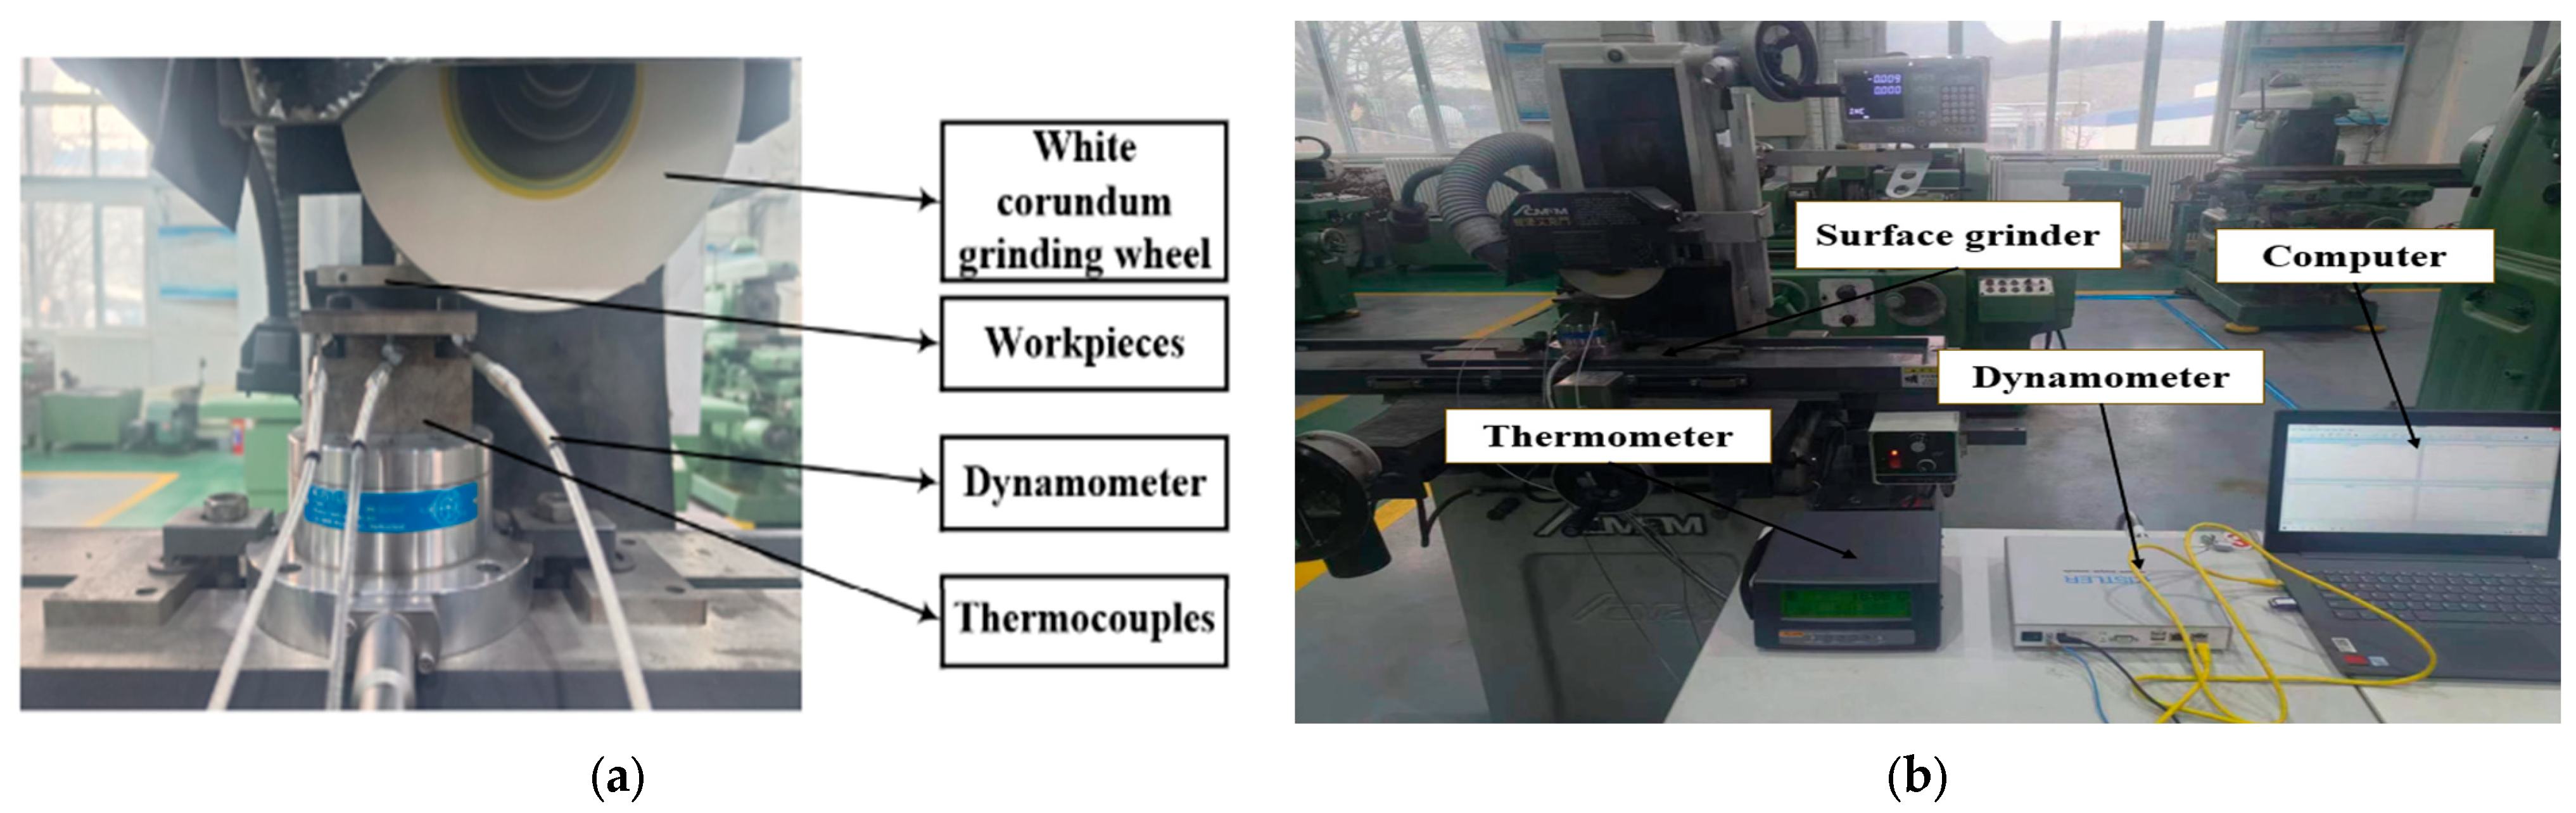
The primary aim of the experiments is to explore the influence of the grinding process parameters on the grinding temperature and the grinding force, which also verifies the precision of the simulation results. A dynamometer with a thermocouple was utilized to assess the grinding temperature and the grinding force. Two M8 bolts were used to fasten the S32168 stainless steel weld specimen with the fixture. The mounting effect is shown in Figure 9a.

Figure 9.
Grinding experimental device. (a) Assembly of test device; (b) experimental devices.
A 120-mesh grinding wheel was used to conduct the grinding experiments on the 06Cr18Ni11Ti weld seam. The selected grinding wheel was a flat-type wheel with a ceramic bonding agent. The grinding wheel was made of white corundum; the size of the abrasive grain ranged from 100 to 125 μm, and it was of medium density.
Throughout the experiment process, a thermometer and a force dynamometer were used to monitor the temperature and grinding force in real time, respectively. The monitored data were recorded and stored using a computer. The detailed configuration of the experimental set is shown in Figure 9b. Subsequently, the cut specimens were mounted and secured on the thermometer and the force dynamometer. The type of the force dynamometer was Kistler 9272, installed on the grinding machine, and the specimen was firmly fixed to the upper surface of the force dynamometer using a specialized fixture. The type of the thermometer used was 1529 Chub-E4 with its measuring end equipped with a KPS-2520-K thermocouple (KAIPUSEN). Due to the bottom specimens’ shape, three sets of thermocouples were deliberately attached to the bottom surface of the specimen to protect them from damage during the grinding process. The vertical distance between the thermocouples and the surface of specimen is 10 mm.
4.2. Experiments Results and Analysis
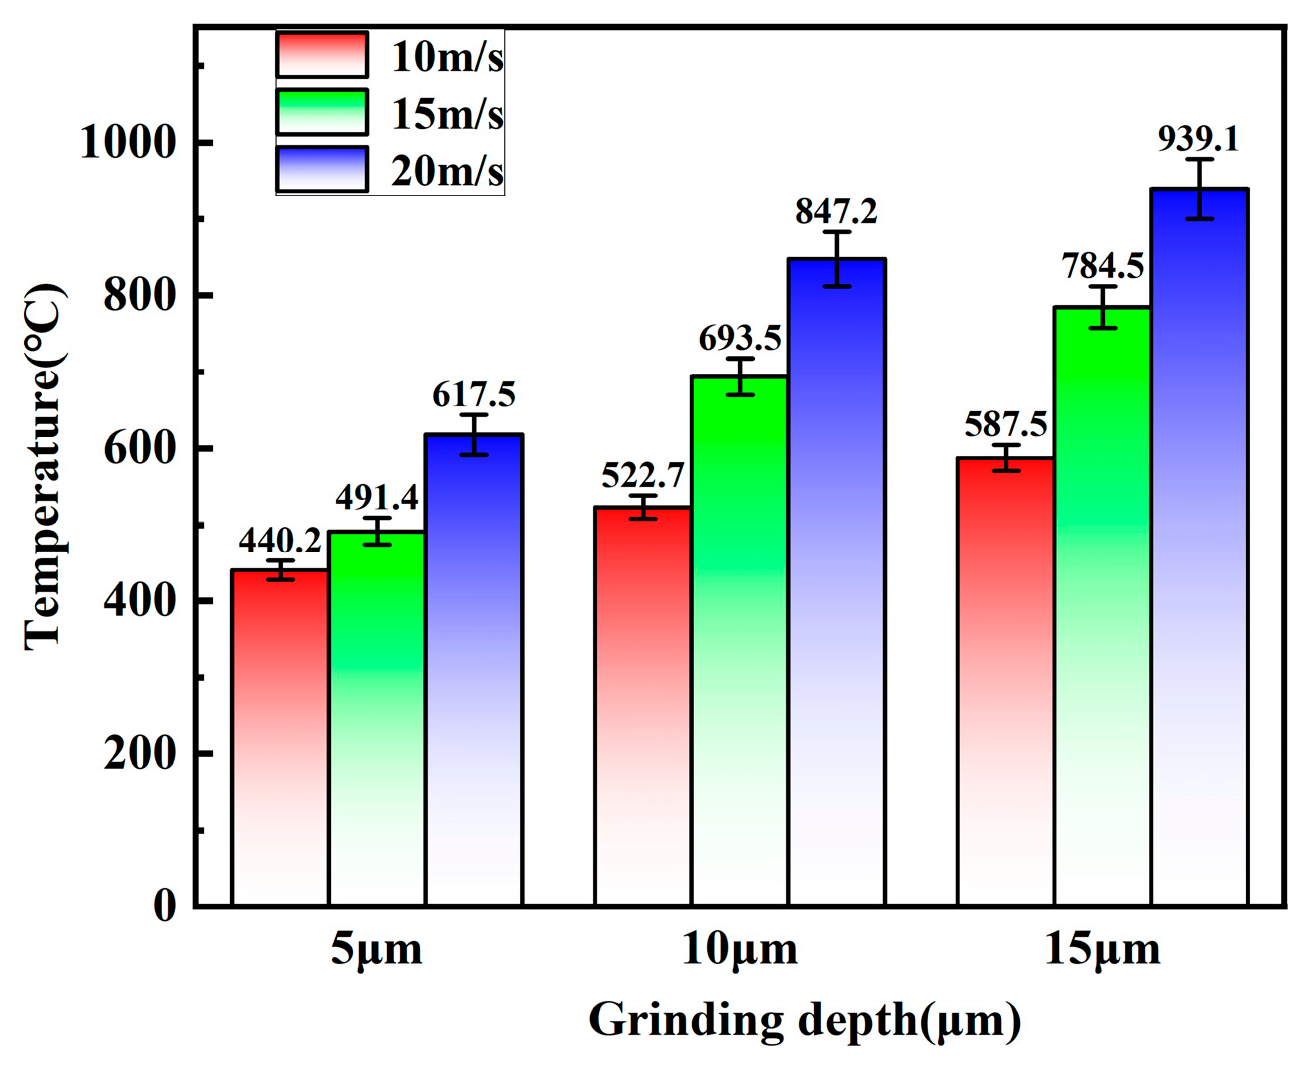
The disparity in the temperature between the cut-in and cut-out phases of wheel grinding results in the accumulation of the grinding heat, which creates a significant temperature variation through the grinding process. Therefore, to avoid errors in the temperature measurement, three sets of thermocouples were used to measure the grinding temperature, and the average of the measured grinding temperatures were taken. Figure 10 shows the measured temperatures.

Figure 10.
Grinding experiments.
As illustrated in Figure 10, the highest temperature rises from 440.2 °C to 617.5 °C as the grinding speed increases during the grinding process with an increase of 40.3% when the grinding depth is 5 μm. The highest temperature measured increases significantly during the grinding process, rising from 522.7 °C to 847.2 °C as the grinding speed increases, with an increase of 62.1% when the grinding depth is 10 μm. The highest temperature measured rises from 587.5 °C to 939.1 °C as the grinding speed increases, which represents an increase of 59.8% when the grinding depth is 15 μm during the grinding process.
The primary reason for this phenomenon lies in the connection between the grinding speed and the mechanics of the grinding process. Maintaining a constant grinding depth while increasing speed enhances the relative movement between the grinding wheel and the workpiece. This results in a larger number of abrasive grains on the wheel’s surface engaging in the grinding process per unit time, which accelerates the accumulation of frictional heat at the interface between the grinding wheel and the workpiece. Although the grinding process inherently generates more heat, some of the thermal energy could be dissipated through the heat dissipation effect. However, the increase in the grinding speed reduces the relative contact time between abrasive grains and the workpiece surface, which makes heat generation exceed heat dissipation, leading to an overall thermal accumulation and an eventually increase in the grinding temperature. Meanwhile, the surface temperature increases significantly with the increase in the grinding temperature, which enhances the thermal softening plasticity and alters the lattice structure of the weld specimen’s surface material, resulting in softer material properties. The alteration in the lattice structure would also lead to a reduction in the yield strength of the material of the weld specimens. Furthermore, the specific heat capacity of the welding material increases with temperature, which slows down the cooling process of the workpieces’ surface.
The highest temperature recorded during the grinding process increases from 440.2 °C to 587.5 °C as the grinding depth increases when the grinding speed is 10 m/s with an increase of 33.5%. The max temperature increases from 491.4 °C to 784.5 °C as the grinding depth increases with a grinding speed of 15 m/s and a notable increase of 59.6%. The max temperature increases from 617.5 °C to 939.1 °C as the grinding depth increases with a grinding speed of 20 m/s, with an increase of 52.1%.
This phenomenon could be attributed to the increase in the grinding temperature as the grinding depth increases with a constant grinding speed. The larger grinding depth contributes a larger removal volume of material within a specified period of time, which leads to an increase in the heat generation in the grinding area. The accumulation of heat leads to an increase in temperature within the grinding area. Furthermore, as the grinding depth increases, the relative motion time between the abrasive grains of the grinding wheel and the workpiece’s surface also increases, leading to a greater generation of frictional heat. The production of the frictional heat increases as the contact area and the contact duration increase, which further increases the temperature in the grinding area. Additionally, due to the constraints inherent in heat conduction, the generated thermal energy during the grinding process could not be dissipated rapidly. This delay in heat dissipation results in a continuous accumulation of the heat in the grinding area, which significantly increases the grinding temperature.
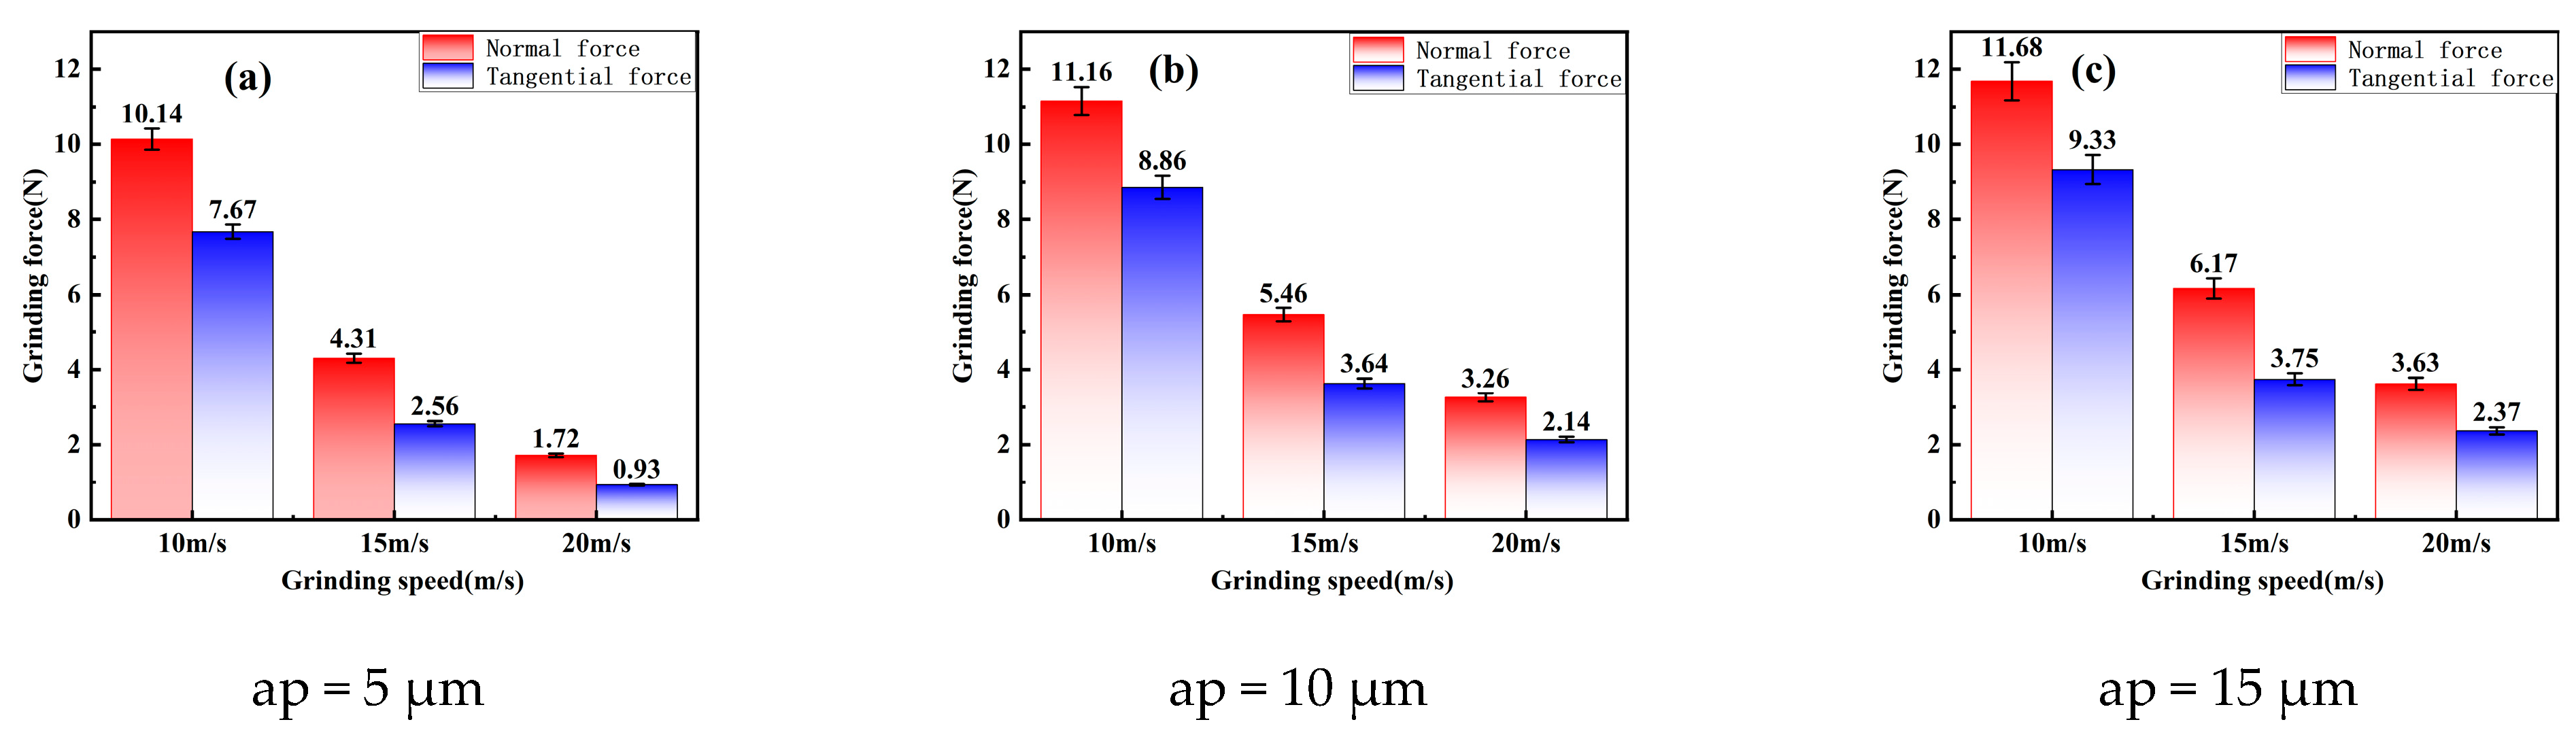
Figure 11 presents a variation trend and comparisons of the normal and tangential forces under different grinding process parameters. From Figure 11a, the data indicate that the normal grinding force exhibits a significant reduction from 10.14 N to 1.72 N as the grinding speed increases when the grinding depth is 5 μm with a decrease of 83.0%. Similarly, the tangential grinding force decreases from 7.67 N to 0.93 N, which is an approximate decrease of 87.9%. As illustrated in Figure 11b, the normal grinding force decreases from 11.16 N to 3.26 N, which is decrease of 70.8% as the grinding speed increases. Concurrently, the tangential grinding force decreases from 8.86 N to 2.14 N, which is a decrease of approximately 75.8%. Furthermore, Figure 11c shows that with a grinding depth of 15 μm, the normal grinding force decreases from 11.68 N to 3.63 N with a decrease of 68.9% as the grinding speed increases. The tangential grinding force also decreases from 9.33 N to 2.37 N, with a decrease of 74.6%.
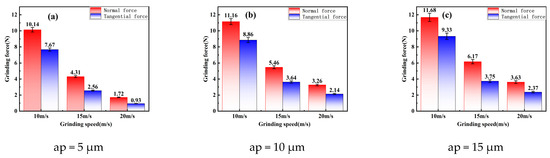
Figure 11.
Trend and comparison of mean values of normal force and tangential force with different process parameters: (a) grinding depths of 5 μm; (b) grinding depths of 10 μm; (c) grinding depths of 15 μm.
This phenomenon could be explained by the reduction in the contact time between the abrasive grains and the workpiece as the grinding speed increases, which is due to the higher relative motion speed between the grinding wheel and the workpiece. Consequently, this leads to a decrease in the frictional coefficient between the grinding wheel and the workpiece surface, resulting in a decrease in the friction force with the decrease in the frictional coefficient [35]. Additionally, the higher grinding speeds increase the number of abrasive grains involved in the grinding process within the same period of time, which generates more grinding heat in the grinding area. Under a higher surface temperature, the yield strength of the weld surface’s material decreases, and the abrasive grains could remove the material of the surface with a small grinding force. Therefore, the grinding force of a single abrasive grain decreases, resulting in a decreasing trend in the grinding force through the grinding process.
The normal grinding force increases from 10.14 N to 11.68 N with the increase in the grinding depth at a grinding speed of 10 m/s with an increase of 15.2%. Similarly, the tangential grinding force increases from 7.67 N to 9.33 N with a significant increase of 21.6%. The normal grinding force increases from 4.31 N to 6.17 N with the addition of grinding depth with a substantial increase of 43.2% when the grinding speed increases to 15 m/s. Concurrently, the tangential grinding force increases from 2.56 N to 3.75 N with an increase of 41.5%. The normal grinding force sharply increases from 1.72 N to 3.63 N with the increase in the grinding depth at a grinding speed of 20 m/s with a remarkable increase of 111.04%. In parallel, the tangential grinding force experiences an increase from 0.93 N to 2.37 N with an increase of 154.84%. This phenomenon could be explained by the fact that as the grinding depth increases, the contact area between abrasive grains and the workpiece also increases. Consequently, the increase in contact area amplifies the cutting force applied by the abrasive grains onto the workpiece. With the increase in the grinding depth, more energy is required to remove the workpiece material, which leads to a corresponding increase in the grinding force. During the grinding process, the friction increases with the increase in the contact area between the abrasive grains and the workpiece [36]. This increasing friction contributes to an increase in the grinding force.
4.3. Comparison of Grinding Test and Simulation Temperature Verification
Table 6 shows the grinding temperatures on the weld of the simulation and experiments. From Table 6, it is evident that at a constant grinding depth, the errors of temperature between the simulation and experiment decrease as the grinding speed increases. Conversely, at a constant grinding speed, the errors of temperature between the simulation and experiment increases with the increase in the grinding depths.
Table 6.
Comparison of simulation temperature and test temperature error in grinding.
With a grinding depth of 5 μm, the errors of simulated and experimental temperature are 6.97%, 7.20%, and 7.04% for the grinding speeds of 10 m/s, 15 m/s, and 20 m/s, respectively. When the grinding depth is 10 μm, the temperature errors between the simulation and experiment are 9.89%, 8.45%, and 8.99% for the grinding speeds of 10 m/s, 15 m/s, and 20 m/s, respectively. When the grinding depth is 15 μm, the temperature errors between the simulation and experiment are 9.89%, 8.45%, and 8.99% for the grinding speeds of 10 m/s, 15 m/s, and 20 m/s, respectively. As the grinding speed increases, the rate of temperature change significantly accelerates, which allows the measuring equipment to respond to temperature fluctuations more quickly. As a result, the errors caused by the response time delay of the measuring equipment are effectively reduced. In contrast, under the low-speed grinding conditions, the temperature changing process is relatively gradual, and the measure equipment is more susceptible to external factors such as ambient temperature fluctuations, which leads to a relatively larger measurement error. As the grinding depth increases, the workpiece material undergoes more severe deformation and experiences higher temperatures. During this process, both the mechanical and thermophysical properties of the material have been changed. Moreover, the parameters such as thermal conductivity and specific heat capacity are likely to change accordingly. However, the material property parameters adopted in the simulation model are unable to fully account for the dynamic evolution of the material properties as the grinding depth increases, which undoubtedly leads to an increase in the error between the results of simulation and the experiments.
The comparison between the simulated and experimental temperature is shown in Figure 12. The horizontal axis represents the group, and the vertical axis represents the temperature, as shown in Table 6. Through temperature comparison, it could be observed that the trend of temperature changes in the experiment is similar to that in the simulation with the simulation temperatures being higher than the experimental temperatures. This is because many factors affect the detection of grinding experimental temperature. For example, detection error occurs because the thermocouple measures the temperature at a certain depth below the grinding surface, which is lower than the actual temperature of the grinding surface. Environmental error also influences the experimental results as the airflow during the grinding process dissipates heat faster than in the ideal simulated environment, causing a large decrease in surface temperature during the experiment. The reasons mentioned above contribute to a discrepancy between the actual grinding temperature and the simulated temperature. The analysis of the nine sets of data presented above reveals that the discrepancies between the experimental and simulation temperatures range between 6.97% and 14.2% with an overall average error of approximately 9.37%. The small error between the simulation and experimental results shows the high accuracy and viability of the built simulation model.
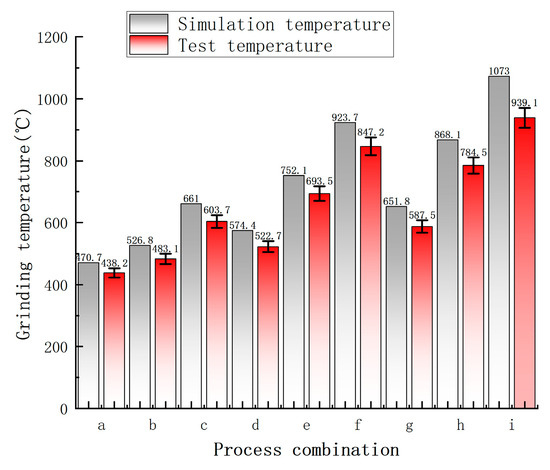
Figure 12.
Comparison of grinding experiment and simulation temperature.
5. Conclusions
The paper built a simulation model for a multi-abrasive grain grinding wheel using the W-M fractal dimension. The grinding simulations reveal the influence of the process parameters on the grinding force and temperature. The effectiveness of the simulation model was validated by comparing the experimental and simulation results. The conclusions obtained are as follows:
- (1)
- The analysis of grinding simulations was conducted with different process parameters. The simulation results reveal that during the initial phase of the grinding, the grinding temperature significantly increases as the grinding duration extends. However, the grinding temperature rise tends to plateau once it reaches the specific threshold. As the grinding wheel contacts with the workpiece, the temperature decreases significantly at first and finally stabilizes as the grinding time extends. The grinding temperature increases with the grinding speed and the grinding depth: the max temperature reaches 1073 °C with a depth of 15 μm and the grinding speed of 20 m/s, while the min temperature is 470.7 °C with a depth of 5 μm and the grinding speed of 10 m/s.
- (2)
- The grinding experiments show that keeping the depth constant, the grinding force decreases as the grinding speed increases. Conversely, the grinding force increases the grinding depth increases. For example, at the depth of 15 μm and the speed of 10 m/s, the normal force is 11.68 N and the tangential force is 9.33 N. At the depth of 5 μm and the speed of 20 m/s, the normal force drops to 1.72 N and the tangential force to 0.93 N.
- (3)
- Comparing the simulation and the experimental temperature data reveals that the error ranges from 6.97% to 14.2% with an average error of 9.37%. The minor difference between the simulation and experimental results shows that the simulation model is highly accurate and feasible.
During the simulation of the grinding process, the abrasive grain shedding of the grinding wheel has not been considered. In the actual grinding process, the shedding of the abrasive grain significantly affects the grinding simulation results, causing the error between the simulation and experimental results. To enhance the simulation accuracy and align it with an actual grinding process, regularly inspecting the grinding wheel’s wear morphology is crucial. By using high-precision measurement, detailed data on the surface wear and contour changes could be obtained. These data serve as a solid foundation for more accurate grinding simulations. Based on this, the existing simulation model could be optimized, thus greatly reducing the error between simulation and actual grinding, which provides a more reliable theoretical basis for grinding process research and improvement.
Author Contributions
Project administration, S.Z.; writing—original draft preparation, Z.L.; writing—review and editing, Y.L.; software, Q.D.; methodology, Z.W.; data curation H.G.; validation, M.L. All authors have read and agreed to the published version of the manuscript.
Funding
This research was funded by the National Key R&D Program of China (2020YFA0714403).
Data Availability Statement
The data used to support the findings of this study are available from the corresponding author upon request.
Conflicts of Interest
The authors declare no conflicts of interest.
References
- Ishigami, A.; Roy, M.J.; Walsh, J.N.; Withers, P.J. The effect of the weld fusion zone shape on residual stress in submerged arc welding. Int. J. Adv. Manuf. Technol. 2017, 90, 3451–3464. [Google Scholar]
- Liu, W. Simulation and Experiment Study of the Precision Grinding of Silicon Nitride Ceramic Based on Single Grain Cutting. Ph.D. Thesis, Hunan University, Changsha, China, 2014. [Google Scholar]
- Zhao, X.Y. Simulation and Experimental Research of Diamond Grinding Wheel 3D Shape Modeling and Cutting Engineering Ceramics. Ph.D. Thesis, Hunan University of Science and Technology, Xiangtan, China, 2015. [Google Scholar]
- Chen, H.F.; Tang, J.Y.; Deng, Z.H.; Zhou, W. Modeling and predicting surface topography of the ultrasonic assisted grinding process considering ploughing action. J. Mech. Eng. 2018, 54, 231–240. [Google Scholar] [CrossRef]
- Chen, X.; Rowe, W.B. Analysis and simulation of the grinding process. Part I: Generation of the grinding wheel surface. Int. J. Mach. Tools Manuf. 1996, 36, 871–882. [Google Scholar]
- Koshy, P.; Jain, V.K.; Lal, G.K. Stochastic simulation approach to modelling diamond wheel topography. Int. J. Mach. Tools Manuf. 1997, 37, 751–761. [Google Scholar] [CrossRef]
- Hou, Z.B.; Komanduri, R. On the mechanics of the grinding process—Part I. Stochastic nature of the grinding process. Int. J. Mach. Tools Manuf. 2003, 43, 1579–1593. [Google Scholar] [CrossRef]
- Xiao, Y.B.; Liang, Z.Q.; Yuan, J.P.; Liu, X.; Xie, G.Z.; Wang, E.J. Research on grinding alloy carburized steel 20Cr2Ni4A with small diameter CBN grinding wheel. Modul. Mach. Tool Autom. Manuf. Tech. 2023, 2, 134–137+142. [Google Scholar]
- Gao, B.; Bao, W.; Jin, T.; Chen, C.; Qu, M.; Lu, A. Variation of wheel-work contact geometry and temperature responses: Thermal modeling of cup wheel grinding. Int. J. Mech. Sci. 2021, 196, 106305. [Google Scholar] [CrossRef]
- Wu, Z.; Zhang, L. Analytical grinding force prediction with random abrasive grains of grinding wheels. Int. J. Mech. Sci. 2023, 250, 108310. [Google Scholar] [CrossRef]
- Zhang, X.L.; Yao, B.; Feng, W.; Shen, Z.H.; Wang, M.M. Modeling of virtual grinding wheel based on random distribution of multi abrasive grains and prediction of grinding force. Acta Aeronaut. Et Sinica 2014, 35, 3489–3498. [Google Scholar]
- Li, Z.; Zhang, F.; Luo, X.; Guo, X.; Cai, Y.; Chang, W.; Sun, J. A new grinding force model for micro grinding RB-SiC ceramic with grinding wheel topography as an input. Micromachines 2018, 9, 368. [Google Scholar] [CrossRef]
- Liu, B.; Yan, C.F.; Wei, L.L.; Yang, H.D.; Zhao, X.M. Simulation and analysis of compound abrasive grinding performance of spiral bevel cears. J. Mech. Strength 2023, 45, 684–691. [Google Scholar]
- Zhao, B.; Guo, X.; Bie, W.; Chang, B.; Zhao, C. Thermo-mechanical coupling effect on surface residual stress during ultrasonic vibration-assisted forming grinding gear. J. Manuf. Process. 2020, 59, 19–32. [Google Scholar]
- Liu, J.S. Numerical Study on Torsional Micromotion Wear of Rough Surfaces. Master’s Thesis, Southwest Jiaotong University, Chengdu, China, 2021. [Google Scholar]
- Liu, J.X.; Liu, J.; Shen, H.M. Numerical study on torsional micromotion wear on rough surfaces. Mech. Strength 2022, 44, 731–736. [Google Scholar]
- Wang, J.H.; Chen, Z.; Gu, C.H.; Qiu, H.T.; Ji, H. Thermal mechanical coupling analysis of the friction interface of mechanical seals under dry friction state. J. Trilogy 2019, 39, 737–745. [Google Scholar]
- Qin, W.; Jin, X.; Kirk, A.; Shipway, P.; Sun, W. Effects of surface roughness on local friction and temperature distributions in a steel-on-steel fretting contact. Tribol. Int. 2018, 120, 350–357. [Google Scholar]
- Wang, H.N.; Xu, R.F.; Han, K.N.; Zhou, H.B.; Zhou, Y.X. Simulation study of grinding GH4169 alloy with single cubic boron nitride grits. Machinery 2020, 58, 66–70. [Google Scholar]
- Yi, J.; Yi, T.; Deng, H.; Chen, B.; Zhou, W. Theoretical modeling and experimental study on grinding force of straight groove structured grinding wheel. Int. J. Adv. Manuf. Technol. 2023, 124, 3407–3421. [Google Scholar]
- Ding, H.H.; Han, Y.C.; Zhou, K.; Huang, Y.H.; Shi, L.B.; Guo, J.; Liu, Q.Y.; Wang, W.J. Grinding force modeling and experimental verification of rail grinding. Proc. Inst. Mech. Eng. Part J J. Eng. Tribol. 2020, 234, 1254–1264. [Google Scholar]
- Yin, Y.; Chen, M. Analysis of Grindability and Surface Integrity in Creep—Feed Grinding of High−Strength Steels. Materials 2024, 17, 1784. [Google Scholar] [CrossRef]
- Paknejad, M.; Abdullah, A.; Azarhoushang, B. Effects of high power ultrasonic vibration on temperature distribution of workpiece in dry creep feed up grinding. Ultrason. Sonochemistry 2017, 39, 392–402. [Google Scholar]
- Cheng, Z. High Speed Grinding Mechanism of Nickel Superalloy with Single Abrasive Grain. Master’s Thesis, Nanjing University of Aeronautics and Astronautics, Nanjing, China, 2011. [Google Scholar]
- Han, Z.; Cao, W.; Chen, Z.Q.; Yan, J.Y.; Wu, J.J.; Hu, Y.Y.; Zhai, J.X.; Zhang, M. Numerical simulation and experimental verification of temperature field under different grinding parameters. Mach. Tool Hydraul. 2022, 50, 76–81. [Google Scholar]
- Shi, F.; Liu, F.; Song, T.J.; Zhang, G.F.; Yin, S. Experimental study on grinding of 16Cr3NiWMoVNbE carbonitriding steel. Manuf. Technol. Mach. Tool 2024, 9, 142–146. [Google Scholar]
- Anderson, D.; Warkentin, A. Bauer of single abrasive-grain cut-ting. Exp. Numer. Investig. Int. J. Mach. Tools Manuf. 2012, 51, 898–910. [Google Scholar] [CrossRef]
- Wan, L.; Deng, Z.; Liu, T.; Tang, H.; Liu, W. Experimental investigation of grinding temperature and burn in high speed deep camshaft grinding. Int. J. Abras. Technol. 2016, 7, 321–336. [Google Scholar] [CrossRef]
- Esmaeili, H.; Adibi, H.; Rizvi, R.; Rezaei, S.M. Coupled thermo-mechanical analysis and optimization of the grinding process for Inconel 718 superalloy using single grit approach. Tribol. Int. 2022, 171, 107530. [Google Scholar] [CrossRef]
- Jiang, X.; Liu, K.; Yan, Y.; Li, M.; Gong, P.; He, H. Grinding temperature and surface integrity of quenched automotive transmission gear during the form grinding process. Materials 2022, 15, 7723. [Google Scholar] [CrossRef]
- Johnson, G.R.; Cook, W.H. A constitutive model and data for metals subjected to large strains, high strain rates and high temperatures. In Seventh International Symposium on Ballistics; American Defense Preparedness Association: The Hague, The Netherlands, 1983; pp. 1–7. [Google Scholar]
- Zhang, S.; Leng, Z.; Duan, Q.; Gu, H.; Lu, M.; Wang, Z.; Liu, Y. Experimental Determination and Simulation Validation: Johnson–Cook Model Parameters and Grinding Simulation of 06Cr18Ni11Ti Stainless Steel Welds. Machines 2024, 12, 660. [Google Scholar] [CrossRef]
- ISO 6892-1:2019; Metallic Materials-Tensile Testing-Part 1: Method of Test at Room Temperature. Comite Europeen de Normalisation: Brussels, Belgium, 2019.
- ISO 9017:2017; Metallic materials-Destructive Tests on Welds-Fracture Test. Comite Europeen de Normalisation: Brussels, Belgium, 2017.
- Quan, J.K. Study on Grinding and Subsurface Damage in Single Abrasive Particle Grinding Process by Theoretical Analysis and Simulation. Master’s Thesis, Hunan University, Changsha, China, 2017. [Google Scholar]
- Wang, Y.Z.; Liu, Y.; Wang, D.; Zhang, W.; Zhao, X.F. Research on gear gridding process of material 18CrNi4A based on burn control. Trans. Beijing Inst. Technol. 2018, 38, 235–240. [Google Scholar]


Disclaimer/Publisher’s Note: The statements, opinions and data contained in all publications are solely those of the individual author(s) and contributor(s) and not of MDPI and/or the editor(s). MDPI and/or the editor(s) disclaim responsibility for any injury to people or property resulting from any ideas, methods, instructions or products referred to in the content. |
© 2025 by the authors. Licensee MDPI, Basel, Switzerland. This article is an open access article distributed under the terms and conditions of the Creative Commons Attribution (CC BY) license (https://creativecommons.org/licenses/by/4.0/).