Article

Defect Detection and Classification on Wind Turbine Blades Using Deep Learning with Fuzzy Voting

by
Reed Pratt
,
Clark Allen
,
Mohammad A. S. Masoum
* and
Abdennour Seibi
Machine Learning and Drone Laboratory, Department of Electrical & Computer Engineering, Utah Valley University, Orem, UT 84058, USA
*
Author to whom correspondence should be addressed.
Machines 2025, 13(4), 283; https://doi.org/10.3390/machines13040283
Submission received: 26 January 2025 / Revised: 26 March 2025 / Accepted: 28 March 2025 / Published: 30 March 2025
(This article belongs to the Section Turbomachinery)

Abstract

:
Wind turbine inspections are traditionally performed by certified rope teams, a manual process that poses safety risks to personnel and leads to operational downtime, resulting in revenue loss. To address some of these challenges, this study explores the use of deep learning and drones for automated inspections. Three Mask R-CNN models, leveraging different convolutional neural network (CNN) backbones—VGG19, Xception, and ResNet-50—were constructed and trained on a novel dataset of 3000 RGB images (size 300 × 300 pixels) annotated with defects, including cracks, holes, and edge erosion. To improve defect detection performance, a multi-variable fuzzy (MVF) voting system is proposed. This method demonstrated superior accuracy compared to the individual models. The best-performing standalone model, Mask R-CNN with Xception, achieved an mAP of 77.48%, while the MVF system achieved an mAP of 80.10%. These findings highlight the effectiveness of combining fuzzy voting systems with Mask R-CNN models for defect detection on wind turbine blades, offering a safer and more efficient alternative to traditional inspection methods.

1. Introduction

The year 2023 marked a milestone for the wind industry, achieving unprecedented growth with a 50% increase in installations compared to the previous year. This surge reflects the increasing global demand for renewable energy sources, driven in part by ambitious international goals, such as the commitment in the COP28 agreement to triple renewable energy capacity by 2030 [1].
Wind turbines play a pivotal role in the transition to renewable energy. However, the blades are particularly vulnerable, as they experience the highest levels of stress and are more susceptible to environmental damage [2]. Wind turbine blades (WTBs) are subjected to strong loads during operation. Cyclic loading can result in fatigue-induced degradation, which can develop cracks on the blade and cause the blade to fail prematurely [3]. Wind turbines are also exposed to harsh and variable environmental conditions while in operation, including storm winds, rain, hail, ice accumulation, bird collisions, and lightning [2,3]. Studies indicate that blade failures account for approximately 19.4% of all wind turbine failures, underscoring the urgent need for effective inspection and maintenance strategies [4]. This paper aims to investigate some of these challenges and propose a potential solution for the detection and classification of WTB defects.
There are many ways to minimize downtime and ensure healthy WTBs during operation. The blades can be tested statically, with numerical or physical methods, or they can be put through a process known as fatigue testing to estimate the life of the blades [3]. However, once WTBs are installed, unpredictable events and potential damage may occur, highlighting the importance of early detection through inspection methods. The primary goal of WTB inspections is to prevent disasters before they materialize. Regular inspections not only minimize risks but also enhance efficiency by reducing downtime and operational costs [3].
Traditionally, wind turbines undergo manual inspections by rope teams, who visually examine the blades for signs of damage. While effective, this method is labor-intensive, time-consuming, and potentially hazardous. Recent advancements in technology have introduced alternative solutions, such as drone-based inspections investigated in this paper, which offer safer and more efficient options [5]. Compared to manual inspections, drone-based solutions can lead to cost reductions of up to 70% for the inspection itself and reduce revenue lost to downtime by up to 90% [
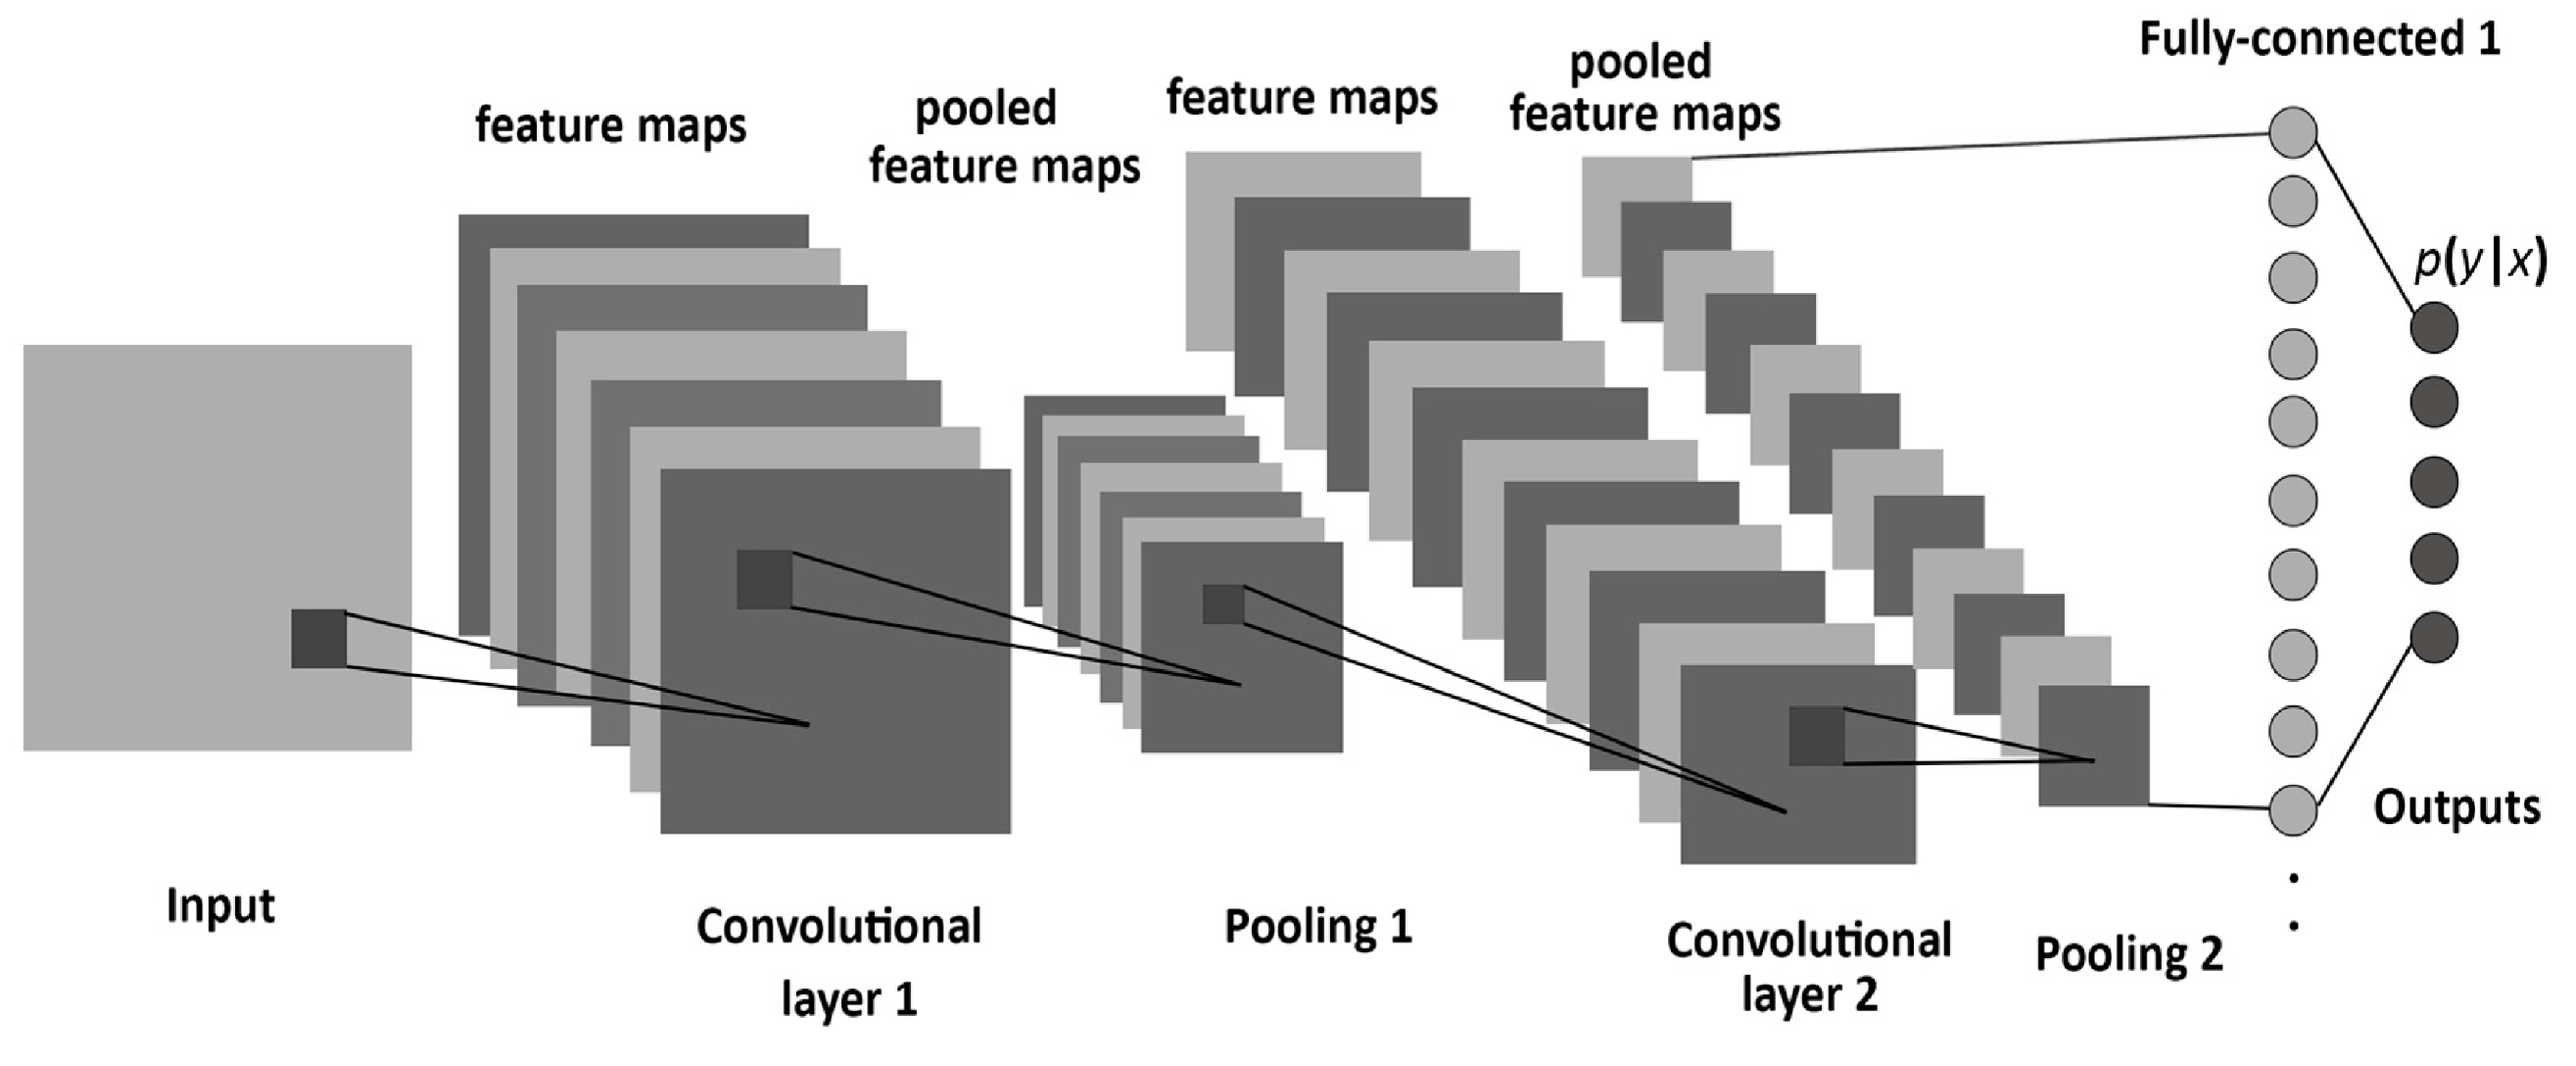
6]. Complementing these advancements with breakthroughs in deep learning has enabled the use of neural networks for defect detection, significantly improving accuracy and reliability. Convolutional neural networks (CNNs) have proven effective for anomaly detection [
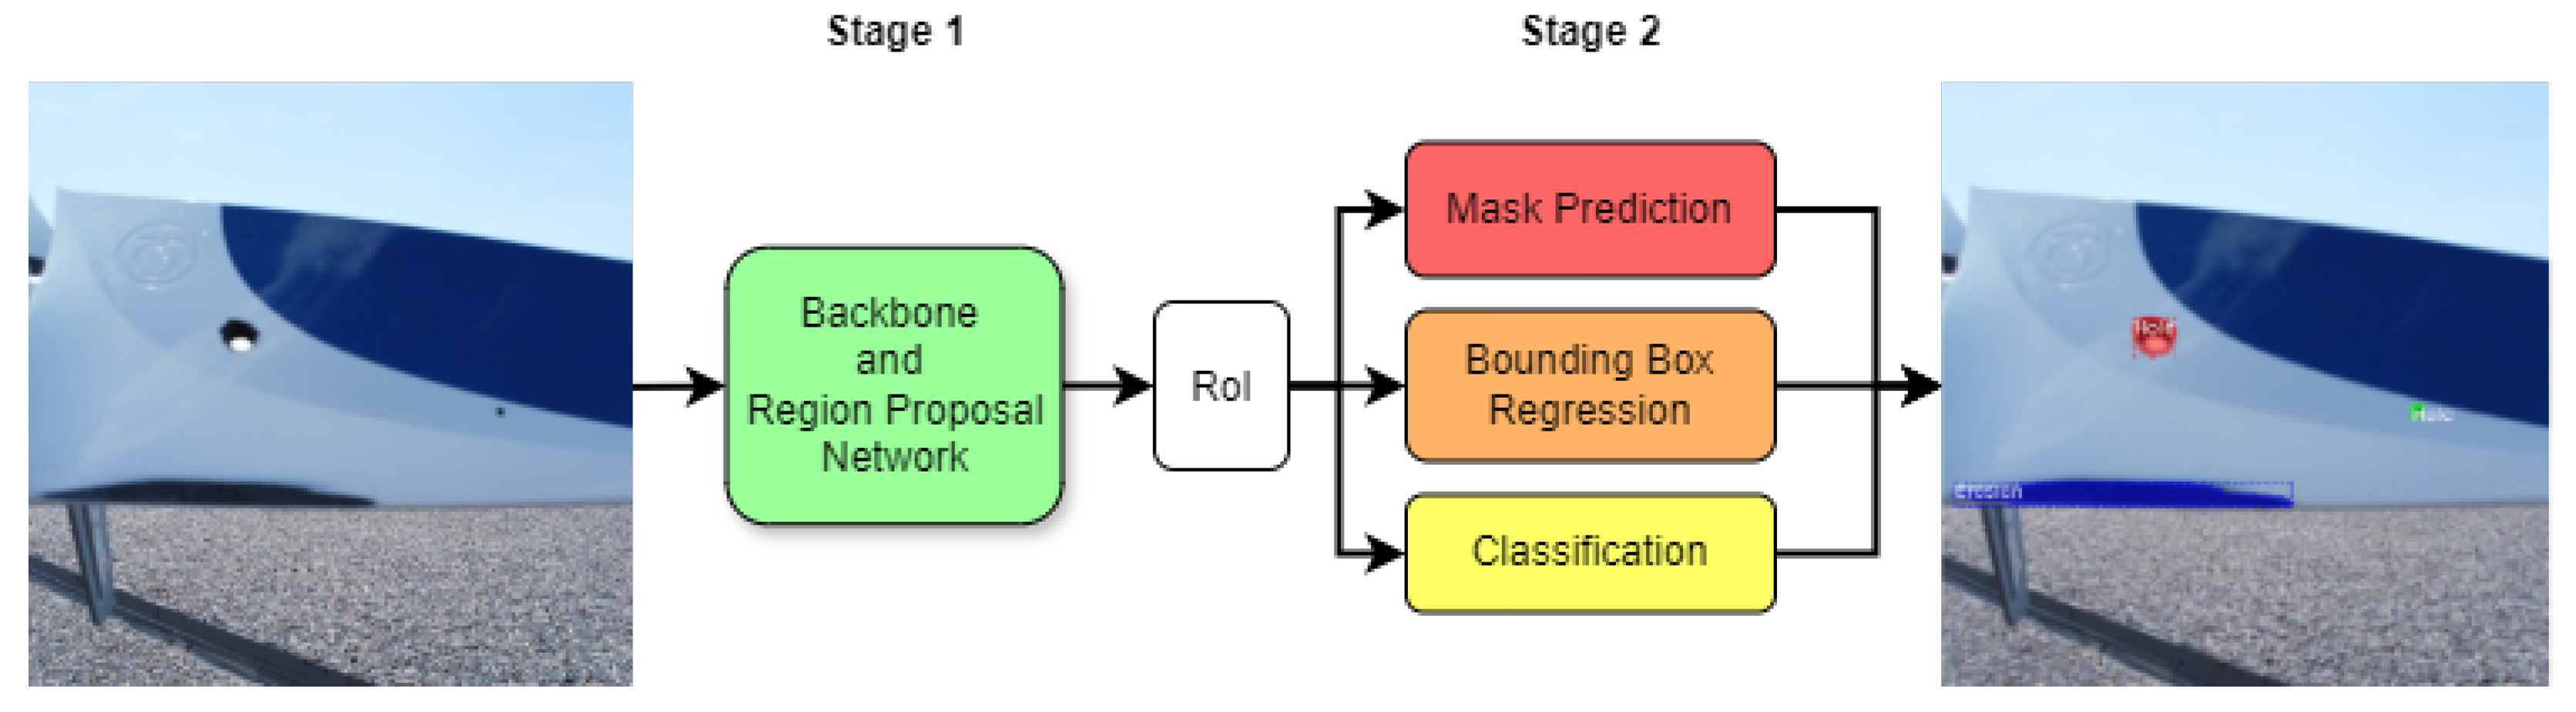
7], and sophisticated architectures such as YOLO, faster region-based CNN (R-CNN), and Mask R-CNN have shown promise in identifying and segmenting defects on turbine blades [8].
Building on these advancements, and previous works [3,7,9], this study focuses on enhancing the performance of Mask R-CNN for defect detection on wind turbine blades. As opposed to [7], which classifies the presence of WTB damage with deep learning neural networks, we propose a post-processing system designed to improve detection accuracy by leveraging fuzzy voting. Note that although [9] implements fuzzy logic as a dataset preprocessing step, it does not implement any voting between networks, nor is it applied to defect detection on wind turbine blades. Our proposed system aggregates outputs from multiple Mask R-CNN models and applies fuzzification techniques combined with various processing methods. The goal is to improve the robustness and reliability of defect detection, paving the way for more effective maintenance practices in the wind energy sector. The Mask R-CNN models used in this study utilize three different backbone networks: Visual Geometry Group 19-layer CNN (VGG19), Extreme Inception (Xception), and Residual Network 50-layer (ResNet-50). To our knowledge, voting systems have been applied to CNNs in the past [10] as well as Mask R-CNN [11]. However, ref. [10] utilized a basic weighted majority voting approach among various detection systems, resulting in only a slight improvement in accuracy for Pneumonia detection from chest X-ray radiograph images. Similarly, ref. [11] also proposed weighted majority voting with Mask R-CNN, using predictions’ confidence as the respective weights instead of manually assigned values. This led to significantly fewer false positives. We were unable to find any voting systems with similar applications that also utilize fuzzy logic. The key contributions of this paper are as follows:
  • The creation and annotation of a novel RGB dataset comprising 3000 aerial images depicting a Primus Air Max small wind turbine mimicking damages and defects that can be commonly found on wind turbine blades including cracks, holes, and edge erosion.
  • The implementation of Mask R-CNN architectures leveraging VGG19, Xception, and ResNet-50.
  • Detailed tuning strategy for the Mask R-CNN models utilizing the Hyperband algorithm.
  • The design, modeling, training, and implementation of a multi-variable fuzzy (MVF) voting system and a data preprocessing stage to utilize outputs from multiple Mask R-CNN models, thereby enhancing detection accuracy.
The remainder of this paper is organized as follows: The theoretical background of this paper is covered in Section 2. This includes the CNN backbone architectures, such as VGG19, Xception, and ResNet, as well as Mask R-CNN, and the mathematical basis for model evaluation and accuracy. Our self-created and annotated RGB dataset with cracks, holes, and edge erosion is presented in Section 3, along with the hyperparameter tuning of backbone architectures with Hyperband. The main innovation of this paper is the MVF voting system proposed in Section 4. The experimental results are presented in Section 5 followed by the conclusions and suggestions for future work in Section 6.

2. Theoretical Background

Drone-based wind turbine blade inspection is becoming a promising field, especially when aided by deep learning networks for improved defect detection [3]. However, manually piloting the drones may face some of the same issues as traditional inspections, so an autonomous system has been proposed [3]. Figure 1 illustrates one of the proposed methodologies for autonomous WTB inspection using drones and multiple stages of deep learning algorithms [3]. This approach represents a continuous improvement cycle, where each component informs and enhances the next, promoting ongoing innovation.

2.1. Convolutional Neural Networks (CNNs)

The three backbone architectures utilized in this paper—VGG19, Xception, and ResNet—are built upon CNNs. These networks employ kernels of varying sizes to establish connections between layers, significantly reducing computational complexity compared to a fully connected neural network. In each convolutional layer, the kernel is convolved with the input layer to create a 2D array known as the activation map or feature map [12]. These feature maps can be leveraged for image classification or integrated into advanced architectures such as Mask R-CNN and Faster R-CNN to perform object detection [13,14]. In the three employed models, each convolutional layer is followed by a pooling layer, which reduces the size of the respective feature maps. Figure 2 illustrates the common stages used to form most CNNs, including the backbones for Mask R-CNN in this research.

2.2. VGG19

VGG19, developed by the Visual Geometry Group at the University of Oxford, was introduced in 2014 by Andrew Zisserman and Karen Simonyan. This model is known for its simplicity, using small 3 × 3 convolutional filters stacked consecutively. This design enables the network to capture complex patterns in data while maintaining a low parameter count [16].
One of the main strengths of VGG19 is its depth and the use of uniform architecture, which facilitates the extraction of hierarchical features from images. The network comprises convolutional layers interspersed with max pooling layers, which progressively reduce the spatial dimensions of the feature maps. This deep architecture allows VGG19 to learn rich feature representations, making it highly effective for various tasks such as image classification, object detection, and image segmentation [16].

2.3. Xception

Xception is a deep convolutional neural network architecture designed to improve model efficiency and performance by leveraging the concept of depthwise separable convolutions. Introduced by François Chollet in 2017, Xception—short for “Extreme Inception”—represents an evolution of the Inception architecture. The model consists of 36 layers and incorporates depthwise separable convolution layers, referred to as Xception modules [17].
The architecture of Xception is structured into multiple modules, each comprising a series of depthwise separable convolutions followed by residual connections. These residual connections address challenges associated with training deep networks by facilitating smoother gradient flow, thereby improving the convergence of the model during training [17].

2.4. ResNet-50

ResNet is a deep convolutional neural network architecture that addresses the limitations associated with training very deep networks, particularly the vanishing gradient problem. Introduced by Kaiming He et al. in 2015 [18], ResNet-50 consists of 50 layers that leverage a residual learning framework. This design enables the network to learn residual mappings instead of direct mappings, allowing for an efficient training process. The architecture includes a combination of convolutional layers, batch normalization, and ReLU activation functions, which contribute to its robustness and performance [18].
The key feature of ResNet is the implementation of skip connections or shortcuts, which allow the gradient to bypass one or more layers during backpropagation. This is crucial for training deep networks, as it helps maintain the flow of gradients, effectively mitigating issues such as vanishing or exploding gradients. By incorporating skip connections, ResNet achieves faster convergence and higher accuracy. This innovative design allows the network to efficiently scale to hundreds of layers without experiencing performance degradation [18].

2.5. Mask Region-Based Convolutional Neural Network

Introduced by Kaiming He et al. in 2017, Mask R-CNN is an extension of the Faster R-CNN framework, which adds a branch for predicting segmentation masks alongside bounding boxes [13]. The architecture consists of two main stages illustrated in Figure 3.
  • Stage one consists of the backbone network, often built on established architectures like ResNet, and a region proposal network (RPN). The backbone extracts high-level feature maps from input images, while the RPN slides over these feature maps to generate region proposals. It predicts objectness scores and bounding box coordinates for anchor boxes of different scales and aspect ratios, enabling the identification of potential object locations [14].
  • Stage 2 processes the proposed regions. Each region undergoes classification, bounding box regression, and mask prediction. The mask branch, implemented as a fully convolutional network, generates binary masks for each detected instance, providing pixel-level segmentation for the identified objects [13].

2.6. Accuracy Metrics

To accurately assess performance for image segmentation tasks, it is essential to define appropriate metrics. The most widely used metric for evaluating image segmentation accuracy is mean average precision (mAP) [19]. It builds on the traditional concepts of precision and recall, where precision measures the ratio of correct predictions to total predictions while recall represents the ratio of correctly identified defects to the total number of actual defects, as shown in Equations (1) and (2):
Precision = TP TP + FP
Recall = TP TP + FN
where TP, FP, and FN are the total number of true positives, false positives, and false negatives, respectively. True positives are defined as any predictions with an Intersection Over Union (IoU) greater than 50% when compared to the ground truth mask. The IoU metric quantifies the similarity between two masks, as illustrated in Equation (3). Predictions with an IoU below 50% or those that misclassify the defect category relative to the ground truth are considered false positives.
Machines 13 00283 i001
To compute mAP, the average precision (AP) must first be calculated for each defect class: cracks, holes, and erosion. For each class, all predictions across the validation dataset are ranked in descending order of confidence. A cumulative list of precision and recall values is then created by iterating through these predictions. To account for minor variations in the curve, the precision values are interpolated, as outlined in [19]. Using the cumulative precision and recall values, a precision–recall curve is plotted, and the area under it represents the AP, as described in Equation (4):
AP i = n ( R ( n + 1 ) R n ) P interp . ( R n + 1 )
where R is the list of recall values and P interp . represents the interpolated precision [19]. The AP ranges from 0% to 100% and is visualized as the area under the curve in Figure 4. Finally, the mAP is determined by taking the average of the AP values for all classes, as defined in Equation (5):
mAP = 1 N i N AP i
The F1 score is another commonly used metric for evaluating performance in binary or multi-class classification tasks. It is defined as the harmonic mean of precision and recall, providing a balanced evaluation that accounts for both false positives and false negatives, as outlined in Equation (6):
F 1 Score = 2 · Precision · Recall Precision + Recall
Unlike mAP, the F1 score is calculated using the overall precision and recall values, which are derived from the total counts of true positives, false positives, and false negatives. It is simpler to calculate and highlights the importance of balancing correct predictions while minimizing incorrect guesses.

3. Self-Created Dataset and Hyperparameter Tuning

3.1. Self-Created and Annotated RGB Dataset with Cracks, Holes, and Edge Erosion

The Mask R-CNN models were trained on a custom, self-produced dataset of 3000 RGB images. The original dataset consisted of 6000 images depicting a small-scale wind turbine (12V Primus Air Max wind turbine), each measuring 300 × 300 pixels. Among these, 4000 indoor images were captured by a smartphone, while 2000 outdoor images were taken with DJI Mini SE and DJI Mini 3 Pro drones at Utah Valley University (UVU) [7].
To focus on defect detection, the dataset was filtered to include only the 3000 images with visible defects. These images were manually curated and annotated for three defect classes: cracks, holes, and edge erosion. The resulting annotations include 5335 cracks, 1632 holes, and 3424 edge erosion defects. Examples of images, both with and without annotations, are shown in Figure 5.
The dataset was split into 2100 training images, 600 test images, and 300 validation images to evaluate the performance of Mask R-CNN with the three backbones.

3.2. Hyperparameter Tuning with Hyperband

The three backbones for Mask-RCNN (Xception, VGG19, and ResNet-50) include configurable settings known as hyperparameters, which were optimized through a process called hyperparameter tuning [20]. Since training the models requires substantial computation time and resources, an algorithm approach was used to identify the most effective hyperparameters. The Hyperband algorithm was selected due to its proven efficiency in prior work [9]. To properly integrate Hyperband into the Matterport codebase, a custom implementation was developed in-house.
The Hyperband algorithm starts by randomly generating hyperparameter configurations, allocating each a specific computational budget [21]. It trains the CNN using these configurations and eliminates underperforming ones in successive rounds. With each iteration, the number of configurations is reduced while their computational budgets are increased, increasing the training times. This approach ensures that configurations optimal for short training runs do not overshadow those yielding the best overall performance. For example, a high learning rate may initially boost performance but might not result in the best accuracy after extended training.
Most hyperparameters tuned in this study were applicable to the Mask R-CNN network as a whole and were already included as configurable options [22]. Hyperparameters specific to any of the individual backbone models were excluded from tuning for simplicity. The hyperparameters selected and tuned for all models are as follows [23,24,25]:
  • Learning rate: Determines the step size for weight updates during training. Higher learning rates accelerate training but may compromise long-term accuracy.
  • Learning momentum: Influences how past gradients affect current weight updates [23].
  • Weight decay: L 2 Regularization penalizes large weights to prevent the network from overfitting. The strength of this penalty is controlled by the weight decay hyperparameter [24].
  • Gradient clip norm: Addresses exploding gradients by rescaling them when they exceed a specified threshold. The gradient clip norm hyperparameter defines this threshold [25].
  • Image Rescale Size: Images in the dataset (300 × 300 pixels) in Section 3.1 are resized when read into the Mask R-CNN network. Higher resolutions preserve more detail, increasing model accuracy but at the cost of slower training speed and higher memory usage.
For each hyperparameter, a reasonable selection of values was chosen, from which Hyperband selected random choices to generate configurations. After multiple Hyperband searches, the top hyperparameter configurations for each backbone are presented in Table 1. Hyperparameter tuning significantly improved model performance, increasing the accuracy by 8–13%. Table 2 shows the impact of hyperparameter tuning on the accuracy of each of the three backbones.

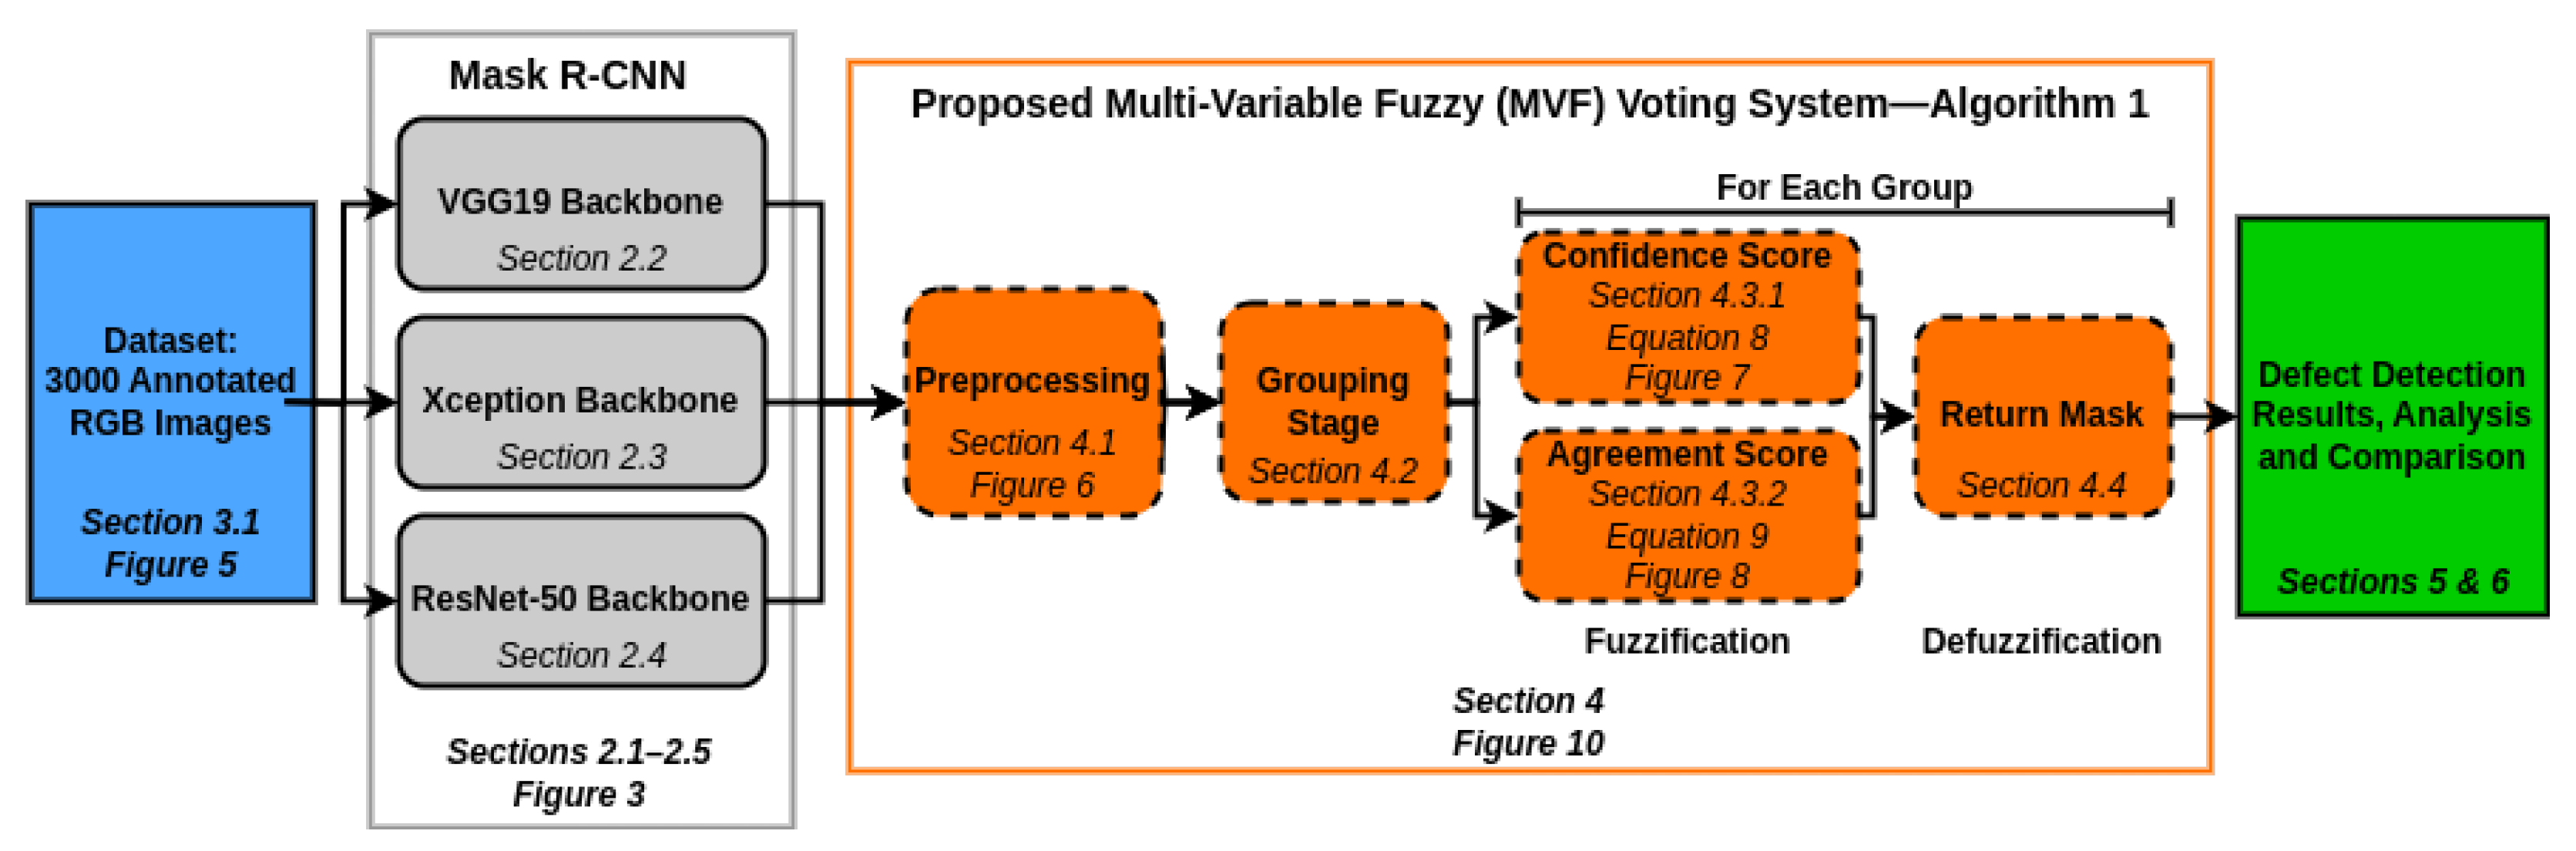
4. Proposed Multi-Variable Fuzzy (MVF) Voting for Defect Detection Using Mask R-CNN with Xception, ResNet, and VGG19 Backbones

Fuzzy logic provides a robust approach to reasoning under uncertainty by enabling input variables to continuously range from 0 to 1, rather than exclusively taking binary true/false values. This characteristic makes fuzzy logic particularly effective for decision-making with imprecise or ambiguous input parameters such as image-based defect detection, where outputs often exhibit ambiguity and partial correctness. Therefore, it is used to combine results and facilitate voting among different Mask R-CNN models.
We propose a multi-variable fuzzy (MVF) voting system, which leverages fuzzy inference to integrate predictions from three Mask R-CNN models (Xception, ResNet, and VGG19) and produce a refined set of defect masks for wind turbine blades. In this research, MVF voting refers solely to the proposed methodology and does not have an established meaning beyond identification. The MVF system comprises the following key components: crisp input extraction, input variable fuzzification, fuzzy rule-based inference, defuzzification, and refined output generation. Each step is explained in detail below.

4.1. Crisp Input Extraction and Preprocessing

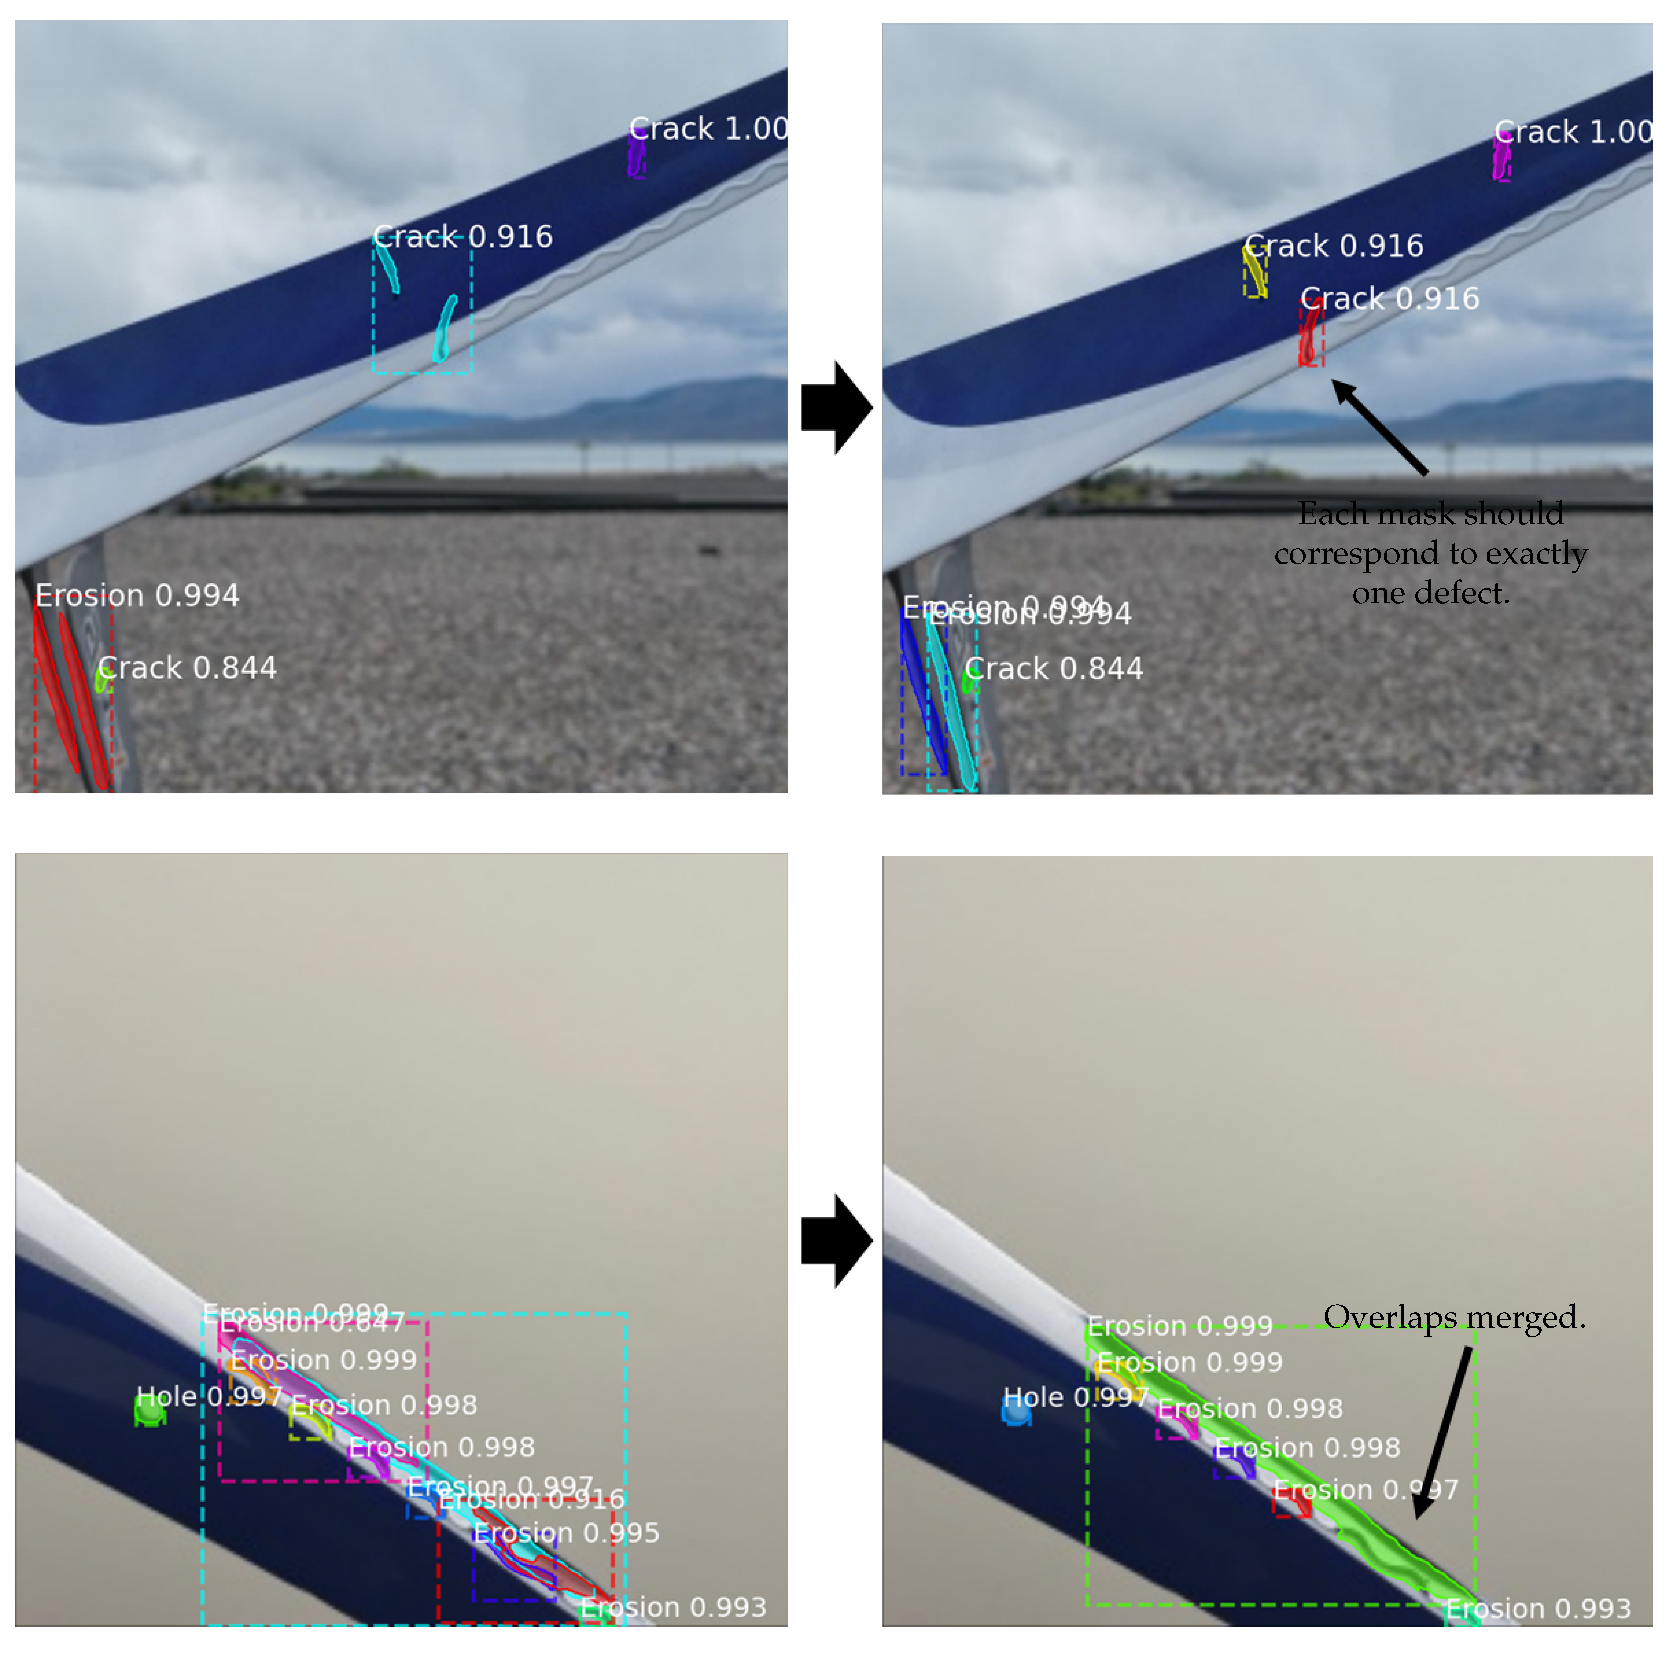
Predictions from all Mask R-CNN backbones (Xception, ResNet, and VGG19) often exhibit issues such as overlapping masks, fragmented masks, or empty masks with only a few pixels. To address this, we apply a mask preprocessing stage, which includes:
  • Mask isolation: Masks containing multiple disconnected regions are separated into individual masks, each corresponding to a single defect. Isolated masks are identified using SciPy’s ndimage.label function [26].
  • Noise filtering: Masks with an area smaller than a defined threshold (five or fewer pixels) are discarded.
  • Mask merging: Highly overlapping masks are merged using a logical OR operation to prevent duplicates.
These preprocessing steps are applied to the output of each backbone individually, reducing false positives and forming the foundation for subsequent fuzzy reasoning. Figure 6 illustrates the impact of the mask-cleaning pipeline on Mask R-CNN predictions.

4.2. Grouping of Mask Predictions

To facilitate voting among masks, it is essential to identify which masks correspond to the same defect. Predictions from different models that overlap are grouped together. Each group becomes an individual unit for fuzzy evaluation. For example, if all three models predict a defect in the same area of the image, their masks are grouped together. However, if overlapping predictions refer to distinct defect types (e.g., a crack and a hole), separate groups are maintained.

4.3. Fuzzification of Input Variables

In this stage, the MVF voting system evaluates each group of masks to determine whether it represents a true positive or a false positive. If the group is deemed valid, the best mask within the group is selected and included in the output.
Fuzzification maps crisp input values to fuzzy sets using defined membership functions. Two fuzzy input variables are defined and used:
  • Confidence score (c): Derived from the maximum confidence value among all masks in a group as described in Section 4.3.1.
  • Agreement score (
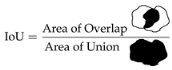
a): Based on the maximum Intersection over Union (IoU) among the masks in the group as described in Section 4.3.2.
These fuzzy variables are transformed into fuzzy values using linear clamped membership functions, described in Equation (7):
λ x , a , b = clamp x a b a , 0 , 1
where x represents the input value (e.g., confidence, IoU, etc.), a is the starting point of interpolation, and b marks the endpoint, beyond which the function remains constant at 1.

4.3.1. Confidence Score

The Mask R-CNN network assigns a confidence value between 0% to 100% to each prediction. This confidence level was identified as the most reliable indicator of a mask’s quality, making it a critical factor in the voting process. To generate the confidence score, the highest confidence among the masks in a group is used as input to Equation (8), as shown in Figure 7.
c = λ max ( X . Conf . , V . Conf . , R . Conf ) , 0.85 , 0.95
where c is the confidence score, and X. Conf., V. Conf., and R. Conf. are the respective confidence values from the Xception, VGG19, and ResNet-50 masks, respectively. The membership function used to calculate the confidence score, c, is visualized in Figure 7.

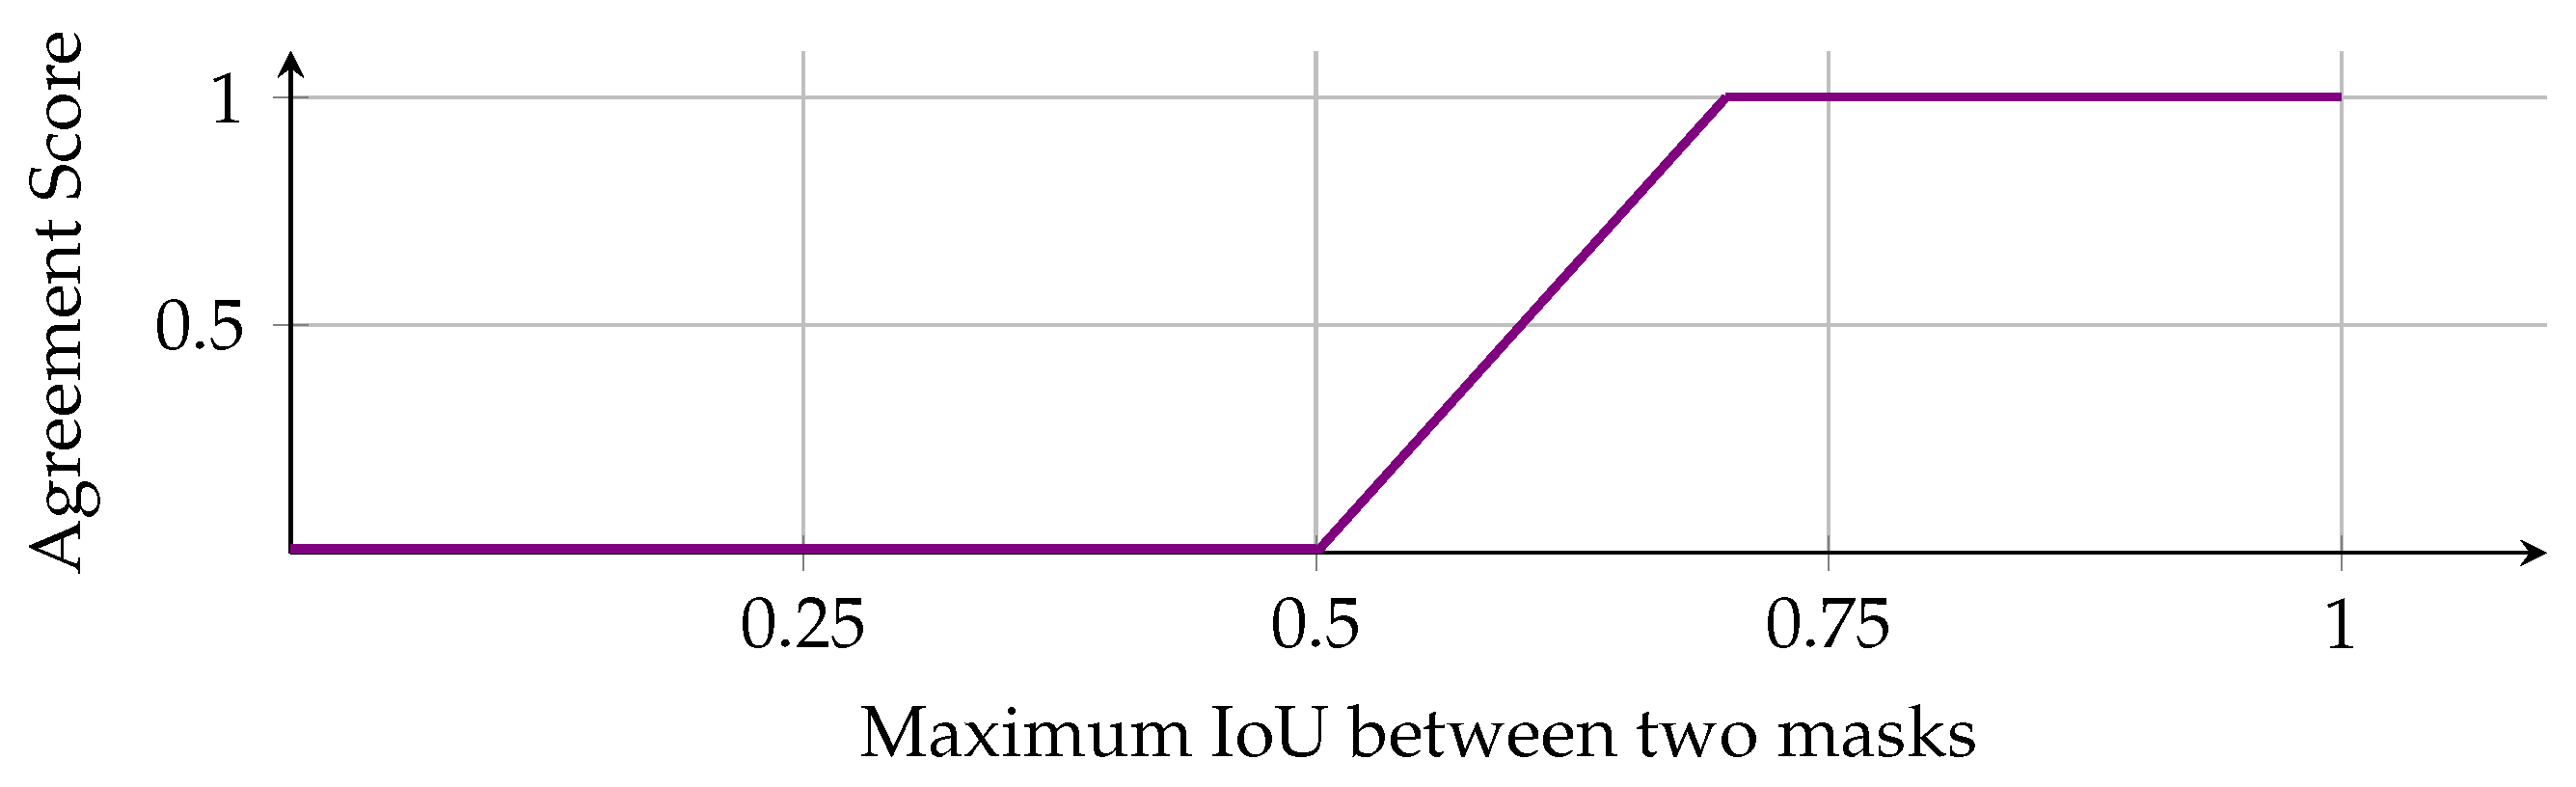
4.3.2. Agreement Score

When all three models predict damage in the same area of a wind turbine blade, it strongly indicates true damage. The MVF voting system incorporates this by creating the agreement score, a, which quantifies the level of agreement between the models. This score is derived by fuzzifying the maximum IoU between the three models, as defined in Equation (9) and illustrated in Figure 8.
a = λ max ( IoU X V , IoU V R , IoU R X ) , 0.5 , 0.7
where IoU X V , IoU R V , and IoU R X represent the IoUs between “Xception and VGG19”, “VGG19 and ResNet-50”, and “ResNet-50 and Xception”, respectively. This relationship is visualized in Figure 8. The agreement score, a, is a constant for each group and does not vary between individual masks.

4.4. Defuzzification and Decision Threshold

The fuzzy inference output is defuzzified to a crisp value representing the group validity score (v). A simple aggregation method is used to calculate the group validity score from the confidence and agreement scores, as seen in Equation (10).
v = c + a
where v is the validity score, c is the confidence score, and a is the agreement score. If v 0.8 , the group is accepted as a valid detection, and the mask with the highest individual confidence is selected as the group’s representative output. Otherwise, the group is discarded.
The final output of the MVF voting system is a consolidated and refined set of high-quality defect masks. By leveraging fuzzy reasoning and integrating predictions from diverse backbone architectures, the MVF voting system enhances detection accuracy, robustness, and generalization beyond what any single model can achieve. The steps of the proposed MVF voting system are delineated in Figure 9, illustrated in Figure 10, and enumerated in Algorithm 1.
Algorithm 1 Multi-variable fuzzy (MVF) defect Mask R-CNN voting.
Input: Mask R-CNN predictions from Xception, VGG19, and ResNet-50 for one image.
Output: A new set of masks.
1:
Cleaning:
2:
   Split isolated masks.
3:
   Discard small masks.
4:
   Merge overlapping masks.
5:
Grouping: Group masks that overlap together.
6:
Fuzzification: For each group, calculate the degree of membership for both the confidence score and agreement score.
7:
    c = λ max ( X . Conf . , V . Conf . , R . Conf ) , 0.85 , 0.95
8:
    a = λ max ( IoU X V + IoU V R + IoU R X ) , 0.5 , 0.7
9:
Defuzzification:
10:
v = c + a :
11:
If  v 0.8 :
12:
   The group passes.
13:
   Return the highest confidence mask.

5. Experimental Results

The Mask R-CNN models with VGG19, Xception, and ResNet-50 backbones were trained and evaluated using the created dataset introduced in Section 3.1. Each backbone underwent hyperparameter tuning, and the optimal hyperparameters, as detailed in Section 3.2, were used to generate the results provided in Table 3, Table 4, Table 5, Table 6, Table 7, Table 8 and Table 9. Validations were performed on a separate dataset of 300 images; the accuracies of the three base models and the proposed MVF voting system are presented in Table 3.
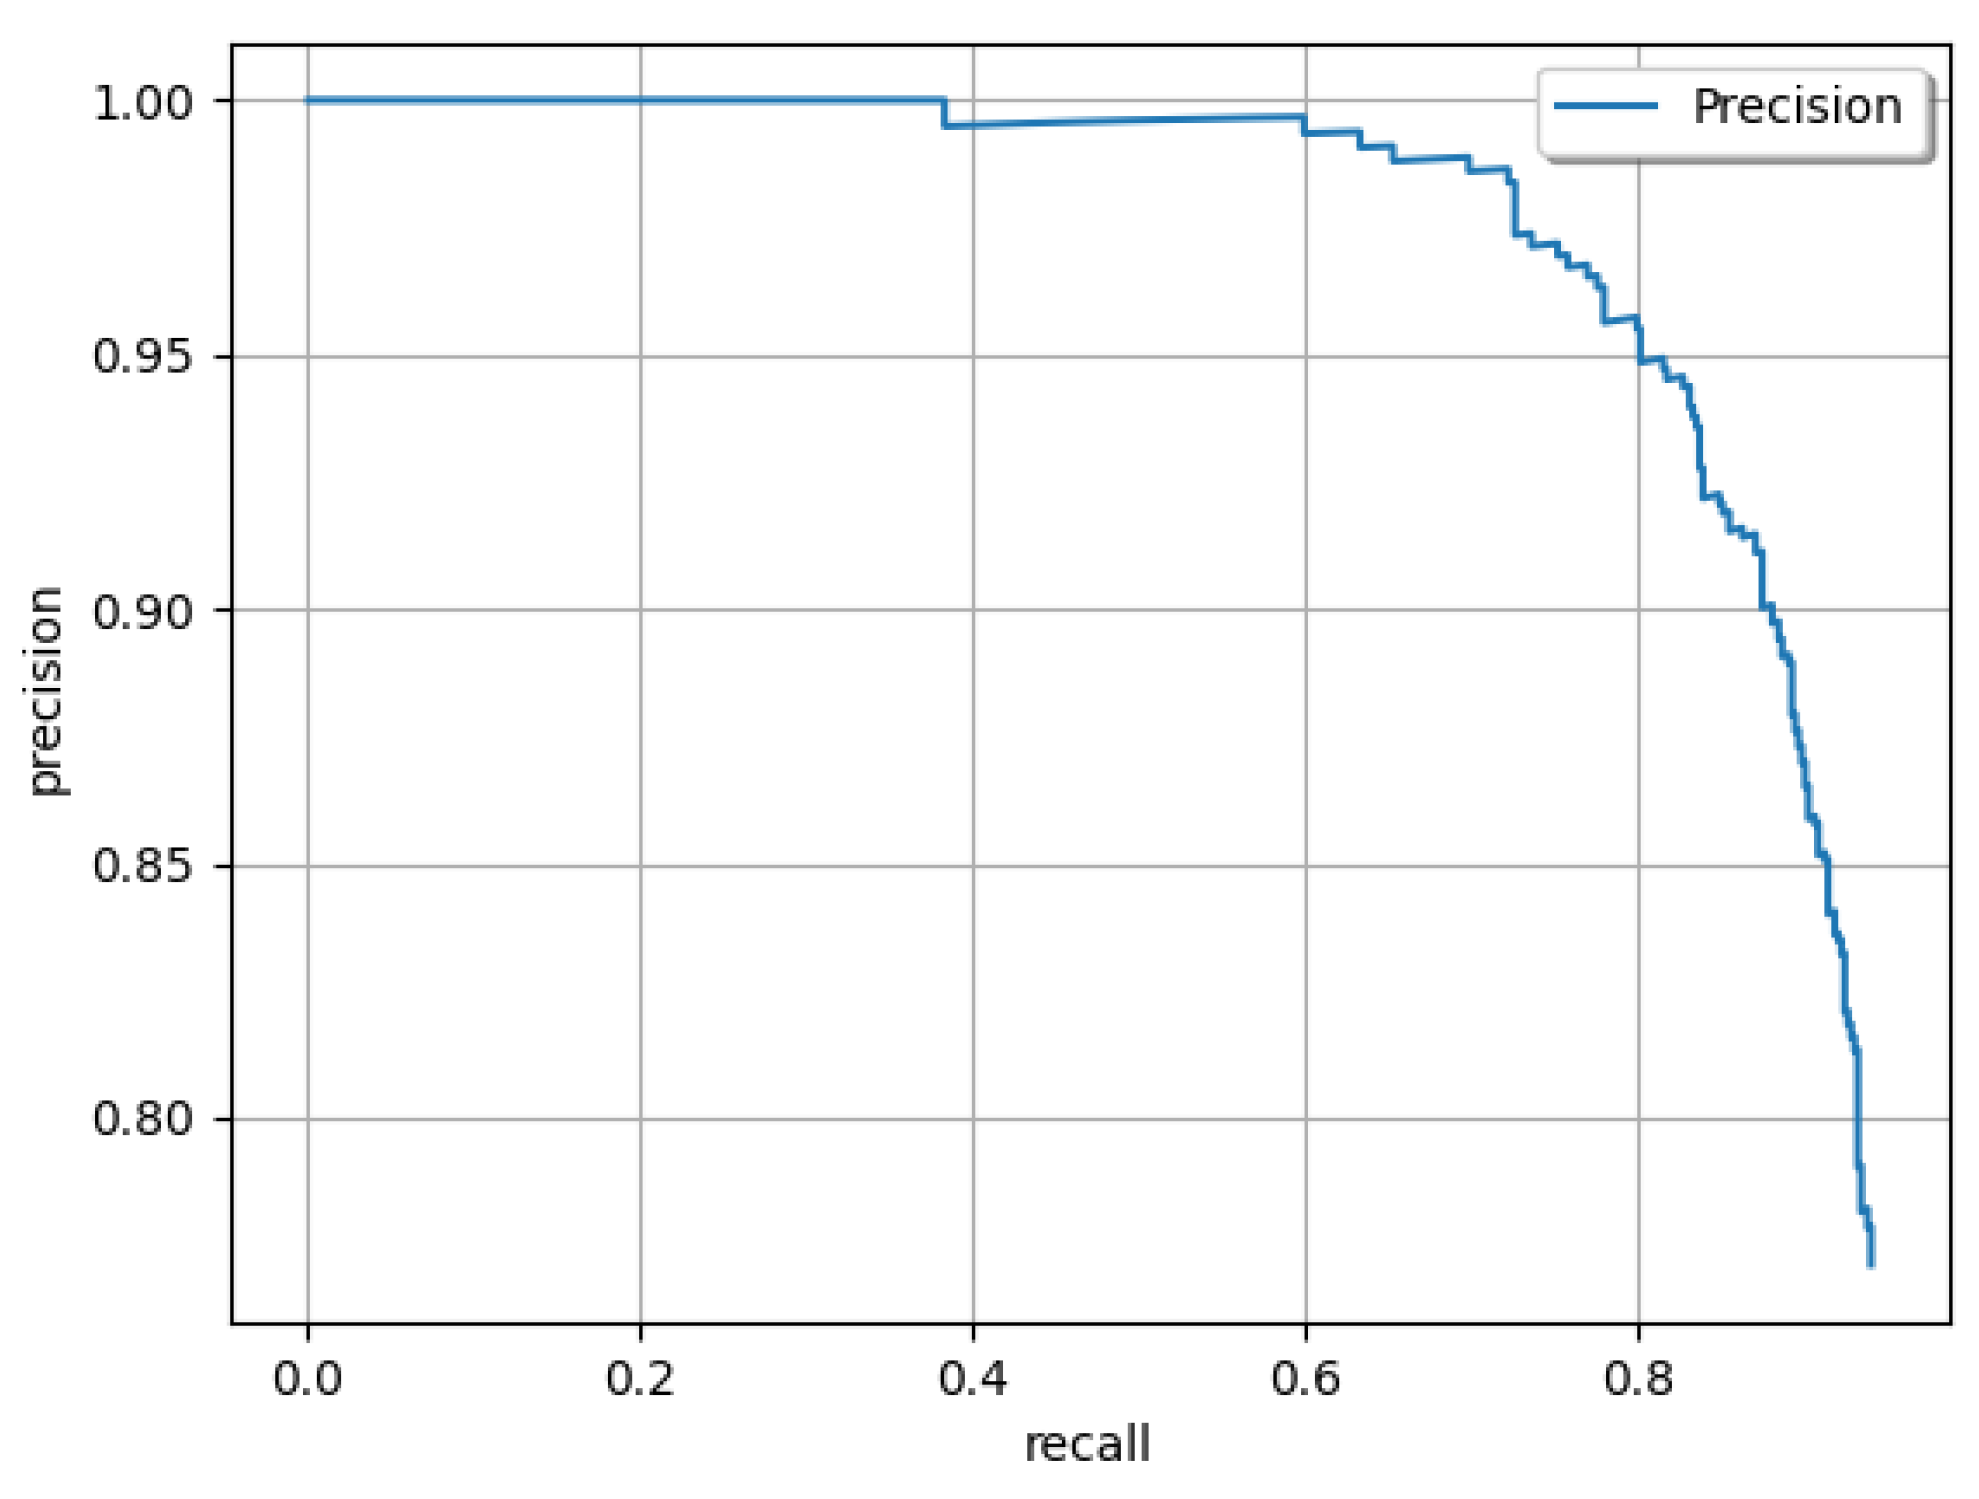
  • Among individual backbones, Xception achieved the highest performance with an mAP of 77.48% (Table 3, row 1, column 2). The best F1 score, 78.33%, was achieved by VGG19 (Table 3, row 2, column 3).
  • The predictions from all three models were further processed using the proposed MVF voting system, which improved accuracy.
  • The most notable improvement was observed in mAP, as it was the primary focus during the development of the voting system. However, no improvement was observed in the secondary metric, the F1 score, indicating that the models were already well-balanced in terms of precision and recall.
  • The MVF voting system increased the mAP by nearly 3%, from Xception’s 77.48% to 80.10%, as shown in the second column of Table 3 in rows 2 and 5, respectively. This improvement was achieved by prioritizing recall at the expense of precision, resulting in a slight decline in the F1 score.
Detailed class-based results from the proposed MVF voting system are provided in Table 4. For completeness, matching results are also provided for the Xception, VGG19, and ResNet-50 backbones individually, in Table 5, Table 6, and Table 7, respectively.
  • MVF outperformed Xception for all damage types except holes.
  • MVF outperformed VGG19 for all damage types except cracks.
  • ResNet-50 had the highest Recall for crack detection, even surpassing MVF, which had the highest recall across the board for other types of damage.
  • Each model was excellent at recognizing holes in wind turbine blades. Xception was the best with an mAP of 90.22%, being the only model to rise above 90% for any class.
  • Edge erosion proved to be the most challenging defect type for the models to identify. MVF voting achieved the highest mAP at 70.58%, exceeding the next-best model, VGG19, by over 5%.
The computational cost of the proposed MVF voting system is comparable to the cost of the three individual models. In order to use the voting system, Mask R-CNN predictions using each of the three backbones must be generated first. This is computationally intensive, as the deep neural networks require a significant amount of video memory (VRAM) to operate. A quick benchmark was performed, averaging the computation time of each step across the validation subset of the dataset (300 images). The results are presented in Table 8.
The intended use case of the proposed MVF voting system is for static, offline processing of images, where speed is not as important. For real-time applications, to speed up inference, we propose using only one of the individual models. Xception, for example, has the highest precision for holes and erosion, as seen in Table 5. VGG19 has the highest precision for cracks, as seen in Table 6, making it a compelling candidate as well.
A notable advantage of the proposed MVF voting system is that it is highly customizable, with adjustable fuzzy parameters that can be adapted to specific applications, such as optimizing for precision or F1 scores in targeted use cases. A modified version of the MVF voting system was developed specifically to maximize the F1 score. This adjustment involved altering the membership function for the confidence score to range from 0.9 to 1.0, while the agreement score function was modified to range from 0.8 to 1.0. Additionally, the final cutoff threshold was increased from 0.8 to 0.9. The process of optimizing the voting system parameters was manual and not comprehensive. From experience, we knew that increasing the quality cutoff for each group would increase the F1 score at the expense of mAP. Initial values for the parameters, numerically larger than before, were chosen by hand, and then iteratively adjusted with small nudges to arrive at the above set of F1 score-focused parameters. As a result, the modified MVF voting system achieved an F1 score of 80.07%, nearly 2% higher than the next best model, VGG19. Detailed class-based accuracy results for this alternative MVF voting system are provided in Table 9.

6. Conclusions

To facilitate fully automated wind turbine blade inspection using deep learning and drones, three Mask R-CNN models with Xception, VGG19, and ResNet-50 backbones were developed, trained, and evaluated. The models were trained on a novel dataset created at Utah Valley University, which consists of 3000 RGB images (300 × 300 pixels) annotated with three common types of defects: cracks, holes, and edge erosion. To further improve defect detection accuracy, a multi-variable fuzzy (MVF) voting system was proposed, trained, and implemented. The MVF voting system functions as follows: (i) it takes sets of binary masks from the three Mask R-CNN models (VGG19, Xception, and ResNet-50) as input, (ii) preprocesses the input masks to clean them and groups any overlapping masks, and (iii) employs fuzzy logic to process each group, selecting the optimal masks to generate the final output.
The results showed that the fuzzy voting system significantly outperformed the individual models, providing a promising step toward safer and more efficient automated inspections of wind turbine blades. Among individual backbones, Xception achieved the highest mAP of 77.48% (Table 5), while the proposed MVF voting systems improved the mAP score by nearly 3% to 80.10% (Table 4). VGG19 had the highest F1 score among individual models at 78.33% (Table 6).
A key advantage of the proposed MVF voting system is its high customizability, with adjustable parameters to suit specific applications. For instance, a modified version of the MVF voting system, optimized for F1 score, improved the F1 performance from 74.52% (achieved by the unmodified MVF, Table 4) to 80.07% (Table 9). This score surpasses those of Xception (77.51%, Table 5), VGG19 (78.33%, Table 6), and ResNet-50 (74.52%, Table 7).
Our future research will aim to improve the fuzzy voting system and explore new voting mechanisms capable of integrating more than three input models. A key approach to increase the accuracy would be to train the deep learning networks on a dataset larger than 3000 images. That will be a focus for future work, as well as extending the defect analysis to include fuzzy fault size computation, enhancing the depth of inspection insights.

Author Contributions

Conceptualization, M.A.S.M.; methodology, R.P., C.A. and M.A.S.M.; software, R.P. and C.A.; validation, R.P., C.A. and M.A.S.M.; formal analysis, R.P. and C.A.; investigation, R.P., C.A. and M.A.S.M.; resources, M.A.S.M.; data curation, M.A.S.M.; writing—original draft preparation, R.P., C.A. and M.A.S.M.; writing—review and editing, M.A.S.M. and A.S.; visualization, R.P., C.A. and M.A.S.M.; supervision, M.A.S.M.; project administration, M.A.S.M.; funding acquisition, M.A.S.M. and A.S. All authors have read and agreed to the published version of the manuscript.

Funding

This work is supported by the Office of the Commissioner of the Utah System of Higher Education (USHE)-Deep Technology Initiative Grant 20210016UT.

Data Availability Statement

Data are contained within the article.

Acknowledgments

We extend our gratitude to Mohammad Shekaramiz for his oversight and management of the project (USHE Grant 20210016UT) prior to his untimely passing in December 2024. We would also like to thank Kaden Clements and Nathan Archer for their assistance in creating the annotated dataset described in Section 3.1.

Conflicts of Interest

The authors declare no conflicts of interest.

References

  1. Lee, J.; Zhao, F.; Global Wind Energy Council. Global Wind Report 2024. Available online: https://www.gwec.net/reports/globalwindreport (accessed on 29 March 2025).
  2. Katsaprakakis, D.A.; Papadakis, N.; Ntintakis, I. A Comprehensive Analysis of Wind Turbine Blade Damage. Energies 2021, 14, 5974. [Google Scholar] [CrossRef]
  3. Memari, M.; Shakya, P.; Shekaramiz, M.; Seibi, A.C.; Masoum, M.A.S. Review on the Advancements in Wind Turbine Blade Inspection: Integrating Drone and Deep Learning Technologies for Enhanced Defect Detection. IEEE Access 2024, 12, 33236–33282. [Google Scholar] [CrossRef]
  4. Wang, W.; Xue, Y.; He, C.; Zhao, Y. Review of the Typical Damage and Damage-Detection Methods of Large Wind Turbine Blades. Energies 2022, 15, 5672. [Google Scholar] [CrossRef]
  5. GEV Wind Power. 2024 Wind Turbine Blade Inspection. Available online: https://www.gevwindpower.com/blade-inspection/ (accessed on 10 December 2024).
  6. Kabbabe Poleo, K.; Crowther, W.J.; Barnes, M. Estimating the Impact of Drone-Based Inspection on the Levelised Cost of Electricity for Offshore Wind Farms. Results Eng. 2021, 9, 100201. [Google Scholar] [CrossRef]
  7. Altice, B.; Nazario, E.; Davis, M.; Shekaramiz, M.; Moon, T.K.; Masoum, M.A.S. Anomaly Detection on Small Wind Turbine Blades Using Deep Learning Algorithms. Energies 2024, 17, 982. [Google Scholar] [CrossRef]
  8. Zhang, J.; Cosma, G.; Watkins, J. Image Enhanced Mask R-CNN: A Deep Learning Pipeline with New Evaluation Measures for Wind Turbine Blade Defect Detection and Classification. J. Imaging 2021, 7, 46. [Google Scholar] [CrossRef] [PubMed]
  9. Ward, Z.; Miller, J.; Engel, J.; Masoum, M.A.S.; Shekaramiz, M.; Seibi, A. Fuzzy-Based Image Contrast Enhancement for Wind Turbine Detection: A Case Study Using Visual Geometry Group Model 19, Xception, and Support Vector Machines. Machines 2024, 12, 55. [Google Scholar] [CrossRef]
  10. Ko, H.; Ha, H.; Cho, H.; Seo, K.; Lee, J. Pneumonia Detection with Weighted Voting Ensemble of CNN Models. In Proceedings of the 2019 2nd International Conference on Artificial Intelligence and Big Data (ICAIBD), Chengdu, China, 25–28 May 2019; pp. 306–310. [Google Scholar] [CrossRef]
  11. Zhang, R.; Cheng, C.; Zhao, X.; Li, X. Multiscale Mask R-CNN–Based Lung Tumor Detection Using PET Imaging. Mol. Imaging 2019, 18, 1536012119863531. [Google Scholar] [CrossRef] [PubMed]
  12. O’Shea, K.; Nash, R. An Introduction to Convolutional Neural Networks. arXiv 2015, arXiv:1511.08458. [Google Scholar] [CrossRef]
  13. He, K.; Gkioxari, G.; Dollár, P.; Girshick, R.B. Mask R-CNN. arXiv 2017, arXiv:1703.06870. [Google Scholar] [CrossRef]
  14. Ren, S.; He, K.; Girshick, R.; Sun, J. Faster R-CNN: Towards Real-Time Object Detection with Region Proposal Networks. arXiv 2016, arXiv:1506.01497. [Google Scholar] [CrossRef] [PubMed]
  15. Albelwi, S.; Mahmood, A. A Framework for Designing the Architectures of Deep Convolutional Neural Networks. Entropy 2017, 19, 242. [Google Scholar] [CrossRef]
  16. Simonyan, K.; Zisserman, A. Very Deep Convolutional Networks for Large-scale Image Recognition. arXiv 2014, arXiv:1409.1556. [Google Scholar] [CrossRef]
  17. Chollet, F. Xception: Deep Learning with Depthwise Separable Convolutions. In Proceedings of the 2017 IEEE Conference on Computer Vision and Pattern Recognition (CVPR), Honolulu, HI, USA, 21–26 July 2017; pp. 1800–1807. [Google Scholar] [CrossRef]
  18. He, K.; Zhang, X.; Ren, S.; Sun, J. Deep Residual Learning for Image Recognition. arXiv 2015, arXiv:1512.03385. [Google Scholar] [CrossRef]
  19. Padilla, R.; Netto, S.L.; da Silva, E.A.B. A Survey on Performance Metrics for Object-Detection Algorithms. In Proceedings of the 2020 International Conference on Systems, Signals and Image Processing (IWSSIP), Niteroi, Brazil, 1–3 July 2020; pp. 237–242. [Google Scholar] [CrossRef]
  20. Talashilkar, R.; Tewari, K. Analyzing the Effects of Hyperparameters on Convolutional Neural Network & Finding the Optimal Solution with a Limited Dataset. In Proceedings of the 2021 International Conference on Advances in Computing, Communication, and Control (ICAC3), Mumbai, India, 3–4 December 2021; pp. 1–5. [Google Scholar] [CrossRef]
  21. Li, L.; Jamieson, K.; DeSalvo, G.; Rostamizadeh, A.; Talwalkar, A. Hyperband: A Novel Bandit-Based Approach to Hyperparameter Optimization. J. Mach. Learn. Res. 2016, 18, 1–52. [Google Scholar] [CrossRef]
  22. Abdulla, W. Mask R-CNN for object detection and instance segmentation on Keras and TensorFlow. 2017. Available online: https://github.com/matterport/Mask_RCNN (accessed on 30 October 2024).
  23. Shi, B. On the Hyperparameters in Stochastic Gradient Descent with Momentum. arXiv 2022, arXiv:2108.03947. [Google Scholar] [CrossRef]
  24. Cortes, C.; Mohri, M.; Rostamizadeh, A. L2 Regularization for Learning Kernels. arXiv 2012, arXiv:1205.2653. [Google Scholar] [CrossRef]
  25. Pascanu, R.; Mikolov, T.; Bengio, Y. On the Difficulty of Training Recurrent Neural Networks. arXiv 2013, arXiv:1211.5063. [Google Scholar] [CrossRef]
  26. Virtanen, P.; Gommers, R.; Oliphant, T.E.; Haberland, M.; Reddy, T.; Cournapeau, D.; Burovski, E.; Peterson, P.; Weckesser, W.; Bright, J.; et al. SciPy 1.0: Fundamental Algorithms for Scientific Computing in Python. Nat. Methods 2020, 17, 261–272. [Google Scholar] [CrossRef] [PubMed]
Figure 1. Methodology for autonomous WTB inspection utilizing drones and deep learning algorithms [3].
Machines 13 00283 g001
Figure 2. General structure of a CNN [7,15].
Machines 13 00283 g002
Figure 3. Mask R-CNN structure.
Machines 13 00283 g003
Figure 4. Illustration of a precision–recall curve. Each prediction in the validation set contributes a point to the curve, which is then strictly decreasing or constant due to the interpolation step. The area under the curve represents the average precision (AP).
Machines 13 00283 g004
Figure 5. Samples from the self-created dataset captured at UVU with the raw images (left) and annotated images (right).
Machines 13 00283 g005
Figure 6. Sample images from the self-created dataset before (left column) and after (right column) mask cleaning. Overlapping masks are combined while disconnected masks are separated.
Machines 13 00283 g006
Figure 7. Fuzzy membership function used to calculate the confidence score, c (Equation (8)).
Machines 13 00283 g007
Figure 8. Fuzzy membership function used to calculate the agreement score a (Equation (9)).
Machines 13 00283 g008
Figure 9. Overview of the proposed MVF voting system (Algorithm 1) for detecting defects in wind turbine blades using Mask R-CNN.
Machines 13 00283 g009
Figure 10. Visualization of how the proposed MVF voting system affects binary masks on an input image.
Machines 13 00283 g010
Table 1. Optimal hyperparameter configurations for the three backbones.
ParameterXceptionVGG19ResNet-50
Learning Rate0.010.0010.005
Learning Momentum0.10.90.5
Weight Decay0.0010.00050.001
Gradient Clip Norm.4.05.012.0
Image Dimensions832 × 832832 × 832832 × 832
Table 2. Comparison of best model accuracy before and after hyperparameter tuning.
ModelmAP Before Hyperparameter TuningmAP After Hyperparameter Tuning
Xception64.19%77.48%
VGG1969.61%77.30%
ResNet-5061.10%72.98%
Table 3. Defect detection accuracy: mAP and F1 score comparison of the individual backbones compared to the proposed MVF voting system.
Model/Voting SystemmAPF1 Score
Xception77.48%77.51%
VGG1977.30%78.33%
ResNet-5072.98%74.52%
Proposed MVF Voting *80.10%74.52%
(*) Mask R-CNN with Xception, ResNet-50, and VGG19 backbones and multi-variable fuzzy voting.
Table 4. Detailed class-based accuracy metrics for the proposed MVF voting system.
mAPPrecisionRecallF1 Score
Cracks79.93%68.47%86.00%76.24%
Holes89.80%88.26%90.38%89.31%
Erosion70.58%57.73%77.57%66.19%
Overall80.10%67.17%83.67%74.52%
Table 5. Detailed class-based accuracy metrics for the Xception backbone.
mAPPrecisionRecallF1 Score
Cracks77.27%72.63%82.80%77.38%
Holes90.22%96.41%90.38%93.30%
Erosion64.94%69.65%70.64%70.14%
Overall77.48%75.46%79.68%77.51%
Table 6. Detailed class-based accuracy metrics for the VGG19 backbone.
mAPPrecisionRecallF1 Score
Cracks80.53%80.19%85.80%82.90%
Holes86.16%95.24%86.54%90.68%
Erosion65.20%62.68%73.75%67.76%
Overall77.30%75.43%81.46%78.33%
Table 7. Detailed class-based accuracy metrics for the ResNet-50 backbone.
mAPPrecisionRecallF1 Score
Cracks75.65%75.28%91.60%78.31%
Holes83.85%89.34%84.62%86.91%
Erosion59.43%61.39%67.54%64.32%
Overall72.98%72.25%76.93%74.52%
Table 8. Average processing time per image for the neural networks and proposed MVF voting system. Results were obtained using an NVIDIA GTX 1080 Ti (Santa Clara, CA, USA) paired with an AMD Ryzen 5 3600 6-core processor (Santa Clara, CA, USA).
VGG19XceptionResNet-50MVF Cleaning StageMVF Voting
Average Computing Time (seconds)0.1280.1090.1290.2390.104
Table 9. Detailed class-based accuracy metrics for the modified version of the MVF voting system, altering membership functions to maximize the F1 score.
mAPPrecisionRecallF1 Score
Cracks77.50%81.34%82.80%82.06%
Holes83.83%95.11%84.13%89.29%
Erosion63.60%79.05%67.54%72.84%
Overall74.98%82.97%77.37%80.07%
Disclaimer/Publisher’s Note: The statements, opinions and data contained in all publications are solely those of the individual author(s) and contributor(s) and not of MDPI and/or the editor(s). MDPI and/or the editor(s) disclaim responsibility for any injury to people or property resulting from any ideas, methods, instructions or products referred to in the content.

