Article

Mechanical Characterization and Feasibility Analysis of PolyJet™ Materials in Tissue-Mimicking Applications

Mechanical Engineering, University of Minnesota, Twin Cities, MN 55455, USA
*
Authors to whom correspondence should be addressed.
Machines 2025, 13(3), 234; https://doi.org/10.3390/machines13030234
Submission received: 4 February 2025 / Revised: 7 March 2025 / Accepted: 12 March 2025 / Published: 13 March 2025
(This article belongs to the Special Issue Recent Advances in 3D Printing in Industry 4.0)

Abstract

PolyJet™ 3D printing is an additive manufacturing (AM) technology from StratasysTM. It has been used for applications such as tissue mimicking, printing anatomical models, and surgical planning. The materials available from StratasysTM have the inherent capabilities of producing a number of PolyJet™ materials with a range of physical properties that can be utilized for representing realistic tissue behavior mechanically. The preset materials available in the PolyJet™ printing software version 1.92.17.44384 GrabCADTM Print allow the user to manufacture materials similar to biological tissue, but the combinations of possibilities are limited and might not represent the broad spectrum of all tissue types. The purpose of this study was to determine the combination of PolyJet™ materials that most accurately mimicked a particular biological tissue mechanically. A detailed Design of Experiment (DOE) methodology was used to determine the combination of material mixtures and printing parameters and to analyze their mechanical properties that best matched the biological tissue properties available in the literature of approximately 50 different tissue types. Uniaxial tensile testing was performed according to the ASTM standard D638-14 of samples printed from Stratasys J850 digital anatomy printer to their determined stress–strain properties. The obtained values were subsequently validated by comparing them with the corresponding mechanical properties of biological tissues available in the literature. The resulting model, developed using the DOE approach, successfully produced artificial tissue analogs that span a wide range of mechanical characteristics, from tough, load-bearing tissues to soft, compliant tissues. The validation confirmed the effectiveness of the model in replicating the diverse mechanical behavior of various human tissues. Overall, this paper provides a detailed methodology of how materials and settings were chosen in GrabCADTM Print software and Digital Anatomy CreatorTM (DAC) to achieve an accurate artificial tissue material.

1. Introduction

Additive manufacturing has many applications in the healthcare sector. For example, medical imaging techniques like Computed Tomography (CT) and Magnetic Resonance Imaging (MRI) scans can transform digital images to computer screens from physical objects. In biomedical engineering, additive manufacturing has enabled applications such as tissue and organ fabrication, the production of implants and prostheses, drug delivery systems, and anatomical structures [1]. In clinical practice, 3D-printed anatomical models that replicate realistic organ shapes have been used for presurgical planning, allowing surgeons to rehearse and prepare for complex procedures. This approach helps reduce both risk and time during surgery while also enhancing education and training. Moreover, anatomical 3D printing plays a vital role in evaluating the performance of newly developed biomedical products. The challenge lies in developing novel 3D-printable materials that closely replicate the biomechanical properties of real tissues.
PolyJet™ 3D printing is an additive manufacturing process in which layers of acrylic-based photopolymers are deposited onto a build tray at specific coordinates. The liquid resin is dispensed from print heads using controlled piezoelectric pulses, and ultraviolet (UV) lamps mounted on the print block partially cure the resin after each pass. Material is jetted during both left-to-right and right-to-left movements of the print block as shown in Figure 1 [2].
A key feature of PolyJet™ technology is its ability to print multiple materials with varying properties into a single build with micron-level precision. For instance, elastomeric and rigid materials can be combined in specific ratios to produce Digital Materials (DMs) with mechanical properties that are intermediate between those of the parent materials. PolyJet™ allows control of both mechanical properties and color through applying specific material mixtures on a point-by-point basis, opening up possibilities for customized and intricate models [4]. Its printing parameters can be fine-tuned to replicate the haptic feel, responsiveness, and biomechanical performance of real tissues, making it a powerful tool for creating realistic anatomical models for medical training, surgical planning, and device testing [5].
This technology also allows for the precise creation of complex bio-inspired shapes. The entire 3D printing process can be controlled using the GrabCAD™ Print software version 1.92.17.44384, which employs a voxel-based system to modify the physiological characteristics of preset materials with high precision. The Stratasys J850™ digital anatomy 3D Printer includes in its portfolio of materials three proprietary anatomical digital materials tailored for specific anatomical applications: GelMatrix™, TissueMatrix™, and BoneMatrix™ [6]. Each material offers distinct mechanical characteristics suited to different uses. These digital materials extend the range of hardness (measured on the Shore A scale), elasticity, and density over the standard portfolio of PolyJet™ materials. The multi-material jetting technology enables the production of realistic, functional, and innovative structures that integrate hard and soft phases with tailored properties—all without compromising the geometric complexity of the designs [7]. This capability is essential for accurately replicating the mechanical behavior of biological systems.
Tissue-mimicking materials provide an ethical and practical alternative to testing on human tissues, addressing ethical concerns associated with clinical and research development. Typically, phantoms or specialized 3D printing materials are employed for such purposes. The use of 3D modeling in preclinical research and presurgical settings has significantly expanded, enabling enhanced planning for complex procedures, a deeper understanding of underlying pathophysiological conditions, and computational validation of preclinical research designs [8].
The review by Yildiz et al. presented advances in bioprinting technologies and its current state [9]. The research presented thermal droplet, laser, and mechanical extrusion bioprinting setups and their ability to fabricate and mimic cellular microenvironments for tissue engineering and regenerative medicine. But mechanical strength and stability are key requirements which are not currently optimized by these methods and need further development. Similarly, the article by Wang et al. also sheds light on similar bioprinting techniques and their application in pharmaceutical and tissue engineering [10].
Research on multi-material 3D and 4D bioprinting by Chen et al. highlights the different multi-material 3D bioprinting techniques that are used for fabricating heterogenous constructs for tissue engineering applications [11]. The article suggested that this technique demonstrates significant potential in constructing tissue constructs, although some challenges still remain such as limited multifunction controllability, variance in mechanical properties, and many more.
The benefits of preprocedural planning with 3D models have been extensively documented. For example, digital 3D models enable clinicians to better assess patient-specific factors, such as anatomical asymmetries, the proximity of procedures or devices to critical structures (e.g., nerves or arteries), and potential issues with device biocompatibility. These models improve the precision and safety of clinical interventions [12]. Despite their utility, most PolyJet™ materials alone lack the mechanical properties required to fully simulate tissue-mimicking materials. This limitation reduces the effectiveness of printed models for applications that depend on highly accurate material jetting to replicate the biomechanical characteristics of human tissues. Further advancements in material development are essential to overcome these constraints and unlock the full potential of 3D printing for tissue-mimicking applications.
The research by Bezek et al. investigated the mechanical properties of tissue-mimicking composites by employing a combination of thermal and mechanical analyses, including dynamic mechanical analysis, Shore hardness testing, puncture testing, and tensile testing [13]. The base materials used in the study were Stratasys™ TangoPlus™, a clear acrylate-based resin, and a non-curing cleaning fluid (CF) material. The study found that higher concentrations of the non-curing fluid generally resulted in reduced strength and stiffness of the composite material. Additionally, exponential and second-order polynomial models were identified as suitable fits for describing many of the mechanical properties as functions of non-curing fluid concentration. However, the research was limited by the small range of material combinations analyzed, which restricted a comprehensive understanding of how various parameters influence the mechanical properties of tissue-mimicking composites. This highlights the need for further research to explore a broader range of material combinations and parameters to fully characterize the behavior and potential of tissue-mimicking composites in various applications.
The research by Ruiz et al. focuses on the mechanical characterization of multi-material specimens designed and fabricated to replicate bio-inspired hierarchical structures, specifically targeting tendons and ligaments. The mechanical behavior of these structures was evaluated under uniaxial tensile tests, with Digital Image Correlation (DIC) employed to accurately measure large strains in a non-contact manner. Two material combinations were analyzed: VeroWhite™ with Agilus30Clear™ and VeroWhite™ with TissueMatrix™. Additionally, variations in the Shore hardness of Agilus30Clear™ were tested for comparative analysis [7]. A related study by Lee et al. from Medtronic Inc. explored the use of PolyJet™ 3D printing for tissue-mimicking materials through experimental configurations [14]. The study quantitatively evaluated solid organ (SO) models under axial loading, comparing their stiffness to that of porcine liver. Similarly, Structural Heart–Myocardium (Myo) configurations were tested under various lubricant conditions to assess lubricity in comparison to porcine epicardium and aorta. Additionally, Subcutaneous Tissue configurations were qualitatively evaluated by preclinical experts during cutting, tunneling, and puncture procedures. The findings revealed that, despite some limitations, digital anatomy materials exhibit tactile properties closer to real tissue than other commercially available 3D-printed materials. Furthermore, DA materials showed lower sample-to-sample variability, providing a level of repeatability that biological tissues cannot achieve although the study was limited to few specific soft tissue types only.
Severseike et al. investigated the ability of 3D-printed synthetic myocardium to replicate the mechanical properties of organic myocardium [12]. The study found that digital anatomy myocardium demonstrated comparability to porcine myocardium in terms of compliance. For compliance testing, the digital anatomy material was within the same range as porcine myocardium or stiffer, particularly in conditions involving higher stress concentrations or smaller displacements. However, when evaluating suture and cutting properties, the digital anatomy material did not perform as well as porcine myocardium. The material was more prone to tearing during suturing and exhibited higher friction forces during needle insertion and cutting. Despite these limitations, the compliance of the digital anatomy myocardium was much closer to that of real tissue than other 3D-printed materials tested.
Kornfellner et al. analyzed the mechanical properties of 50 3D-printed samples fabricated from commercially available materials in both their pure forms and as matrixinclusion mixed composites. The study involved cubic inclusions of RGD8430-DM™ and RGD8530-DM™ materials, which were used to create matrix-inclusion composites through material jetting [15]. The results revealed that the performance of multi-materials is influenced by the choice of starting materials, the geometries, and the contact properties between the individual phases within the composite.
In another study, Daneshdoost et al. examined the mechanical tensile performance of two-material composite designs, comparing them based on different volumetric ratios of the two constituent materials—one rigid and strong, and the other soft and ductile [16]. The researchers concluded that custom digital material composites, when designed with voxel-scale precision, provided better control over mechanical performance compared to traditional layered composites. Specifically, they showed that custom-designed composites offered increased Young’s Modulus and ultimate strength over the standard digital materials preset by the manufacturer.
Several studies have explored how varying the mechanical properties of PolyJet™ printed structures can be achieved irrespective of the tissue-mimicking application. Liu et al. investigated the impact of 3D lattice structures on the mechanical properties of printed parts, specifically analyzing BCC, BCC-Z, FCC, and octet lattices [2]. They also examined how changes in strut thickness and printability—whether integrated or assembled through snap-fit techniques—affected the material performance. Barclift et al. focused on how the orientation of printed parts relative to the printing bed (X, Y, and Z axes) influenced their mechanical properties [17]. The study highlighted how variations in orientation could alter the strength and structural integrity of the printed parts, underscoring the importance of print orientation in achieving the desired material performance. Pugalendhi et al. studied the effect of process parameters on the mechanical properties of VeroBlue™ material in PolyJet™ technology [4]. Two properties were varied: High Quality/High Speed and Matte/Glossy finishes. Their findings concluded that the High Speed-Glossy setting resulted in the highest flexural modulus and strength, which suggests this combination provides an optimal balance for producing strong, functional parts. These studies demonstrate the importance of process optimization in PolyJet™ 3D printing, with material selection, lattice design, print orientation, and finish type all playing significant roles in determining the mechanical properties of the final printed structures. Further research is needed to refine these techniques and enhance the reliability and versatility of PolyJet™ printed materials.
Cross-comparison of real tissue value and PolyJet™ printed tissue values would establish a relationship for suggesting the possible parameter settings/material combination to achieve a specific tissue manufactured with accuracy. Vergen measured the biomechanical properties of human and animal cardiothoracic tissues. Planar Biaxial Testing was used to characterize the changes in axial load and strain of human, porcine, and ovine fossa ovalis following a transseptal puncture [18]. Additionally, characterization of Human Ascending Aorta and Human and Porcine Pericardium were also done. Grytz et al. mentions the material properties of the posterior human sclera regions [19]. The elastic response of the posterior human sclera can be characterized by the anisotropic architecture and crimp response of scleral collagen fibrils. Emig et al. outlines a review of existing studies that have measured mechanical properties of myocardial tissue [20]. They outlined the measured Young’s Modulus reported from various studies between Porcine and Human Myocardial tissue and their variation when the heart is diseased. In a similar manner, Singh et al. provided an extensive review of the literature reporting the mechanical properties of whole-body soft tissues [21]. They listed tissue properties existing in the literature available online with the variation that is possible with age, gender, etc. Table 1 below shows a consolidated list of the tissue properties extracted from the available literature.
While the studies provide insights into characterizing the mechanical properties of 3D-printed materials produced by 3D printing, there is still limited research into how variations in material choices and software parameters impact the mechanical properties of printed objects. Further research is needed to fully understand the influence of these variables on the performance of 3D-printed multi-materials to optimize material and software combinations for specific applications. This research employs a DOE approach to systematically capture the effects of varying PolyJet™ printing parameters on the mechanical properties observed in tensile testing. The resulting data is then validated by comparing the mechanical properties of the printed samples with those of biological tissues available in the literature, ensuring the printed models closely mimic real tissue behavior.

2. Materials and Methods

2.1. Specimen Design and Testing

ASTM D638, Type 4 tensile test “dogbone” samples were used (Figure 2a) [22]. This geometry was used with all the recipe settings across all runs. Each sample material was set in the GrabCAD™ print software version 1.92.17.44384 using the Digital Anatomy Creator (DAC) feature and were saved by their run number. The specimens were marked with the same number for simplicity and the testing results were characterized accordingly.
Figure 2a–c shows the Type 4 ASTM dogbone used in this DOE. According to the standard, a strain rate of 50 mm/min was used for the samples with a grip separation of 25 mm. An MTS uniaxial Criterion® Electromechanical Test machine was used with a 6 kN load cell at ambient conditions.

2.2. GrabCAD Print Settings

GrabCAD™ Print is a proprietary software acquired by Stratasys (Eden Prairie, MN, USA) in 2014 which comes with a wide variety of presets using the existing Stratasys™ portfolio of materials to replicate tissue materials. Users can use the presets to assign materials to any part of the print that needs to be printed with specific material properties. Although the list of material property options is quite extensive, a wide variety of tissues are not present in the software.
DAC feature allows users to modify and create new material combination settings for custom applications. This option has not been extensively studied in the existing literature and was explored in this study to expand human tissue replication capabilities through PolyJet™. In the existing GradCAD™ print software, once a model is imported into the system for printing, it can be sent to DAC for configuring with the material properties/printing settings to produce custom materials as can be seen in the screenshot of a GradCAD™ print software in Figure 3. DAC enables removing/adding more materials to the existing model based on the materials available in the tray; it allows the addition/removal of layers in the model along with manipulating their thickness; it allows changing the infill type of each layer between perlin, digital material, gyroid, cubes, and scattered sphere; it enables the changing of the material composition of each layer based on the requirement. PolyJet™ infills are always solid and are not described clearly online but the difference can be seen visually in the GradCAD™ interface when assigning infill. They affect the structural integrity of the print due to their shape. Combining these settings allows significant control and customizability. This article utilizes these variables to build a Design of Experiment (DOE) to analyze tensile mechanical properties as a response to design interactions between factors and responses. This knowledge can be used to design a particular tissue-mimicking material to accurately represent other materials based on varying the parameters in a defined manner.
GrabCAD™ allows a maximum of eight materials to be used for a particular model, which also includes the support material SUP706. By default, there are two layers that are preexisting for any model—outer layer and background layer. The outer layer is the outermost layer of a model that allows material and parameter variation to the outermost boundary of a material. GrabCAD™ also allows the user to set the thickness of the layer with the thinnest portion of the model setting the limit. The background layer is automatically set by the software to fill the remaining inside volume of the part not defined by the outer layer.

2.3. Experiment Design

The materials options for the background and outer layer are one of the primary factors that affect the mechanical properties of the resulting print. Other variables that influence the mechanical properties are the percentage combination of the materials in the mixture and the type of infill. The volume of the model the software determines as the background is governed by the thickness of the outer layer. Thus, it is necessary to consider outer layer thickness as one of the two primary factors of analysis during the DOE. As a result, Table 2 represents the primary factors that are analyzed for the DOE.
Although GrabCAD™ will allow up to seven different materials to be included, only four were chosen for the outer layer. RadioMatrix™ does not contribute unique mechanical properties and so it is not included in this DOE. GelMatrix™ is a gel-based material that would result in compromising the structural strength of the prints and therefore not included. VeroPureWhite™ has similar properties as VeroClear™ so including one is adequate for this experiment. On a similar note, only five of the seven materials were included in the background layer. GelMatrix™ is included due to its ability to contribute to the extra flexibility for mimicking softer tissues of the body and since background material comprises the internal volume of the model, it will not affect the structural integrity of the model.
Two thickness levels were chosen for the outer layer thickness: 0.3 mm and 1 mm. These thickness levels provide a distribution of thickness variation for the respective model utilized for the uniaxial tensile testing while maintaining enough volume distribution across the layers. Along with this, the type of background layer infill is a variable included in the study. Cubes Grid and scattered spheres are not included in the DOE as the inclusion of gyroid, perlin, and DM provides sufficiently wide distribution to varying mechanical properties while reducing the number of overall runs required for the DOE. Including cubes grid and scattered spheres might also increase non-uniformity in the infill of sample which can lead to undesired localized stress zones in the tensile sample. Additionally, the type of infill for the outer layer was kept fixed at DM across the DOE. This is primarily because the outer layer is exposed and using either of them would cause a non-uniform boundary surface which will increase anisotropy across the cross section of the model.
This results in a complex custom DOE which includes continuous, categorical, and mixture parameters that needs to be evaluated coherently. This is done by using a full factorial analysis to design the experiments for studying each possible combination. The responses which are monitored for this DOE are: Maximum Strain, Maximum Stress, and Young’s Modulus. These responses are then compared to the tissue literature properties to establish a relationship between the factors and the resulting responses. Any specific sample was assigned a match when all three responses were compared with the corresponding biological tissue values. This relationship will help in guiding the parameter selection process for the accurate replication of a tissue. Table 3 describes the runs generated for a full factorial analysis between two factors of outer layer thickness. Table 4 describes the number of runs generated from the Mixture DOE for the outer layer. Due to a software material limitations error, a few of the runs have been excluded from the DOE, as highlighted in the table. Table 5 describes the number of runs generated from the Mixture DOE for specifically the background layer. These DOEs are used in a full factorial DOE which includes all possible combinations resulting in a total of 462 runs.
T o t a l   n u m b e r   o f   r u n s = 6 × 7 × 11 = 462 .

2.4. Printing and Post Processing

The samples were printed in a Stratasys™ PolyJet™ J850™ digital anatomy 3D Printer from the material procured from Stratasys. The materials utilized for this research were from the same lot number to avoid variability generating from lot variation. Fifty samples were printed per run due to the limitation on the size of the bed. All the batches were printed in such a manner that all samples are oriented longitudinally in the X direction of the printer bed to avoid any variability caused by the orientation of the sample and it results in higher tensile strength relative to other orientations according to the literature [5]. Each sample was then cleaned to physically remove support materials from it, soaked in the caustic solution for cleaning, and dried off. This protocol was followed for all the 462 samples. It was observed that some of the samples were too soft and fragile due to the recipe settings assigned to them. This resulted in discarding a few of the samples. The repeatability of PolyJet™ was studied by Severseike et al. as it was noted that the advantage of digital anatomy materials is its ability to provide repeatable results, unlike biological tissue, which often exhibits significant variability [12]. A standard deviation of 0.003 MPa in Modulus was reported by the study. Repeating experiments extensively in this research would have required significant resources, making it impractical within the study’s constraints.

3. Results and Discussion

After tensile testing of the samples, no samples failed in an unintentional manner. There were no failures caused by any mix-ups or any misprints. In this DOE, Analysis of Variance (ANOVA) was derived to analyze the impactful factors and their relative interactions. During this analysis, the statistical software JMP™ Pro 17.2, a subsidiary of SAS Institute, was utilized for analyzing the data. Alongside that was the free trial of DesignExpert™ by Stat-Ease 360, which was also utilized to construct the model and build relationships between factors and responses. In addition to this, Microsoft Excel was used to compare with the existing literature of human tissue values. Table 6 below shows data of a few random runs that were performed during the DOE.
In the existing literature, research on soft tissues has predominantly focused on their linear and isotropic mechanical properties [21]. So far, tissues such as the skin, muscles, brain, arteries, breast, liver, spleen, esophagus, tonsils, tongue, pancreas, pelvic tissues, and small intestine have been characterized using isotropic or transversely isotropic hyperelastic models, though typically only at a limited range of strain rates. Expanding these studies to cover broader strain conditions and refining the models could greatly enhance the accuracy of tissue-mimicking materials in medical and research applications, but for the purposes of simplifying this article, linear elastic relationship is assumed and analyzed for tissues.
The factors are annotated according to Table 7 below for maintaining consistency across the research article. After analyzing the mechanical properties of the samples, the data turned out to be skewed due to many samples being designed for softer tissue types which had low Max Stress, high Max Strain, and low Young’s Modulus, as can be seen in Table 8, Table 9 and Table 10 below. The data is represented separately for ease in comparison among the existing preset standard in the upcoming sections.

3.1. Maximum Stress

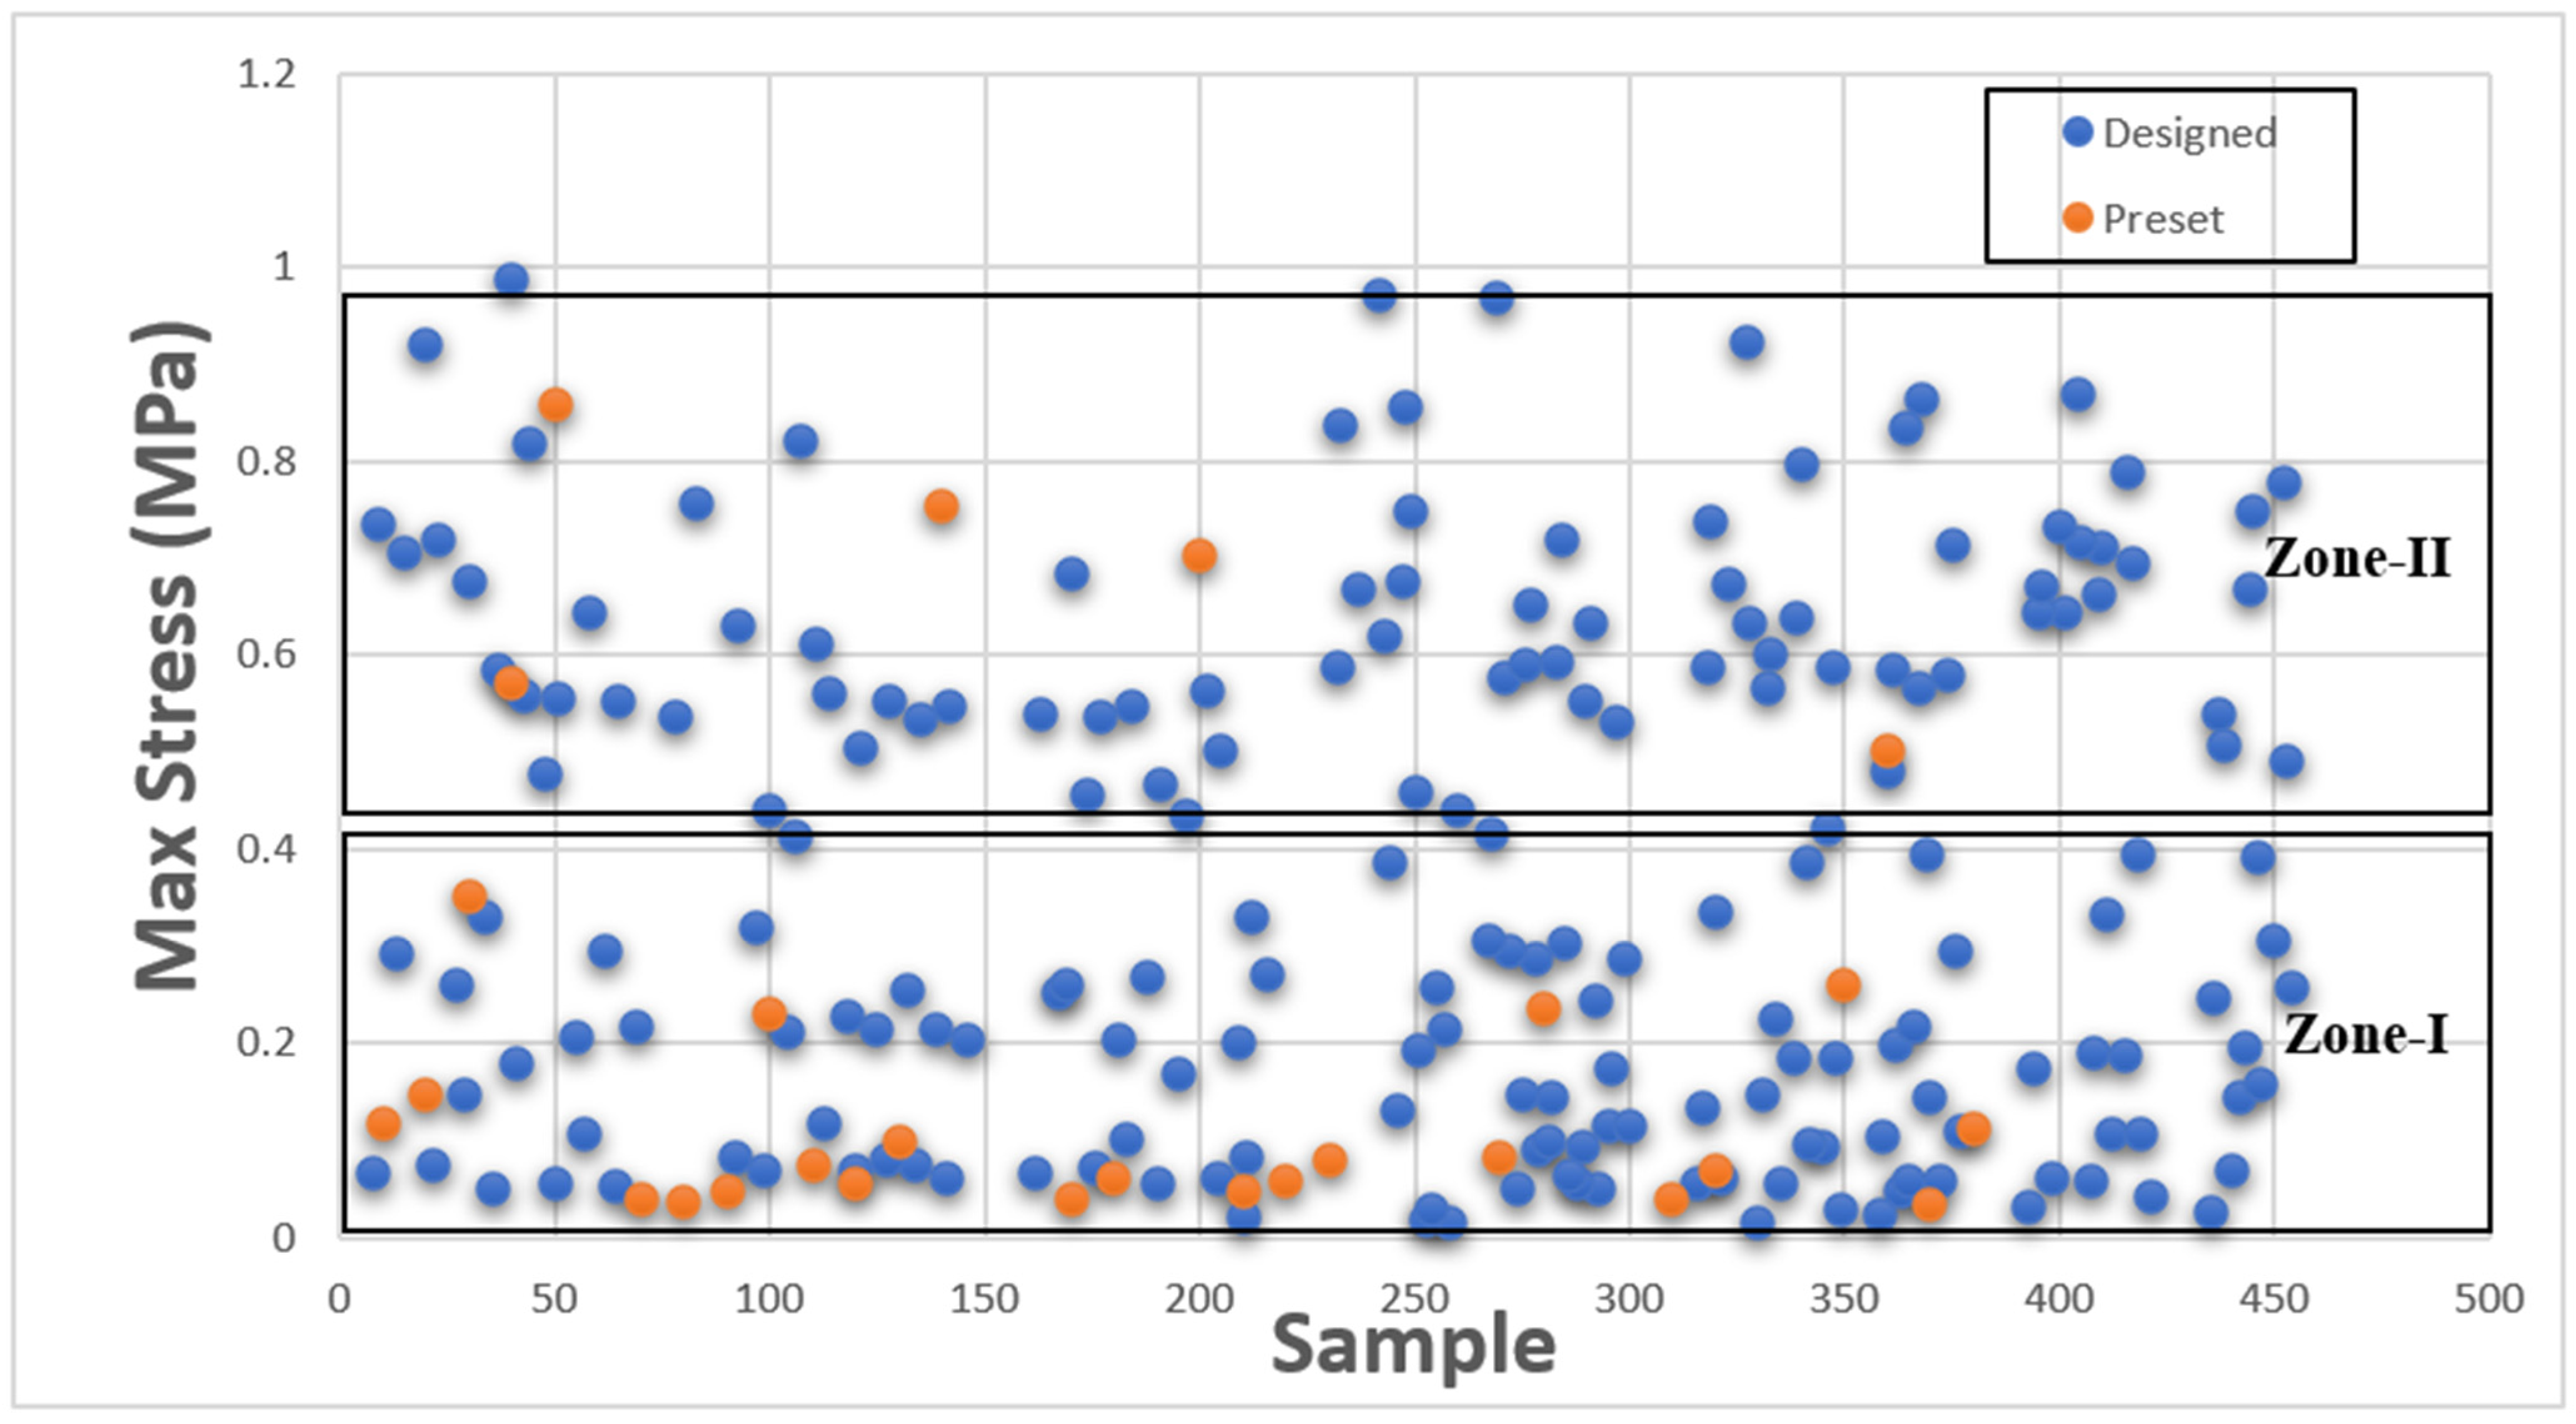
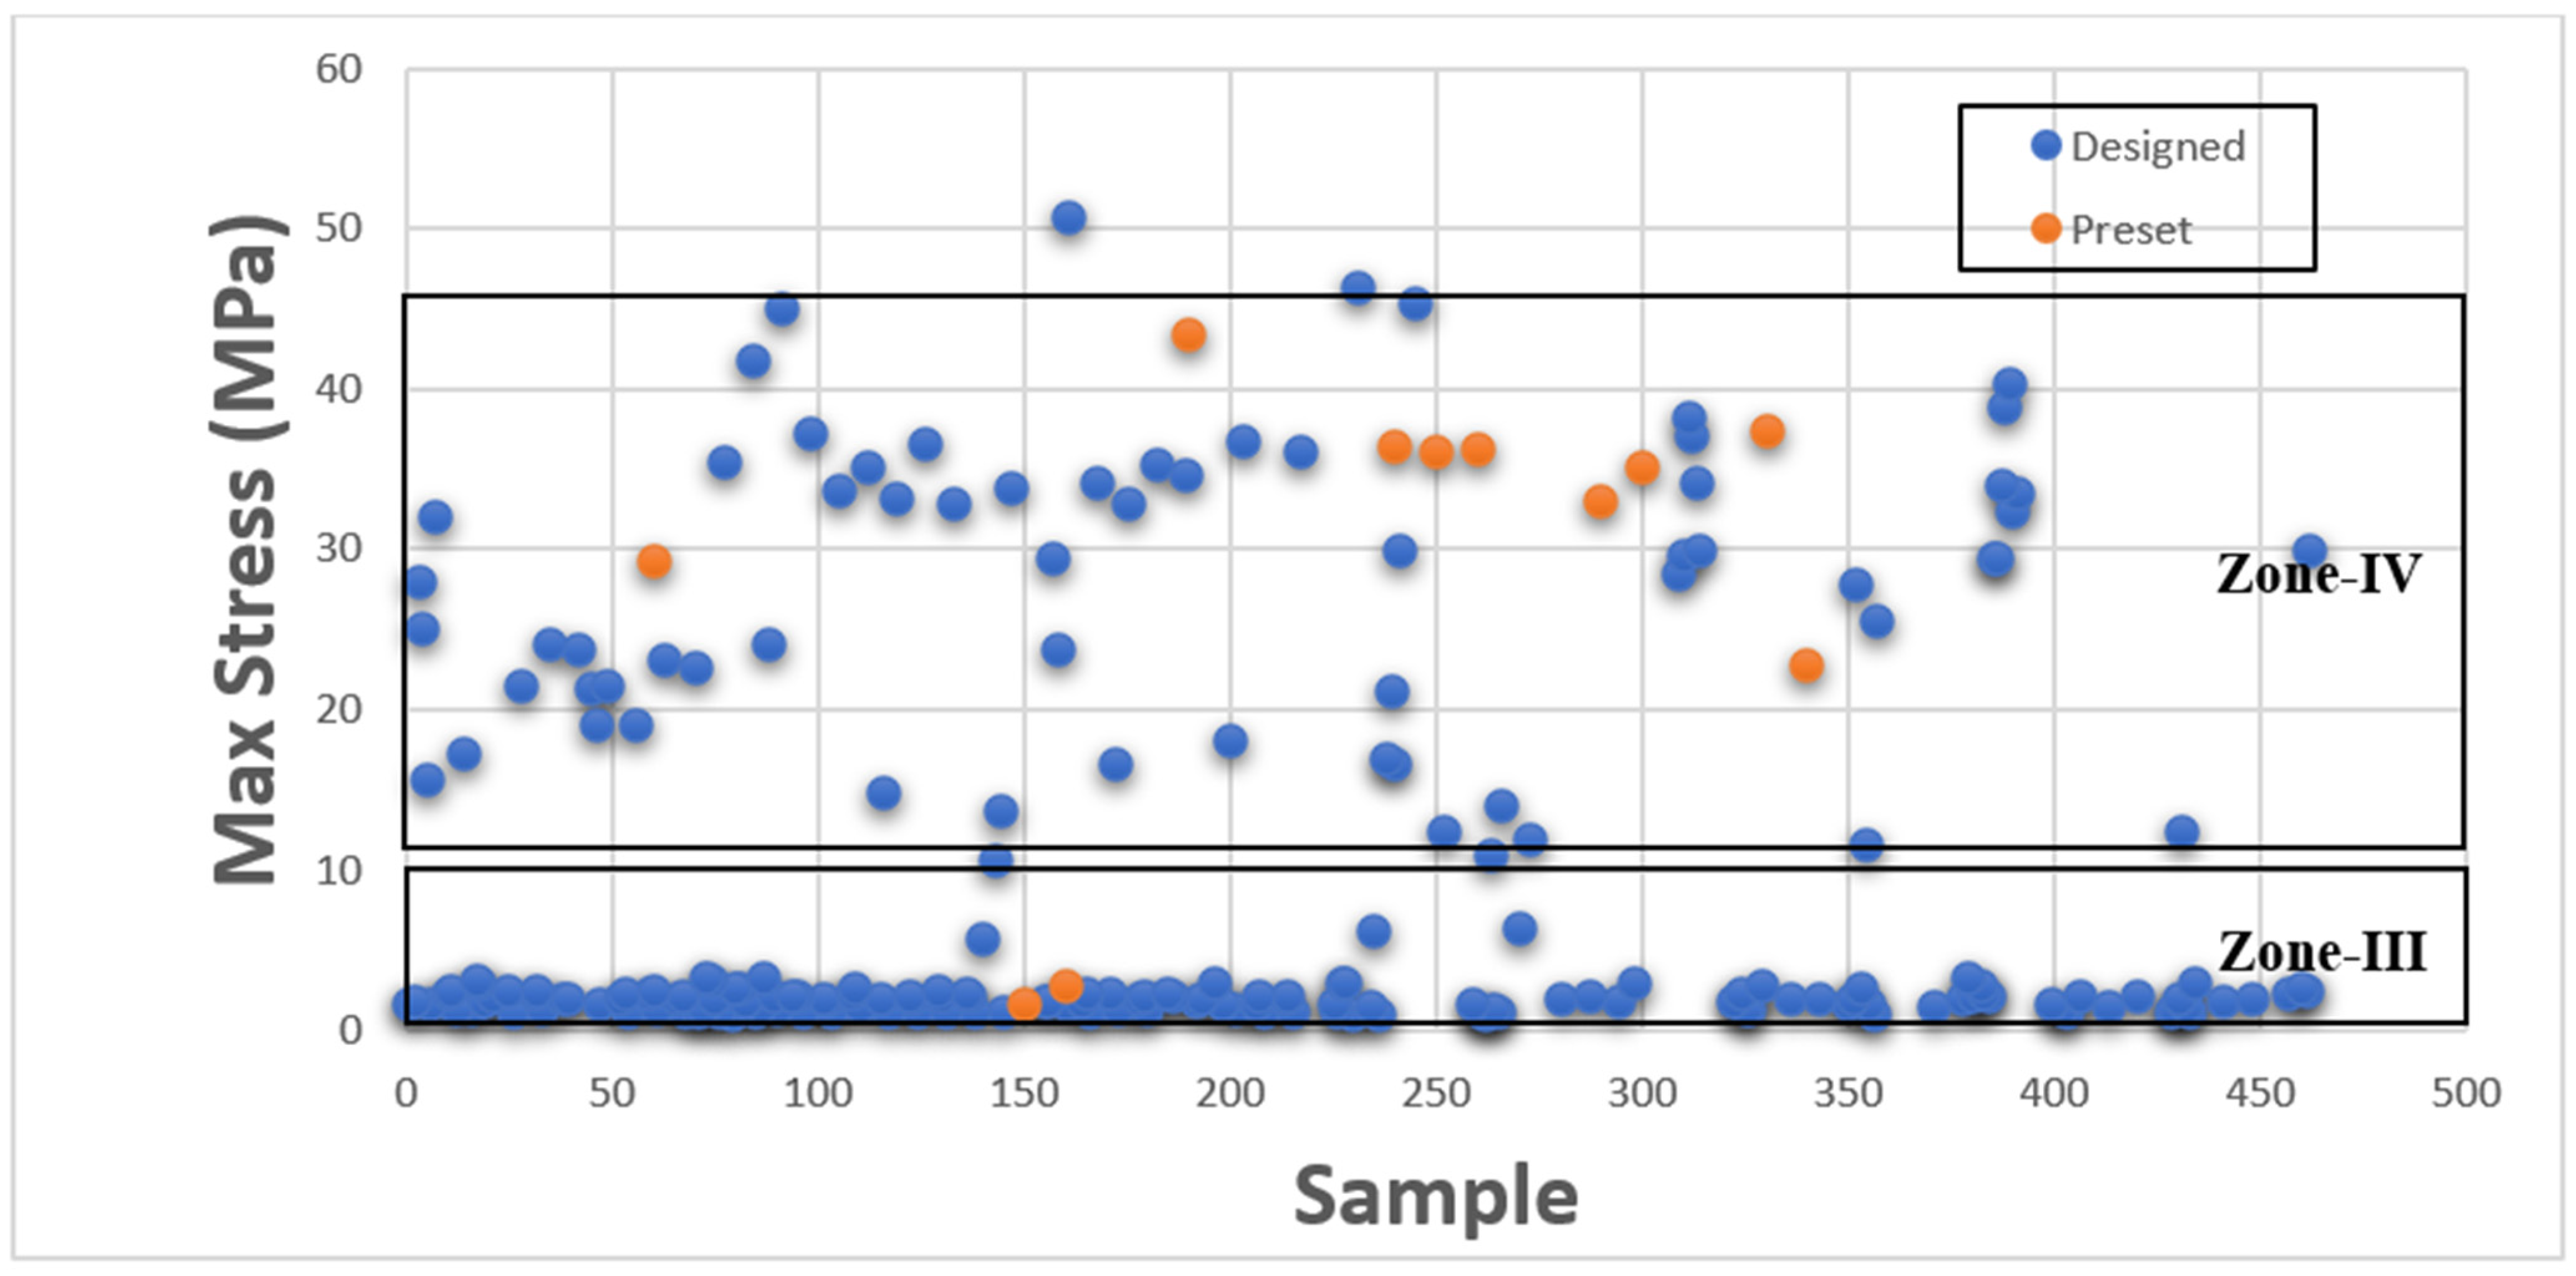
This section presents Maximum Stress results individually in comparison with existing GrabCAD™ tissue presets. The tested samples resulted in a wide range of Max Stress values between 0.016 MPa and 50.69 MPa. The samples can be divided into several groups based on the Max Stress values shown in subsequent Figure 4 and Figure 5.
These figures show the resulting Max Stress values overlayed with the existing preset standard tested parts from Stratasys™. The figures are divided into four zones-I, II, III, and IV. Zone I indicate the samples which had low ultimate tensile strength value. Based on tensile values of biological tissue derived from the literature, these are usually ultra-soft tissues like liver tissue, lung tissue, low rigidity structural heart frame, low stiffness Myocardium, Suturable vessel wall, extensible valve chordae, soft ligaments, nerves, etc. Zone II includes ascending aorta, pericardium, stomach tissue, moderately rigid structural heart frame, stiff Myocardium, soft valve annulus tissue, and general anatomically dense connective tissues. Zone III includes stiff valve annulus, pulmonary valve tissue, aortic valve, esophagus, fossa ovalis, stiff ascending aorta, stiff pericardium, etc. Finally, Zone IV consists of rigid tissue materials such as varying porosity bones, skull, vertebrae, tendons, ligaments, etc.
This indicates that there are combinations of settings that can broaden the range of Max Stresses beyond what is available in the standard GrabCAD™ settings.

Interaction Plots and ANOVA: Max Stress

A linear model was fitted into the analysis. To investigate the primary influence of input parameters on individual response, an ANOVA with a 95% confidence interval was used. The ANOVA values for Max Stress are shown in Table 11. If the 
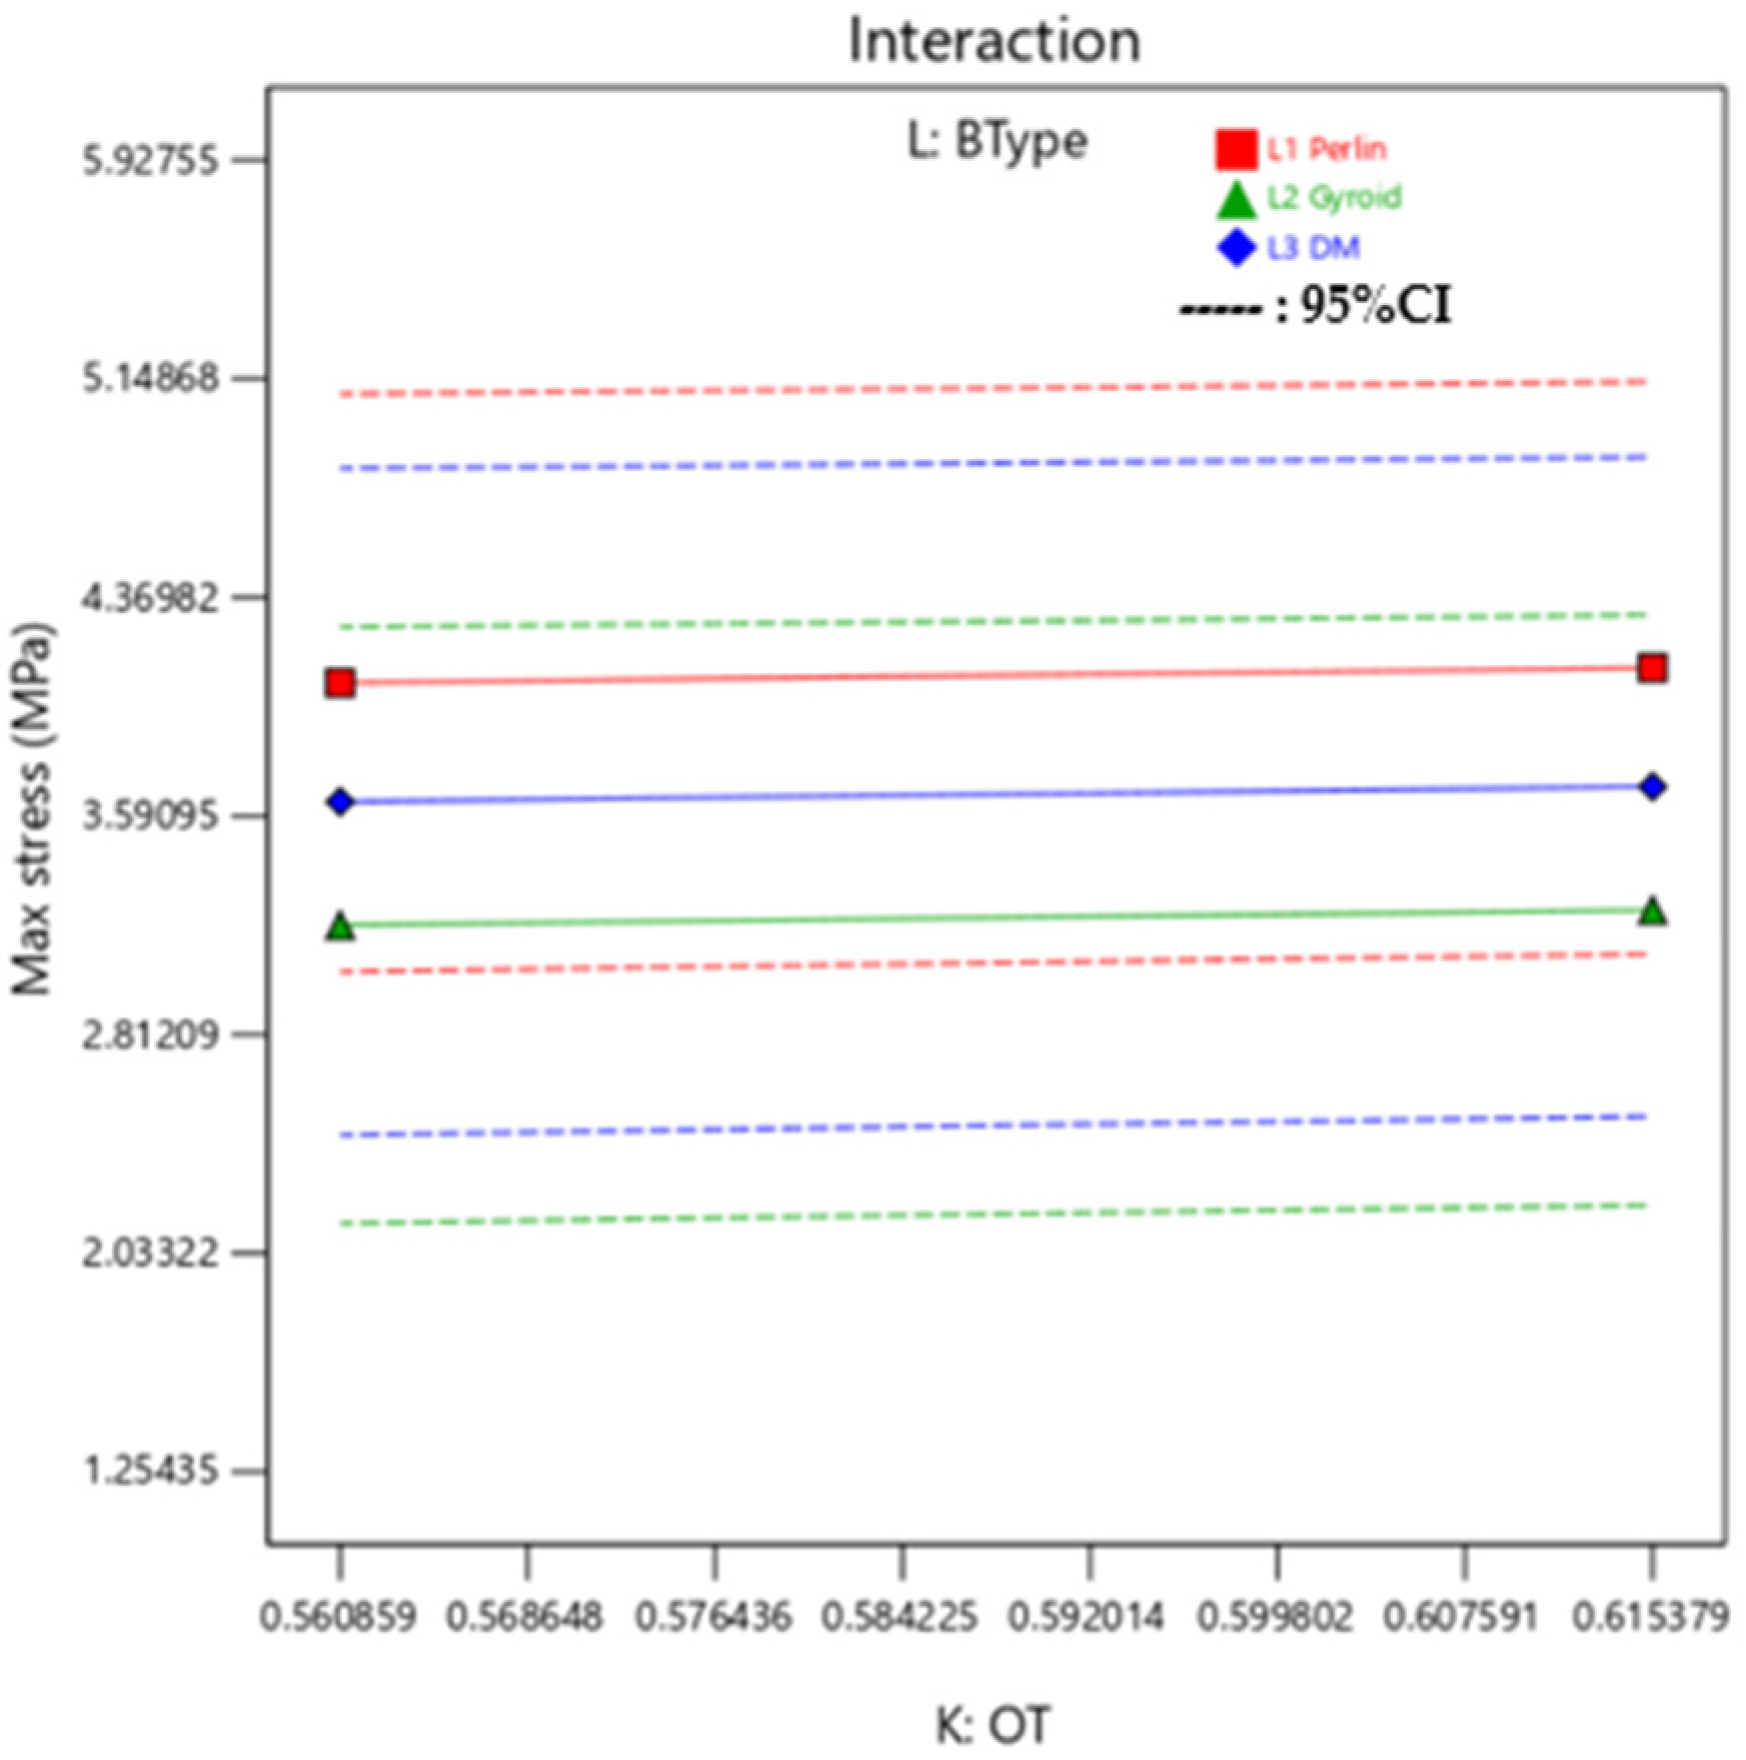
p-value is less than 0.05, the parameter is significant in terms of responses as highlighted in the ANOVA tables. Due to the complexity of the DOE, which includes mixture–mixture factorial design, the ANOVA table has been analyzed in a similar manner. After analyzing the significant terms, it is observed that using VeroPureWhite™ in the outer layer (B) and background (F) has the highest impact on the obtained Max Stress values. While the dependence of Max Stress between outer layer and background layer is governed by the OT(K). It determines which mixture will have the most impact on the response among the two as the volume of mixture 1 and mixture 2 constitute depends upon it.
Additionally, it can be observed in Figure 6, that is the interaction plot for the median setting of outer layer mixture and background layer mixture, there is minimal variation in Max Stress with the background type variation. In this interaction plot, the lines are almost parallel, which indicates there is not a good relationship between the BType (L) factor and its interaction with OT (K) on the value of Max Stress. Irrespective of changing the BType, Max Stress remains constant while OT is varied.
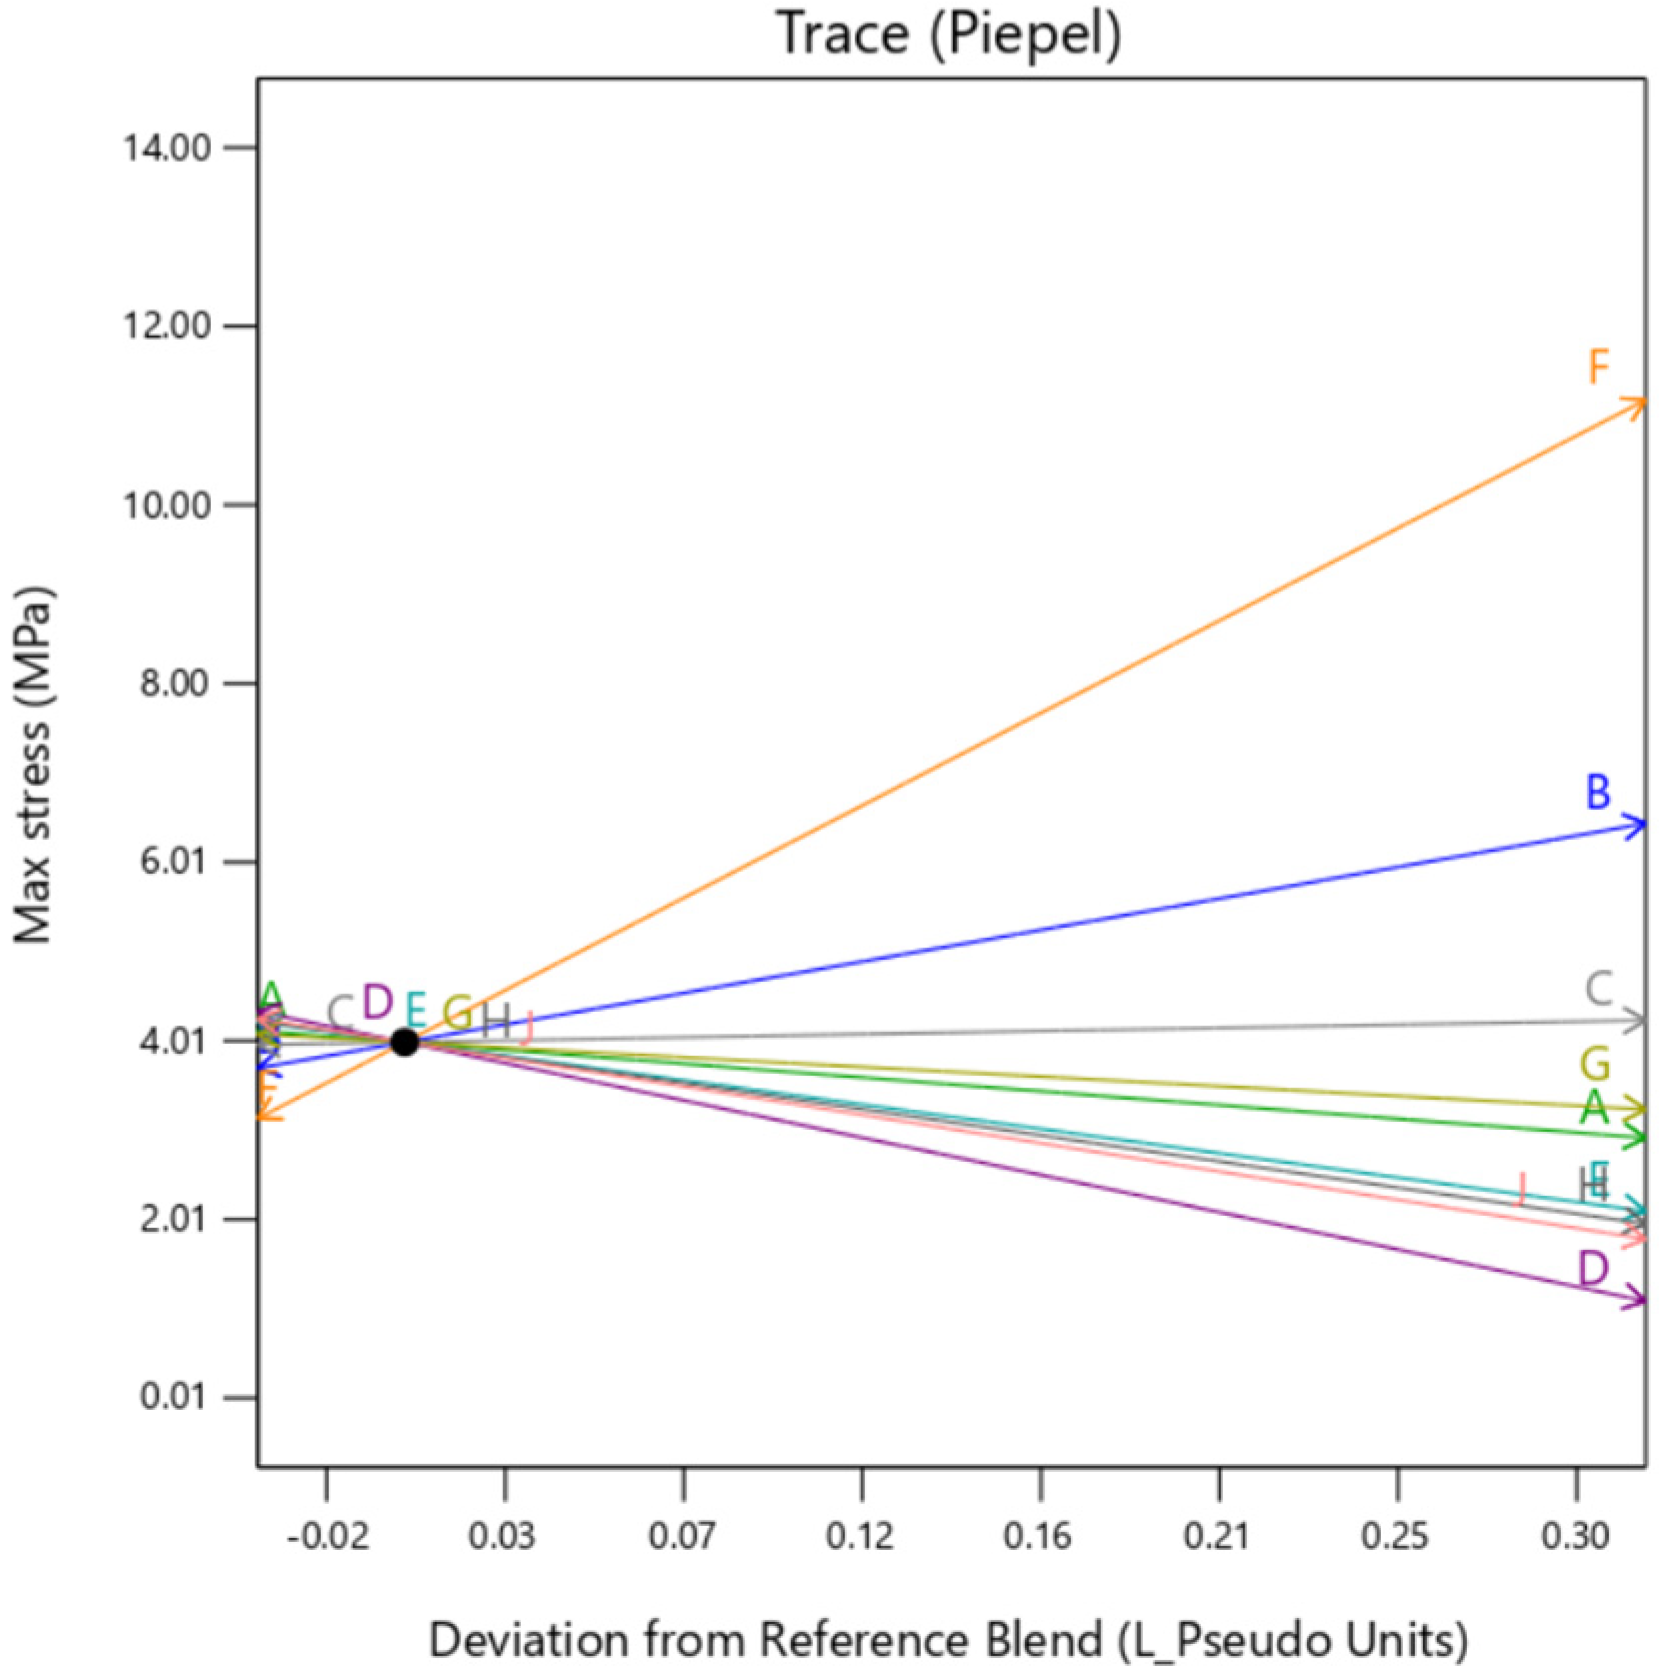
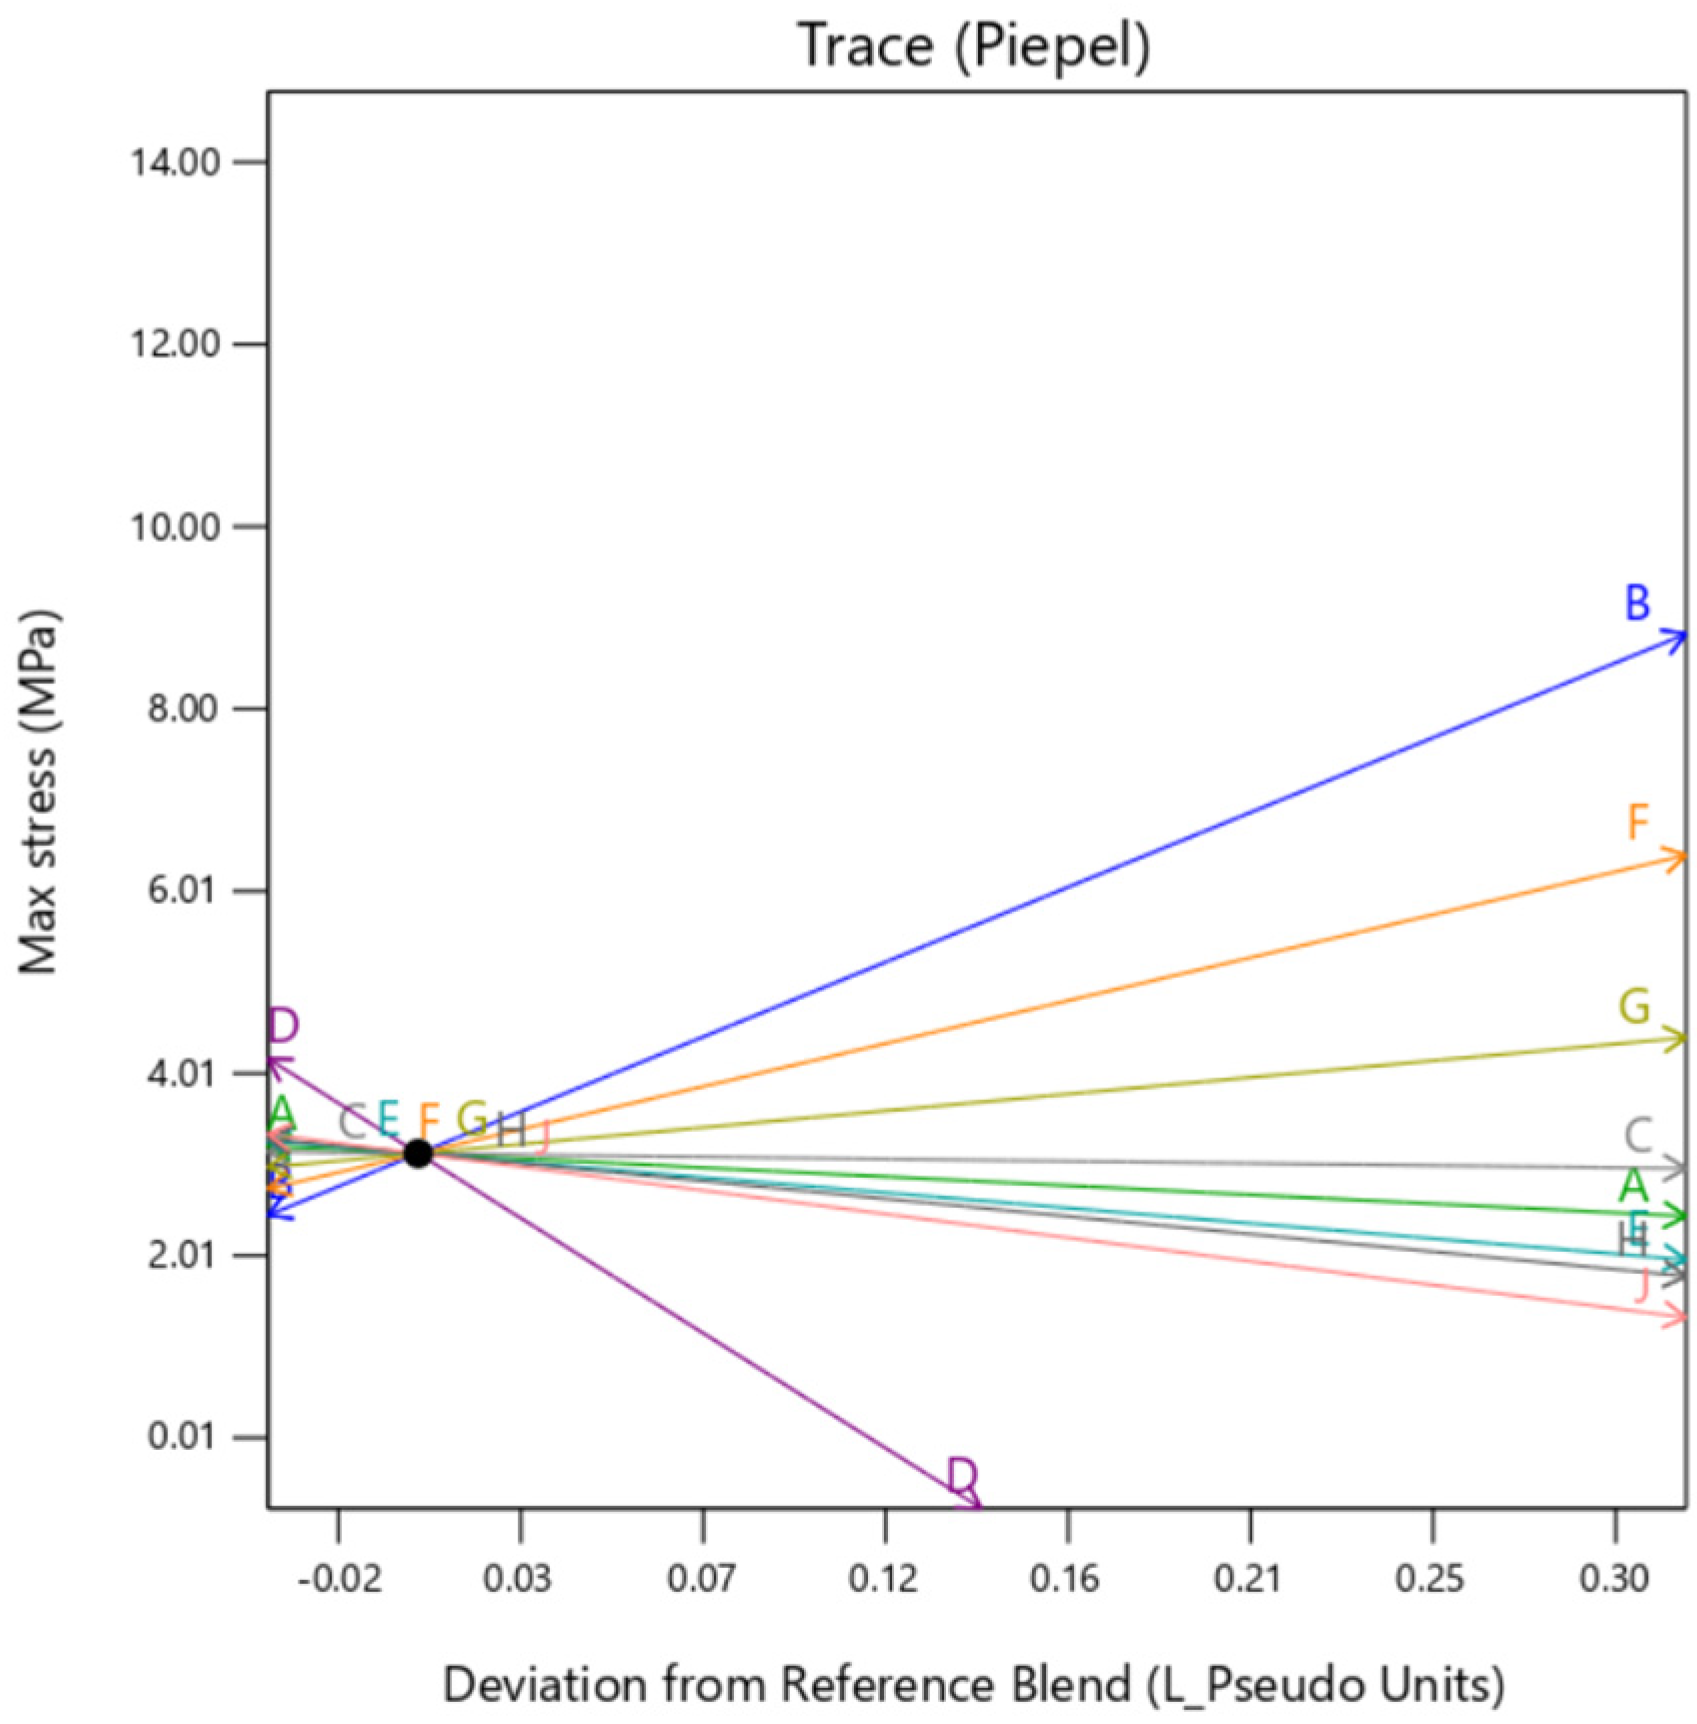
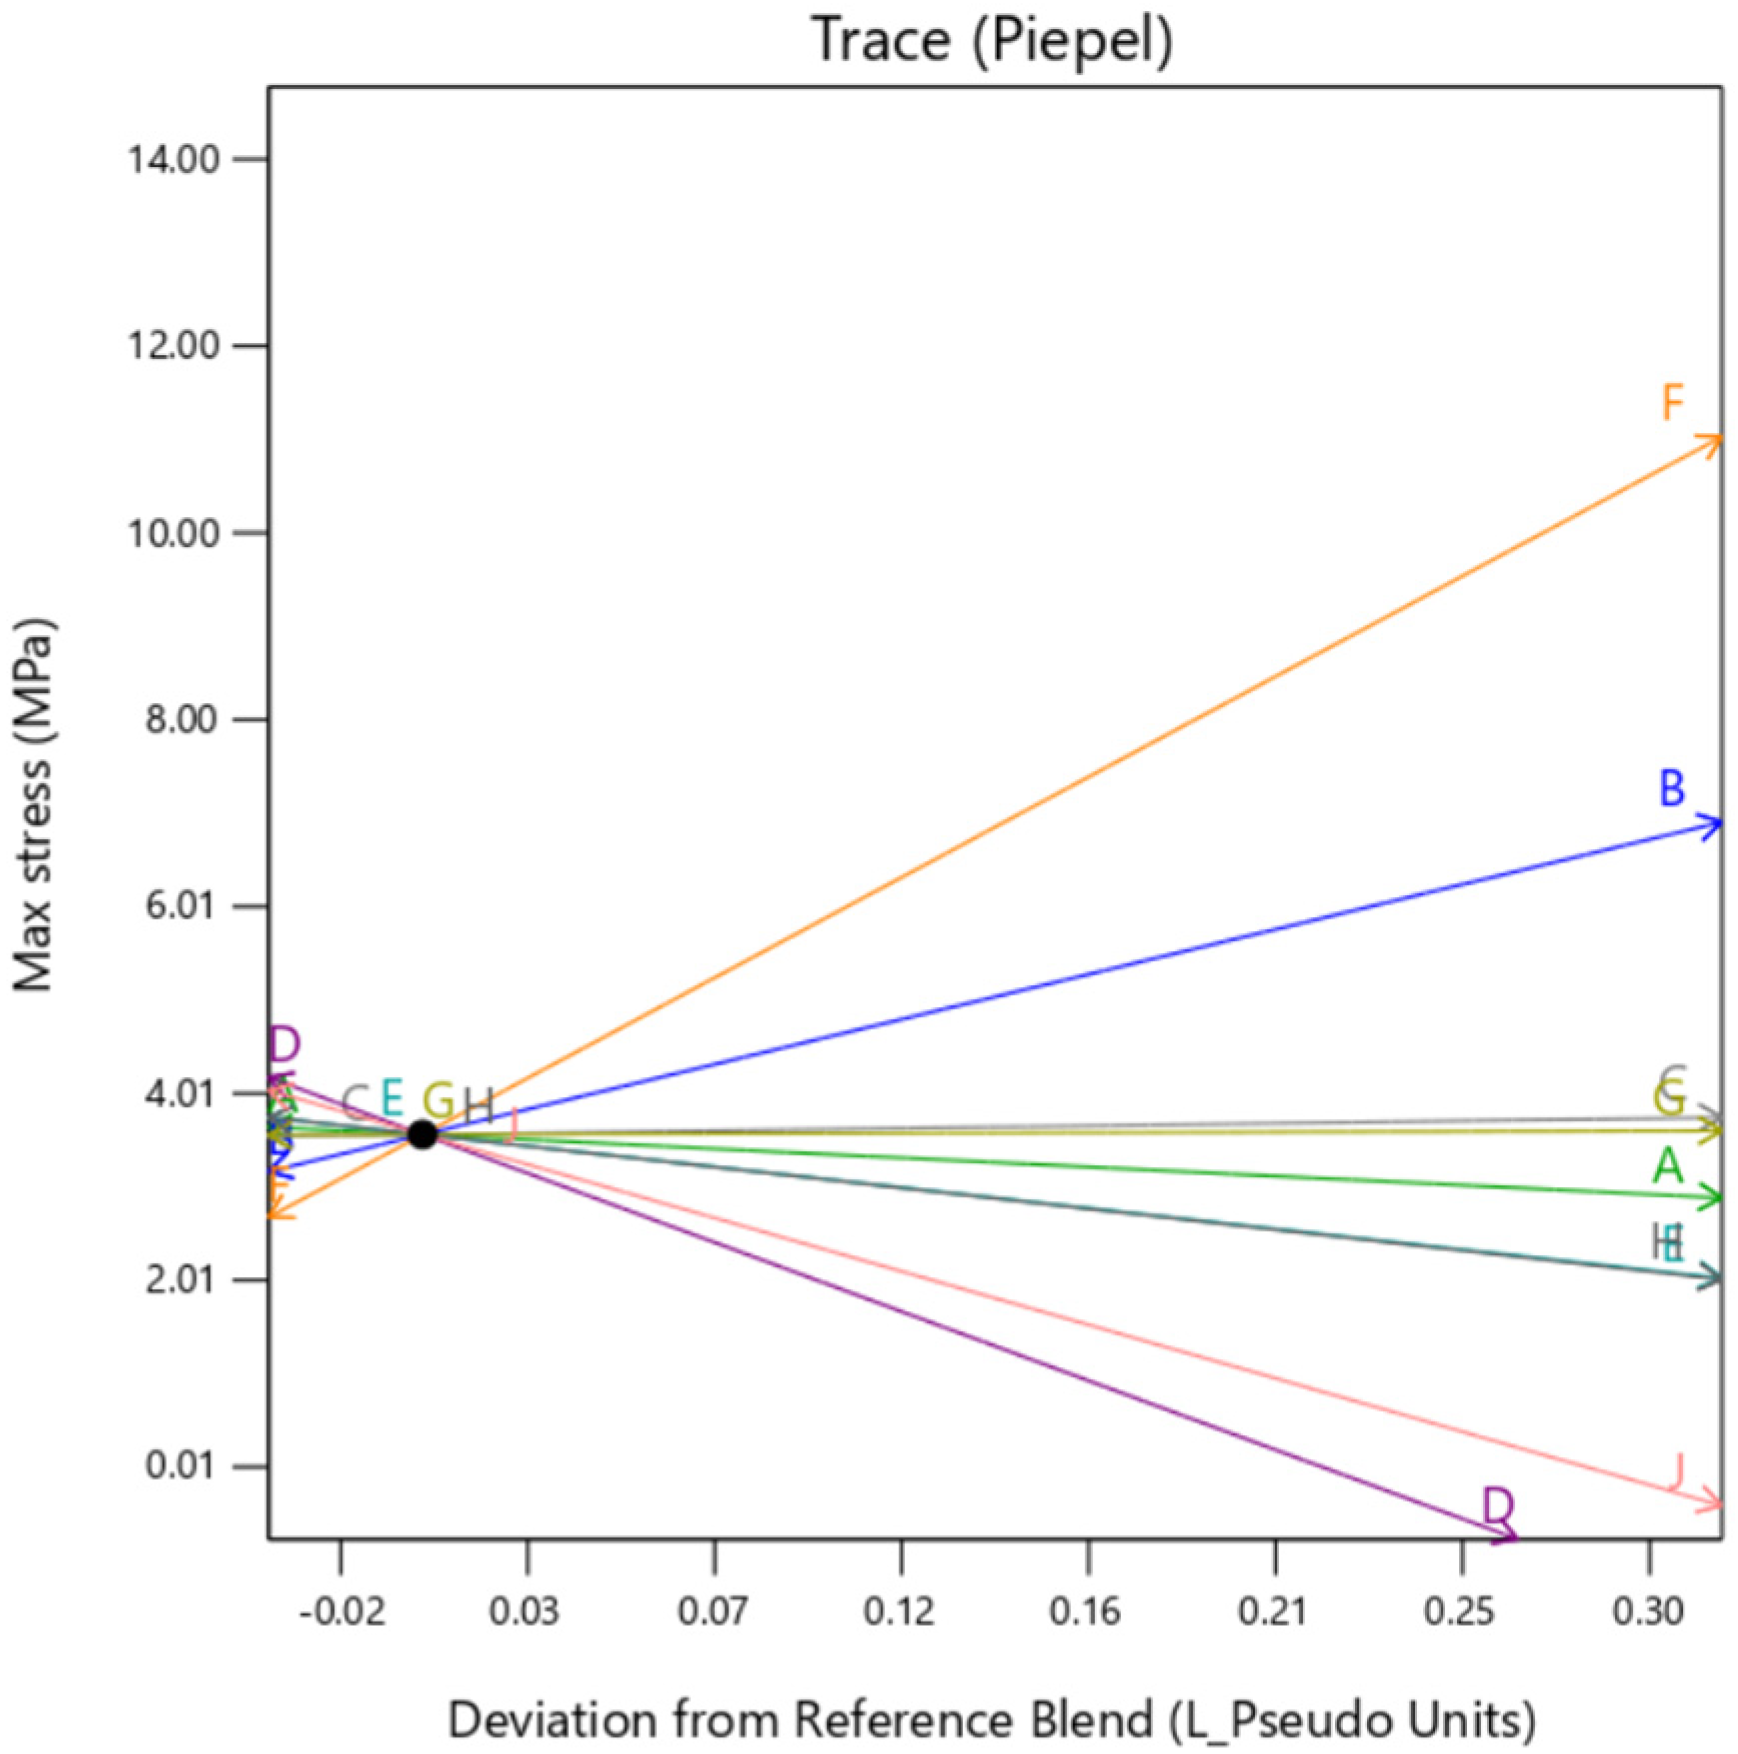
Individual trace plots are also presented below in Figure 7, Figure 8 and Figure 9. They show the individual impact of the mixture factors and its sensitivity on the response when they are varied from a reference point, which is termed as “Deviation from Reference blend”. In this article, the reference blend is set at the mixture where all the constituents are taken at equal quantity %. Here, the outer layer thickness is fixed at a nominal setting of 0.5 mm. It is important to note here that except when the background type is set at gyroid, the trace is similar for all the factors. That means setting the background to gyroid enhances the outer layer dependency of the sample, irrespective of the mixture constituting the background. It is to be noted here that the model extrapolates the value of Max Stress below zero as there is no boundary condition preventing that. Since this is a hypothetical condition, it can be ignored.
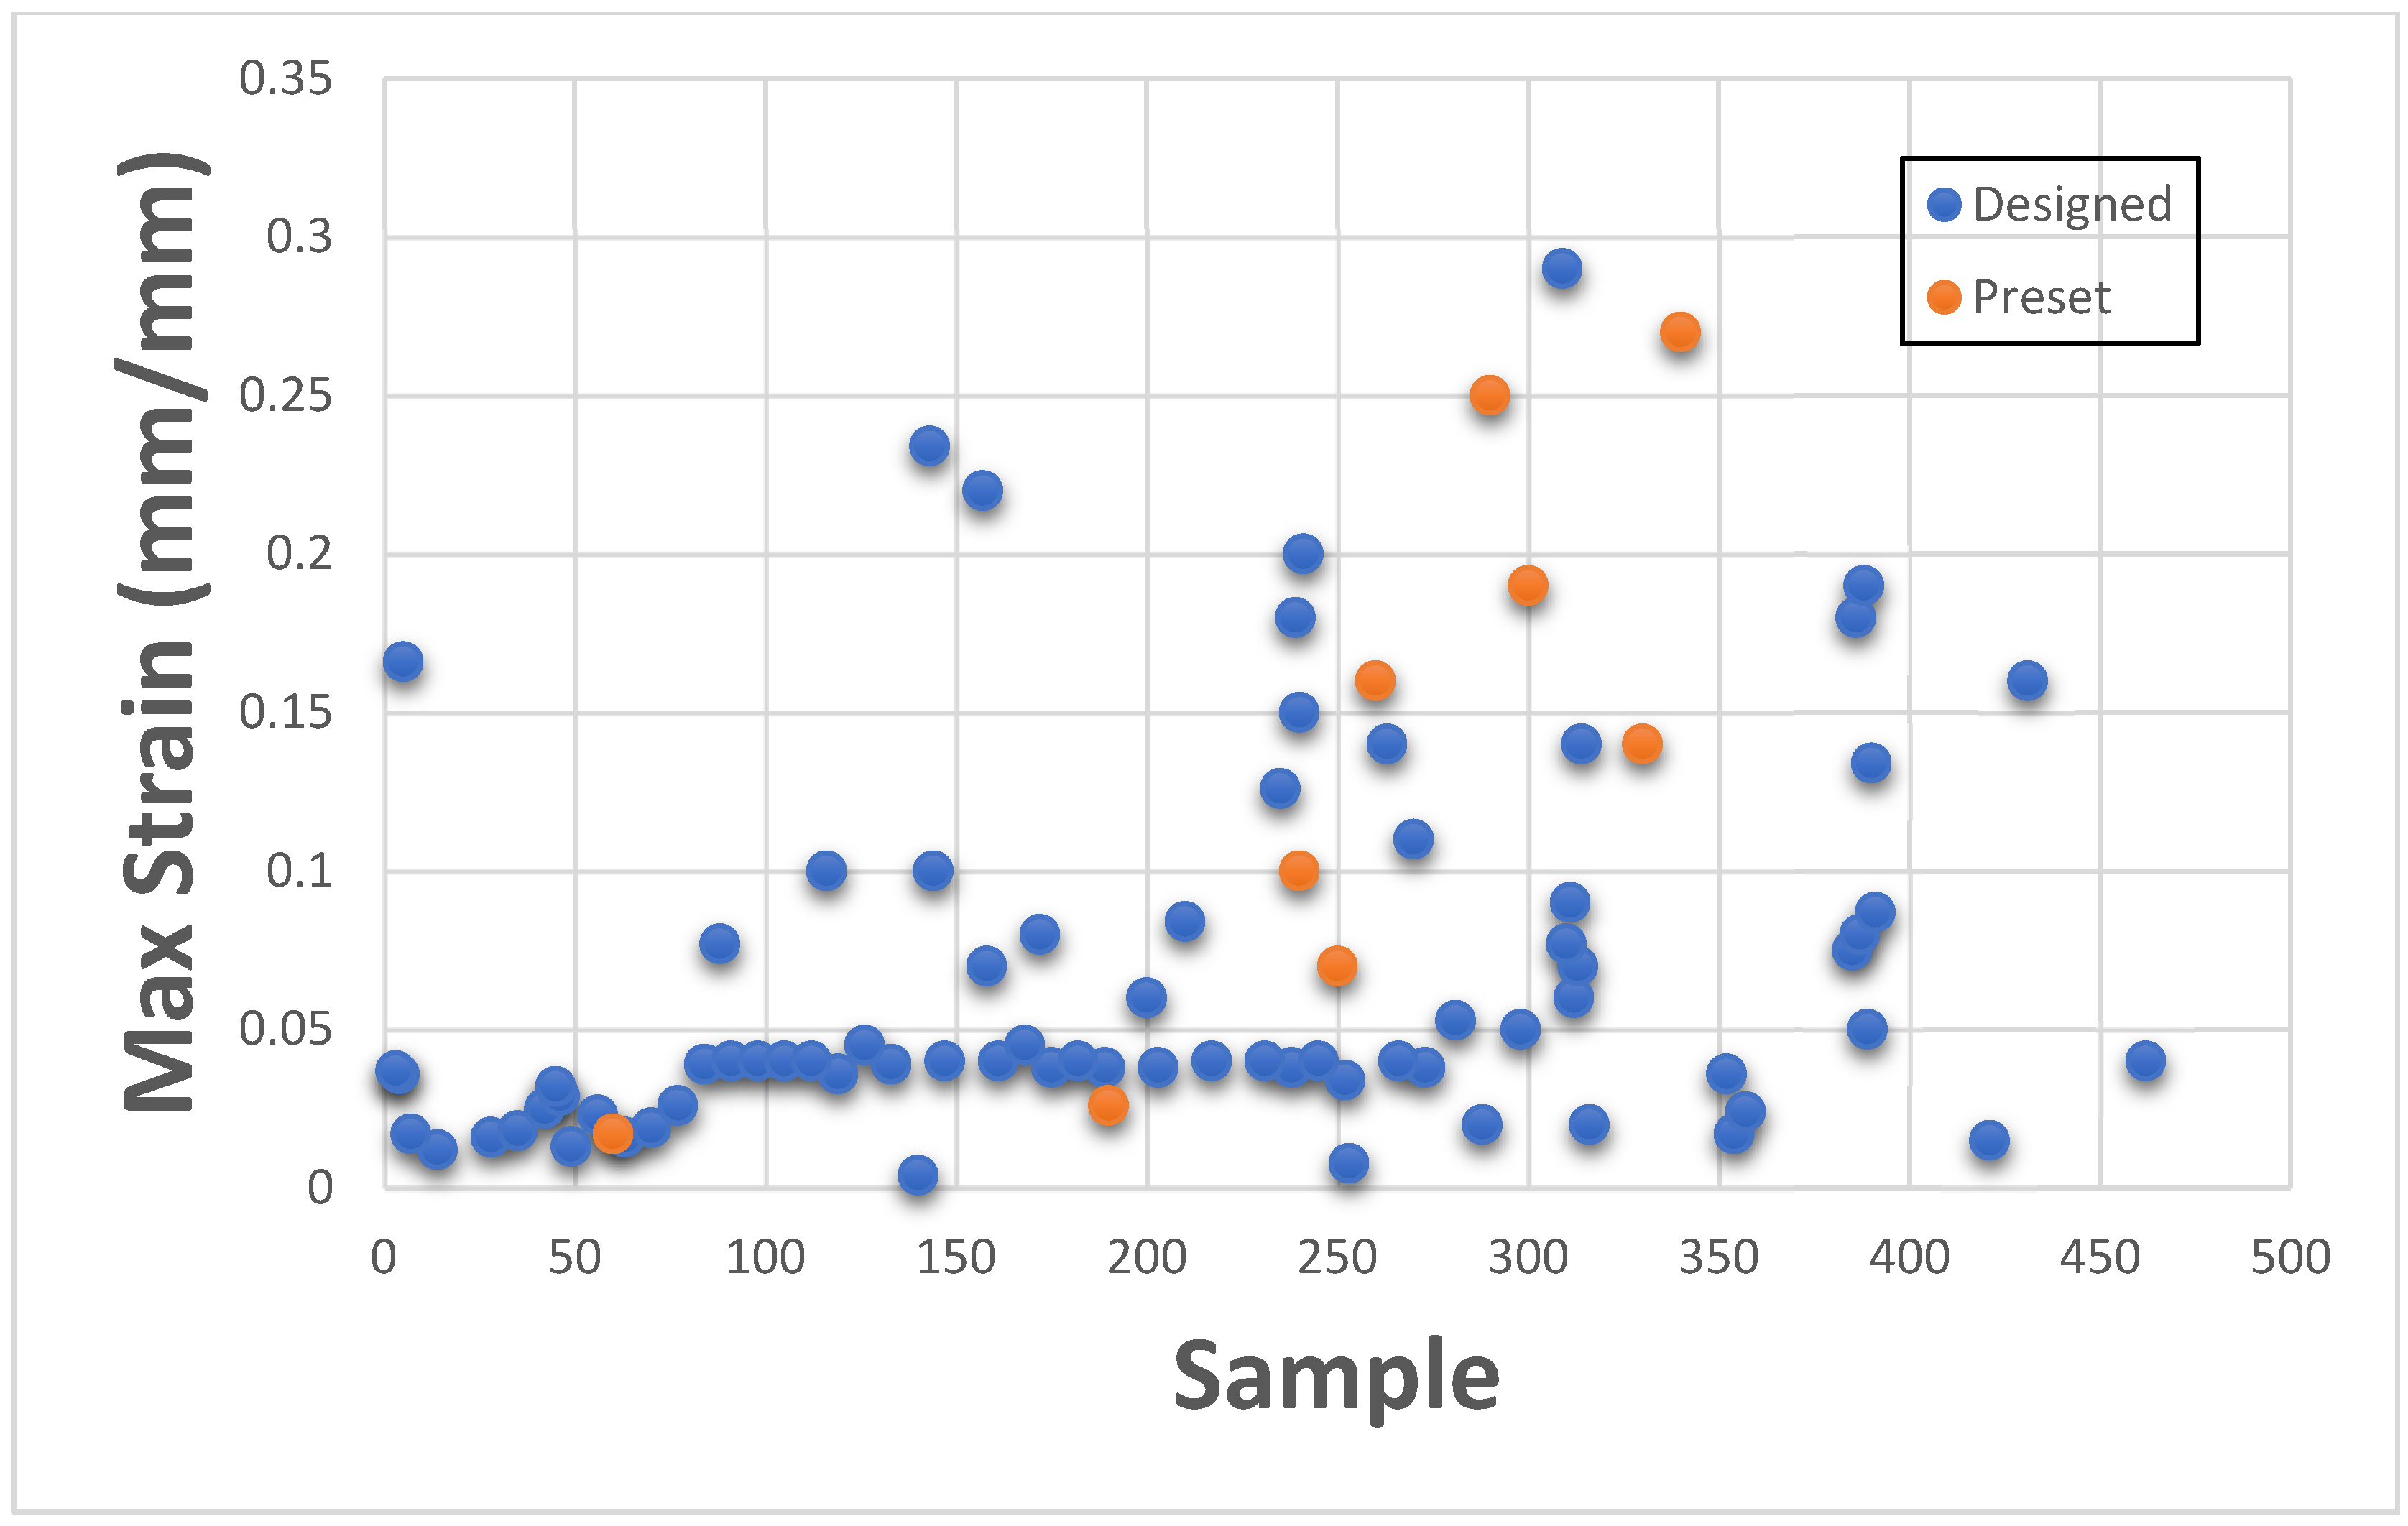
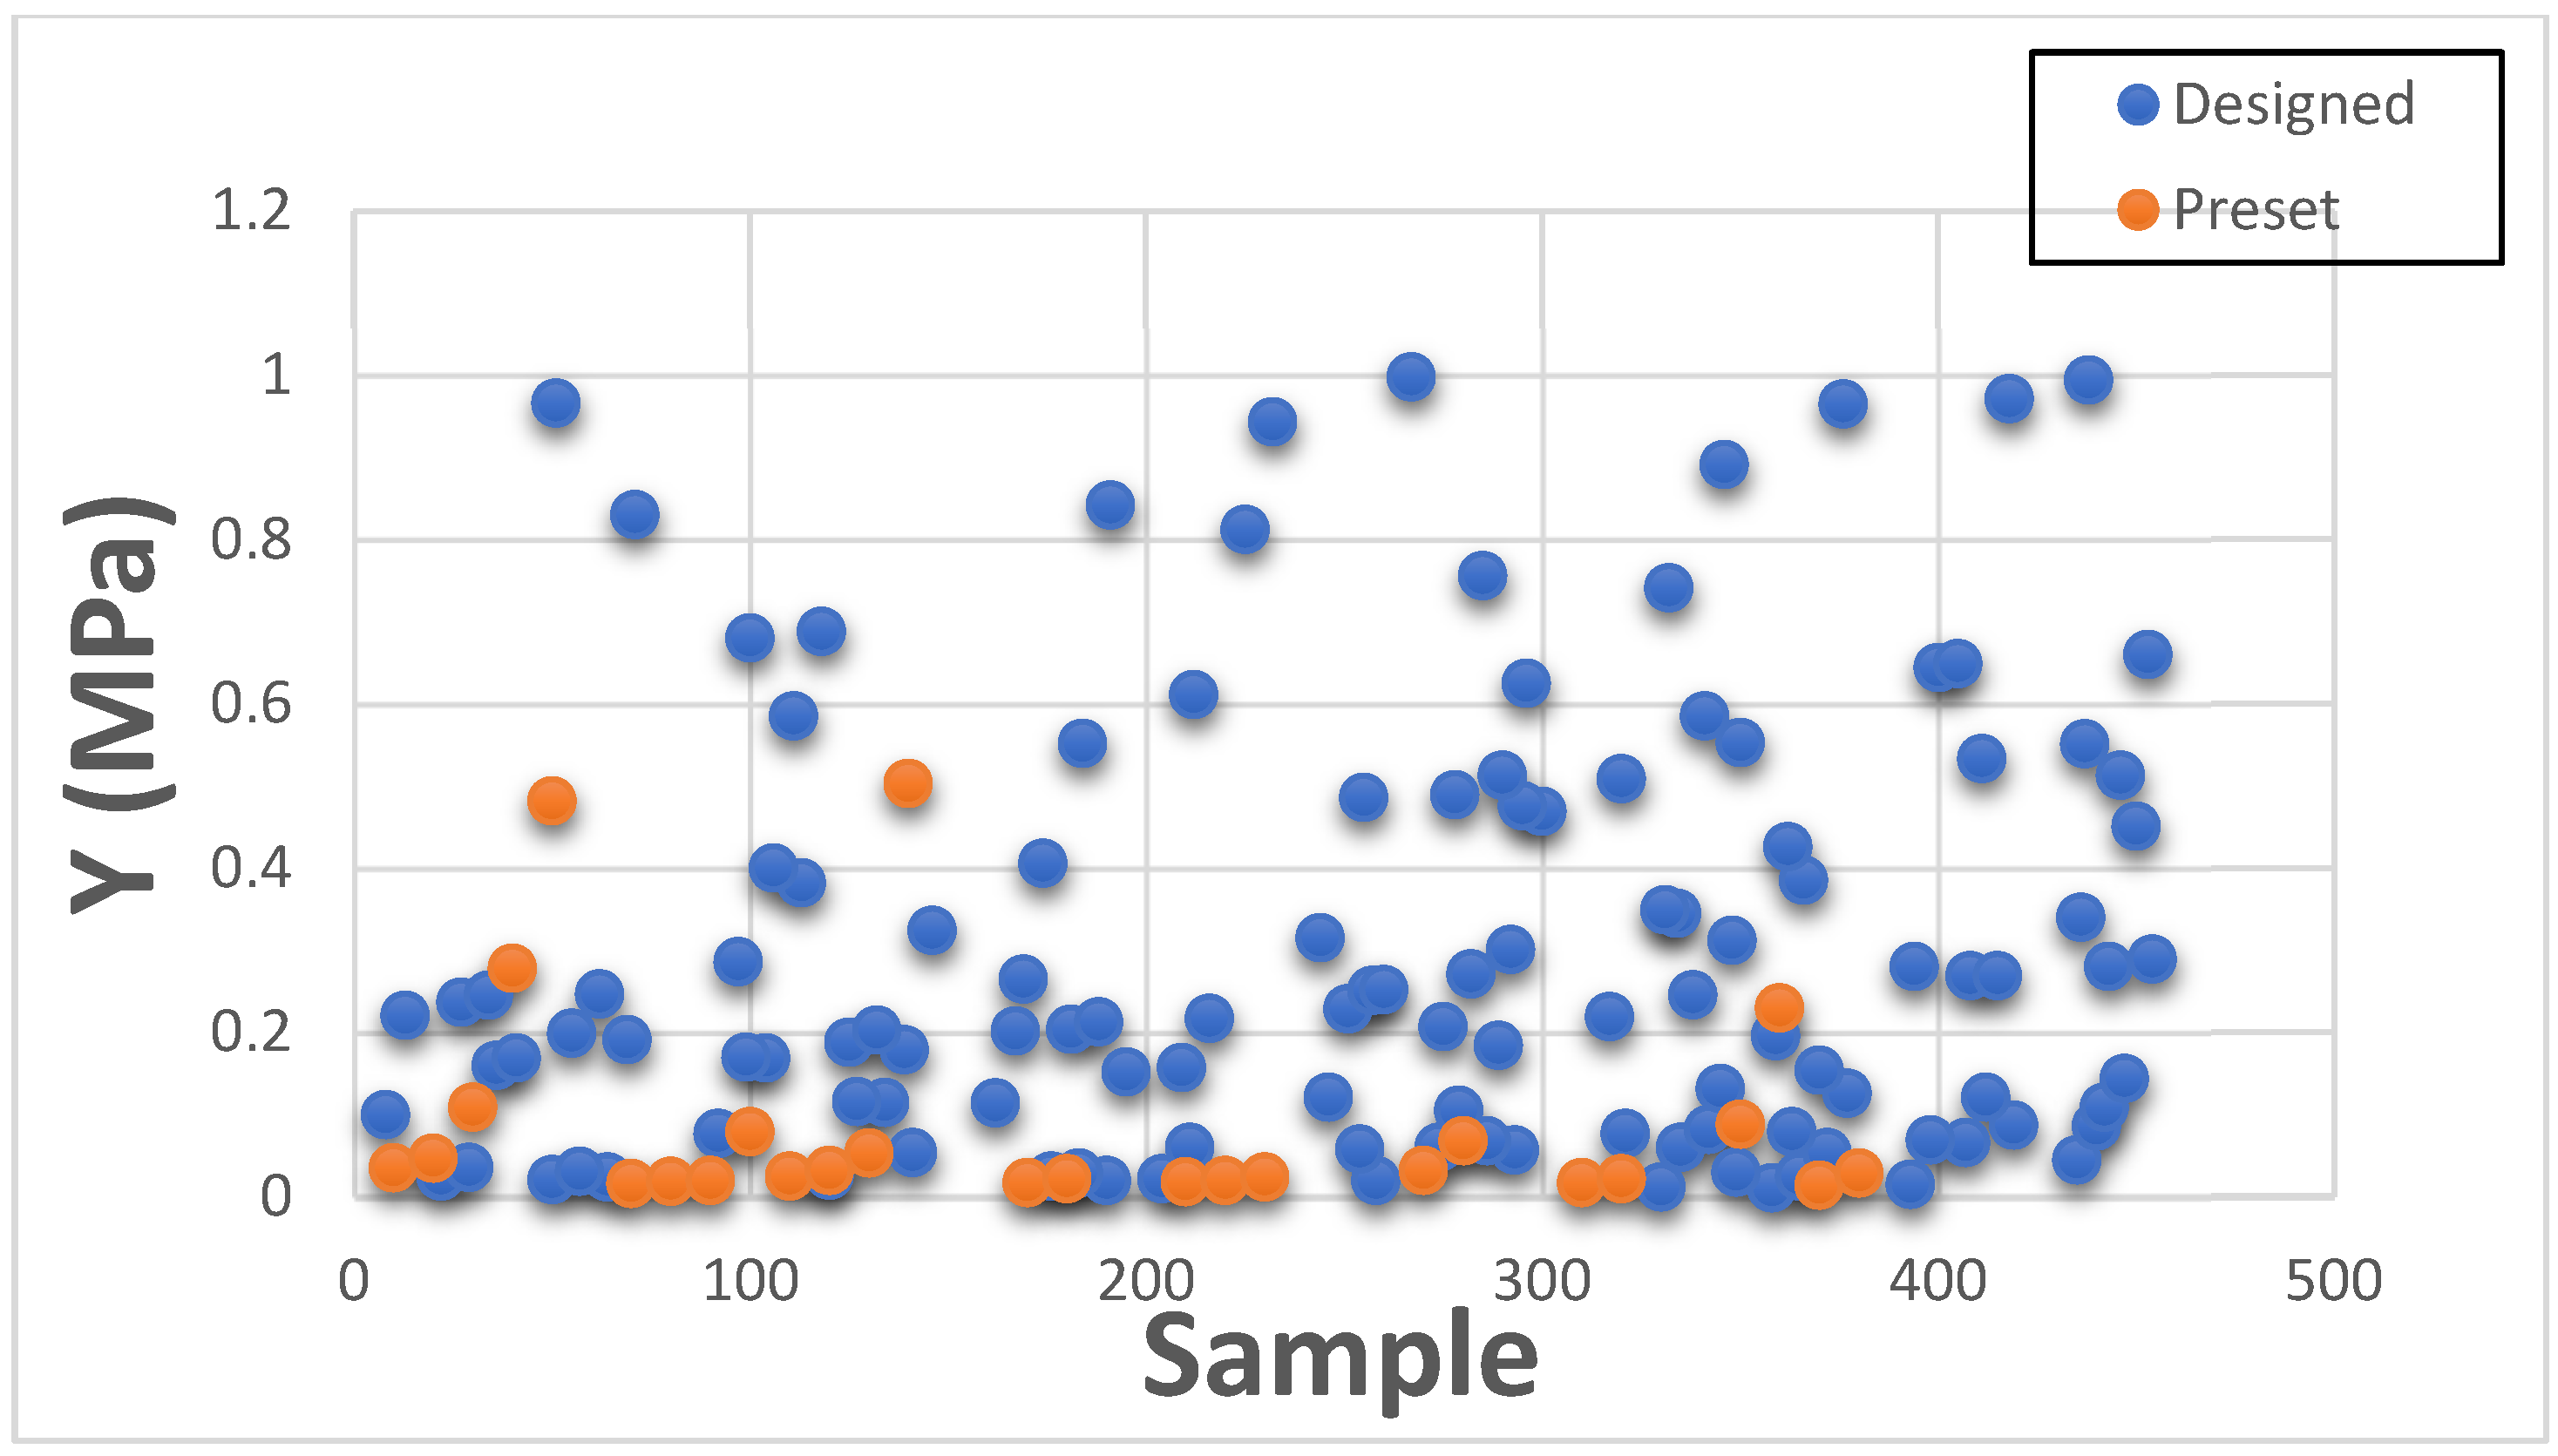
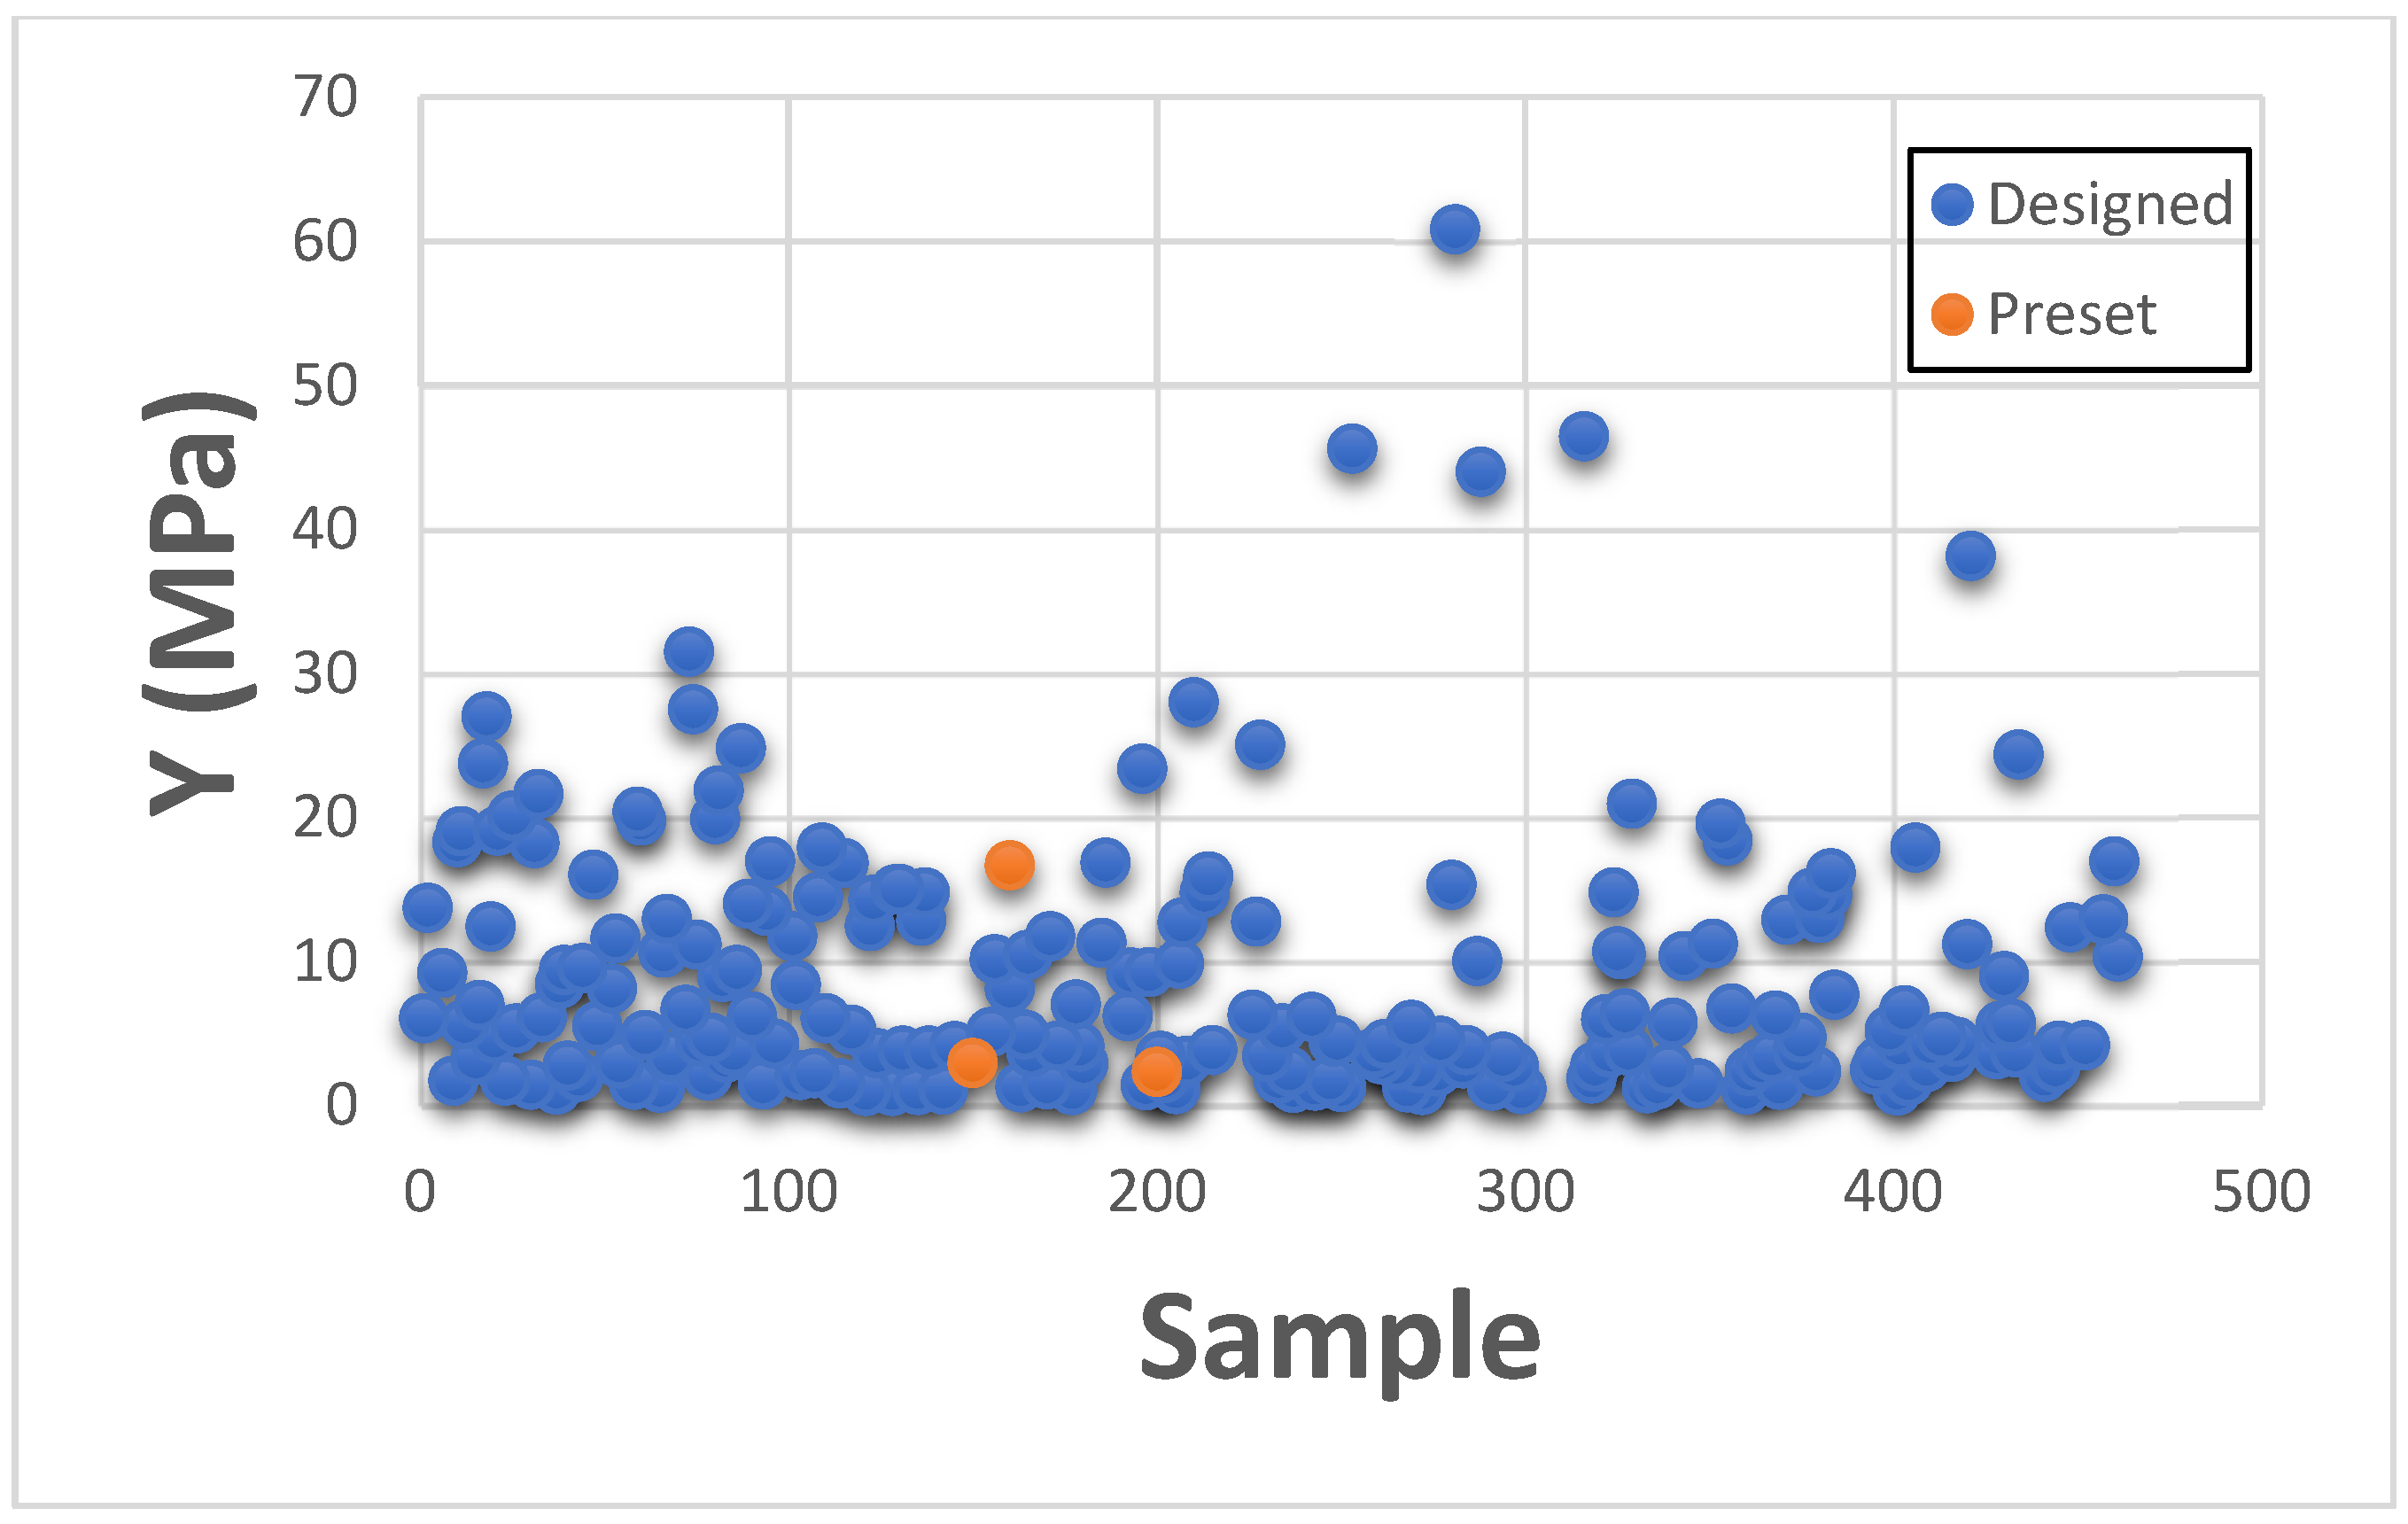
3.2. Max Strain

This section presents Maximum Strain results individually for categorizing with existing GrabCAD™ presets. The tested samples resulted in a wide range of Max Strain values ranging between 0.004 to 424.16. The vast number of runs can be divided into several distinct groups based on the existing tested tensile parts made from preset materials.
Figure 10 and Figure 11 shown below depict the values plotted separately based on low strain values of 0.004 to 1.0 and high strain values of 1.1 to 424.16. Figure 11 consists of samples designed to mimic bone tissue, extremely stiff structural heart frame, skull, vertebrae, long bones, calcified tissues, etc., while Figure 10 consists of all the remaining soft tissues of the body.
Thus, the DOE also successfully encompasses and expands the existing preset standard material range with Max Strain values too.

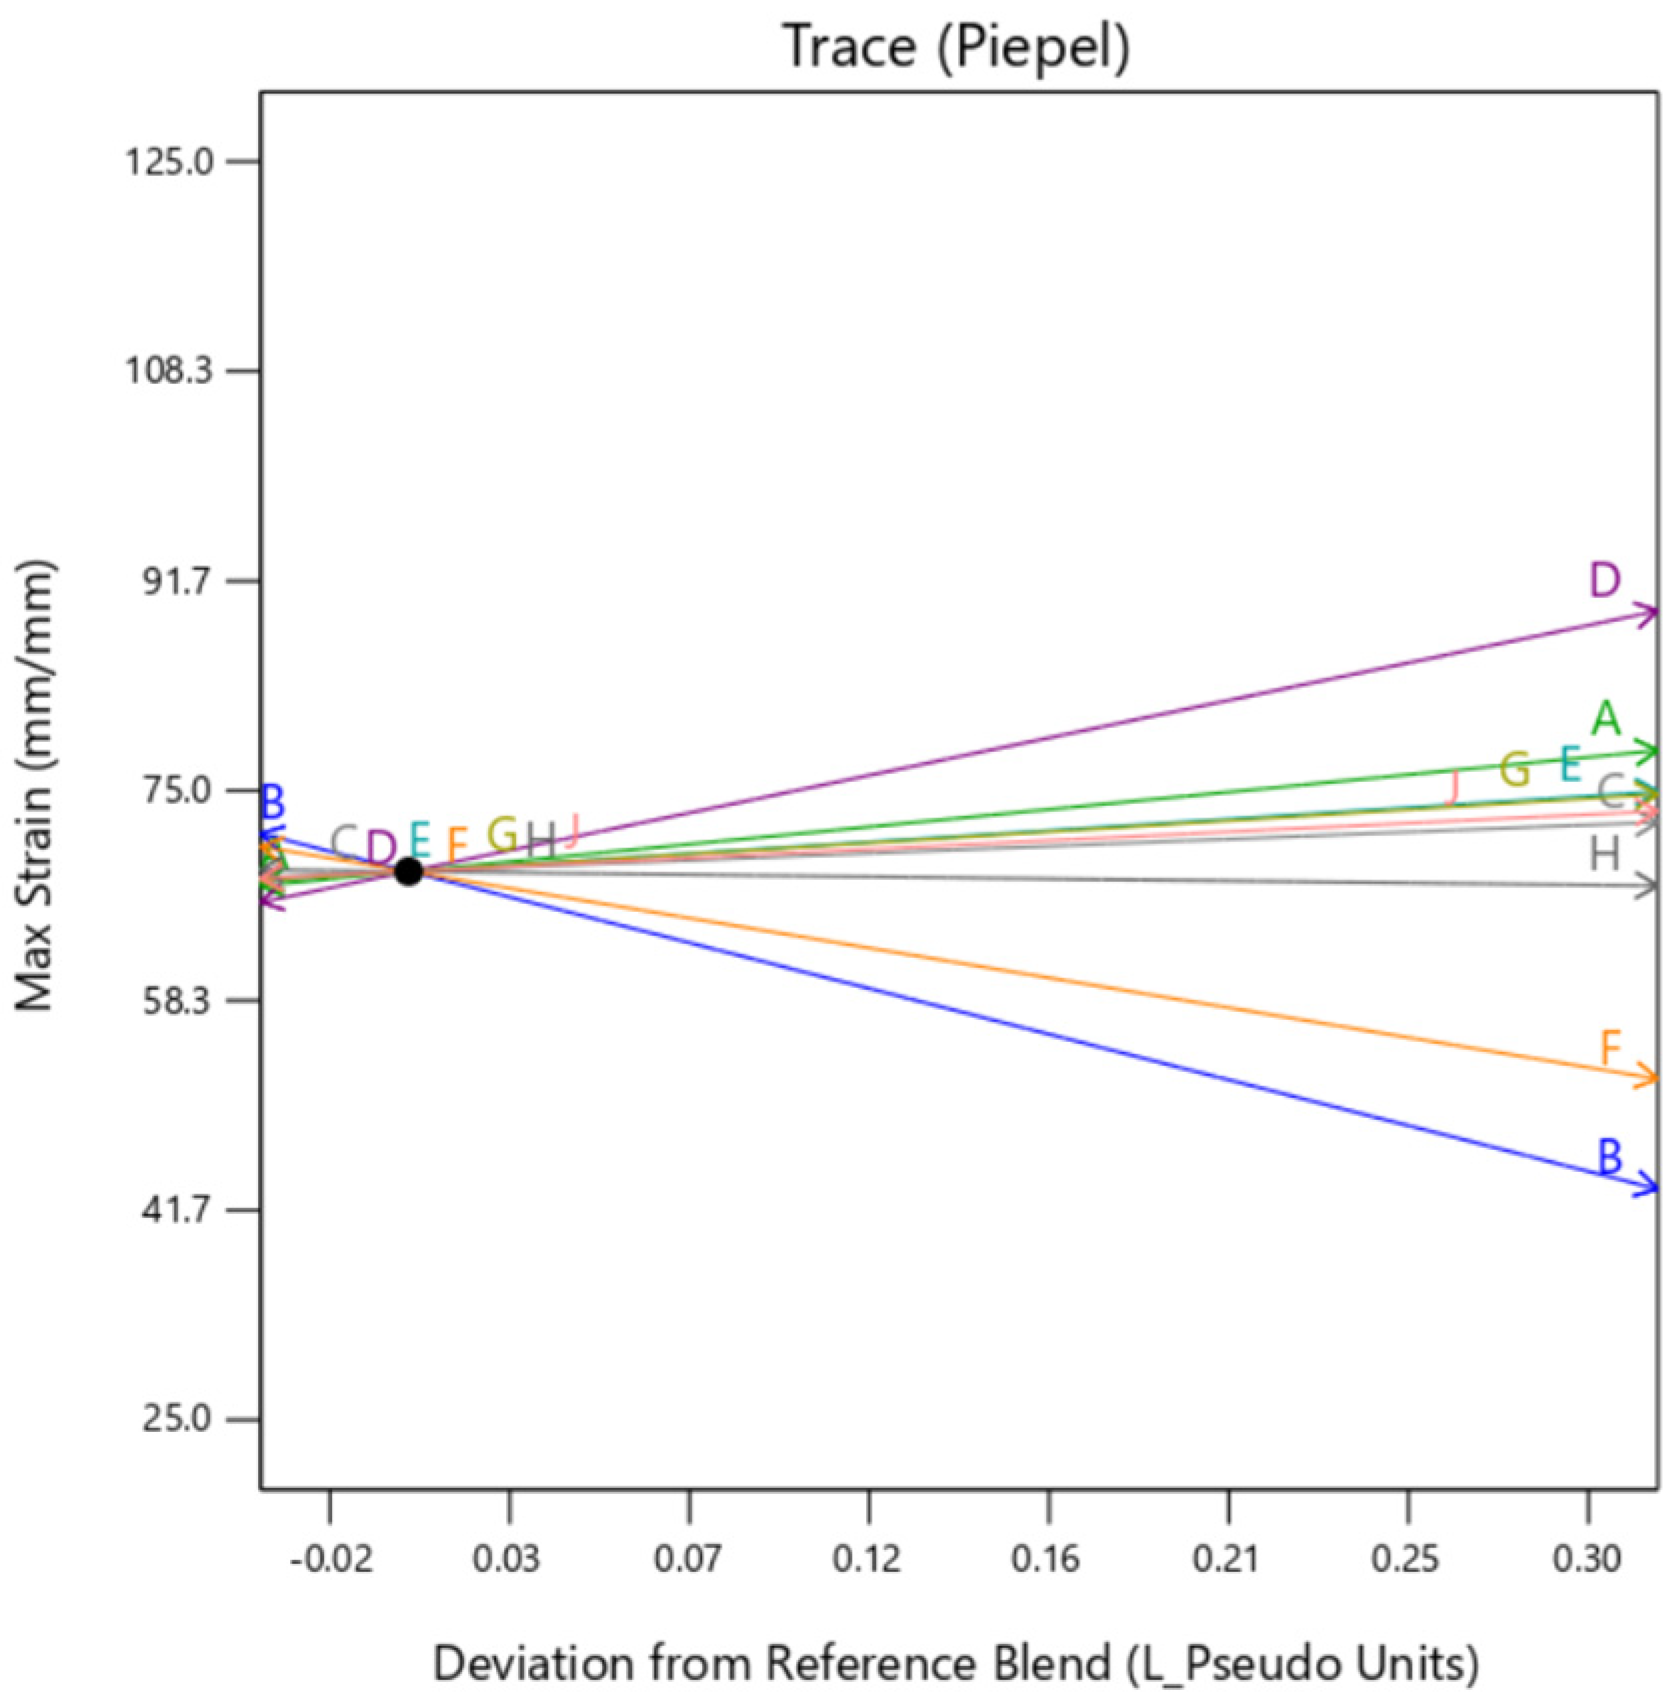
Interaction Plots and ANOVA: Max Strain

After fitting the Linear fit model, it was observed that the quantity of Agilus30Clear™ in the outer layer (A) and background layer (E) has the highest influence on the Max strain values, as suggested by ANOVA in Table 12. No other factor has a significant impact on the response in this case. This clearly suggested that while designing a sample to mimic a specific tissue, the amount of Agilus30Clear™ included in the mixture should be monitored and governed in accordance with Max Stress and Young’s Modulus values. The non-impact of interaction between OT and BType has also been observed in the interaction plot in Figure 12, while it can also be seen that using DM as BType has a slight impact on the resultant strain values.
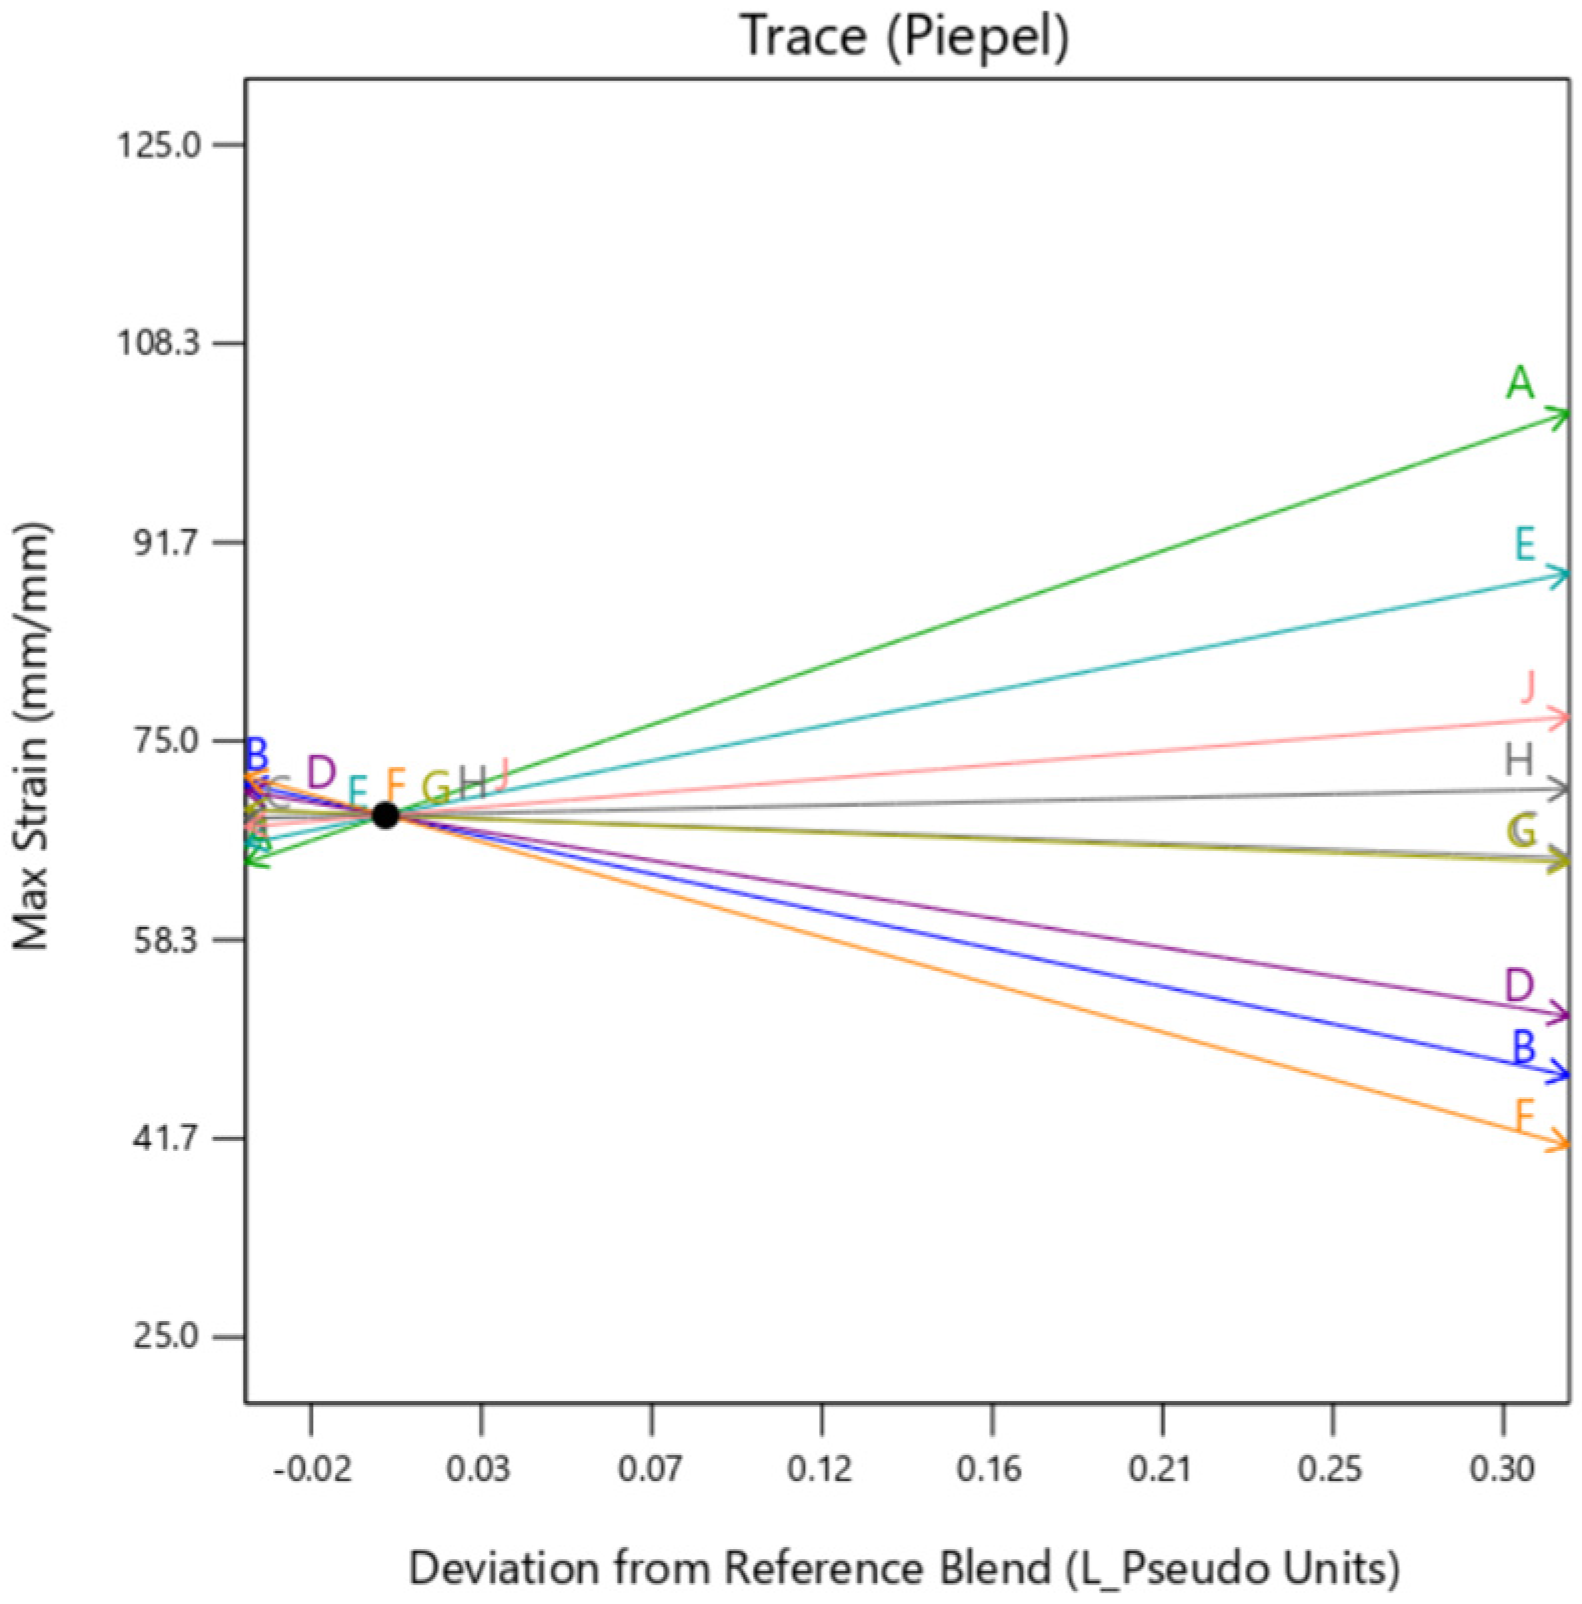
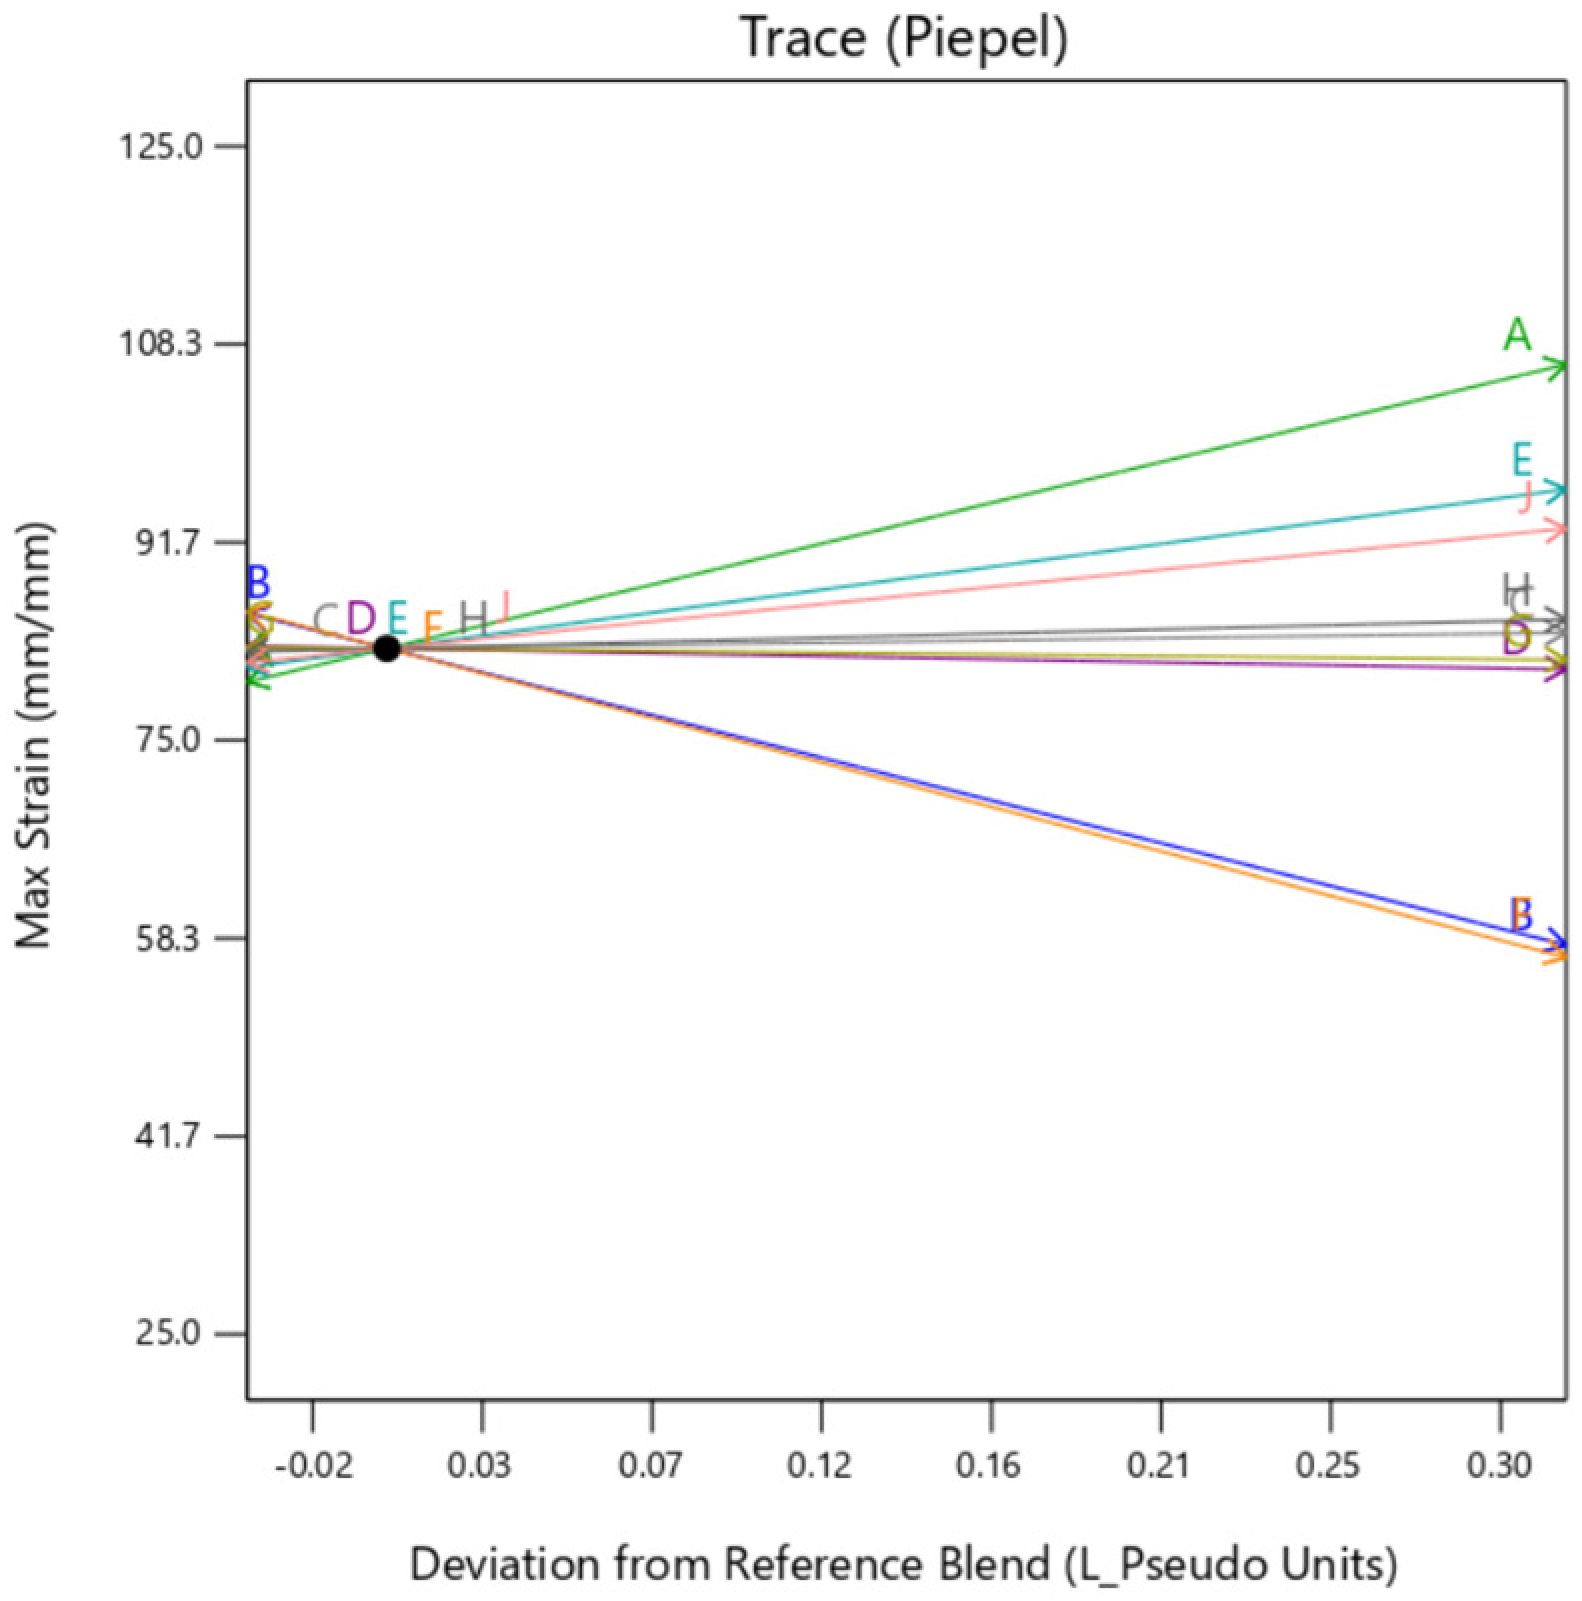
The individual trace plots shown below in Figure 13, Figure 14 and Figure 15 depicts the similarity between the graphs of DM and perlin. Gyroid background shows some dependency on the TissueMatrix™(D) too for the outer layer as can be observed by the slope of trace D in Figure 14 in contrast to Figure 13 and Figure 15. This is due to the increased dependency on the Agilus30Clear™(A) in the overall sample as gyroid infill utilizes both mixture 1 and mixture 2 as its constituents, which inadvertently increases net quantity of mixture 1 in the overall sample.

3.3. Young’s Modulus

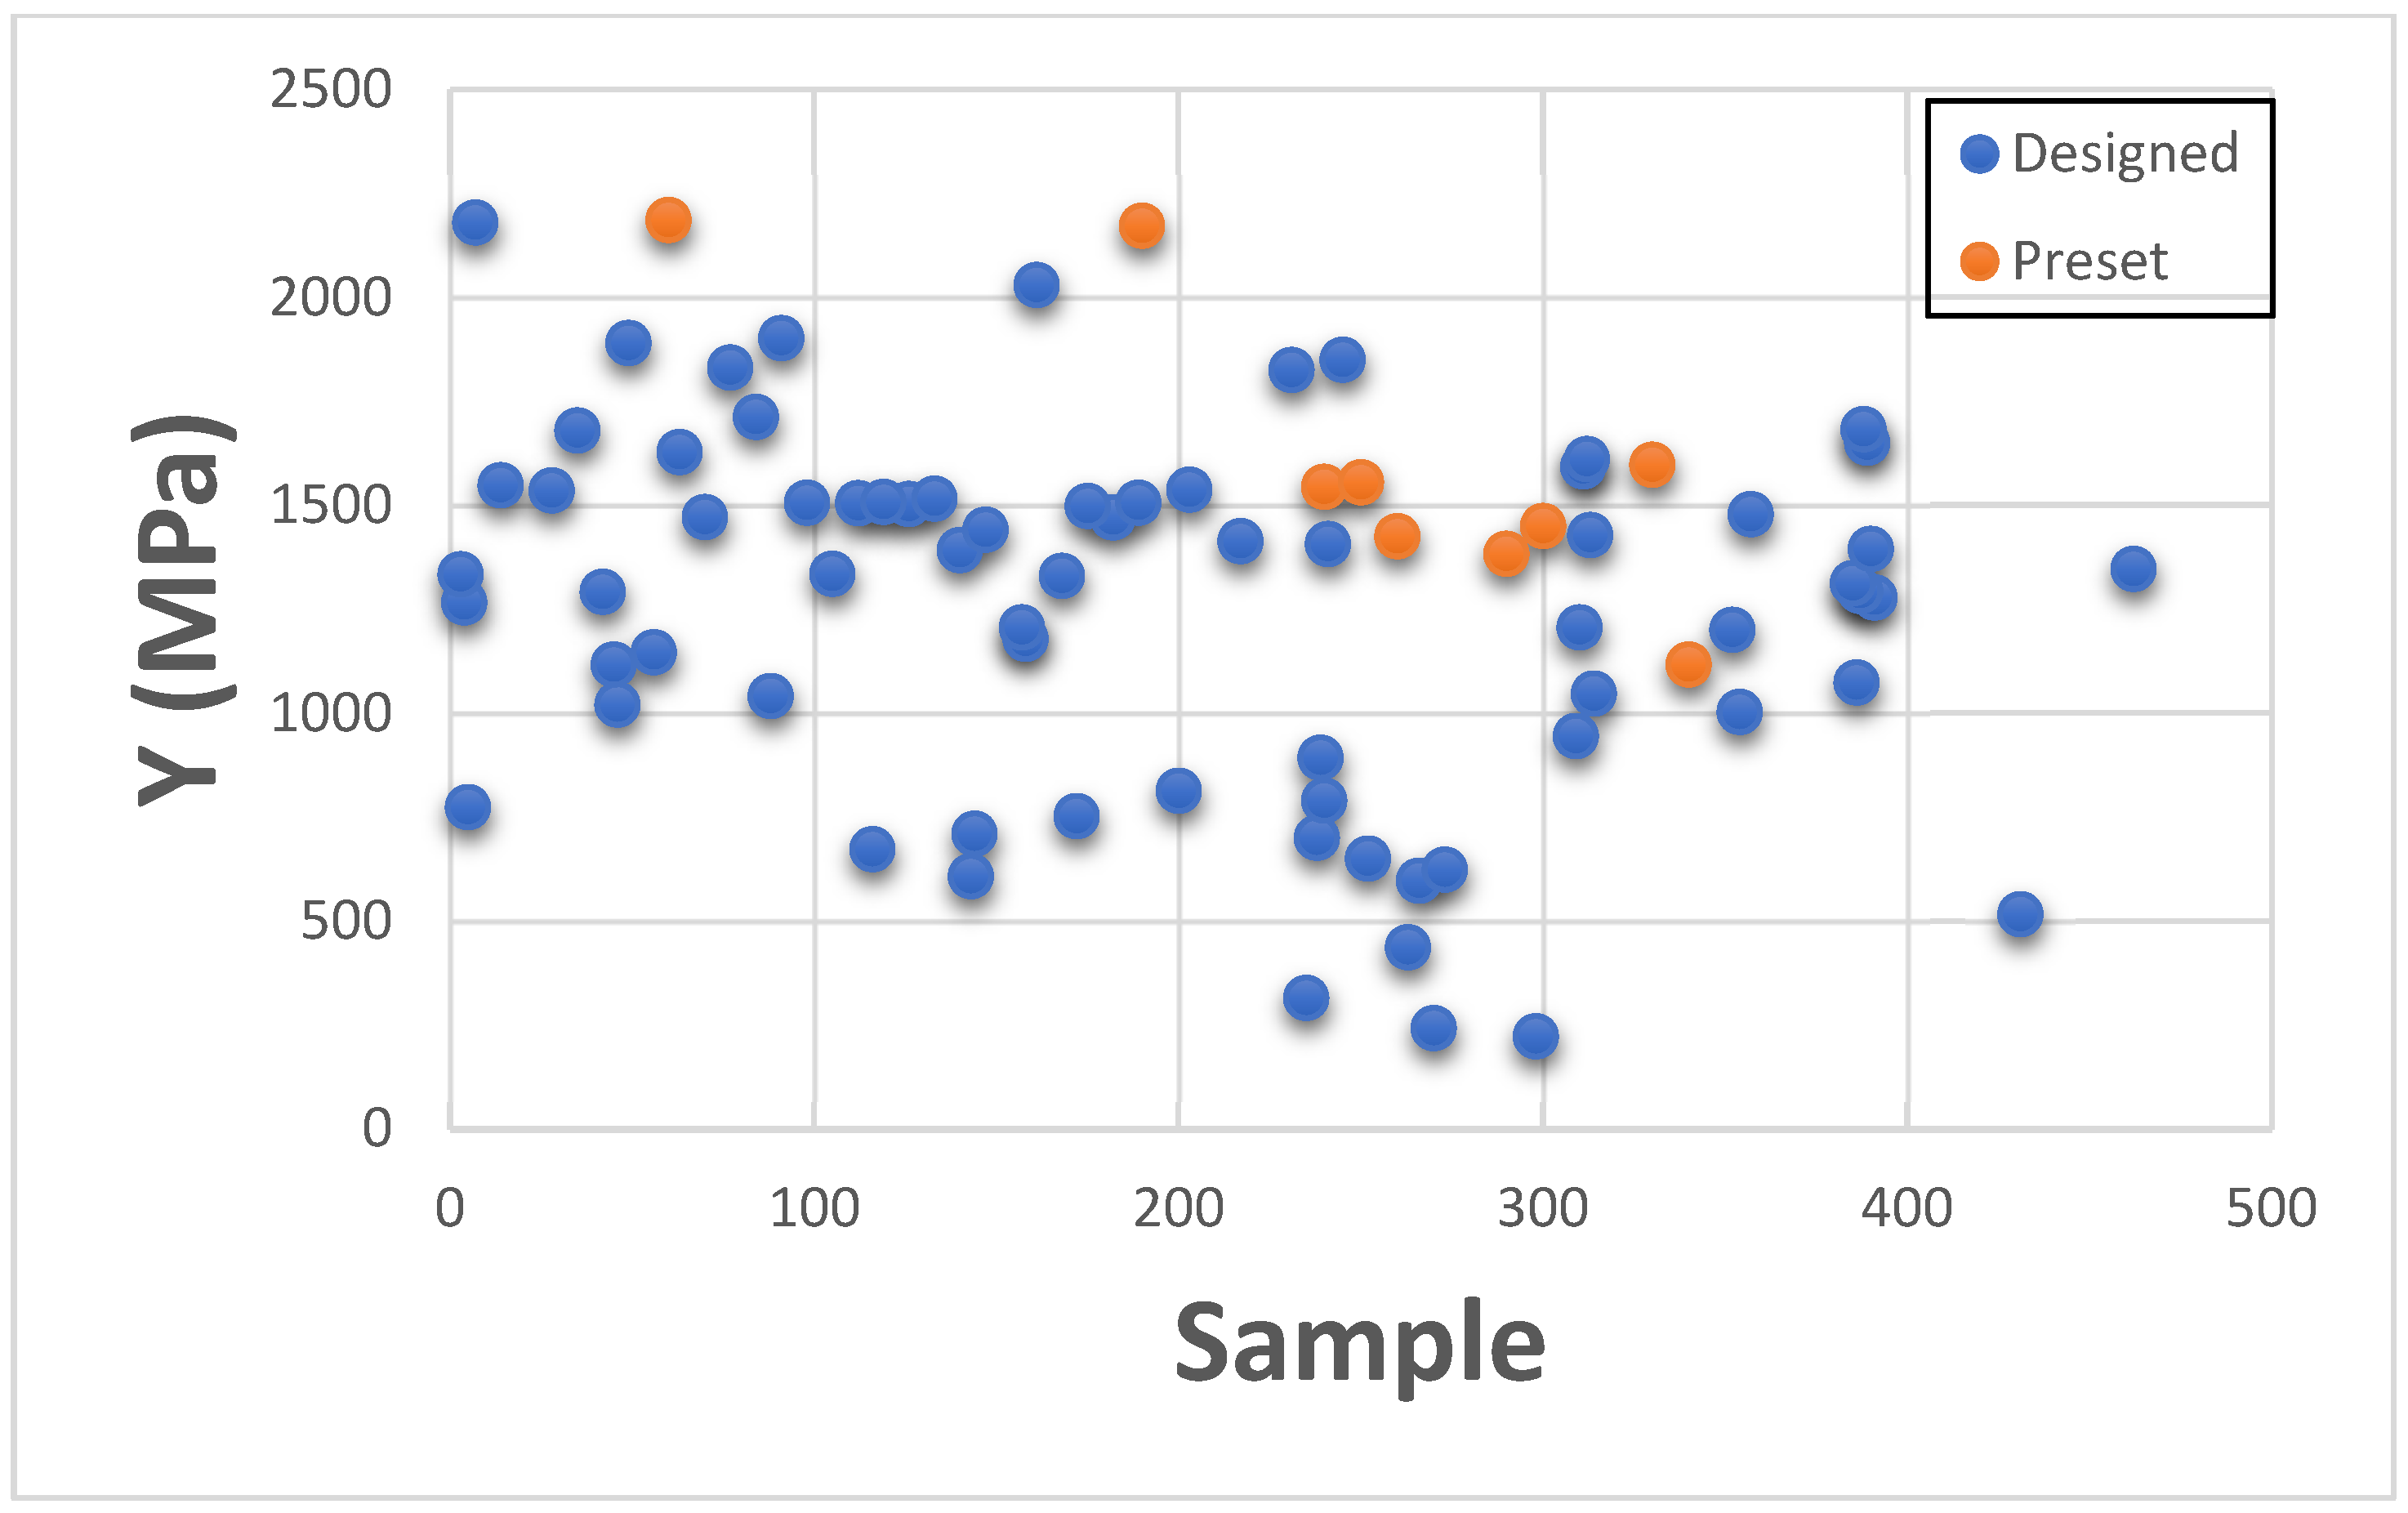
This section presents Young’s Modulus results individually for categorizing with existing GrabCAD™ presets. The tested samples resulted in a wide range of Young’s Modulus values ranging between 0.011 MPa to 2180 MPa. The vast number of runs can be divided into several distinct groups based on the existing tested tensile parts made from preset materials.
The Figure 16, Figure 17 and Figure 18 shown below are the resulting Young’s Modulus values overlapped with the existing preset standard tested parts from Stratasys. Figure 16 contains the samples which had low ultimate Young’s Modulus value. These are generally softer tissues like Liver tissue, Lung tissue, low to mid rigidity structural heart frame, low to mid stiffness Myocardium, Suturable vessel wall, extensible Valve chordae, soft ligaments, nerves, liver tissue, lung tissue, esophagus, stomach tissue, kidney tissue etc. Figure 17 includes stiffened valve annulus, pulmonary valve tissue, aortic valve, soft skin tissue, Sclera tissue, temporal muscle tissue, general anatomical dense connective tissues etc. Finally, Figure 18 consists of rigid tissue materials such as high rigidity structural heart frame, varying porosity bones, skull, vertebrae, tendons, ligaments, rigid skin tissue, long bone tissue, etc.

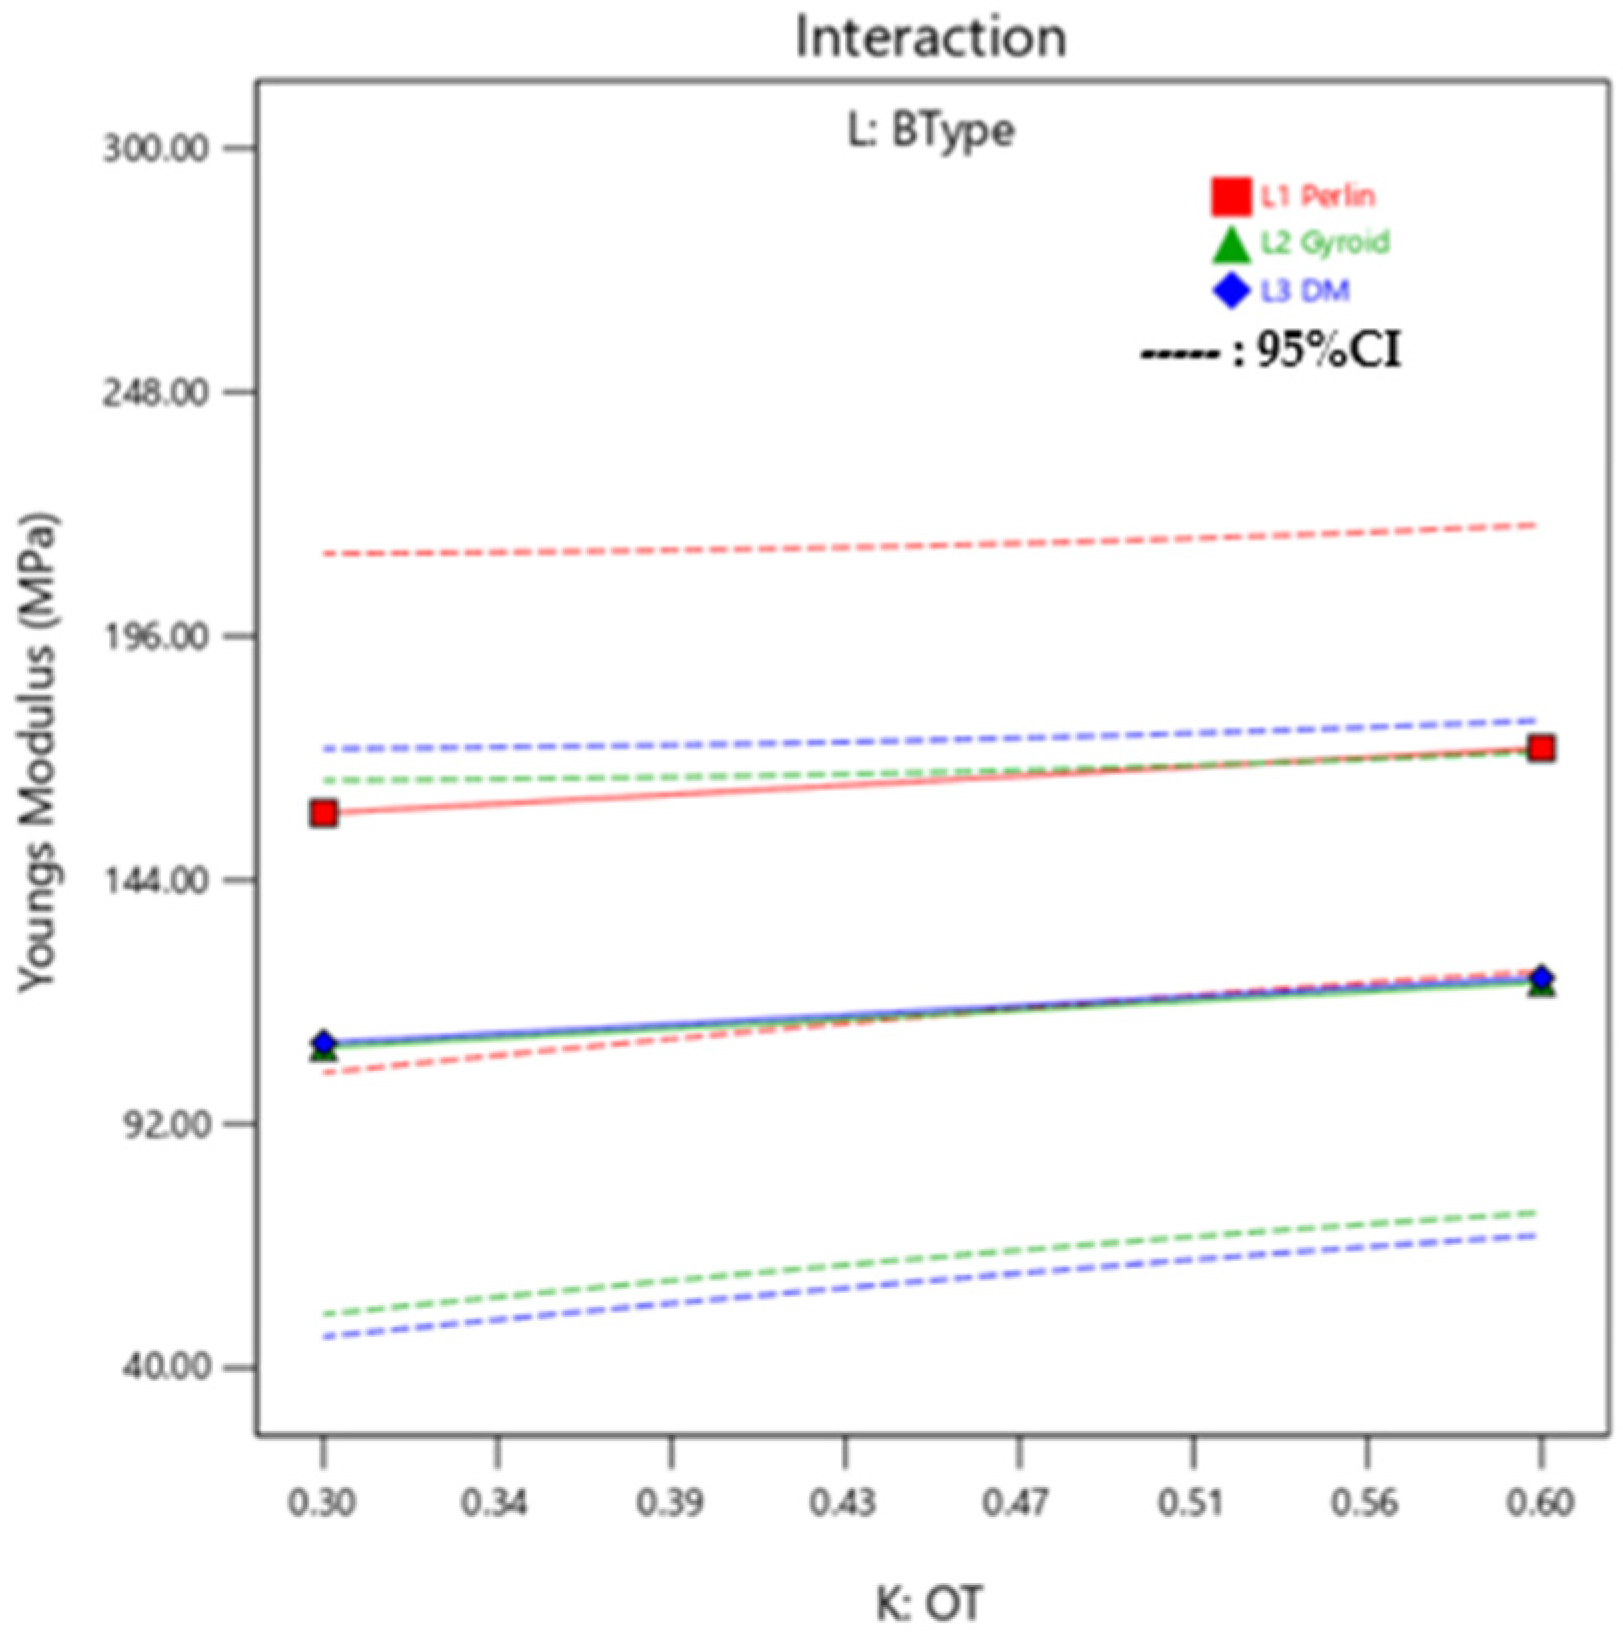
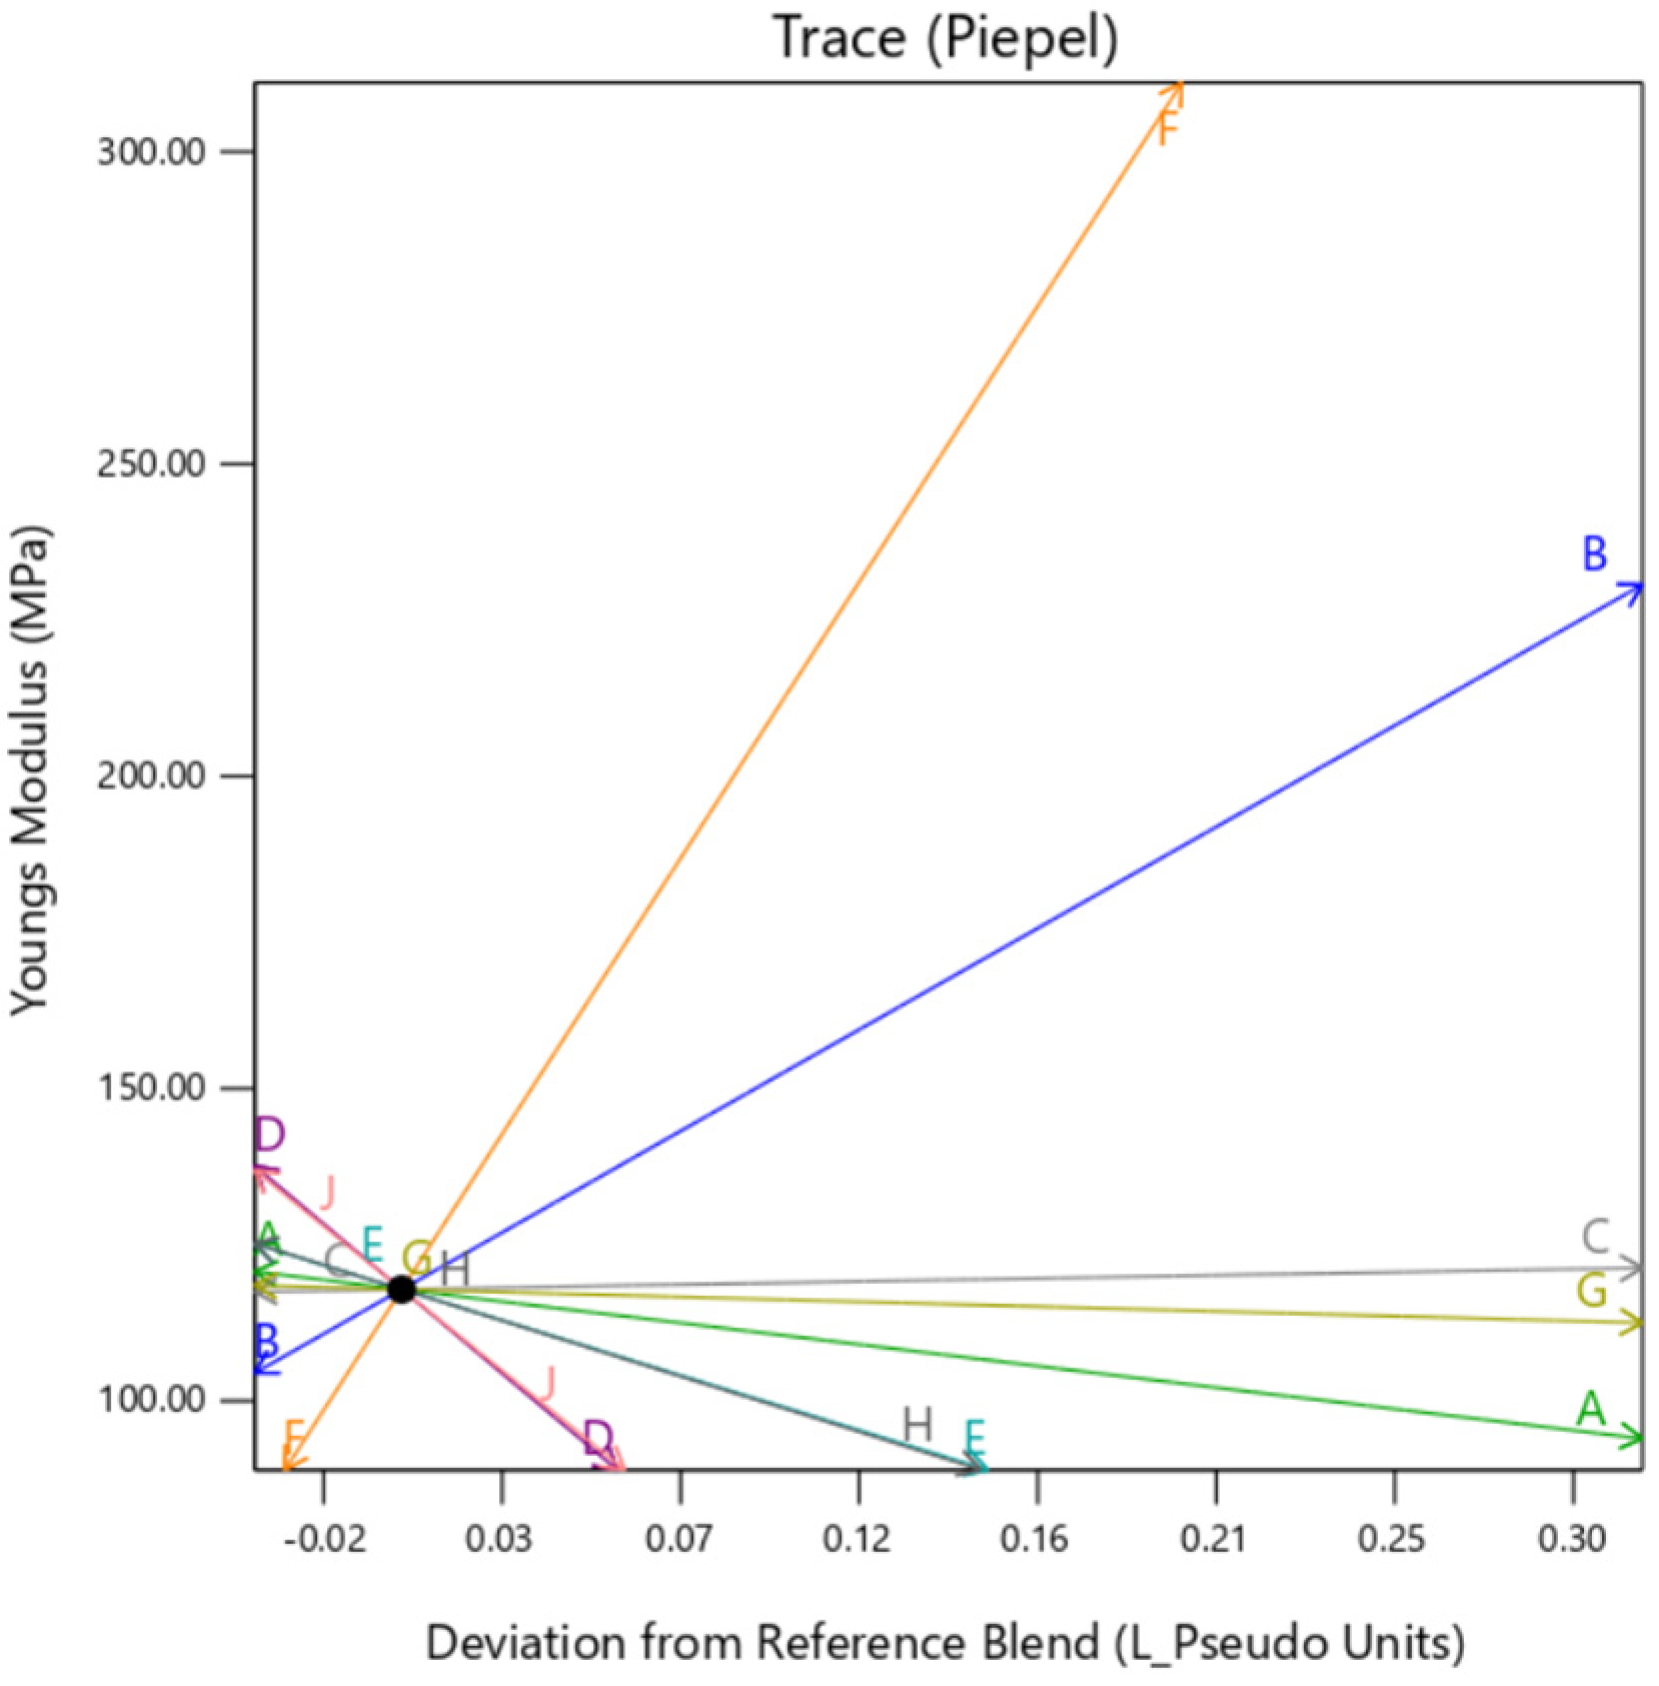
Interaction Plots and ANOVA: Young’s Modulus

The linear model fitting suggested that the ratio of Agilus30Clear™ and VeroPureWhite™ in the Background layer (A and B) and Outer Layer (E and F) have the highest influence on the Young’s Modulus of the sample. As suggested by the ANOVA in Table 13, all the materials have a substantial impact on the Young’s Modulus, it is due to the collective mixture of the Outer Layer and background layer that makes the influence substantial. Young’s Modulus is also highly affected by the OT (K) as it impacts the dependency between Mixture 1 and Mixture 2. As can be seen in the interaction plot in Figure 19, there is little variation on response effected by BType.
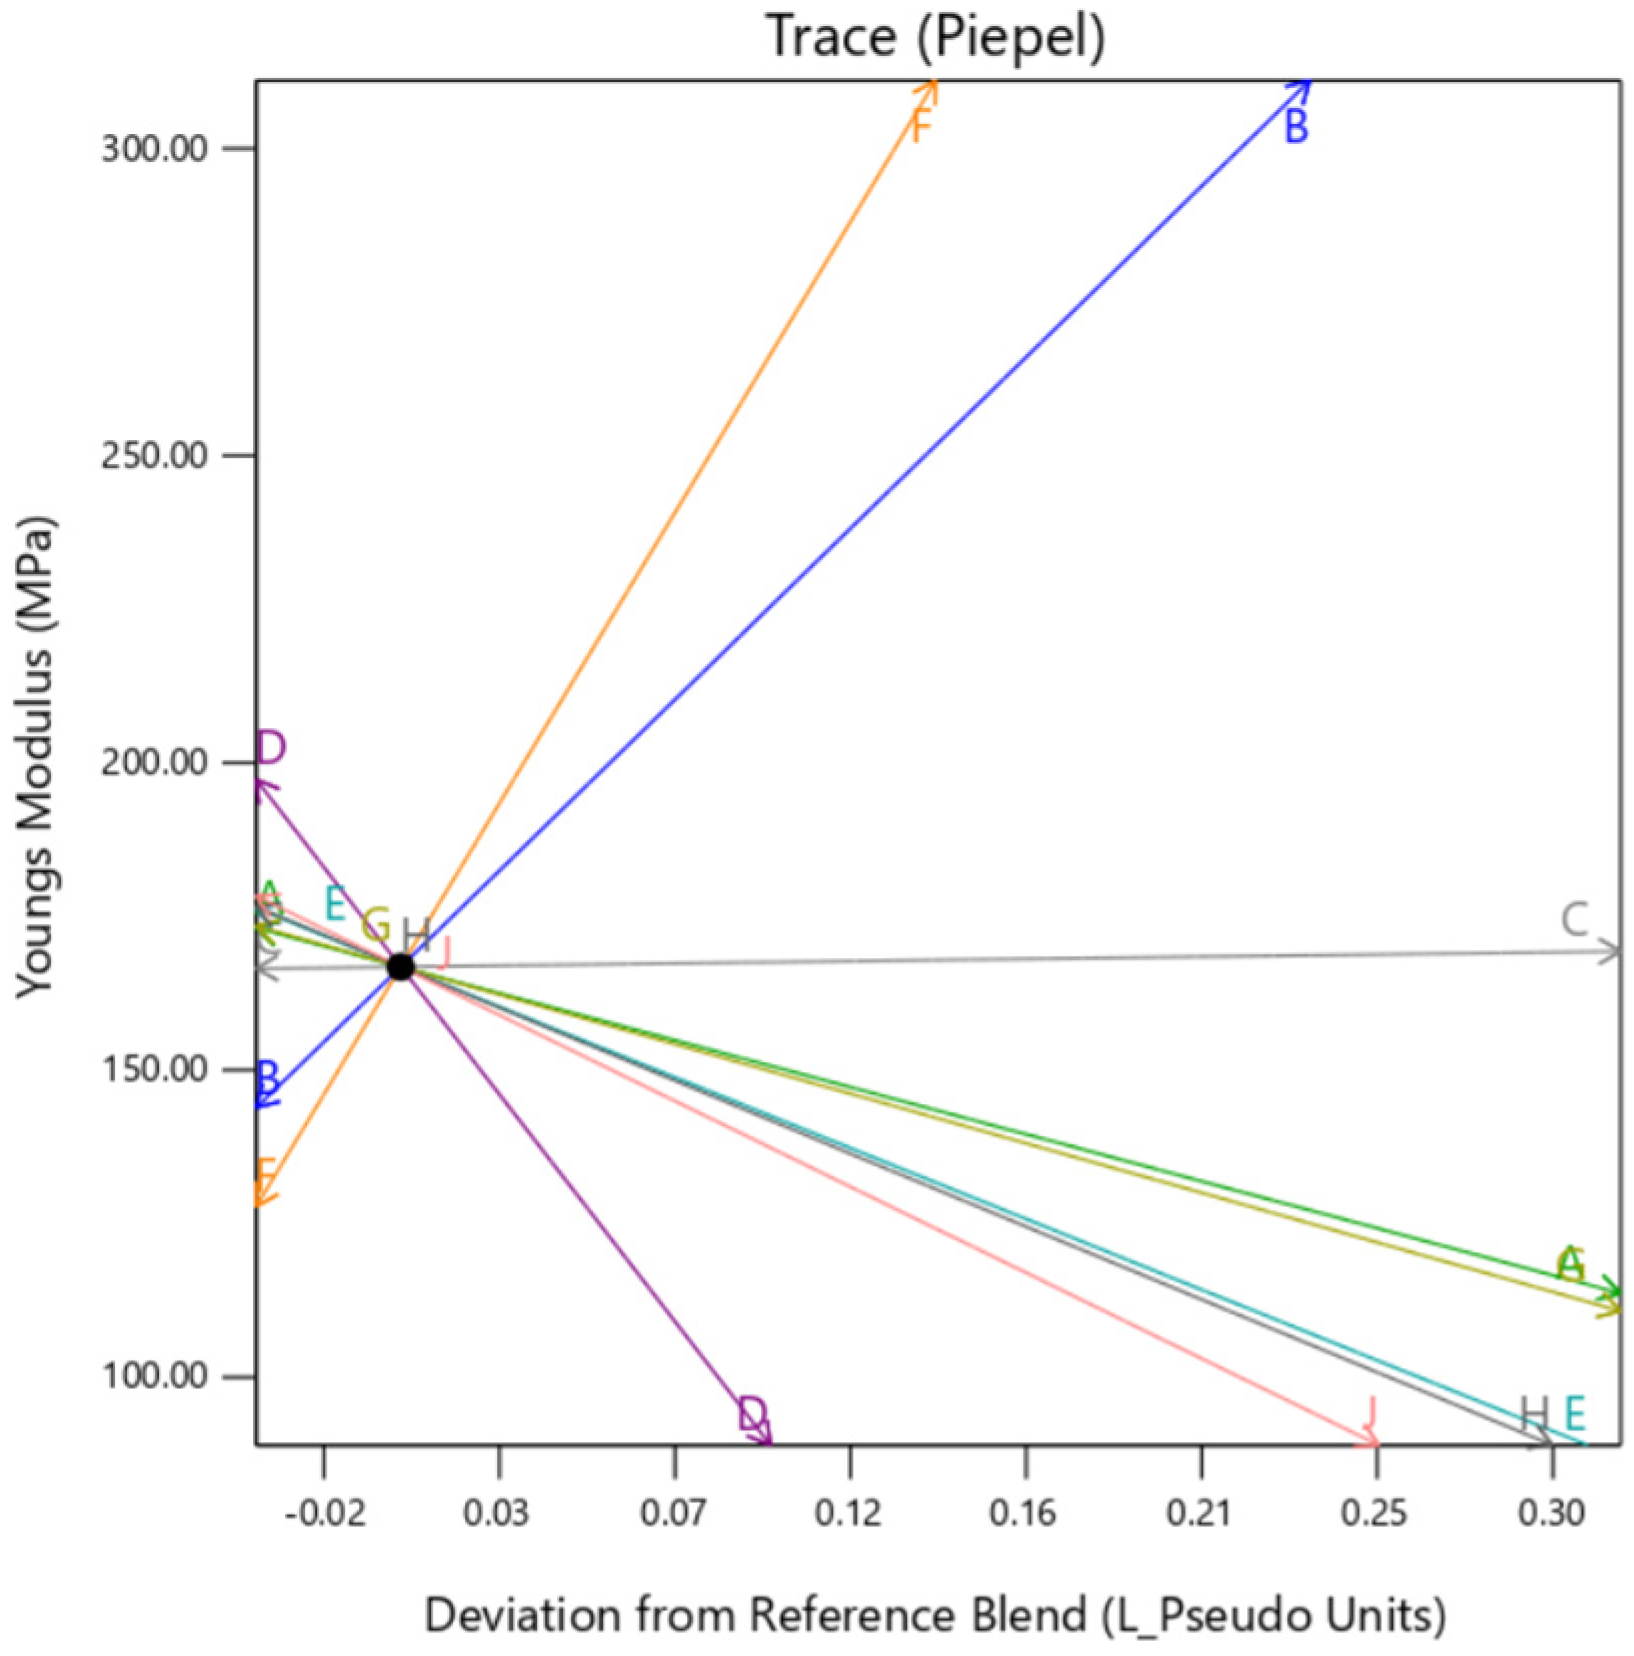
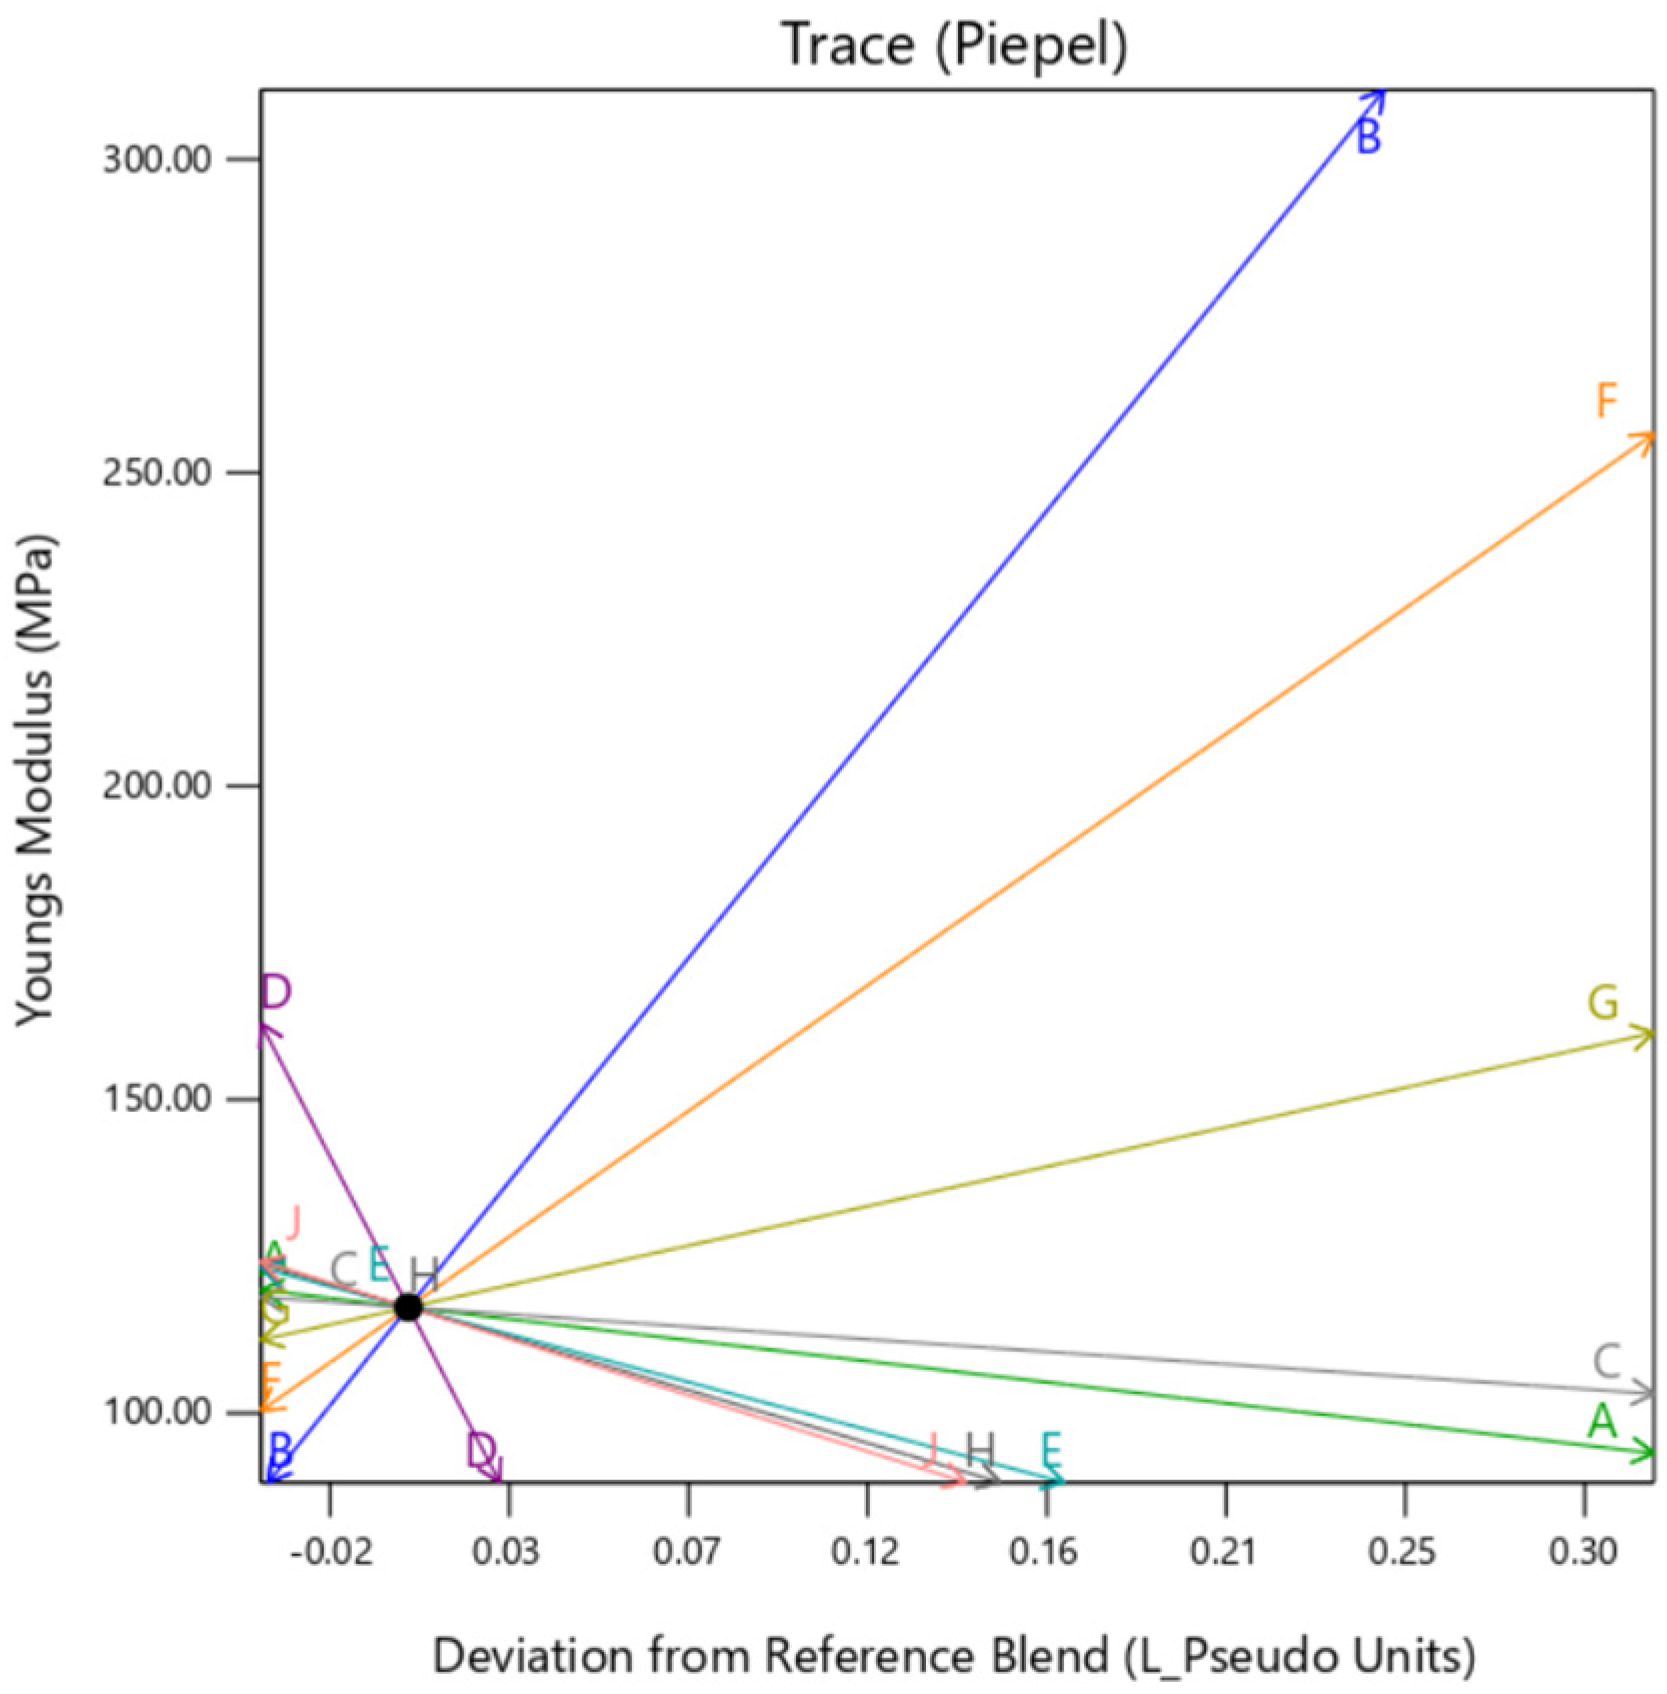
The individual trace plots in Figure 20, Figure 21 and Figure 22 affirm the slight variation caused by gyroid type background in comparison to perlin and DM. This clearly suggests that although the infill for all the samples is 100% across the DOE, gyroid infill creates some discrepancies.

3.4. Optimization and Prediction

To check the validity of the results, several use cases of the tissues have also been tested. This section overviews the parameter/material settings required to generate liver tissue- and tendon tissue-mimicking materials. These tissue types exist on the opposite spectrum mechanistically as liver tissue is relatively soft whereas tendon tissue is relatively hard. The statistics model uses the tissue mechanical properties of Max Stress, Max Strain and Young’s Modulus as inputs based on the literature. As a result, DesignExpert outputs the recommended parameters to achieve the specific tissue types.

3.4.1. Liver Tissue

According to the literature, the liver tissue’s Max Stress value ranges from 0.011 to 0.2 MPa, the Max Strain values range from 200 to 400, and the Young’s Modulus values range from 0.010 to 0.05 MPa [21]. These values depend upon the donor’s age, height, weight, health etc. These values are also listed in Table 14 below.
These values are used in the optimization toolbox of the Design Expert and Table 15 shows the recommended parameter/material settings, indicated by the red dot on each subplot, that are required to obtain an accurate liver tissue mimicking material. These values can also be tweaked in either direction based on the learnings of the impact of specific parameters on the responses to obtain a particular value between LSL and USL. The model suggests various solutions which depend upon the total range of LSL and USL. Based on the requirement of tissue, any specific parameter can be chosen accordingly.

3.4.2. Tendon Tissue

According to the literature, the tendon tissue’s Max Stress value ranges from 100 to 140 MPa, the Max Strain values range from 0.1 to 0.5, and the Young’s Modulus values range from 1000 to 1500 MPa [21]. These values depend upon different factors such as a specimen’s age, height, weight, health, etc. These values are also listed in Table 16 below.
In a similar manner, as explained in the aforementioned section for liver tissue, the model suggests various different settings to achieve the target values between the Max Stress, Max Strain, and Young’s Modulus for tendon tissue as shown in Table 17. According to the requirement, a specific setting can be chosen and used for making the model. Since the mechanical properties provided in this case are broad, the model generates multiple solutions to satisfy the values within the given range.

4. Conclusions

This article utilizes an elaborate DOE to explore tissue-mimicking applications with the help of PolyJet™ printing method. By using a custom design which includes a combination of mixture and factorial analysis, the impact of various material and software parameter settings are analyzed. These values are used to manufacture tensile testing specimens under ASTM D638 for evaluating mechanical properties such as Max Stress, Max Strain, and Young’s Modulus. After PolyJet™ 3D printing all the samples, they are tested, and the mechanical properties are recorded for analyzing the data. The model suggests that outer layer thickness is a crucial factor in designing a material as it governs the impact between outer layer and background layer. Based on the outer layer thickness the rigidity of a sample is defined, and the resulting stiffness is determined by the quantity of Agilus30Clear™ and VeroPureWhite™ in the mixture. By varying these material parameters in accordance with the type of infill, a specific sample can be obtained having desired mechanical properties.
Additionally, the samples are also compared with the existing literature values of tensile tested human tissue values and the preset standard tissue values available in the software GrabCAD™ print. The DOE model is verified by suggesting printing parameters for replicating liver and tendon tissue. The samples printed from the study covered more than 50 biological tissue values found in the literature. It is observed that the designed samples encompassed varied tissue properties with possible variances to allow customizing of specific tissue properties based on the application. Thus, this study provides researchers and professionals with a way of mimicking human tissue’s mechanical properties through varying material and software parameters by PolyJet™ 3D printing method.

Author Contributions

Conceptualization, Y.S. and P.R.; methodology, Y.S.; software, Y.S.; validation, Y.S.; formal analysis, Y.S.; investigation, Y.S.; resources, Y.S., P.R. and A.G.E.; data curation, Y.S.; writing—original draft preparation, Y.S.; writing—review and editing, Y.S., P.R. and A.G.E.; visualization, Y.S.; supervision, P.R. and A.G.E.; project administration, P.R.; funding acquisition, A.G.E. All authors have read and agreed to the published version of the manuscript.

Funding

This research is supported by The Frank J. and Eleanor A. Maslowski Charitable Trust. Thanks to Jesse Roitenberg from Stratasys Inc. for support by providing some materials used in this study. We would like to recognize Anderson Labs, UMN for allowing the use of their MTS Tensile testing machine, as well as Bakken Medical Device Center, UMN and MedWorx for allowing the use of the Stratasys Polyjet J850 printer used in this research. We also want to thank Dr. Will Durfee for providing great feedback on the manuscript outline and writing.

Data Availability Statement

Data are contained within the article.

Acknowledgments

During the preparation of this work the author(s) used ChatGPT version 4.o in order to improve the readability and language of the manuscript. After using this tool/service, the author(s) reviewed and edited the content as needed and take(s) full responsibility for the content of the published article.

Conflicts of Interest

The authors declare no conflicts of interest.

References

  1. Heo, H.; Jin, Y.; Yang, D.; Wier, C.; Minard, A.; Dahotre, N.B.; Neogi, A. Manufacturing and Characterization of Hybrid Bulk Voxelated Biomaterials Printed by Digital Anatomy 3D Printing. Polymers 2021, 13, 123. [Google Scholar] [CrossRef] [PubMed]
  2. Liu, W.; Song, H.; Huang, C. Maximizing Mechanical Properties and Minimizing Support Material of PolyJet Fabricated 3D Lattice Structures. Addit. Manuf. 2020, 35, 101257. [Google Scholar] [CrossRef]
  3. “What Is PolyJetTM 3D Printing?” n.d. Available online: https://www.stratasys.com/en/stratasysdirect/resources/infographics/what-is-polyjet/ (accessed on 15 December 2024).
  4. Pugalendhi, A.; Ranganathan, R.; Chandrasekaran, M. Effect of Process Parameters on Mechanical Properties of VeroBlue Material and Their Optimal Selection in PolyJet Technology. Int. J. Adv. Manuf. Technol. 2020, 108, 1049–1059. [Google Scholar] [CrossRef]
  5. Palanisamy, C.; Raman, R.; Dhanraj, P.K. Additive Manufacturing: A Review on Mechanical Properties of Polyjet and FDM Printed Parts. Polym. Bull. 2022, 79, 7065–7116. [Google Scholar] [CrossRef]
  6. “PolyJet Materials” n.d. Available online: https://www.stratasys.com/en/materials/materials-catalog/polyjet-materials/ (accessed on 5 May 2024).
  7. Ruiz, O.G.; Reinoso, M.R.; Ingrassia, E.; Vecchio, F.; Maniero, F.; Burgio, V.; Civera, M.; Bitan, I.; Lacidogna, G.; Surace, C. Design and Mechanical Characterization Using Digital Image Correlation of Soft Tissue-Mimicking Polymers. Polymers 2022, 14, 2639. [Google Scholar] [CrossRef] [PubMed]
  8. McGarry, C.K.; Grattan, L.J.; Ivory, A.M.; Leek, F.; Liney, G.P.; Liu, Y.; Miloro, P.; Rai, R.; Robinson, A.; Shih, A.J.; et al. Tissue mimicking materials for imaging and therapy phantoms: A review. Phys. Med. Biol. 2020, 65, 23TR01. [Google Scholar] [CrossRef] [PubMed]
  9. Arslan-Yildiz, A.; El Assal, R.; Chen, P.; Guven, S.; Inci, F.; Demirci, U. Towards artificial tissue models: Past, present, and future of 3D bioprinting. Biofabrication 2016, 8, 014103. [Google Scholar] [CrossRef] [PubMed]
  10. Wang, J.; Wang, Y.; Wang, R.; Wang, Q.; Wen, M.; Sheng, L.; Zheng, Y.; Xi, T. A Review on 3D Printing Processes in Pharmaceutical Engineering and Tissue Engineering: Applications, Trends and Challenges. Adv. Mater. Technol. 2025, 10, 2400620. [Google Scholar] [CrossRef]
  11. Chen, A.; Wang, W.; Mao, Z.; He, Y.; Chen, S.; Liu, G.; Su, J.; Feng, P.; Shi, Y.; Yan, C.; et al. Multimaterial 3D and 4D Bioprinting of Heterogenous Constructs for Tissue Engineering. Adv. Mater. 2024, 36, 2307686. [Google Scholar] [CrossRef] [PubMed]
  12. Severseike, L.; Lee, V.; Brandon, T.; Bakken, C.; Bhatia, V. Polyjet 3D Printing of Tissue-Mimicking Materials: How Well Can 3D Printed Synthetic Myocardium Replicate Mechanical Properties of Organic Myocardium? bioRxiv 2019, 825794. [Google Scholar] [CrossRef]
  13. Bezek, L.B.; Chatham, C.A.; Dillard, D.A.; Williams, C.B. Mechanical properties of tissue-mimicking composites formed by material jetting additive manufacturing. J. Mech. Behav. Biomed. Mater. 2022, 125, 104938. [Google Scholar] [CrossRef] [PubMed]
  14. Lee, V.; Severseike, L.; Bakken, C.; Bermel, E.; Bhatia, V. PolyJet 3D Printing of Tissue Mimicking Materials: An Investigation of Characteristic Properties of 3D Printed Synthetic Tissue. bioRxiv 2020. [Google Scholar] [CrossRef]
  15. Kornfellner, E.; Königshofer, M.; Krainz, L.; Krause, A.; Unger, E.; Moscato, F. Measured and simulated mechanical properties of additively manufactured matrix-inclusion multimaterials fabricated by material jetting. 3D Print. Med. 2024, 10, 4. [Google Scholar] [CrossRef] [PubMed]
  16. Daneshdoost, N.; Peloquin, J.; Gall, K. Structure-performance relationships of multi-material jetting polymeric composites designed at the voxel scale: Distribution and composition effects. J. Manuf. Process. 2024, 131, 2118–2132. [Google Scholar] [CrossRef]
  17. Barclift, M.W.; Williams, C.B. Examining Variability in the Mechanical Properties of Parts Manufactured via Polyjet Direct 3D Printing; University of Texas at Austin: Austin, TX, USA, 2012. [Google Scholar]
  18. Iaizzo, P.A.; Vergen, J.A.; Ziph, J.; Lindberg, M.E. Using Planar Biaxial Testing to Characterize the Changes in Axial Load and Strain of Human, Porcine, and Ovine Fossa Ovalis Following a Transseptal Puncture, 8 November 2023, PREPRINT (Version 1). Available online: https://www.researchsquare.com/article/rs-3439222/v1 (accessed on 3 February 2025).
  19. Grytz, R.; Fazio, M.A.; Girard, M.J.; Libertiaux, V.; Bruno, L.; Gardiner, S.; Girkin, C.A.; Downs, J.C. Material properties of the posterior human sclera. J. Mech. Behav. Biomed. Mater. 2014, 29, 602–617. [Google Scholar] [CrossRef] [PubMed]
  20. Emig, R.; Zgierski-Johnston, C.M.; Timmermann, V.; Taberner, A.J.; Nash, M.P.; Kohl, P.; Peyronnet, R. Passive myocardial mechanical properties: Meaning, measurement, models. Biophys. Rev. 2021, 13, 587–610. [Google Scholar] [CrossRef] [PubMed]
  21. Singh, G.; Chanda, A. Mechanical properties of whole-body soft human tissues: A review. Biomed. Mater. 2021, 16, 062004. [Google Scholar] [CrossRef]
  22. ASTM D638-14 D20 Committee; Test Method for Tensile Properties of Plastics. ASTM International: West Conshohocken, PA, USA, 2022. [CrossRef]
Figure 1. PolyJet™ Printing Process [3].
Machines 13 00234 g001
Figure 2. (a) ASTM D638 Type IV tensile testing dogbone; (b) tensile sample dimensions (in mm); (c) 3D-printed tensile sample.
Machines 13 00234 g002
Figure 3. User interface of the DAC™ feature in GrabCAD™ print software.
Machines 13 00234 g003
Figure 4. Max Stress vs. Sample Plot (for samples with Max Stress < 1 MPa).
Machines 13 00234 g004
Figure 5. Max Stress vs. Sample Plot (for samples with Max Stress > 1 MPa).
Machines 13 00234 g005
Figure 6. Interaction plot for Max Stress.
Machines 13 00234 g006
Figure 7. Trace plot for Max Stress under perlin.
Machines 13 00234 g007
Figure 8. Trace plot for Max Stress under gyroid.
Machines 13 00234 g008
Figure 9. Trace plot for Max Stress under DM.
Machines 13 00234 g009
Figure 10. Max Strain vs. Sample Plot (for samples with Max Strain < 1%).
Machines 13 00234 g010
Figure 11. Max Strain vs. Sample Plot (for samples with Max Strain > 1%).
Machines 13 00234 g011
Figure 12. Interaction plot for Max Strain.
Machines 13 00234 g012
Figure 13. Trace plot for Max Strain under perlin.
Machines 13 00234 g013
Figure 14. Trace plot for Max Strain under gyroid.
Machines 13 00234 g014
Figure 15. Trace plot for Max Strain under DM.
Machines 13 00234 g015
Figure 16. Young’s Modulus vs. Sample Plot (for samples with Youngs Modulus < 1 MPa).
Machines 13 00234 g016
Figure 17. Young’s Modulus vs. Sample Plot (for samples with 1 MPa < Youngs Modulus < 100 MPa).
Machines 13 00234 g017
Figure 18. Young’s Modulus vs. Sample Plot (for samples with Youngs Modulus > 100 MPa).
Machines 13 00234 g018
Figure 19. Interaction plot for Young’s Modulus.
Machines 13 00234 g019
Figure 20. Trace plot for Young’s Modulus under perlin.
Machines 13 00234 g020
Figure 21. Trace plot for Young’s Modulus under gyroid.
Machines 13 00234 g021
Figure 22. Trace plot for Young’s Modulus under DM.
Machines 13 00234 g022
Table 1. Human tissue mechanical properties [12,19,20,21].
Tissue TypeMax Stress or Ultimate Tensile Strength (MPa)Max StrainYoung’s Modulus (MPa)
Sclera--37.42
Heart--0.2–0.6
Diastolic adult human myocardium--0.008–0.015
Tendons and Ligaments100–140-200–1500
Skin13.2–30-48.4–118.2
Temporal muscle0.14–0.37-0.94–2.22
Pulmonary valve1.73–3.83-14.03–18.07
Aortic valve1.45–2.03-11.5–19.18
Oesophagus1.2-0.004–0.014
Lung tissue--0.004–0.008
FO (before TSP)1.44–3.847.68 × 10−3% Strain/mm2 ± 1.49 × 10⁻³-
Ascending Aorta0.3–2.365.68 × 10−3% E/mm2 ± 4.54 × 10⁻³-
Pericardium0.9–5.56.1 × 10−3 ± 3.7 × 10⁻³% vertical strain/mm2-
Kidney--0.18
Stomach--0.006
Table 2. Factors considered in the DOE.
FactorParameterLevelClassification
1Outer layer thickness (OT)
  • 0.3 mm
  • 1 mm
Continuous
2Outer layer constituents
  • VeroWhite™
  • Agilus30Clear™
  • TissueMatrix™
  • BoneMatrix™
Mixture
3Background constituents
  • VeroWhite™
  • Agilus30Clear™
  • TissueMatrix™
  • BoneMatrix™
  • GelMatrix™
Mixture
4Background infill type (BType)
  • Gyroid
  • DM
  • Perlin
Categorical
Table 3. Runs generated for process factors.
Full Factorial DOE Between OT and BType
PtTypeBlocksOTBType
111Perlin
111Gyroid
111DM
110.3Gyroid
110.3Perlin
110.3DM
Table 4. Runs generated for outer layer mixture factors (red highlighted runs are not included in DOE).
Mixture 1 DOE for Outer Layer
PtTypeBlocksAgilus30Clear™VeroWhite™BoneMatrix™TissueMatrix™
−110.1250.1250.1250.625
111000
010.250.250.250.25
110010
−110.1250.6250.1250.125
−110.1250.1250.6250.125
−110.6250.1250.1250.125
110100
110001
Table 5. Runs generated for background mixture factors.
Mixture 2 DOE for Background
PtTypeBlocksAgilus30Clear™VeroWhite™BoneMatrix™TissueMatrix™GelMatrix™
1101000
1100010
−110.10.10.60.10.1
−110.10.10.10.60.1
1110000
1100001
−110.10.60.10.10.1
−110.10.10.10.10.6
−110.60.10.10.10.1
010.20.20.20.20.2
1100100
Table 6. Mechanical properties of a few tested samples.
FactorResponse
RunKLABCDEFGHJMax Stress (MPa)Max Strain (%)Y (MPa)
181Perlin0.1250.6250.1250.1250.10.10.60.10.12.99920.7627.025
3790.3DM0010100000.78893.323.387
Table 7. Factors classification for analysis.
ComponentNameType
Mixture 1 FactorsAAgilus30Clear™Mixture
BVeroWhite™Mixture
CBoneMatrix™Mixture
DTissueMatrix™Mixture
Mixture 2 FactorsEAgilus30Clear™Mixture
FVeroWhite™Mixture
GBoneMatrix™Mixture
HTissueMatrix™Mixture
JGelmatrix™Mixture
Process Factor 1KOTContinuous
Process Factor 2LBTypeCategoric
Table 8. Frequency of samples under specific Max Stress intervals.
Max Stress (MPa)Frequency
0.016–2.549326
2.549–5.03816
5.038–7.6173
7.617–12.686
12.68–15.223
15.22–17.755
17.75–20.283
20.28–22.825
22.82–25.356
25.35–27.882
27.88–30.429
30.42–32.954
32.95–35.4911
35.49–38.025
38.02–40.553
40.55–43.091
43.09–45.622
45.62–48.151
48.15–50.691
Table 9. Frequency of samples under specific Max Strain intervals.
Max Strain (%)Frequency
0.004–21.2185
21.21–42.4231
42.42–63.6263
63.62–84.8390
84.83–106.0467
106.04–127.2536
127.25–148.4614
148.46–169.668
169.66–190.873
190.87–212.082
212.08–233.291
233.29–254.492
254.49–275.701
275.70–296.912
296.91–318.124
318.12–360.541
360.54–381.741
381.74–424.161
Table 10. Frequency of samples under specific Young’s Modulus intervals.
Youngs Modulus (MPa)Frequency
0.011–109.01341
109.01–327.013
327.01–545.012
545.01–654.014
654.01–763.014
763.01–8723
872–9812
981–10905
1090–11993
1199–13087
1308–14179
1417–152612
1526–16356
1635–17444
1744–18533
1853–19622
1962–20711
2071–21801
Table 11. ANOVA for Max Stress (Bold terms indicate significant terms in model).
SourceSum of SquaresdfMean SquareF-Valuep-Value
Model35,833.4279453.5913.98<0.0001
Linear × Linear Mixture25,512.67191342.7741.38<0.0001
AEK33.46133.461.030.3107
AEL2.2021.100.03380.9667
AFK649.951649.9520.03<0.0001
AFL66.46233.231.020.3603
AGK1.4311.430.04410.8339
AGL21.08210.540.32490.7229
AHK10.29110.290.31700.5738
AHL1.5020.74800.02310.9772
AJK15.38115.380.47380.4917
AJL0.907420.45370.01400.9861
BEK1032.8411032.8431.83<0.0001
BEL69.66234.831.070.3430
BFK255.781255.787.880.0053
BFL159.04279.522.450.0878
BGK291.501291.508.980.0029
BGL332.412166.205.120.0064
BHK1364.9511364.9542.06<0.0001
BHL108.58254.291.670.1892
BJK222.471222.476.860.0092
BJL488.292244.147.520.0006
CEK19.28119.280.59410.4414
CEL0.486620.24330.00750.9925
CFK9.1619.160.28230.5955
CFL487.532243.767.510.0006
CGK1.4911.490.04590.8306
CGL60.66230.330.93470.3937
CHK29.09129.090.89650.3444
CHL1.4720.73510.02270.9776
CJK34.96134.961.080.3000
CJL25.01212.510.38540.6805
DEK153.391153.394.730.0304
DEL16.4328.210.25320.7765
DFK576.991576.9917.78<0.0001
DFL212.242106.123.270.0392
DGK19.03119.030.58640.4444
DGL32.90216.450.50700.6028
DHK124.481124.483.840.0510
DHL13.2126.610.20360.8159
DJK9.9919.990.30770.5795
DJL31.29215.650.48220.6179
Table 12. ANOVA for Max Strain (Bold terms indicate significant terms in model).
SourceSum of SquaresdfMean SquareF-Valuep-Value
Model1.149 × 1067914,546.8313.45<0.0001
Linear × Linear Mixture8.569 × 1051945,099.8541.71<0.0001
AEK1327.7511327.751.230.2686
AEL1.000 × 105250,018.7546.26<0.0001
AFK1108.0911108.091.020.3121
AFL3889.6121944.801.800.1671
AGK2602.5712602.572.410.1217
AGL17,884.6428942.328.270.0003
AHK2627.3712627.372.430.1200
AHL17,022.8228511.417.870.0005
AJK40,280.02140,280.0237.26<0.0001
AJL6659.1023329.553.080.0473
BEK367.751367.750.34010.5601
BEL9.0124.500.00420.9958
BFK27.59127.590.02550.8732
BFL303.752151.870.14050.8690
BGK281.531281.530.26040.6102
BGL588.762294.380.27230.7618
BHK3952.1113952.113.660.0568
BHL649.452324.730.30030.7408
BJK4855.7214855.724.490.0348
BJL869.082434.540.40190.6694
CEK48.26148.260.04460.8328
CEL891.802445.900.41240.6624
CFK80.21180.210.07420.7855
CFL1788.442894.220.82710.4382
CGK1573.0111573.011.450.2286
CGL1460.952730.470.67560.5095
CHK4.2414.240.00390.9501
CHL556.452278.230.25730.7733
CJK2354.4212354.422.180.1410
CJL1119.622559.810.51780.5963
DEK1150.9211150.921.060.3029
DEL9945.9524972.974.600.0107
DFK2321.0712321.072.150.1438
DFL239.172119.590.11060.8953
DGK2092.0512092.051.930.1652
DGL1141.772570.890.52800.5903
DHK520.731520.730.48160.4882
DHL2118.5821059.290.97970.3765
DJK390.051390.050.36080.5485
DJL770.832385.410.35650.7004
Table 13. ANOVA for Young’s Modulus (Bold terms indicate significant terms in model).
SourceSum of SquaresdfMean SquareF-Valuep-Value
Model8.048 × 107791.019 × 10614.46<0.0001
Linear × Linear Mixture5.703 × 107193.002 × 10642.62<0.0001
AEK50,940.32150,940.320.72320.3957
AEL2128.7421064.370.01510.9850
AFK8.574 × 10518.574 × 10512.170.0006
AFL68,332.01234,166.000.48510.6161
AGK487.331487.330.00690.9338
AGL50,869.56225,434.780.36110.6972
AHK11,095.02111,095.020.15750.6917
AHL1310.312655.160.00930.9907
AJK19,195.99119,195.990.27250.6020
AJL1240.752620.380.00880.9912
BEK3.712 × 10613.712 × 10652.71<0.0001
BEL3787.3721893.680.02690.9735
BFK5.621 × 10515.621 × 1057.980.0050
BFL1.958 × 105297,913.481.390.2505
BGK4.177 × 10514.177 × 1055.930.0154
BGL4.592 × 10522.296 × 1053.260.0396
BHK3.468 × 10613.468 × 10649.24<0.0001
BHL2606.1721303.080.01850.9817
BJK8.611 × 10518.611 × 10512.230.0005
BJL1.262 × 10626.311 × 1058.960.0002
CEK14,498.51114,498.510.20580.6503
CEL2458.6521229.320.01750.9827
CFK460.341460.340.00650.9356
CFL9.828 × 10524.914 × 1056.980.0011
CGK23,307.62123,307.620.33090.5655
CGL1.356 × 105267,801.380.96260.3830
CHK25,075.16125,075.160.35600.5511
CHL5263.0822631.540.03740.9633
CJK57,932.89157,932.890.82250.3651
CJL69,541.97234,770.990.49370.6108
DEK5.672 × 10515.672 × 1058.050.0048
DEL584.542292.270.00410.9959
DFK1.162 × 10611.162 × 10616.50<0.0001
DFL1.393 × 105269,650.170.98880.3731
DGK16,115.16116,115.160.22880.6327
DGL26,980.18213,490.090.19150.8258
DHK3.617 × 10513.617 × 1055.140.0241
DHL3823.0921911.540.02710.9732
DJK79,628.04179,628.041.130.2884
DJL1.071 × 105253,574.130.76060.4682
Table 14. Liver tissue mechanical properties.
Liver Tissue
Lower Specification Limit (LSL)Upper Specification Limit (USL)
Max Stress (MPa)0.0110.2
Max Strain (mm/mm)200400
Young’s Modulus (MPa)0.0100.05
Table 15. Recommended parameter settings to 3D print liver tissue.
FactorValue
A: Agilus30Clear™89.5%
B: VeroWhite™1%
C: BoneMatrix™6.7%
D: TissueMatrix™2.8%
E: Agilus30Clear™4.7%
F: VeroWhite™7.6%
G: BoneMatrix™8.5%
H: TissueMatrix™10.3%
J: GelMatrix™68.9%
K: OT0.97 mm
L: BTypeDM
Table 16. Tendon Tissue mechanical properties.
Tendon Tissue
LSLUSL
Max Stress (MPa)100140
Max Strain (mm/mm)0.10.5
Young’s Modulus (MPa)10001500
Table 17. Recommended parameter settings to 3D print tendon tissue.
FactorValue
A: Agilus30Clear™23.4%
B: VeroWhite™40.5%
C: BoneMatrix™28%
D: TissueMatrix™8.1%
E: Agilus30Clear™0.1%
F: VeroWhite™92.4%
G: BoneMatrix™5%
H: TissueMatrix™0.05%
J: GelMatrix™2.45%
K: OT0.44 mm
L: BTypePerlin
Disclaimer/Publisher’s Note: The statements, opinions and data contained in all publications are solely those of the individual author(s) and contributor(s) and not of MDPI and/or the editor(s). MDPI and/or the editor(s) disclaim responsibility for any injury to people or property resulting from any ideas, methods, instructions or products referred to in the content.

