1. Introduction
Nowadays, motorcycles are no longer solely transportation systems. The riding experience and a sense of freedom have become decisive factors in making motorcycles a hobby [
1]. Therefore, for motorcycle manufacturers, the capability to continuously develop motorcycles with higher performance is becoming crucial.
As highly human–machine coupled systems, handling and stability are naturally important indicators for evaluating motorcycles’ comprehensive performance. However, for motorcycles, it is difficult to quantify handling and stability numerically.
Most research on motorcycles mainly focuses on developing and testing operations, and then correlates experimental results with simulation results [
2,
3,
4,
5].
Lane change (LC), as a typical transient maneuver, has been applied in the study of the handling and stability of motorcycles. The Koch index was first proposed by Koch to describe the handling performance of motorcycles at a curved entrance [
6]. The handling performance of motorcycles was quantified based on the relationship between the motorcycle–rider system’s input (steering torque) and the motorcycle’s response (rolling rate) with normalized speed. Later, Vittore Cossalter focused on the lane change test for motorcycles and developed a new indicator, the ‘LC roll index’. As an optimization of the Koch index, this indicator used peak-to-peak instead of peak, providing a more comprehensive description of the behavior at the LC entrance [
7]. Based on the analysis of a large amount of lane change operation data, Horst Ecker characterized a motorcycle’s roll angle as an indicator “Intensity” ranging from 0 to 10 to appropriately represent the intensity of the operations of a rider performing lane changes [
8].
The steady-state turning test was determined to be an effective and quantitative method for evaluating the low-frequency and non-transient handling characteristics of two-wheeled vehicles. The handling sensation of a rider was related to the steering torque required to follow a given forward speed and path. Based on this perspective, the roll index and acceleration index were proposed to quantify the handling performance of motorcycles in a steady-state turning maneuver [
9]. John W. Zellner analyzed experimental data at different speeds and radii and indicated that a primary purpose of steady-state turning was to measure the corresponding vehicle control gains—ratios of output motion quantities to rider control inputs [
10]. Vittore Cossalter believed that the steering ratio was a good indicator for effectively evaluating the handling and stability of motorcycles, and then analyzed and experimentally verified the mathematical steering models of different types of motorcycles. Vittore Cossalter indicated that in a steady-state turning maneuver, when steering torque was low and a motorcycle appeared to have appropriate oversteer characteristics, the rider would feel a good sense of handling [
11]. Recently, a new evaluation index, the ‘stability factor ’was proposed by Masayuki Miki to better evaluate and understand the line-tracking performance of motorcycles by examining the relationship between dynamic characteristics and motorcycle tires under different turning radii [
12].
The slalom test includes both steady-state and transient characteristics, and is widely used in the study of the handling and stability of motorcycles. The slalom test is considered an effective way to evaluate the handling and stability performance of motorcycles, which has been confirmed by the following studies.
Aoki indicated that the slalom response method was suitable for studying the dynamic characteristics of motorcycles and can provide dynamic information about motorcycles under curved driving conditions. In the slalom response of heavy motorcycles, the rider’s lean angle has a relatively small impact on the system output, while steering torque is the main input force [
13]. However, the performance of light motorcycles has been neglected.
Vittore Cossalter observed the transfer functions of a typical sports motorcycle during slalom tests, and then the formation of steering torque was analyzed to interpret the ‘maximum gain’ for the torque-to-roll transfer function that drivers rated as ‘good handling’ [
14].
The Mozzi axis theory has been proven useful in highlighting the effects of variations in path, like vehicle properties and riding style [
15]. However, the actual motion of motorcycles is nonlinear and influenced by various dynamic factors, such as tire forces, aerodynamic forces, and gyroscopic effects. These factors may make the calculation and interpretation of the Mozzi axis more complex.
Kishi first connected weave modes with slalom testing. By analyzing the low-speed weave mode with forward speed, pylon interval, and slalom width, it was found that the slalom frequency is equivalent to the frequency of the weave mode in the low-speed range [
16].
As a human–machine coupled system, the subjective evaluation of the handling and stability of a motorcycle is crucial; however, few studies have connected the dynamic parameters or objective indicators of motorcycles with the subjective evaluation of riders.
Barath Mohan conducted objective testing and subjective evaluation analysis on the dynamic parameters of motorcycles equipped with three different sets of tires to determine the correlation between the characteristics for evaluating tire performance and subjective perception, and then proposed a testing and analysis technique for quantifying the performance of tires [
17]. However, that research focused on evaluating and understanding motorcycle tire performance rather than overall vehicle performance.
The objective of this study was to develop a strict procedure for slalom tests and an analysis index that can be used to evaluate the handling and stability performance of all types of motorcycles. In this study, multiple motorcycles were used for comparative research between experiments and simulations. By comparing different motorcycles, we proposed the limitation of using the ‘optimal speed point’ to evaluate the handling and stability of motorcycles. For the slalom test, the riding styles of different riders and the repeatability of a single rider, as well as the limitations of using the roll angle and the steering torque phase as evaluation indicators for light motorcycles, were studied. Based on the experimental results, a new objective evaluation index was proposed and correlated with the subjective perceptions of expert riders.
The remainder of this paper is organized as follows.
Section 2 discusses a simulation conducted to discover the limitations of assessing the handling and stability of motorcycles via the ‘optimal speed point’ under slalom conditions.
Section 3 describes the experimental tests carried out, and an objective evaluation index is proposed based on the analysis of the experimental process.
Section 4 presents a subjective evaluation based on a FAHP that was applied to verify the effectiveness of the objective evaluation method mentioned above, with conclusions finally given in
Section 5.
2. Simulation Model
Weave mode is an important vibration mode that reflects the stability of motorcycles; furthermore, the vibration may contribute to handling performance in slalom running. Research has indicated that under a certain pylon interval, the vibration frequency of the zero point of the eigenvalue’s real part is highly consistent with the frequency of the corresponding slalom running at low speed [
18], at which point the vibration remains without attenuation. Vittore Cossalter also described this speed point and indicated that the rider was able to obtain a greater vehicle roll response at a unit effort at this speed point, for which there was optimal subjective feedback from the rider [
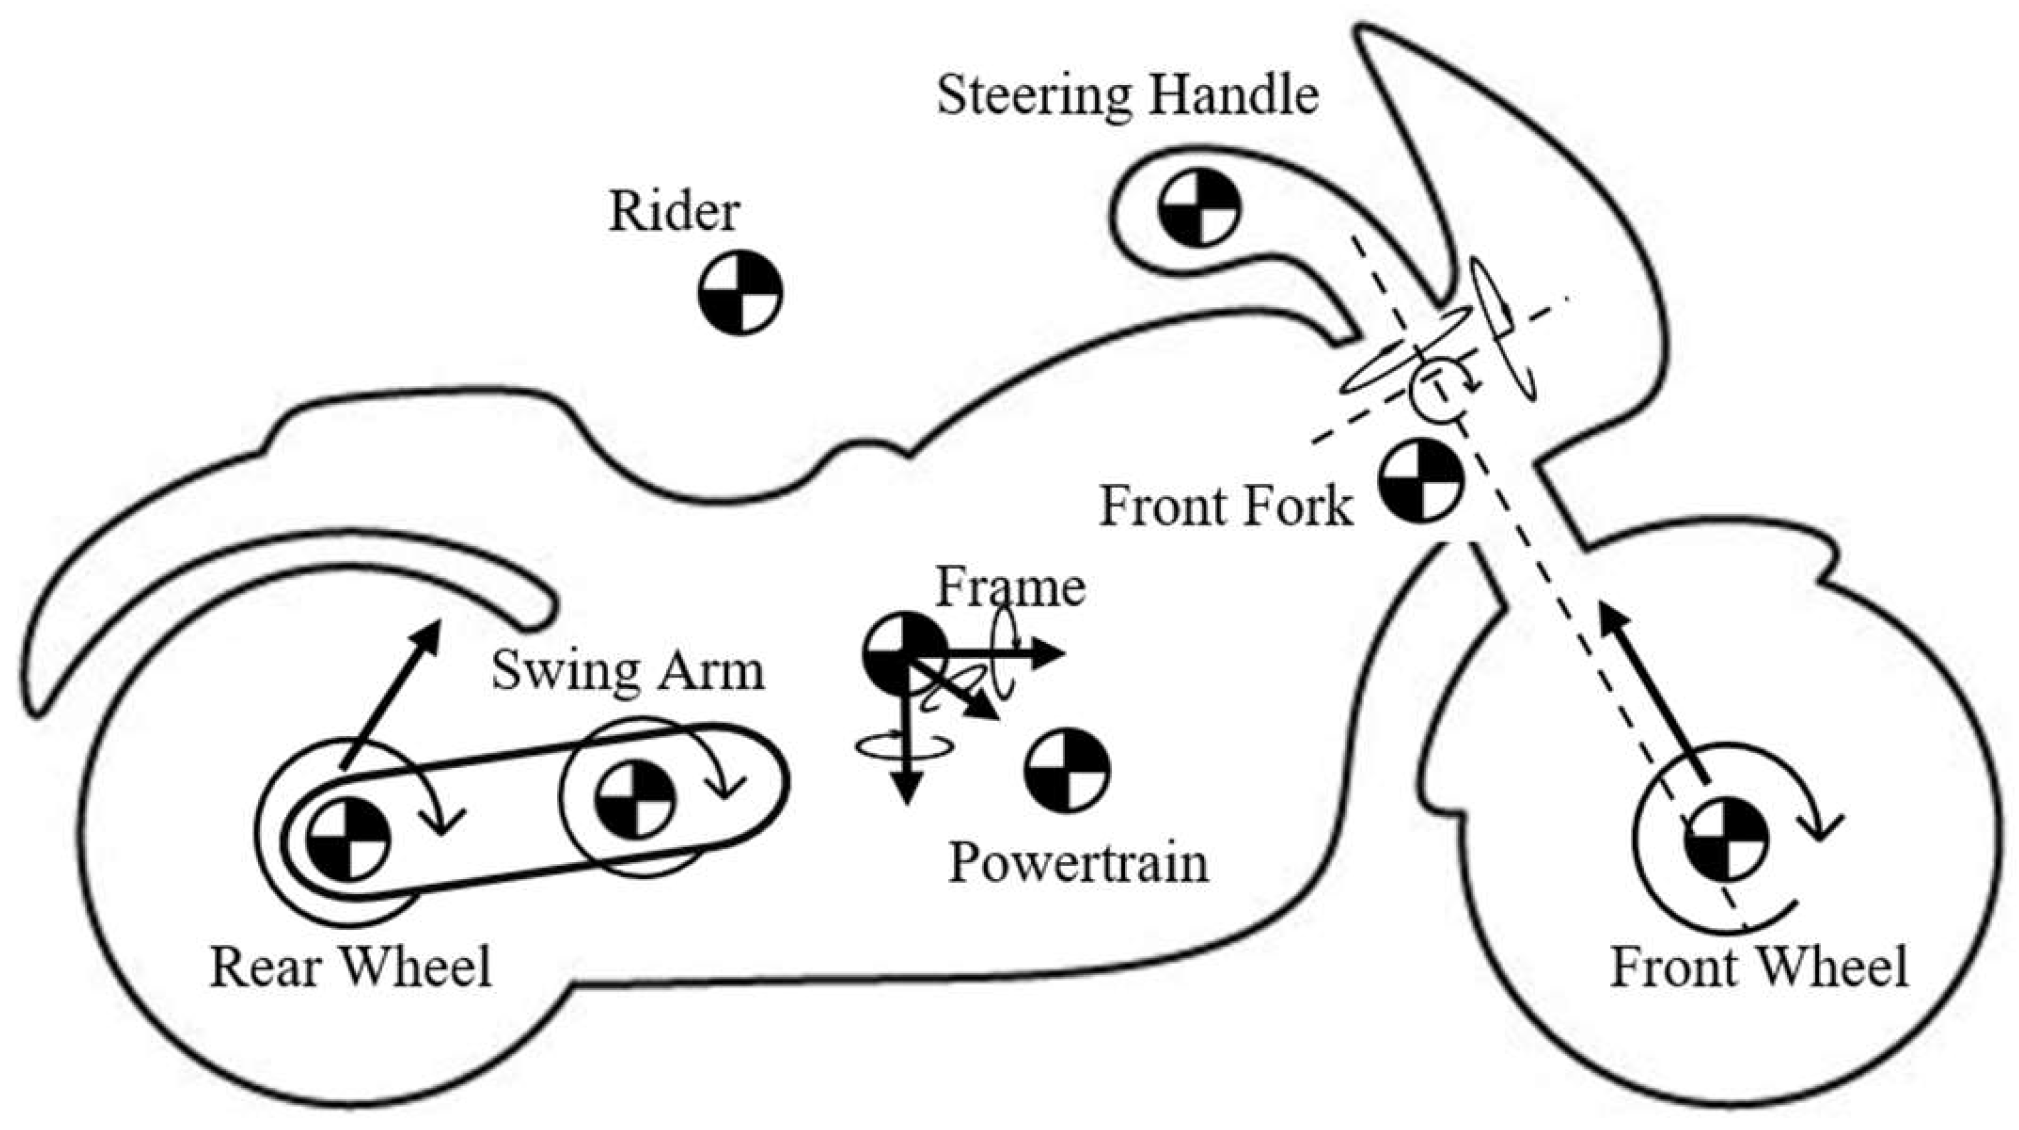
14]. Therefore, a multibody model was built for motorcycle vibration mode simulation, as shown in
Figure 1. For simulations, the multibody simulation software MotionView2020 was used.
The model contains eight lumped masses (the rider, frame, powertrain, steering handle, front fork, swing arm, front wheel, and rear wheel) in which the rider and powertrain are rigidly connected to the frame.
In addition, the model has sixteen degrees of freedom (DOF), including
Six DOF related to the frame’s rigid body motion;
Front wheel and rear wheel spin;
Front wheel suspension and rear wheel suspension travel;
Steering handle rotation;
Front fork bend;
Front fork twist;
Frame bend;
Frame twist;
Swing arm rotation.
The MF-Tire model was used to describe tire forces and tire motion [
19].
A lumped stiffness method was applied to characterize the compliance of the frame and front fork, which strongly affect the weave mode [
20].
Simulations were conducted with two types of pylon interval patterns (10 m and 15 m). Simulation conditions were consistent with experimental conditions noted in
Section 3.
Four motorcycles (an electric scooter, a 150 cc scooter, a 250 cc cruiser, and a 600 cc touring bike) were modelled for simulation under the above conditions. Motorcycle details are shown in
Table 1.
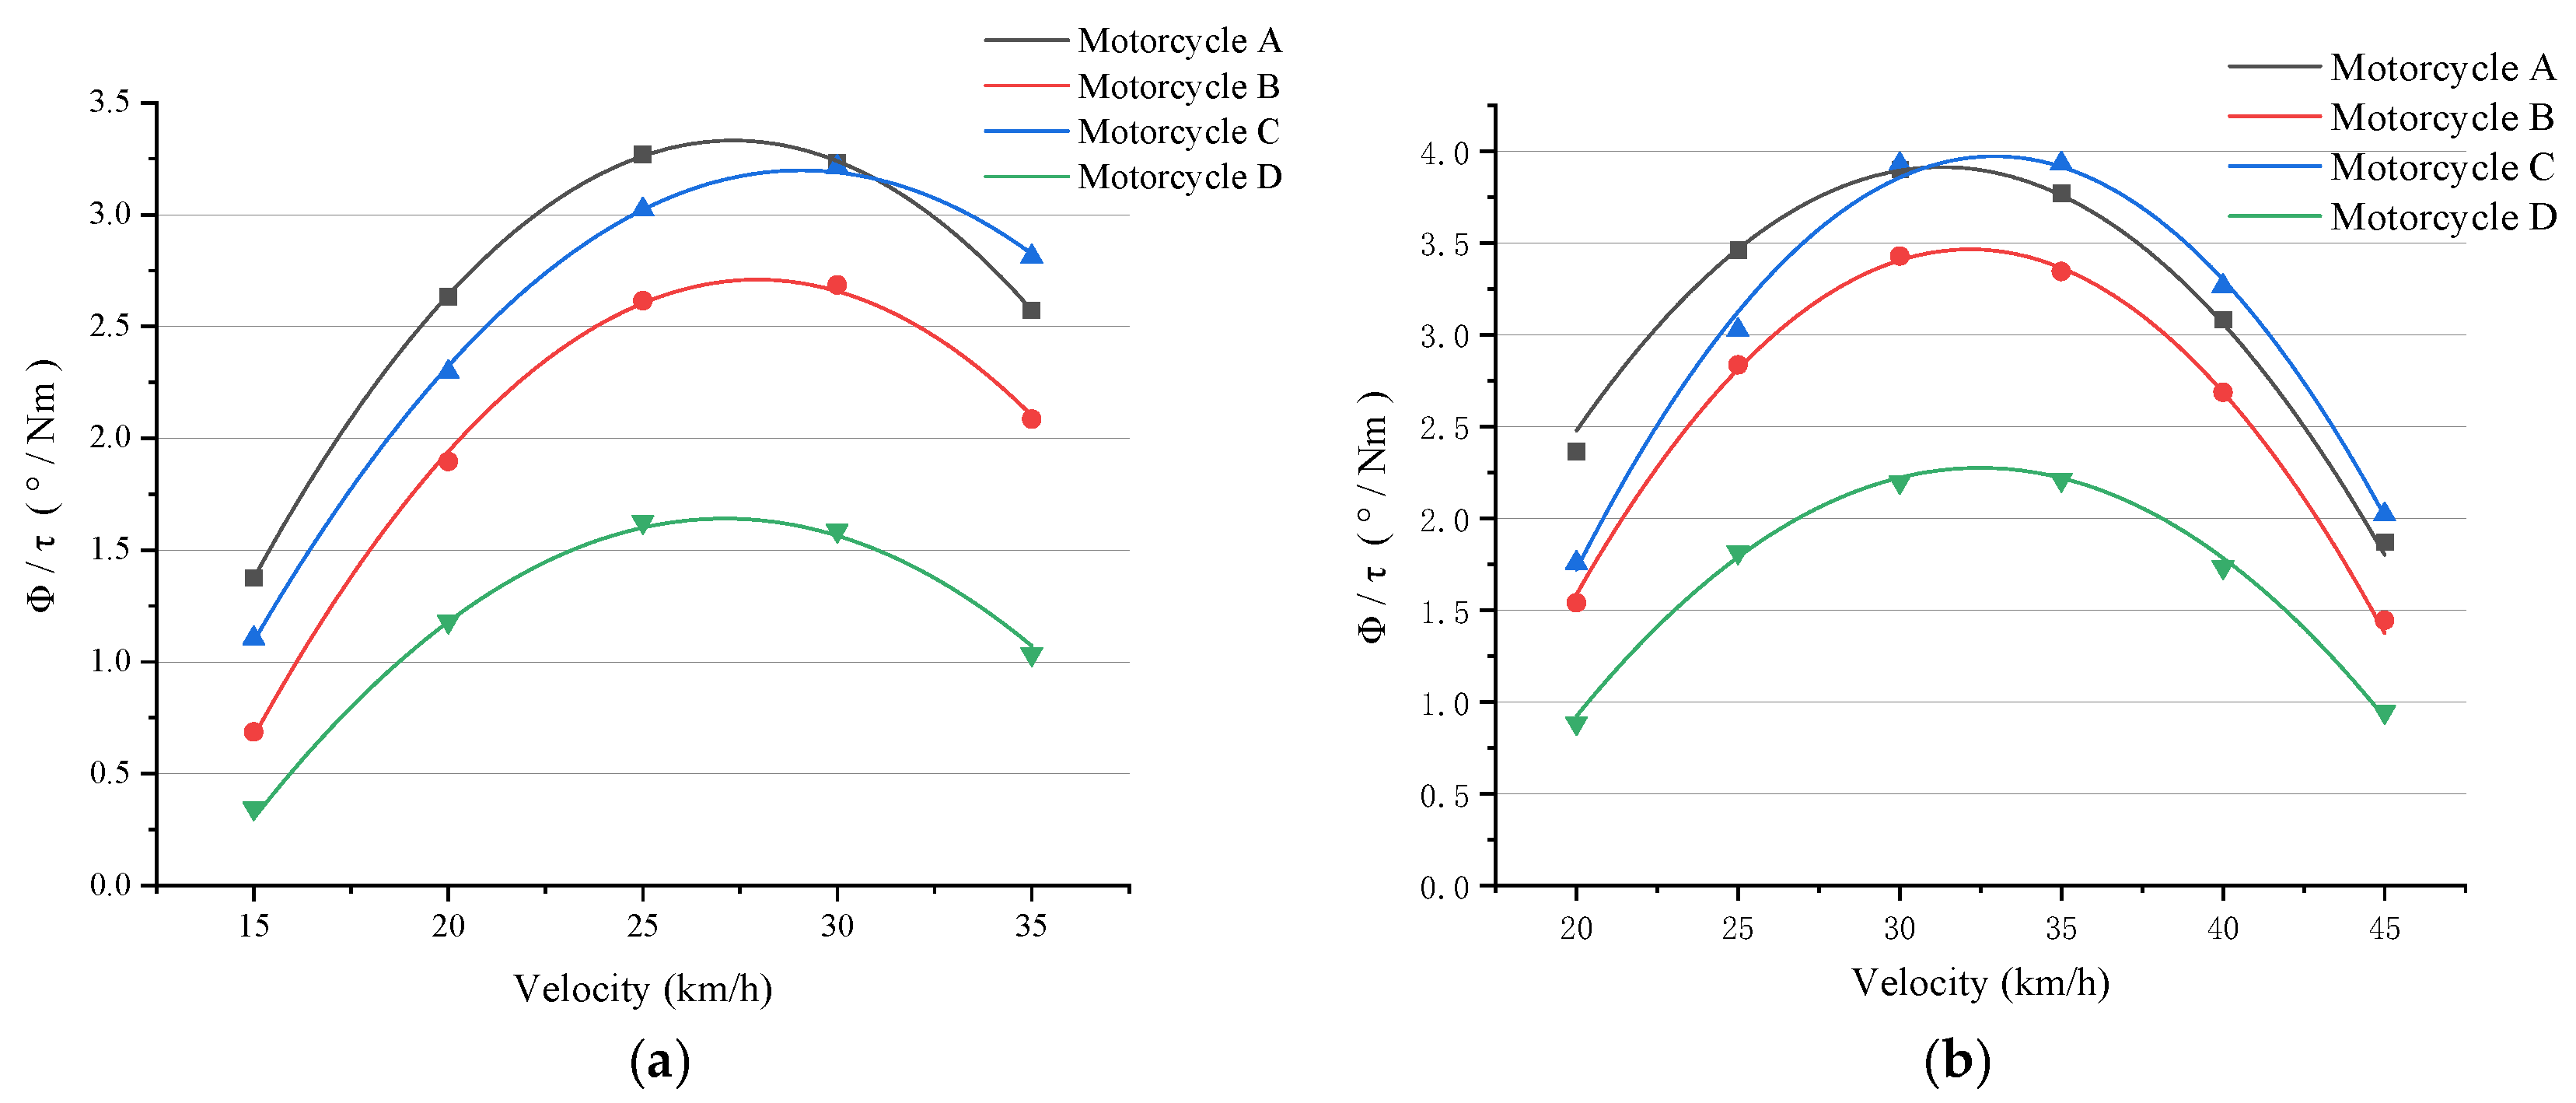
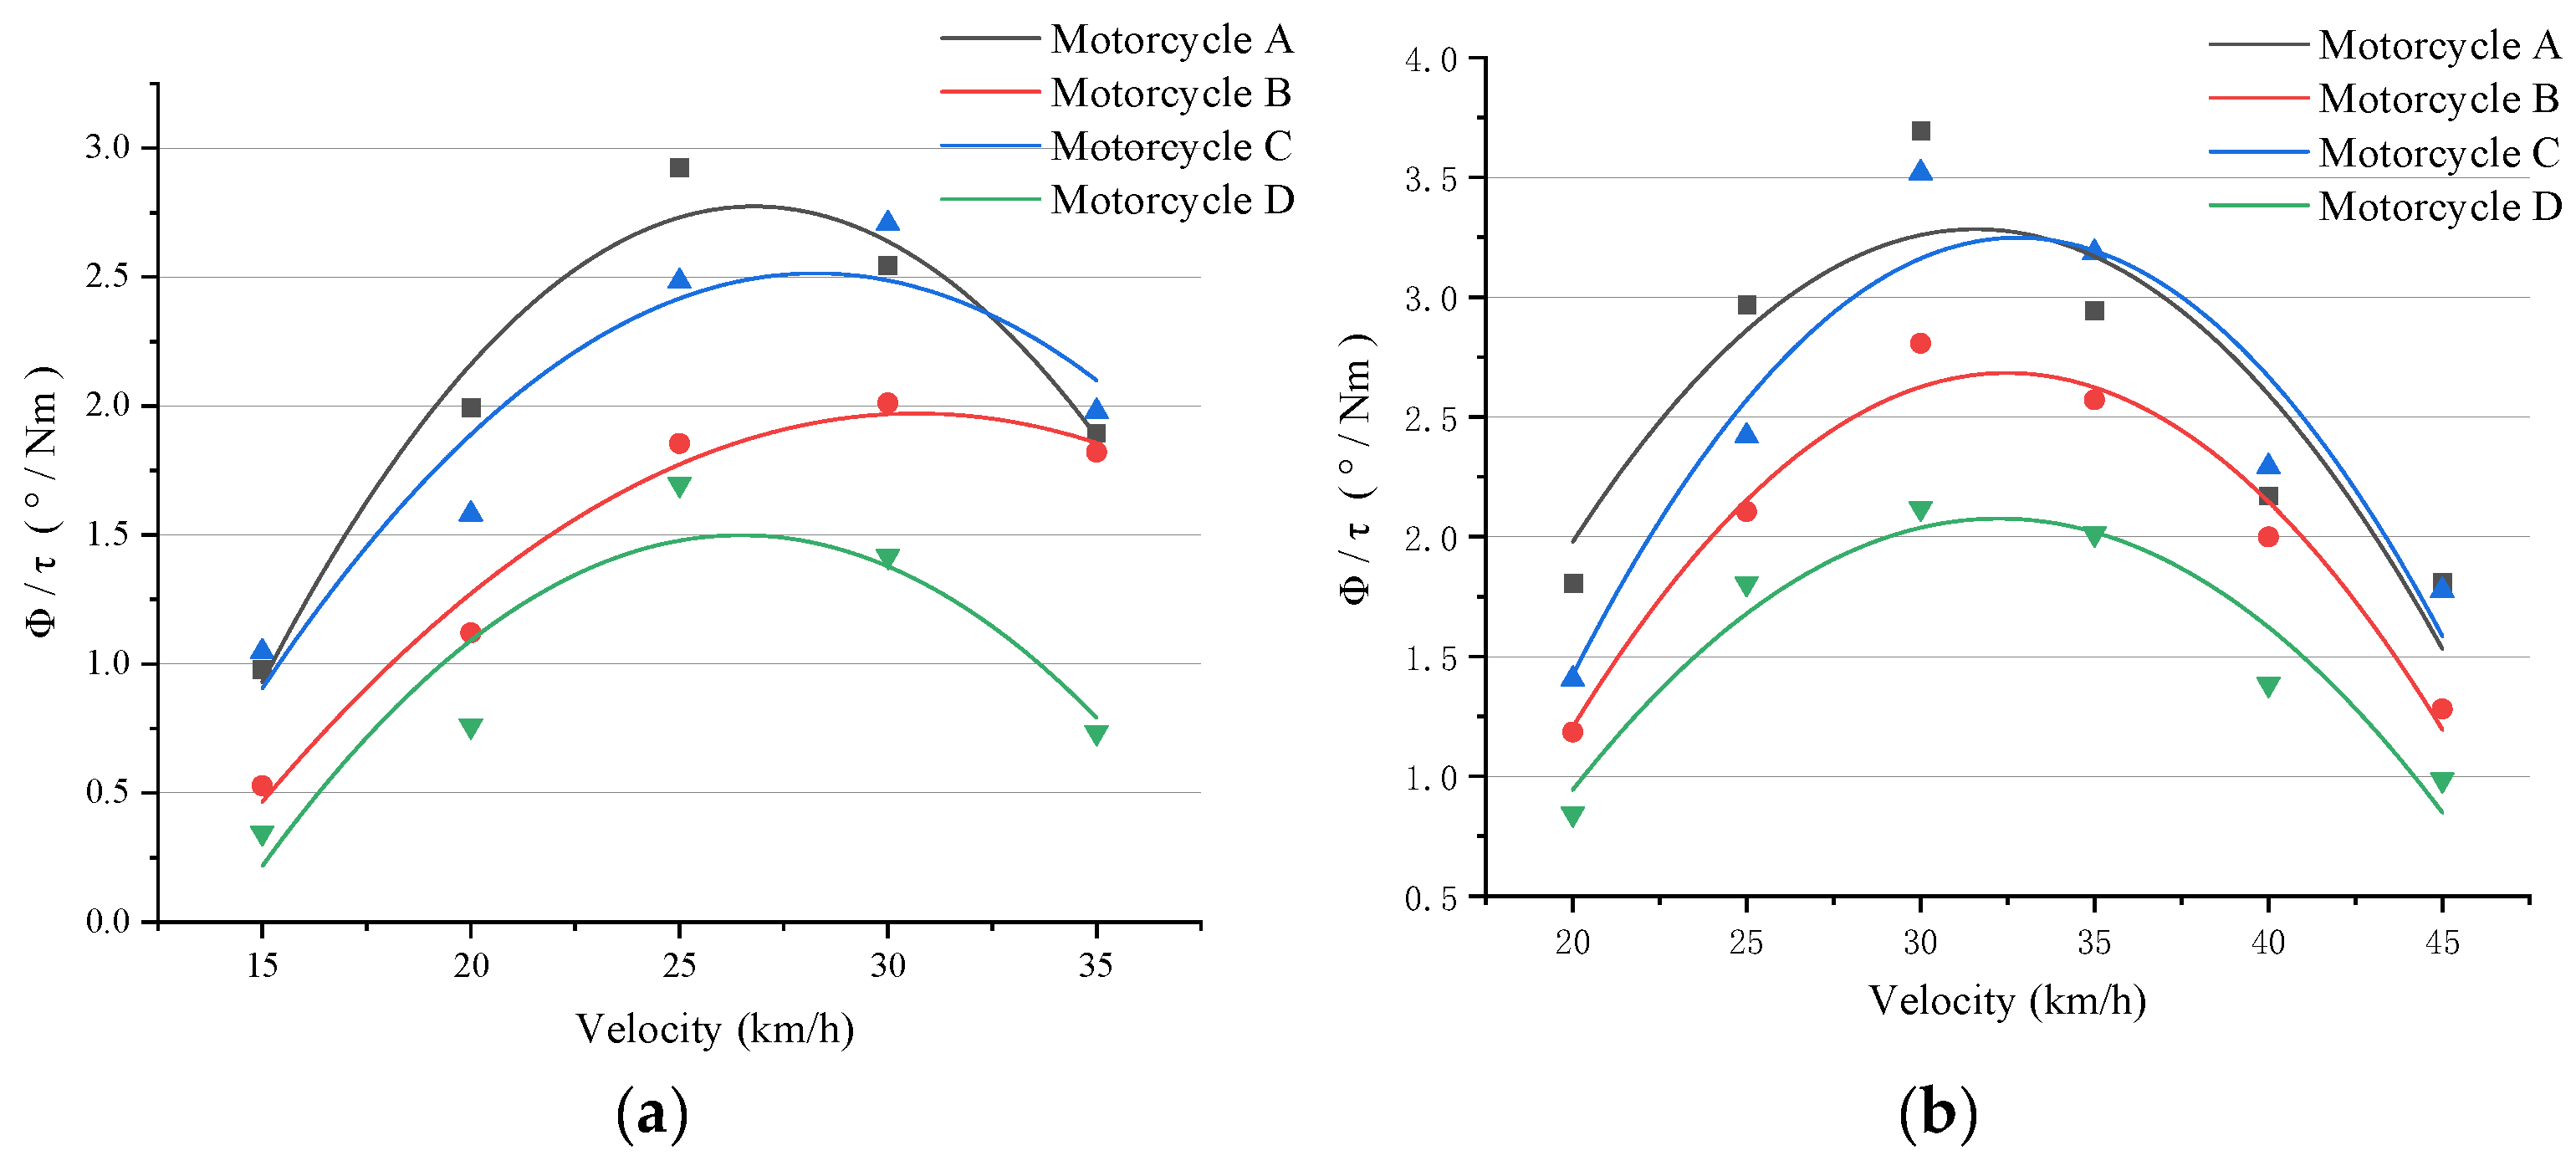
Figure 2 indicates the ratio between the roll angle amplitude and the steering torque amplitude at various velocities calculated under the above conditions.
For different vehicles, the ‘optimal speed point’ exists, but corresponds to different vehicle speeds. Due to their different dimensions, structures, mass distributions, flexibility, and tires, motorcycles exhibit different weave mode frequencies. Therefore, it is irrational to evaluate a vehicle’s handling performance by comparing the amplitude of the optimal point.
Therefore, it is crucial to develop an evaluation method to assess the riding performance of different motorcycles.
3. Experiments
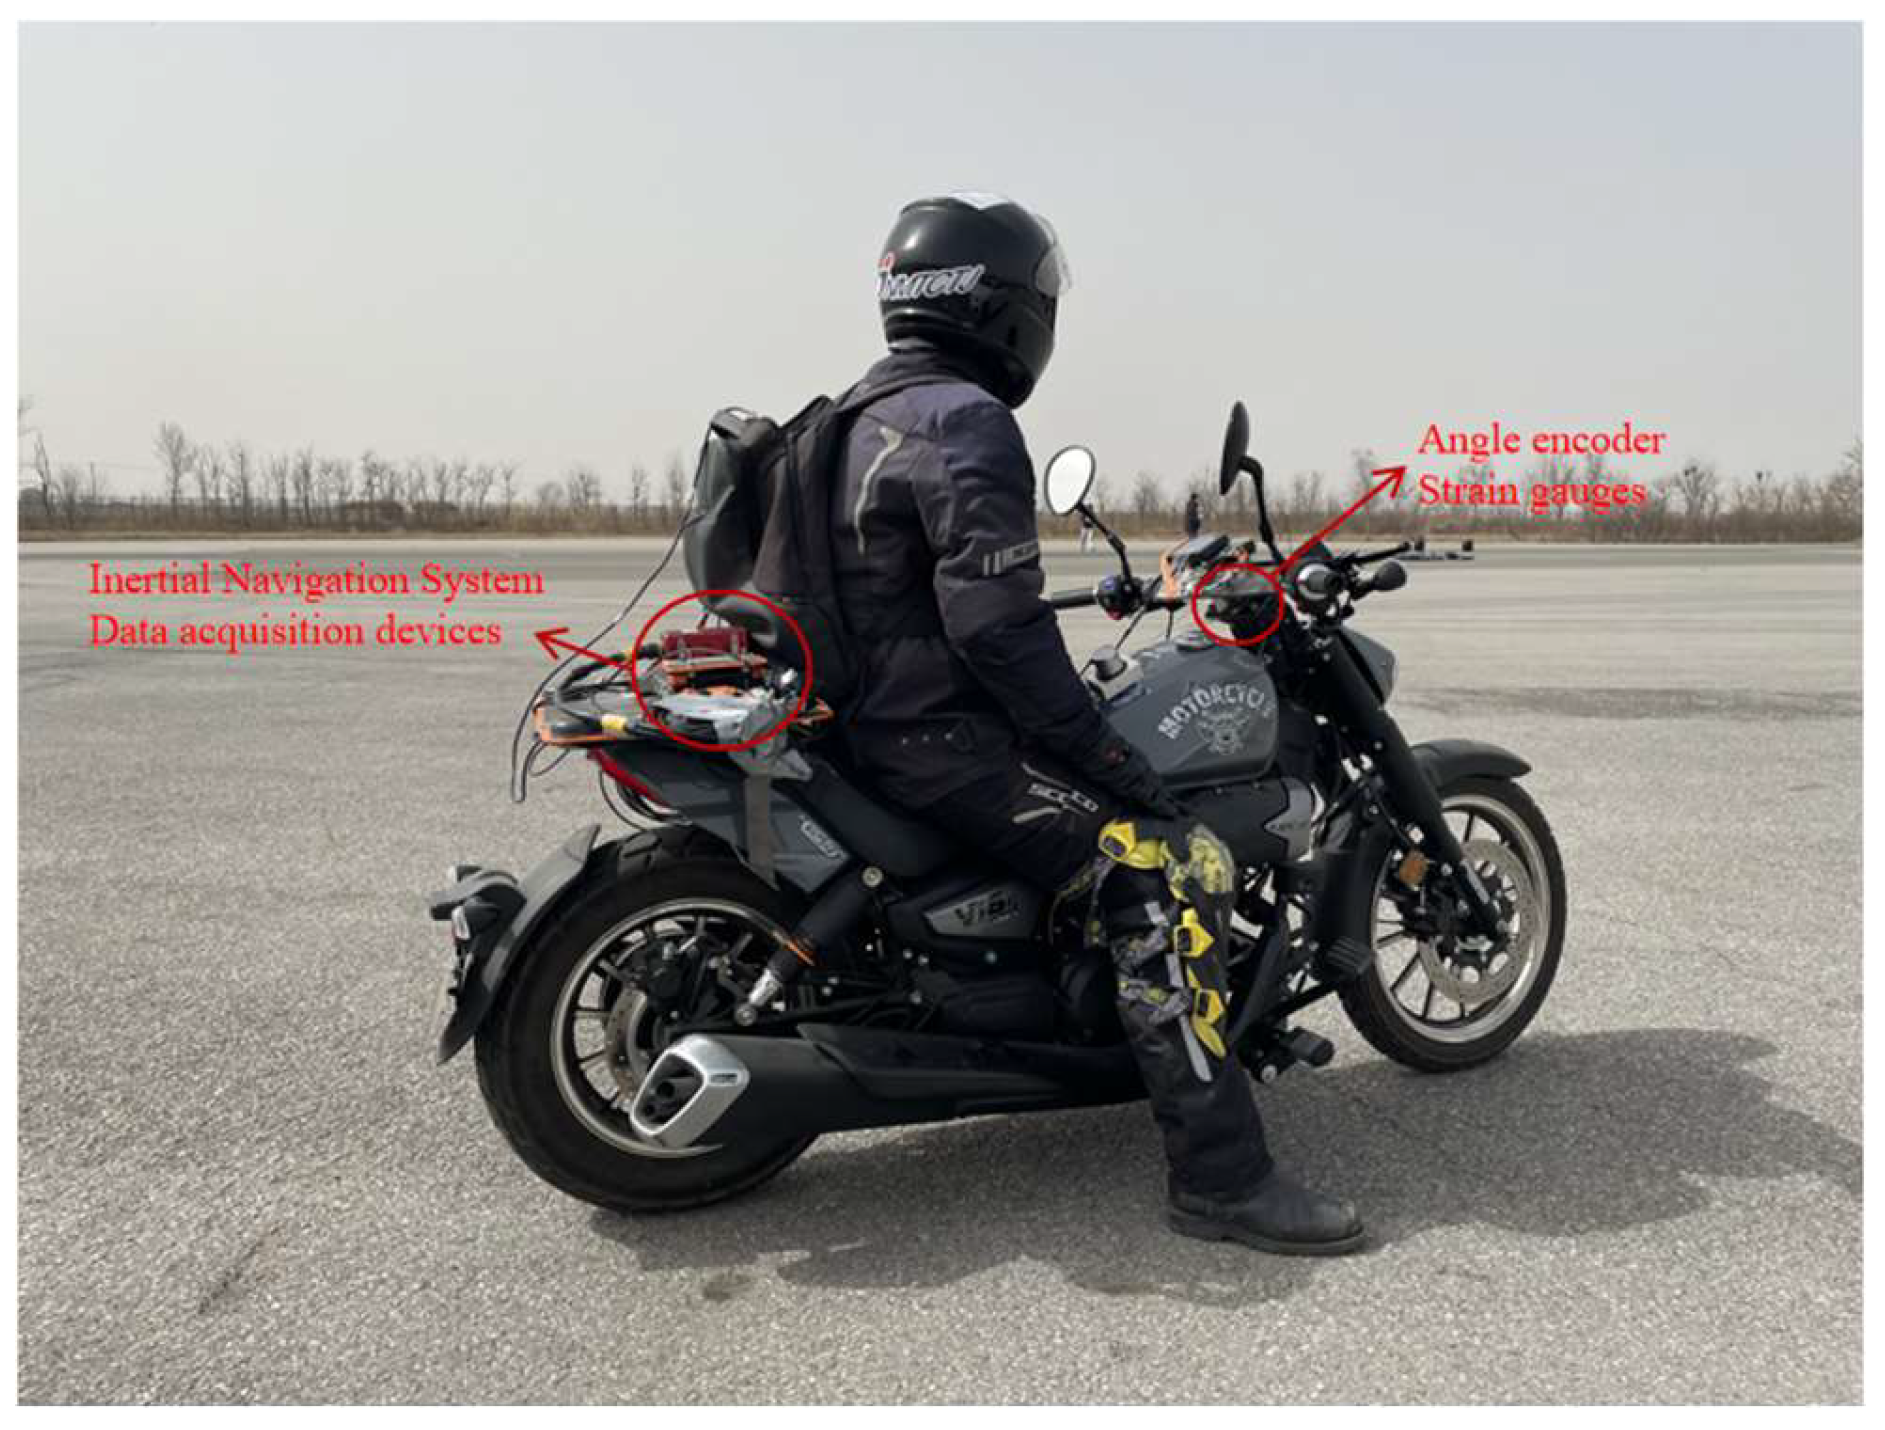
Four motorcycles (an electric scooter, a 150 cc scooter, a 250 cc cruiser, and a 600 cc touring bike) equipped with instrumentation were used for the experiments.
Figure 3 shows an example of an instrumented 250 cc cruiser.
For our study, three skilled riders were selected to reduce variability in the results from differences in interpreting the scoring rules or lack of experience. Rider details are shown in
Table 2.
In this experiment, a comprehensive set of dynamic parameters were measured, including forward speed, steering torque, steering angle, motion of the motorcycle, and relative transducers, as listed in
Table 3.
To accurately measure steering torque and steering angle, a specially designed sensor was utilized that was able to maintain the original motorcycle’s human–machine triangle while conducting accurate measurements.
Each vehicle’s speed and motion were obtained through an OXTS inertial navigation system.
In order to accurately reflect the motion of the whole motorcycle, the center of gravity (CoG) position was measured, allowing the inertial navigation system to be installed at the appropriate position.
To maintain the temporal synchronization of all parameters, Dewesoft data acquisition devices were employed to capture signals from the sensors and the inertial navigation system, operating at a sampling rate of 100 Hz.
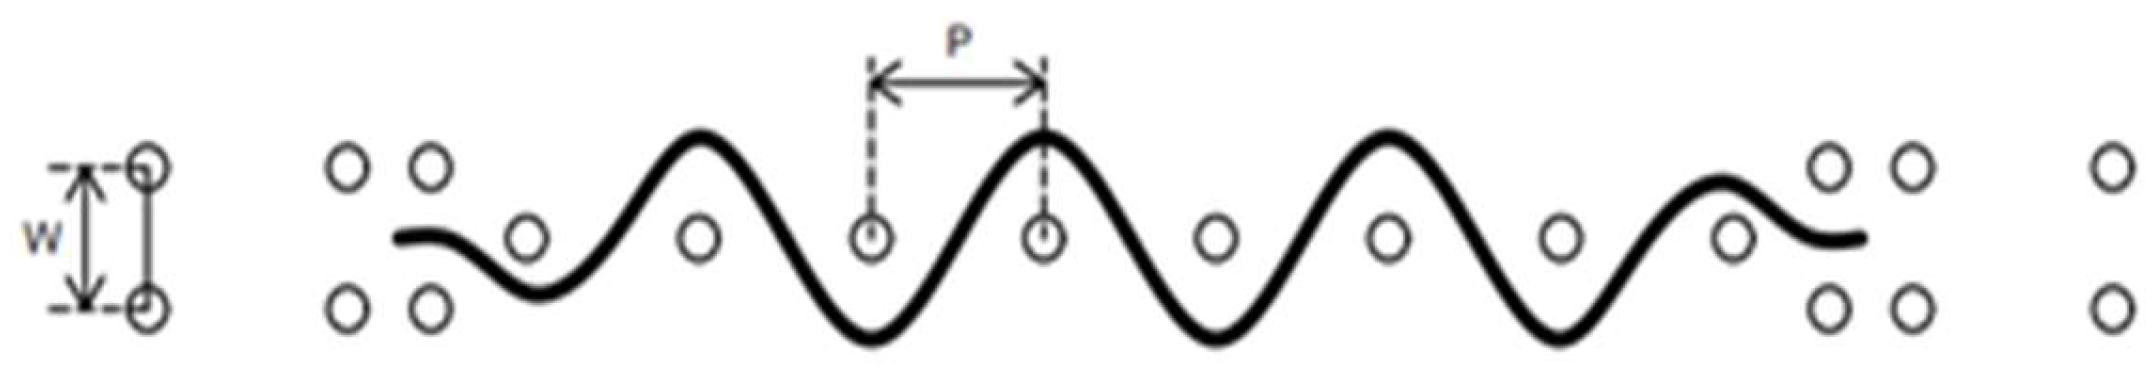
Slalom running tests were as shown in
Figure 4.
The maximum roll angle of a motorcycle is constrained by the stand or exhaust pipe. Experiments should cover conditions of all motorcycles. Based on sufficient consideration of the above factors, forward speed V and the pylon interval P were set as in
Table 4.
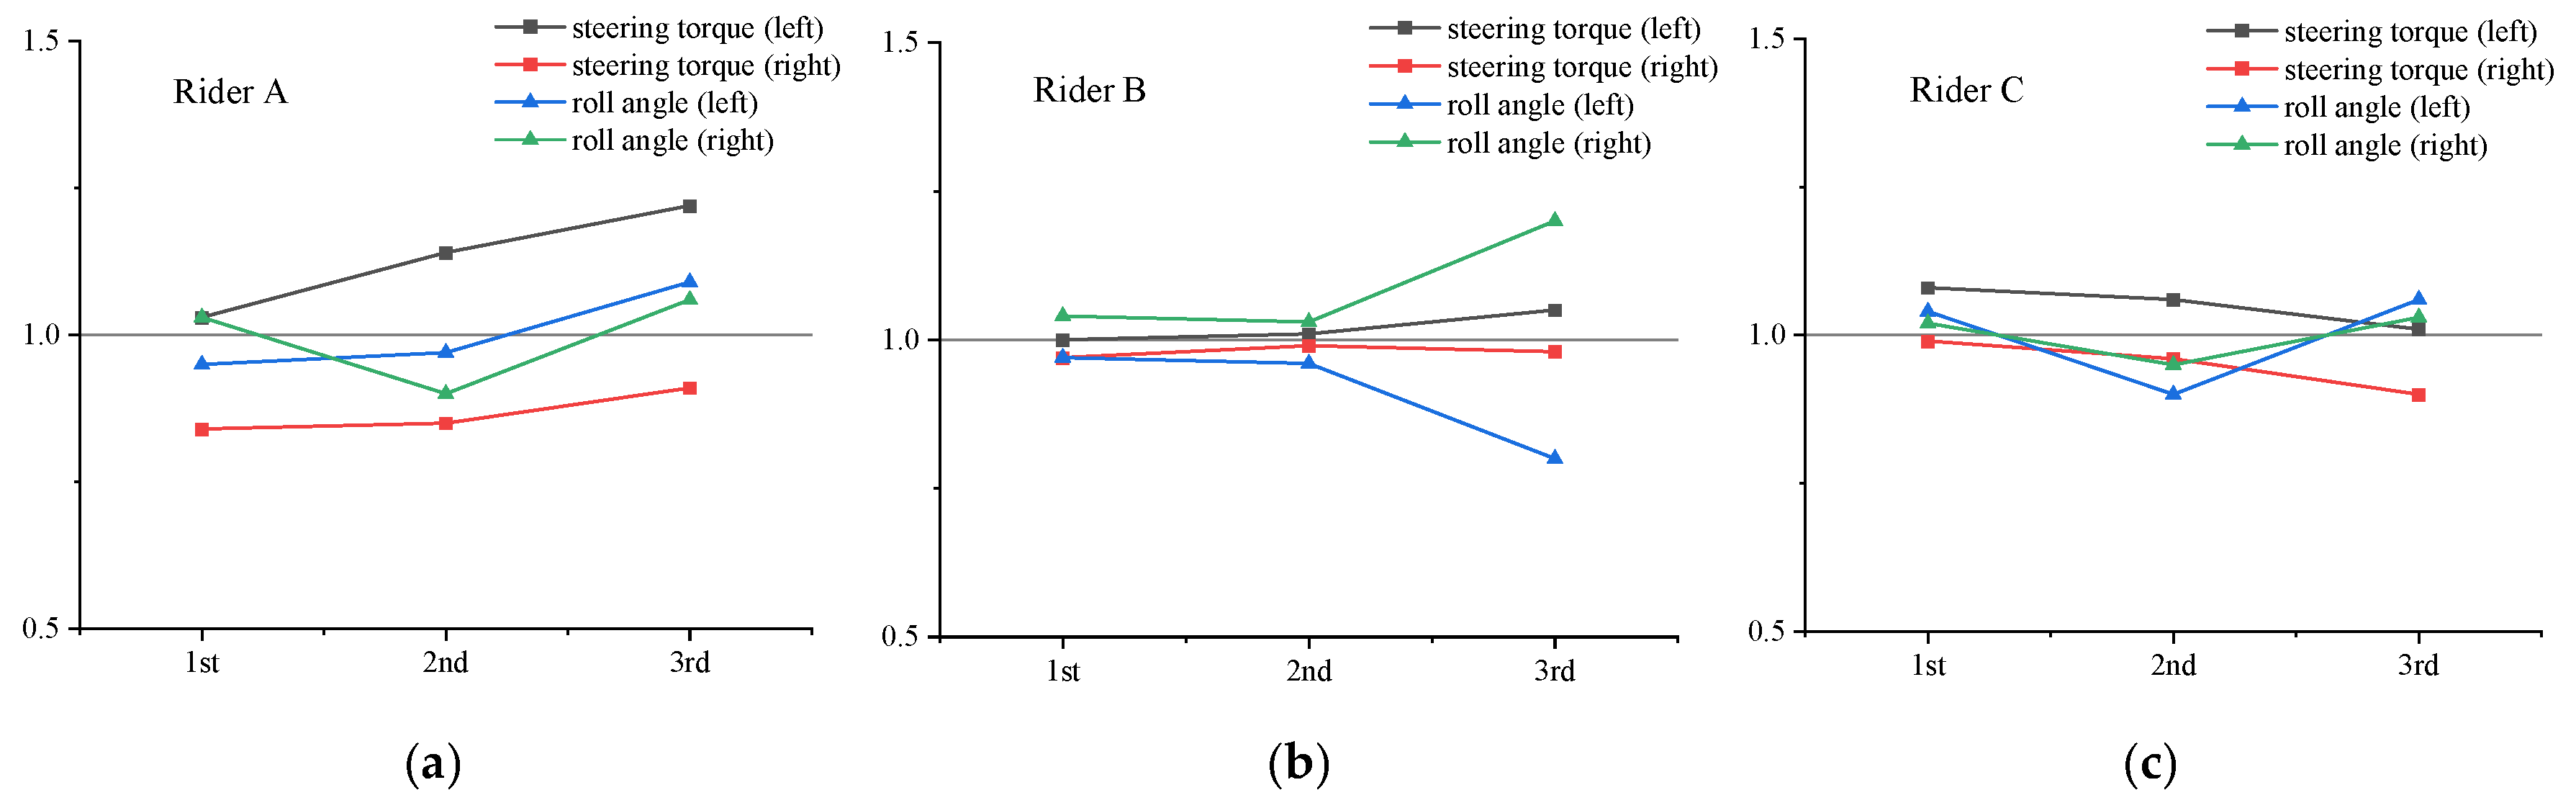
This experiment fully considered human influence factors. Three riders were asked to conduct slalom tests to the left and right three times each. Normalized results for steering torque and roll angle for different riders are shown in
Figure 5, and the specific values are listed in
Table 5, in which stl stands for steering torque (left), etc.
We normalized data for each left and right slalom running of Riders A, B, and C in the first, second, and third tests. It can be observed that these three riders showed different results for left and right slalom running due to their different riding styles. And results of these three riders in the first, second, and third tests exhibited varying extents of repeatability.
Therefore, it is necessary to consider the rider factor when evaluating the handling stability of a motorcycle.
Figure 6 shows experimental data for four motorcycles. It can be observed that there was a trend similar to that of the simulation’s data, but there was a certain gap in amplitude and phase.
One specific reason for this is partly that the closed-loop control logic in the simulation was for the rider to track trajectories that were not the same as those of the experiments. Other causes may include the temperature of the tires, a crosswind, or the expression of the frame and front fork’s flexibility.
Some scholars believe that when the mass ratio of a rider to a motorcycle is relatively small, the degree of contribution of the motion of the rider’s upper body as an input is small [
13]. To confirm if this applies to light motorcycles, an extra rider lean angle signal was measured with motorcycle A to determine the coherence between the input of the rider’s upper body and the response of the motorcycle.
In the frequency domain, this coherence is defined as [
21]:
where
denotes the frequency and
represents the coherence function between
and
at the frequency
k. The term
refers to the cross-power spectral density, indicating the mutual variations of
and
at frequency
k;
, and
, on the other hand, denote the auto-power spectral densities of
and
, respectively.
Figure 7 illustrates the coherence of the roll angle with steering torque and the rider lean angle under a maneuver at 45 km/h and a 15 m pylon interval. It appears there was high coherence in the low frequency range around the basic frequency of 0.42 Hz for both inputs, while the steering torque had a higher value.
It can be concluded that steering torque is the main input of the motorcycle–rider system, while the motion of the rider’s upper body as an input is nonnegligible for light motorcycles. Therefore, the phase of the roll angle and steering torque is not a definitive indicator for evaluating the differences in handling and stability between different motorcycles, because the rider’s physical input increased uncertainty factors.
An evaluation method based on the roll angle and steering torque ratio under the slalom test has been proposed for assessing the handling and stability performance of different motorcycles.
Combined with slalom tests with pylon intervals of 10 m and 15 m, we then considered the driving styles of different riders and repetitions with the same rider; the expression of indicators is proposed as follows:
where
f(
x) and
g(
x) represent the fitted quadratic function based on data points of the ratio between roll angle amplitude and steering torque amplitude.
Data points used for fitting in functions
f(
x) and
g(
x) are calculated as follows:
where
l represents the number of riders,
m represents the number of times the experiment is repeated, and
n represents the number of effective cycles, which is defined as independent cycles from the first pylon to the last pylon based on the steering torque signal.
4. Objective Evaluation Method
Studies have indicated that feedback from riders was majorly focused on tire grip and the maneuverability and stability of motorcycles [
17].
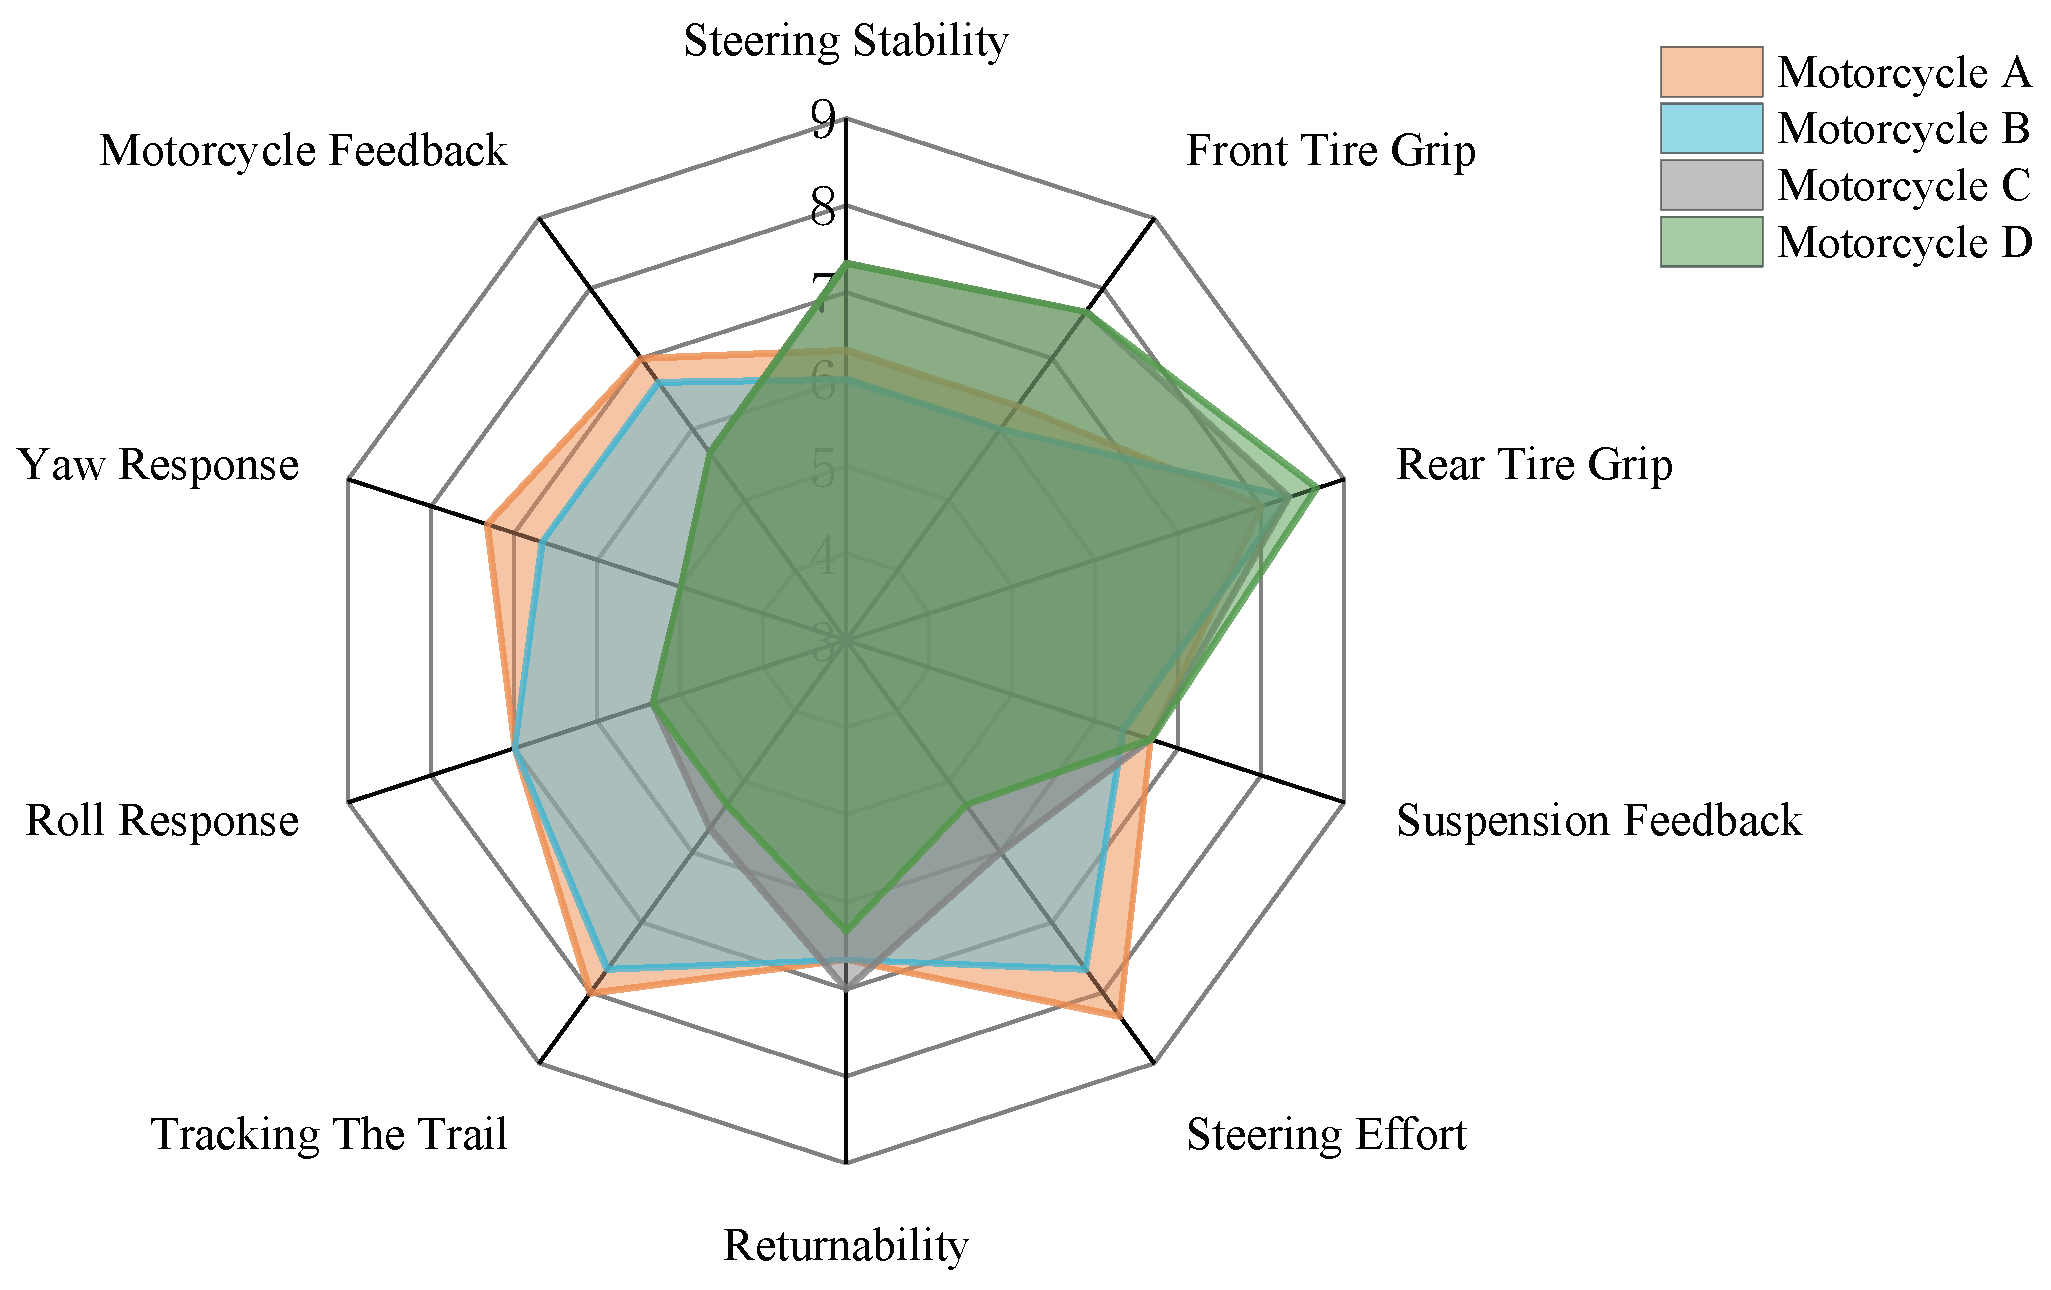
Three expert professional riders were asked to score the performance of four motorcycles during slalom running. Scoring rules were developed from the SAE ten-point absolute rating method, as shown in
Table 6. Results of the subjective evaluation given in
Figure 8 indicate the average value of four motorcycles scored by the three riders.
Intuitively, motorcycle A had the highest evaluation in indexes that reflect handling performance, and motorcycle D had the highest evaluation in indexes that reflect stability.
It was easy to evaluate one property, but difficult to evaluate the whole performance of handling and stability; thus, a fuzzy analytic hierarchy process (FAHP) method was applied to determine the weights of subjective evaluation indicators. Based on the basic theory of a fuzzy consistent matrix and the method of establishing a fuzzy consistent judgment matrix [
22], the subjective evaluation index weight coefficients of handling and stability performance were determined, as shown in
Table 7.
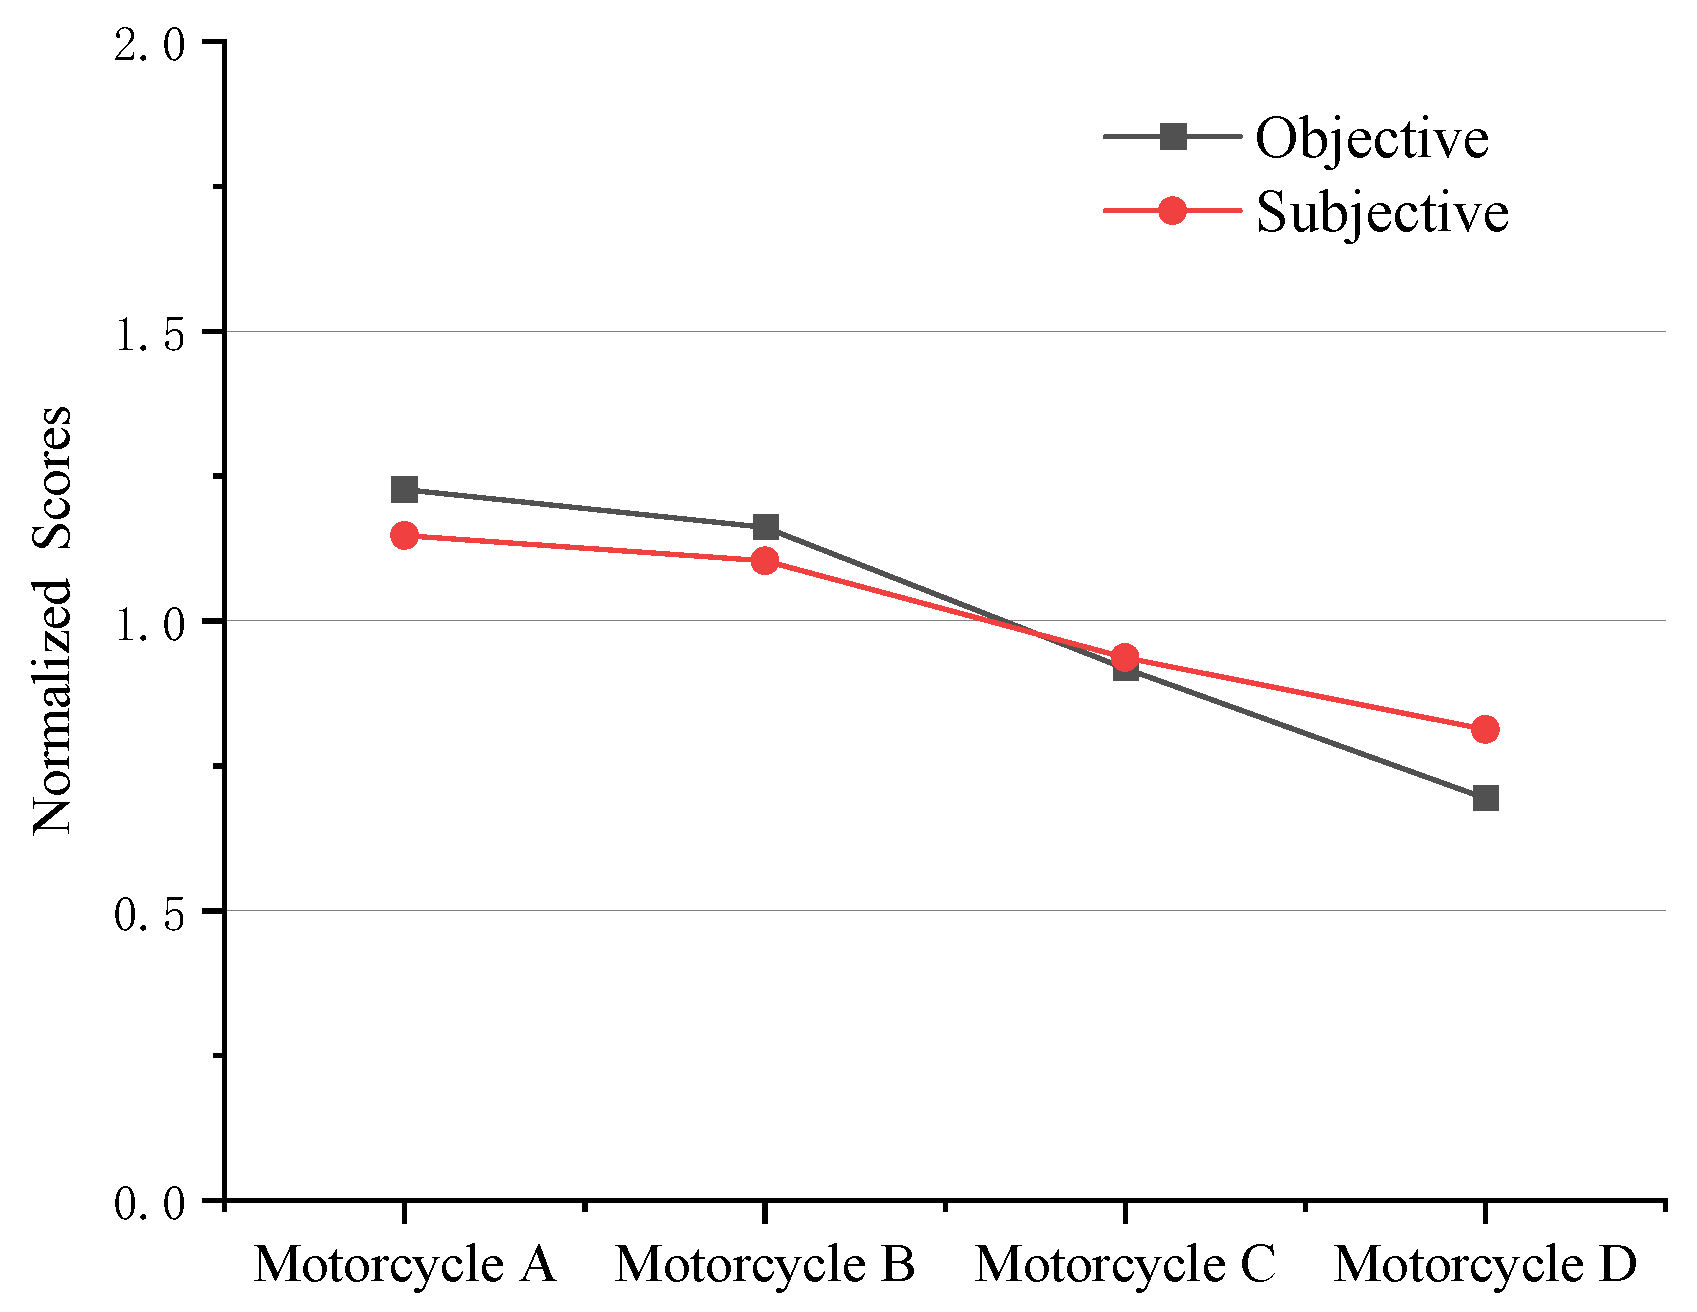
Based on the subjective evaluation score and index weight coefficient, the final subjective evaluation scores of four motorcycles were normalized, and then compared with the normalized values of objective indicators, as shown in
Figure 9.
These results show a good correlation between the index and riders’ subjective evaluations, especially with motorcycles of the same type (motorcycle A and motorcycle B).
Although only roll angle and steering torque were used as input variables for objective evaluation indicators, these demonstrated a high degree of consistency with riders’ subjective evaluation results. This may have been due to a certain degree of compensation between the phase that characterizes handling and the factor that characterizes stability.


