Article

High-Definition Map Change Regions Detection Considering the Uncertainty of Single-Source Perception Data

1
Qingdao Surveying & Mapping Institute, Qingdao 266000, China
2
China Dayou Positioning Intelligence Co., Ltd., Anqing 246000, China
3
Hexagon Geosystems Co., Ltd., Qingdao 266000, China
4
State Key Laboratory of Information Engineering in Surveying, Mapping and Remote Sensing, Wuhan University, Wuhan 430072, China
*
Author to whom correspondence should be addressed.
Machines 2025, 13(12), 1080; https://doi.org/10.3390/machines13121080
Submission received: 17 October 2025 / Revised: 13 November 2025 / Accepted: 22 November 2025 / Published: 24 November 2025
(This article belongs to the Special Issue Control and Path Planning for Autonomous Vehicles)

Abstract

High-definition (HD) maps, with their accurate and detailed road information, have become a core component of autonomous vehicles. These maps help vehicles with environment perception, precise localization, and path planning. However, outdated maps can compromise vehicle safety, making map updates a key research area in intelligent driving technology. Traditional surveying methods are accurate but expensive, making them unsuitable for large-scale and frequent updates. Most existing crowdsourced map update methods focus on matching perception data with map features. However, they lack sufficient analysis of the reliability and uncertainty of perception results, making it difficult to ensure the accuracy of map updates. To address this, this paper proposes an HD map change detection method that considers the uncertainty of single-source perception results. This method extracts road feature information using onboard camera and Global Navigation Satellite System (GNSS) data and improves matching accuracy by combining geometric proximity and consistency. Additionally, a probability-based change detection method is introduced, which evaluates the reliability of map changes by integrating observations from multi-source vehicles. To validate the effectiveness of the proposed method, experiments were conducted on both simulation data and real-world road data, and the detection results of single-source data were compared with those of multi-source fused data. The experimental results indicate that the probabilistic estimation method proposed in this study effectively identifies the three typical scenarios of addition, deletion, and modification in HD map change detection. Additionally, the method achieves more than a 10% improvement in both precision and recall compared to single-source data.

1. Introduction

The development of intelligent driving technology helps reduce traffic carbon emissions and improve road safety, making it one of the research hotspots [1,2]. However, in existing technologies, autonomous vehicle sensors are often affected by environmental factors, leading to traffic accidents, which has raised widespread public concerns about the safety of autonomous driving technology [3,4,5]. To ensure vehicle safety, high-definition (HD) maps have gradually become an indispensable part of autonomous vehicles [6]. HD maps are precise navigation maps that use centimeter-level accuracy to describe road geometry and semantic information [7,8], including lane markings, traffic signs and symbols, traffic information, road boundaries, and other detailed road features [9,10]. Compared to traditional navigation maps, HD maps have higher accuracy and more detailed semantic information [11]. These maps provide key prior information for autonomous vehicles, playing an important supporting role in core modules such as environmental perception, precise localization, control and path planning [12,13]. As the automation level of intelligent vehicles continues to increase, the system’s reliance on HD maps also deepens. Especially in complex traffic scenarios, HD maps have become an essential component in ensuring the safety and robustness of autonomous driving systems [14]. Therefore, how to efficiently, accurately, and cost-effectively construct and update HD maps has become a critical issue in the fields of autonomous driving [15].
In real-world road environments, road structures and traffic elements are frequently updated, such as the addition of new lanes, adjustments to lane markings, or temporary construction. If HD maps are not updated in time, it can lead to deviations in the perception, localization, or decision-making processes of autonomous vehicles, thus affecting driving safety. The current common method for HD map updating primarily relies on mobile measurement systems (MMS) for field data collection and processing, which can provide centimeter-level data. However, these systems are expensive, with long data processing workflows, requiring significant time for map updating. Therefore, although MMS offer high accuracy, they face challenges such as high costs and long update cycles, making it difficult to meet the timeliness and coverage requirements of autonomous vehicles [16,17]. In contrast, crowdsourced data uses low-cost sensors on regular vehicles (e.g., taxis, buses) to collect road traffic data, offering a more affordable solution with broader coverage and more stable data sources. This approach is cost-effective and provides broader coverage with more stable data sources. According to existing literature [11,18], crowdsourcing can achieve sub-meter-level data collection and HD map updates. Although this accuracy is not as high as the centimeter-level accuracy provided by MMS-based systems, it is usually sufficient for many intelligent driving applications and real-time map updates. Therefore, in recent years, crowdsourced data has become an important data source for HD map updates [19,20].
In recent years, many studies have attempted to use crowdsourced data from onboard sensors to automatically update HD maps [21,22]. However, most existing methods focus primarily on the matching process between perception data and map features, as well as the map update process, while paying less attention to the unreliability and uncertainty of the perception results themselves [23,24]. In real-world road environments, individual perception results from single-vehicle data are often incomplete or inaccurate due to occlusion, viewpoint limitations, or errors in sensor parameters. Directly using single-vehicle perception data for map updates can lead to misjudgments in map change detection, affecting the accuracy and precision of the HD map. To address this issue, this paper proposes an HD map change detection method that considers the uncertainty of single-vehicle perception data. The method categorizes map changes into three types: addition, deletion, and modification. It then fuses multi-source perception results to construct a probabilistic evaluation model for these changes. This model incorporates data matching consistency and the reliability of detection results.
The main contributions of this paper are as follows:
  • A multi-object detection and tracking method based on a hybrid model is proposed, which enables real-time perception and tracking of ground lane markings and arrows.
  • A feature matching algorithm based on geometric proximity and shape consistency is proposed, allowing for accurate matching between perception results and HD maps.
  • A probabilistic update model that considers the uncertainty of single-vehicle perception data is developed, which integrates multi-source data to achieve precise map change detection.

2. Related Work

As this study focuses on HD map change detection and automatic updating, this section provides a review of HD map construction and update methods, with an emphasis on existing research using crowdsourced onboard perception data for map updates.

2.1. HD Map Construction and Update

In the initial construction phase of HD maps, traditional methods typically rely on MMS for high-precision data collection, combined with manual or semi-automated processing workflows to generate HD maps [25,26]. MMS platforms usually integrate high-precision LiDAR, surround cameras, and an integrated navigation system (INS), enabling the collection of centimeter-level road spatial information for HD map construction. However, this method has limited coverage and high processing costs, making it suitable for the initial construction of HD maps but not ideal for map updates. In addition to MMS-based approaches, some studies have also attempted to use high-resolution remote sensing imagery for HD map construction [27,28]. Gao et al. proposed a method that integrates satellite imagery and onboard sensor data to generate satellite images for each sample in the nuScenes dataset and then constructs HD maps through a hierarchical feature fusion module [29]. Similarly, Wei et al. integrated high-resolution aerial imagery, vehicle telemetry, and existing navigation map information to extract and reconstruct HD map features [22]. However, these remote sensing-based methods face challenges in ensuring the accuracy, timeliness, and completeness of semantic information of map features when constructing high-precision maps. As a result, they struggle to meet the accuracy and real-time requirements for HD maps in autonomous vehicles.
For HD map updates, methods can mainly be categorized into LiDAR-based and vision-based approaches, depending on the type of perception sensor used [30,31]. LiDAR is an active perception sensor that can rapidly scan the road environment to obtain centimeter-level accurate 3D road information. LiDAR-based HD map update methods typically use vehicles equipped with LiDAR to collect environmental point cloud data in real-time during driving and then perform 3D reconstruction using simultaneous localization and mapping (SLAM) algorithms [26,32]. Feature matching is then employed to identify change areas in the HD map, enabling incremental updates. Ye et al. proposed a semi-automated method for extracting curved road lane features from mobile laser scanning (MLS) point clouds, using point cloud data to obtain lane markings and centerline information for HD maps [33]. Xiong et al. proposed a road-model-based method for automatically extracting road boundary line information from HD maps using multi-beam LiDAR [34]. This method can accurately and comprehensively extract boundary information for both curved and straight roads. Compared to other sensors, LiDAR-based HD map construction methods offer higher data quality and accuracy in map feature extraction. However, LiDAR is more expensive than other sensors, making large-scale deployment and extensive data collection challenging.
In contrast, vision-based approaches project road features perceived by cameras into the map coordinate system for 3D reconstruction and then through map matching with existing HD maps to identify potential changes. Hui et al. proposed a vision-based road change detection method, which reconstructs vehicle trajectories through interpolation, further recovers lane information from images, and compares it with HD grid maps to identify change areas [35]. Heo et al. designed an HD map change detection method based on deep metric learning, which directly maps images to HD maps for change estimation [30]. Overall, LiDAR-based methods perform better in spatial accuracy and 3D reconstruction, while vision-based methods, though less accurate than LiDAR point clouds, are more cost-effective and easier to deploy. Therefore, both methods have their advantages in HD map updates and are suitable for different application scenarios and update requirements.

2.2. HD Map Update Based on Crowdsourced Data

Crowdsourced HD map updating methods refer to the use of vehicles equipped with low-cost sensors, such as GNSS receivers and industrial-grade cameras, to collect trajectory and image data during daily driving. Through data processing and analysis, these methods aim to enable automatic updates of HD maps. Generally, such approaches can be classified into two categories: projection-based methods and end-to-end methods [36,37].
Projection-based methods typically extract road features from images or trajectories and then, using the sensor’s internal and external parameters, geometrically project the features from the 2D image space to the 3D geographic space. They are then matched and compared with existing HD maps to detect and update map changes. Zhou et al. proposed a lane mask propagation network method for identifying lane information in images and combined GNSS positioning data to project it from the perspective view space to the 3D space, thereby extracting lane features from the HD map [18]. Similarly, Qin et al. used a convolutional neural network-based image segmentation method to divide the original image into multiple semantic categories, such as ground, lane markings, parking lines, road signs, road edges, vehicles, bicycles, and pedestrians, in order to build a semantic map. They then reproject the semantic pixels from the image plane to the ground plane based on the camera’s internal and external parameters [20]. However, projection-based methods typically rely on single-frame images for feature extraction, lacking the ability to model temporal information and struggling to fully utilize structural consistency between consecutive frames. Moreover, during the perspective projection and re-projection process, images are prone to errors due to inaccuracies in sensor internal and external parameters, affecting the accuracy of 3D spatial reconstruction and the precision of the extracted map features. Additionally, single image data is often affected by factors such as lighting conditions and observation angles, leading to incomplete or inaccurate road information. To address these issues, it is necessary to fuse multi-vehicle perception data to compensate for data accuracy problems.
End-to-end HD map updating methods have also become one of the current research hotspots. These methods construct a unified learning framework that directly inputs raw perception data and HD maps and outputs the probability of map feature changes or update categories. Heo et al. proposed an HD map change detection algorithm based on deep metric learning, which directly maps raw images to the estimated probability of map changes, forming an end-to-end prediction process [30]. To reduce the spatial and semantic differences between images and maps, the authors introduced an adversarial learning strategy, mapping both perception images and map information to a unified feature space and performing pixel-level change probability estimation through a local change detector. Similarly, Lambert et al. proposed a deep learning-based map update method, modeling it as a classification problem, determining whether there are areas that need updating after integrating multi-sourced perception data with existing map information [38]. Although end-to-end methods offer stronger feature representation and higher automation, they typically rely on large-scale models for training and inference, which places higher demands on onboard or cloud computing resources, limiting their practical deployment in resource-constrained environments. Likewise, end-to-end map change detection methods rely on single-vehicle data, which can lead to issues such as unstable data sources and inaccurate detection accuracy.
Overall, single-vehicle perception data are susceptible to environmental factors, leading to some instability in terms of accuracy and reliability, making it difficult to directly support accurate HD map updates. To improve the robustness and reliability of map change detection results, this paper integrates multi-source perception information, considers the uncertainty of perception data, and proposes a probabilistic modeling-based map update method, thereby providing a more comprehensive and robust assessment of map changes.

3. Method

3.1. Framework Overview

This paper uses vehicle trajectories and road images collected by multi-sourced vehicles equipped with low-cost GNSS receivers and industrial cameras as data sources to detect changes in HD maps. As shown in Figure 1, the framework consists of two modules: perception and matching, and probabilistic modeling. The perception and matching module primarily achieve real-time road marking detection through a multi-object detection and tracking method based on a hybrid model. In map matching, unlike existing methods, this paper projects HD map information onto the image coordinate system using the camera’s internal and external parameters and then performs matching based on geometric proximity and shape consistency. The probabilistic modeling module categorizes HD map changes into three types: addition, deletion, and modification. It fully considers the instability and incompleteness of single-vehicle perception data and conducts probabilistic modeling to identify map changes more accurately.

3.2. Road Information Perception and Matching

3.2.1. Road Information Perception

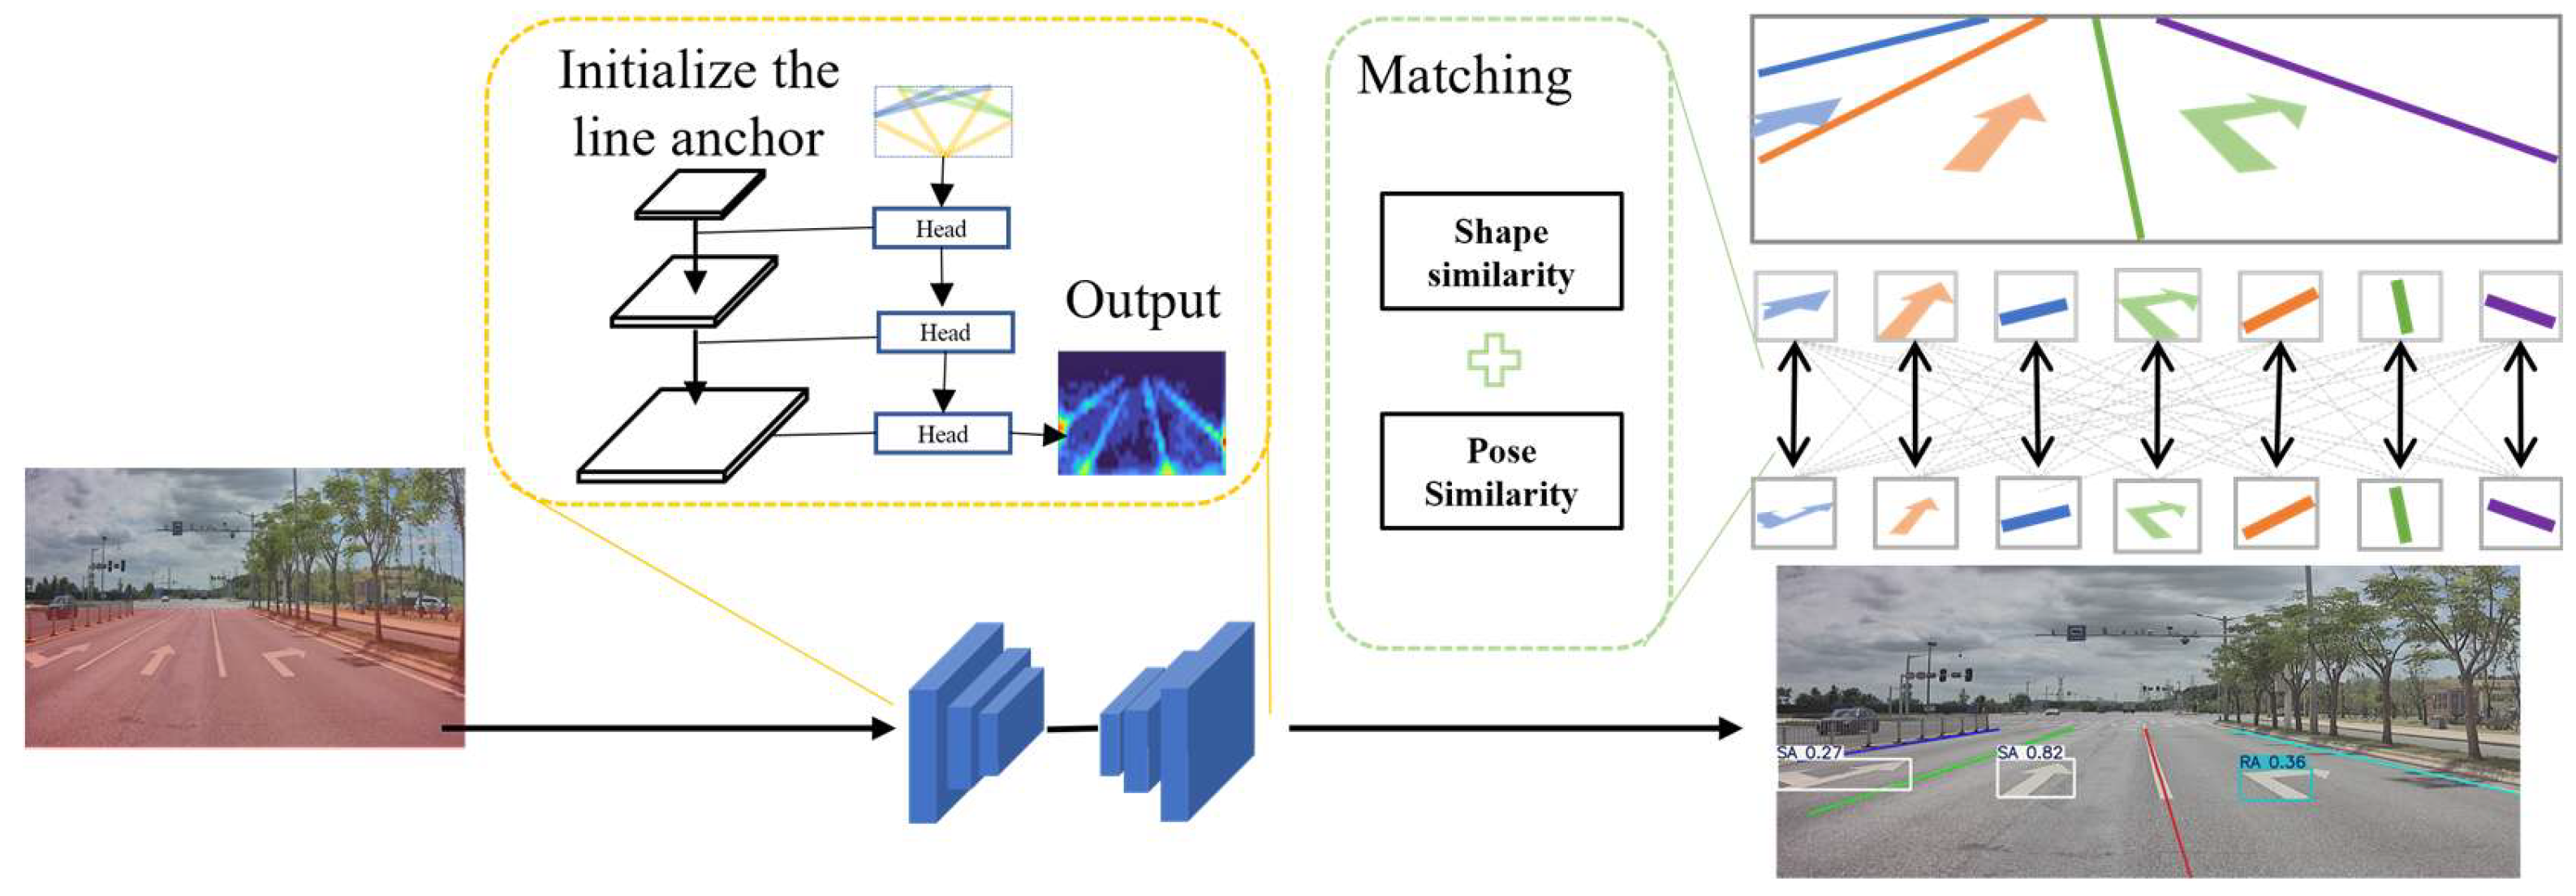
This paper primarily focuses on updating lane marking information and ground signs in HD maps. To achieve accurate identification and continuous tracking of lane markings and ground signs in complex traffic environments, this paper proposes a multi-object tracking framework based on hybrid modeling, building upon previous work [39]. The approach uses a detection-first, tracking-later strategy, with the overall structure consisting of two main modules: state modeling and estimation, and data association, as shown in Figure 2. In state modeling, different types of road elements are represented with differentiated parameterizations. For linear geometric features such as lane markings, they are abstracted as line-anchor models, denoted as l i = x i , y i , θ i , S i , where ( x i , y i ) represents the anchor position, θ i denotes the orientation angle, and S i indicates the length scale. During detection, the line-anchor is used as an initial high-level representation of the lane. This is continuously refined through lane/background classification and parameter regression by the detection head, with feature propagation and fusion across multiple scales to achieve fine-grained modeling and tracking of the lane markings. For ground markings, bounding box parameters are used for modeling. The state vector is defined as c x i , c y i , a i , h i , where ( c x i , c y i ) represents the bounding box center, a i is the aspect ratio, and h i denotes the bounding box height.
In the data association stage, this study constructs a cost matrix by integrating pose similarity and appearance similarity to achieve optimal cross-frame matching. Pose similarity is measured using the Mahalanobis distance, which quantifies the discrepancy between the predicted state and the detection result. Appearance similarity is obtained by extracting visual feature vectors of road elements with a convolutional neural network and computing the cosine similarity. The two similarity measures are combined in a weighted manner to form the final cost matrix, which is then processed by the Hungarian algorithm to complete the matching. Finally, during state updating, a Kalman filter is introduced to recursively refine the spatial position and scale of the targets, effectively suppressing detection noise and short-term occlusions. In this way, robust tracking of both lane lines and ground markings is achieved.
Different from the existing methods, this paper projects HD maps from the world coordinate system to the camera coordinate system, rather than projecting perception information into the geographic coordinate system of the HD map. This approach changes the alignment from absolute geometric alignment in spatial coordinates to relative alignment in image space, allowing for better utilization of the map’s relative information and local features while reducing reliance on absolute positioning data. Therefore, after detecting lane markings and lane arrows, the HD map needs to be converted from the geographic coordinate system to the image coordinate system in order to match the map features and facilitate subsequent change detection. The points in the HD map are defined as P m = [ x m ,   y m ,   z m ] T . First, the map points are converted from the world coordinate system to the vehicle coordinate system using the rotation matrix R w 2 v and translation vector t w 2 v (location and heading information provided by the positioning device), as shown in Equation (1). Then, based on the camera’s extrinsic parameters (rotation matrix R v 2 c and translation vector t v 2 c ), the points are transformed from the vehicle coordinate system to the camera coordinate system, as shown in Equation (2). Finally, the points in the camera coordinate system are projected onto the normalized image plane using the camera’s intrinsic parameters K and the camera height ( z c , i.e., scale), as shown in Equation (3).
P v = R w 2 v · P m + t w 2 v
P c = R v 2 c · P v + t v 2 c
x y 1 = K · x c / z c y c / z c 1

3.2.2. Road Information Matching

The road information perceived by a single vehicle is often incomplete, and the camera’s internal and external parameters inevitably contain errors, leading to discrepancies between the projected HD map and the perception results in terms of spatial location. Therefore, it is necessary to design a precise, robust, and computationally efficient matching method for HD map change detection. To address this, this paper proposes a matching method based on geometric proximity and shape consistency. First, a matching strategy based on start and end point proximity search is used to identify candidate lanes in the HD map that correspond to the perceived lanes. Then, the matching scenarios are classified into two categories, namely complete matching and incomplete matching, based on the relationship between the number of perceived lanes and the number of map lanes.
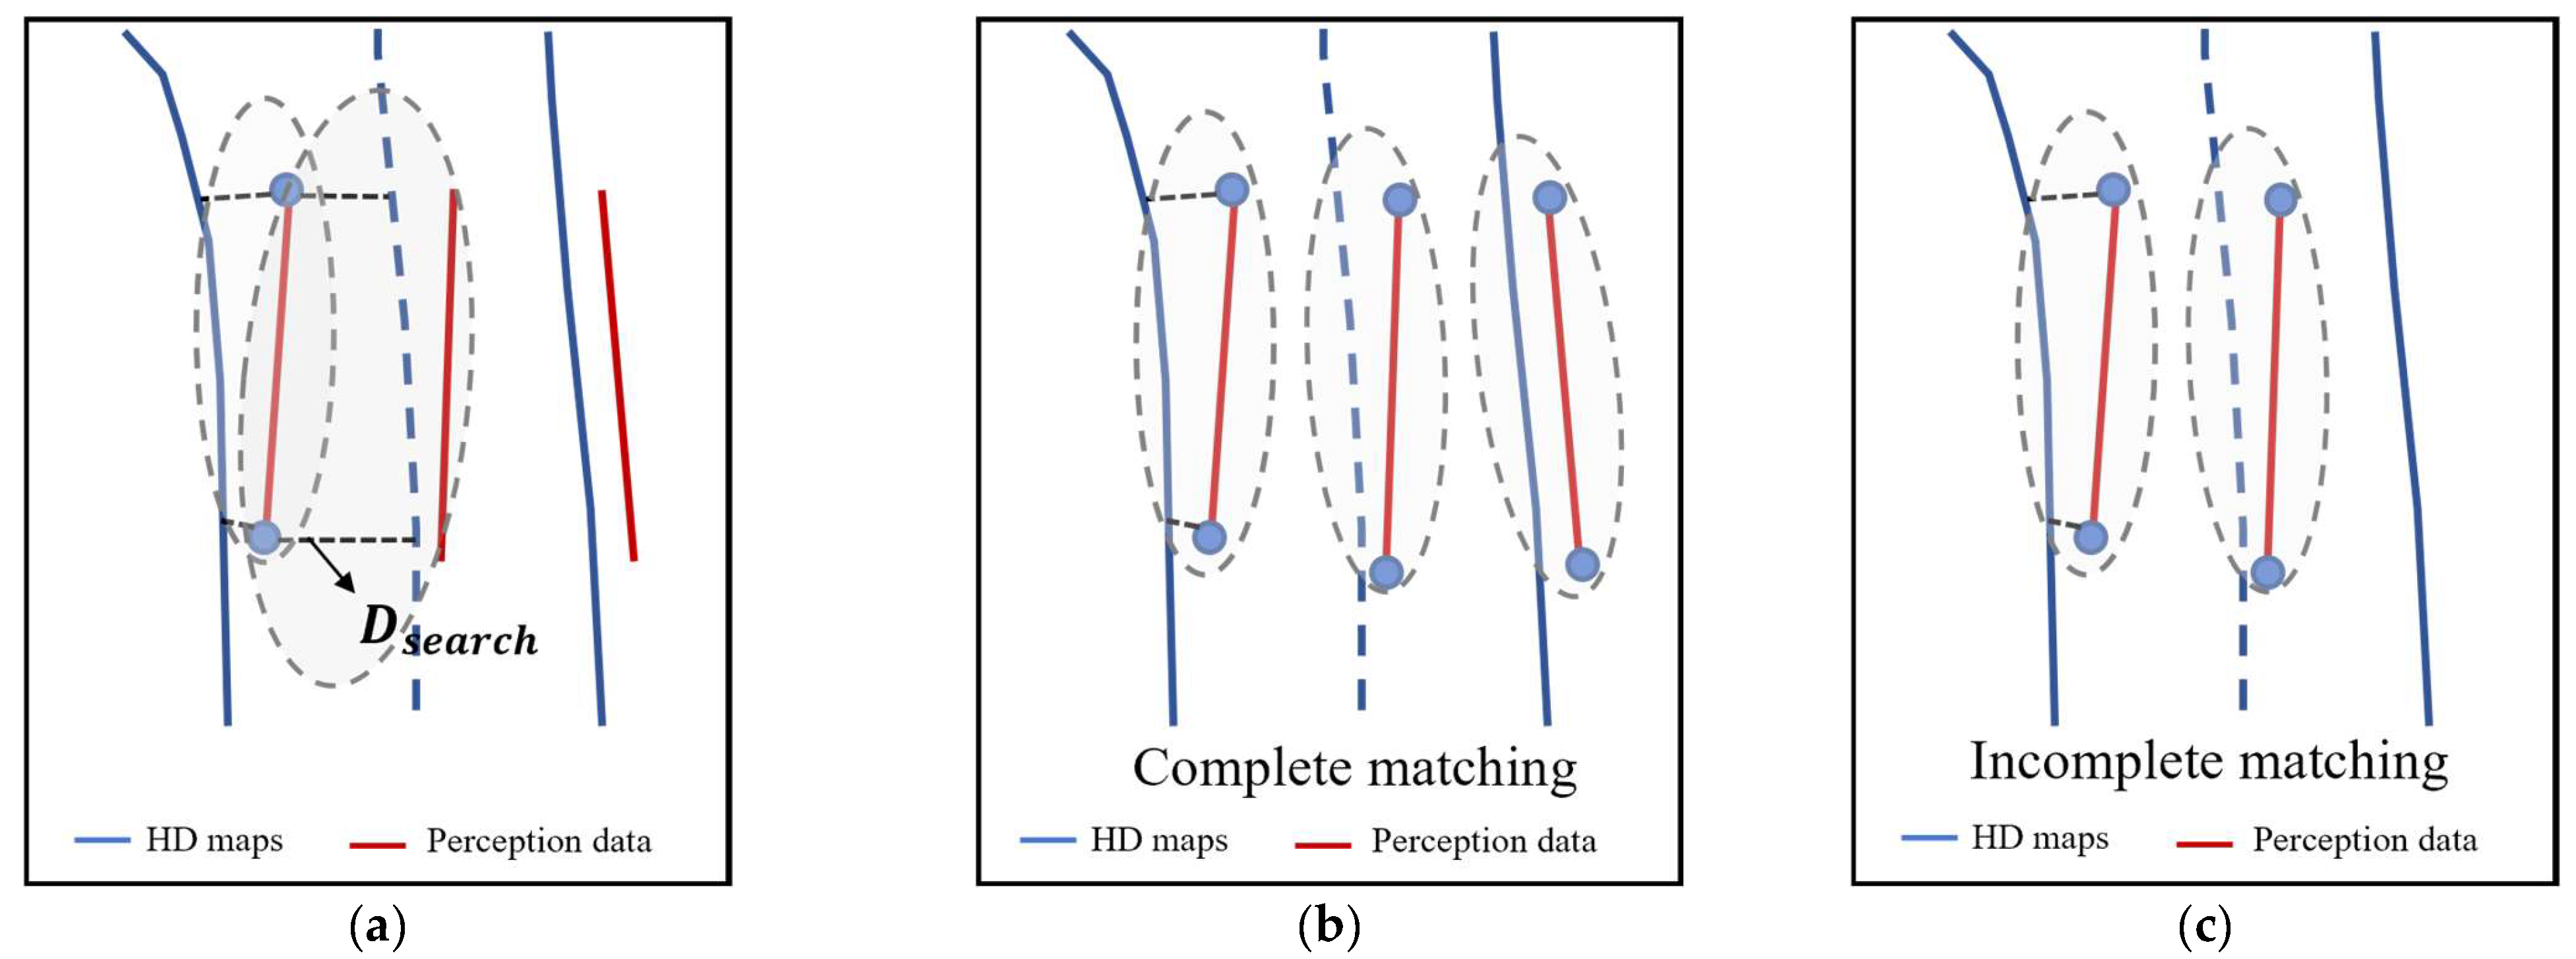
As shown in Figure 3a, for a perceived lane L i p , the start point s i p and end point e i p are extracted. The set of HD map lanes C whose Euclidean distance to either endpoint is less than the threshold D s e a r c h is retrieved, as expressed in Equation (4). In the candidate set C , for each candidate L ( m ) , the consistency between the perceived lane and its corresponding lane count is evaluated. Let the number of lanes annotated in the HD map for this section be K m , and the number of lanes detected by perception be K p . If K m = K p , and there is a one-to-one correspondence between the perceived lanes and the map lanes in terms of topological order (i.e., each perceived lane corresponds to a candidate HD map feature), it is considered a complete match, as shown in Figure 3b. If K m K p or if the correspondence cannot be determined, it indicates that there are issues such as missing, occluded, or erroneous detections in the perception data, and it is considered an incomplete match, as shown in Figure 3c.
C = { L k m | m i n ( d i s t ( s i p , L k m ) , d i s t ( e i p , L k m ) ) D s e a r c h }
For complete matching, as illustrated in Figure 3b, matching is performed based on the proximity of start and end points as well as positional variance. For each perceived lane L i p , the polyline distance between its start and end points and the corresponding HD map lane is computed, and the proximity error of the start and end points is defined as shown in Equation (5). In addition, both the perceived lane and the HD map lane are resampled equidistantly to obtain point sequences { P i , k } k = 1 N and { M i , k } k = 1 N . The point variance between the two curves is then calculated as in Equation (6). Both the proximity error of the start and end point and the position variance are normalized, and their sum is calculated as the matching cost, as shown in Equation (7). Based on this cost metric, the Hungarian algorithm is used to determine the optimal correspondence and minimize the total matching cost.
d i , j = 1 2 ( d i s t s i p , L j m + d i s t ( e i p , L j m ) )
σ 2 i , j = 1 N k = 1 N P i , k M j , k 2
C i , j = d i , j + σ 2 i , j
In addition to the complete matched scenarios, it is also essential to consider situations where GNSS positioning inaccuracies and incomplete perception data lead to mismatches or partial matches. To address this, this paper introduces a shape similarity metric, in addition to proximity of start and end points and position variance, to improve the robustness of the matching process. First, the unit tangent vectors t ^ i ( p ) and t ^ i ( m ) are calculated by the difference in the forward and backward resampled points for the perceived lane and the HD map lane. Then, the directional cosine between the two tangent vectors is calculated and averaged for each point. Their average is taken as the shape similarity score, as defined in Equation (8). This value is then normalized and combined with the proximity of start and end points and position variance to form a comprehensive score, as shown in Equation (9). Among all the candidate lane set C , the maximum value is selected as the final matching result. When the vehicle’s positioning error is large or the perception data is incomplete, the composite score will be lower, indicating that the observation contributes less to the high-definition map change detection.
s i , j = 1 N k = 1 N t ^ i , k ( p )   ·   t ^ j , k ( m )
s c o r e i , j = C i , j + s i , j
The map matching method proposed in this paper takes into account the incompleteness of perception data, dividing the matching process into two categories: complete matching and incomplete matching. By combining geometric proximity and shape consistency features, the method enables simple, fast, and accurate real-time matching of HD maps and perception data. The detailed matching procedure is presented in Algorithm 1.
Algorithm 1: Lane Matching between Perception Data and HD Map
Input: Set of perceived lanes L ( p ) ; Set of HD map lanes L ( m )
Output: Matched lane pairs between perception and HD map M
1:  Initialize matched set M =
2:  for each perceived lane L i p L ( p )  do
3:    m i n ( d i s t ( s i p , L k m ) , d i s t ( e i p , L k m ) ) D s e a r c h // Find candidate set
4:  if  K m = K p and lanes can be topologically aligned then
5:  for each candidate L k m  do
6:    d i , j = 0.5 ( d i s t s i p , L k m + d i s t ( e i p , L k m ) )
7:    σ 2 i , j = 1 N k = 1 N P i , k M i , k 2
8:   Normalize d i , j and σ 2 i , j and compute matching cost
9:   Apply Hungarian algorithm to minimize total matching cost
10:    Add matched pairs to M
11:   else each candidate L k m  do
12:    Compute d i , j and σ 2 i , j
13:     s i = 1 N i = 1 N t ^ i ( p ) · t ^ i ( m )
14:    Normalize all metrics to [0,1]
15:    Compute total score
16:    Select candidate with maximum s c o r e i as match
17:    if s c o r e i < T s , mark as unreliable
18:   end for
19:   return M

3.3. Probabilistic Model

Considering the inaccuracies in positioning results and the uncertainty of perception results, probabilistic modeling of the matching between perception data and map information is necessary for detecting changes in HD maps. This allows for the identification of feature change areas within the map and quantifies the reliability of the detection results. In this paper, the map changes are categorized into three types: addition, deletion, and modification. Addition refers to features that were not present in the original map but continuously appear in the perception data. Deletion refers to features that were present in the original map but are consistently missing in the perception data. Modification refers to features that exist in the original map but exhibit persistent discrepancies in geometry or position compared to the perception data. Perception results from multiple vehicles are then fused, and probabilistic inference is applied to determine whether an update should be triggered.
Considering that incomplete matching may result from factors such as positioning errors, viewing angle, occlusion, and illumination conditions, a visibility factor V i     [ 0 ,   1 ] is introduced to characterize the reliability of the i-th observation. The visibility factor is defined as a weighted combination of three components: geometric visibility V g e o , occlusion level V o c c , and observation distance V d i s t , as given in Equation (10).
V i = α 1 V g e o , i + α 2 V o c c , i + α 3 V d i s t , i
where V g e o is computed from the angle between the lane marking and the matched HD map lane; V o c c is derived from the proportion and continuity of visible pixels; and V d i s t is calculated from the distance between the vehicle and the target element. While it is true that different users with different sensors might introduce different levels of uncertainty, we chose equal weights to simplify the model. So, the weights α 1 , α 2 , α 3 are set to 1/3 to give equal importance to the three components.

3.3.1. Problem Definition

Let the possible change state set of the map element be denoted as H, as shown in Equation (11). Suppose there are N vehicles passing through the region where the feature is located, and the set of perception observations obtained is D, as shown in Equation (12). Each vehicle observation is denoted as an event o i , which includes the matching type m i (complete/incomplete), the matching probability score s c o r e i , and the visibility information V i at the time of acquisition, as expressed in Equation (13). Assuming that observations from different vehicles are independent, the objective is to compute the posterior probability P ( H | D ) for each change hypothesis.
H = { H a d d , H d e l , H m o d , H n o }
D = { o 1 , o 2 , , o N }
o i = m i , s c o r e i , V i ,   m i { c o m p l e t e , i n c o m p l e t e }
where H a d d , H d e l , H m o d , H n o represent the addition, deletion, modification, and no-change states of HD map elements, respectively.

3.3.2. Single-Observation Probability

Each single observation is first classified into two categories: supporting change or supporting no change, as defined in Equations (14) and (15). When s c o r e i is close to 1 and the visibility V i is high, the observation strongly supports the hypothesis of no map change. Conversely, when s c o r e i is small and V i is high, the observation supports the hypothesis of a change in the map. If V i is small, both terms are suppressed, indicating that the observation has limited contribution.
e i n o = V i · s c o r e i
e i c h g = V i · ( 1 s c o r e i )
The change probability e i c h g from a single observation is then allocated to the three specific change types based on contextual information, as shown in Equations (16) and (17). If the map lacks an element but it is detected in the perception data, the evidence is biased toward z i a d d , i.e., z i [ 1 ,   0 ,   0 ] . If the element exists in the map but is missing in the perception data, the evidence is biased toward z i d e l , i.e., z i [ 0 ,   1 ,   0 ] . If the element exists in both the map and perception data but with significant geometric discrepancies, the evidence is biased toward z i m o d , i.e., z i [ 0 ,   0 ,   1 ] . When the context is ambiguous, the probability is evenly distributed, i.e., z i = [ 1 3 ,   1 3 ,   1 3 ] . The evidence from a single observation for each change type is then obtained, as shown in Equation (18).
z i = [ z i a d d , z i d e l , z i m o d ]
z i a d d + z i d e l + z i m o d = 1
e i a d d = e i c h g · z i a d d ,     e i d e l = e i c h g · z i d e l ,     e i m o d = e i c h g · z i m o d

3.3.3. Multi-Vehicle Observation Fusion Probability

To avoid the impact of multiple frames from the same vehicle on the same element, multiple observations from a single vehicle within a time window are first combined into a single representative observation e i h using a weighted average. The probabilities from all vehicles are then accumulated in the logarithmic domain to obtain the total probability δ v h , as shown in Equation (19). Assuming uniform priors for each change hypothesis, P H = n o , P H = a d d , P H = d e l , P H = m o d , the prior is incorporated in the logarithmic domain as shown in Equation (20). Numerical normalization is performed using the log-sum-exp operation to obtain the posterior probability, as shown in Equation (21). The maximum posterior probability among the three change types is then computed in Equation (22).
L h = v = 1 V l o g ( e i h + ϵ ) ,     h { n o ,   a d d , d e l , m o d }
S h = L h + l o g P ( H = h )
P H = h D = e x p ( S h ) h e x p ( S h )
C c h g = m a x { P H = a d d D , P H = d e l D , P H = m o d D     }
where V denotes the number of distinct vehicles, and ϵ is a small constant set to 10 6 . An update is triggered when the probability exceeds the confidence threshold T s and the number of observing vehicles satisfies V 5 .

4. Experiments and Analysis

4.1. Study Area and Data

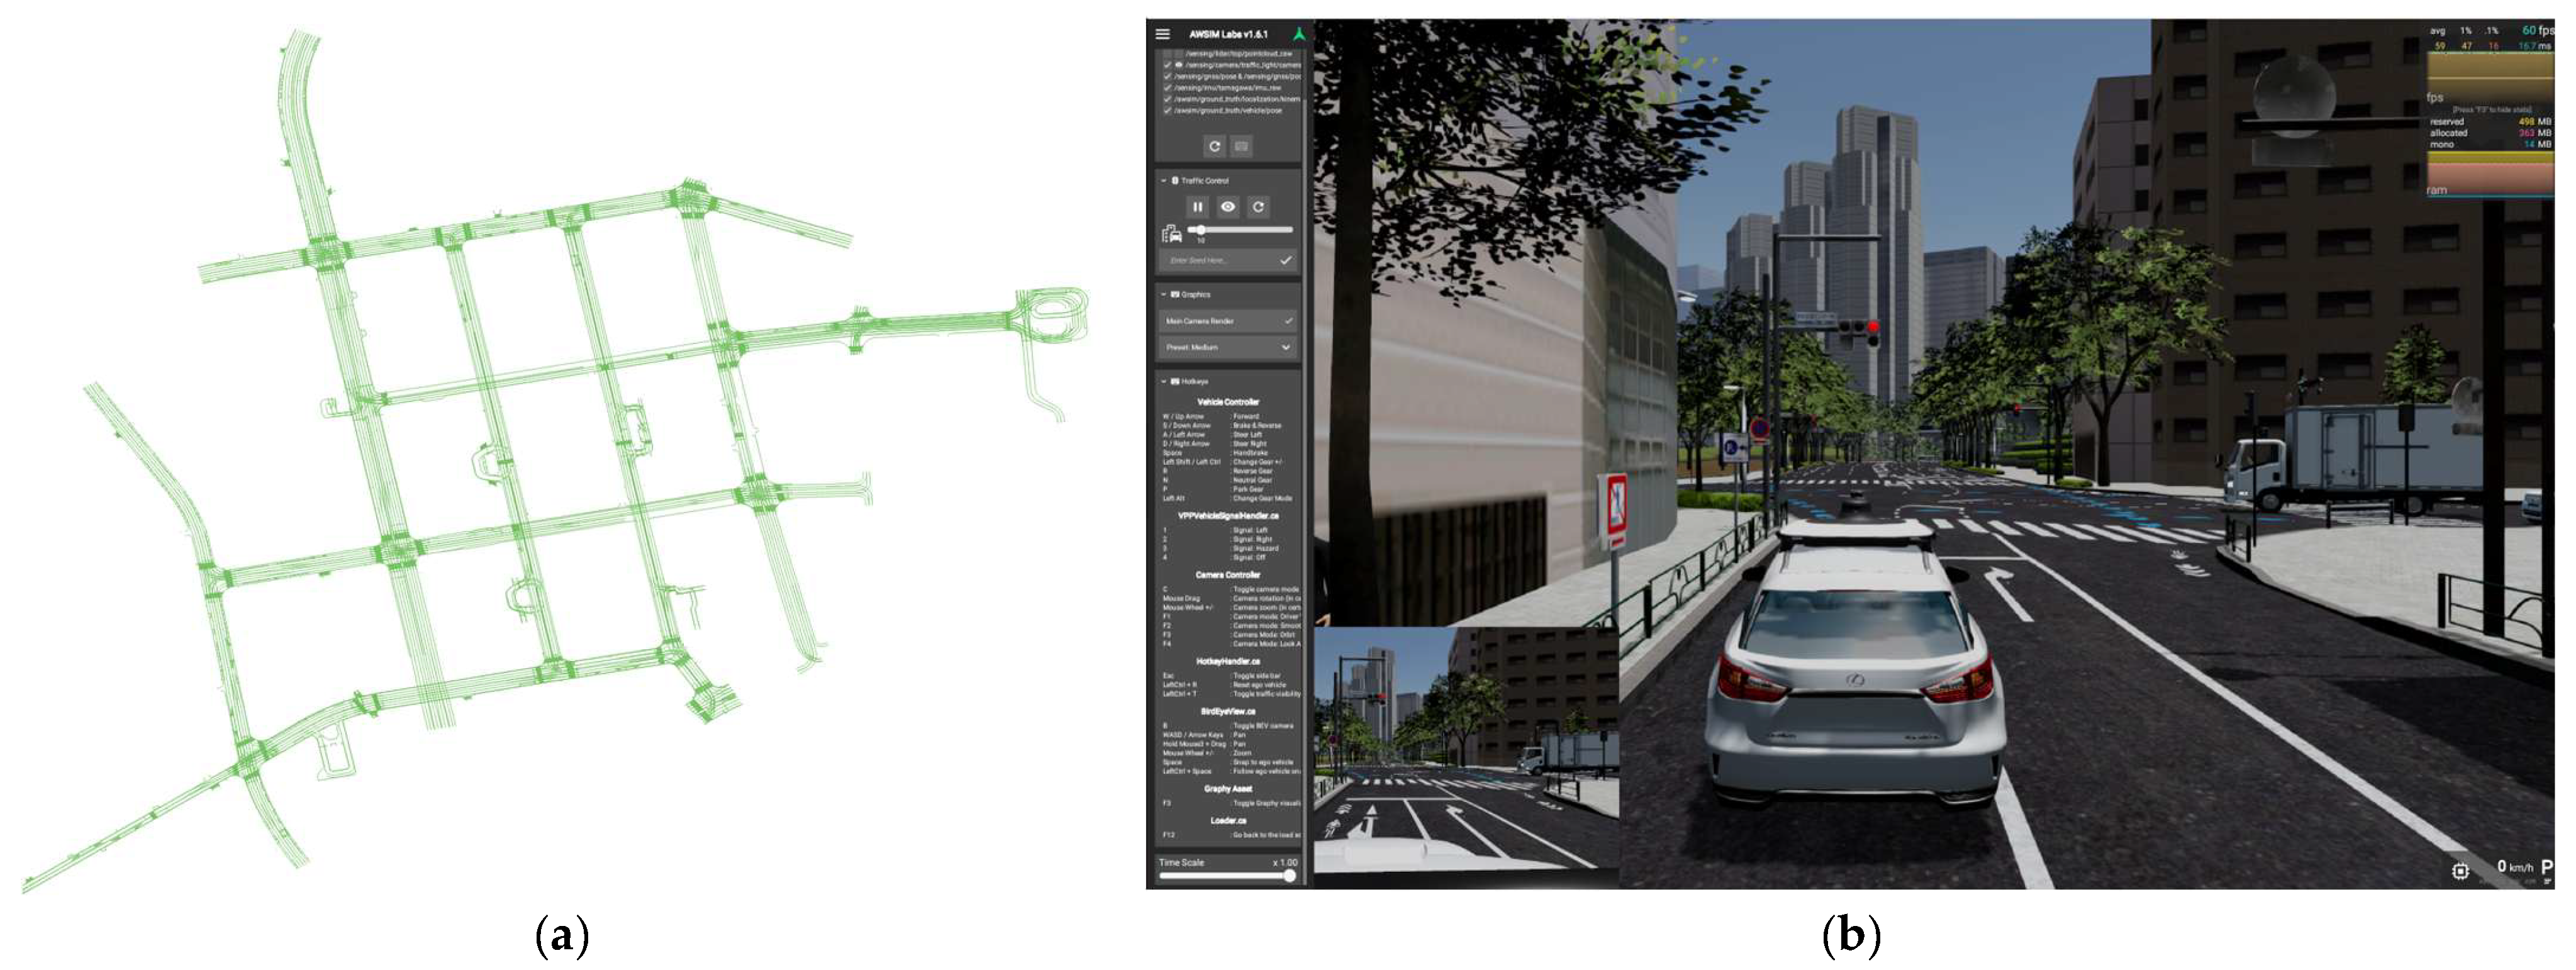
To validate the effectiveness of the proposed HD map change detection method, experiments are conducted on two different datasets to cover a wide range of scenarios, from virtual simulations to real-world roads. The first dataset is based on simulation data generated using the Autoware.Universe 0.47.0 platform, as illustrated in Figure 4. This dataset uses a road network and HD map built in the simulation environment as a foundation, and by deploying multi-sourced vehicles equipped with sensor models in the virtual scene, it collects camera and position observation data. This simulates the process of vehicle groups perceiving road features in the real world. The dataset allows for strict control of road changes in the scene, such as additions, deletions, and modifications, and provides ground truth maps for comparison, enabling the controlled validation of the method.
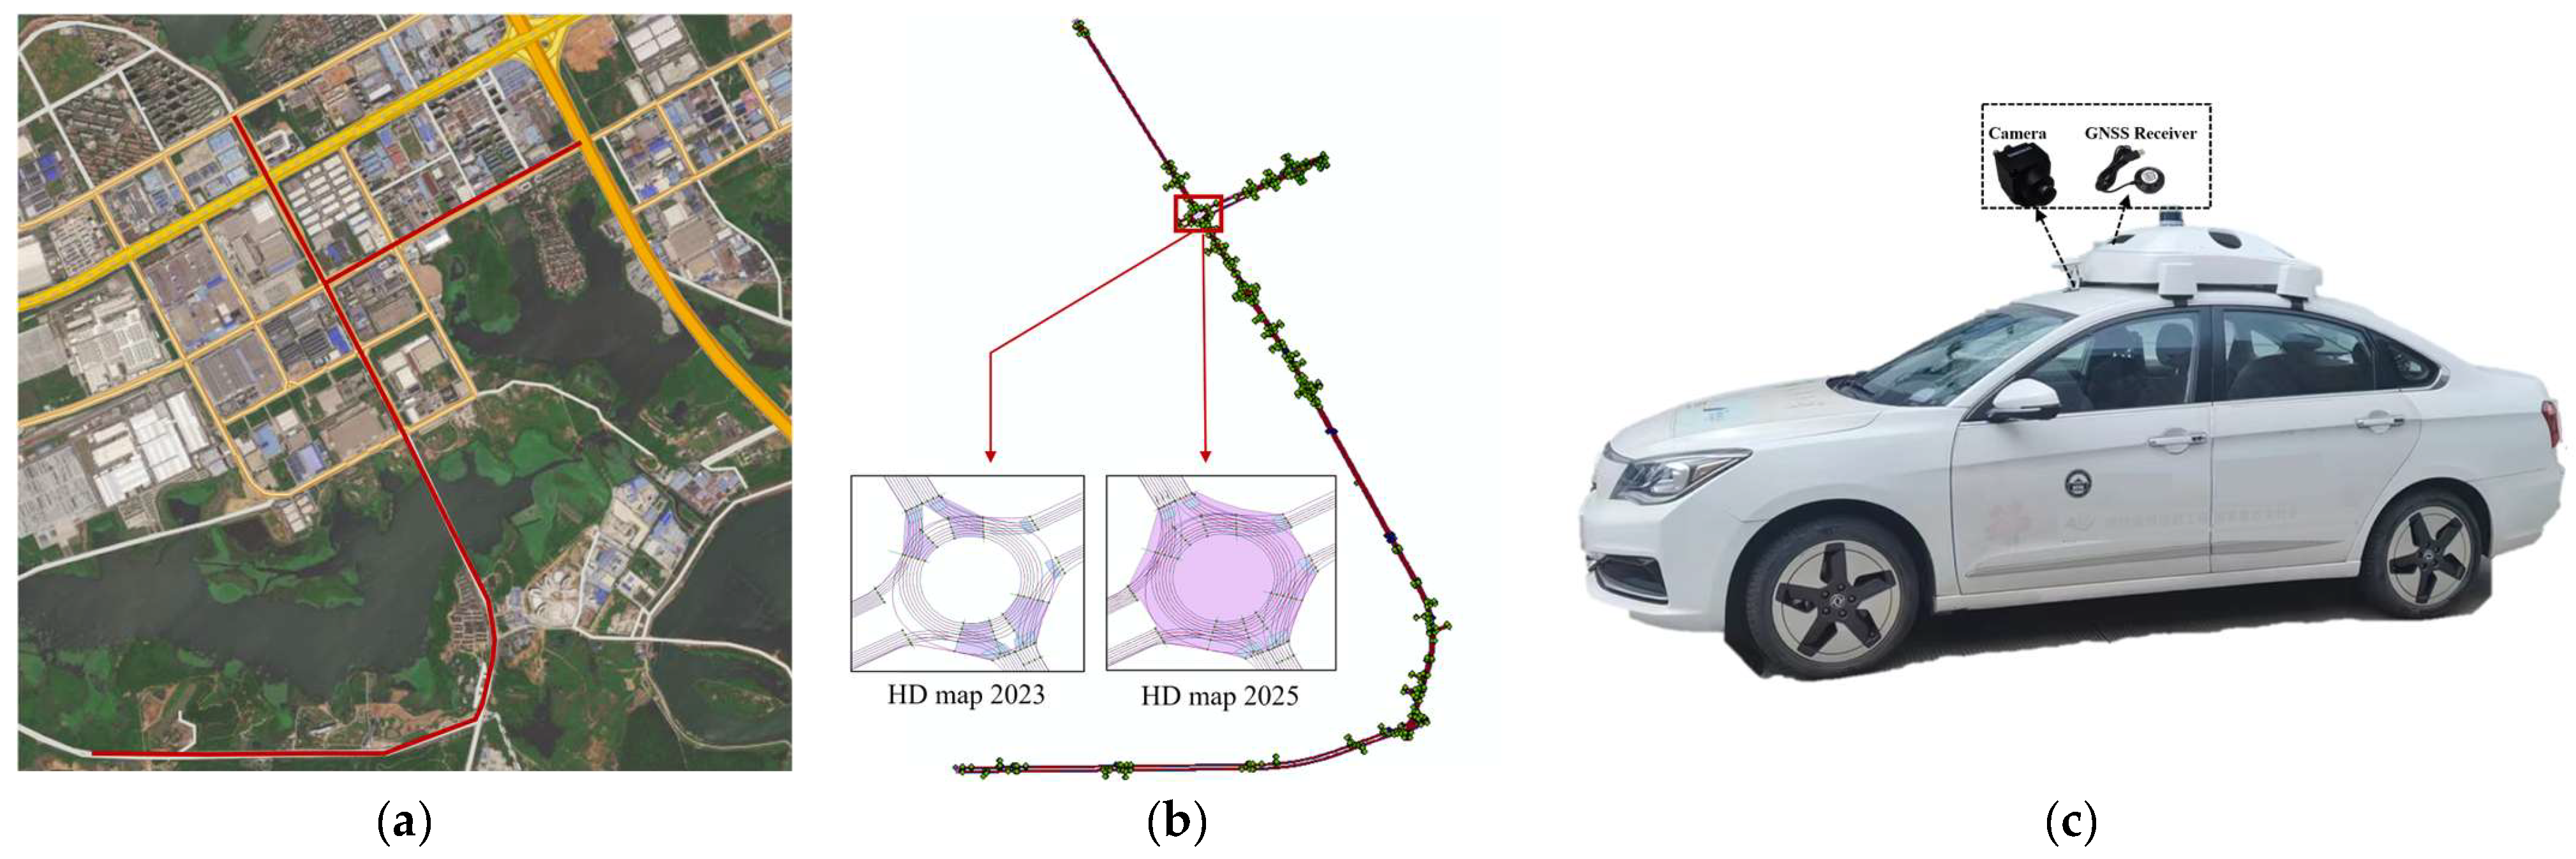
The real-world road data collected in the Intelligent Connected Vehicle Demonstration Zone in Wuhan, China, with the experimental area shown in Figure 5a. This region contains both a 2023 version of the HD map and an updated 2025 version. Differences between the two maps mainly involve adjustments to road geometry, the introduction of new road elements, and the removal of outdated features, as illustrated in Figure 5b. To obtain observation data, multi-sourced vehicles equipped with onboard cameras and GNSS receivers were deployed to repeatedly traverse the demonstration area, shown in Figure 5c. By applying localization and time-synchronization techniques, vehicle observations were aligned with map elements to construct the experimental observation set. By employing these two datasets, the experiments not only assess the accuracy and robustness of the method in a simulated environment but also validate its applicability and reliability under complex real-world traffic conditions.

4.2. Experiment Setting and Accuracy Evaluation

4.2.1. Experiment Setting

To train the proposed model, the CULane and CeyMo datasets were employed. The CULane dataset contained 133,235 images extracted from more than 55 h of video, with detailed annotations for lane markings. The CeyMo dataset included 2887 images comprising 4706 instances of road markings, categorized into 11 classes, such as left-turn arrow, pedestrian crossing, right-turn arrow, and so on. The test set of the CeyMo dataset further covered six different scenarios, namely normal, crowded, glare, nighttime, rainy, and shadowed conditions.
In the process of matching perceived lanes with HD map lanes, candidate lanes are first selected based on a threshold D s e a r c h . The primary sources of error affecting the endpoint distance include vehicle localization errors, projection errors of perceived features, and inherent errors of the HD map. Due to the multipath effect of GNSS, vehicle localization errors in urban road environments are typically within 3–4 m. Projection errors of features, caused by the accuracy of camera intrinsic and extrinsic parameters as well as road undulations, usually range from 0.7 to 1 m, while the intrinsic errors of the HD map are generally within 0.3–0.5 m. Considering the geometric extension introduced by lane width, this study sets D s e a r c h = 10 .

4.2.2. Accuracy Evaluation

To validate the effectiveness of the proposed HD map change detection method, the experimental evaluation is divided into two aspects: assessing the performance of the matching method and assessing the performance of map change extraction. In the perception and matching stage, matching reliability and matching recall are adopted as evaluation metrics. Matching reliability reflects the proportion of perceived elements that can be successfully matched with the HD map, which measures the credibility of matching results in the perception data, as shown in Equation (23). Matching recall reflects how many ground-truth map elements can be detected and successfully matched, as shown in Equation (24).
R m a t c h = L m a t c h e d L d e t e c t e d
R r e c a l l = L m a t c h e d L m a p
where L d e t e c t e d denotes the set of elements detected by the perception algorithm, L m a t c h e d denotes the subset of elements that can be effectively matched with the HD map, and L m a p denotes the set of ground-truth elements existing in the map.
In the map change detection stage, precision and recall are adopted as the overall evaluation metrics to measure the reliability and coverage of the detection results, as shown in Equations (25) and (26).
P r e c i s i o n = T P T P + F P
R e c a l l = T P T P + F N
where TP denotes the number of true change elements correctly detected by the system, FP denotes the number of elements incorrectly identified as changes, and FN denotes the number of true changes that are missed.

4.3. Experiment Results

4.3.1. Matching Evaluation

To evaluate the robustness of the proposed perception method under different environmental conditions, we first visualized the perception results in real road scenarios. As shown in Figure 6, the proposed method was able to stably extract lane markings and traffic sign information under various challenging conditions, including normal lighting, shadow occlusion, light fog, and backlighting. Particularly in scenarios with light changes (e.g., entering and exiting tunnels, as shown in Figure 6b), local overexposure caused by backlight (Figure 6c), and shadow interference on the road surface (Figure 6d), the method preserved the integrity and continuity of lane markings while effectively reducing false detections and missed detections. This demonstrates that the proposed method is not only applicable to clear scenes but also exhibits robustness under environmental disturbances. Experimental results confirm the adaptability of the proposed perception method across various real-world road scenarios, providing a reliable input foundation for subsequent map feature matching and change detection.
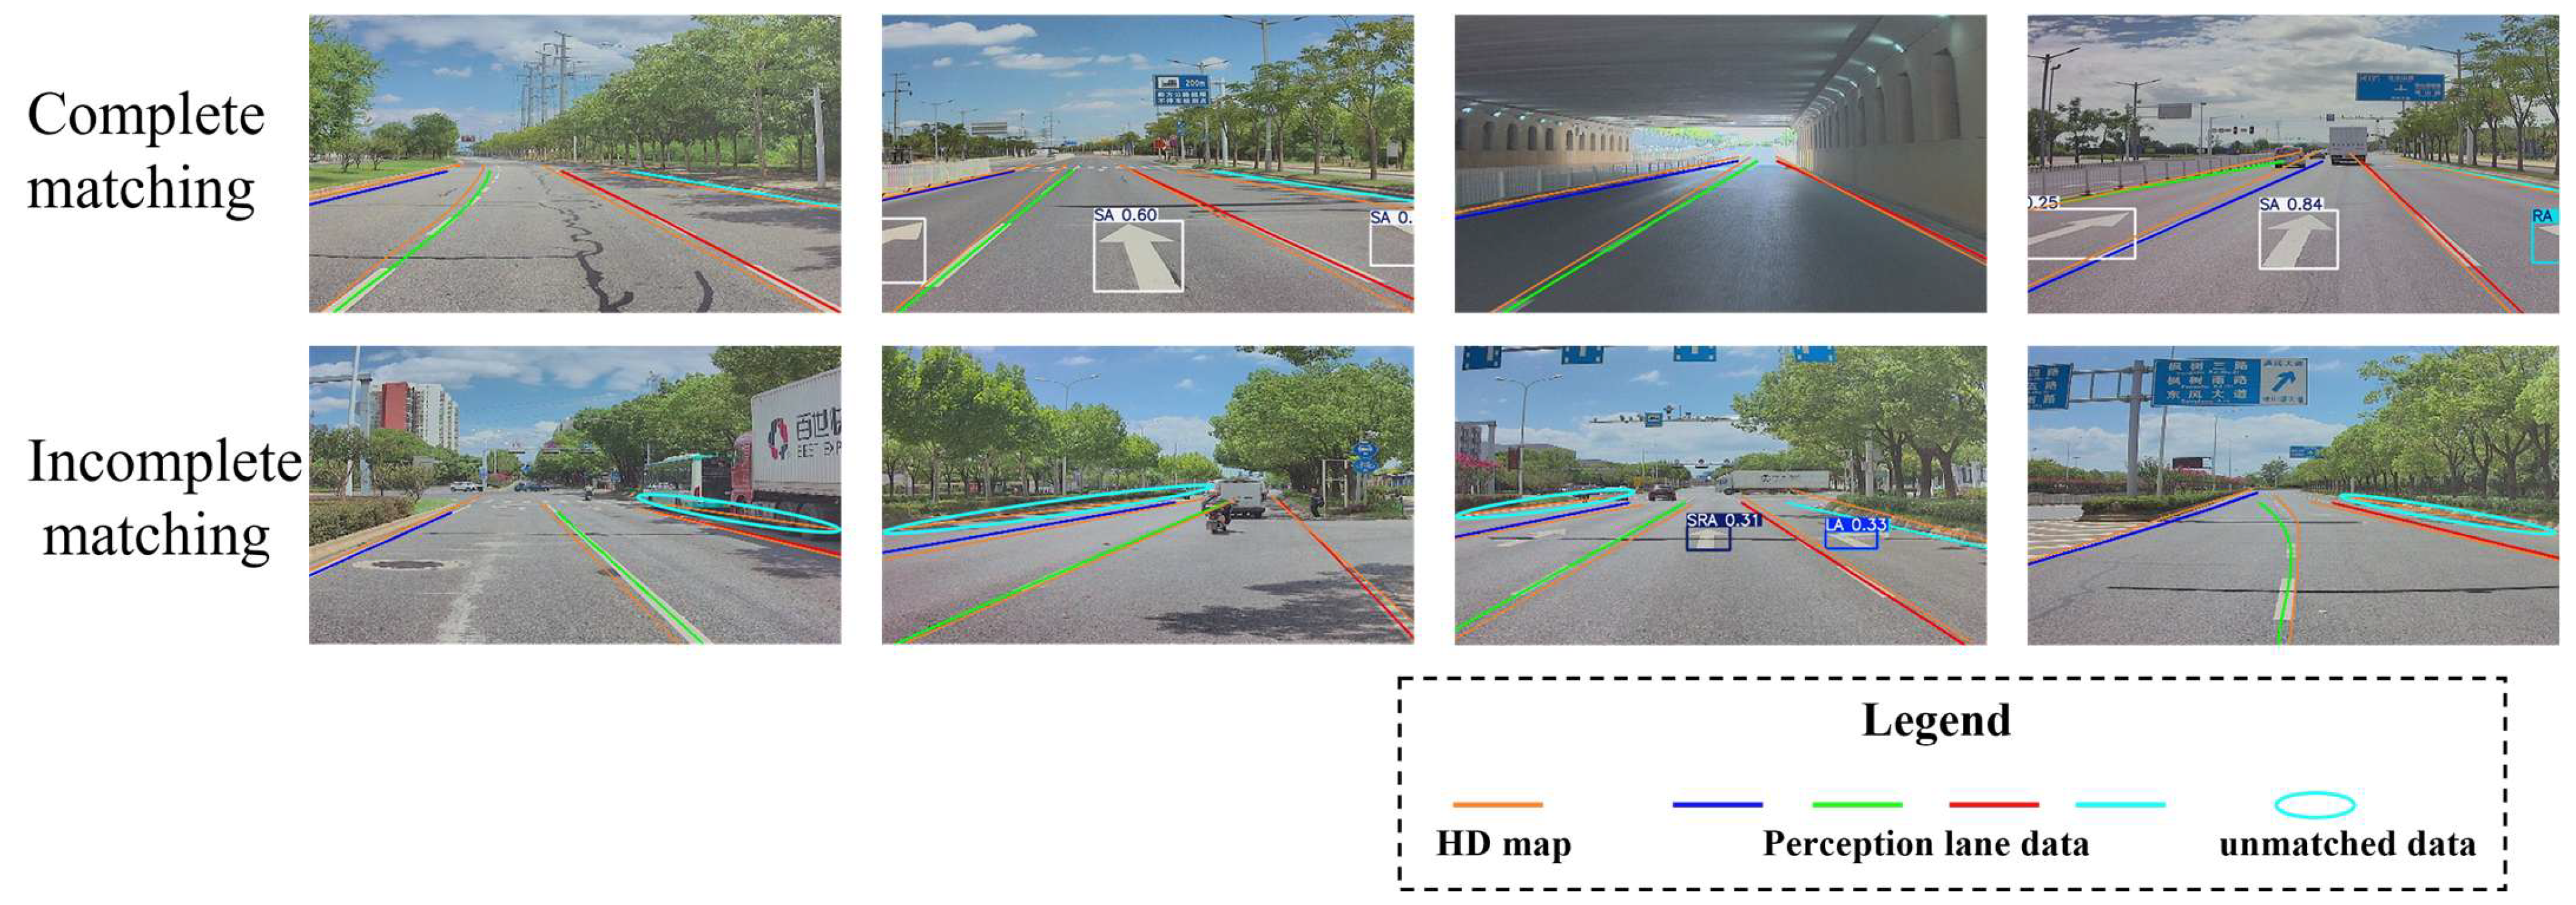
To validate the effectiveness of the proposed matching method, we present the visualized results of the matching algorithm. As shown in Figure 7, the matching results include both complete and incomplete matches. In complete matching scenarios, the perceived lane markings were well aligned with the map lanes, with geometric shapes and topological structures remaining largely consistent, indicating that the perception data provided high-confidence support for the map elements. In contrast, incomplete matching occurred when discrepancies were present between the perception results and the map, typically manifested as discontinuous lane markings, local positional deviations, or missing segments. Such cases often arose in areas where the vehicle’s field of view was limited, severe occlusions were present, lighting conditions varied significantly, or the map had already undergone changes.
Under conditions of sufficient lighting and unobstructed views, the proportion of complete matches was the highest. However, in scenarios with skewed vehicle perspectives, heavy traffic, or more complex environments, the probability of incomplete matches increased significantly. Due to the complex geometry of map lanes and the impact of dynamic occlusions on perception, single-vehicle observations often resulted in incomplete matches. Therefore, the accumulation of multi-vehicle observations was required, with probability fusion used to reveal the actual changes in the map. The probability distribution of complete and incomplete matches not only reflected the quality of single-vehicle perception data but also provided a quantitative basis for subsequent change detection based on multi-vehicle fusion.
The matching accuracy between perception data and the HD map directly affected the reliability and effectiveness of map change detection. To this end, this paper quantitatively evaluates the precision and recall of map matching in both simulation and real-world data, as shown in Table 1. Precision reflects the proportion of detected elements that were correctly matched to map features, while recall measures the proportion of existing map elements that were successfully perceived and matched.
The results indicate that the matching precision and recall rate in the simulation environment are higher than in the real-world environment. In the simulation environment, the map matching precision exceeds 95%, and the recall rate exceeds 85%. This is mainly because the lighting conditions and vehicle observation angles are favorable in the simulation environment. In contrast, when vehicles drive on the edge lanes in real-world roads, it becomes difficult to detect lane information at greater distances, leading to a significant decrease in recall rate. Overall, matching precision is influenced by several factors. First, HD maps did not account for road elevation information, causing local projection errors when there is vehicle roll and pitch. Second, errors in camera calibration affect the accuracy of coordinate transformation. Third, the frequency mismatch between the camera and the positioning system leads to temporal misalignment between perception data and the map.

4.3.2. Map Change Evaluation

The simulation and real-world data used in this study both include HD maps before and after updates, with the updated maps considered as ground truth for quantitative evaluation of detection results. To assess the impact of perception data errors on the experimental results, we compared the results of single-vehicle detection with those of multi-vehicle fusion as a form of cross-validation. This comparison was conducted to verify the effectiveness of the probabilistic model proposed in this study.
We first quantify the precision and recall of single-vehicle detection based on both simulation and real-world data, as shown in Table 2. In the real-world data, due to the interference of complex factors such as lighting changes, dynamic traffic flow, and local occlusions, the map change detection precision based on single-vehicle data is 74.5%, with a recall rate of only 52.1%. In the simulation data, the precision slightly increases to 76.3%, but the recall rate remains low at 53.5%. This is primarily due to the significant impact of vehicle perspective limitations and environmental uncertainties on the accuracy and stability of single-vehicle observation data.
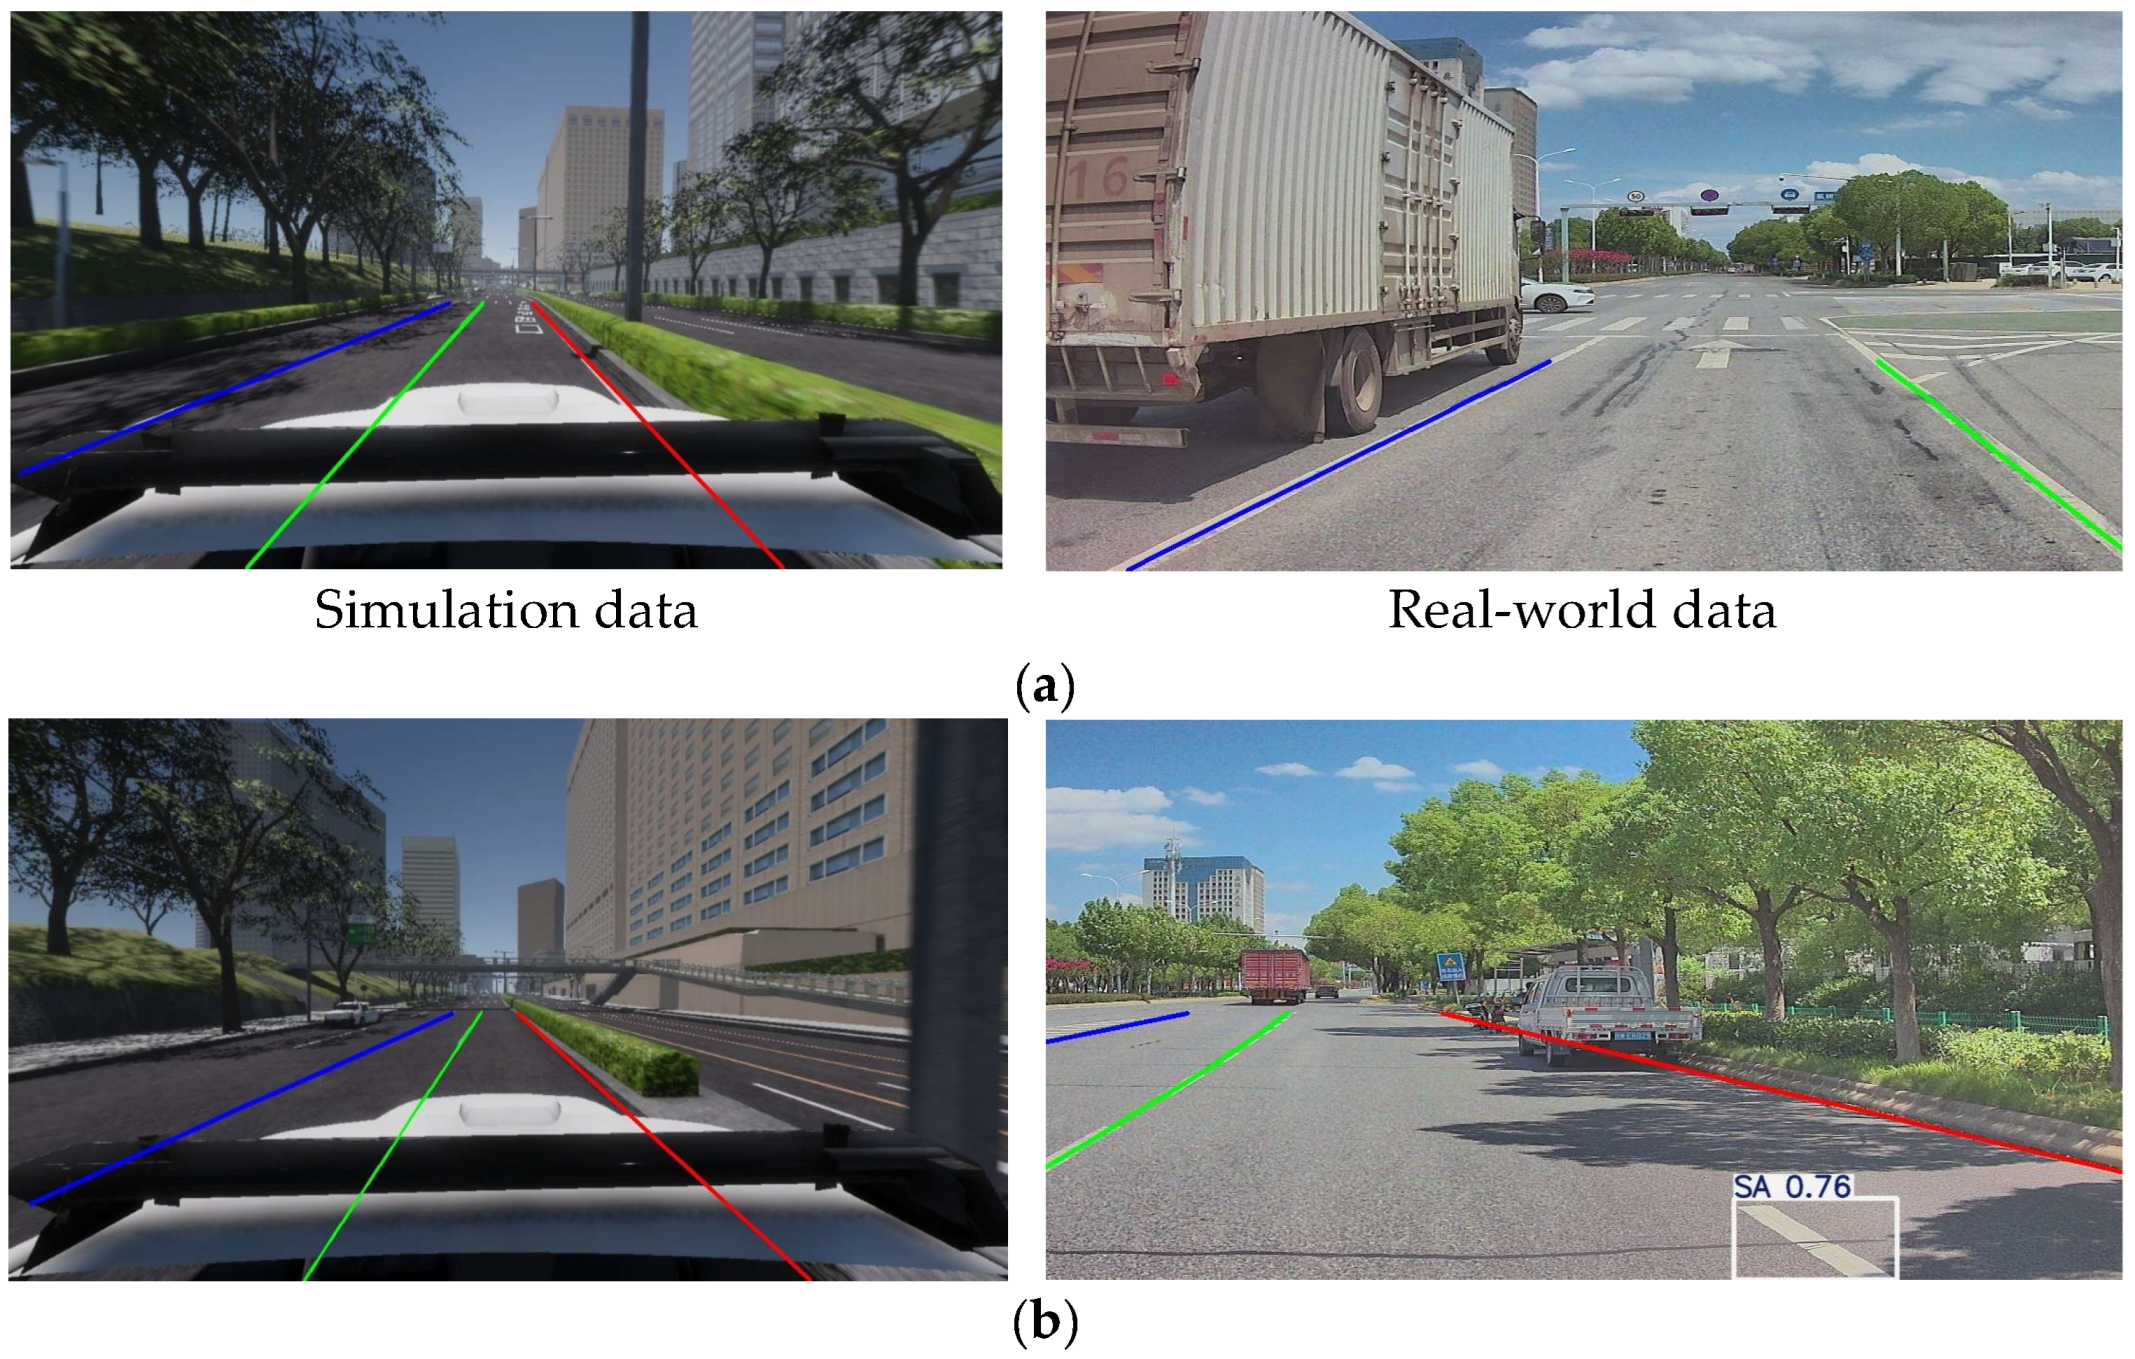
As illustrated in Figure 8a, whether in simulation data or real-world data, when the vehicle is at an oblique angle, or when the road is obstructed by shadows or other vehicles, or even when signs are damaged, lane markings and ground signs are often difficult to clearly identify. This leads to some change areas being missed, resulting in a lower overall recall rate. Single-vehicle detection is also limited by the camera’s field of view, making it difficult to cover global map changes comprehensively. Another part of the detection errors, as shown in Figure 8b, occurs in certain areas where, due to vehicle occlusion, some ground arrows are mis-detected as lane markings, while some short-dashed lines are misidentified as ground arrows, introducing additional false detections. These situations indicate that single-vehicle observations are not only prone to missed detections but also carry a risk of false detections. As a result, the overall detection results are difficult to maintain stable and accurate in complex environments. Therefore, single-vehicle observations cannot ensure the completeness and reliability of map change detection in long-term dynamic scenarios. Considering the uncertainty of multi-source perception information, integrating multi-vehicle observation results is crucial for improving road change detection accuracy, which is essential for the precision of HD maps and the safety of autonomous driving.
To further validate the effectiveness of the probabilistic update model proposed in this study, we compared the results of multi-vehicle data fusion with single-vehicle data. However, during the process of evaluating the probability of map changes using the probabilistic model, the choice of confidence threshold T s significantly impacts whether a map update is triggered. Therefore, selecting an appropriate threshold is crucial for ensuring the robustness of the method in real-world scenarios. To determine the value of T s , we tested several different threshold values (0.7, 0.75, 0.8, 0.85, 0.9, 0.95) and compared them based on precision and recall. The results, as shown in Table 3, indicate that as T s increases, the overall precision gradually improves in both the simulation and real-world scenarios, while recall decreases. When T s = 0.85 , the combined precision and recall reach their maximum values.
Additionally, the results in Table 3 demonstrate that, compared to single-vehicle detection, the probabilistic model proposed in this paper improves both the precision and recall rates of HD map change detection by over 10% through the fusion of multi-vehicle data. This approach mitigates the uncertainties caused by limitations in vehicle perspective and environmental interferences in single-vehicle observations. Multi-vehicle data fusion not only enhances the spatial-temporal coverage but also provides more reliable results by observing the same road features multiple times. For changes detected by only a single vehicle, supplementary observations from other vehicles help eliminate errors caused by missing or biased data from the single vehicle, thereby improving the overall precision of map change detection.
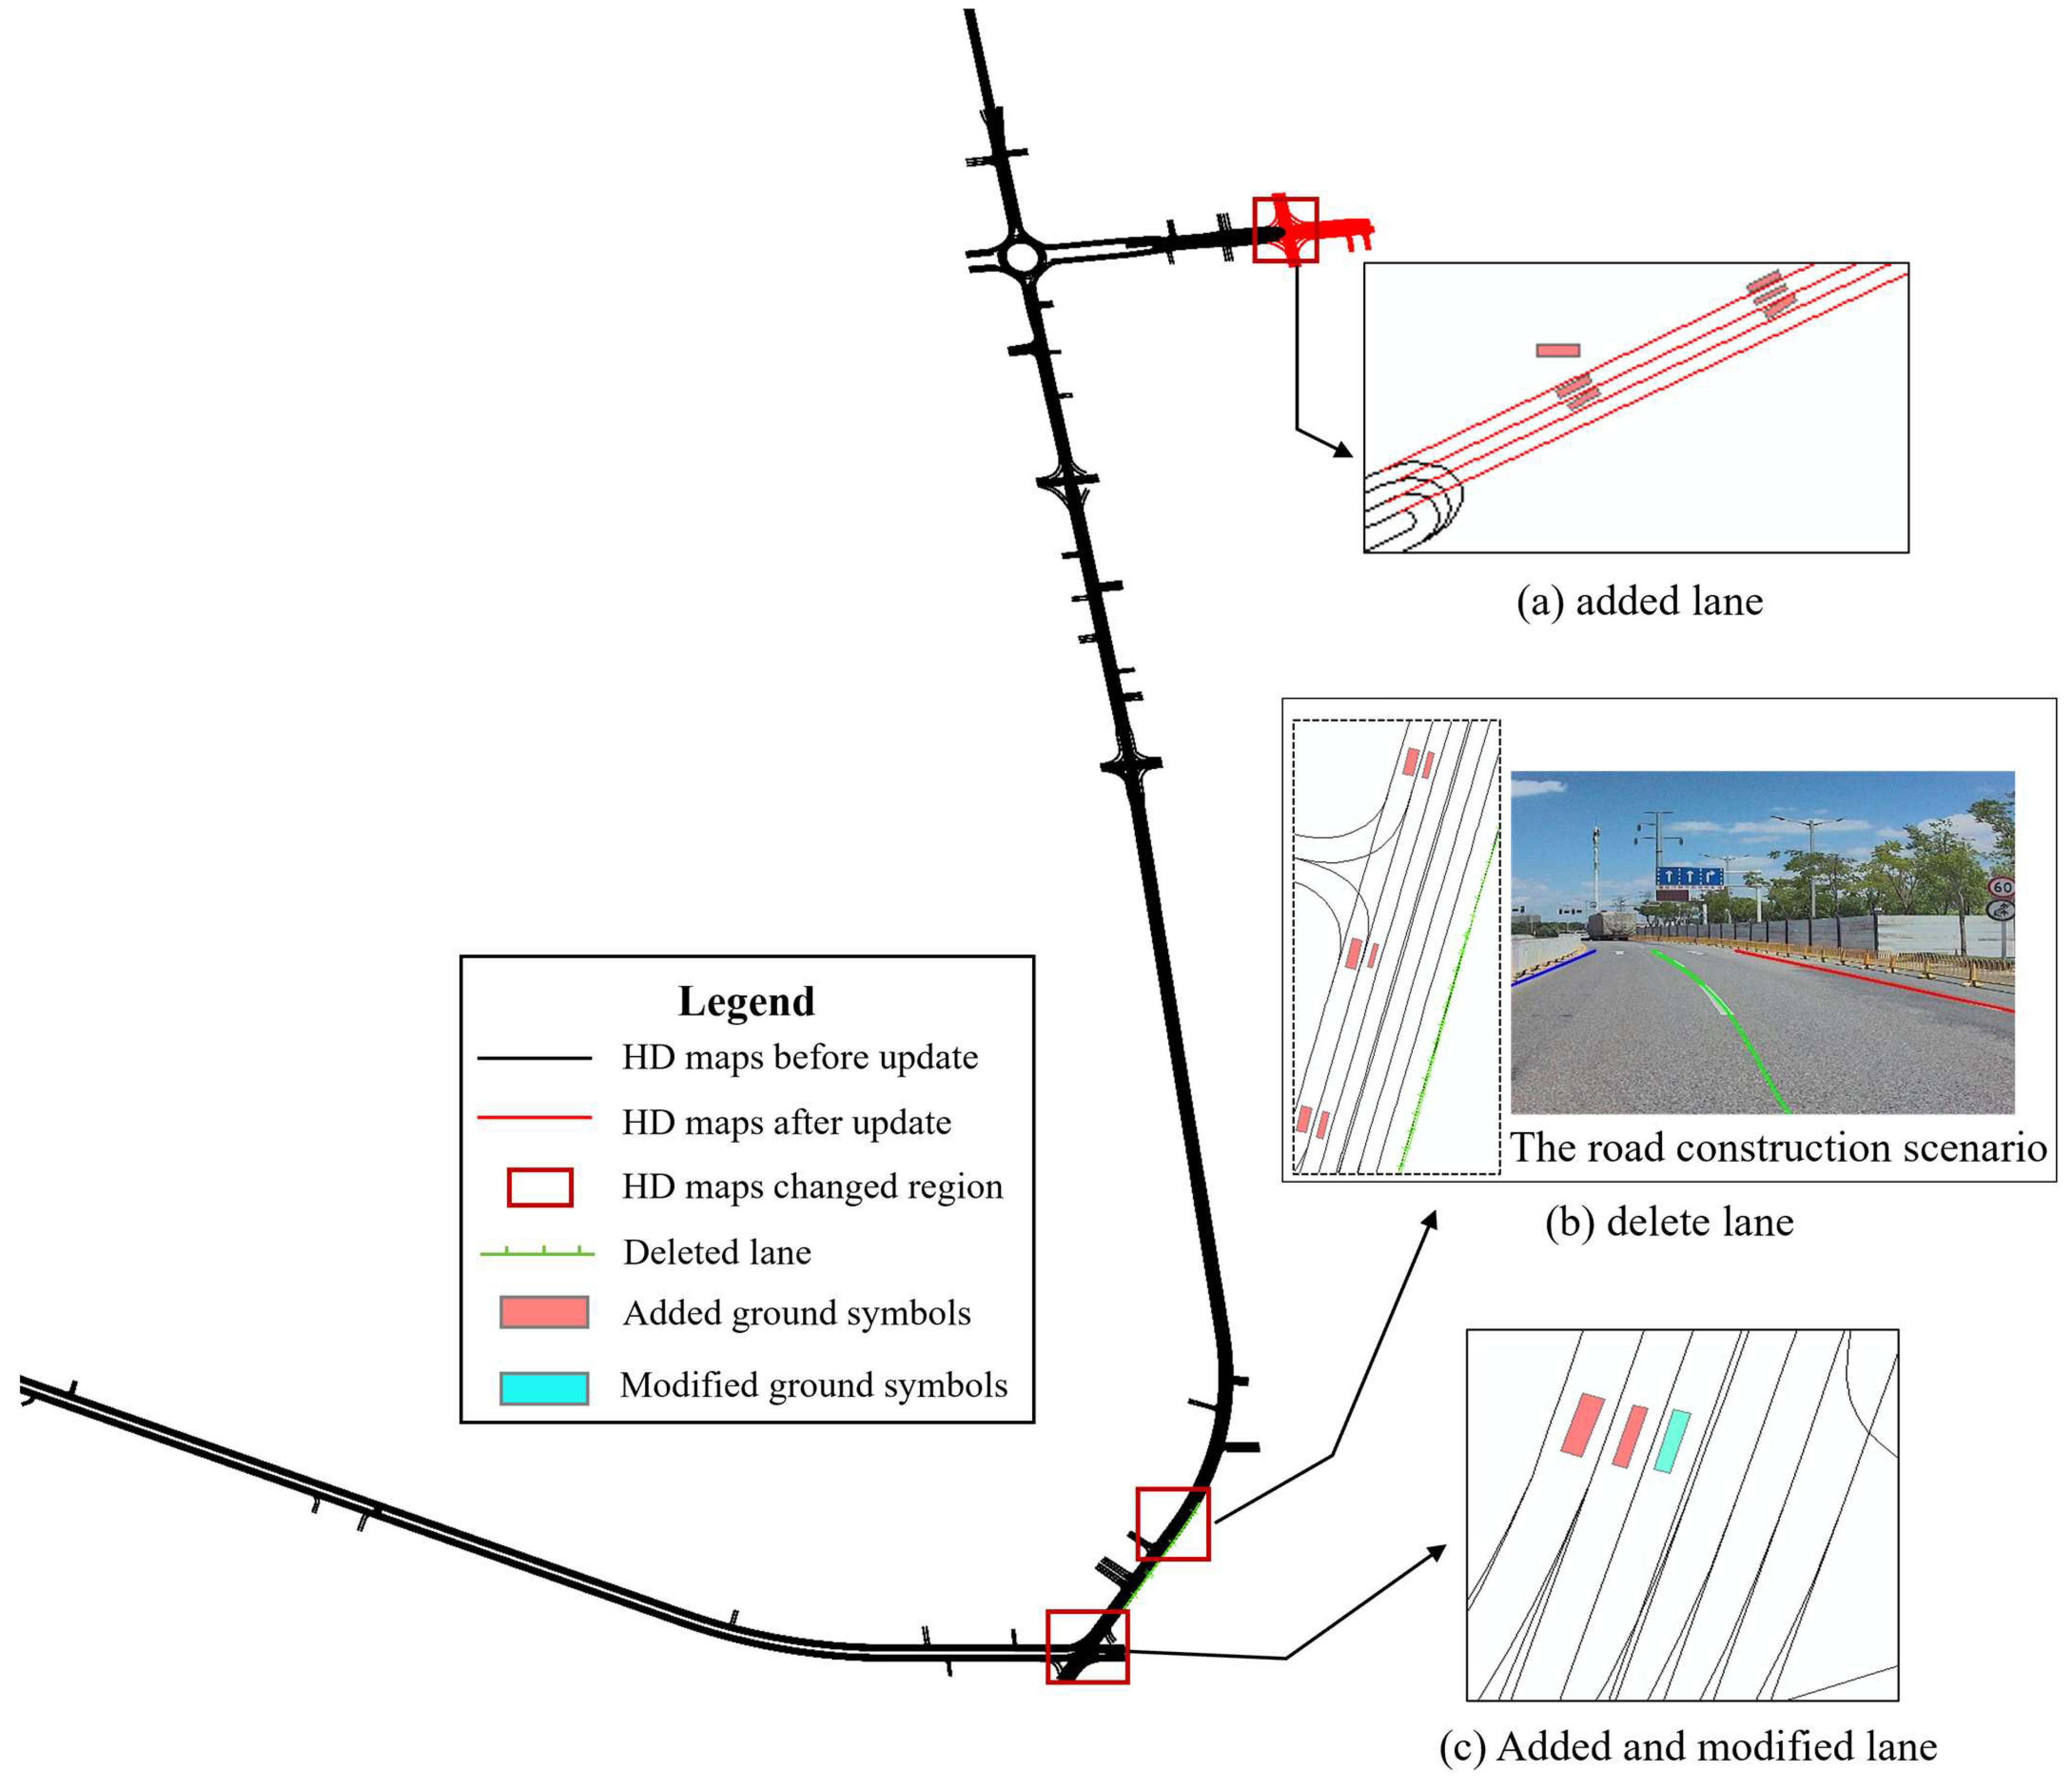
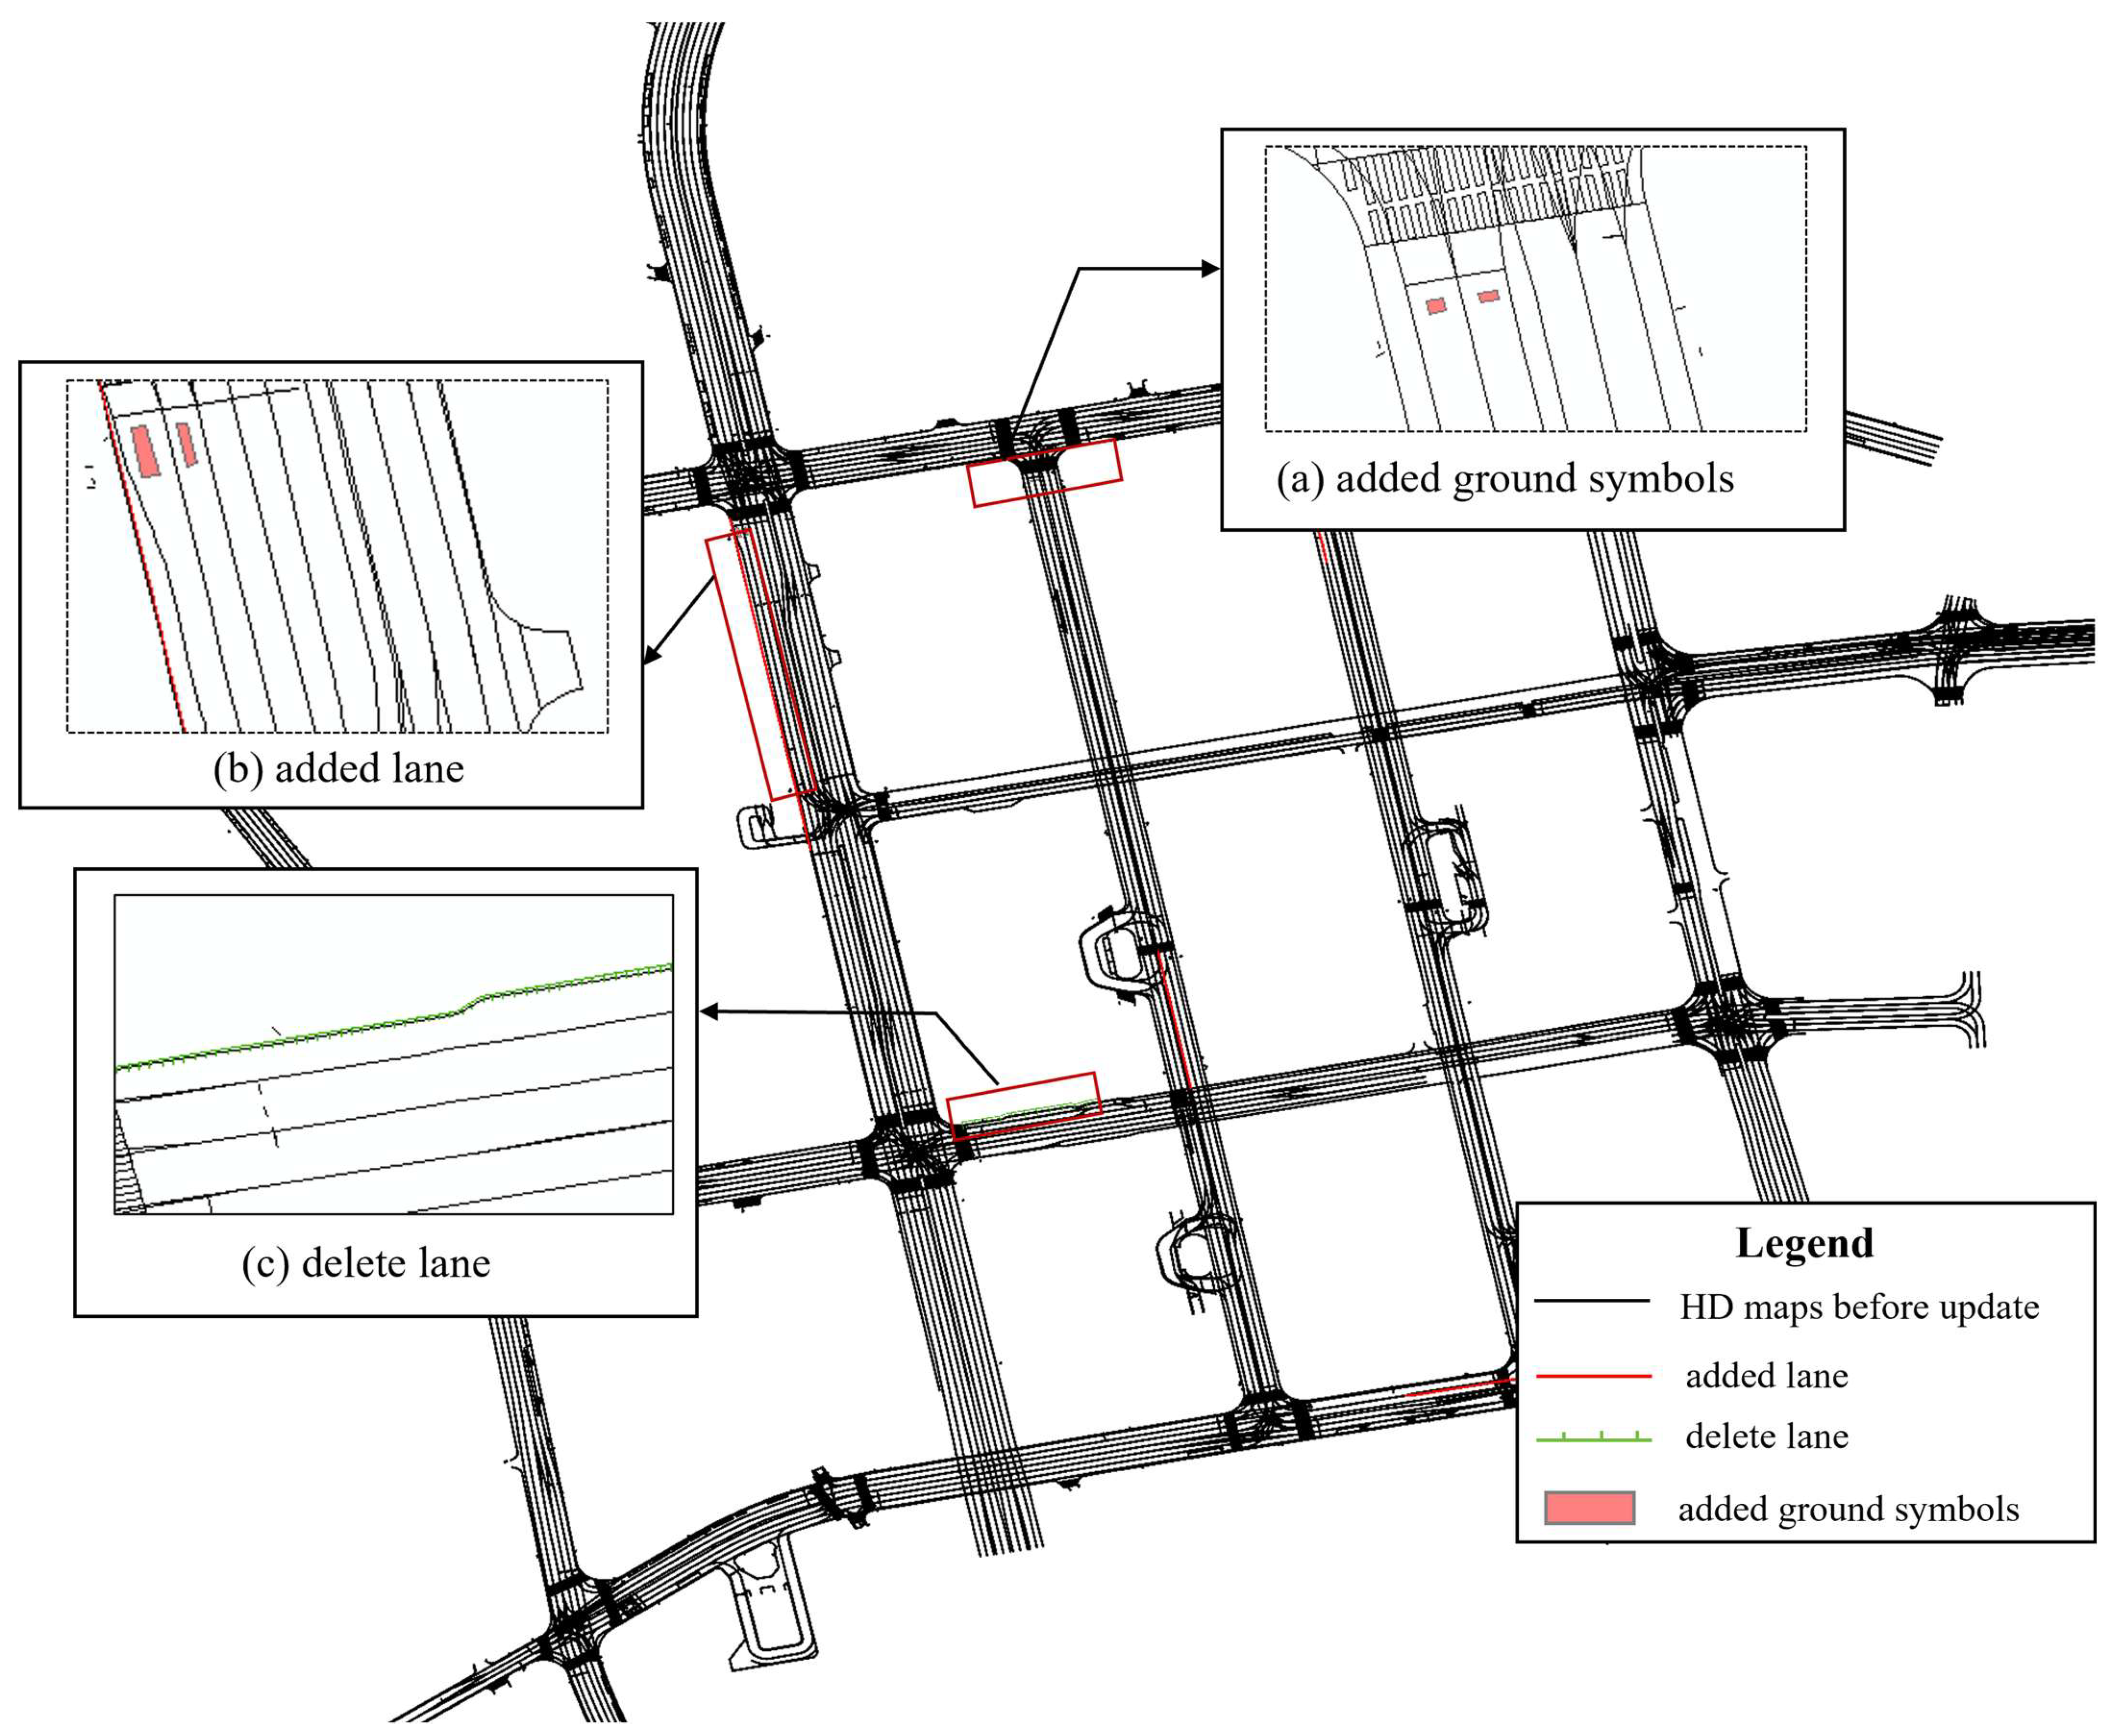
To visually demonstrate the effectiveness of the proposed method in map updating, the detected map changes were visualized, as illustrated in Figure 9 and Figure 10. The experiments covered three typical types of changes: addition, deletion, and modification. The results indicate that, both in simulation and real data, the proposed method can effectively detect regions with newly added lane markings and ground signs. It can also accurately identify areas where lanes are temporarily deleted due to construction (Figure 9b and Figure 10c), as well as areas where ground signs have changed (Figure 9c and Figure 10a). Overall, the visual results confirm that the proposed method not only accurately identifies the newly added lane markings and ground signs but also effectively detects areas with temporarily deleted lanes due to construction and regions with changes in ground signs.

5. Conclusions

This paper proposes an HD map change detection method that considers the uncertainty of multi-source data perception. Based on a hybrid modeling multi-target tracking framework, it achieves accurate identification and tracking of road information in complex environments. By projecting HD maps into the image coordinate system and considering the incompleteness of multi-source perception data, map matching is divided into two categories: complete and incomplete matching. The method combines geometric proximity and shape consistency to enable real-time matching between the HD map and perception data, providing reliable input for map change detection. To address the uncertainty of perception data caused by factors such as vehicle viewpoint, occlusion, and lighting changes in single-vehicle observations, this paper further proposes a probabilistic update model. It introduces multi-vehicle observation fusion probabilities to detect three types of map changes: addition, deletion, and modification. During the experiments, we compared the detection results from multi-vehicle fusion with those from single-vehicle observations. The results show that, compared to single-vehicle data, the proposed probabilistic fusion method improves both precision and recall by over 10%, confirming the robustness and practicality of the proposed probabilistic model in HD map change detection. This further demonstrates the potential of the method in real-world applications, particularly in real-time, large-scale scenarios within intelligent transportation systems.
However, there are some limitations in this study. First, the stability of perception still needs to be improved in complex environments, such as when there is severe vehicle occlusion or when the vehicle viewpoint deviates. Second, the current method mainly focuses on lane markings and ground signs, and the ability to detect changes in other traffic infrastructure (such as guardrails, traffic cones, and traffic lights) has not yet been verified. Future work will focus on optimizing the perception model to improve its robustness in complex environments, especially under low visibility and occlusion conditions. Additionally, the method will be expanded to detect changes in more types of road features. This will include real-time updates of 3D structures and dynamic facilities. Such enhancements will help support the long-term maintenance of HD maps and strengthen the application capabilities of intelligent driving systems.

Author Contributions

Conceptualization, Z.Z. and X.Q.; methodology, B.L. and J.Z. (Jun Zhao); software, Q.L.; validation, X.Q., J.Z. (Jun Zhao) and P.Y.; formal analysis, X.Q.; investigation, J.Z. (Jun Zhao); resources, Z.Z. and P.Y.; data curation, J.Z. (Jun Zhao); writing—original draft preparation, J.Z. (Jian Zhou); visualization, Q.L.; supervision, Z.Z. and X.Q.; project administration, Q.L.; funding acquisition, J.Z. (Jian Zhou). All authors have read and agreed to the published version of the manuscript.

Funding

This research was funded in part by the National Natural Science Foundation of China [Grant Number: 42471480] and in part by Hubei Provincial Natural Science Foundation of China [Grant Number: 2024AFB778].

Data Availability Statement

Dataset available on request from the authors.

Conflicts of Interest

Author Qingjian Li was employed by the company China Dayou Positioning Intelligence Co., Ltd. and author Peng Yin was employed by the company Hexagon Geosystems Co., Ltd. The remaining authors declare that the research was conducted in the absence of any commercial or financial relationships that could be construed as a potential conflict of interest.

Abbreviations

The following abbreviations are used in this manuscript:
HD mapHigh-definition map
SD mapStandard-definition map
MMSMobile mapping systems
SLAMSimultaneous localization and mapping
CNNConvolutional neural network

References

  1. Jia, Z.; Yin, J.; Cao, Z.; Wei, N.; Jiang, Z.; Zhang, Y.; Wu, L.; Zhang, Q.; Mao, H. Sustainable Transportation Emission Reduction through intelligent transportation systems: Mitigation drivers, and temporal trends. Environ. Impact Assess. Rev. 2025, 112, 107767. [Google Scholar] [CrossRef]
  2. Cao, B.; Li, L.; Zhang, K.; Ma, W. The influence of digital intelligence transformation on carbon emission reduction in manufacturing firms. J. Environ. Manag. 2024, 367, 121987. [Google Scholar] [CrossRef] [PubMed]
  3. Panagiotopoulos, I.; Dimitrakopoulos, G. An empirical investigation on consumers’ intentions towards autonomous driving. Transp. Res. Part C Emerg. Technol. 2018, 95, 773–784. [Google Scholar] [CrossRef]
  4. Cao, Y.; Sun, H.; Li, G.; Sun, C.; Li, H.; Yang, J.; Tian, L.; Li, F. Multi-Environment Vehicle Trajectory Automatic Driving Scene Generation Method Based on Simulation and Real Vehicle Testing. Electronics 2025, 14, 1000. [Google Scholar] [CrossRef]
  5. Wu, F.; Sun, C.; Li, H.; Zheng, S. Real-Time Center of Gravity Estimation for Intelligent Connected Vehicle Based on HEKF-EKF. Electronics 2023, 12, 386. [Google Scholar] [CrossRef]
  6. Wen, J.; Tang, J.; Liu, H.; Qian, C.; Fan, X. Real-Time Scan-to-Map Matching Localization System Based on Lightweight Pre-Built Occupancy High-Definition Map. Remote Sens. 2023, 15, 595. [Google Scholar] [CrossRef]
  7. Bao, Z.; Hossain, S.; Lang, H.; Lin, X. High-Definition Map Generation Technologies for Autonomous Driving. arXiv 2022, arXiv:2206.05400. [Google Scholar] [CrossRef]
  8. Guo, Y.; Zhou, J.; Li, X.; Tang, Y.; Lv, Z. A Review of Crowdsourcing Update Methods for High-Definition Maps. ISPRS Int. J. Geo-Inf. 2024, 13, 104. [Google Scholar] [CrossRef]
  9. Guo, Y.; Zhou, J.; Dong, Q.; Bian, Y.; Li, Z.; Xiao, J. A lane-level localization method via the lateral displacement estimation model on expressway. Expert. Syst. Appl. 2024, 243, 122848. [Google Scholar] [CrossRef]
  10. Liu, R.; Wang, J.; Zhang, B. High Definition Map for Automated Driving: Overview and Analysis. J. Navig. 2020, 73, 324–341. [Google Scholar] [CrossRef]
  11. Elghazaly, G.; Frank, R.; Harvey, S.; Safko, S. High-Definition Maps: Comprehensive Survey, Challenges, and Future Perspectives. IEEE Open J. Intell. Transp. Syst. 2023, 4, 527–550. [Google Scholar] [CrossRef]
  12. Guo, Y.; Zhou, J.; Dong, Q.; Li, B.; Xiao, J.; Li, Z. Refined high-definition map model for roadside rest area. Transp. Res. Part A Policy Pract. 2025, 195, 104463. [Google Scholar] [CrossRef]
  13. Li, M.; Li, G.; Sun, C.; Yang, J.; Li, H.; Li, J.; Li, F. A Shared-Road-Rights Driving Strategy Based on Resolution Guidance for Right-of-Way Conflicts. Electronics 2024, 13, 3214. [Google Scholar] [CrossRef]
  14. Zhang, F.; Shi, W.; Chen, M.; Huang, W.; Liu, X. Open HD map service model: An interoperable high-definition map data model for autonomous driving. Int. J. Digit. Earth 2023, 16, 2089–2110. [Google Scholar] [CrossRef]
  15. Pannen, D.; Liebner, M.; Hempel, W.; Burgard, W. How to Keep HD Maps for Automated Driving Up to Date. In Proceedings of the 2020 IEEE International Conference on Robotics and Automation (ICRA), Paris, France, 31 May–31 August 2020; pp. 2288–2294. [Google Scholar] [CrossRef]
  16. Kim, K.; Cho, S.; Chung, W. HD Map Update for Autonomous Driving with Crowdsourced Data. IEEE Robot. Autom. Lett. 2021, 6, 1895–1901. [Google Scholar] [CrossRef]
  17. Xu, Z.; Liu, Y.; Sun, Y.; Liu, M.; Wang, L. CenterLineDet: CenterLine Graph Detection for Road Lanes with Vehicle-Mounted Sensors by Transformer for HD Map Generation. In Proceedings of the 2023 IEEE International Conference on Robotics and Automation (ICRA), London, UK, 29 May–2 June 2023; pp. 3553–3559. [Google Scholar] [CrossRef]
  18. Zhou, J.; Guo, Y.; Bian, Y.; Huang, Y.; Li, B. Lane Information Extraction for High Definition Maps Using Crowdsourced Data. IEEE Trans. Intell. Transp. Syst. 2022, 24, 7780–7790. [Google Scholar] [CrossRef]
  19. Liebner, M.; Jain, D.; Schauseil, J.; Pannen, D.; Hackelöer, A. Crowdsourced HD Map Patches Based on Road Model Inference and Graph-Based SLAM. In Proceedings of the 2019 IEEE Intelligent Vehicles Symposium (IV), Paris, France, 9–12 June 2019; pp. 1211–1218. [Google Scholar] [CrossRef]
  20. Qin, T.; Huang, H.; Wang, Z.; Chen, T.; Ding, W. Traffic Flow-Based Crowdsourced Mapping in Complex Urban Scenario. IEEE Robot. Autom. Lett. 2023, 8, 5077–5083. [Google Scholar] [CrossRef]
  21. Redondo, J.; Yuan, Z.; Aslam, N. Enhancement of High-Definition Map Update Service Through Coverage-Aware and Reinforcement Learning. arXiv 2024, arXiv:2402.14582. [Google Scholar] [CrossRef]
  22. Wei, Y.; Mahnaz, F.; Bulan, O.; Mengistu, Y.; Mahesh, S.; Losh, M.A. Creating Semantic HD Maps from Aerial Imagery and Aggregated Vehicle Telemetry for Autonomous Vehicles. IEEE Trans. Intell. Transport. Syst. 2022, 23, 15382–15395. [Google Scholar] [CrossRef]
  23. Wijaya, B.; Yang, M.; Wen, T.; Jiang, K.; Wang, Y.; Fu, Z.; Tang, X.; Sigomo, D.O.; Miao, J.; Yang, D. Multi-Session High-Definition Map-Monitoring System for Map Update. ISPRS Int. J. Geo-Inf. 2024, 13, 6. [Google Scholar] [CrossRef]
  24. Zhang, P.; Zhang, M.; Liu, J. Real-Time HD Map Change Detection for Crowdsourcing Update Based on Mid-to-High-End Sensors. Sensors 2021, 21, 2477. [Google Scholar] [CrossRef]
  25. Dong, H.; Zhang, X.; Xu, J.; Ai, R.; Gu, W.; Lu, H.; Kannala, J.; Chen, X. SuperFusion: Multilevel LiDAR-Camera Fusion for Long-Range HD Map Generation. arXiv 2023, arXiv:2211.15656. [Google Scholar] [CrossRef]
  26. Wang, X.; Li, H.; Hu, M.; Dou, Q.; Ouyang, W.; Ma, G.; Li, Y.; Qin, H. HD Map Construction and Update System for Autonomous Driving in Open-Pit Mines. IEEE Syst. J. 2023, 17, 6202–6213. [Google Scholar] [CrossRef]
  27. Fischer, P.; Azimi, S.M.; Roschlaub, R.; Krauß, T. Towards HD Maps from Aerial Imagery: Robust Lane Marking Segmentation Using Country-Scale Imagery. ISPRS Int. J. Geo-Inf. 2018, 7, 458. [Google Scholar] [CrossRef]
  28. Lagahit, M.L.R.; Liu, X.; Xiu, H.; Kim, T.; Kim, K.-S.; Matsuoka, M. Learnable Resized and Laplacian-Filtered U-Net: Better Road Marking Extraction and Classification on Sparse-Point-Cloud-Derived Imagery. Remote Sens. 2024, 16, 4592. [Google Scholar] [CrossRef]
  29. Gao, W.; Fu, J.; Shen, Y.; Jing, H.; Chen, S.; Zheng, N. Complementing Onboard Sensors with Satellite Maps: A New Perspective for HD Map Construction. In Proceedings of the 2024 IEEE International Conference on Robotics and Automation (ICRA), Yokohama, Japan, 13–17 May 2024; pp. 11103–11109. [Google Scholar] [CrossRef]
  30. Heo, M.; Kim, J.; Kim, S. HD Map Change Detection with Cross-Domain Deep Metric Learning. In Proceedings of the 2020 IEEE/RSJ International Conference on Intelligent Robots and Systems (IROS), Las Vegas, NV, USA, 24 October 2020–24 January 2021; pp. 10218–10224. [Google Scholar] [CrossRef]
  31. Bathla, G.; Bhadane, K.; Singh, R.K.; Kumar, R.; Aluvalu, R.; Krishnamurthi, R.; Kumar, A.; Thakur, R.N.; Basheer, S. Autonomous Vehicles and Intelligent Automation: Applications, Challenges, and Opportunities. Mob. Inf. Syst. 2022, 2022, e7632892. [Google Scholar] [CrossRef]
  32. Kim, C.; Cho, S.; Sunwoo, M.; Resende, P.; Bradaï, B.; Jo, K. Cloud Update of Geodetic Normal Distribution Map Based on Crowd-Sourcing Detection against Road Environment Changes. J. Adv. Transp. 2022, 2022, e4486177. [Google Scholar] [CrossRef]
  33. Ye, C.; Zhao, H.; Ma, L.; Jiang, H.; Li, H.; Wang, R.; Chapman, M.A.; Junior, J.M.; Li, J. Robust Lane Extraction from MLS Point Clouds Towards HD Maps Especially in Curve Road. IEEE Trans. Intell. Transp. Syst. 2022, 23, 1505–1518. [Google Scholar] [CrossRef]
  34. Xiong, H.; Zhu, T.; Liu, Y.; Pan, Y.; Wu, S.; Chen, L. Road-Model-Based Road Boundary Extraction for High Definition Map via LIDAR. IEEE Trans. Intell. Transp. Syst. 2022, 23, 18456–18465. [Google Scholar] [CrossRef]
  35. Hui, N.; Jiang, Z.; Cai, Z.; Ying, S. Vision-HD: Road change detection and registration using images and high-definition maps. Int. J. Geogr. Inf. Sci. 2024, 38, 454–477. [Google Scholar] [CrossRef]
  36. Li, Q.; Wang, Y.; Wang, Y.; Zhao, H. HDMapNet: An Online HD Map Construction and Evaluation Framework. In Proceedings of the 2022 International Conference on Robotics and Automation (ICRA), Philadelphia, PA, USA, 23–27 May 2022; pp. 4628–4634. [Google Scholar] [CrossRef]
  37. Liu, Y.; Yuan, Y.; Wang, Y.; Wang, Y.; Zhao, H. VectorMapNet: End-to-End Vectorized HD Map Learning. arXiv 2023, arXiv:2206.08920. [Google Scholar] [CrossRef]
  38. Lambert, J.; Carballo, A.; Cano, A.M.; Narksri, P.; Wong, D.; Takeuchi, E.; Takeda, K. Performance Analysis of 10 Models of 3D LiDARs for Automated Driving. IEEE Access 2020, 8, 131699–131722. [Google Scholar] [CrossRef]
  39. Zheng, T.; Huang, Y.; Liu, Y.; Tang, W.; Yang, Z.; Cai, D.; He, X. CLRNet: Cross Layer Refinement Network for Lane Detection. In Proceedings of the IEEE/CVF Conference on Computer Vision and Pattern Recognition, New Orleans, LA, USA, 19–24 June 2022; pp. 898–907. Available online: https://openaccess.thecvf.com/content/CVPR2022/html/Zheng_CLRNet_Cross_Layer_Refinement_Network_for_Lane_Detection_CVPR_2022_paper.html (accessed on 5 December 2022).
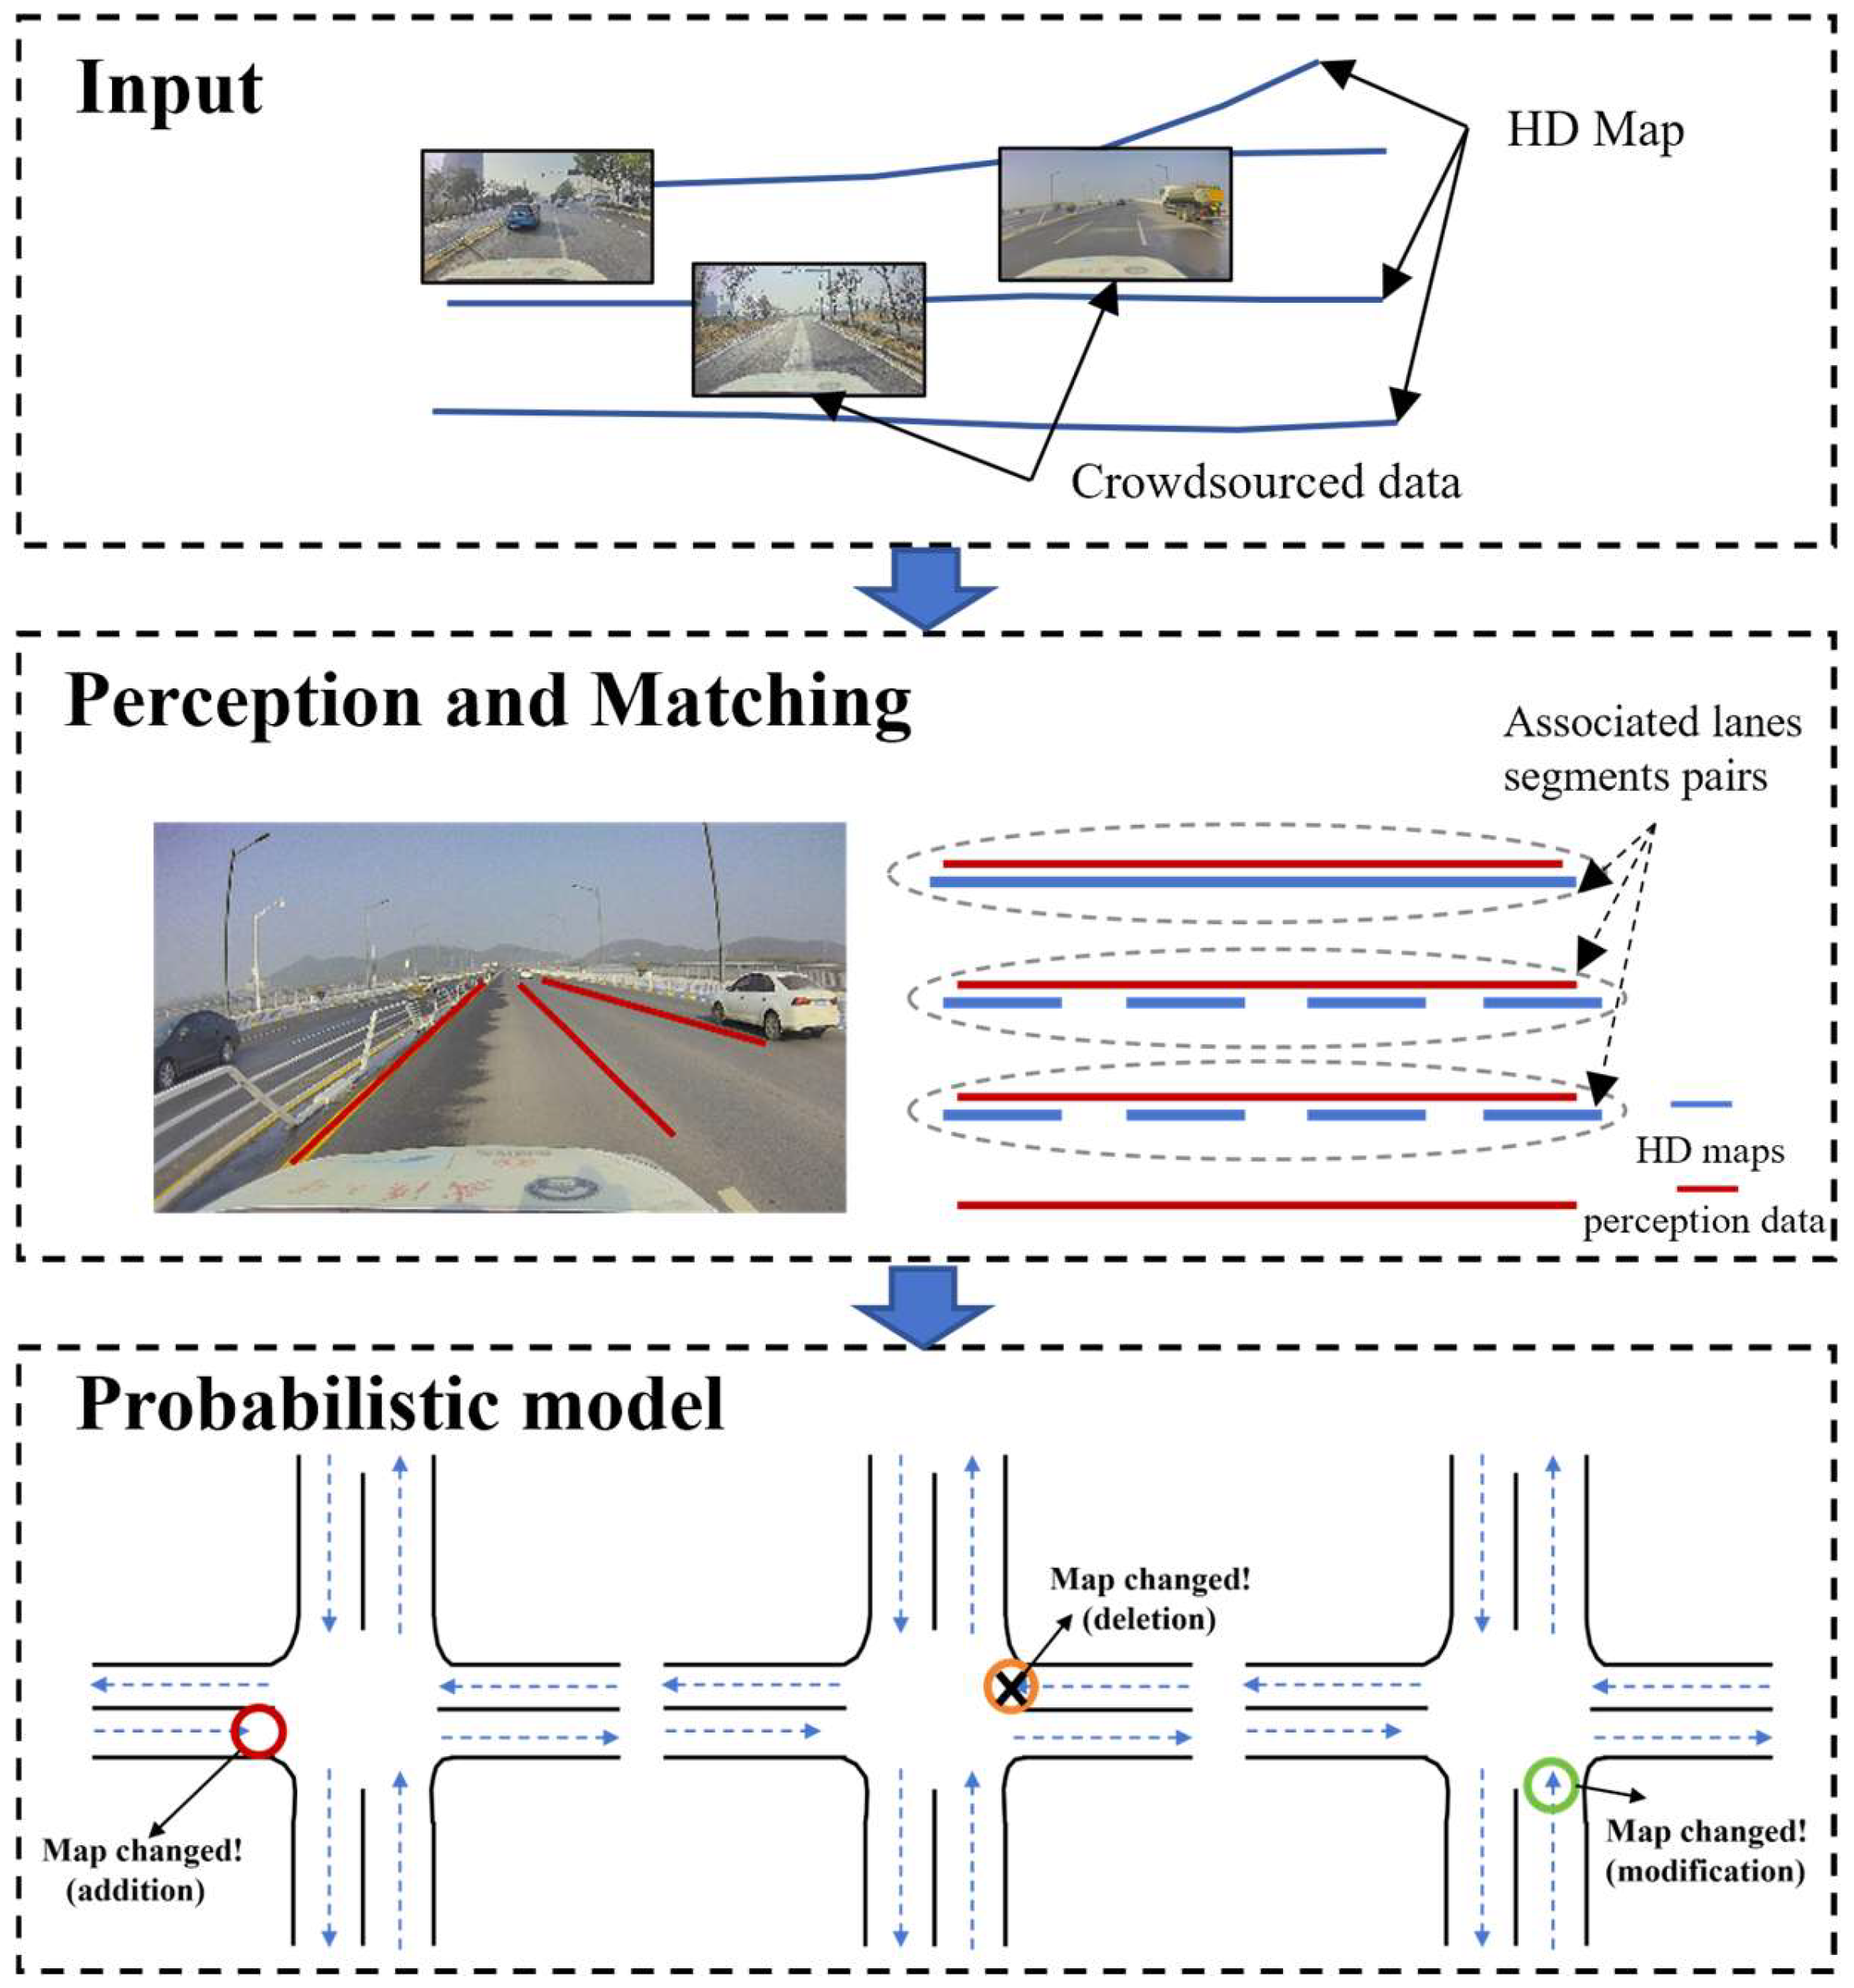
Figure 1. Framework of the proposed method.
Machines 13 01080 g001
Figure 2. Overall architecture of the road information perception network.
Machines 13 01080 g002
Figure 3. Diagram of lane information matching. (a) Schematic of candidate lane search; (b) schematic of complete matching; (c) schematic of incomplete matching.
Machines 13 01080 g003
Figure 4. Illustration of the simulation area dataset. (a) HD map of the simulation area; (b) multi-sourced simulation vehicle.
Machines 13 01080 g004
Figure 5. Experimental area and roads in the Wuhan Intelligent and Connected Vehicle Demonstration Zone. (a) Illustration of the experimental area and road network; (b) Comparison between the 2023 version and the 2025 version of the HD map for the test roads; (c) multi-sourced experimental vehicle.
Machines 13 01080 g005
Figure 6. Visualization results of road information perception. The first row shows the raw data, and the second row shows the detection results. (a) Normal scene; (b) scene with severe illumination changes; (c) backlight scene; (d) shadowed scene. Lines of different colors represent lane markings from different lanes.
Machines 13 01080 g006
Figure 7. Visualization results of complete matching and incomplete matching.
Machines 13 01080 g007
Figure 8. Missed and incorrect detections of ground markings. (a) Missed detections caused by skewed vehicle perspective, road shadows, and occlusions from other vehicles; (b) Examples of false detections of ground markings. Lines of different colors represent lane markings from different lanes.
Machines 13 01080 g008
Figure 9. Visualization results of road change detection in real-world scenarios. (a), (b), and (c) illustrate scenarios of lane addition, lane deletion, and lane modification, respectively. In (b), lines of different colors represent lane markings from different lanes.
Machines 13 01080 g009
Figure 10. Visualization results of road change detection in simulation scenarios.
Machines 13 01080 g010
Table 1. The precision and recall of the matching results.
PrecisionRecall
Simulation95.1%85.2%
Real-world91.1%76.3%
Table 2. The precision and recall of the map change result of single-vehicle detection.
PrecisionRecall
Simulation76.3%53.5%
Real-world74.5%52.1%
Table 3. The precision and recall of the map change result of multi-vehicle detection with different Ts.
T S 0.70.750.80.850.90.95
SimuRealSimuRealSimuRealSimuRealSimuRealSimuReal
precision0.8020.7510.8290.7730.8620.8320.8830.8530.8850.8560.8860.859
recall0.8270.8240.8080.8020.7910.7570.7820.7420.7560.7310.7450.719
Disclaimer/Publisher’s Note: The statements, opinions and data contained in all publications are solely those of the individual author(s) and contributor(s) and not of MDPI and/or the editor(s). MDPI and/or the editor(s) disclaim responsibility for any injury to people or property resulting from any ideas, methods, instructions or products referred to in the content.