Article

Research Based on a Fuzzy Algorithm for Energy Saving Single-Phased Powered Pumps

1
College of General Aviation and Flight, Nanjing University of Aeronautics and Astronautics, Nanjing 211106, China
2
Nanjing Watt Electric Motors Corporation, Nanjing 211200, China
*
Authors to whom correspondence should be addressed.
Machines 2025, 13(11), 1070; https://doi.org/10.3390/machines13111070
Submission received: 24 September 2025 / Revised: 7 November 2025 / Accepted: 15 November 2025 / Published: 20 November 2025
(This article belongs to the Section Automation and Control Systems)

Abstract

Water pumps consume roughly 20% of global electricity, yet 60–70% of pumps operate below optimal efficiency, leading to substantial energy waste. Improving pump efficiency is therefore critical. A major contributor to these losses is the low efficiency of the driving motor at reduced speeds and the lack of variable-speed capability—especially in single-phase pumps. This paper presents a fuzzy-logic–FOC (field oriented control) permanent magnet synchronous motor (PMSM) pump system that can run on either three-phase or single-phase power. The system maintains high efficiency across a wide speed range and saves energy not only through variable-speed operation but also via an intelligent control strategy termed “constant flow, variable pressure.” To assess performance, we conducted experiments comparing the proposed fuzzy-logic FOC controlled PMSM pump and a conventional AC asynchronous induction motor pump. The results show that the new system overcomes the inherent lack of speed regulation in traditional single-phase pumps and significantly improves efficiency across diverse operating conditions. Moreover, by implementing the “constant flow, variable pressure” strategy, the system achieves average energy savings estimated at 30–50% compared with a conventional AC asynchronous motor-driven pump.

1. Introduction

According to global energy consumption statistics, pumps account for approximately 20% of the world’s total electricity usage [1]. Pumps are widely used across various sectors, including water supply, HVAC (heating, ventilation, and air conditioning), petrochemicals, water distribution, drainage, and civil infrastructure. Despite their widespread application, the energy efficiency of pumps remains generally low, leading to significant energy waste. Research indicates that approximately 60% to 70% of pumps worldwide do not operate at optimal efficiency, with inefficiencies exceeding 80% in some sectors. To enhance pump efficiency, the use of variable frequency drive (VFD) technology has emerged as the most popular method. VFDs adjust pump speed to match actual water demand, improving energy use.
Numerous studies have explored the potential of VFDs to enhance pump efficiency. For instance, Ahmed et al. [2] investigated the improvement of energy efficiency and economic performance in motor-pump systems using electric variable-speed drives. Luo et al. [3] proposed an energy-saving operational control model for centrifugal pump systems using a single inverter to control multi-type configurations. Yimchoy and Supatti [4] designed and implemented a motor control system using programmable logic controllers (PLCs) with variable-speed drivers to reduce energy and water loss in water supply pumps. Rakibuzzaman et al. [5] examined the implementation of a variable-speed drive system with inverter control in variable flow and pressure systems to save energy and enhance pumping performance.
Additionally, Zhu [6], Ding [7], and Gao [8] developed constant pressure water supply systems using inverter control to save energy, while Wang [9] studied efficiency degradation detection in pump systems with VFDs. Su et al. [10] designed a variable frequency constant pressure control system for closed system pumps used in marine vessels. Further research by Zhu [11], Mo [12], Li [13], Yu [14], Wang et al. [15], and Shankar et al. [16] focused on controlling water flow and pressure through motor speed regulation to achieve energy-saving operations in pumps.
These studies primarily aim to enhance pump performance for energy savings. However, with advancements in control technologies, there has been increasing interest in using smart pump control systems to improve energy efficiency. Shankar et al. [17] explored fuzzy speed control of induction motors for centrifugal pumps, while Shen et al. [18] investigated fuzzy control in constant pressure water supply systems. Ramadhan and Fang [19] examined the enhancement of energy-efficient water pumping using advanced fuzzy logic and PID controllers. Yang et al. [20] employed adaptive fuzzy PID control for high-speed on-off valve position control systems used in water hydraulic manipulators. Pruna et al. [21] focused on model predictive control (MPC), proposing a robust optimization method similar to fuzzy logic to handle uncertainty, emphasizing coordinated scheduling and start–stop optimization of multiple pumps for energy savings. Wang et al. [22] combined a radial basis function (RBF) neural network with a conventional PID controller to form an intelligent composite controller. This approach utilizes the online identification capability of the RBF network for real-time PID parameter self-tuning, achieving precise control and energy conservation under complex operating conditions. Bouchakour et al. [23] proposed a serial hybrid PSO-GA (particle swarm optimization-genetic algorithm)-PID controller, which uses GA for global exploration and then applies PSO for fine-tuning, optimizing PID parameters for precise control and energy savings in water pump systems.
These advancements represent a shift from conventional VFD control towards integrating fuzzy algorithms, RBF networks, and PSO-GA. However, all these methods, whether VFD or VFD combined with control algorithms, are limited by the inherent efficiency characteristics of AC asynchronous motors, particularly at low speeds. While variable-speed drive systems are a primary means of improving pump efficiency, pumps powered by three-phase asynchronous induction motors benefit from readily available variable-speed control via VFDs. However, for pumps powered by single-phase asynchronous motors, VFD control is less effective due to the design characteristics of these motors. Single-phase motors rely on a main and auxiliary winding, along with a capacitor to create a “pseudo two-phase” supply, which becomes imbalanced when the frequency is altered, leading to reduced starting torque, increased heating, and higher vibration. Moreover, many single-phase motor types, such as capacitor-start induction-run (CSIR) and capacitor-start capacitor-run (CSCR) motors, employ centrifugal switches that can malfunction under low-frequency soft-starting, leading to current spikes and stressing both the motor and the drive.
This paper proposes a new pump system using a fuzzy-logic and field oriented control (FOC) controlled permanent magnet synchronous motor (PMSM) to replace both single-phase and three-phase motor-driven pumps. The PMSM requires an electronic drive and integrates a driver with a front-end power stage to supply a consistent 300 V DC to the inverter that energizes the PMSM windings. This front-end stage can accept either single-phase or three-phase AC input while ensuring steady operation of the PMSM. The PMSM offers a solution to the low efficiency problem of speed-regulated AC asynchronous motors. The FOC enables precise control and feedback adjustment for optimal pump performance.
The proposed pump system operates under a new model of constant water flow, variable pressures, replacing the traditional constant pressure approach. This model reduces energy waste by adjusting pump operation based on actual water flow demand, rather than maintaining unnecessary pressure. Two practical prototypes were developed: one with PMSM under fuzzy-logic FOC control, and another with a conventional AC asynchronous motor. Experimental testing of both prototypes showed that the fuzzy-logic FOC controlled PMSM pump delivered significantly higher energy efficiency.
Research indicates that 60–70% of pumps worldwide operate below optimal efficiency, with some sectors exceeding 80%. Pumps account for more than 20% of global electricity consumption, highlighting the importance of improving pump efficiency [1].

2. The Pump System

A pump system normally consists of a mechanical pump and a power driving source. The pump’s mechanical body cannot work by itself; it is driven by a motor that we call the power driving source.

2.1. Pumps

A pump is a device that converts mechanical energy into the kinetic or pressure energy of a liquid through mechanical action. Pumps are primarily used for transporting liquids (such as water, oil, and chemicals). As the core equipment for fluid transmission, pumps play a crucial role in industrial, agricultural, municipal, and civilian sectors.
Pumps are classified according to their different physical structures, which have variable efficiency. A pump’s efficiency is determined by its physical structure, the driving motor’s efficiency, and the working model.

2.1.1. Pumps’ Mechanical Characteristics

The relationship between the resisting torque T and the rotational speed n of a pump impeller is expressed as:
T =   K r n 2
where Kr is the motor torque constant, normally united by kg·cm or N·cm.
The relationship between the loading power P and pump impeller speed n is expressed as:
P = K r n 3 9550 = K p n 3
where Kp is the loading power constant. P’s unit is KW. T’s unit is kg·cm or N·cm. N’s unit is RPM (rotation per minute). Kr’s unit is kg·cm or N·cm
In fact, friction torque exists in the motor at all times, so for the motor’s output shaft, there will be a loss of torque and power dissipation under no-load conditions, but it can be ignored as it is quite small. Equation (3) shows the relationship between water flow volume, water head, and shaft power within the speed range of the pump impeller:
Q / Q n = n / n N
H / H n = ( n / n N ) 2
P / P n = ( n / n N ) 3
where n N is the rated speed; n is the working speed. Q n is the water flow volume when speed is n N ; Q is the water flow volume when speed is n . H n is the water head when speed is n . P n is the water head when speed is n N ; P is the power when speed is n .
Equation (3) shows the pump’s water flow is proportional to the pump’s driven motor speed.
Equation (4) shows the head of the water pump is proportional to the square of the pump motor speed.
Equation (5) shows the power of the pump is directly proportional to the cube of the pump motor speed.
So, when the pump motor speed decreases, the energy consumed by the pump decreases rapidly at a cubic rate. For example, when the pump’s output flow rate drops to 70% of its full capacity, the motor speed also drops to 70% of its original speed, the pressure decreases to 49%, and the pump power consumption decreases to 34.3% of its original value. This suggests that if the pump could adjust its power according to the water flow rate changing, the pump could significantly reduce power consumption.

2.1.2. The Energy Saving Principle of Pumps

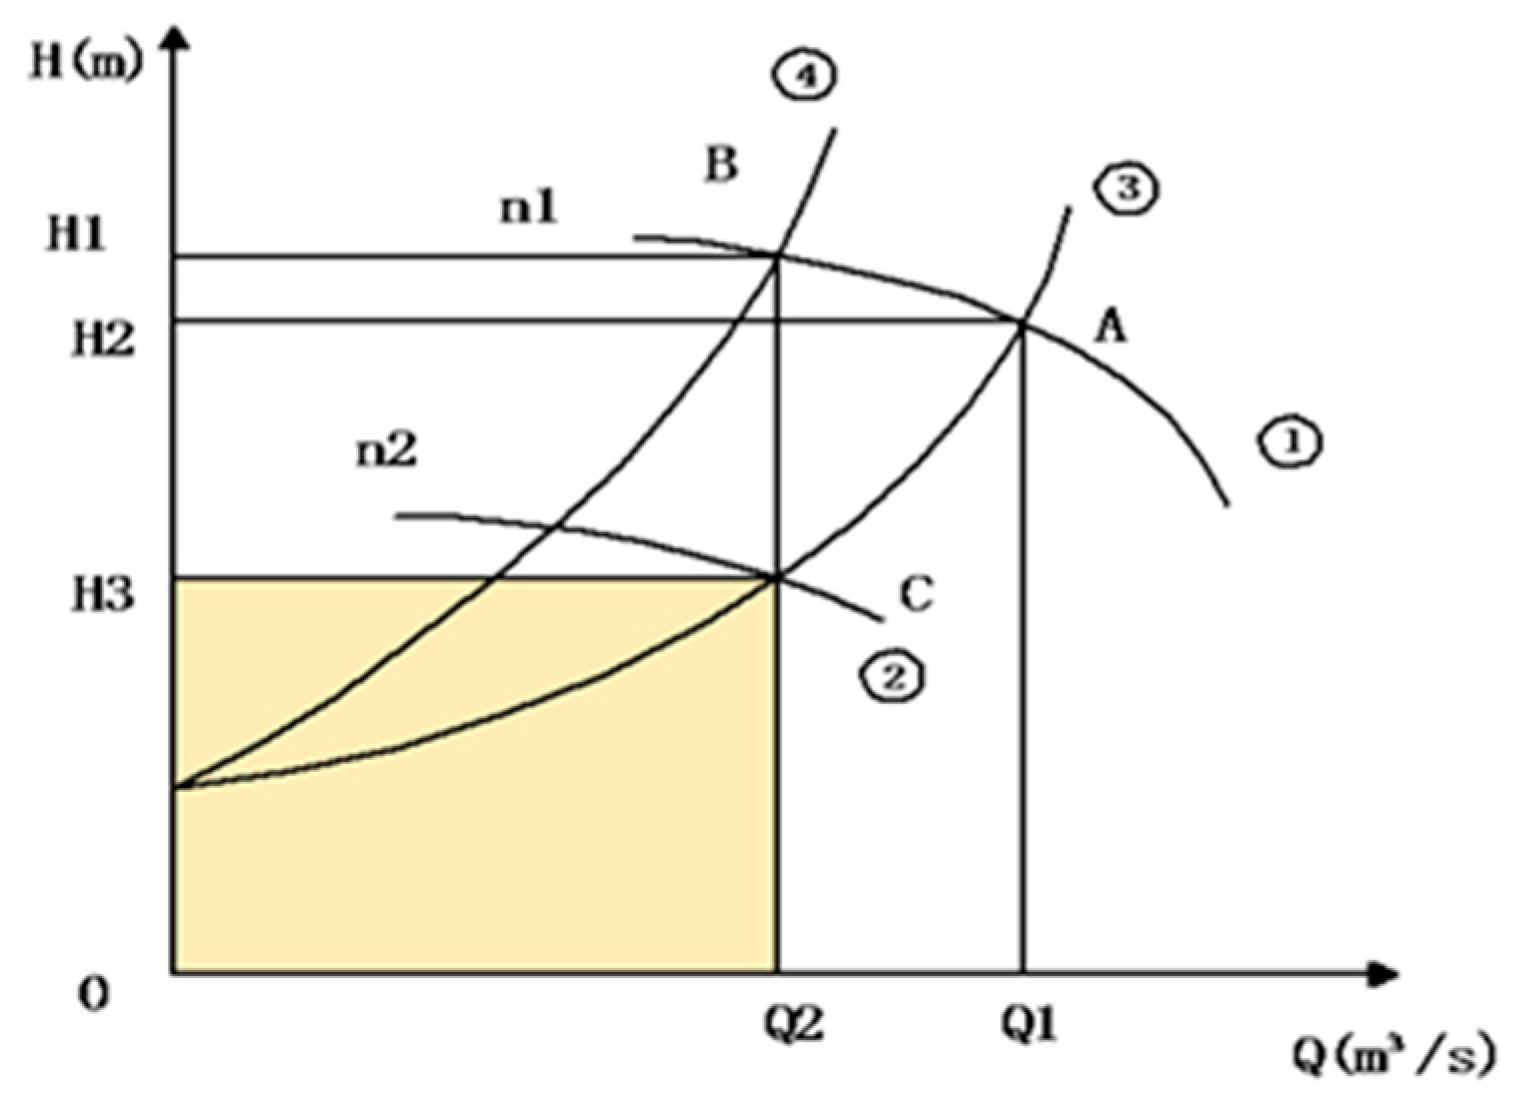
In water pump supply systems, both motor speed control and water flow valve adjustment are employed to regulate the volume of water supplied. The motor speed control method adjusts the motor’s speed to control the kinetic energy of the water, thereby modifying its flow rate, while the pipe resistance characteristics remain constant. In contrast, the variable frequency drive (VFD) control method regulates the pump’s speed based on water demand, thereby controlling the water pressure and flow within the pipes. As water demand increases, the motor speed increases, and as demand decreases, the motor speed slows down. The valve control method, on the other hand, continuously adjusts the valve’s opening to control the water flow rate, relying on changes in pipe resistance to regulate the flow. However, due to the fluctuating nature of water demand, if the valve opening remains fixed for an extended period, this can result in under- or over-pressure situations [24]. Figure 1 illustrates a typical pump loading curve, where Curves 1 and 2 represent the head characteristics at operating speeds n1 and n2, respectively, and Curves 3 and 4 represent the pipe resistance characteristics at different valve openings.
If the water pump operates at the optimal working point A, the system’s efficiency is highest, and the flow output is maximized. The output power of the water pump can be expressed as P A = S A , H 2 , O , Q 1 , where S A , H 2 , O , Q 1 is the enclosed area of four points of A, H2, O, Q1. The yellow area in Figure 1 represents the output power of the water pump at this time.
Valve control essentially adjusts the water supply flow volume by changing the pipe resistance characteristics of the network, while the motor speed remains constant and the head characteristics do not change. When the valve opening is reduced, the flow volume decreases from Q1 to Q2, and the pipe resistance characteristics shift from Curve 3 to Curve 4. At this point, the head characteristics of the pump remain unchanged, following Curve 1, and the optimal working point transitions from Point A to Point B, achieving pressure regulation through constant speed and variable pressure adjustment. At this moment, the pump’s output power can be expressed as P B = S B , H 1 , O , Q 2 , where S B , H 1 , O , Q 2 is the enclosed area of four points of B, H1, O, Q2, as shown in Figure 1. The shaft power of the motor at Point A and B is roughly similar: when the water head increases, the water flow volume decreases, but the power consumption of the pump does not show a significant change. This highlights a key challenge in energy-saving for single-phase asynchronous motor-driven pumps: simply controlling the water flow volume through the valve does not make the pump more energy efficient.
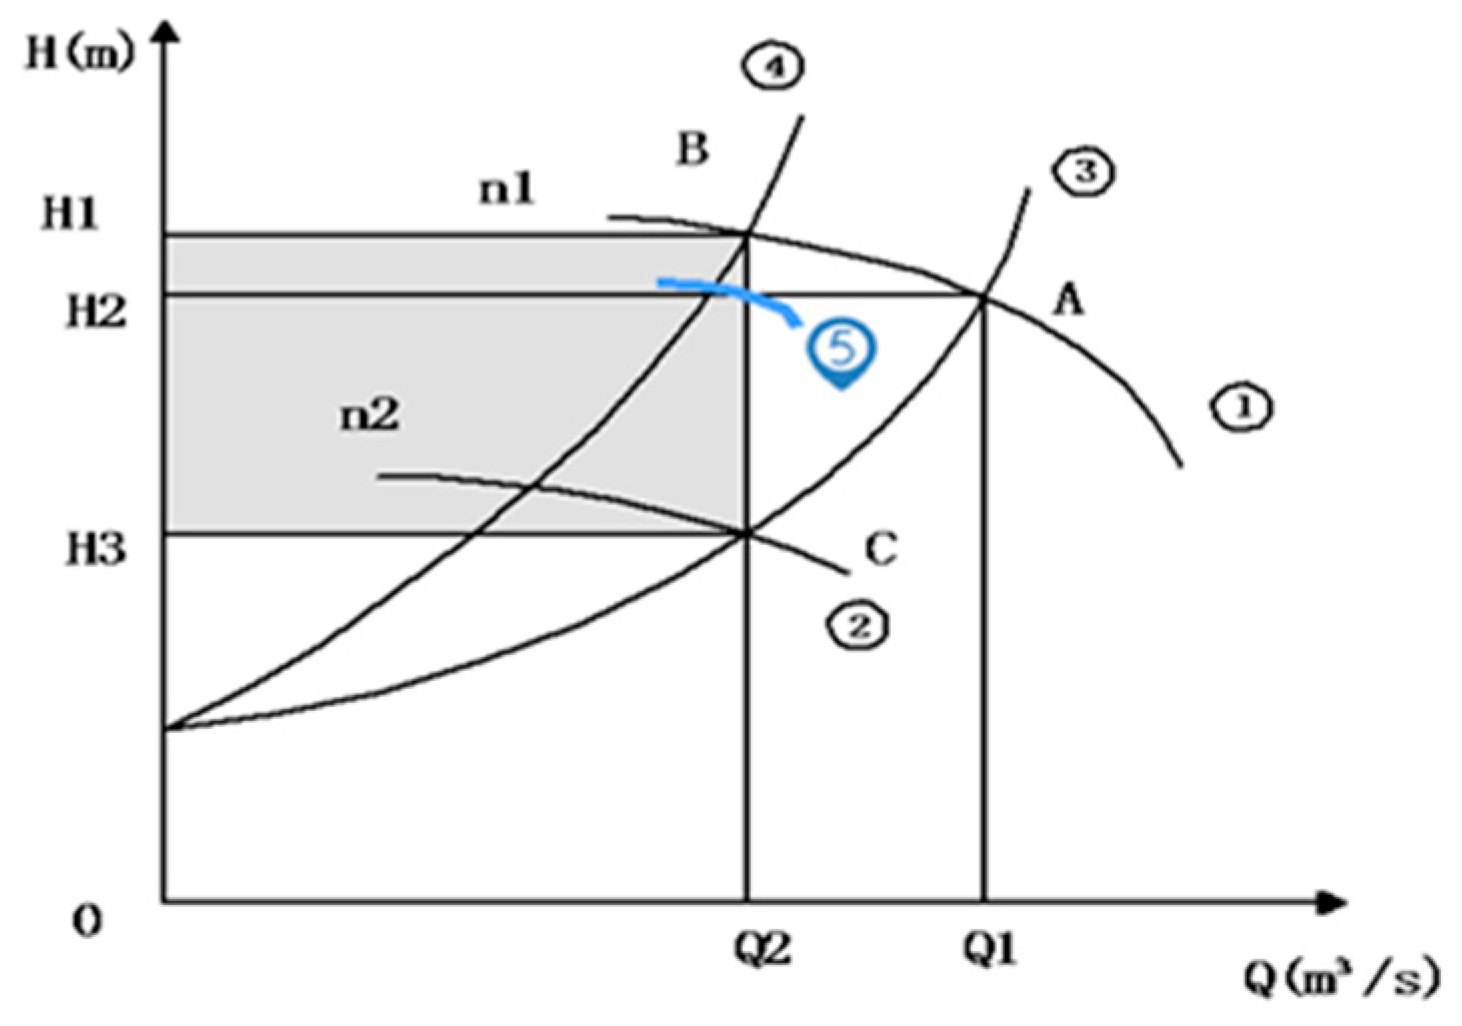
In the speed control process, the valve opening remains constant, and the pipe resistance characteristics do not change. Adjusting the pump speed controls the output water flow volume, while the head characteristics dynamically change when the water flow volume changes. When using speed control to reduce the water flow volume from Point Q1 to Point Q2, the pump speed decreases from Point n1 to Point n2, causing the system’s head characteristics to change from Curve 1 to Curve 2. The pipe resistance characteristics remain unchanged, still following Curve 3. At this point, the working condition of the supply system transitions from Point B to Point C, achieving variable pressure and speed flow volume transition adjustment. At this point, the working condition of the supply system transitions from Point B to Point C, achieving variable pressure and speed flow volume transition adjustment. The pump’s output shaft power at this time can be expressed as P C = S C , H 3 , O , Q 2 , where S C , H 3 , O , Q 2 is the enclosed area of four points of C, H3, O, Q2, as shown in Figure 2.
Comparing the two methods, the output power P B = S B , H 1 , O , Q 2 of the pump with valve control is greater than the output power P C = S C , H 3 , O , Q 2 with speed control. The difference in power between the two methods is Δ P = S B , H 1 , O , Q 2 S C , H 3 , O , Q 2 .
In Figure 1, under the same water flow volume variation, changing the pipe resistance characteristics of the water supply system by adjusting the valve opening does not improve the energy-saving efficiency of the system. However, controlling the motor speed through speed control, which further changes the head characteristics of the water supply system, can significantly enhance supply efficiency. Transitions between different operating conditions can also be smooth and continuous, reducing energy loss. Therefore, variable-speed control technology is an ideal way to regulate the pump’s performance. However, if the principle of constant pressure water supply is followed during the pump’s performance regulation, the pump will work along the blue Curve 5 shown in Figure 3. It will achieve some energy-saving but will not reach the optimal working point. The most energy-efficient solution would be if the pump could judge and maintain the output water flow volume of Q2 and reduce the water head to H3, which is working Point C. This will produce the most efficient way of changing the pump’s variable pressure while water flow volume is kept constant.
If the pump is a 3-phased motor driving pump, it would be easy to adjust the pump speed to Point C in Figure 3 by a VFD. However, the asynchronous induction motor efficiency would be much lower when its speed is regulated if the pump was driven by a single-phase asynchronous motor. It would be difficult to produce a lower speed at Point C in Figure 3 because a single-phase AC asynchronous motor’s speed is limited by the number of poles, as the formula below shows:
n = 60 f p
where n is motor speed, f is the power frequency, p is the number of pole pairs.
So if the motor is 4-pole motor, and the power is AC 230 V 50 Hz, then the motor speed would be n = 60 * 50/4 ÷ 2 = 1500 RPM.
To achieve variable speeds in a single-phase AC asynchronous motor, researchers have developed a multi-winding approach, where windings for 2, 4, 6, 8, and 10 poles are combined in a single motor winding. By connecting different lead wires for each pole configuration, the motor’s operating speed can be switched between 2, 4, 6, 8, or 10 poles. This setup allows for variable motor speeds while maintaining high efficiency at each speed. However, the speed changes are discrete rather than continuous, limiting the motor to fixed speeds (2, 4, 6, 8, or 10 poles). Additionally, this method increases manufacturing complexity and cost, making it less suitable for developing variable-speed pumps for single-phase motors or for creating specialized inverters.
In this paper, we introduce a permanent magnet synchronous motor (PMSM) as the driving unit for the pump. A fuzzy control and FOC algorithm are employed to intelligently control the pump operation, enabling communication between water demand and water supply, and appropriate adjustment of the pump’s output. The PMSM is a three-phase DC motor, powered by a 300 V DC input. Consequently, each PMSM requires an integrated AC/DC inverter in the power supply unit, enabling the motor to be powered by either a single-phase or three-phase supply. This innovative pump system not only adjusts the water flow and pressure according to actual demand but also optimizes the input power to achieve the most suitable output flow and pressure. This approach maximizes energy savings across the entire pump system. The proposed system addresses the lack of speed regulation in AC asynchronous motor-powered pumps and enhances efficiency at all operating speeds by providing the most appropriate power input in a linear manner.

2.2. Permanent Magnet Synchronous Motor

Due to the limitations of AC asynchronous induction motors, where the operating speed is constrained by the number of poles, it is not feasible to develop a variable-speed pump that operates efficiently across all speed ranges with a conventional AC asynchronous motor. Existing research has demonstrated that the variability in pump speed is crucial for energy saving. Therefore, it is essential to identify a motor that maintains high efficiency when its speed is regulated. In this context, the permanent magnet synchronous motor (PMSM) is proposed as the driving motor unit for a variable-speed pump.
A PMSM utilizes permanent magnetic materials in the rotor or stator to generate the magnetic field. The interaction between the constant magnetic field produced by the permanent magnets and the induced current magnetic field enables the motor’s operation. Unlike traditional induction motors, PMSMs do not require external excitation for the magnetic field, resulting in superior efficiency and dynamic performance across 80% of their speed range. As a result, PMSMs are an ideal choice for developing variable-speed pumps. Although other motors, such as servo motors, could also be applied based on their efficiency and broad speed range, the PMSM is the optimal choice from both a cost and performance perspective.

2.2.1. The Structure of PMSM

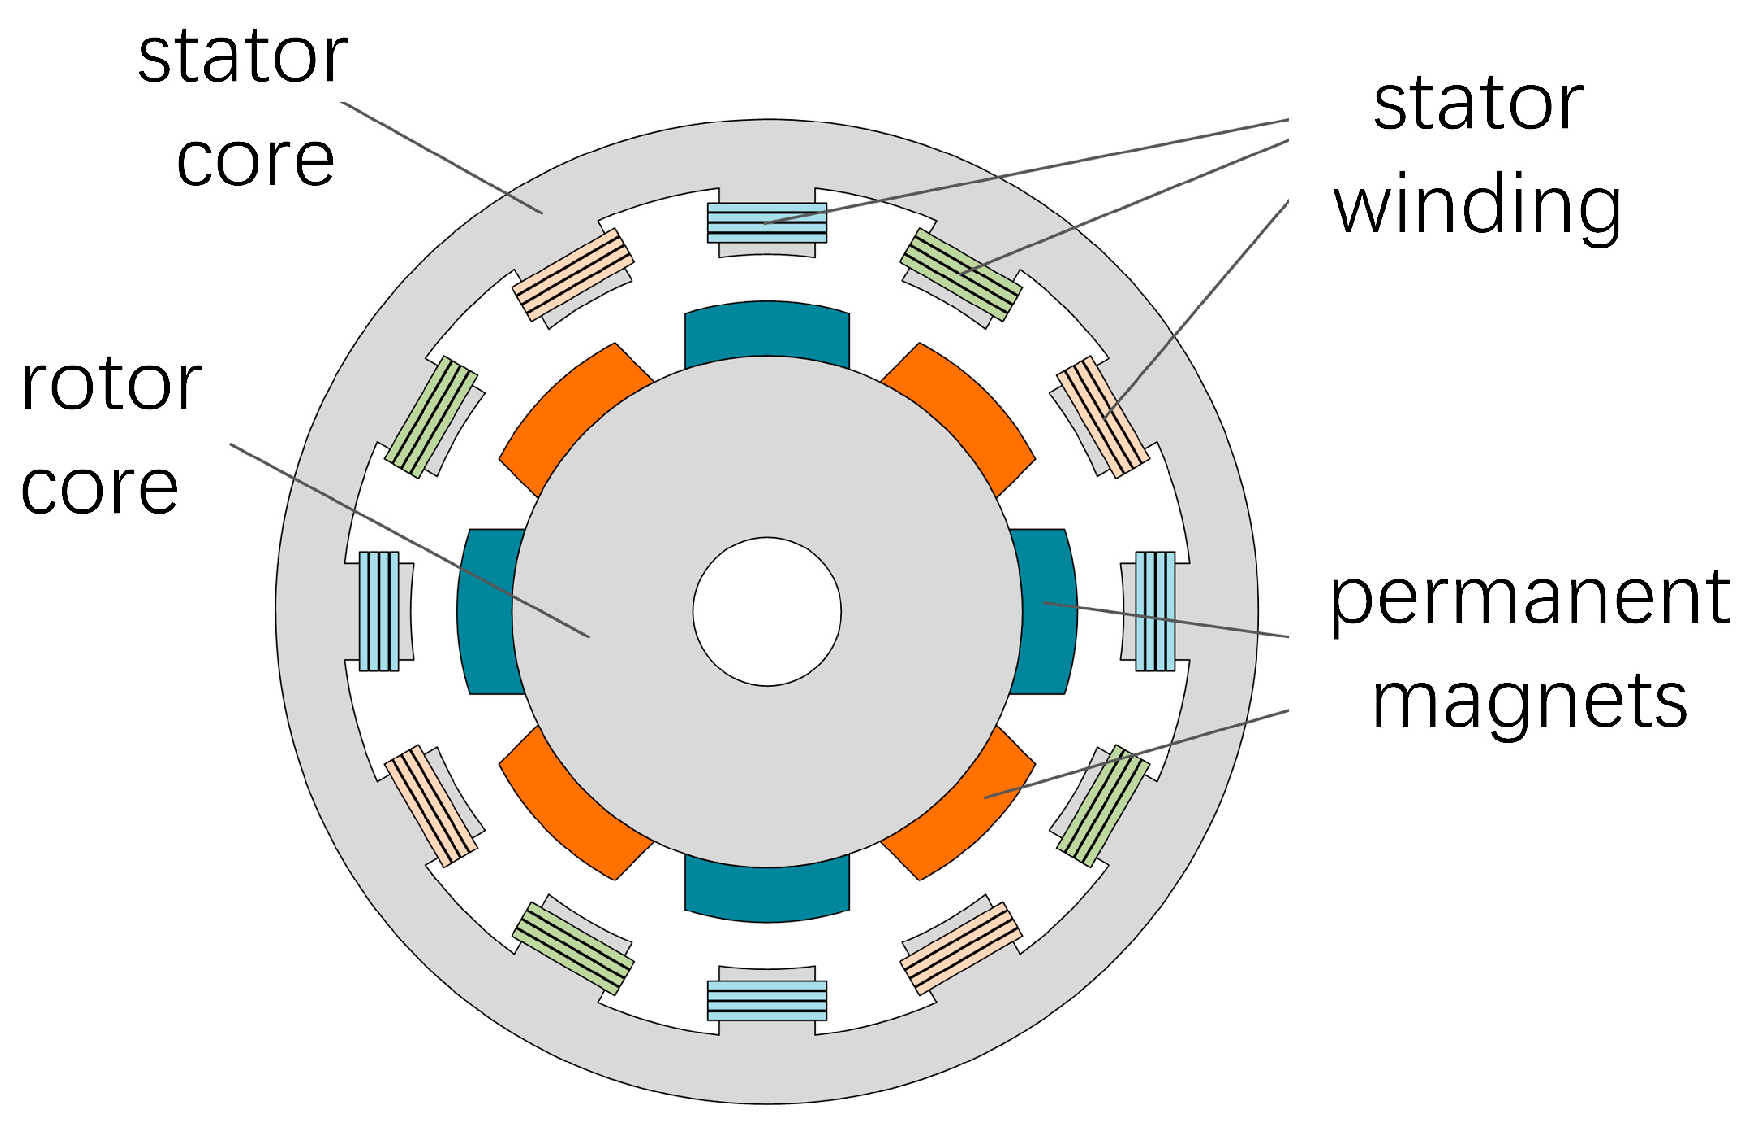
A typical PMSM vertical section is shown in Figure 4.
Main parts functions instructed as Table 1.

2.2.2. Field Oriented Control (FOC) Building on PMSM

When a pump is driven by a PMSM, in order to intelligently control the pump’s output water flow so it is constant, there is a need to build a field oriented control (FOC) into the PMSM.
By building a dq rotating rectangular coordinate system, which is on a rotor magnet, the PMSM’s voltage vector can be obtained via Equation (7):
V q = R 1 i q + p L q i q + ω r L d i d + ψ f V d = R 1 i d + p L d i d + ψ f ω r L q i q
where V q , V d are the PMSM dq axis voltage component; i d , i q is the dq axis current component; L d , L q are the PMSM dq axis inductance; R 1 is the phase resistance of the stator winding; ψ f is the permanent magnet flux linkage; and ω r is the angle speed of the rotor.
Magnet torque produced by the PMSM:
T e = p p Ψ f i q + L d L q i d i q
where p p is the motor poles pair. As we are going to use a surface-mounted magnet motor, there is no salient effect, so we can control the exciting current in the above equation = 0, and the magnet torque can be simplified to be:
T e = p p Ψ f i q
FOC is a control technique that decouples the motor’s torque and flux control. By transforming the three-phase motor currents into the d- and q-axes components we obtain:
i d : The direct-axis current, responsible for the flux-producing component (excitation current).
i q : The quadrature-axis current, responsible for the torque-producing component (torque current).
By controlling these currents independently, the motor can be operated efficiently, with the torque directly controlled via i q , and the magnetic flux controlled via i d .
In the context of the system, the key benefit of using FOC is the ability to independently control the magnet torque (Tm) through the torque current i d , while keeping the excitation current i d at a constant value to maintain flux stability. This results in a faster and more responsive control system for applications like constant water flow regulation in pumps. In summary, the PMSM voltage equations describe the relationship between the stator voltage, currents, inductances, and other parameters in a dq-coordinate system. The components in the equations—such as resistance, inductance, and permanent magnet flux linkage—are key to understanding the motor’s behavior and how FOC allows for independent control of the motor’s torque and flux. Through FOC, the motor’s torque can be controlled by adjusting i q , while the flux can be controlled by adjusting i d , making it an ideal control strategy for pump applications where constant water flow needs to be maintained.
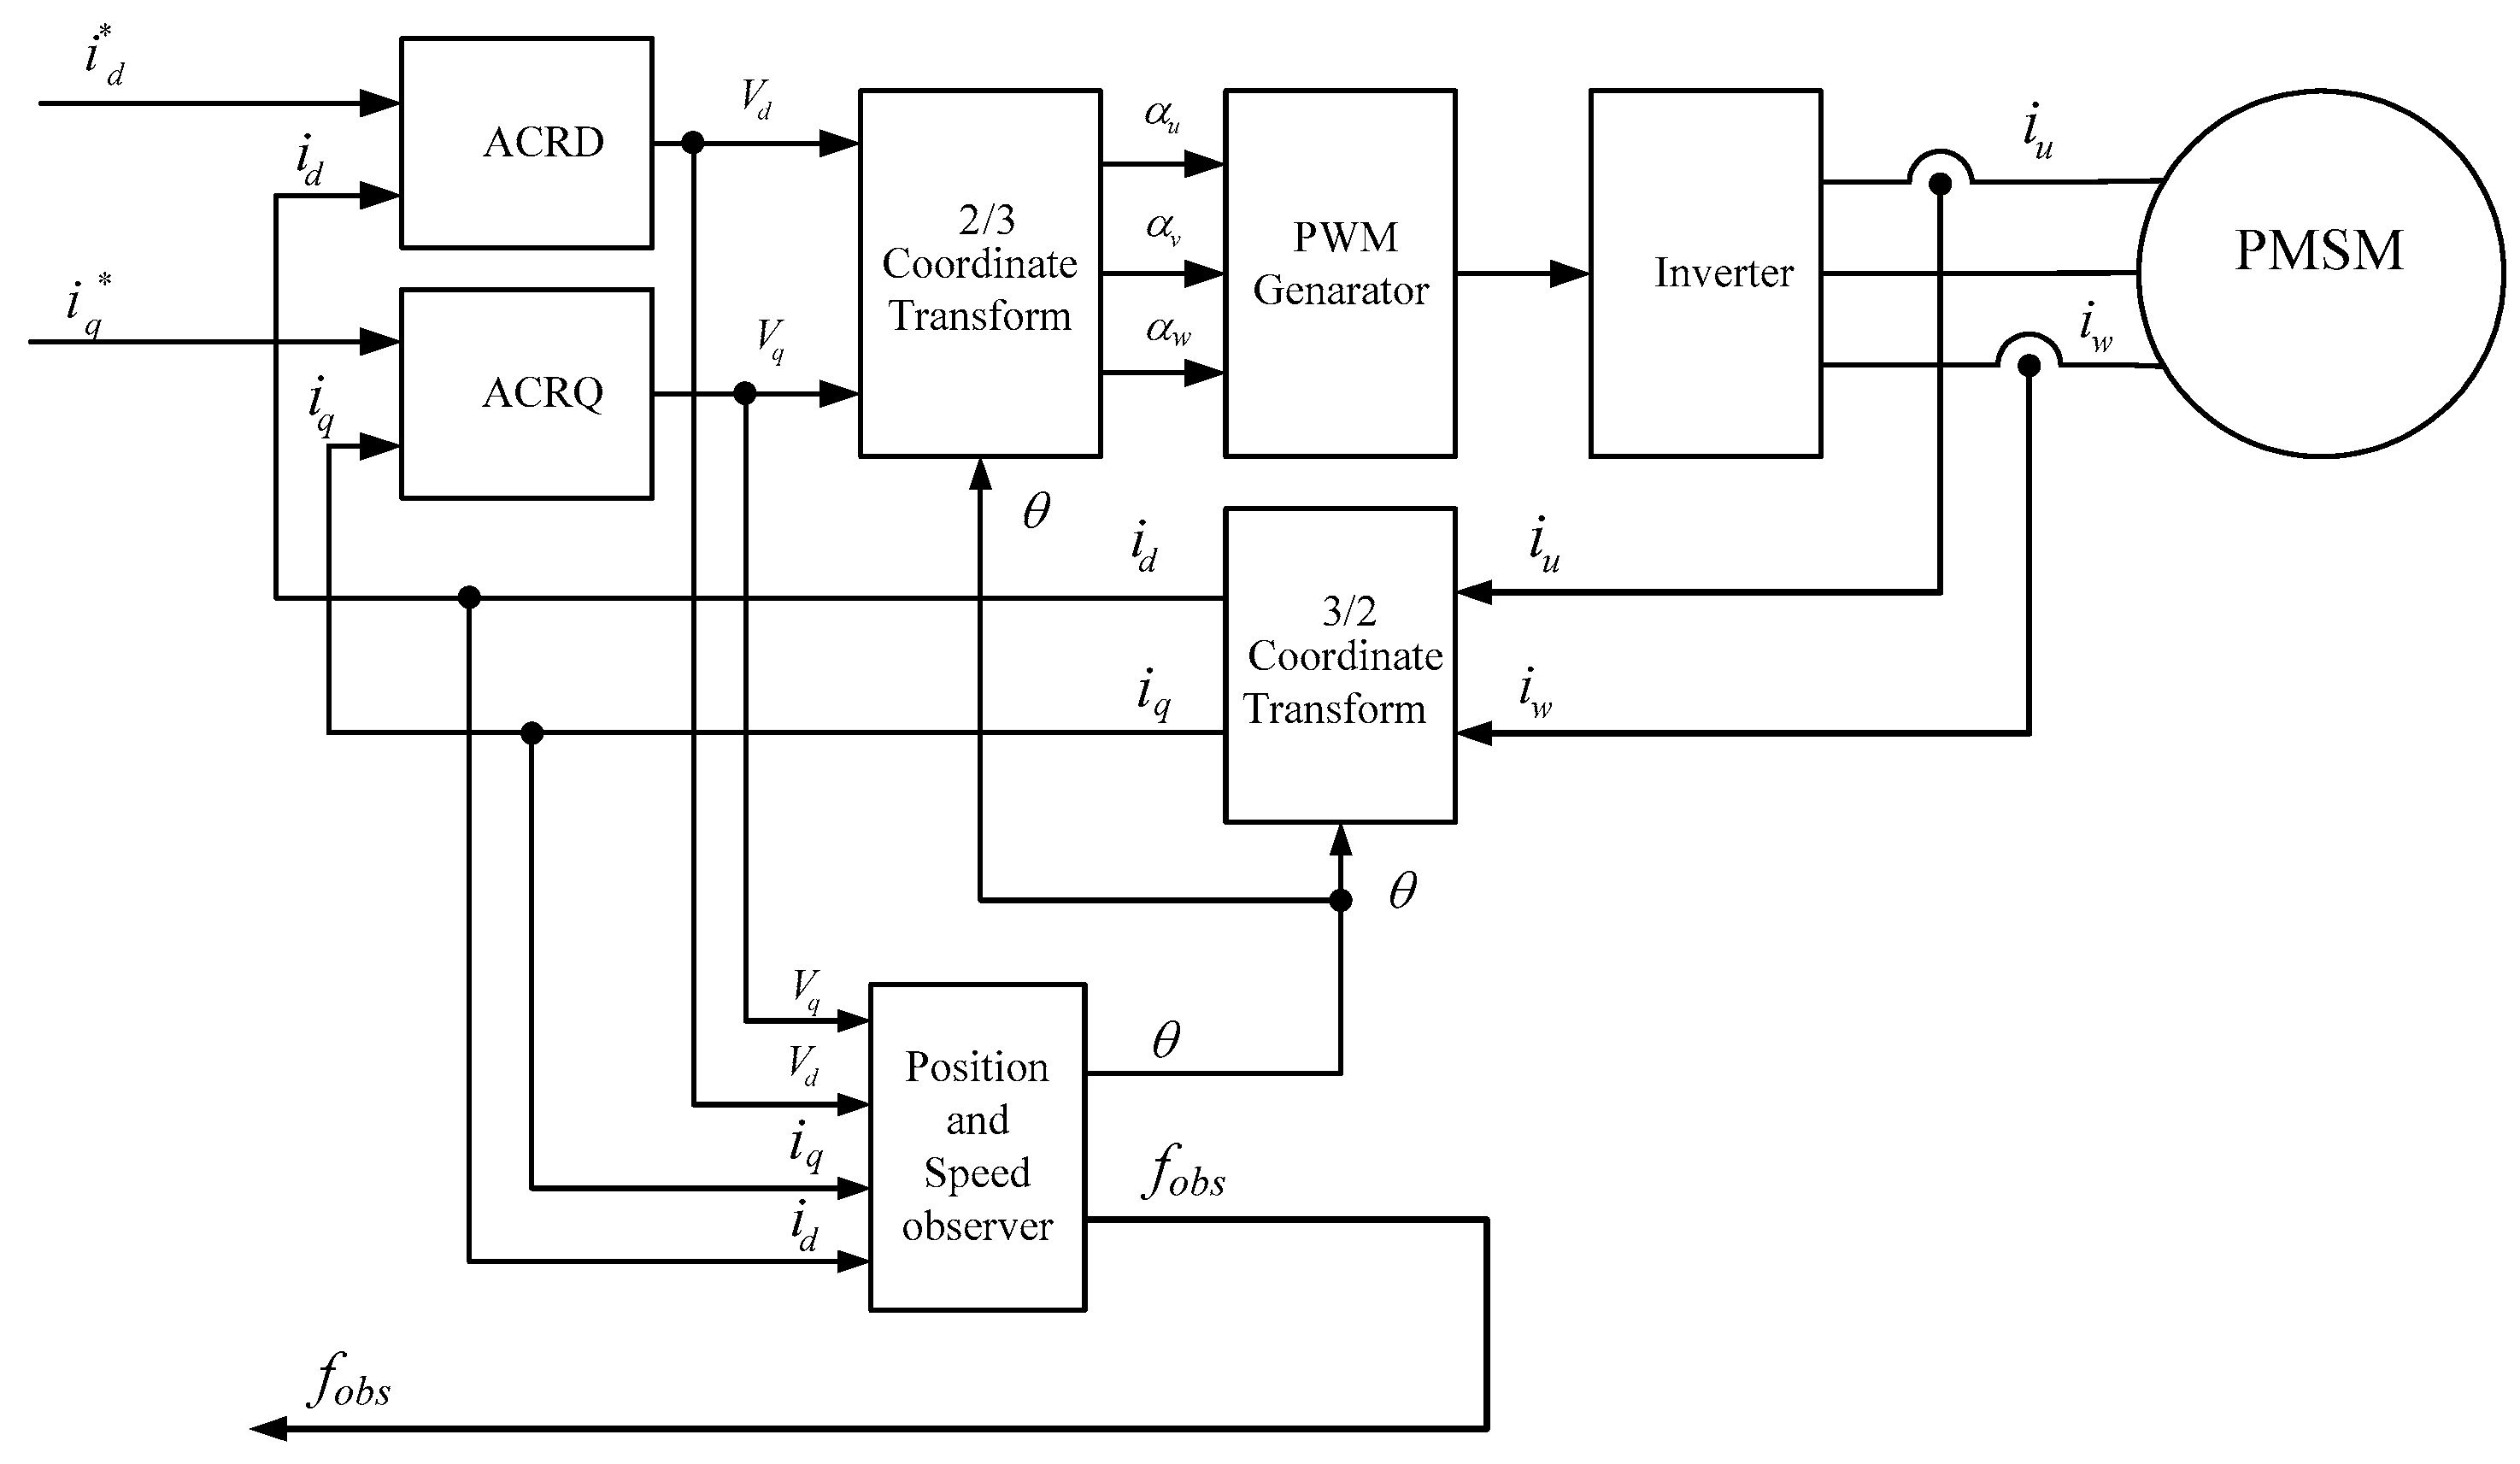
The FOC control schematics for PMSM are explained in Figure 5 below. First, obtain the motor rotor position through a speed and position observer, then obtain the phase angle of the motor. Then, after the CPU samples the actual three-phase currents from the current sensor, calculate the torque current i q and the excitation current id through Clark and Park transformation of coordinates. Compare the set data and calculated data of the torque current i q and the excitation current id separately, and obtain the voltages’ vector sum through input differences of the current comparisons with the current regulator. The voltage–duty ratio, in which outputs of the current regulator through inverse-Park and inverse-Clark coordinates transform the inputs of the PWM waver generator, allows the generator to produce six channels of PWM waves to control the insulated gate bipolar translator (IGBT) on/off and timing, and control the motor effectively.
In Equation (9), it can be observed that the output electromagnetic torque of the PMSM can be controlled by setting the torque currents. When the torque current is constant, the output electromagnetic torque of the PMSM motor remains constant, a process referred to as constant torque control. However, it is evident that the pump’s output water flow is not constant when the output pressure fluctuates, even under constant torque control. Therefore, it is necessary to explore a torque current control strategy based on a fuzzy algorithm to ensure a constant water flow output, even as the pressure varies.

2.2.3. The Characteristics of Permanent Magnet Motors

The working principle of permanent magnet motors consists of the following steps:
(1)
Permanent magnet generates a static magnetic field: The permanent magnet creates a constant static magnetic field in the motor.
(2)
Current flows through the winding to generate a rotating magnetic field: When current passes through the stator winding, it produces a rotating electromagnetic field.
(3)
Interaction between the static and rotating magnetic fields: The interaction between the static and rotating magnetic fields generates torque, driving the rotor to rotate.
(4)
The rotor follows the rotating magnetic field: The conductors on the rotor are subjected to magnetic forces, causing the rotor to rotate in sync with the rotating magnetic field.
Permanent magnet motors exhibit several notable operational characteristic advantages, including, but not limited to:
(1)
High efficiency: Since no external excitation is needed, permanent magnet motors achieve higher energy efficiency.
(2)
High power density: These motors are smaller and lighter, offering a higher power density for the same power output.
(3)
Quick response: They feature rapid start–stop, acceleration, and deceleration, making them suitable for applications that require frequent speed changes.
(4)
Low noise: The stable magnetic field generated by the permanent magnet results in low noise during motor operation.
(5)
High starting torque: Due to its requirement for rotor-frequency synchronization and the inherent strength of its permanent magnets, the PMSM exhibits a significantly higher starting torque than induction (asynchronous) motors.
(6)
Longer life: Due to the high working efficiency at variable speeds, the PMSM could work at different speeds depending on the application request, which lengthens the motor’s life as the motor does not work always at its max speed.
(7)
Less maintenance: The longer operational life of the PMSM contributes to reduced bearing maintenance and eliminates the need for capacitor maintenance entirely. This contrasts with most single-phase AC motors, which require capacitors for either starting or running operation.
Due to the above advantages of a PMSM, there is already much research on applying PMSM to pumps. Jin et al. [25] researched applying a PMSM to low-voltage water pump systems, while Bahrami-Fard et al. [26] researched transition of submersible pump driving motors from an AC motor to a PMSM.

3. Developing Self-Adaptive Fuzzy PID Control for Pumps

3.1. Normal PID Control

The normal proportional integral derivative (PID) controller is widely recognized for its simplicity, effective control performance, and high reliability, making it a staple in industrial control systems. Currently, approximately 90% of PID controllers are employed in practical control applications. One of the key advantages of PID controllers is their ease of tuning, with the proportional, integral, and derivative components being flexibly and conveniently adjustable. Over time, extensive practical experience has led to the maturation of PID control design technology, solidifying its crucial role in real-world control systems.
A traditional PID controller operates as a linear system that calculates the error between the set point and the actual output. This error is processed through proportional, integral, and derivative operations, with the final output sent to the actuator. The underlying principle is depicted in Figure 6.
The PID controller forms the control error e ( t ) based on the given value r ( t ) and the actual feedback value c ( t ) as:
e ( t ) = r ( t ) c ( t )
The control is based on the combination of proportional, integral, and derivative actions, allowing the control quantity to adjust the controlled object. The fuzzy PID control law is expressed as:
u ( t ) = K p e ( t ) + 1   T 1 0 t e ( t ) + T d d e ( t ) d ( t )
The transfer function of the PID is:
G ( s ) = K p + 1   T 1   × s + T d × s
where e ( t ) is a deviation signal, u ( t ) is an output, K p is a proportional coefficient, T 1 is an integral time, and T d is a derivative time.
The main functions of each control component in a PID controller are as follows:
(1)
Proportional component
The mathematical expression for the proportional component is as follows:
P ( t ) = K p e ( t )
When an error occurs, the controller immediately adjusts the control object, aiming to reduce the error. The intensity of this adjustment is closely related to the proportional coefficient K p . Increasing K p reduces the settling time and also decreases the steady-state error, but it can lead to a larger overshoot and, in severe cases, cause the system to oscillate or even become unstable. Therefore, when determining the proportional coefficient K p , it must be selected appropriately based on the characteristics of the control system. This ensures that the settling time is reduced, the steady-state error is minimized, and the system remains stable.
(2)
Integral component
The mathematical expression for the integral is as follows:
I ( t ) = K p T i e ( t ) d t
As shown in Equation (14), the integral component is the process of accumulating the system’s error. By accumulating the error, the controller’s output is adjusted to eliminate the inherent offset. If the integral component is too strong, it can lead to system overshoot or even instability, which is determined by the integral time T i and is inversely proportional to the strength of the integral action.
(3)
Derivative component
The mathematical expression for the derivative is as follows:
D ( t ) = K p T d d e ( t ) d t
As shown in Equation (15), the derivative component allows for predicting changes in the error. Adjusting the strength of derivative action can improve system performance. However, the derivative component can also introduce negative effects to the system, so it must be used appropriately. The effectiveness of the derivative action is determined by the derivative time constant T d .
In the use of PID control, only three basic parameters need to be set: K p , K i , and K d . However, in most cases, setting just the proportional or proportional-integral parameters is sufficient to meet the system’s requirements.
The transfer function of PID control is expressed as:
G c ( s ) = K P = K p T i 1 s + K p τ s
where K p is the proportional coefficient, T i is the integral time constant, and T d is the derivative time constant. These three constants can be tuned.
The output signal of the PID controller is expressed as:
u ( t ) = K p e ( t ) + K p T i 0 t e ( t ) d t + K p t d e ( t ) d t
The PID transfer function can be converted to:
U ( s ) E ( s ) = K p T i T i τ s 2 + T i s + 1 s
Compared to the PI controller, the PID controller has many advantages, which is why it is more widely used in practical applications. However, the PID controller’s structure is relatively more complex, as it has one more parameter than the PI controller, making the tuning process more challenging. The PID controller is a combination of the PI and PD controllers, leveraging the advantages of both while mitigating their weaknesses.
In actual systems, a discrete PID control algorithm is used, and there are mainly two types: the position algorithm and the incremental algorithm.
The position algorithm is expressed as:
u ( k ) = K p e ( k ) + K i j = 0 k e ( j ) + K d [ e ( k ) e ( k 1 ) ]
The incremental algorithm is expressed as:
Δ u ( k ) = u ( k ) u ( k 1 ) = K p [ [ e ( k ) e ( k 1 ) ] + K i e ( k ) + K d [ e ( k ) 2 e ( k 1 ) ] + e ( k 2 ) ]
where K p is the proportional coefficient, K i is the integral coefficient, K d is the derivative coefficient, T is the sampling period, e ( k ) is the error value at the k sampling, e ( k 1 ) is the error value at the k 1 sampling.
Equation (20) represents the digital incremental PID control algorithm, which can be implemented using the stored values e ( k ) , e ( k 1 ) , and e ( k 2 ) , and provides excellent control performance.
The core of PID control lies in the tuning process of the proportional coefficient, integral coefficient, and derivative time constant. The selection of parameters directly affects the control performance of the system. Through years of development and practical application, engineers have developed various tuning methods, accumulating rich theories and practical steps for parameter tuning. These methods have met the system needs to a certain extent. However, as systems become increasingly complex, with growing instability in control objects, tuning parameters has become significantly more challenging, and traditional tuning methods can no longer meet the requirements of modern systems.
The water supply system mentioned in this paper is a nonlinear time-delay system, which is difficult to control with traditional fixed-parameter PID controllers due to the uncertainty in the system model. Therefore, PID parameters need to adapt, requiring a more advanced PID controller, specifically one with self-tuning capabilities [27,28].
The rapid development of computer technology has made self-tuning PID controllers possible. Consequently, some CAD tuning methods have emerged, such as parameter setting using relevant MATLAB(R2021b) toolboxes. MATLAB’s tuning tools allow modeling and simulation to quickly obtain system tuning performance, after which PID parameters are adjusted accordingly. However, this method requires a highly accurate system model, and if the model changes, the original parameters become obsolete. In self-tuning control systems, an accurate model of the control object is not needed, and the parameters can be adjusted through self-learning [29].
In recent years, methods based on control object parameter tuning have been widely applied. These methods tune the three PID parameters online based on various requirements or objective functions. Computer optimization techniques for finding optimal PID parameters have been applied to specific applications. These methods leverage the strong computational power of computers but also have limitations, such as the need to establish an accurate mathematical model. However, this requirement assumes that the controlled object is linear, time-invariant, and has weak time-delay characteristics; otherwise, the system parameters and performance derived may not be accurate.

3.2. Self-Adaptive Fuzzy PID Control

This paper combines fuzzy controllers with classical PID controllers, utilizing fuzzy sets, fuzzy logic, and fuzzy inference to automatically modify the PID parameters K p , K i , and K d online based on different error and error change rate values. Compared to classical PID controllers, this controller has the following advantages:
  • Fast response;
  • Low overshoot;
  • Strong robustness.
It solves the issues of pure time-delay, time-varying, and nonlinear systems.
In a variable frequency speed control water supply system, the feedback signal is the outlet pressure, which is compared with the reference pressure value to determine the control instructions for the frequency converter. The variable frequency speed control water supply system has the following characteristics:
(1)
There is a nonlinear relationship and uncertainty between the outlet pressure and the pump speed;
(2)
There is a certain delay between the water pressure and the pump speed;
(3)
The system has high inertia and a long pure delay time.
Due to these characteristics, designing the control system becomes very challenging. The dynamic characteristics of classical control theory are significantly inferior in water pressure control. Therefore, this design combines fuzzy control theory with adaptive fuzzy PID control to regulate and adjust the water pressure and flow volume in the water supply system.

3.2.1. Principles of Self-Adaptive Fuzzy PID Control

Fuzzy control has the characteristic of not relying on the model of the industrial object, and its system features are described using linguistic variables. Control commands are obtained through appropriate logical calculations based on the expert knowledge base of the system and the dynamic information collected. Since it does not depend on a system model, the system has good robustness, but the control precision is relatively low. If combined with adaptive PID, it can better adjust the system parameters automatically based on the changes in the adaptive control system’s parameters, meeting the system’s control requirements. This control method, which combines a fuzzy controller with a traditional controller, is known as a composite fuzzy controller. Typically, a simple fuzzy controller is connected in series with a classical PI or PID controller. This combination leverages the strong non-linearity of the fuzzy controller and the maturity of the classical PI/PID controller to jointly control system oscillations and steady-state errors. Therefore, the combination of fuzzy control and PID control is an effective means of improving control performance [30,31,32].
This system employs a method based on fuzzy logic, using an online self-tuning PID controller to improve system control precision and robustness.
In a fuzzy control system, it is necessary to establish a correspondence between the controller’s input quantities and fuzzy variables. When using self-tuning fuzzy control, standardized values of the input and output measurements are used. Through careful analysis, comparison, and summation, and based on the characteristics of the water supply system, this paper adopts a two-dimensional fuzzy controller for logical analysis and inference. Specifically, error and error change rate are input into the fuzzy controller, while the pump speed signal is used as the output.
Step one is to establish the model for the fuzzy self-tuning PID controller. Based on a control process, the principles for setting PID parameters corresponding to different values of error e and error change rate e c are derived as follows:
(1)
When e is large ( e > e b ), the absolute value of the error is significant. To quickly eliminate the error, K p should be increased to improve the system’s dynamic response speed. To prevent the instantaneous value of e c from being too large, K d should be set to a smaller value to avoid large overshoots. Additionally, to prevent integral saturation, the integrator should be limited, and typically K i = 0 ;
(2)
When the error e is moderate ( e = e b ), to ensure a good response speed and moderate overshoot, K p should be reduced, K i should be increased, and K d should be set to an appropriate value;
(3)
When e is small e b > e > e a , to achieve better stability, both K p and K i should be set to larger values. At the same time, to avoid oscillations, the value of K d should take e c into account: if e c is small, K d can be larger; otherwise, K d should be smaller.
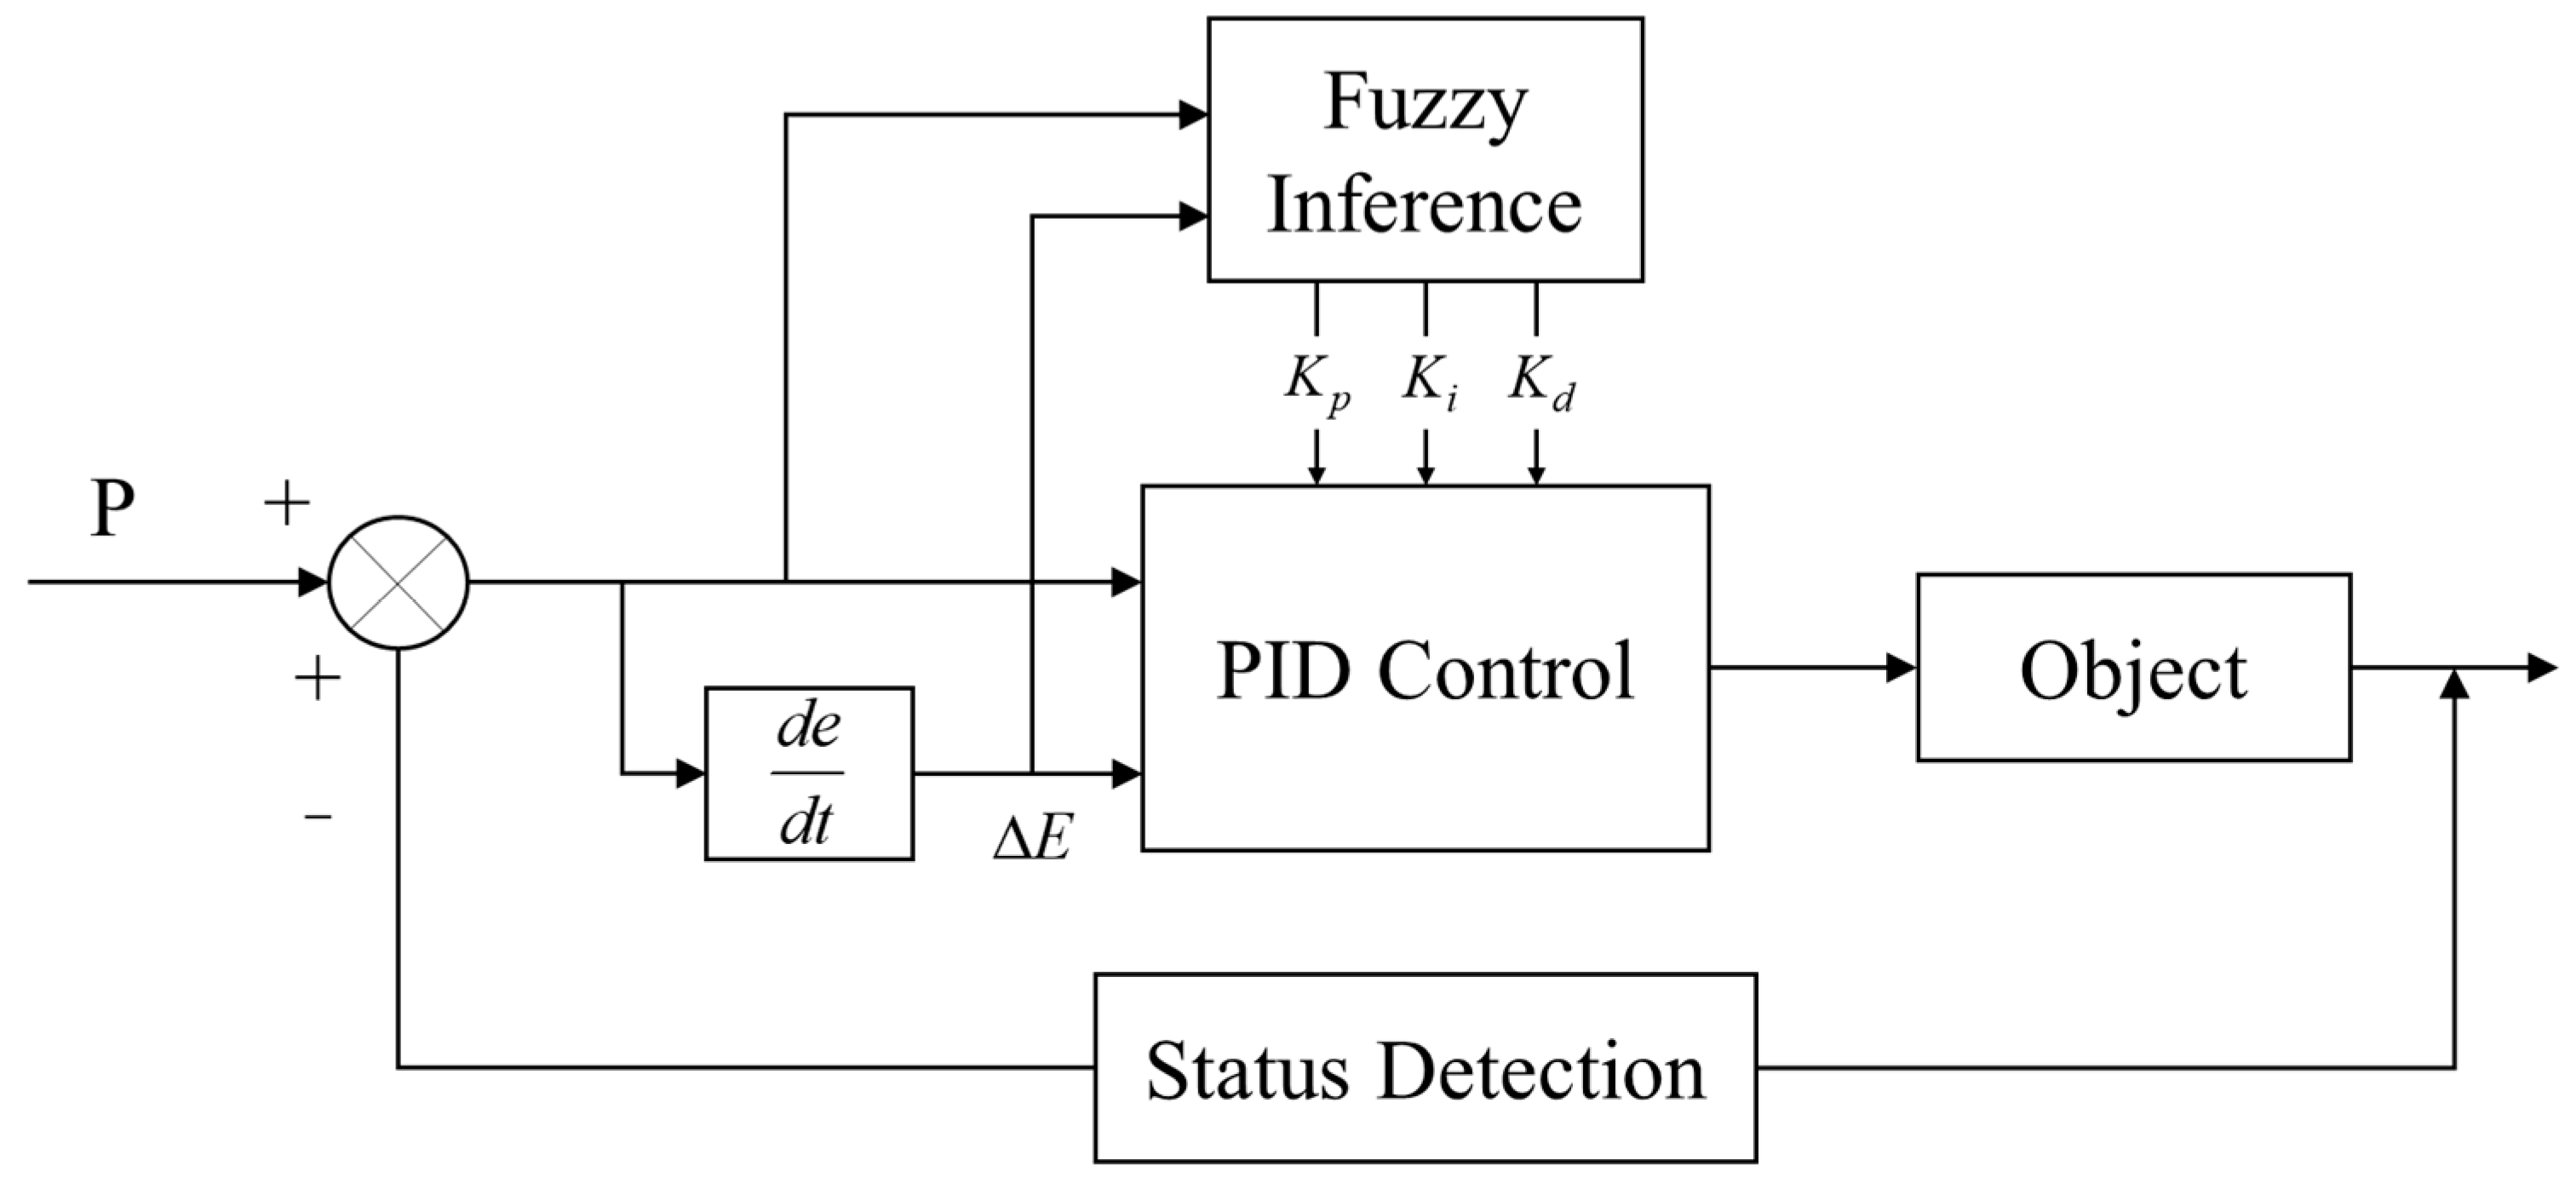
A classic PID controller does not have the capability to tune parameters K p , K i , and K d online. When error e and error change rate e c change, its parameters cannot adjust accordingly, making it difficult to further improve the system’s control performance. By using fuzzy expert rules, PID parameters can be modified in real time, which is the concept behind the self-tuning PID controller, also known as the adaptive fuzzy PID controller. Based on the roles and adjustment methods of K p , K i , and K d described above, fuzzy control rules for these parameters are derived. The fuzzy controller monitors the values of e and e c in real time and adjusts the PID parameters accordingly. This achieves automatic correction of PID parameters. Its structure is shown in Figure 7.
The design principle of this system is based on the fuzzy relationship between the three PID parameters and the error e and the error change rate e c . During operation, the system inputs the e and e c signals into the fuzzy controller in real time. The fuzzy controller adjusts the three PID parameters in real time according to expert knowledge to match the changes in e and e c . This approach overcomes the system’s non-linearity without relying on the control system model.

3.2.2. Design of Self-Adaptive Fuzzy PID Controller

First, select the appropriate type of fuzzy controller and specific derivation method based on the actual controlled system; i.e., determine the system architecture, structure, system input, output variables, fuzzy inference rules, fuzzification algorithm, and defuzzification calculation method. The design steps for an adaptive fuzzy PID controller are as follows [33]:
(1)
Determine the structure and type of the fuzzy controller and the corresponding input and output variables. In this paper, error e and rate of change of error e c are selected as the inputs to the controller, and the incremental PID parameters Δ K p , Δ K i , and Δ K d are selected as the output variables.
(2)
Choose scaling factors, quantization factors, and other mapping parameters in the universe of discourse.
(3)
Define the fuzzy subsets of the variables and select appropriate membership functions.
(4)
Establish fuzzy control rules. Input fuzzy conditional statements to obtain the fuzzy control rules.
(5)
Obtain the fuzzy control table. Based on these output values, determine the adjustment values for the PID parameters. By integrating all the logical computation relationships, the control rule table is derived. Since the PID has three parameters, the controller needs to output three output variables as well.
(6)
Input the system’s error and error change rate into the fuzzy logic matrix after Steps (2) and (3) to obtain the modification values of the PID parameters. Finally, the final controller output value, i.e., the system’s control quantity, is calculated through the PID algorithm.
(7)
Verify the system parameters. By modeling and simulating, the control effect of the system is determined, and then the various system parameters are appropriately adjusted to achieve optimal performance.

3.2.3. Building up Fuzzy Rules Tablet

In the water pump supply control system, the system is required to have a certain level of disturbance resistance and to adjust the PID parameters as quickly as possible. Therefore, based on the actual conditions on site, the actual operational experience of the operators and engineers, and the principles of PID parameter tuning, a control rule table for the control process has been summarized and determined. When the system is running online, the computer can tune the PID parameters by directly looking up the table, thereby reducing the amount of computation and achieving a quick response. The fuzzy control rule tables for tuning the parameters Δ K p , Δ K i , and Δ K d are shown below (Table 2, Table 3 and Table 4).
According to the system accuracy requirements, the input variable error E and the error rate of change EC can be divided into different levels, with more levels representing higher accuracy. In this paper, based on the actual system requirements, the input variable error E and the error rate of change EC are divided into 7 levels of linguistic variables, with each level corresponding to a fuzzy subset.
E = {NB, NM, NS, ZO, PS, PM, PB}
EC = {NB, NM, NS, ZO, PS, PM, PB}
Based on above fuzzy rule table, there are 49 control rules, and every rule has its responding E and EC, and control language value. The control rule can be expressed in the above table, or written as ‘If e and e c , then Δ K p , Δ K i , and Δ K d ’, for example:
If ( e is NB) and ( e c is NB), then ( Δ K p is PB) ( Δ K i is NB) ( Δ K d is PS);
If ( e is NB) and ( e c is NM), then ( Δ K p is PB) ( Δ K i is NB) ( Δ K d is NS);
If ( e is NB) and ( e c is NS), then ( Δ K p is PM) ( Δ K i is NM) ( Δ K d is NB);
If ( e is NB) and ( e c is ZO), then ( Δ K p is PM) ( Δ K i is NM) ( Δ K d is NB);
If ( e is NB) and ( e c is PS), then ( Δ K p is PS) ( Δ K i is NS) ( Δ K d is NB);
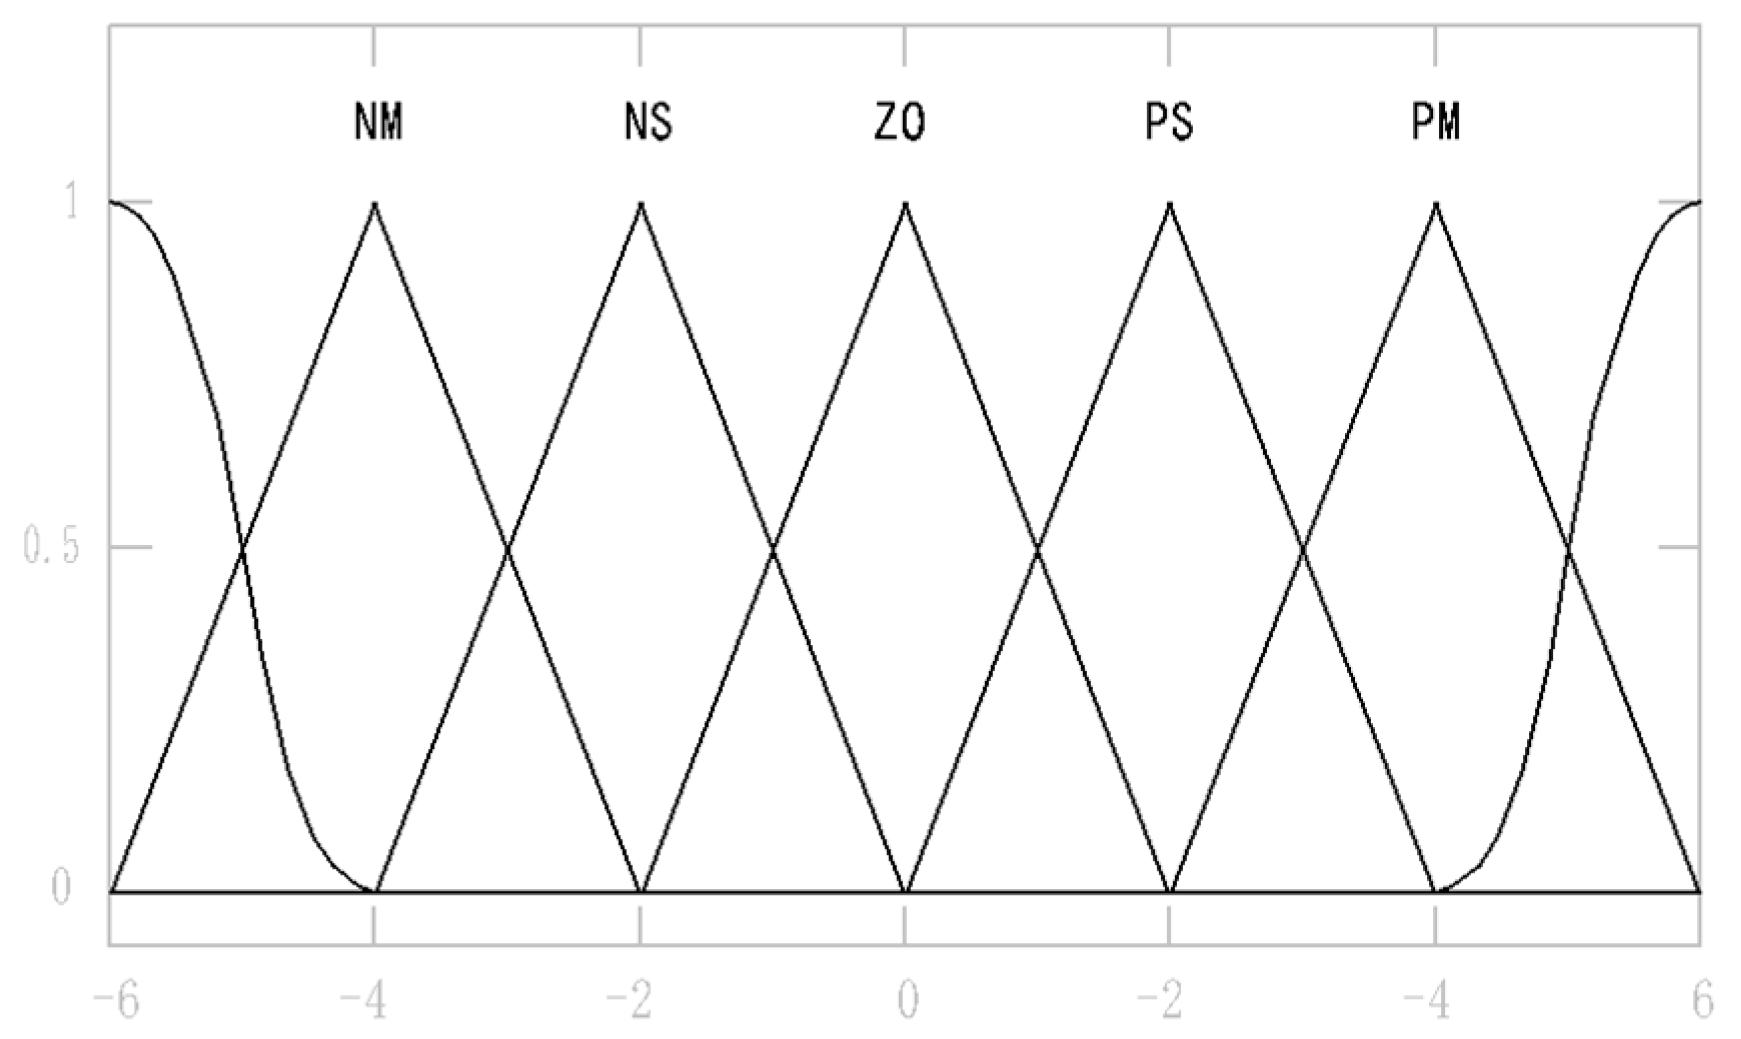
E, EC, Δ K p , Δ K i , Δ K d membership functions are triangular functions, as the Figure 8 below shows:
The Δ K p , Δ K i , Δ K d fuzzy inference input and output surface 3D are as Figure 9 below shows:

3.2.4. Fuzzy Control Rule Lookup Tablet

The fuzzy linguistic variables of E and EC, from largest to smallest, are positive big (PB), positive medium (PM), positive small (PS), zero (ZO), negative small (NS), negative medium (NM), and negative big (NB). These are symbolized as PB, PM, PS, ZO, NS, NM, NB. Then, we precisely discretize the domain of E and EC, dividing it into 13 levels; i.e., …
E = {−6, −5, −4, −3, −2, −1, 0, 1, 2, 3, 4, 5, 6}
EC = {−6, −5, −4, −3, −2, −1, 0, 1, 2, 3, 4, 5, 6}
Through the quantitative factor conversion formula, we obtain:
k = 2 n b a
In Formula (21), a represents the lower bound of the domain, b represents the upper bound of the domain, and n = 6 . The quantifying factor is used to transfer the error e in the domain [−0.05,0.05] and the error variation rate ec in the domain [−12,12] are transformed to the domain [−6,6] in the below experiment.
We first need to apply the fuzzy inference composition algorithm to calculate the fuzzy control lookup table. Then, based on the values of e and e c , the corresponding fuzzy control quantity is found from the lookup table through fuzzy control and then processed through defuzzification for output. Each control rule in the fuzzy control rule table determines a fuzzy relation. By performing the “union” operation on the 49 control rules R i (where i = 1 , 2 , , 49 ), we obtain the total fuzzy relation matrix R ~ for the water supply system’s fuzzy controller, as follows:
R ~ = R ~ 1 R ~ 2 R ~ 48 R ~ 49
Based on the above fuzzy relation matrix R ~ , when the error e ~ = e ~ 1 and the error change rate e c ~ = e c ~ 1 are known, the corresponding control quantity R ~ can be obtained by looking up the control rules:
R ~ K P = ( e 1 × e c ~ ) R ~
R ~ K I = ( e 1 × e c ~ ) R ~
R ~ K D = ( e 1 × e c ~ ) R ~
Since the elements of the universes of e ~ and e c ~ are known, precise control values K ˜ for various conditions can be calculated offline using the formula above, thereby creating the fuzzy control lookup table.
The aggregation operation in the given context refers to the union operation applied to the 49 control rules in the fuzzy control system. This operation combines the fuzzy relations corresponding to each control rule in the fuzzy control rule table.
In fuzzy logic, the union operation typically involves combining two fuzzy sets (or relations) in such a way that the resulting set captures all the possible elements of both sets. When dealing with fuzzy relations, the union operation can be thought of as taking the maximum or supremum of the corresponding membership values for each element across the fuzzy relations.
Here, the union operation is used to combine the 49 control rules’ fuzzy relations into a total fuzzy relation matrix for the water supply system’s fuzzy controller. This matrix is then used to obtain the corresponding fuzzy control quantity by looking up the control rules, as explained in the subsequent steps involving defuzzification and lookup table construction.
The lookup tables for the fuzzy control rules Δ K p , Δ K i , and Δ K d are as Table 5, Table 6 and Table 7.
The three tables are calculated through the weighted average method:
K = k i u i k i
k i is the i weight, u i is the i original value, or suggested value, or detected value, in the control rules; it is a suggested control value that is output by control rules. The weight in Equation (26) is “1”.
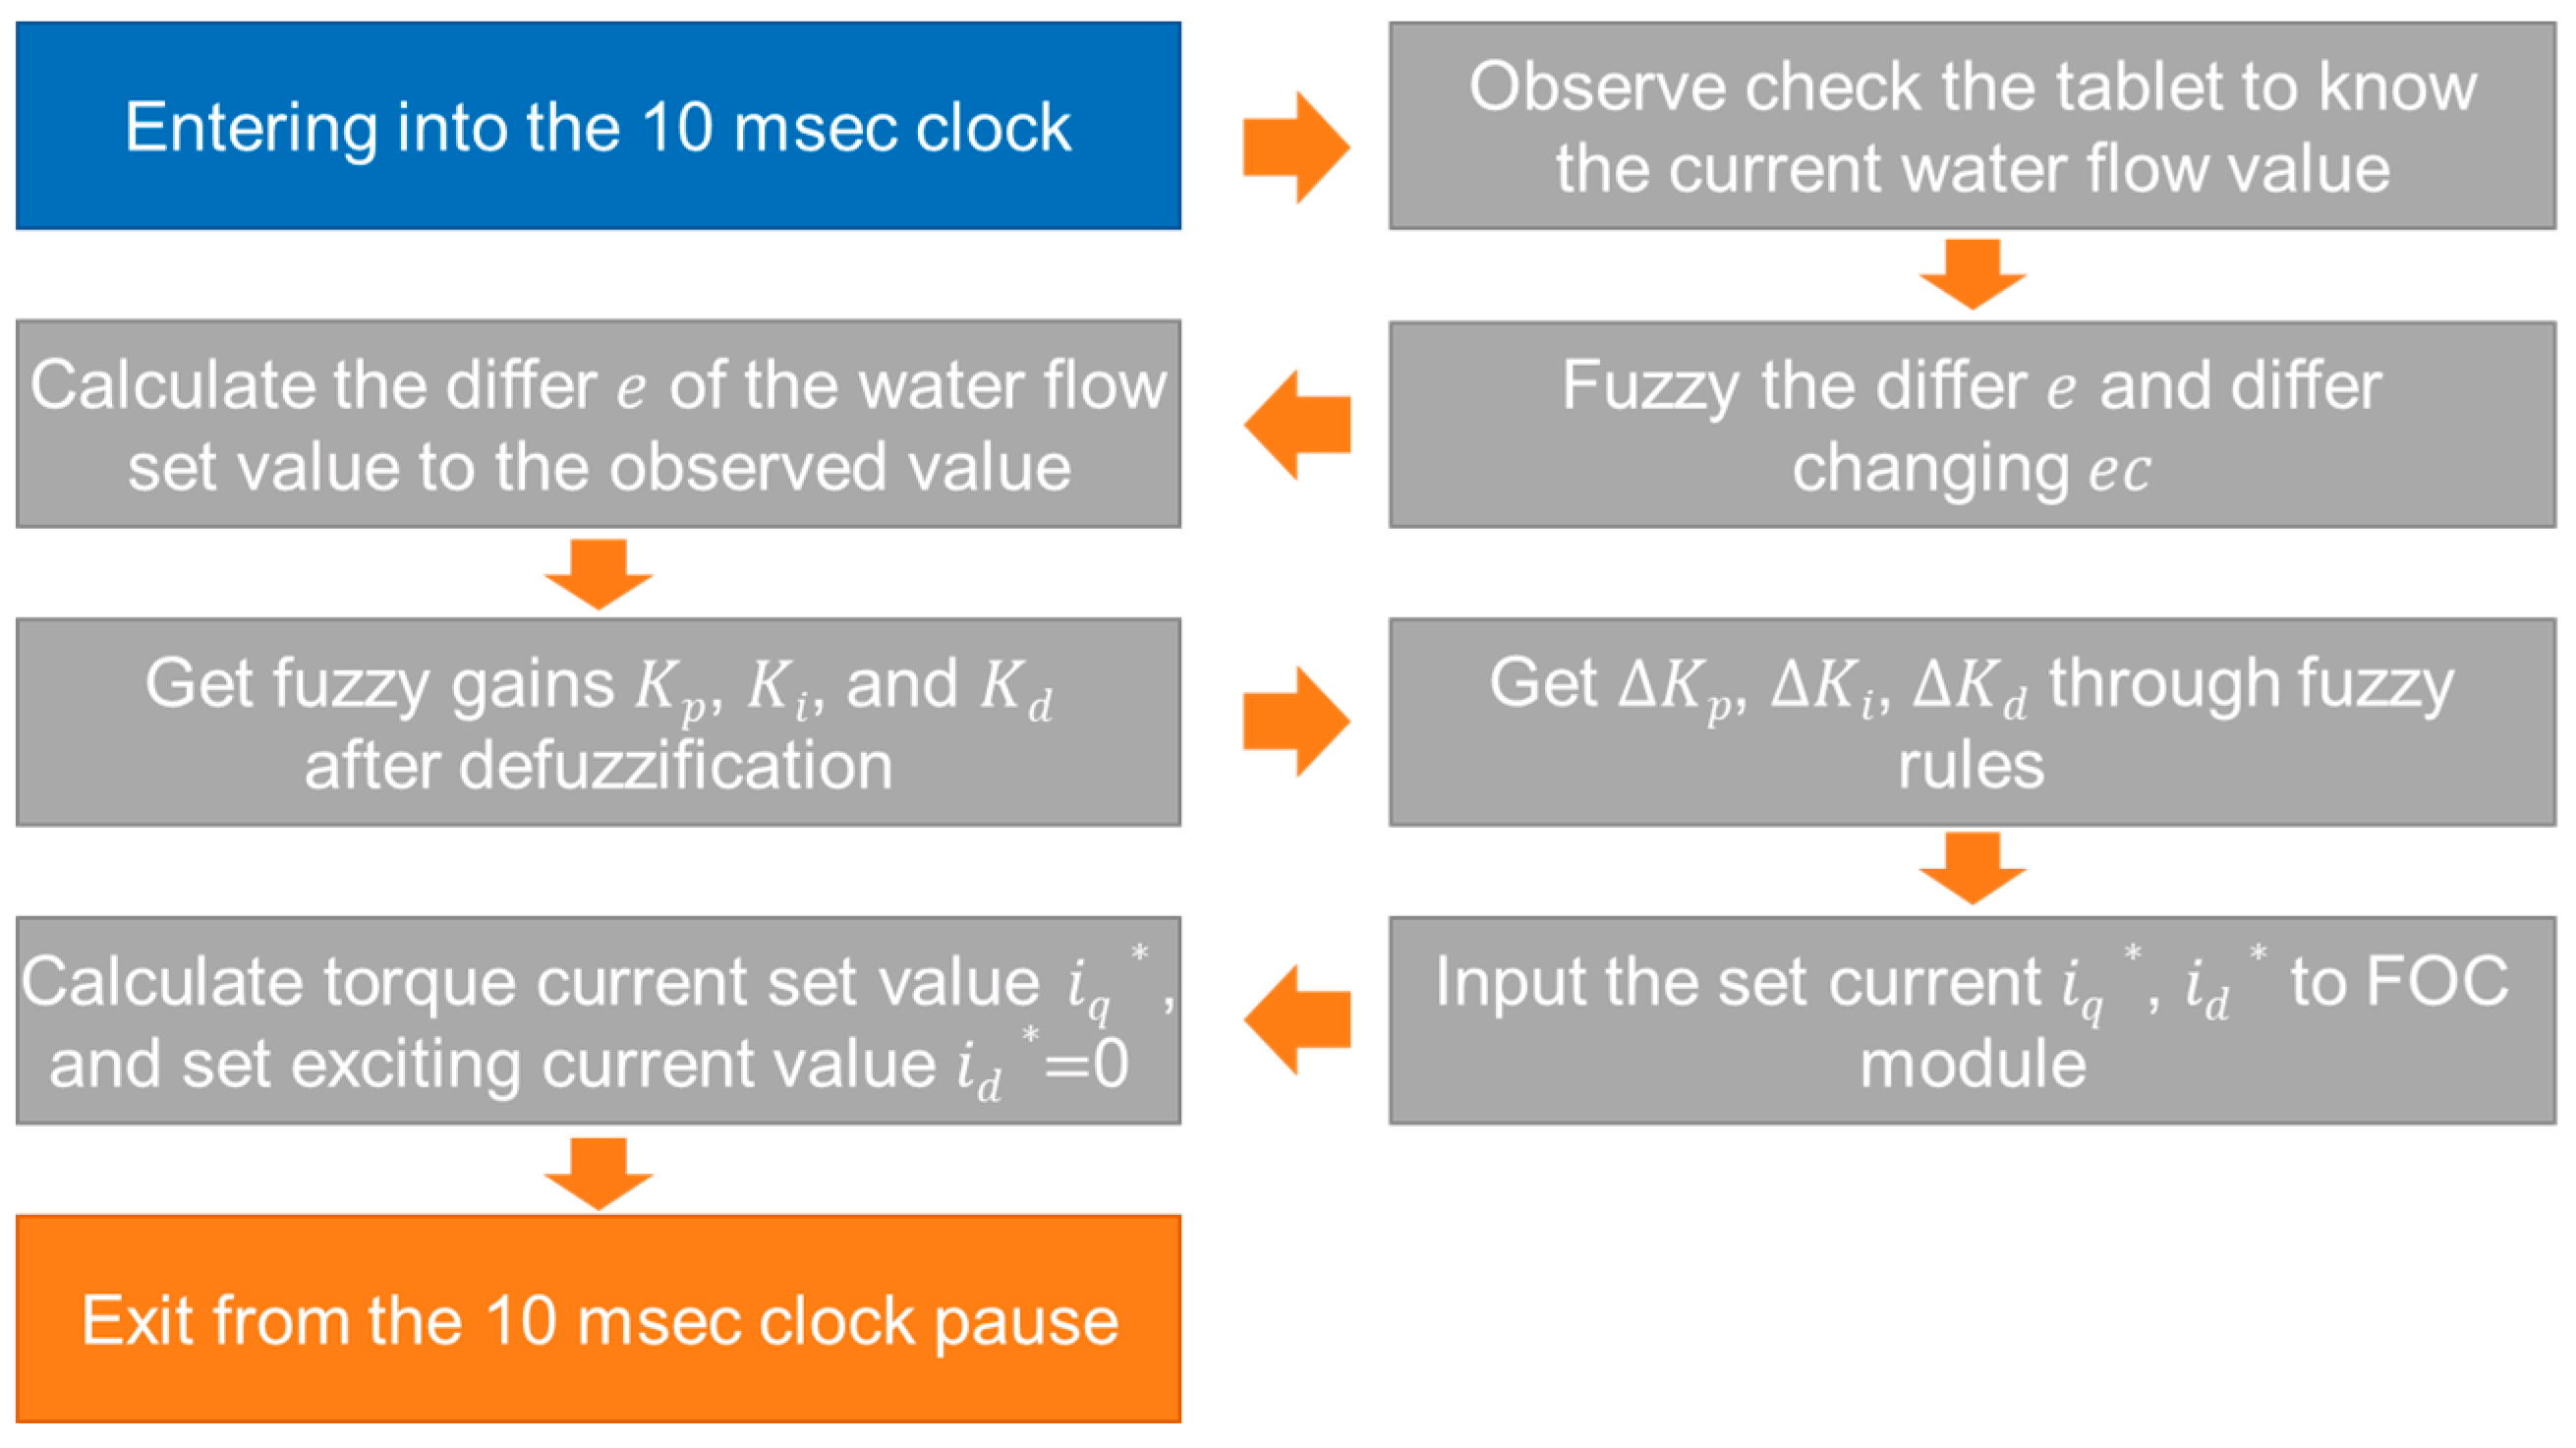
The tables above are uploaded and stored in the computer. In the control program, a subroutine is written to search and query the table. The water supply system calculates the error e ( k ) and the error change Δ e k = e k e k 1 based on the given water flow volume and water pressure value and the actual water flow volume and water pressure value feedback by the flow volume and pressure sensor. Then, the error e ( k ) and the error change Δ e k are multiplied by the quantization factors K e and K e c , respectively, to obtain the corresponding elements in the domain. Finally, by querying the corresponding row and column of the fuzzy control rule table, we obtain the required output control quantity Δ k . However, this control quantity is a value processed through the fuzzy logic system and needs to be multiplied by the scaling factor K u to convert it into the actual control value before being input to the actuator of the water supply system, as shown by the following equation.
K p = K p + Δ K p = K p + { e , e c } p
K i = K i + Δ K i = K i + { e , e c } i
K d = K d + Δ K d = K d + { e , e c } d
The system ultimately achieves real-time correction of the PID parameters, ensuring optimal control performance. In conclusion, the intelligent self-adaptive PID water supply system presented in this paper leverages the efficiency and speed of fuzzy control principles. By utilizing the system’s collected error and error change rate, the proportional constant K p , integral constant K i , and derivative constant K d of the PID controller are quickly adjusted through fuzzy computation and fuzzy control rule table lookup, making corresponding compensations Δ K p , Δ K i , and K d . This approach addresses the limitations of traditional PID control systems, where fixed parameters are unable to adapt to complex nonlinear systems. The values of gains are: Δ K p = 0.2, Δ K i = 0.1, K d = 1.

3.2.5. Self-Adaptive PID Fuzzy Control Chart Design

In order to make pump automatically adjust its output water flow and self-adjust its input power, we need to design a self-adaptive PID fuzzy control chart as shown below Figure 10.
A self-adaptive PID fuzzy control loop (manipulated variable is typically VFD frequency/motor speed; measured variable is the water flow) operates as follows:
P (proportional): Responds in proportion to the current error. Larger error → larger correction, giving fast reaction to disturbances and a “stiffer” loop. With pipeline inertia and delays, too much P causes oscillation/hunting; too little makes the response sluggish and produces a steady-state error.
I (integral): Accumulates past error to remove long-term small errors, achieving zero steady-state error. It compensates for pump curve effects, piping losses, valve position changes, supply pressure, fluid viscosity changes, etc. Excessive I can cause slow oscillations, overshoot, and long settling times, and may lead to integral windup. Use integral limits, conditional integration, or anti-windup strategies.
D (derivative): Acts on the rate of change of error to anticipate its trend, adding damping to reduce overshoot and speed up stabilization; helpful for sudden disturbances (e.g., quick valve moves). However, D amplifies measurement noise, and flow signals often have ripple/noise, so D is usually small or unused in flow control. If used, apply moderate measurement filtering or a filtered derivative.
In the context of constant flow for pumps:
With P only, a steady-state error typically remains (especially with centrifugal pumps influenced by the system resistance curve). The I term “wipes out” that error by nudging speed to exactly meet the target flow.
When disturbances occur (downstream valve changes, upstream pressure or temperature shifts), P reacts quickly; I then trim to zero error; D helps suppress overshoot and oscillations caused by water-column inertia and signal delays.
Flow measurements often contain noise/pulsation (from the flow meter, turbulence, positive-displacement pulsation, etc.), which limits usable P and D gains. Apply reasonable low-pass filtering/averaging, but avoid excessive filtering that adds delay.

4. Experiment and Results

4.1. Testing Sample Building

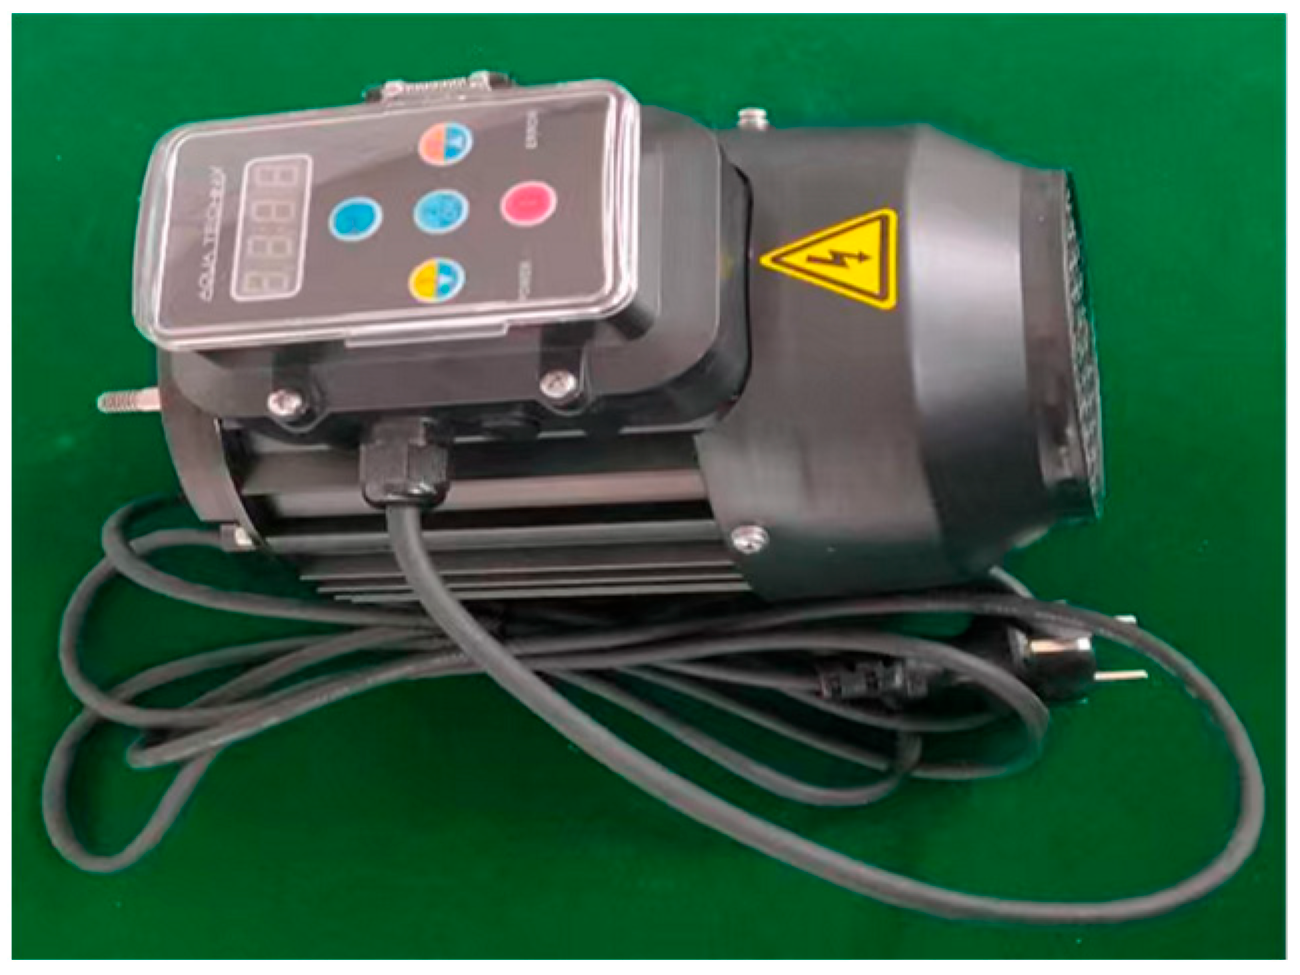
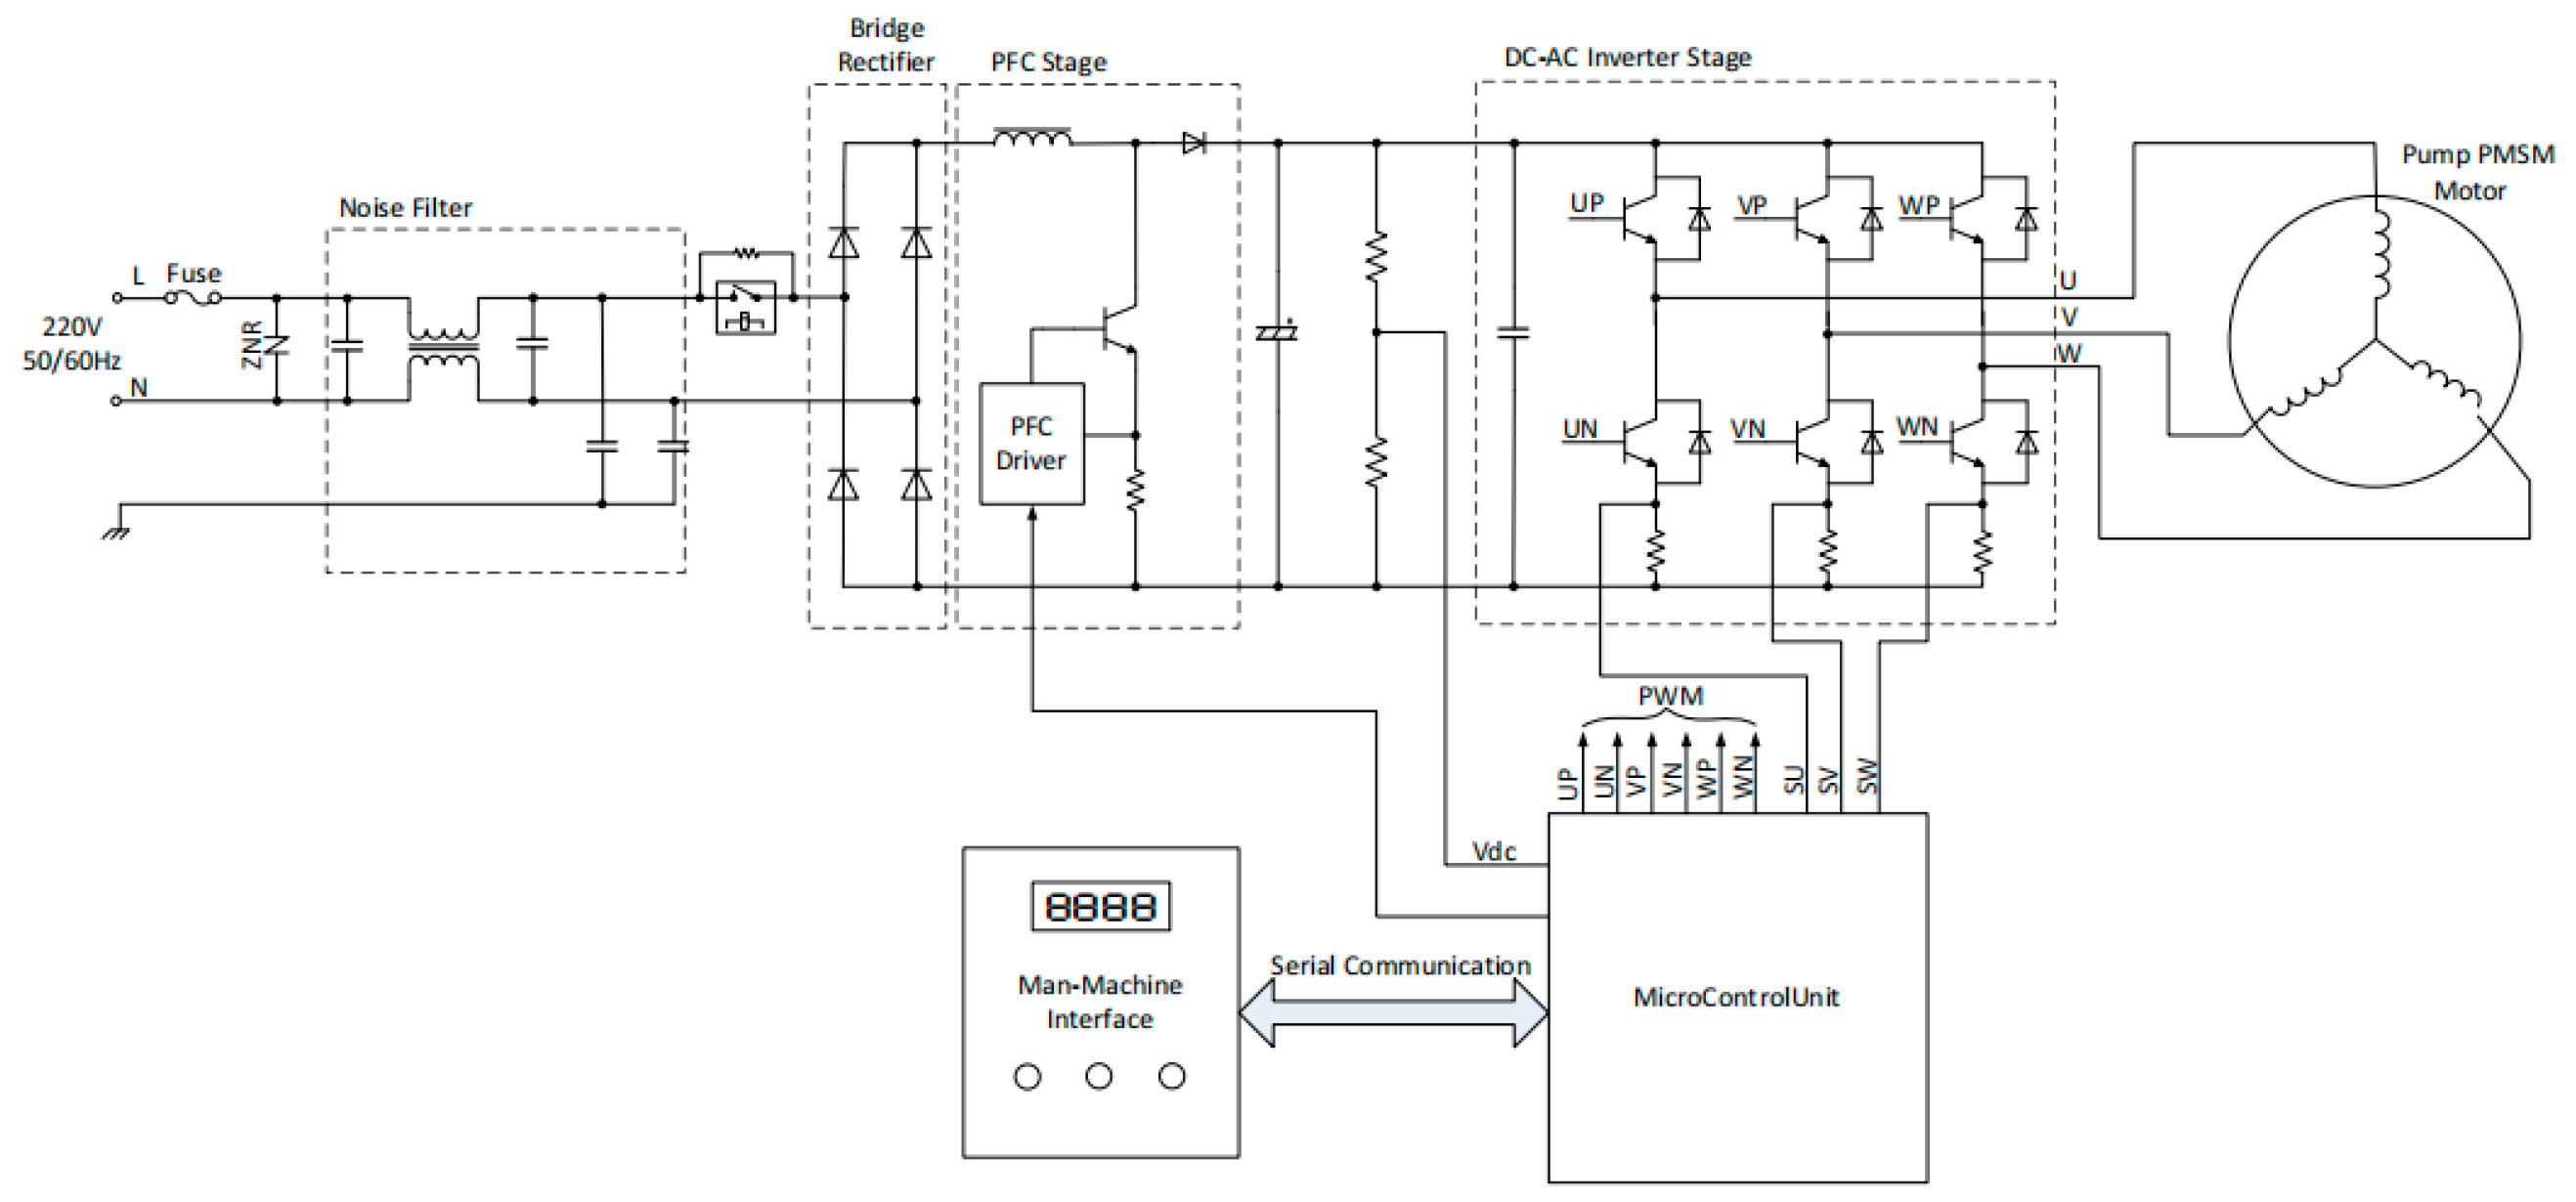
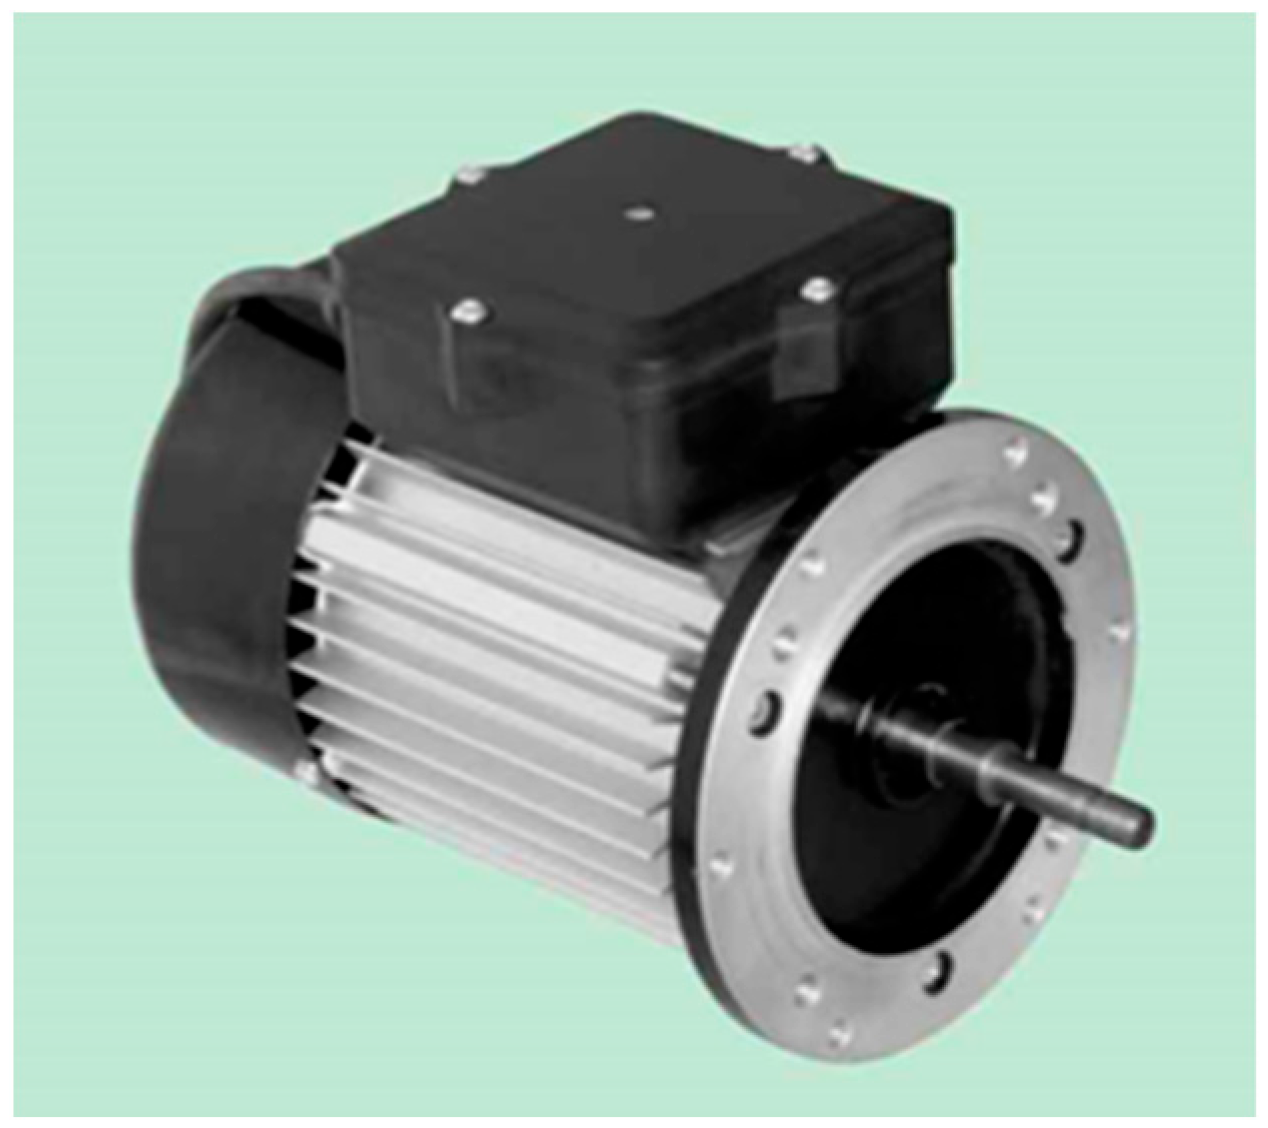
This experiment involves the construction of a PMSM motor (Nanjing Watt Electric Motors Corporation, Nanjing, China), as shown in Figure 11. The motor is an 8-pole permanent magnet motor with a rated output power of 750 W and a maximum output power of 850 W. Figure 12 shows the schematic diagram of the PMSM motor, and it can be found that the PMSM power supply is from an DC-AC inverter, so either 3-phase power or a single-phase power supply could be applied through an inverter. As shown in Figure 13, it also used an AC asynchronous motor (Nanjing Watt Electric Motors Corporation, Nanjing, China) with the following specifications of rated input power supply: 220 V 50 HZ, rated current of 4.2 A, a 2-pole motor, rated speed of 2800 RPM, rated output power of 750 W, and a starting capacitor of 25 uF. The specific specifications are as shown in Table 8.

4.2. Testing Platform Building

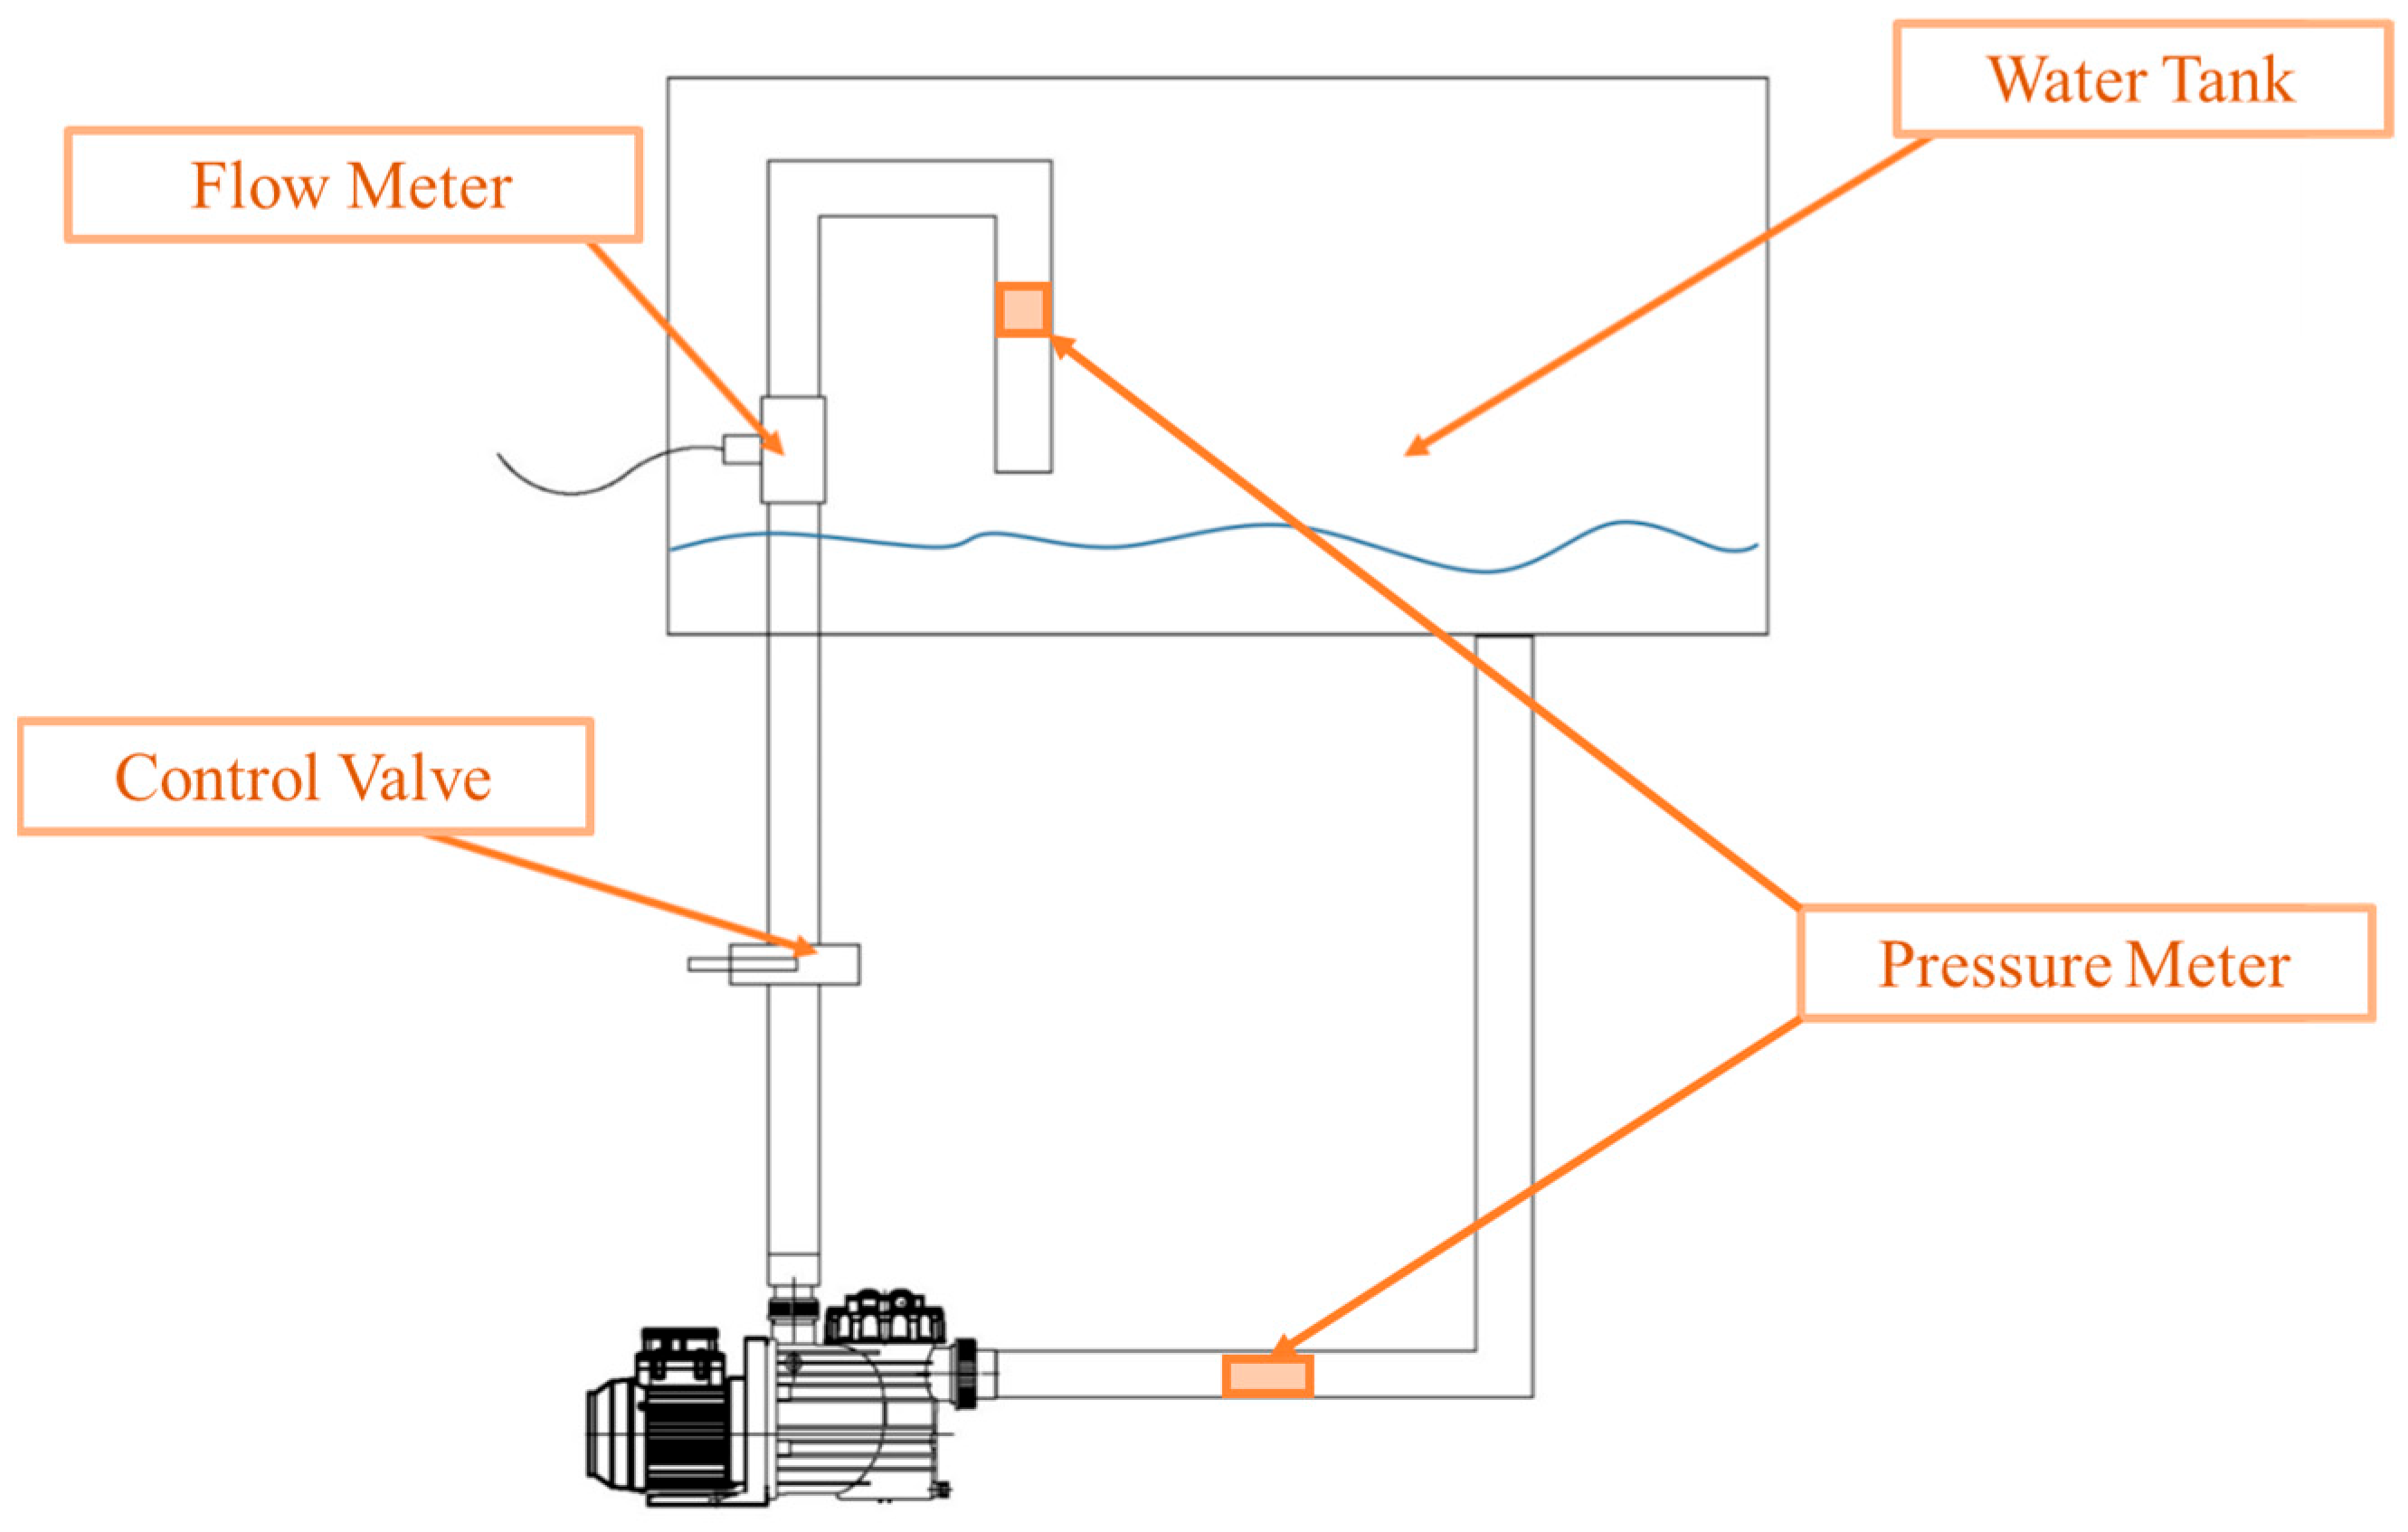
Figure 14 shows the testing platform, including power supply, water flow volume meter, control valve, water pressure meter, water tank, and water pipes.
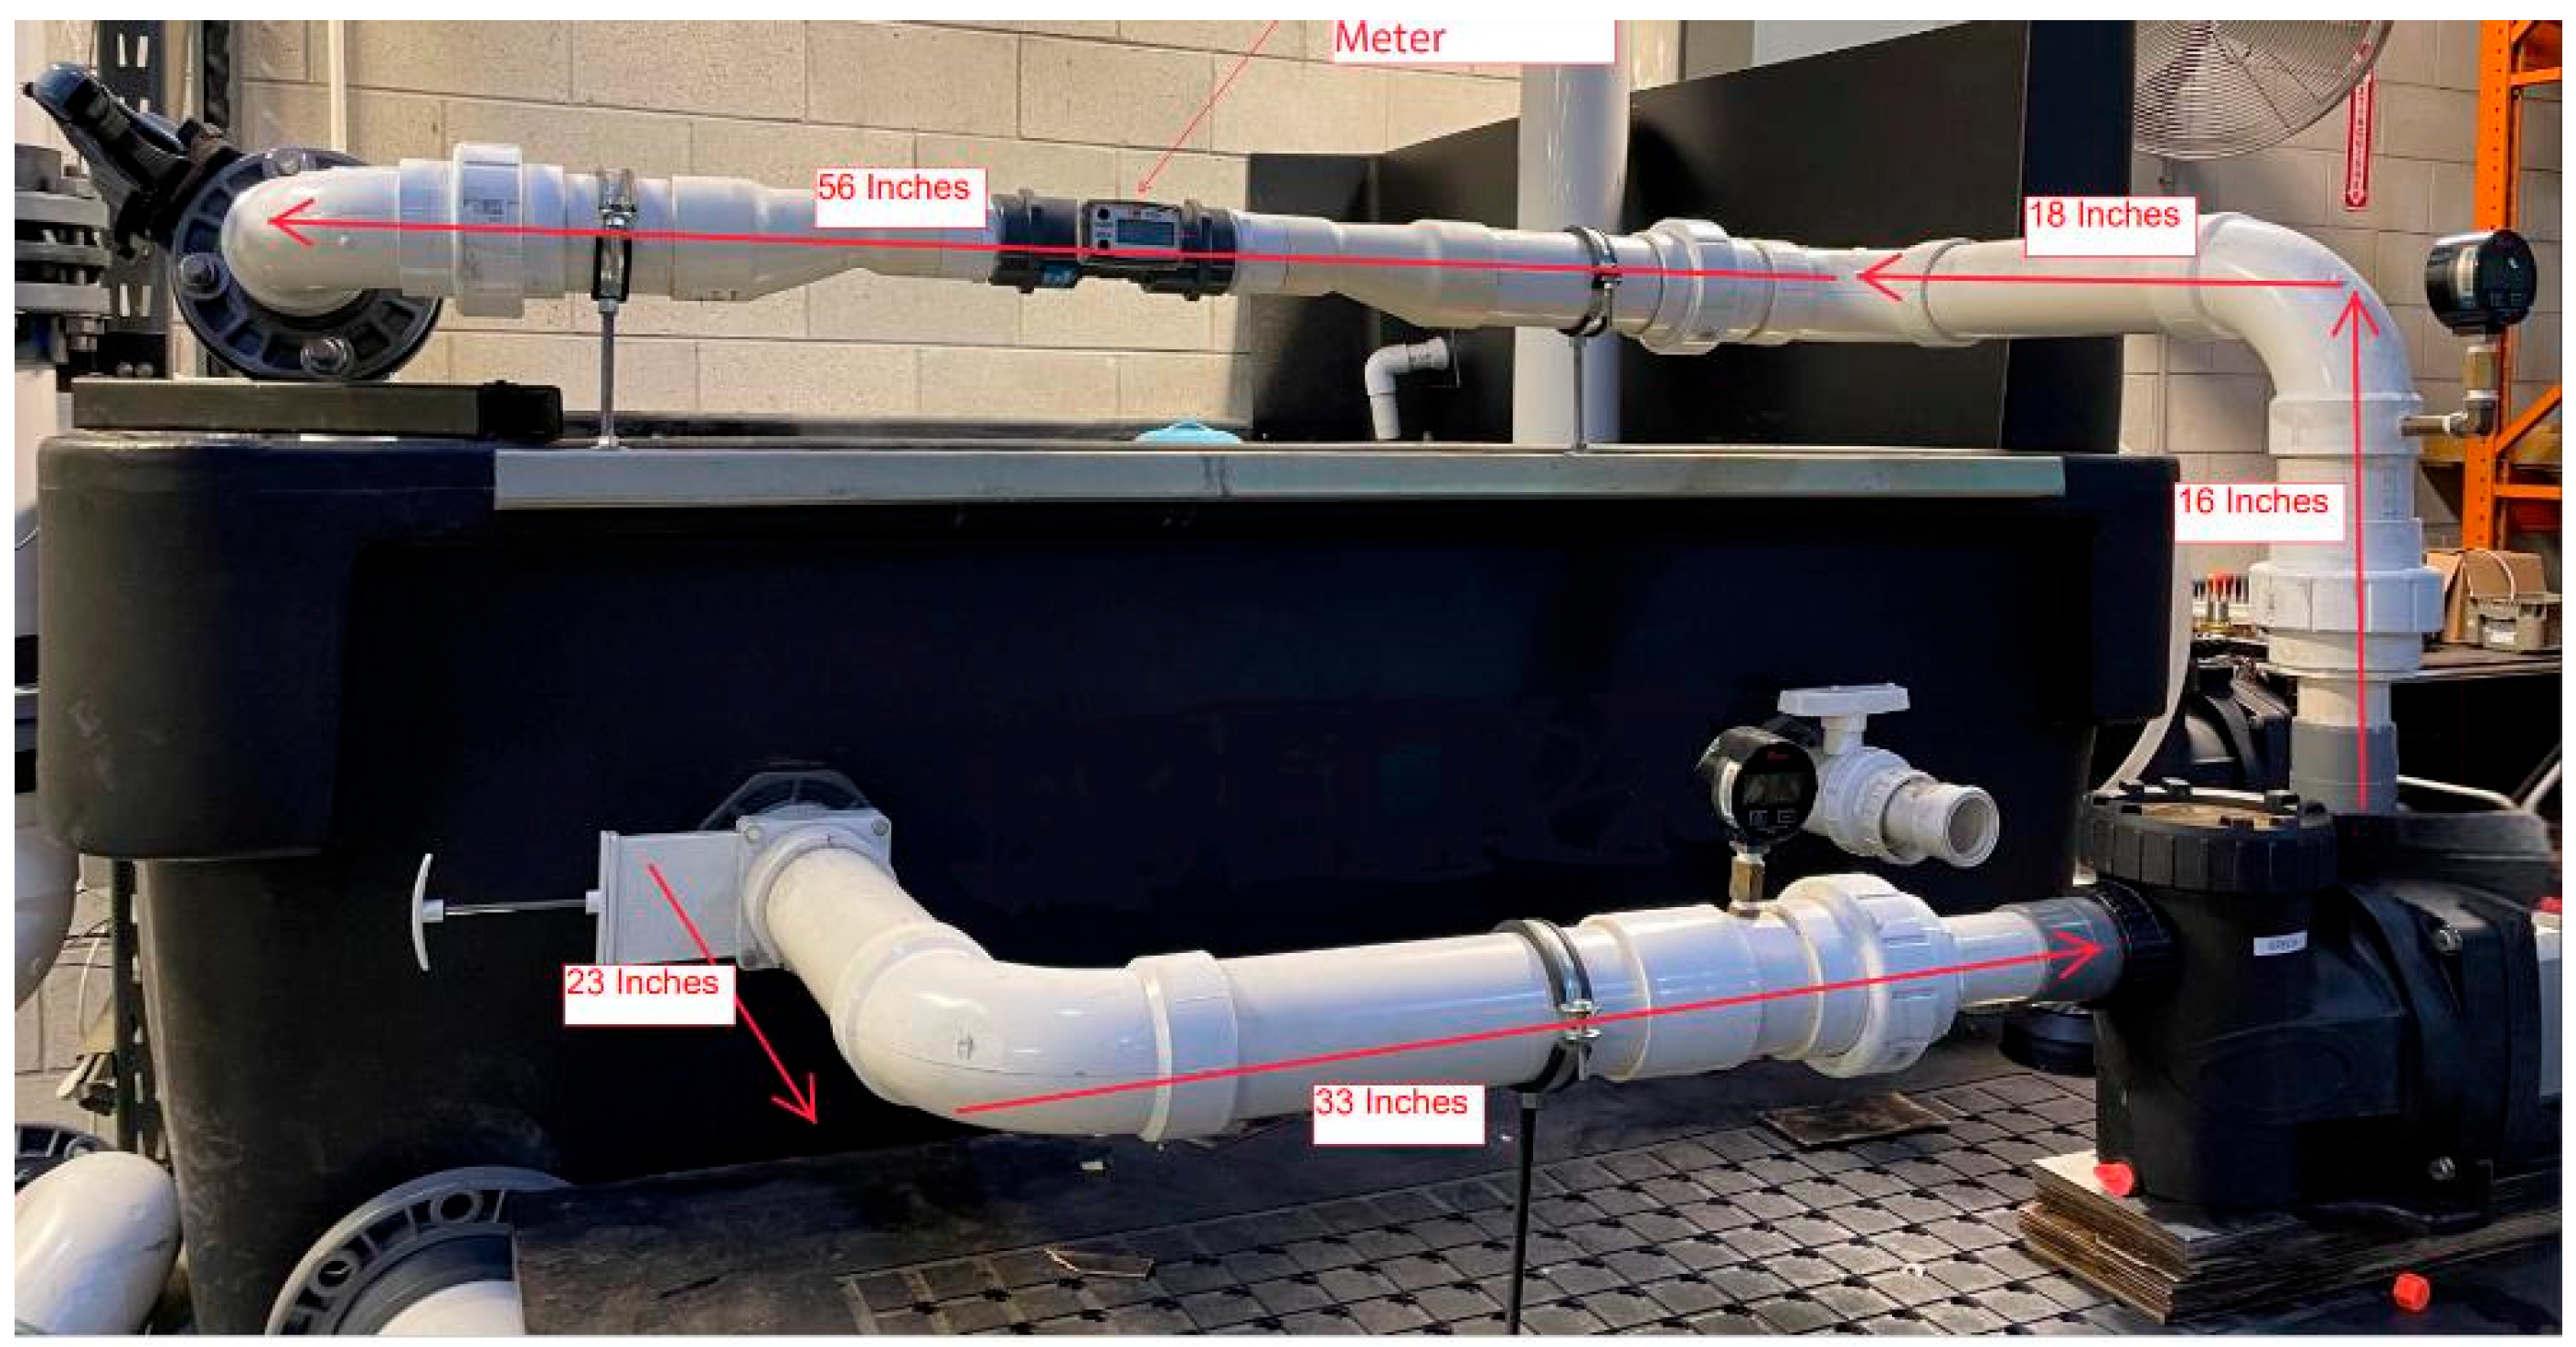
In the pipes used to connect the pump, valve, flow meter, and pressure meter, the diameter of the I.D = 3.0 inches, the O.D = 3.5 inches, and the material was PVC (each part of the pipe length is shown in Figure 15). At the pump suction and discharge ports, the pipe size was reduced to 2 inches. The flow meter testing capability was 0–50 M3/h with a tolerance of ±0.005 M3/h. The pressure meter testing capacity was 0–3.5 bar with a tolerance of ±0.005 bar. The meters were monitored every time the valve close rate was changed.

4.3. Experiment Method and Results

The pumps were tested by setting a fixed input power first, then changing the valve on the pipe to see how the water flow and pressure changed, using the water flow and water pressure sensors to detect the data changing; then, the pump performance curve of water flow vs. water pressure was drawn.
The fuzzy controlled PMSM pump used was a variable-speed pump that can work at different speeds, and at each speed, it has a corresponding input power. However, this is not a certain relation: as soon as the water pressure changes, the input power corresponding to each speed will change too if the same water flow is kept, or the input power is kept constant. The water flow will have to change when water pressure changes. The symbols used in the testing are shown below in Table 9.
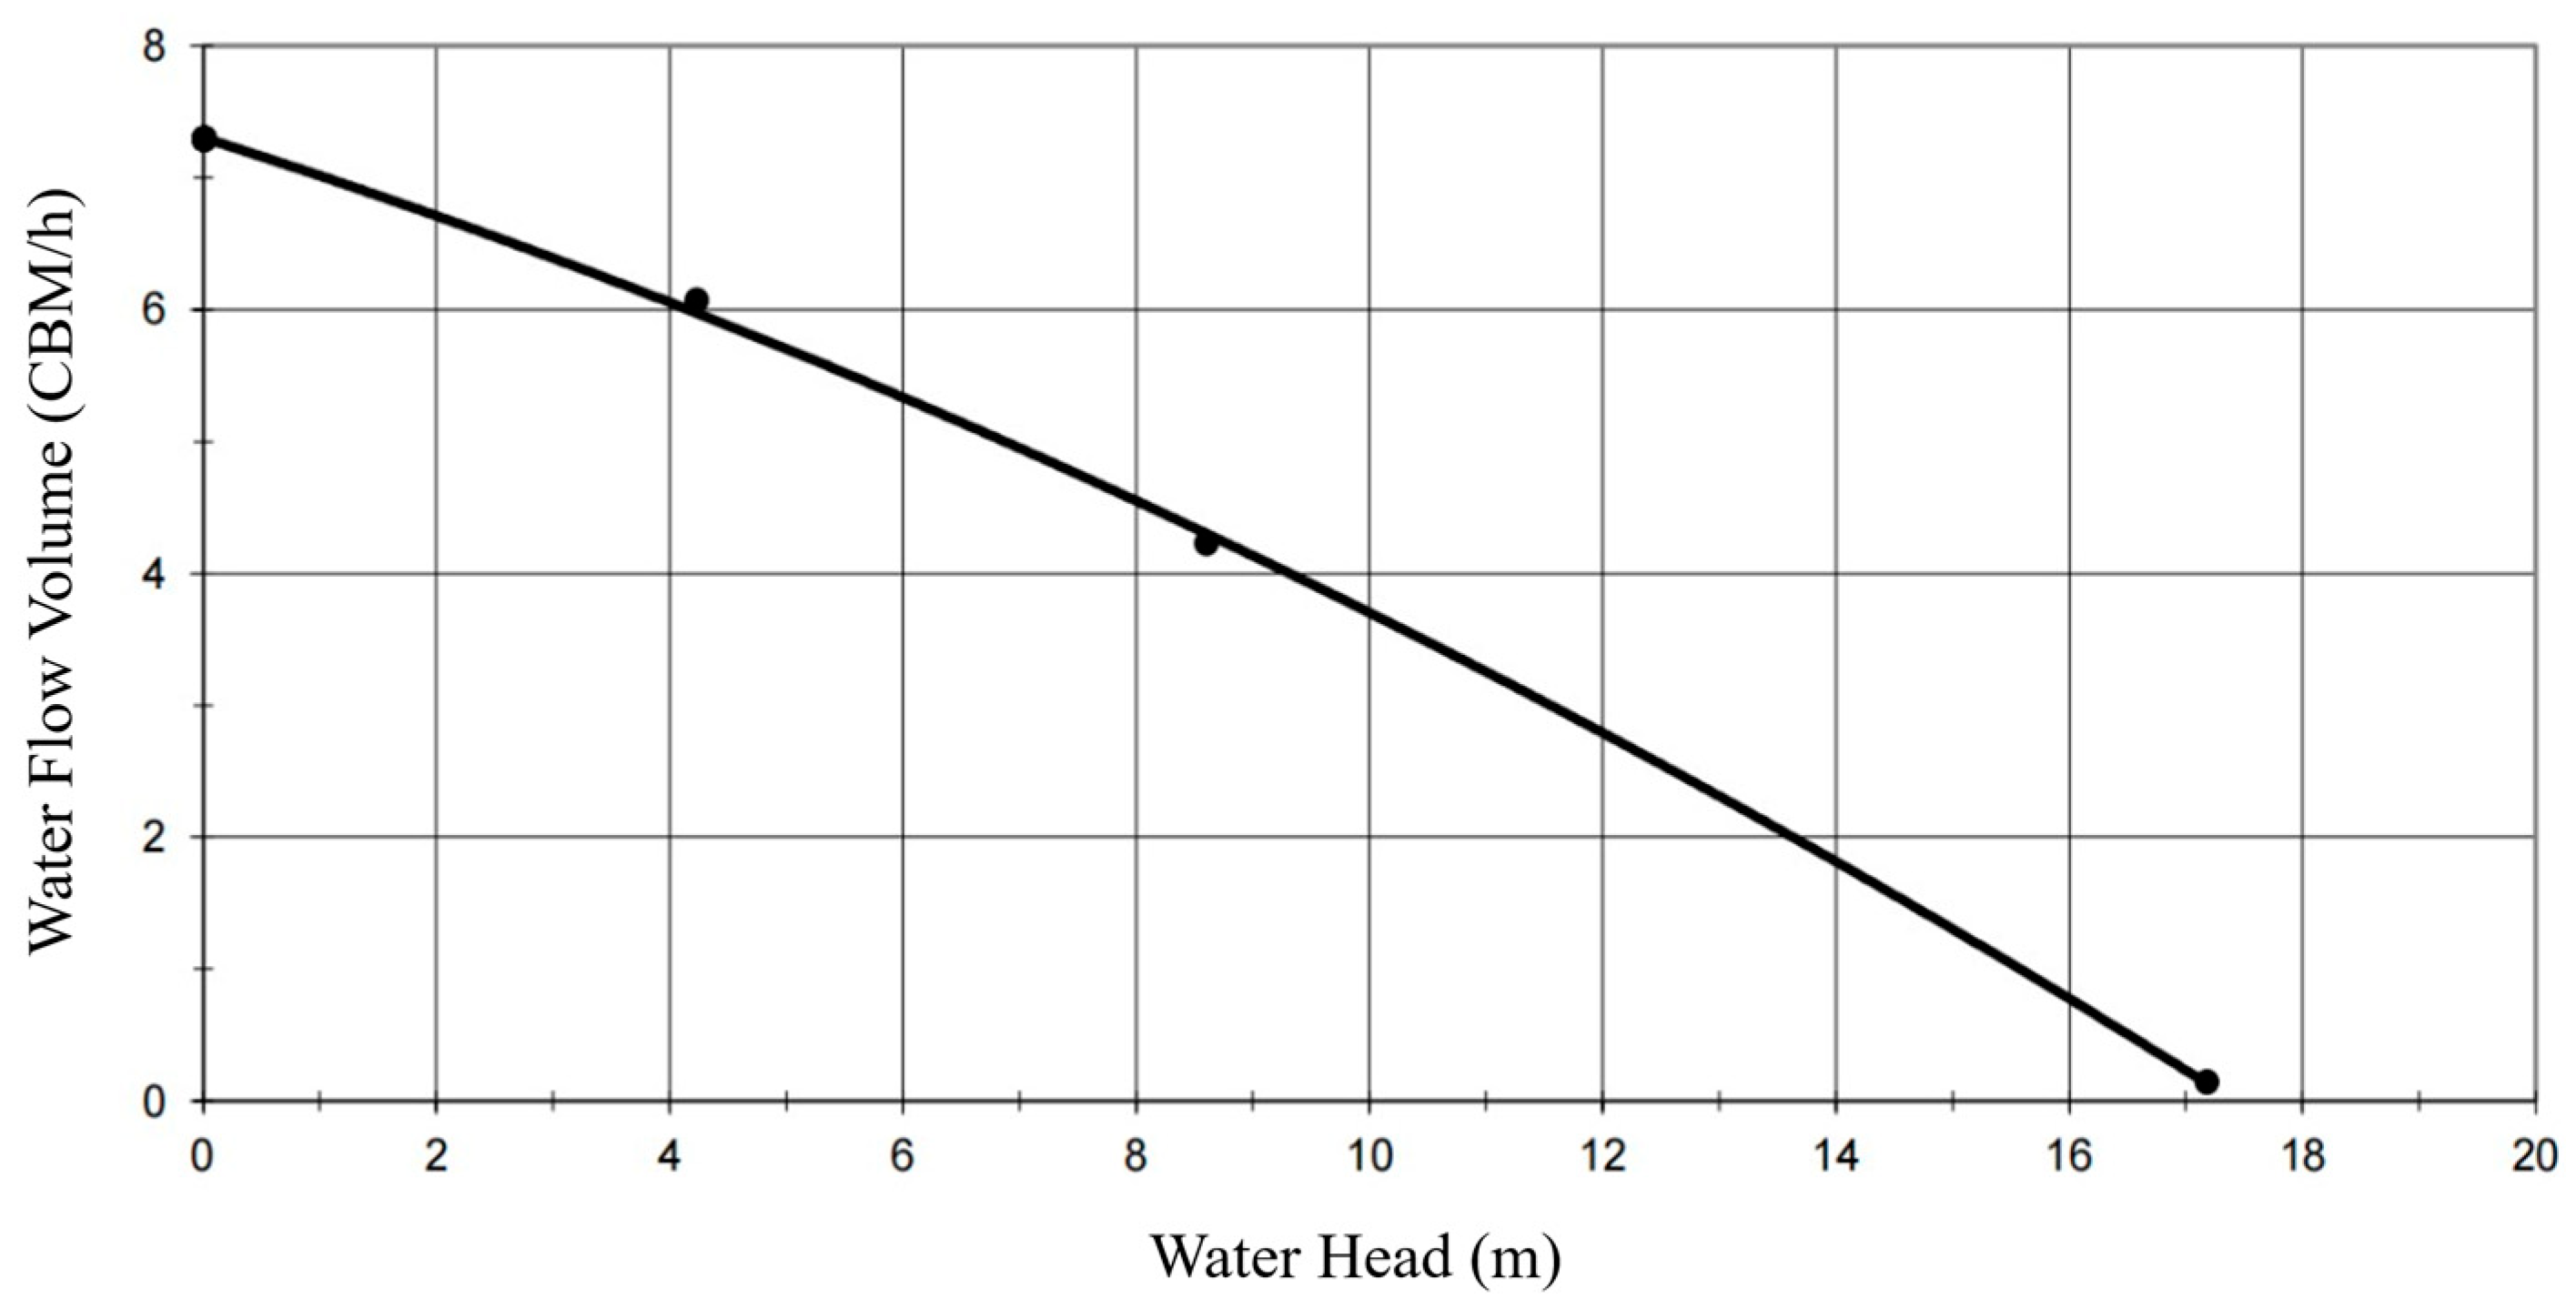
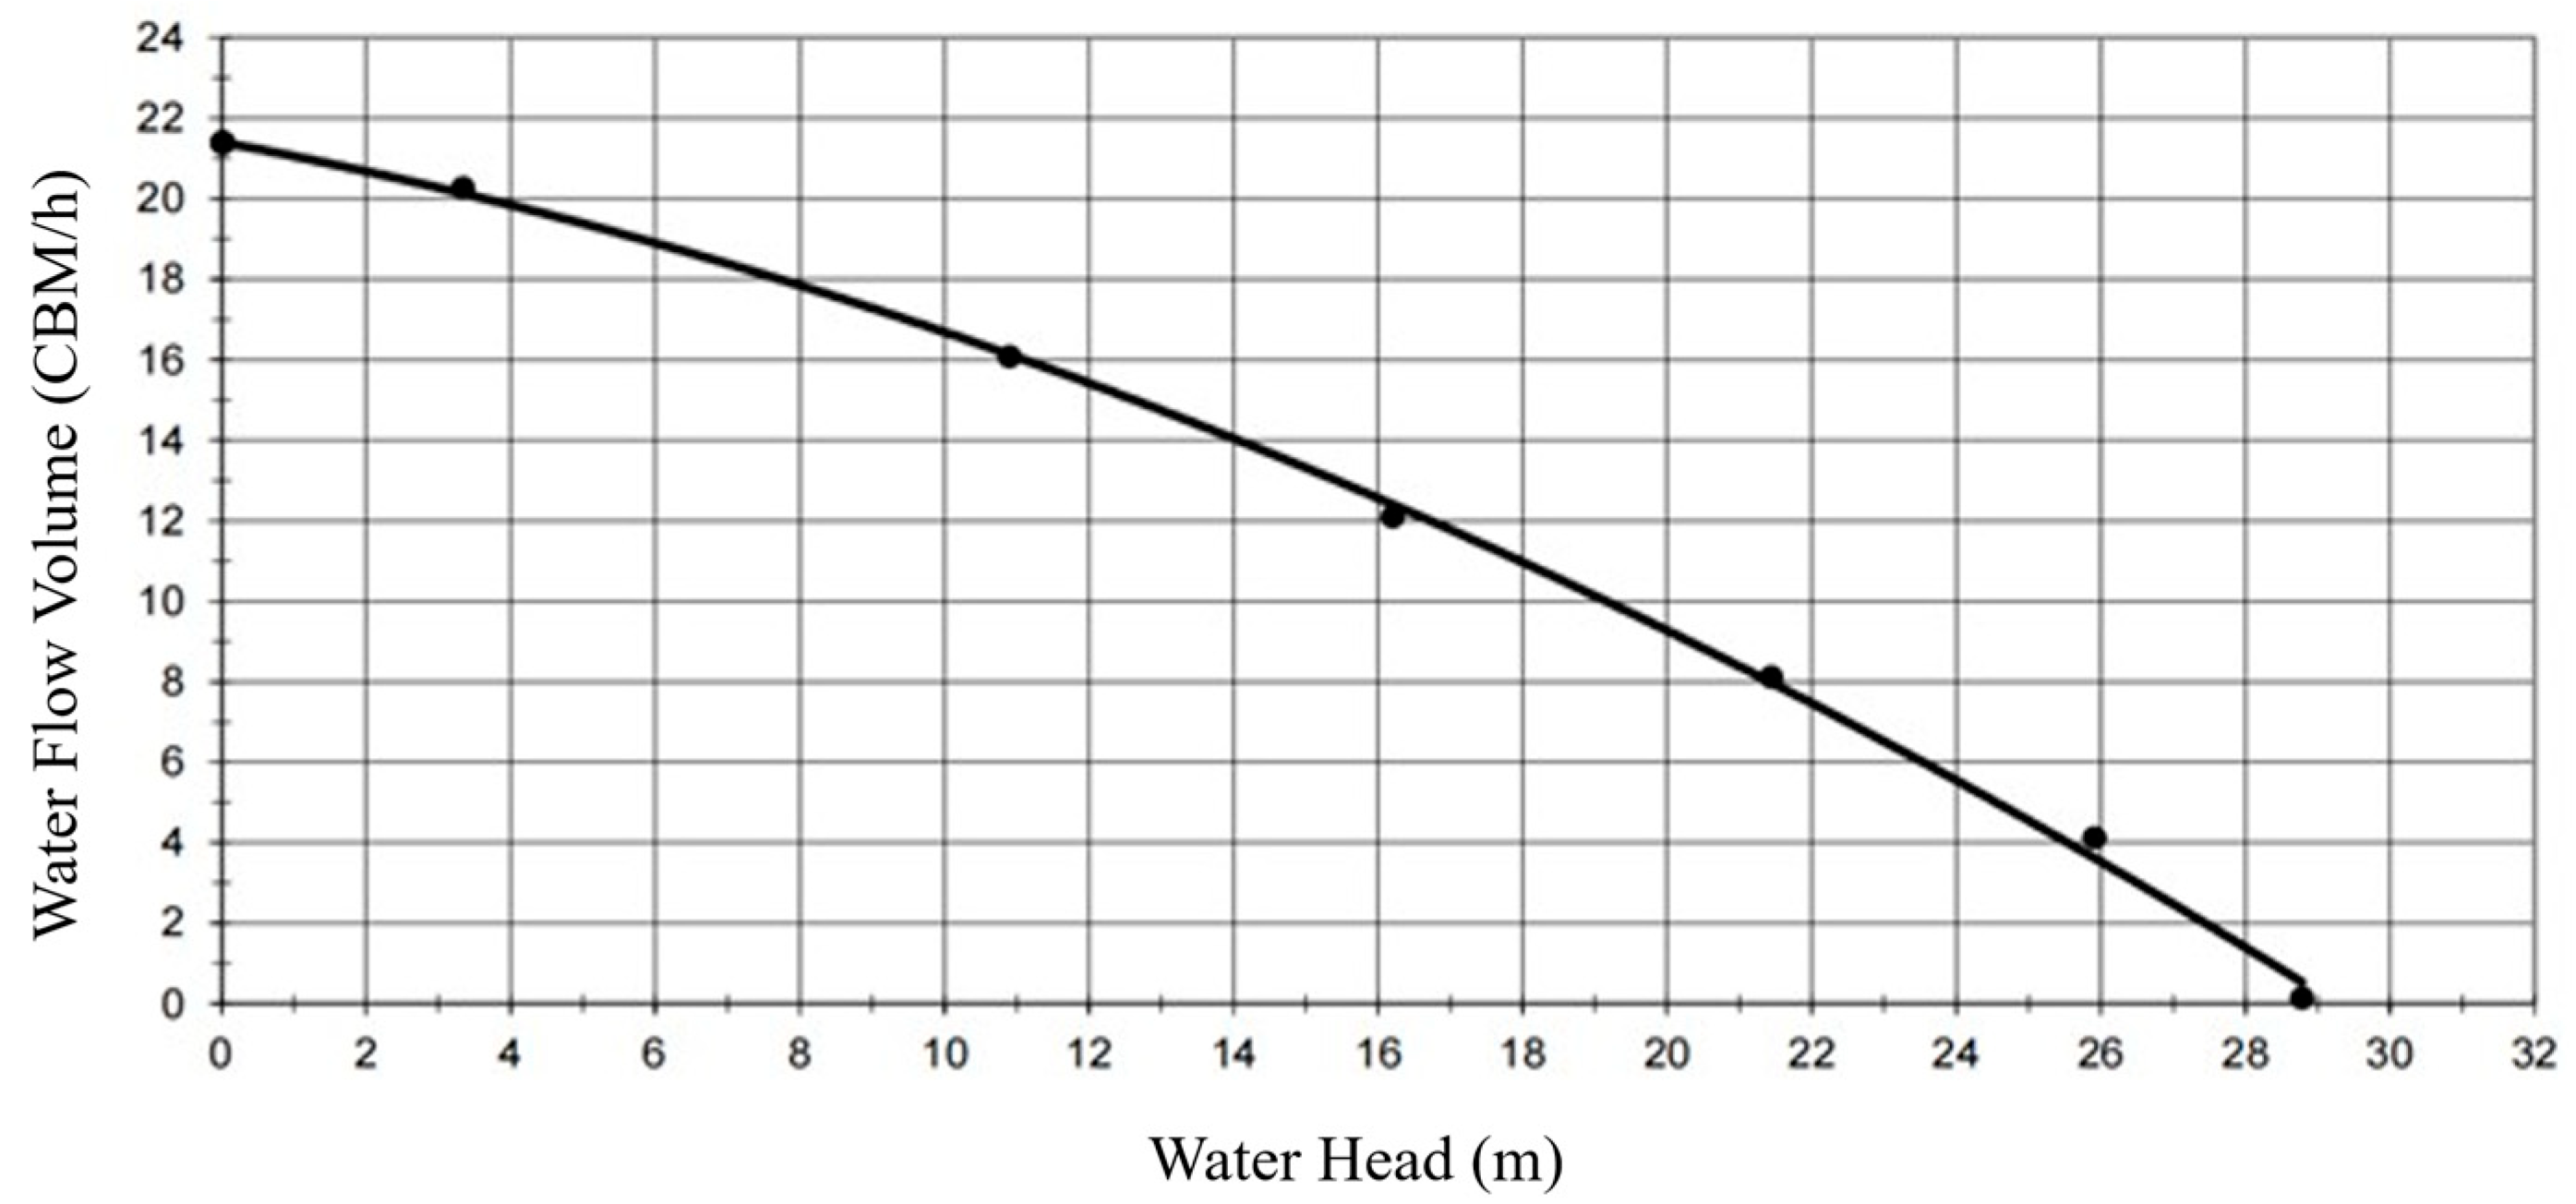
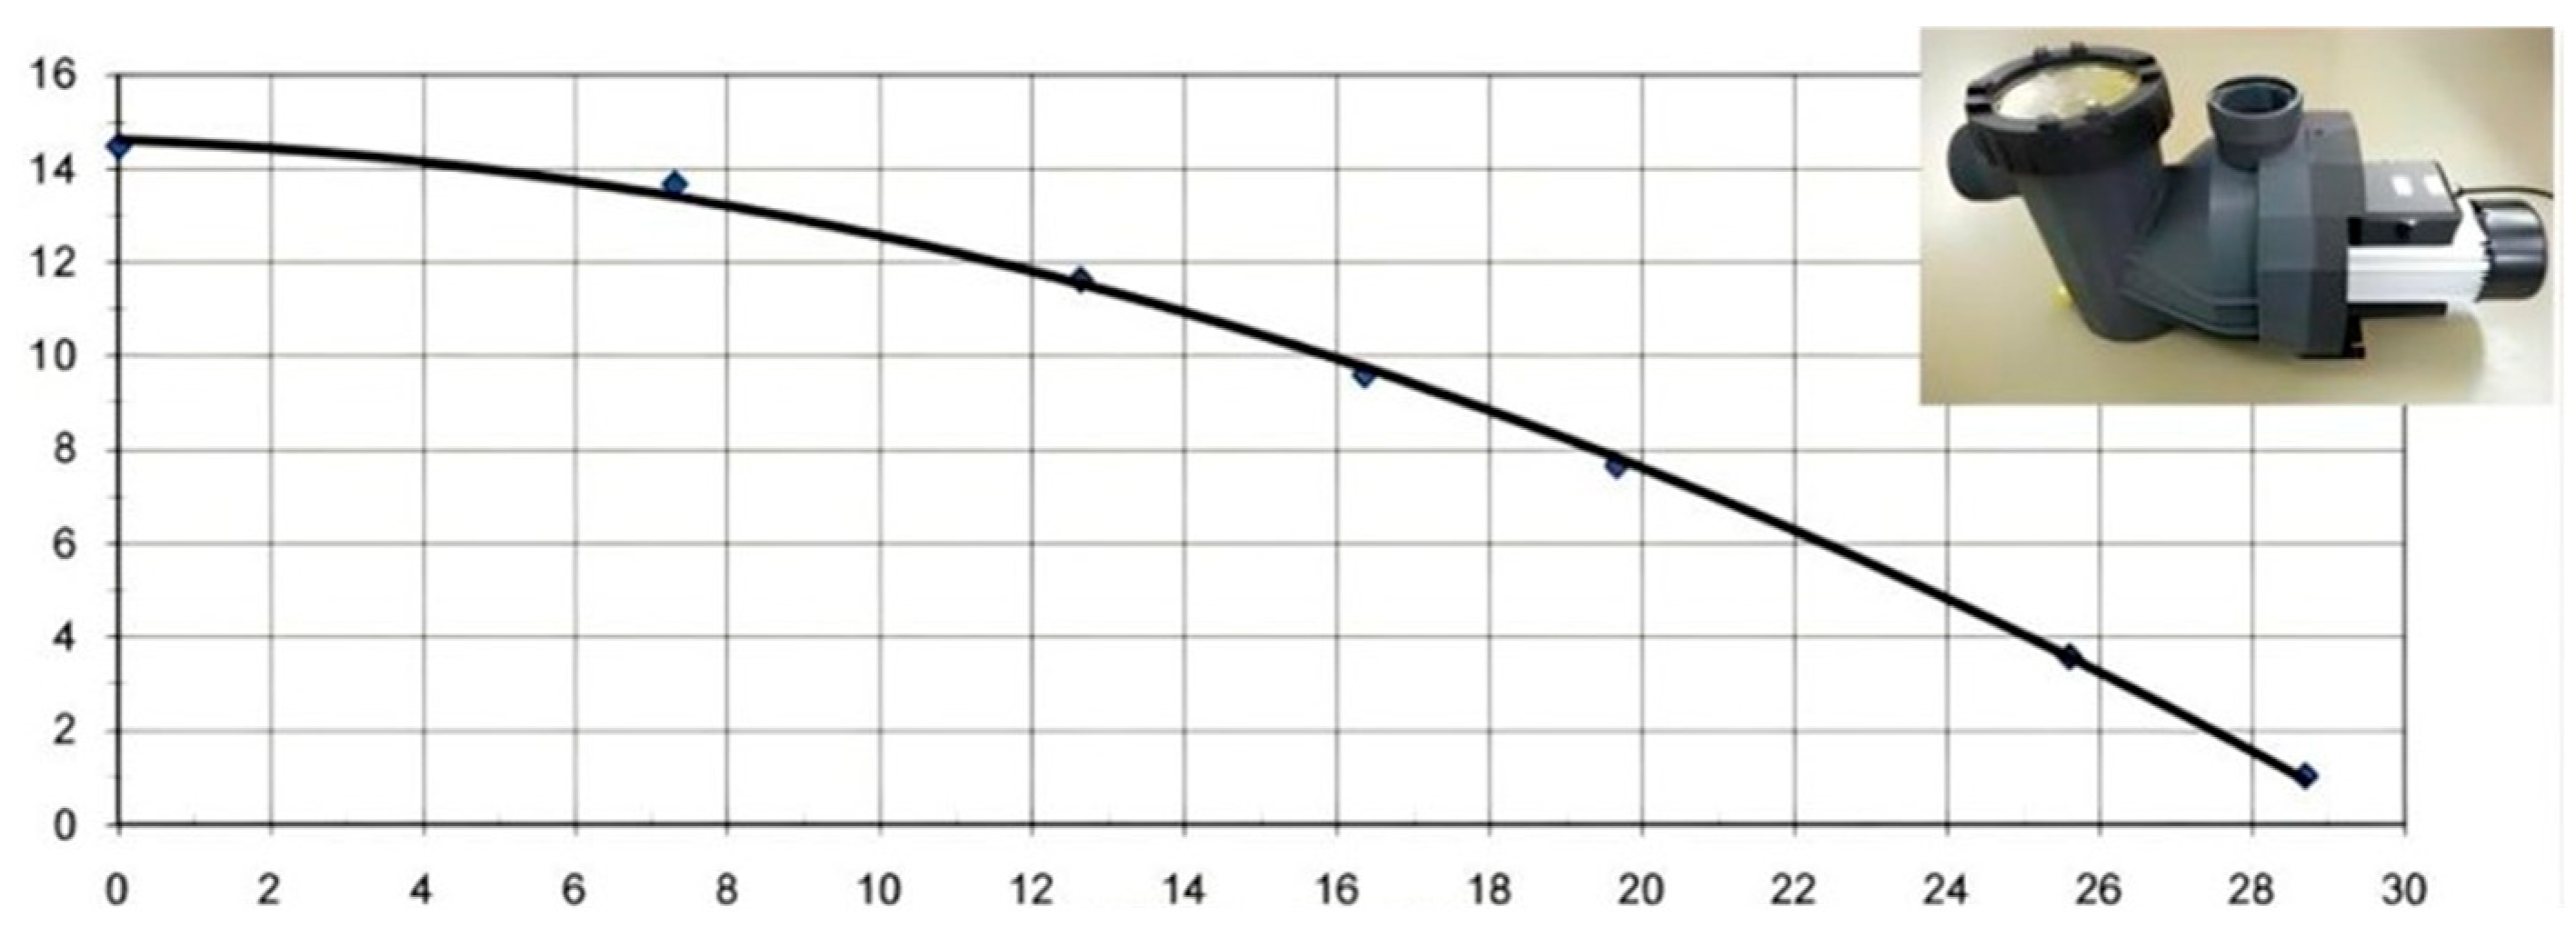
Table 10 and Table 11 correspond to the testing results when motor input power is 230 W and 1100 W. Figure 16 shows the tested pump performance curve when the motor input power is 230 W. Figure 17 shows the pump performance curve when motor input power is 1100 W.
Based on the testing data in Table 10, pump performance curve is expressed by water flow volume and water pressure in Figure 14 when motor input is 230 W. Table 10 and Figure 14 show the direct relationship of water flow and water pressure with motor input power and current.
It is noted in the test results that when a constant power of 230 W is input into the pump system (driving motor), the pump output a water flow volume and water head curve, which is actually a curve of speed and shaft torque. From Table 10, we can see the water flow is not a linear relationship to the pump impeller speed. It is not a relationship of “more speed, more water”, it is actually a relationship of “more speed (water pressure), less water” if the input power is fixed (in Table 10, when pump impeller speed is 1586 RPM, the water flow is 17.18 M3/h, and 1632 RPM with 8.6 M3/h water flow volume).
Based on the testing data in Table 11, the pump performance curve is expressed by water flow volume and water pressure in Figure 17 when motor input is 1100 W. Table 11 and Figure 17 build up the direct relationship of water flow, water pressure with motor input power, and current.
It is noted that when a constant input power of 1100 W is input into the same pump system (driving motor), when pump impeller speed is 2798 RPM, the water flow is 28.78 M3/h, and when speed is 2978 RPM, the water flow volume is 10.9 M3/h.
If we compare the two Table 10 and Table 11,it is noted that in Table 11, an input 230 W pump could output a water flow volume at 8.6 M3/h when its speed is 1632 RPM, and a volume of 17.18 M3/h with a speed 1586 RPM, so we could assume it could output 10.9 M3/h at a speed around 1622 RPM. In Table 11, an input 1100 W pump system could output 10.9 M3/h when its speed is 2978 RPM. So the same pump could output the same water flow volume at different speeds when the input power is different, if the online water demand at this time is 10.9 M3/h. Obviously, 230 W input power to the pump system is much more energy saving than 1100 W input power to the pump system.
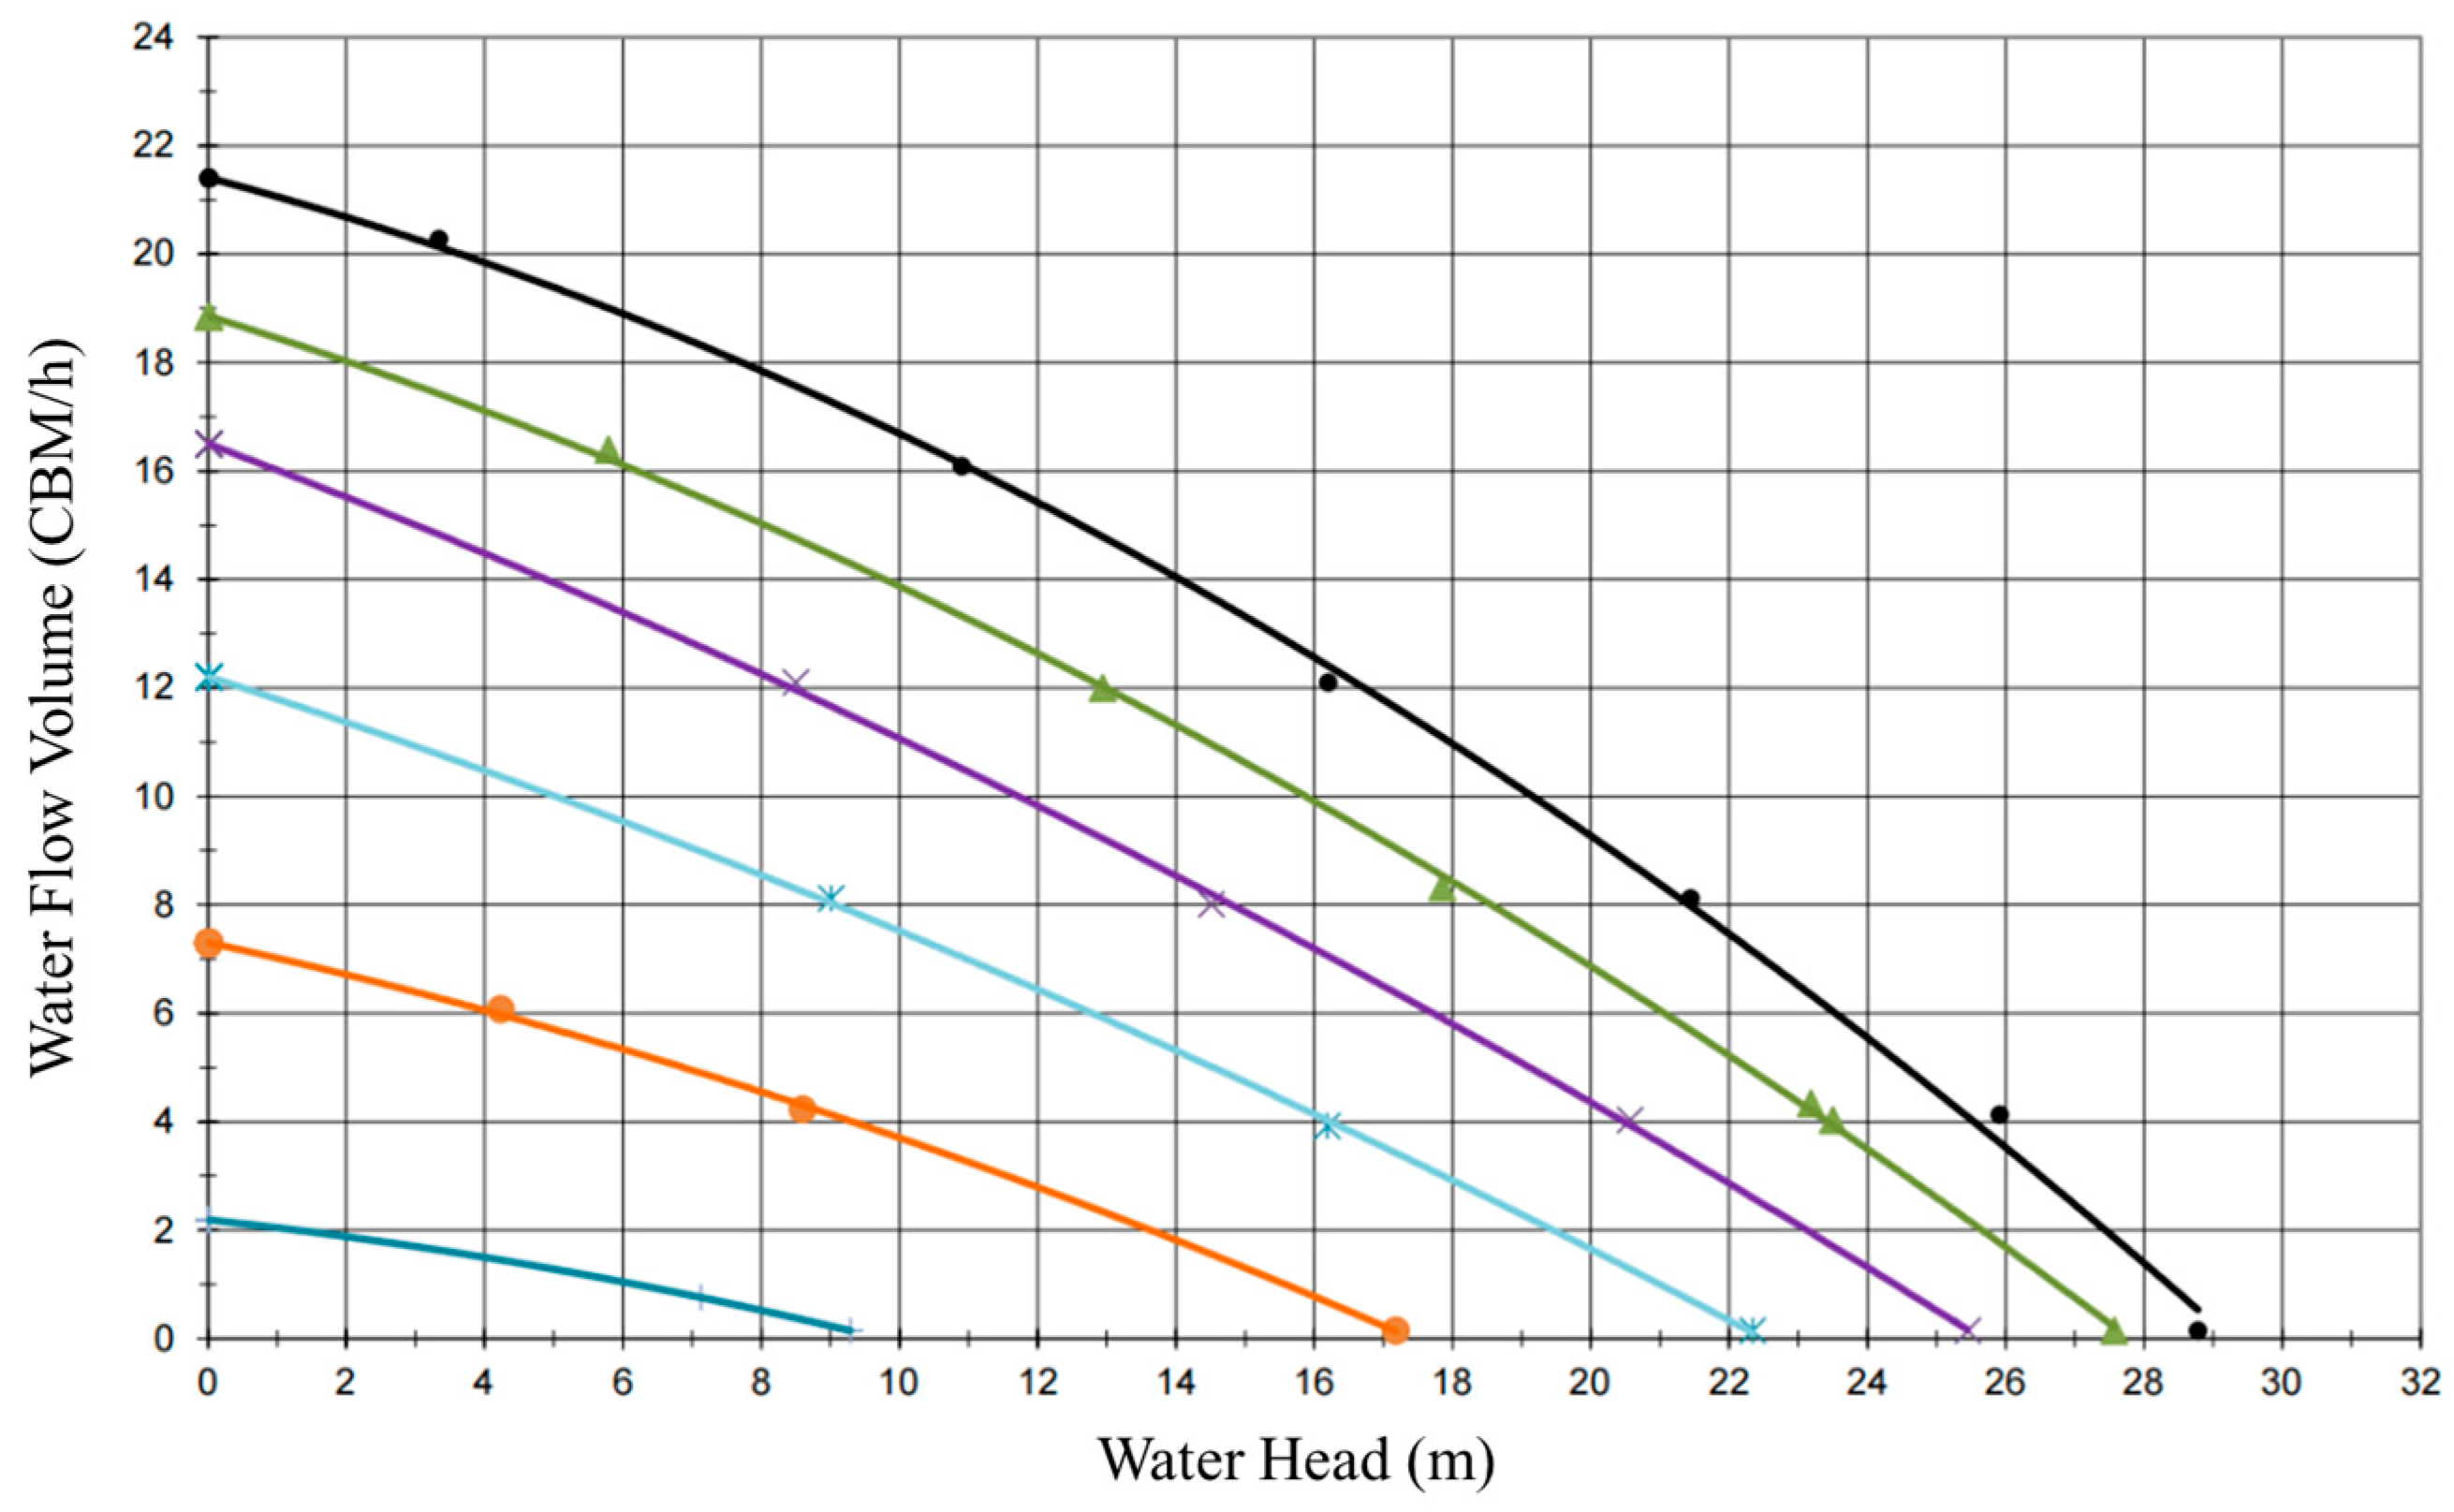
In the same way, the researched new pump system’s water flow vs. water pressure performance curve at different input power values of 60 W (dark blue), 230 W (orange), 450 W (light blue), 680 W (purple), 880 W (green), and 1100 W (black) could be drawn as below in Figure 18. The curve colors change from dark blue to black as the input power changes from 60 W to 1100 W. So, the direct relationship between pump output performance to motor input power, and current, has been established through the testing. This could work as the observation tablet in the fuzzy algorithm.
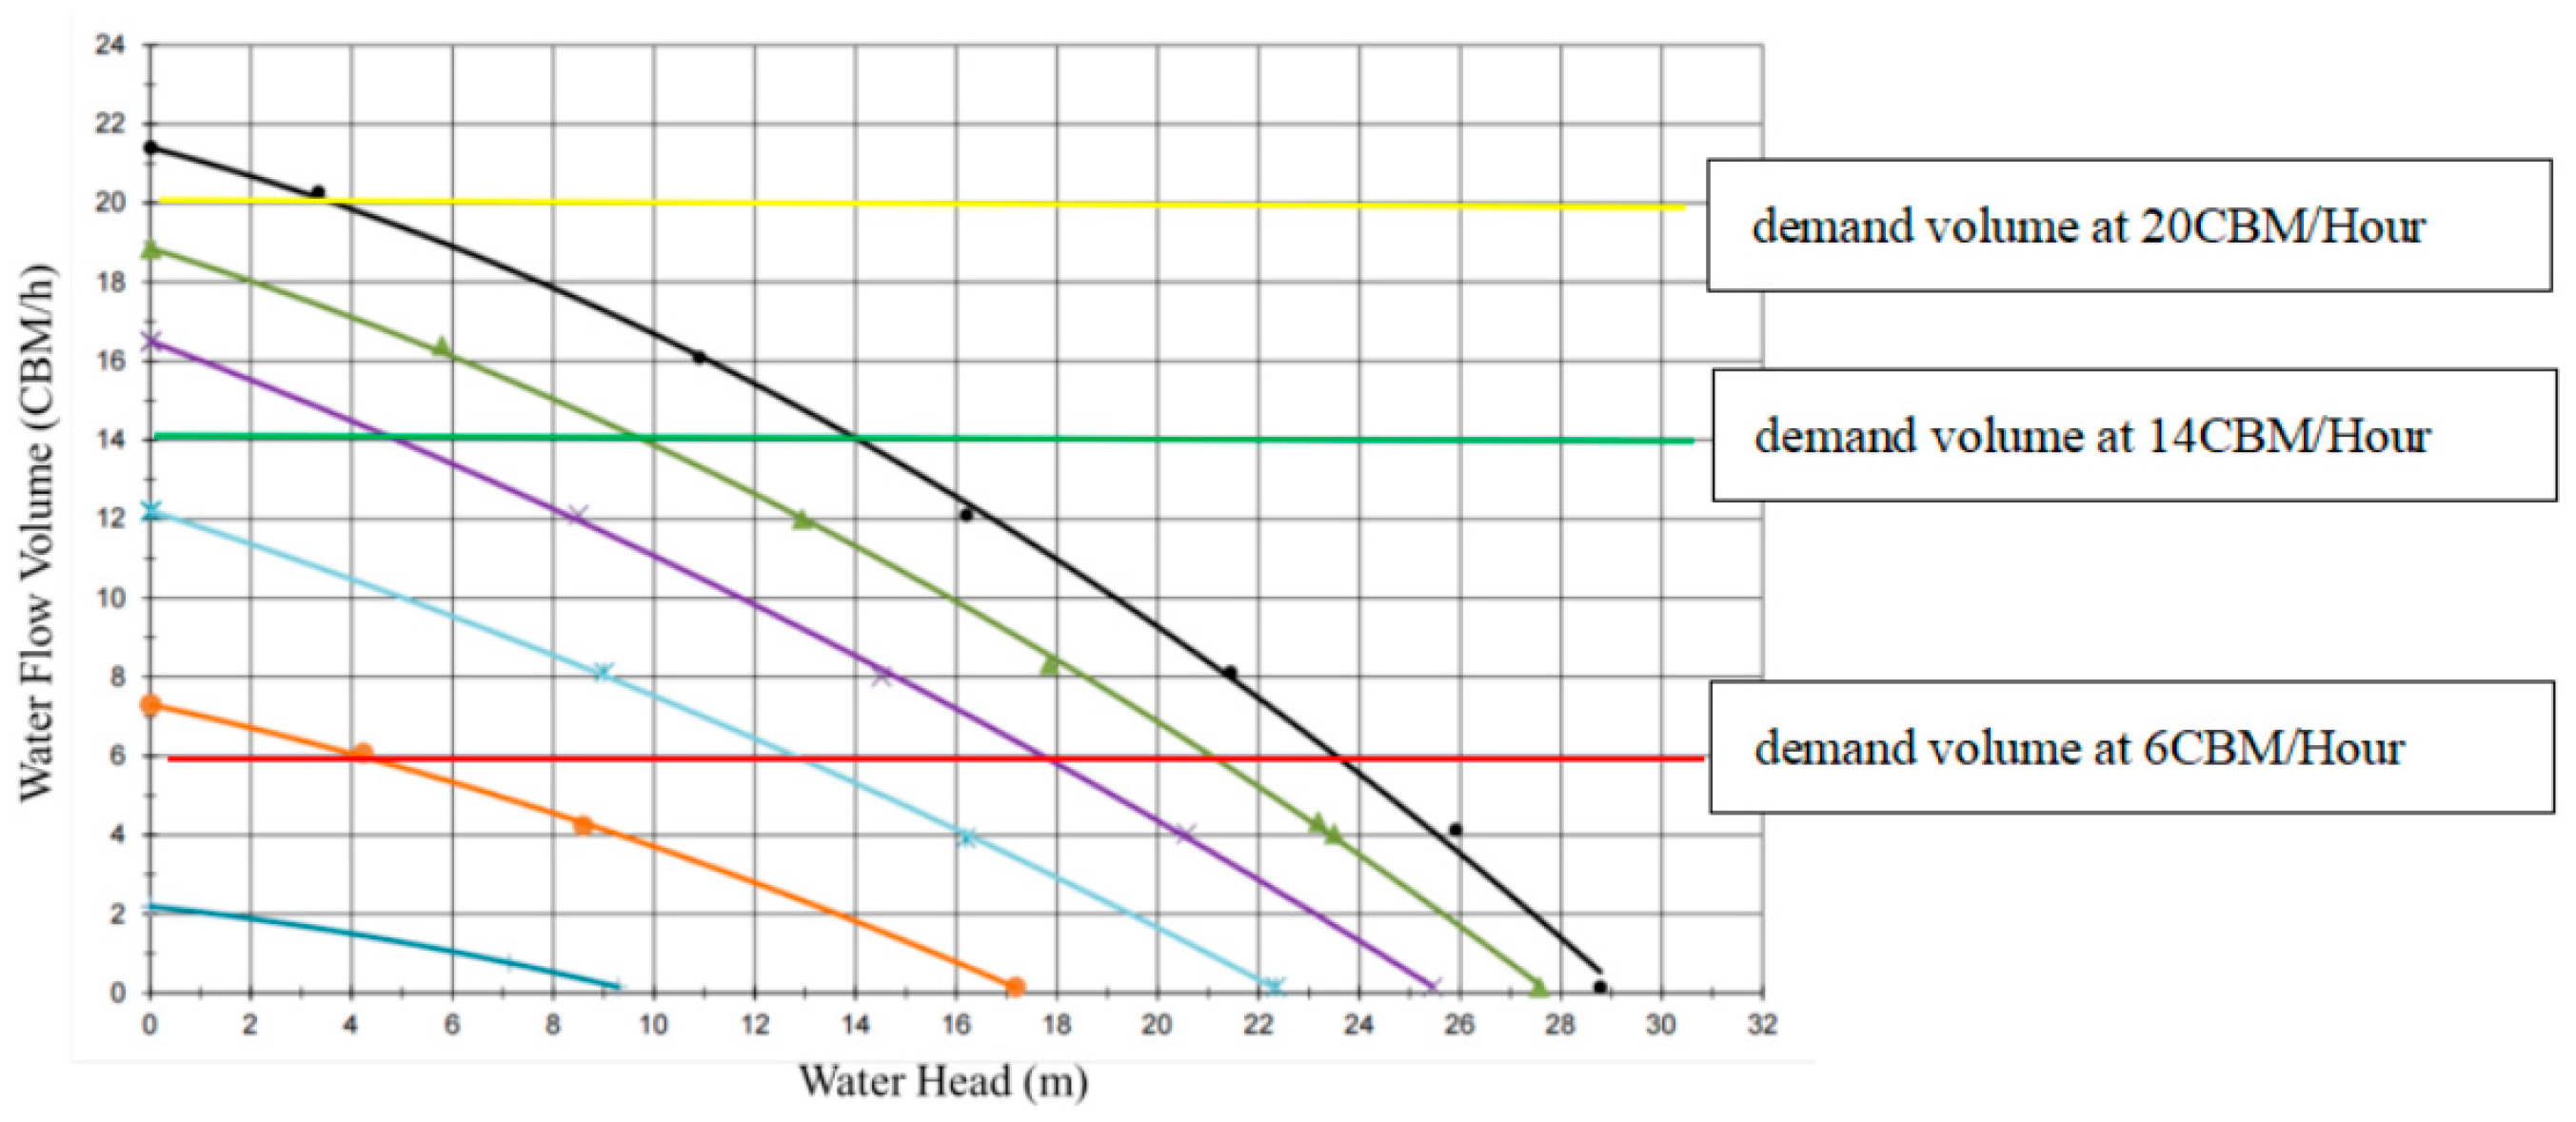
If we add constant water demand volume lines to Figure 18 above, we obtain Figure 19 as below:
Figure 19 shows the most energy saving input power value for each target water flow volume is the first cross point to the pump’s performance curves from the left. The built-in fuzzy algorithm would self-adapt the pump’s input power to the most energy saving input power through its tunability and convergence.
However, if the pump is driven by an AC asynchronous induction motor, as Table 12 and Figure 20 show, the water pressure and water flow volume could be adjusted by a valve’s opening rate, and the pump water supply volume is changed, but the pump’s input power does not change accordingly. It is always a 1000 W input.
The water flow volume is the pump system’s final demand. The water pressure is the factor that helps to transport the demanded water flow volume in time, but the water flow changes when the water pressure changes, so keeping a certain required water flow volume constant on the application side is most important in a pump system. The researched fuzzy algorithm-FOC controlled pump aims to build up a self-adaptive function which could adjust the pump’s water flow to be constant while the water pressure changes.
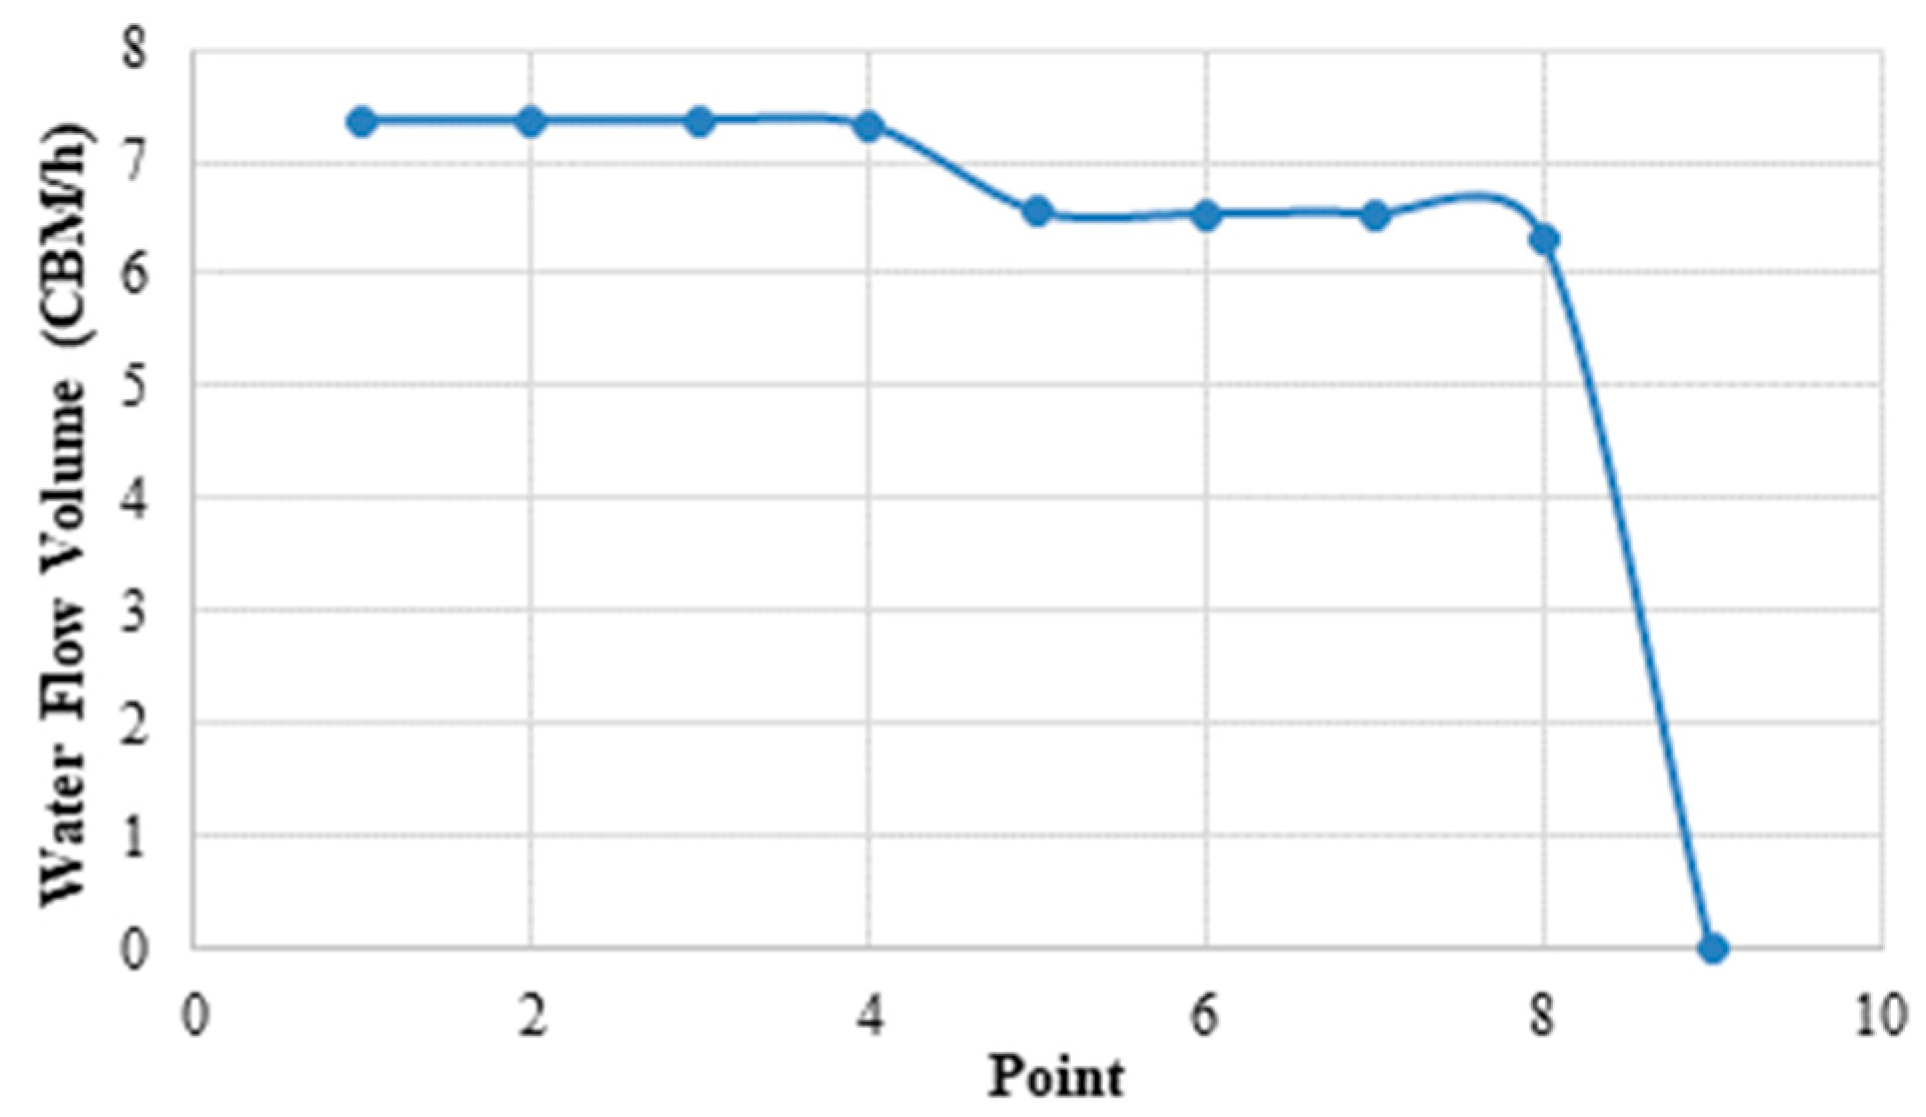
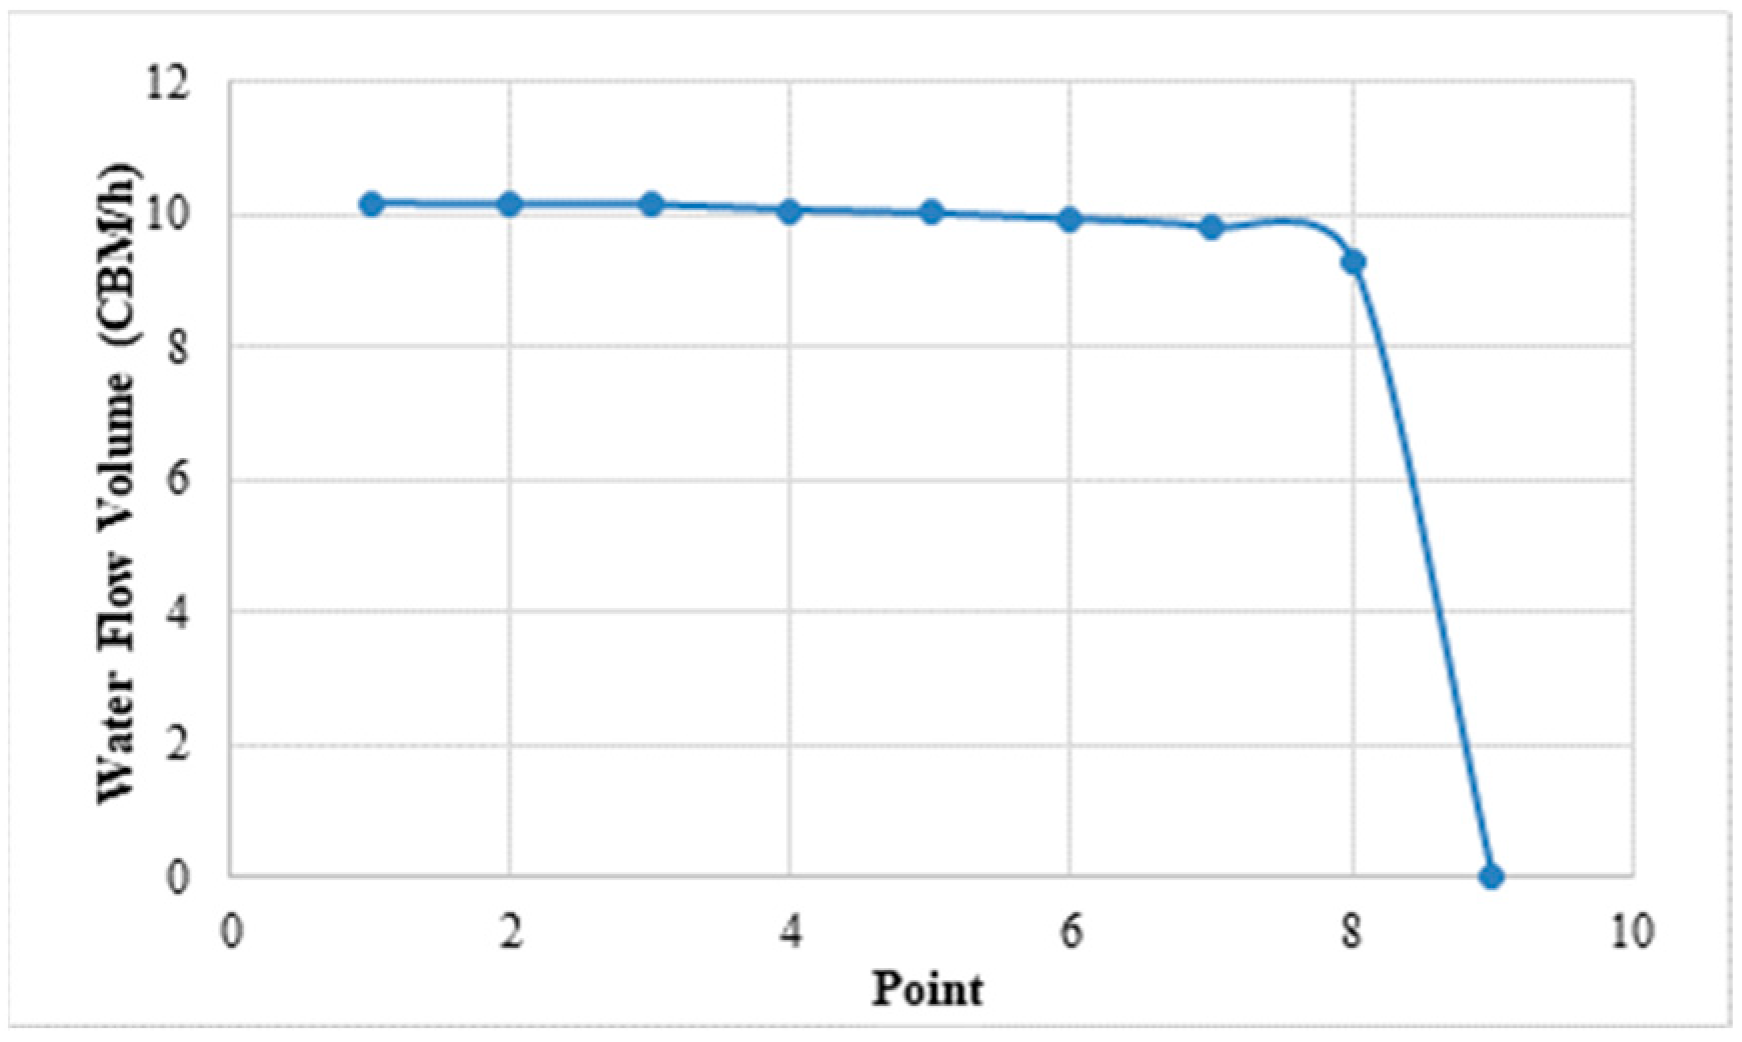
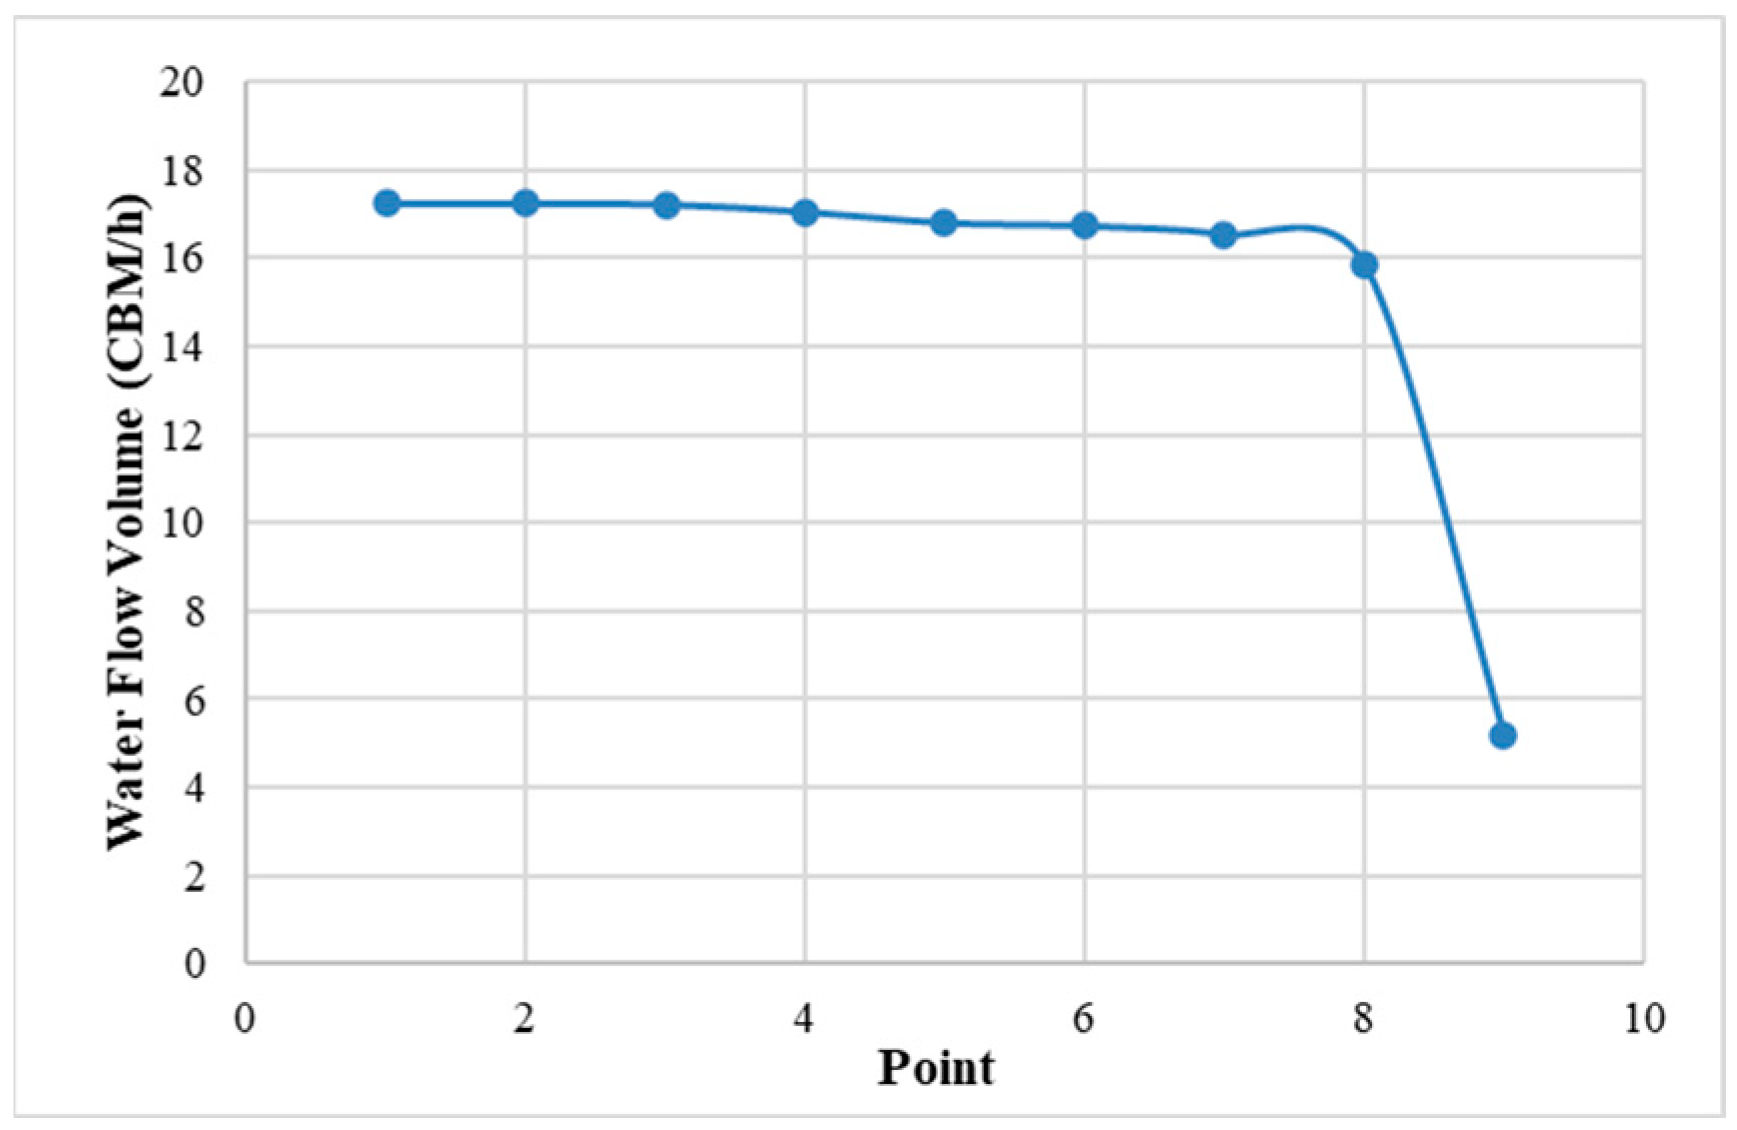
The researched pump was tested at each different input power value (100 W, 215 W, 810 W) with different valve opening rates (from 0 to 1, increasing by 1/8 every step) which changed the water pressure in the pump system. The testing results are shown in Table 13, Table 14 and Table 15, and Figure 21, Figure 22 and Figure 23.
From the testing results shown in Table 13, Table 14 and Table 15 and water flow curves shown in Figure 21, Figure 22 and Figure 23, it was found that when the valve opening rate changes from 1/8, 1/4 to 8/8 (fully opened), the water flow volume of the pump output is almost the same when the water pressure changes. This result proves the fuzzy algorithm-FOC controlled pump could self-adjust its performance and constantly output same water flow volumes when water pressures change. This is a big difference from the AC asynchronous motor-driven pump’s performance: when water pressure is increased/decreased, the water flow volume will be decreased/increased (see Table 12 and Figure 20). This testing result also proves that when the water flow volume increased/decreased, the pump input power increased/decreased automatically to match the pump’s performance at the motor’s high working efficiency points at each power input value.
The experiment verified two things:
(1)
When the pump system’s input power is a fixed power supply, the pump outputs a constant water flow in a range when the pressure changes. This was verified in the testing: when the motor’s input power was fixed at 100 W, 215 W, 810 W as shown in Figure 21, Figure 22 and Figure 23, the pressure was ignored intentionally in the testing, because in real application, the pressure change would be irregular, so we used a valve to change the water supply pressure, in the same way as a normal water supply’s valve control.
(2)
When the constant water flow was broken or the pressure was too much changed, the pump system automatically switched to a higher input power to achieve a more constant water flow volume or a smaller input power to achieve more energy saving, as Figure 19 shows.
The working efficiency of the researched pump was tested at input power points of 25%, 50%, 75%, 100%, and 116.7% of the rated input power. The results are shown in Table 16.
The Table 16 testing results show when the pump works at different loading ratios from 25% to 116.7%, the motor’s working efficiency is from 56.82% to 81.24%. The important efficiency here is not the point of 100% loading but the 25%, 50%, 75% loading points. If the pump could work most efficiently at these non-related speed points, it would enable the energy saving to happen when it switched from one working power to another. The working power switching here is enabled through the set fuzzy algorithm. The FOC control on the motor helps to make the power switching accurately and helps to keep the right speed and torque.
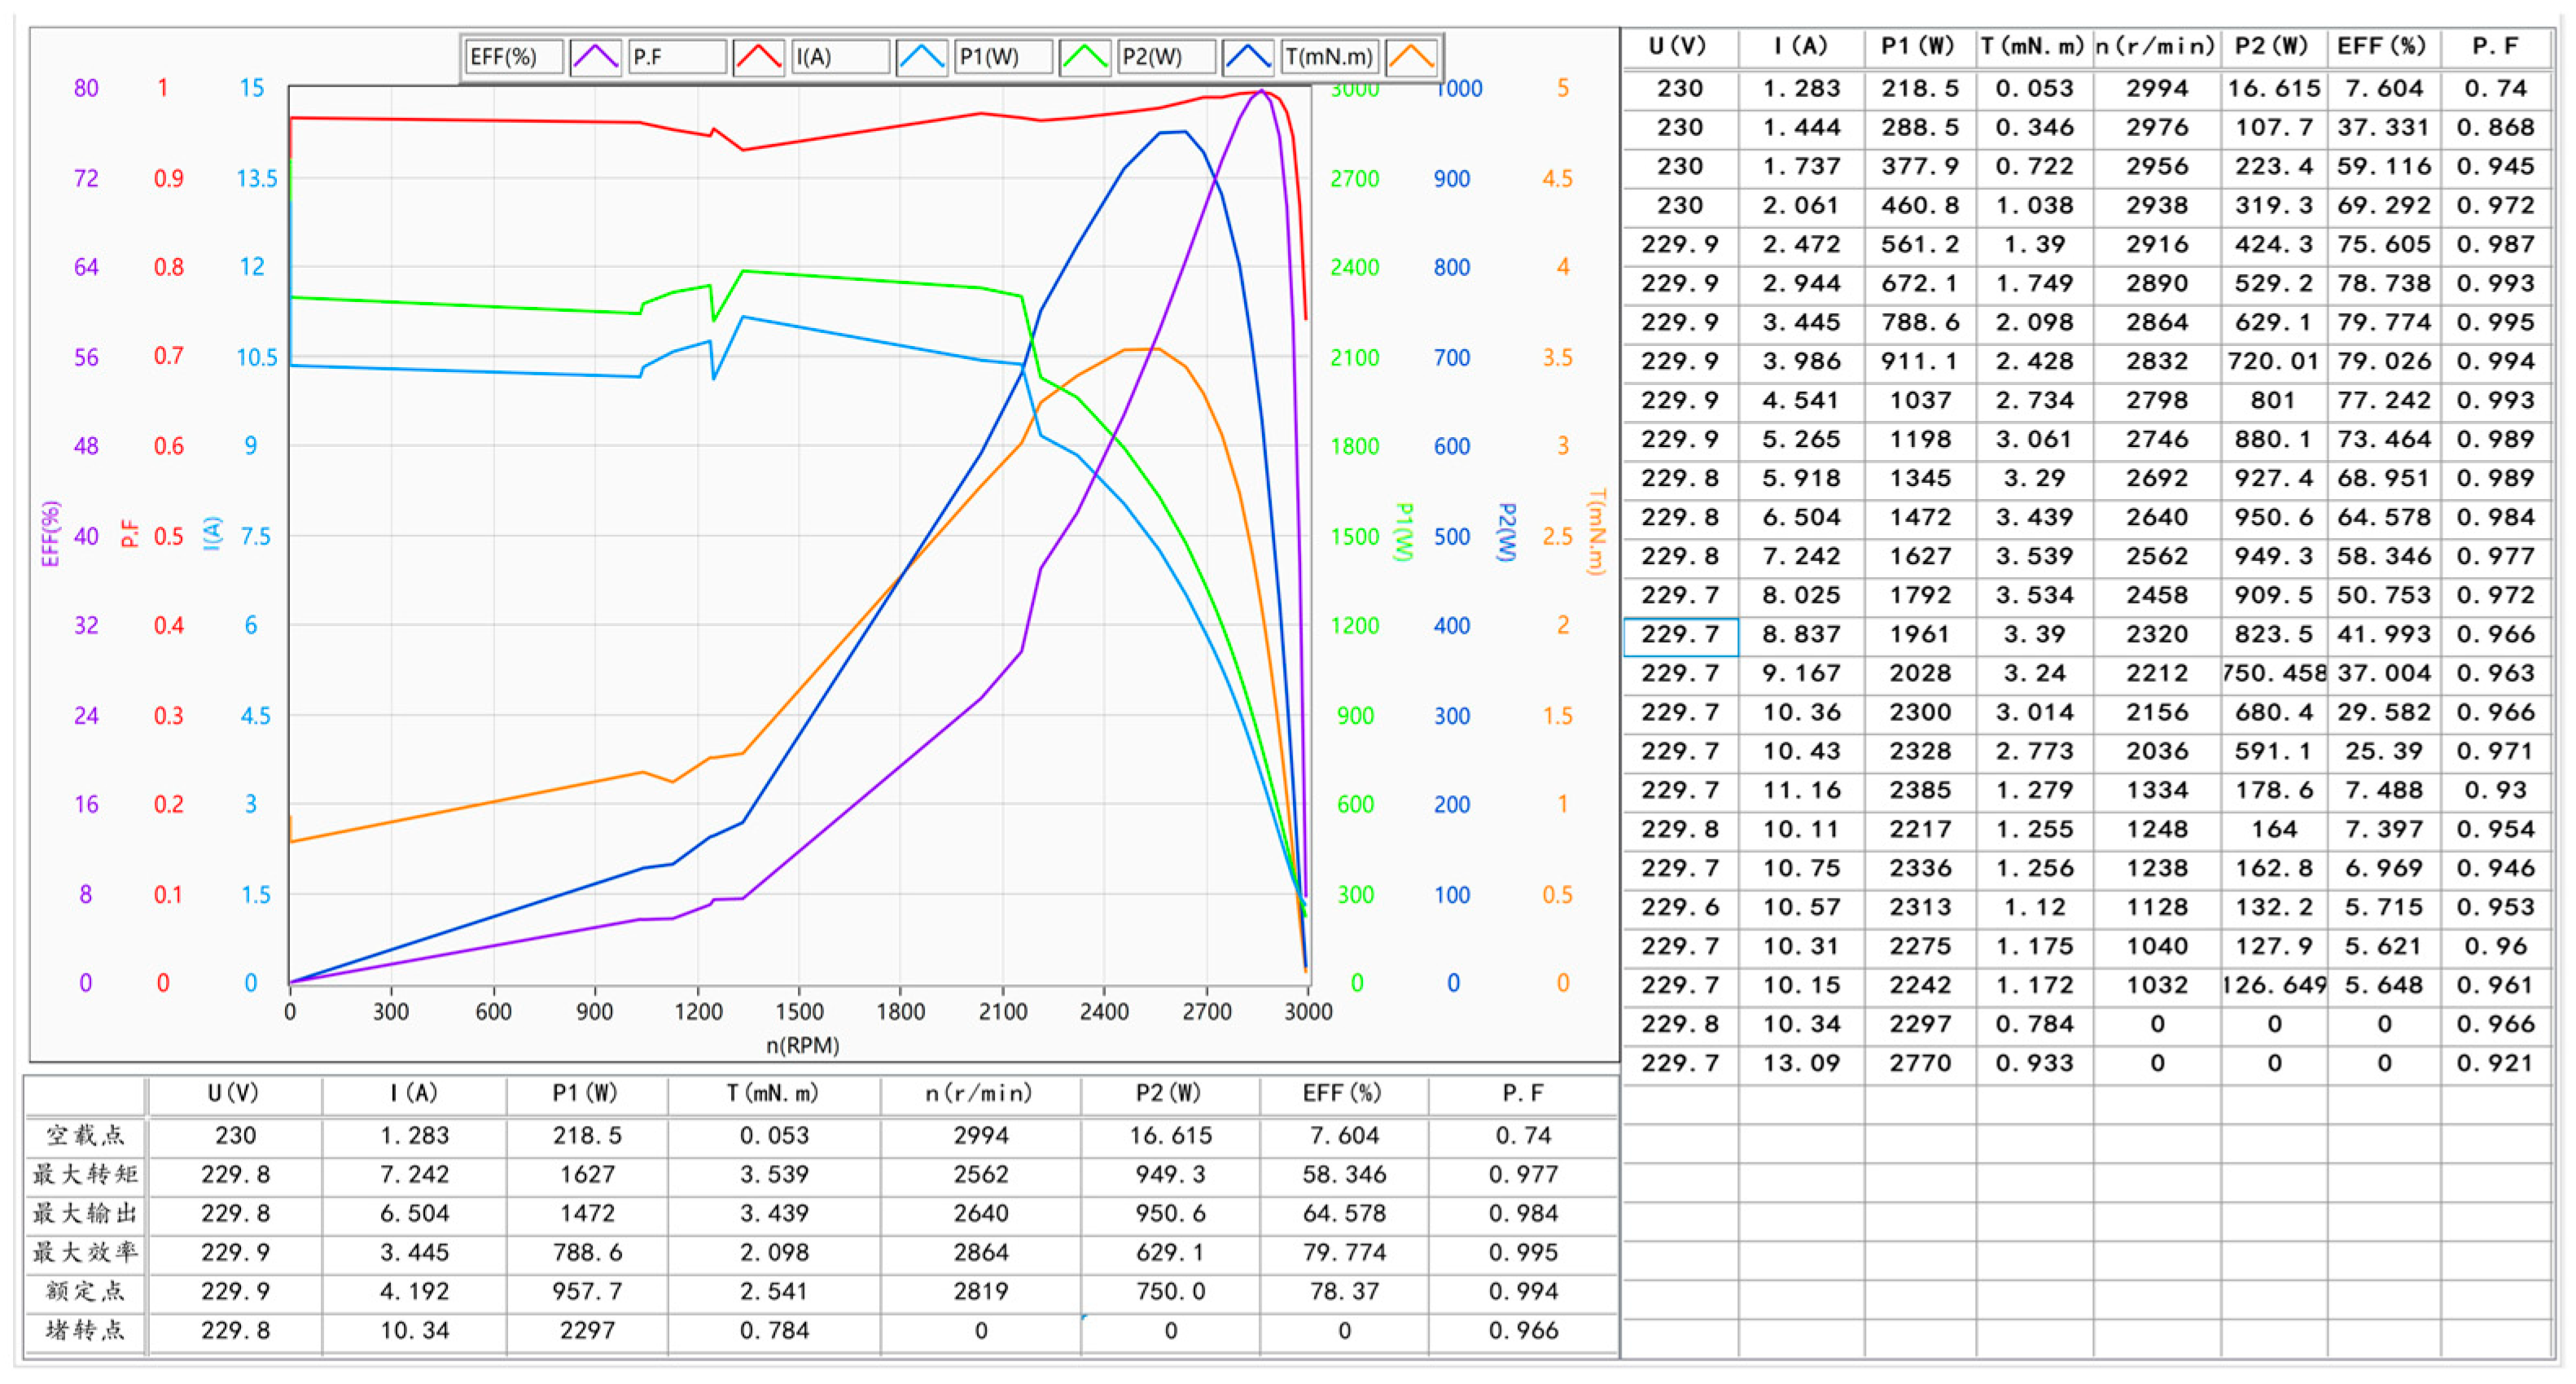
The AC asynchronous motor’s non-related output speed points’ efficiency were tested and compared as shown below in Figure 24.
Figure 24 shows performance testing of an AC asynchronous motor, in which the dynamo meter and magnet resistor were used on the shaft to change the motor speed, and tested its working efficiency at non-related speed.
In Figure 24, the left under the curve shows the tested points, they are in sequence in vertically: (1) No load point; (2) Max output torque point; (3) Max output power working point; (4) Max efficiency point; (5) Rated output power point; (6) Lock rotor.
Figure 24 shows that an AC asynchronous 2-pole motor works at an output speed of 1334 RPM with an efficiency 7.488%, and an output speed 1032 RPM with an efficiency 5.648%. Obviously, there would be a lot of energy wasted if the working speed of the AC asynchronous motor driving pump changed.
As the two pumps’ physical structures are the same, when the pumps work at the same speed, the pumps’ input power could be treated as the same. So, the two driving motors’ working efficiency could be treated as the two pump systems’ efficiency. Table 17 shows the two pumps’ driving motors speed range and their efficiency range.
In addition to maintaining high efficiency during speed regulation, the permanent magnet synchronous motor (PMSM) offers a key advantage: a wide speed regulation range that enables greater potential for intelligent operational capabilities. The primary difference between a conventional AC asynchronous induction motor-driven pump and the fuzzy-logic FOC controlled PMSM-driven pump discussed here lies in their operational characteristics. A conventional pump system typically uses a variable-frequency drive (VFD) to adjust the pump’s speed. Since the motor is asynchronous, its rotor speed is not synchronized with the electrical frequency and varies with the load (known as slip). The motor’s maximum base speed is limited by the pole count, and peak efficiency is generally achieved near the rated operating point, with efficiency dropping significantly outside that range. In contrast, the proposed pump is driven by a PMSM under fuzzy-logic control. The PMSM’s mechanical speed is synchronized with the input electrical frequency, enabling efficient operation over a broader speed range. As a result, the system not only benefits from higher motor efficiency under speed regulation but also from an intelligent, demand-responsive control strategy enabled by fuzzy logic. Traditional “constant-pressure” systems are designed for the maximum pressure required when all fixtures are open simultaneously. Under low-demand conditions, this often results in excessive line pressure and significant energy waste. Additionally, operators must constantly monitor the system and adjust pump settings to prevent over- or undersupply.
Consider a building with 20 apartments: water demand is much higher in the morning and evening than at midday. Under the “constant-pressure” control model, the system maintains unnecessarily high pressure during off-peak hours, wasting energy. In contrast, the proposed pump automatically adapts its performance to real-time water demand. In our testing, we simulated water demand changes by closing valves to increase line pressure. At representative input power settings of 100 W, 215 W, and 810 W, the controller maintained a nearly constant flow within its regulation band despite pressure increases. When the load change exceeded this band—for example, when water demand increased from 25% to 100% of full load—the pump automatically adjusted its input power from 330 W to 932 W to meet the new demand.
A pump’s total energy savings are not only related to the system’s efficiency at each speed but also to the amount of time the pump operates at each speed. For example, if both the fuzzy-controlled PMSM pump and the asynchronous induction motor-driven pump can meet the water demand over three hours, with one working at 750 W for 1 h and 375 W for 2 h, the following energy consumption calculations apply: the fuzzy-controlled PMSM pump would work for 1 h at 750 W (932 W input to the motor) and 2 h at 375 W (530 W input to the motor). The total power consumption would be 0.932 kW × 1 h + 0.53 kW × 2 h = 1.992 kWh. The conventional AC asynchronous induction motor-driven pump would operate for 3 h at 750 W (about 950 W input to the motor). The total power consumption would be 0.95 kW × 3 h = 2.85 kWh. Therefore, the fuzzy-controlled PMSM pump saves 2.85 kWh−1.992 kWh = 0.858 kWh, which represents approximately 30% energy savings compared to the AC asynchronous motor-driven pump. If the water demand can be met by working 1 h at 750 W and 5 h at 187.5 W, the fuzzy-controlled PMSM pump would operate for 1 h at 750 W (932 W input) and 5 h at 187.5 W (330 W input). The total power consumption would be 0.932 kW × 1 h + 0.33 kW × 5 h = 2.582 kWh. In comparison, the conventional AC asynchronous induction motor-driven pump would operate for 6 h at 750 W (about 950 W input), resulting in a total power consumption of 0.95 kW × 6 h = 5.7 kWh. Thus, the fuzzy-controlled PMSM pump saves 5.7 kWh−2.582 kWh = 3.118 kWh, which is approximately 54.7% in energy savings compared to the AC asynchronous motor pump.
Even if the AC asynchronous motor is speed-regulated using a special inverter, based on testing results shown in Figure 24 and Table 16, the efficiency of the fuzzy-controlled PMSM pump motor is significantly higher. The PMSM is about 45.36% more efficient at around 2000 RPM and 50% more efficient at speeds below 1000 RPM.
Therefore, we can confidently expect an average energy saving of 30–50% when switching from an AC asynchronous motor-driven pump to a fuzzy-logic-FOC controlled PMSM-driven pump, depending on variations in water demand.

5. Conclusions

The pump system introduced in this paper not only offers high efficiency, variable speed, higher starting torque, reduced maintenance, and longer service life, but it is also intelligent. Using a fuzzy-logic FOC control algorithm, the system synchronizes supply with demand through a real-time feedback loop. When demand changes, the pump automatically adjusts its operating point to deliver a constant flow within a predefined range. Within this range, it maintains steady flow despite fluctuations in pressure. If demand shifts outside the range defined by the fuzzy rules, the pump adapts by changing its input power and speed to a more suitable level, thereby meeting the new flow requirement. This approach prevents over- or undersupply—common issues in conventional systems—and reduces reliance on manual monitoring and intervention. Here, in the working model with constant flow and variable pressure, the “constant water flow” does not refer to the pump continuously supplying a fixed flow rate. Rather, it means maintaining the target water flow equal to the required water flow at the pump’s most efficient power setting. If the target flow is disrupted, the pump will automatically adjust to another appropriate flow rate, which remains constant for a defined period until the system requires further adjustment. During this process, the water pressure fluctuates, as it continuously adapts to changes in the system.
The new pump can operate with either a single-phase or three-phase AC power supply as it has a PMSM driver built in, which rectifies the AC current to DC current input to the motor winding. The PMSM motor in the system overcomes the common limitations that a single-phase AC asynchronous induction-driven pump could not easily be speed-regulated, or the low-efficiency characteristic after speed is regulated with a special inverter.
The primary limitation of this system lies in designing the fuzzy rules setting. It is difficult to create a universal set of rules that works for all applications; instead, rules must be tailored and refined through testing for each specific use. This need for application-specific tuning is currently the main barrier to widespread adoption. In the future, machine learning may help overcome this challenge by enabling more adaptive, self-configuring control strategies.

Author Contributions

Conceptualization, W.S. and H.S.; methodology, W.S. and H.W.; software, H.W.; validation, H.S.; formal analysis, W.S.; data curation, G.L.; writing—original draft preparation, W.S.; writing—review and editing, G.L.; visualization, H.W.; supervision, H.S. and H.W.; funding acquisition, H.S. All authors have read and agreed to the published version of the manuscript.

Funding

This research was funded by the Aeronautical Science Foundation of China, grant number 2024Z071052007; Joint Fund of National Natural Science Foundation of China and Civil Aviation Administration of China, grant number U2033202; Fundamental Research Funds for the Central Universities, grant number NS2022094.

Data Availability Statement

The data presented in this study are available on request from the corresponding author due to privacy and legal reasons.

Acknowledgments

The authors express sincere gratitude to Nanjing Watt Electric Motors Corporation for the experimental data. We also deeply appreciate the editors and reviewers for their insightful feedback and constructive suggestions.

Conflicts of Interest

Author Wangsheng Sun was employed by the company Nanjing Watt Electric Motors Corporation. The remaining authors declare that the research was conducted in the absence of any commercial or financial relationships that could be construed as a potential conflict of interest.

Abbreviations

The following abbreviations are used in this manuscript:
PMSMPermanent Magnet Synchronous Motor
HVACHeating, Ventilation, and Air Conditioning
VFDVariable Frequency Drivers
PLCsProgrammable Logic Controllers
PIDProportional Integral Derivative

References

  1. China Standards Research Institute; United Nations Development Program; Global Environment Facility. China Motor System’s Energy Efficiency and Market Potential Analysis Report; China Standards Research Institute: Beijing, China; United Nations Development Program: New York, NY, USA; Global Environment Facility: Washington, DC, USA, 2008. [Google Scholar]
  2. Ahmed, A.A.; Moharam, B.A.; Rashad, E.E. Improving energy efficiency and economics of motor-pump-system using electric variable-speed drives for automatic transition of working points. Comput. Electr. Eng. 2022, 97, 107607. [Google Scholar] [CrossRef]
  3. Luo, Y.; Xiong, Z.; Sun, H.; Guo, Y. Research on energy-saving operation control model of the multi-type configuration centrifugal pump system with single invert. Adv. Mech. Eng. 2017, 9, 1687814017707650. [Google Scholar] [CrossRef]
  4. Yimchoy, S.; Supatti, U. An energy-savings evaluation method for variable-frequency-drive applications on water pump systems. In Proceedings of the 24th IEEE International Conference on Electrical Machines and Systems, Gyeongju, Republic of Korea, 31 October–3 November 2021. [Google Scholar]
  5. Rakibuzzaman; Suh, S.; Kim, K.; Kim, H.; Cho, M.T.; Yoon, I.S. A study on multistage centrifugal pump performance characteristics for variable speed drive system. In Proceedings of the 6th BSME International Conference on Thermal Engineering, Dhaka, Bangladesh, 19–21 December 2014. [Google Scholar]
  6. Zhu, Y. Development and Application of Inverter Controlled Constant Pressure Water Supply System. Master’s Thesis, Zhejiang University, Hangzhou, China, 2005. [Google Scholar]
  7. Ding, L. Study on Constant Pressure Water Supply Control System of Variable Frequency. Master’s Thesis, Tianjin University, Tianjin, China, 2007. [Google Scholar]
  8. Gao, M. Constant Pressure Water Supply System Design and Implementation Based on Variable Frequency. Master’s Thesis, University of Electronic Science and Technology of China, Chengdu, China, 2013. [Google Scholar]
  9. Wang, G. Efficiency degradation detection for VFD-motor-pump systems. Sci. Technol. Built Environ. 2018, 24, 974–981. [Google Scholar] [CrossRef]
  10. Su, C.L.; Liao, C.H.; Chou, T.C.; Tsai, S.Y.; Yu, K.T. Design and application of variable frequency constant pressure technology in closed system pumps on marine vessels. In Proceedings of the 2015 IEEE IAS Joint Industrial and Commercial Power Systems/Petroleum and Chemical Industry Conference, Hyderabad, India, 19–21 November 2015. [Google Scholar]
  11. Zhu, G. Constant Pressure Water Supply Control System Using PIC. Master’s Thesis, Zhejiang Sci-Tech University, Hangzhou, China, 2019. [Google Scholar]
  12. Mo, X. Based on PLC the automatic constant pressure control water supply system design. Appl. Mech. Mater. 2015, 716, 1587–1590. [Google Scholar] [CrossRef]
  13. Li, S. The design of constant pressure water supply control system for city. Adv. Mater. Res. 2015, 1079, 1018–1021. [Google Scholar] [CrossRef]
  14. Yu, L. Design and Realization of Constant Pressure Water Supply System Based on PLC. Master’s Thesis, Harbin Engineering University, Harbin, China, 2017. [Google Scholar]
  15. Wang, H.; Zhang, Y.; An, Z.; Liu, R. An energy-efficient adaptive speed-regulating method for pump-controlled motor hydrostatic drive powertrains. Processes 2024, 12, 25. [Google Scholar] [CrossRef]
  16. Shankar, V.K.A.; Umashankar, S.; Paramasivam, S.; Norbert, H. Real time simulation of variable speed parallel pumping system. In Proceedings of the 9th International Conference on Applied Energy, Cardiff, UK, 21–24 August 2017. [Google Scholar]
  17. Shankar, V.K.A.; Umashankar, S.; Padmanaban, S.; Bhaskar, M.S.; Almakhles, D. Investigation for performances comparison PI, adaptive PI, fuzzy speed control induction motor for centrifugal pumping application. In Proceedings of the 2019 IEEE 13th International Conference on Compatibility, Power Electronics and Power Engineering, Sonderborg, Denmark, 23–25 April 2019. [Google Scholar]
  18. Shen, G.; Sun, B.; Ma, G. A constant pressure water supply system on a fuzzy control basis. Ind. Instrum. Automat 2002, 5, 50–52. [Google Scholar]
  19. Ramadhan, R.; Fang, X. Enhancing energy efficient water pumping with intelligent control: A comparative study of advanced fuzzy logic and PID controllers on Simulink/Matlab. J. World Sci. 2024, 3, 479–489. [Google Scholar] [CrossRef]
  20. Yang, X.; Wu, D.; Wang, C.; Gao, C.; Gao, H.; Liu, Y. Adaptive fuzzy PID control of high speed on-off valve for position control system used in water hydraulic manipulators. Fusion. Eng. Des. 2024, 203, 114437. [Google Scholar] [CrossRef]
  21. Pruna, E.; Andaluz, V.H.; Proaño, L.E.; Carvajal, C.P.; Escobar, I.; Pilatásig, M. Construction and analysis of PID, fuzzy and predictive controllers in flow system. In Proceedings of the 2016 IEEE International Conference on Automatica, Curico, Chile, 19–21 October 2016. [Google Scholar]
  22. Wang, Z.; Xia, L.; Calautit, J.K.; Wang, X.R.; Jiang, D.W.; Pan, S.; Wu, J.S. Development of an enhanced self-tuning RBF-PID controller for achieving higher energy-efficient process control. J. Build. Constr. Plan. Res. 2021, 9, 272–291. [Google Scholar] [CrossRef]
  23. Bouchakour, A.; Zarour, L.; Bessous, N.; Bechouat, M.; Borni, A.; Zaghba, L.; Rabehi, A.; Alwabli, A.; El-Abd, M.; Ghoneim, S.S.M. MPPT algorithm based on metaheuristic techniques (PSO & GA) dedicated to improve wind energy water pumping system performance. Sci. Rep. 2024, 14, 17891. [Google Scholar] [CrossRef]
  24. Hartono, H.; Sudjoko, R.I.; Iswahyudi, P. Speed control of three phase induction motor using universal bridge and PID controller. In Proceedings of the 1st International Conference on Engineering and Applied Science, Madiun, Indonesia, 21 August 2019. [Google Scholar]
  25. Jin, X.; Zhou, L.; Lang, T.; Jiang, Y. Low-Voltage water pump system based on permanent magnet synchronous motor. Electronics 2024, 13, 3674. [Google Scholar] [CrossRef]
  26. Bahrami-Fard, M.; Korrani, M.G.; Rastegar, M.; Fahimi, B. Advanced startup and smooth transition to sensorless field oriented control for CSI-Fed PMSM drives in submersible pumps. IEEE Trans. Power Electron. 2025, 40, 12402–12415. [Google Scholar] [CrossRef]
  27. Nasser, A.; Szemes, P.T. Speed control of three phase induction motor using scalar method and PID controller. Recent. Innov. Mechatron. 2018, 5, 1. [Google Scholar] [CrossRef]
  28. Anjum, F.; Sharma, N. Speed control of induction motor using hybrid PID fuzzy controller. Int. Res. J. Eng. Technol. 2018, 5, 576–580. [Google Scholar]
  29. Flores, T.K.S.; Villanueva, J.M.M.; Gomes, H.P. Fuzzy pressure control: A novel approach to optimizing energy efficiency in series-parallel pumping systems. Automation 2023, 4, 11–28. [Google Scholar] [CrossRef]
  30. AL-washali, T.; Sharma, S.; Kennedy, M. Methods of assessment of water losses in water supply systems: A review. Water Resour. Manag. 2016, 30, 4985–5001. [Google Scholar] [CrossRef]
  31. Santos de Araújo, J.V.; Villanueva, J.M.M.; Cordula, M.M.; Cardoso, A.A.; Gomes, H.P. Fuzzy control of pressure in a water supply network based on neural network system modeling and IoT measurements. Sensors 2022, 22, 9130. [Google Scholar] [CrossRef] [PubMed]
  32. Moreira, H.A.M.; Gomes, H.P.; Villanueva, J.M.M.; Bezerra, S.T.M. Real-time neuro-fuzzy controller for pressure adjustment in water distribution systems. Water Supply 2021, 21, 1177–1187. [Google Scholar] [CrossRef]
  33. Wu, Y.; Zhong, Y.; Chen, J.; Qiu, A.; Cao, L. Design of constant pressure water supply control system based on fuzz-PID. In Proceedings of the 2018 33rd Youth Academic Annual Conference of Chinese Association of Automation, Nanjing, China, 18–20 May 2018. [Google Scholar]
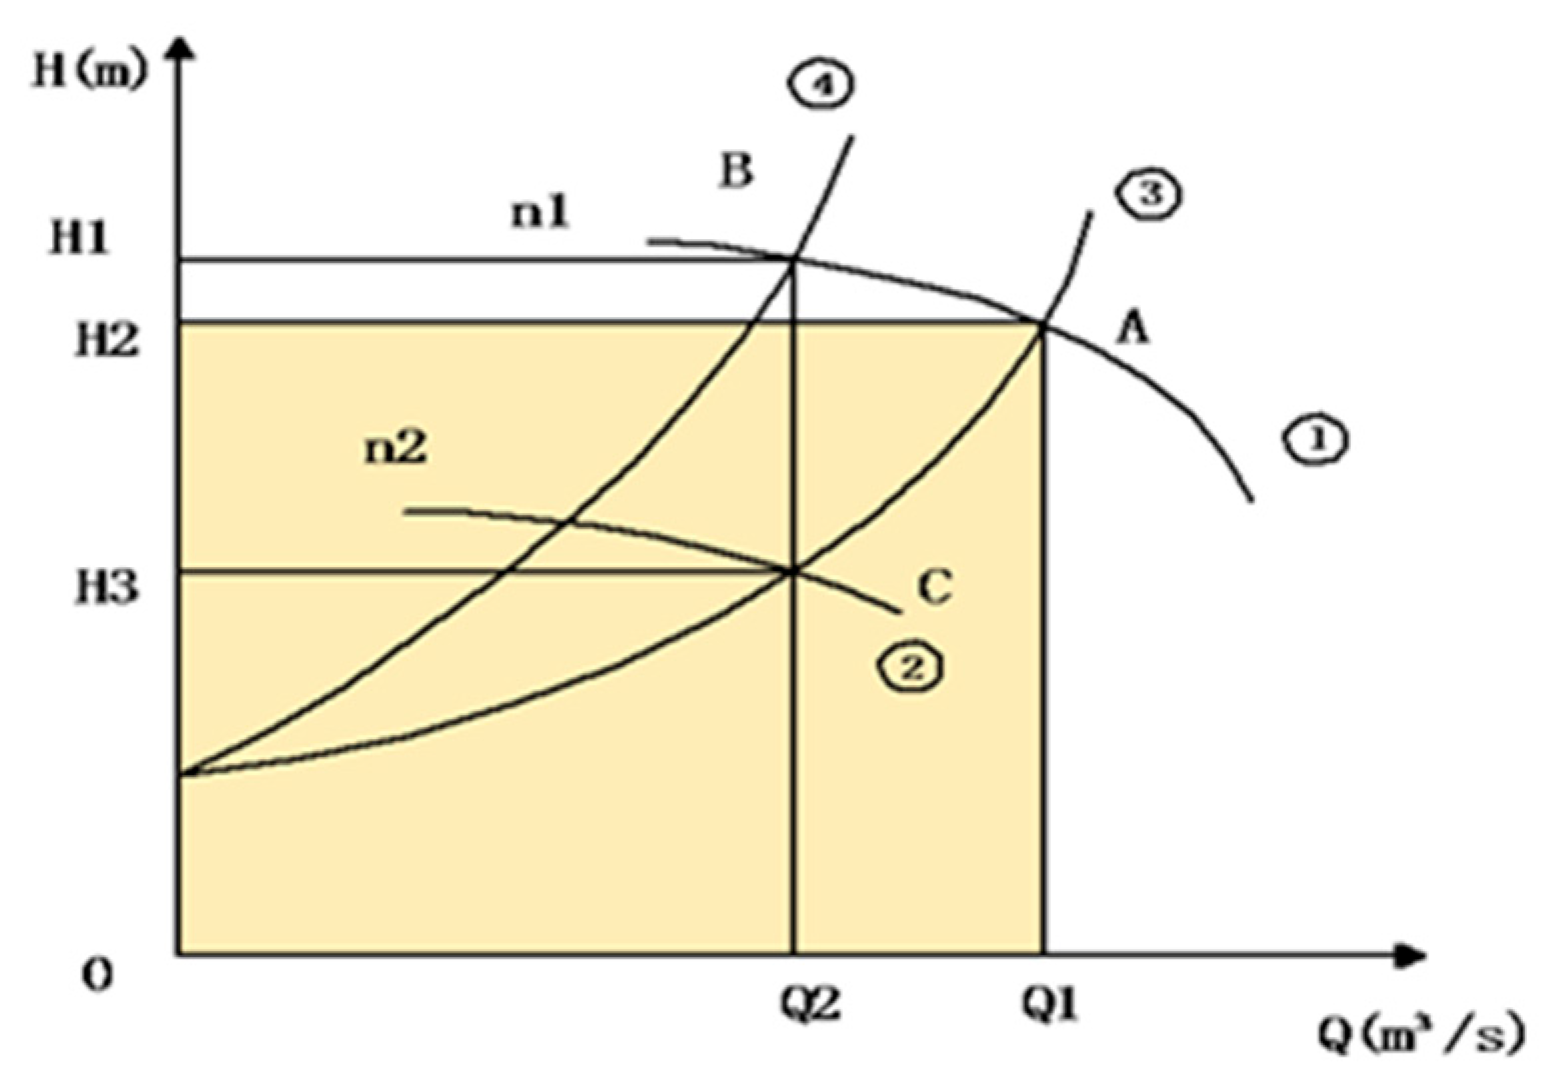
Figure 1. Pump loading curves change when valve controlled.
Machines 13 01070 g001
Figure 2. Pump loading curves change when variable-speed controlled.
Machines 13 01070 g002
Figure 3. Constant pressure water supply and the working curve.
Machines 13 01070 g003
Figure 4. Section of PMSM.
Machines 13 01070 g004
Figure 5. PMSM FOC control system schematics.
Machines 13 01070 g005
Figure 6. The schematic diagram of a PID controller.
Machines 13 01070 g006
Figure 7. The structure diagram of self-adjusting fuzzy-PID control system.
Machines 13 01070 g007
Figure 8. E, EC, Δ K p , Δ K i   Δ K d membership functions.
Machines 13 01070 g008
Figure 9. Δ K p , Δ K i , Δ K d fuzzy inference input and output surface.
Machines 13 01070 g009
Figure 10. Self-adaptive PID fuzzy control chart.
Machines 13 01070 g010
Figure 11. PMSM motor.
Machines 13 01070 g011
Figure 12. PMSM pump motor control schematic diagram.
Machines 13 01070 g012
Figure 13. AC asynchronous motor.
Machines 13 01070 g013
Figure 14. Testing platform schematic diagram.
Machines 13 01070 g014
Figure 15. Testing platform setup.
Machines 13 01070 g015
Figure 16. Pump performance curve when input is 230 W.
Machines 13 01070 g016
Figure 17. Pump performance curve when input power is 1100 W.
Machines 13 01070 g017
Figure 18. Pump performance curves at different loadings.
Machines 13 01070 g018
Figure 19. Different input power values when water demand is 20 (yellow), 14 (green), and 6 (red) CBM/h.
Machines 13 01070 g019
Figure 20. Pump performance curve when input power is 1000 W.
Machines 13 01070 g020
Figure 21. Water flow curve when input power is set as 100 W.
Machines 13 01070 g021
Figure 22. Water flow curve when input power is set as 215 W.
Machines 13 01070 g022
Figure 23. Water flow curve when input power is set as 810 W.
Machines 13 01070 g023
Figure 24. AC asynchronous motor performance testing.
Machines 13 01070 g024
Table 1. Main structure of a PMSM.
PartFunction
Permanent magnetsThe primary magnetic field source, generating a static magnetic field.
Stator coreA stationary coil that generates a rotating magnetic field.
Rotor coreThe rotating part with conductors, which rotates under the interaction of the static and rotating magnetic fields.
Stator windingCoils on the stator that produce the electromagnetic field.
OthersShaft and bearings which support the rotation of the rotor
Table 2. Δ K p fuzzy rule table.
e c NBNMNSZOPSPMPB
e
NBPBPBPMPMPSZOZO
NMPBPBPMPSPSZONS
NSPMPMPMPSZONSNS
ZOPMPMPSZONSNMNM
PSPSPSZONSNSNMNM
PMPSZONSNMNMNMNB
PBZOZONMNMNMNBNB
Table 3. Δ K i fuzzy rule table.
e c NBNMNSZOPSPMPB
e
NBNBNBNMNMNSZOZO
NMNBNBNMNSNSZOZO
NSNBNMNSNSZOPSPS
ZONMNMNSZOPSPMPM
PSNMNSZOPSPSPBPB
PMZOZOPSPSPMPBPB
PBZOZOPSPMPMPBPB
Table 4. Δ K d fuzzy rule table.
e c NBNMNSZOPSPMPB
e
NBPSNSNBNBNBNMPS
NMPSNSNBNMNMNSZO
NSZONSNMNMNSNSZO
ZOZONSNSNSNSNSZO
PSZOZOZOZOZOZOZO
PMPBNSPSPSPSPSPB
PBPBPMPMPMPSPSPB
Table 5. Δ K p fuzzy control lookup table.
e −6−5−4−3−2−10123456
e c
−66655555332100
−56655543221000
−4555543310000−1
−3555433210000−1
−244443321000−1−2
−14443310000−1−1−3
03332210000−1−2−3
13210000−1−2−2−3−3−3
2210000−1−2−3−3−4−5−5
310000−1−2−3−4−5−5−5−5
40000−1−2−3−4−5−5−5−5−5
5000−1−2−2−3−4−5−5−5−6−6
600−1−2−3−3−5−5−5−5−6−6−6
Table 6. Δ K i fuzzy control lookup table.
e −6−5−4−3−2−10123456
e c
−6−6−6−5−5−5−5−5−3−3−2−100
−5−6−6−5−5−5−4−3−2−2−1000
−4−5−5−5−5−4−3−3−100001
−3−5−5−5−4−3−3−2−100001
−2−4−4−4−4−3−3−2−100012
−1−4−4−4−3−3−10000113
0−3−3−3−2−2−10000123
1−3−2−10000122333
2−2−100001233455
3−1000012345555
40000123455555
50001223455566
60012335555666
Table 7. Δ K d fuzzy control rule lookup table.
e −6−5−4−3−2−10123456
e c
−611−1−2−5−6−6−6−5−4−311
−51−1−2−3−4−5−6−5−4−3−2−11
−41−2−2−3−4−5−5−4−4−3−2−10
−31−2−3−4−5−6−5−4−3−2−2−10
−20−1−2−2−3−4−4−4−3−2−100
−100−1−2−3−3−4−3−3−2−1−10
0000−1−1−2−2−2−1−1−100
10000000000000
21100001111111
354−1−2112223455
45321123345555
56544433322256
66655443332266
Table 8. The specifications of the PMSM and AC asynchronous motor.
MotorInput
Voltage
Input
Frequency
Rated
Speed
Rated
Output Power
IP GradePoles of The Motor
PMSM motor230 V50/60 Hz2850 RPM750 WIP558 Poles
AC asynchronous motor230 V50 Hz2850 RPM750 WIP542 Poles
Table 9. Symbols used in pump testing.
SymbolExplanation
H d Water pressure on the discharged side
H s Water pressure on the suction side
V d 2 V s 2 / 2 g Formula used if suction and discharge pipe side are different, can be ignored if the sizes are same.
H = H d H s Water pressure difference from discharge to suction.
H g e s Conversation from bar to meter.
Q Water flow volume.
n Motor output speed.
I Motor input current.
U Motor input voltage.
P 1 Motor input power.
P K Motor output power.
Table 10. Electric data and pump performance data when pump driving motor input power is 230 W.
H d
[bar]
H s
[bar]
V d 2 V s 2 / 2 g
[m]
H = H d - H s
[bar]
H g e s
[m]
Q
[m3/h]
n
[1/min]
I
[A]
U
[V]
P 1
[kW]
−0.040.050.00−0.090.1517.1815861.022320.23
0.360.050.000.314.238.6016321.032310.23
0.540.050.000.496.074.2317571.052320.24
0.660.050.000.617.300.0017661.062310.24
Table 11. Electric data and pump performance data when pump driving motor input power is 1100 W.
H d
[bar]
H s
[bar]
V d 2 V s 2 / 2 g
[m]
H = H d - H s
[bar]
H g e s
[m]
Q
[m3/h]
n
[1/min]
I
[A]
U
[V]
P 1
[kW]
−0.040.050.00−0.090.1528.7827984.872311.11
0.350.050.000.304.1325.9127774.902301.12
0.740.050.000.698.1221.4428004.872311.11
1.130.050.001.0812.1016.2028534.852311.11
1.520.050.001.4716.0810.9029784.812311.10
1.930.050.001.8820.273.3431774.562311.05
2.040.050.001.9921.400.0032774.432311.02
Table 12. Electric data and pump performance when pump driving motor input power is 1000 W.
H d
[bar]
H s
[bar]
V d 2 V s 2 / 2 g
[m]
H = H d - H s
[bar]
H g e s
[m]
Q
[m3/h]
n
[1/min]
I
[A]
U
[V]
P 1
[kW]
P K
[kW]
η
[%]
0.150.050.000.101.0228.7027104.67230.41.0650.670.12
0.400.050.000.353.5725.6127044.70230.41.0740.680.37
0.800.050.000.757.6519.6727094.67230.41.0630.670.61
1.000.060.000.949.5916.3627174.59230.21.0460.660.65
1.200.060.001.1411.6312.6327334.45230.31.0120.640.60
1.400.060.001.3413.677.3127784.05230.60.9140.580.47
1.480.060.001.4214.480.0028223.66231.30.8080.530.00
Table 13. Pump performance when input power is set as 100 W.
Input Power
[W]
Valve Close RateWater Flow
[Q]
Input Voltage
[V]
Frequency
[Hz]
Input Current
[A]
Input Power Actual
[W]
Motor Speed
[RPM]
10007.37230500.7590.21388
1/87.37230500.7794.81388
1/47.37230500.7794.11390
3/87.32230500.78961398
1/26.56230500.7895.31400
5/86.54230500.7996.61415
3/46.54230500.898.81424
7/86.33230500.8100.91436
10230502.082812430
Table 14. Pump performance when input power is set as 215 W.
Input Power
[W]
Valve Close RateWater Flow
[Q]
Input Voltage
[V]
Frequency
[Hz]
Input Current
[A]
Input Power Actual
[W]
Motor Speed
[RPM]
215010.18230501.652151948
1/810.16230501.642161947
1/410.16230501.642171946
3/810.08230501.642151947
1/210.03230501.642151947
5/89.94230501.632141947
3/49.81230501.622151947
7/89.3230501.622131947
10230504.777043446
Table 15. Pump performance when input power is set as 810 W.
Input Power
[W]
Valve Close RateWater Flow
[Q]
Input Voltage
[V]
Frequency
[Hz]
Input Current
[A]
Input Power Actual
[W]
Motor Speed
[RPM]
810017.24230505.468123170
1/817.24230505.458103170
1/417.22230505.468133172
3/817.05230505.458113172
1/216.8230505.488143172
5/816.73230505.468113172
3/416.54230505.448103172
7/815.87230505.428063173
15.2230506.029083720
Table 16. Pump performance at different input power values.
Loading
Rated
Motor Output Power
[W]
Motor Input Power
[W]
Current
[A]
Torque
[N·m]
Power FactorN
(rpm)
Efficiency
25%187.53302.4680.5200.58219556.82%
50%375.05303.7601.0620.615255070.75%
75%562.57355.0401.6000.640293076.53%
100%750.09326.2002.1000.657325080.47%
Max *875.010776.9802.4540.678340081.24%
* The loading rate is the motor’s output power to its related output power.
Table 17. Fuzzy controlled PMSM pump’s efficiency and speed range vs. AC motor pump’s.
Pump Driving MotorEfficiency RangeRegulating Speed Range
Normal AC Motor-2poles7.48–79.77%1334 RPM to 2864 RPM
PMSM56.82–81.24%195 RPM–3400 RPM
Disclaimer/Publisher’s Note: The statements, opinions and data contained in all publications are solely those of the individual author(s) and contributor(s) and not of MDPI and/or the editor(s). MDPI and/or the editor(s) disclaim responsibility for any injury to people or property resulting from any ideas, methods, instructions or products referred to in the content.