Article

An Enhanced NSGA-II Algorithm Combining Lévy Flight and Simulated Annealing and Its Application in Electric Winch Trajectory Planning: A Complex Multi-Objective Optimization Study

by
Enzhi Quan
1,2,
Yanjun Liu
1,2,3,4,5,
Han Gao
1,2,
Huaqiang You
1,2 and
Gang Xue
1,2,3,4,5,*
1
Key Laboratory of High Efficiency and Clean Mechanical Manufacture of Ministry of Education, School of Mechanical Engineering, Shandong University, Jinan 250061, China
2
National Demonstration Center for Experimental Mechanical Engineering Education, Shandong University, Jinan 250061, China
3
State Key Laboratory of Advanced Equipment and Technology for Metal Forming, Shandong University, Jinan 250061, China
4
Institute of Marine Science and Technology, Shandong University, Qingdao 266237, China
5
Shandong Key Laboratory of Intelligent Marine Engineering Geology, Environment and Equipment, Qingdao 266237, China
*
Author to whom correspondence should be addressed.
Machines 2025, 13(11), 1017; https://doi.org/10.3390/machines13111017
Submission received: 7 October 2025 / Revised: 30 October 2025 / Accepted: 31 October 2025 / Published: 3 November 2025
(This article belongs to the Section Electrical Machines and Drives)

Abstract

To overcome the limitations of traditional multi-objective evolutionary algorithms—which often become trapped in local optima when addressing complex optimization problems and face challenges in balancing convergence efficiency with population diversity—this study proposes an enhanced NSGA-II algorithm that incorporates Lévy flight and simulated annealing strategies. The proposed algorithm enhances global exploration via Lévy flight mutation, improves local search precision through simulated annealing, and dynamically coordinates the search process using adaptive parameter strategies. Experiments conducted on the ZDT and DTLZ test function series demonstrated that the proposed algorithm achieves performance comparable to or better than that of NSGA-II and other benchmark algorithms, as measured by inverted generational distance and hypervolume metrics. It also exhibited superior convergence, distribution uniformity, and robustness. Furthermore, the algorithm was applied to the multi-objective optimization of electric winch trajectories for oil drilling rigs, which employed trajectory planning based on quintic polynomials. The simulation results demonstrated, compared to the pre-optimization baseline data, reductions of 6% in total operation time, 17.99% in energy consumption, and 27.4% in impact severity, thereby validating the method’s effectiveness and applicability in practical engineering scenarios. The comprehensive results demonstrate that the improved algorithm exhibits robust performance and excellent adaptability when addressing complex multi-objective optimization problems.

1. Introduction

Optimization algorithms play a pivotal role in resolving complex engineering challenges, identifying optimal solutions under specific constraints [1,2]. In recent years, meta-heuristic algorithms have garnered significant attention for their capacity to efficiently explore vast solution spaces without requiring gradient information [3]. These algorithms, inspired by natural phenomena, physical laws, and swarm intelligence, have been successfully applied across diverse domains including forecasting, control systems, and mechanical engineering. However, within the specific application domain of electric winch operation in petroleum drilling rigs, traditional optimization methods encounter significant challenges. As the power core of the derrick hoisting system, electric winches must strike a balance between operational efficiency and safety considerations. During field operations, operator deviations in controlling the winch’s hoisting/lowering speed can readily trigger severe safety incidents such as ‘top bumping’ or ‘bottom slamming’. Such occurrences not only directly threaten personnel safety and equipment structural integrity but also precipitate a cascade of consequences including drilling operation interruptions and drill string damage. This underscores the critical impact of winch speed control precision on drilling safety and continuity.
This class of electric winch trajectory planning problems essentially constitutes a typical complex multi-objective optimization challenge. Its core characteristic lies in the simultaneous optimization of multiple conflicting objectives, where improvement in any single objective often leads to deterioration in others. Consequently, solutions capable of achieving a Pareto-optimal solution set must be sought [4,5]. To resolve this engineering challenge, an integrated solution combining ‘algorithm performance enhancement with engineering scenario adaptation’ must be developed. Practical engineering problems such as electric winch trajectory planning exhibit complex constraints, high dimensionality, and strong nonlinearity [6,7]. These characteristics render traditional mathematical optimization techniques—which rely on gradient information and possess weak constraint handling capabilities—ineffective. Such approaches not only frequently converge to local optima but also struggle to identify balanced solutions amidst multi-objective conflicts.
Against this backdrop, metaheuristic algorithms have garnered significant attention and experienced rapid development due to their advantages of requiring no gradient information, exhibiting strong global convergence, and possessing high flexibility [8]. Early meta-heuristic algorithms primarily fall into three categories: evolutionary, physics-inspired, and swarm intelligence-based [3]. Representative examples include genetic algorithms (GAs) [9], simulated annealing (SA) [10], and particle swarm optimization (PSO) [11]. Subsequent developments have yielded improved algorithms such as gray wolf optimization (GWO) [12] and the whale optimization algorithm (WOA) [13]. Today, the algorithm classification system has become more systematic, with new categories emerging such as chemical reaction-based algorithms [14], Teaching and Learning-based Optimization (TLBO) inspired by human behavior [15], gradient-based optimization algorithms (GSO) [16], and the Portia Spider Algorithm (PSA) [17]. Current research priorities have shifted from ‘proposing entirely novel algorithms’ to ‘enhancing the performance of existing algorithms’. Mainstream approaches include introducing adaptive mechanisms, integrating chaotic strategies, or combining machine learning to construct hybrid models. Crucially, evolutionary algorithms within meta-heuristics demonstrate unique advantages when addressing such multi-objective problems [18,19]. These algorithms can simultaneously search for multiple Pareto-optimal solutions through population iteration while maintaining robust performance for high-dimensional, strongly nonlinear problems. They effectively address variable coupling and dynamic constraints in winch trajectory planning, overcoming the shortcomings of traditional mathematical optimization techniques, namely high computational cost and susceptibility to local optima.
In multi-objective optimization algorithms, the second-generation non-dominated sorting genetic algorithm (NSGA-II) has become a cornerstone method within the field due to its adoption of rapid non-dominated sorting and crowding degree calculation mechanisms to enhance solution convergence and distribution [20,21]. However, NSGA-II exhibits notable limitations when addressing complex problems such as electric winch trajectory optimization, which impede its performance on intricate tasks. These primarily include: susceptibility to premature convergence due to diminished population diversity [22]; sluggish convergence rates when handling high-dimensional problems [23]; and suboptimal performance of the crowding distance metric mechanism when multiple objectives are involved [23]. To overcome these limitations, researchers have proposed various enhancement strategies. For instance, Lu et al. enhanced population diversity by introducing chaotic mappings [24]; Pires et al. simultaneously improved convergence accuracy and distribution uniformity through local search strategies [25]. Other studies integrated specialized operators such as Lévy walks [26] or simulated annealing [27] to enhance global search capabilities or better balance ‘exploration’ and “exploitation”. However, these improvements predominantly focused on single dimensions, with few studies simultaneously integrating ‘global exploration—local exploitation—parameter adaptation’ to form a synergistic mechanism.
Regarding the optimization of electric winch trajectory planning, existing research has yet to integrate trajectory planning models for the hoisting and lowering phases with high-performance multi-objective algorithms. To address this gap, this study constructs an enhanced algorithm (NSGAII-Levy-SA) based on an improved NSGA-II framework. This algorithm combines Levy flight with simulated annealing strategies and applies it to optimize the velocity trajectory of electric winches on oil drilling platforms.
The main contributions are summarized as follows:
  • Introduction of the Lévy flight mutation operator to broaden the global search scope and circumvent local optima traps;
  • Integration of the simulated annealing local search mechanism to enhance late-stage optimization capabilities;
  • Design of an adaptive parameter control strategy to dynamically coordinate the balance between exploration and exploitation.
The remainder of this paper is organized as follows: Section 2 details the architecture and mechanics of the proposed NSGA-II-Levy-SA algorithm; Section 3 presents a comparative analysis of the algorithm’s performance on standard test functions (ZDT and DTLZ series); Section 4 demonstrates the application of the proposed algorithm to the velocity trajectory optimization of electric winches in oil drilling rigs; and finally, Section 5 summarizes the principal findings and outlines prospective directions for future research.

2. An Improved NSGA-II Algorithm Integrating Lévy Flight and Simulated Annealing

The Non-dominated Sorting Genetic Algorithm II (NSGA-II), proposed by Deb et al. in 2002, is a classic multi-objective evolutionary algorithm [20]. Its core mechanics rely on fast non-dominated sorting and crowding distance computation to maintain population convergence and diversity. This section focuses on elucidating the proposed enhancements to the NSGA-II algorithm and does not provide a detailed description of the foundational algorithm itself.

2.1. Analysis of Core Innovation Points

2.1.1. Global Exploration Variation Strategy Based on Lévy Flight

The mutation operators in traditional genetic algorithms typically generate small step sizes. This often causes the algorithm to become trapped in local optima when confronted with multimodal, complex optimization problems, thereby hindering effective exploration of the entire search space. To overcome this limitation, the proposed algorithm incorporates a mutation operator based on the Lévy flight mechanism, which is characterized by a heavy-tailed distribution of step lengths. This property enables the operator to frequently make small, localized steps for intensive search while occasionally generating large, long-range jumps, thus facilitating escape from local optima and enhancing global explorative capability.
Lévy flight is a specialized random walk in which the step size, denoted as “s”, follows a Lévy distribution. It is characterized by frequent short-distance movements interspersed with occasional long-distance jumps. This heavy-tailed property facilitates an efficient global search strategy, enabling the algorithm to escape local optima and explore vast regions of the search space effectively. The probability density function of the Lévy distribution is provided in Equation (1).
f x ( x ; σ , μ ) = ( σ 2 π ) 1 / 2 1 ( x μ ) 3 / 2 exp σ 2 ( x μ ) μ < x <
where μ is the location parameter, which shifts the distribution curve horizontally to make the distribution range μ , , and σ is the scale parameter.
The stride s for the Lévy walk can be generated using the Mantegna algorithm, calculated as shown in Formula (2).
s = μ v 1 / γ
where u ~ N ( 0 , σ μ 2 ) and v ~ N ( 0,1 ) ; the calculation formula for σ μ is given by Equation (3):
σ u = Γ ( 1 + β ) sin ( π γ / 2 ) γ Γ ( γ + 1 ) / 2 2 ( γ 1 ) / 2 1 / γ
The value of σ μ = γ is typically set to 1.5.
In the algorithm, the update process for individual xi in generation t is expressed as follows (Equation (4)):
x i ( t + 1 ) = x i ( t ) + α ( t ) s ( x max x min )
where x m a x and x m i n represent the upper and lower bound vectors of the decision variable, respectively; s denotes the random stride generated via the Lévy distribution; and α t signifies the stride scaling factor that adapts to the iteration count t.
By incorporating a Lévy flight operator, which leverages its characteristic mix of frequent short steps and occasional long jumps, the algorithm stochastically updates individual positions within the population. This enhances its capacity to explore and identify global optima. This mechanism thereby increases population diversity and accelerates the convergence toward globally optimal solutions. Consequently, the global exploration capability of the algorithm is significantly enhanced. The occasional long-range jumps facilitate escape from local optima basins of attraction and enable the exploration of novel, potentially more promising regions of the search space. This process effectively maintains population diversity and mitigates the risk of premature convergence.

2.1.2. Local Development and Elite Retention in Simulated Annealing

As the algorithm progresses into later iterations, a majority of the solutions converge toward the Pareto-optimal front. At this stage, the primary focus of the algorithm shifts from global exploration to the refinement of high-quality, non-dominated solutions—a process termed local exploitation. To facilitate this refinement process, a simulated annealing mechanism is incorporated.
Simulated annealing is a stochastic optimization algorithm based on a physical annealing process. Its core principle lies in accepting not only better solutions but also inferior ones with a certain probability at a given “temperature” T, thereby enabling an escape from shallow local minima. This acceptance probability follows the Metropolis criteria. For a current solution xcurrent and a new solution xneighbor generated within its neighborhood, their energies (fitness values) are denoted as Ecurrent and Eneighbor, respectively. The energy function E is defined as the sum of multi-objective function values, i.e., E = m 1 M f m ( x ) , where M denotes the total number of objectives, and fm(x) represents the value of the mth objective function.
The acceptance probability P of the new interpretation is defined by Formula (5):
P ( x c u r r e n t x n e i g h b o r ) = 1 Δ E 0 e Δ E T Δ E > 0
where Δ E = E n e i g h b o r E c u r r e n t .
This algorithm employs a dual-temperature cooling strategy to achieve a more refined search-control mechanism:
(1)
Intergenerational Temperature Adjustment: Before performing SA optimization on the tth generation population, an initial temperature Tinit(t) is set based on the global iteration progress, as shown in Equation (6).
T i n i t ( t ) = T 0 ( 1 t t max )
where T 0 is the global initial temperature, and t m a x is the total number of iterations.
(2)
Internal Iterative Cooling: Within the inner loop, k local searches are performed on a given solution, and the temperature T decays after each iteration:
T k + 1 = T k η
where η is the cooling rate.
This dual cooling schedule enables the algorithm to apply varying search intensities across different evolutionary stages. The inter-generational temperature adjustment promotes overall stability during the later phases of evolution, while the intra-generational cooling facilitates intensive exploration within individual local search procedures. Consequently, this approach significantly enhances the convergence precision and algorithmic stability.

2.1.3. Adaptive Parameter Control Strategy

To enable the algorithm to intelligently balance exploration and exploitation throughout the entire evolutionary process, an adaptive parameter control strategy was designed.
(1)
Adaptive adjustment of the Leviathan flight step scaling factor α(t) as shown in Equation (8):
α ( t ) = C ( 1 t t max )
where C is a constant. In the early stages of evolution, α t is large. Combined with the decision variable range ( x m a x x m i n ) , this enables the Lévy walk to generate large strides, promoting global exploration. As t increases, α t decreases linearly, causing the mutation stride to shorten. The algorithm then shifts toward more refined local search.
(2)
Dynamic Switching of the Lévy Flight Index β:
During the initial phase ( t t m a x 0.6 ), the algorithm employs a larger β value to stabilize the step size distribution. In the later phase ( t t m a x > 0.6 ), it switches to a smaller value of β , which increases the “tail” heaviness of the Lévy distribution. This increases the probability of long-distance jumps, aiding in breaking potential deadlocks during the later stages of the search and escaping from deep local optima.
(3)
Dynamic Control of Simulated Annealing Temperature T:
The simulated annealing (SA) component utilizes a dual cooling schedule that integrates inter-generational adjustment with intra-generational cooling. This strategy ensures a gradual transition from extensive global exploration in the initial phases to intensive local exploitation in the final phases.
The adaptive parameter control mechanism allows the algorithm to dynamically modulate its search strategy in response to the varying requirements of different evolutionary stages. This capability facilitates a seamless transition and maintains a dynamic balance between global exploration and local exploitation, thus significantly enhancing the algorithm’s robustness and overall optimization performance.

2.2. Operational Framework of the NSGAII-Levy-SA Algorithm

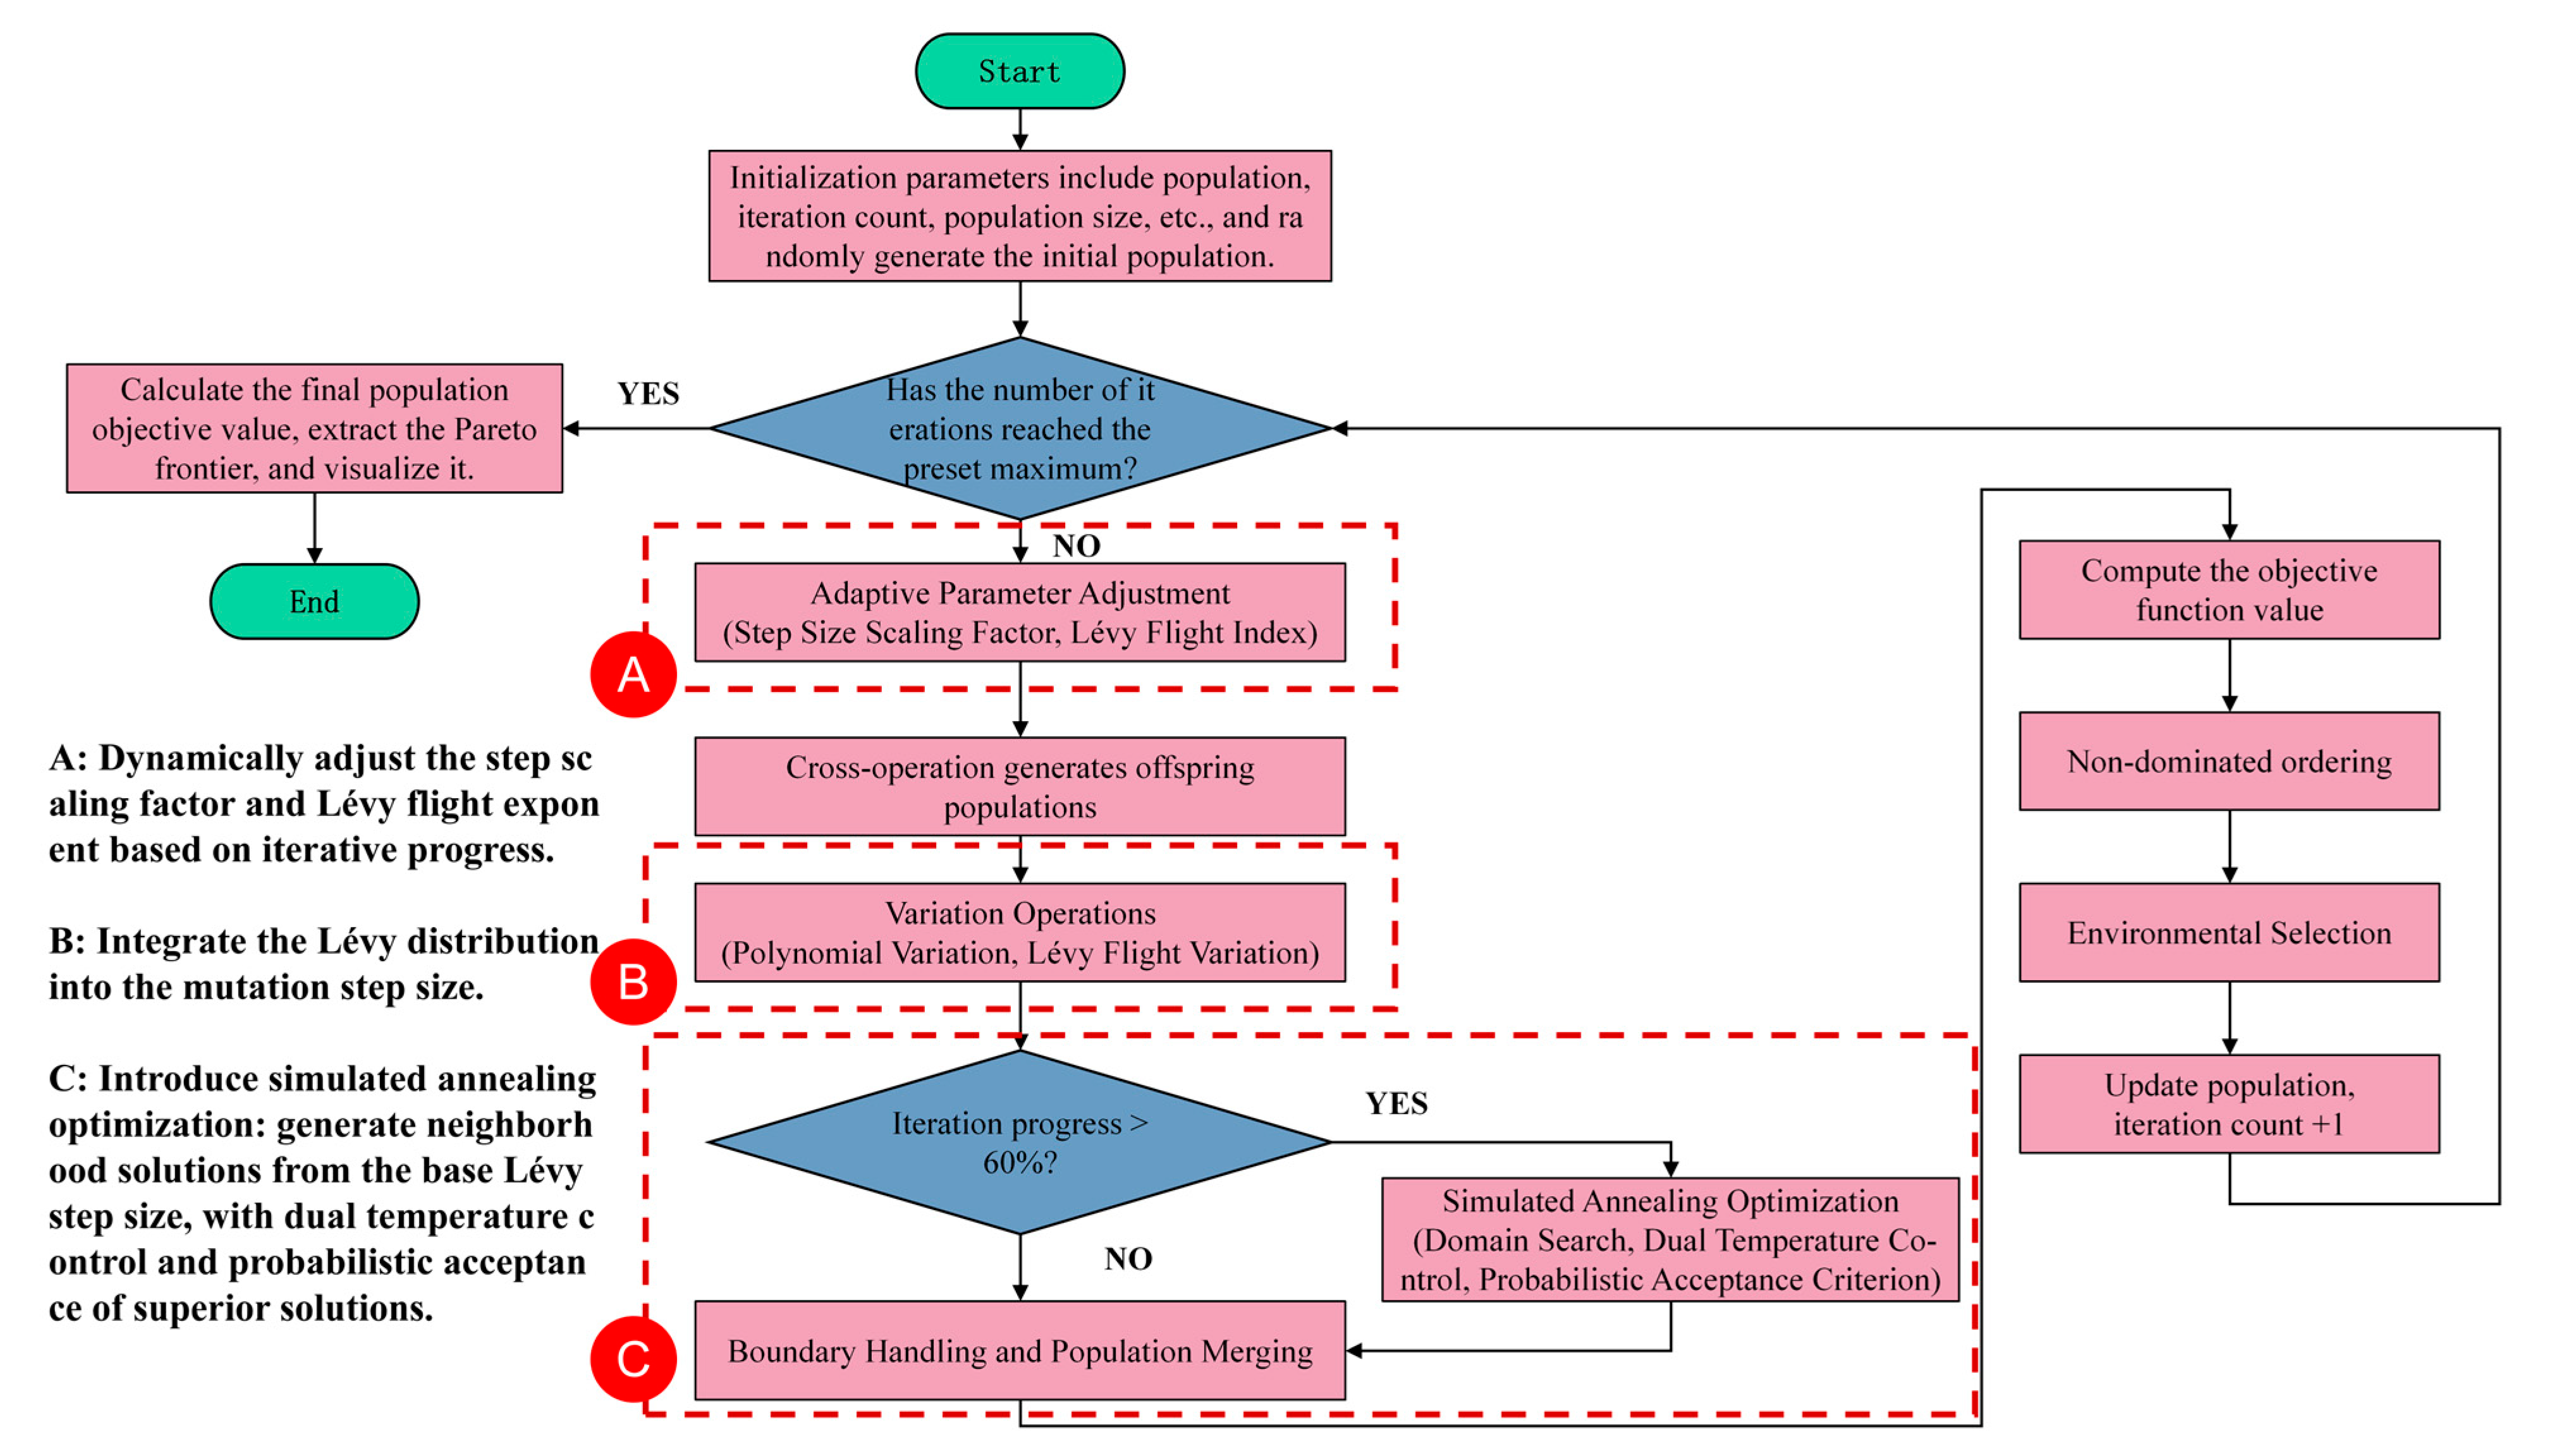
The operational framework of the NSGA-II-Levy-SA algorithm consists of five sequential phases:
Phase 1: Initialization. The initial population is randomly generated, and key parameters (e.g., the maximum number of iterations and variable boundaries) are configured. The objective function values for all individuals are subsequently evaluated.
Phase 2: Adaptive Variation. Algorithmic parameters, including the step scaling factor and Lévy flight index, are adaptively adjusted. Offspring are then generated through simulated binary crossover (SBX), followed by individual updating via polynomial mutation integrated with Lévy flight mutation.
Phase 3: Local Intensification. A simulated annealing (SA) procedure is activated in the later stages of evolution (typically when iteration progress exceeds 60%). New candidate solutions are generated based on Lévy strides, and their acceptance is governed by a dual-temperature control mechanism following a probabilistic criterion.
Phase 4: Environmental Selection. Fast non-dominated sorting is applied to the merged population (parents and offspring) to identify Pareto frontiers. Individuals are subsequently selected for the next generation based on their Pareto rank and crowding distance.
Phase 5: Termination and Output. The iterative process terminates upon reaching the predefined maximum number of iterations. The Pareto-optimal frontier is extracted from the final population, and the optimization results are outputted (e.g., for visualization and analysis).
The overall workflow of the NSGA-II-Levy-SA algorithm is schematically illustrated in Figure 1.

3. Analysis of Test Function Results

3.1. Test Functions and Algorithm Parameters

To comprehensively evaluate the performance of the proposed NSGA-II-Levy-SA algorithm, benchmark tests were conducted on a set of ten standard multi-objective test problems. This set comprised four two-objective functions (ZDT1, ZDT2, ZDT3, ZDT4) and six three-objective functions (DTLZ1 to DTLZ6). The ZDT and DTLZ test suites are widely adopted as standard benchmarks for evaluating multi-objective optimizers due to their well-established properties, which include standardized design, diverse landscape characteristics, and scalable complexity. For comparative analysis, several state-of-the-art multi-objective algorithms were also tested, including NSGA-II, MOPSO [28], IBEA [29], and SPEA2 [30]. The performance of all algorithms was analyzed based on their capability to approximate the true Pareto front.
Each algorithm was run independently 10 times to ensure statistical significance. Parameter configurations for all algorithms—namely NSGA-II, MOPSO, IBEA, SPEA2, and the proposed NSGA-II-Levy-SA—are summarized in Table 1 and were optimized based on empirical observations from preliminary experiments.
The core experimental configuration was set as follows: a maximum number of iterations (Maxiter) of 300 (increased to 1000 for the ZDT4 function due to its higher complexity), a population size (Npop) of 100, and an archive size (Nr) of 100. Other algorithm-specific parameters—including the crossover probability (Pc), mutation probability (Pm), Lévy exponent (beta_levy), initial step scale (step_scale), initial SA temperature (sa_T0), SA cooling rate (sa_cooling), and SA iterations per cycle (sa_iter)—are detailed in Table 1.

3.2. Evaluation Metrics for Algorithms

To evaluate algorithmic performance, two widely adopted metrics were employed: Inverted Generational Distance (IGD) [31] and Hypervolume (HV) [32]. IGD measures the convergence precision and diversity of the solution set against the true Pareto front, while HV assesses the overall quality by quantifying the dominated objective space without requiring the true front. These metrics provide a comprehensive assessment of convergence precision, distribution uniformity, and robustness.
The IGD metric is defined as the average distance from each point on the true Pareto front (used as a reference set) to its nearest solution in the approximated solution set obtained by the algorithm. A smaller IGD value signifies superior performance, reflecting a closer approximation to the Pareto front and a more uniform distribution of solutions. The mathematical formulation of IGD is presented in Equation (9):
I G D = i = 1 n d i 2 n
where n denotes the number of true Pareto-optimal solutions, and di represents the Euclidean distance between the i-th true Pareto-optimal solution in the reference set and the most recently obtained Pareto-optimal solution.
The Hypervolume (HV) metric quantifies the volume of the objective space dominated by the approximated Pareto front and bounded by a predefined reference point. A larger HV value corresponds to a better overall performance, implying superior convergence and diversity. The mathematical definition of HV is provided in Equation (10):
H V = δ ( i = 1 s v i )
where δ denotes the Lebesgue measure used to quantify volume, s represents the number of non-dominated solution sets, and v i constitutes the hypervolume formed by the reference point and the i-th point within the solution set.
The HV metric serves as a comprehensive indicator for assessing both the convergence and diversity of non-dominated solution sets. Moreover, as the HV metric can be calculated without prior knowledge of the true Pareto front, it is particularly valuable for real-world engineering applications where the optimal Pareto front is unknown.

3.3. ZDT Test Functions

To validate the feasibility and efficacy of the proposed NSGA-II-Levy-SA algorithm, the ZDT test suite was selected to evaluate its performance in solving multi-objective optimization problems. These test functions exhibit diverse characteristics, such as convex, concave, or disconnected Pareto fronts, providing a comprehensive benchmark for assessing algorithmic performance. The specific properties and characteristics of these test functions are summarized in Table 2.

3.3.1. Analysis of IGD Results for NSGAII-Levy-SA on the ZDT Test Set

The IGD test results for the algorithms are shown in Table 3. The IBEA algorithm achieved the highest values across all test functions, indicating relatively weaker performance. The MOPSO algorithm performed second-best, generally outperforming IBEA but underperforming compared to other benchmark algorithms. The NSGA-II algorithm demonstrated robust performance across all test functions, yielding values in the upper-middle range. The SPEA2 algorithm excelled on the ZDT1, ZDT2, and ZDT3 test functions, achieving values significantly lower than most comparison algorithms. The NSGAII-Levy-SA algorithm maintained low values across all test functions, demonstrating superior overall performance in certain scenarios.

3.3.2. Analysis of HV Results for NSGAII-Levy-SA on the ZDT Test Set

The algorithmic test results for HV are shown in Table 4. The NSGAII-Levy-SA algorithm demonstrated superior performance in most test scenarios, particularly excelling in several typical test functions and exhibiting overall strong efficiency. The SPEA2 algorithm demonstrated strong performance robustness, maintaining high levels across most test functions and only slightly underperforming the optimal algorithm in isolated scenarios. The IBEA algorithm excelled in specific test functions, revealing adaptive advantages for certain problem scenarios. The overall performance of the MOPSO and NSGA-II algorithms was relatively weak, exhibiting lower efficiency across multiple test functions.

3.3.3. Stability Analysis of the NSGA-II-Levy-SA Algorithm Based on the ZDT Test Set

The IGD and HV evaluation metrics of the NSGAII-Levy-SA algorithm on test functions ZDT1 to ZDT4 are presented in Table 5 and Table 6. Both types of metrics exhibit variance and standard deviation at extremely low orders of magnitude. Specifically, the variance of the IGD metric ranges at the 10−8 order, while its standard deviation clusters around the 10−4 order, and the variance of the HV metric spans the range from 10−7 to 10−5, with the standard deviation falling between 10−4 and 10−3. These statistical characteristics reveal that during multiple independent runs, the fluctuation levels of both IGD and HV metrics are extremely minimal. This demonstrates the algorithm’s high stability and repeatability in adapting to different ZDT test scenarios, indicating minimal data variability, stable results, and high algorithmic robustness.

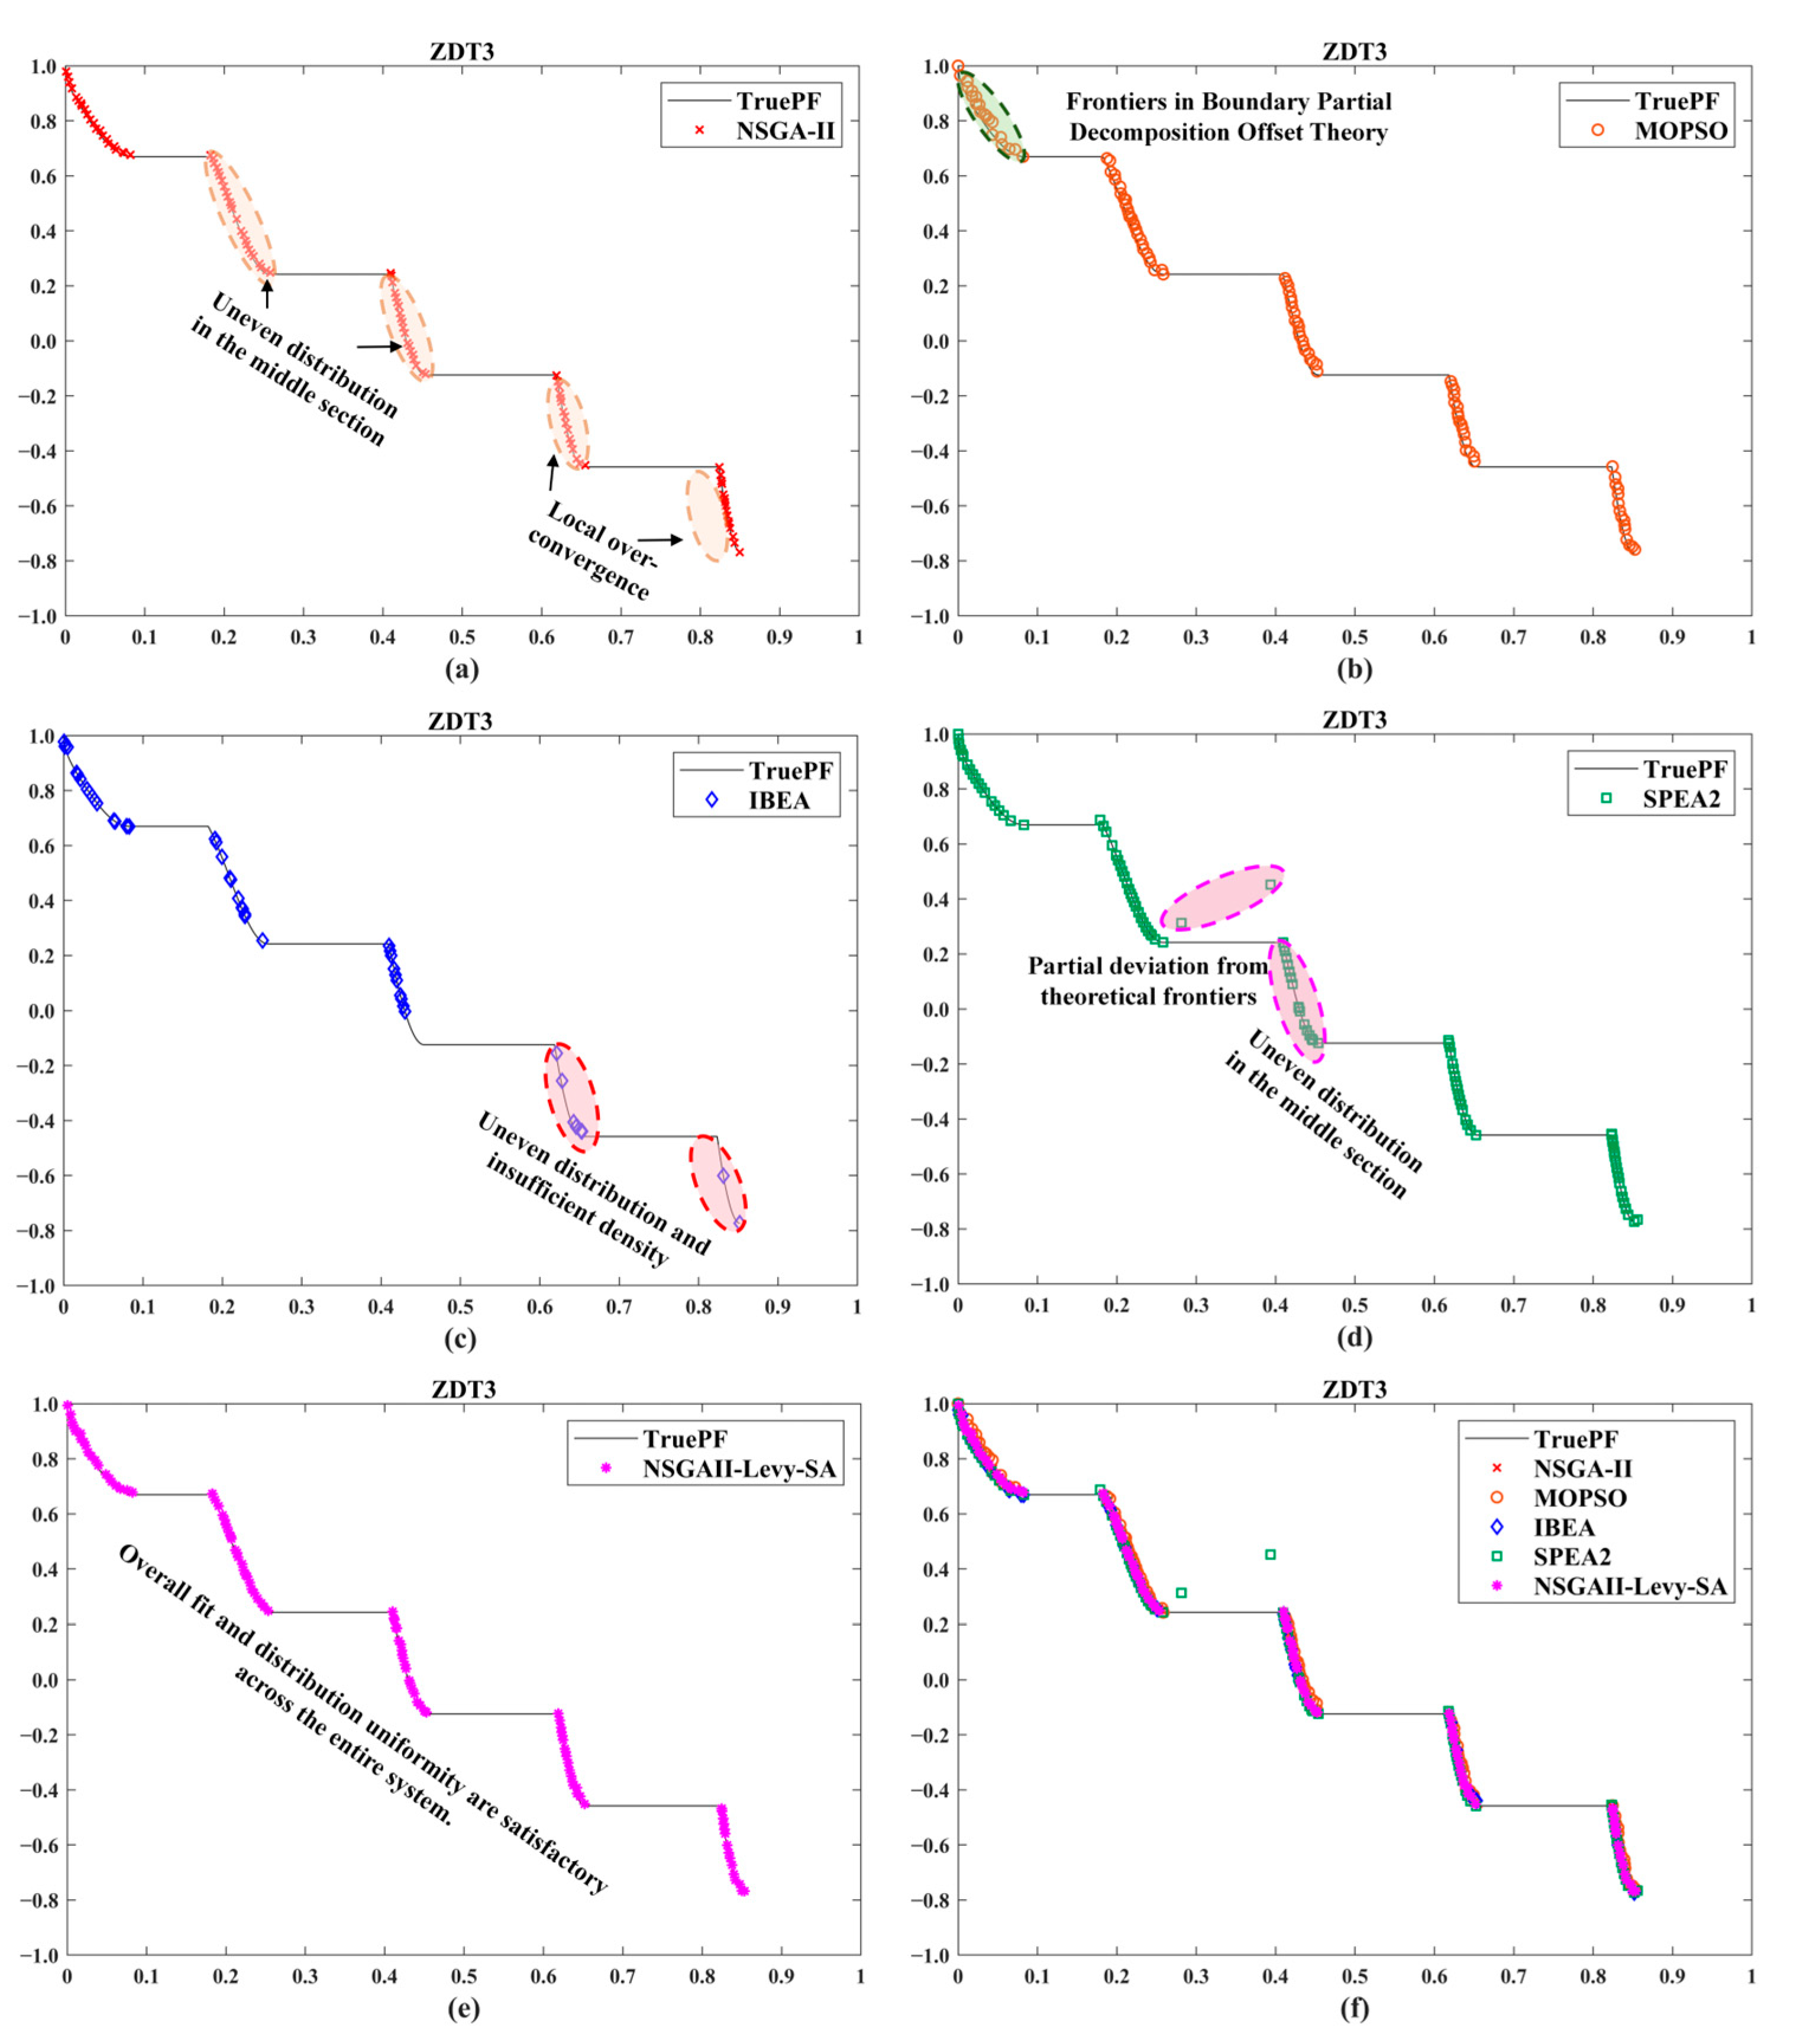
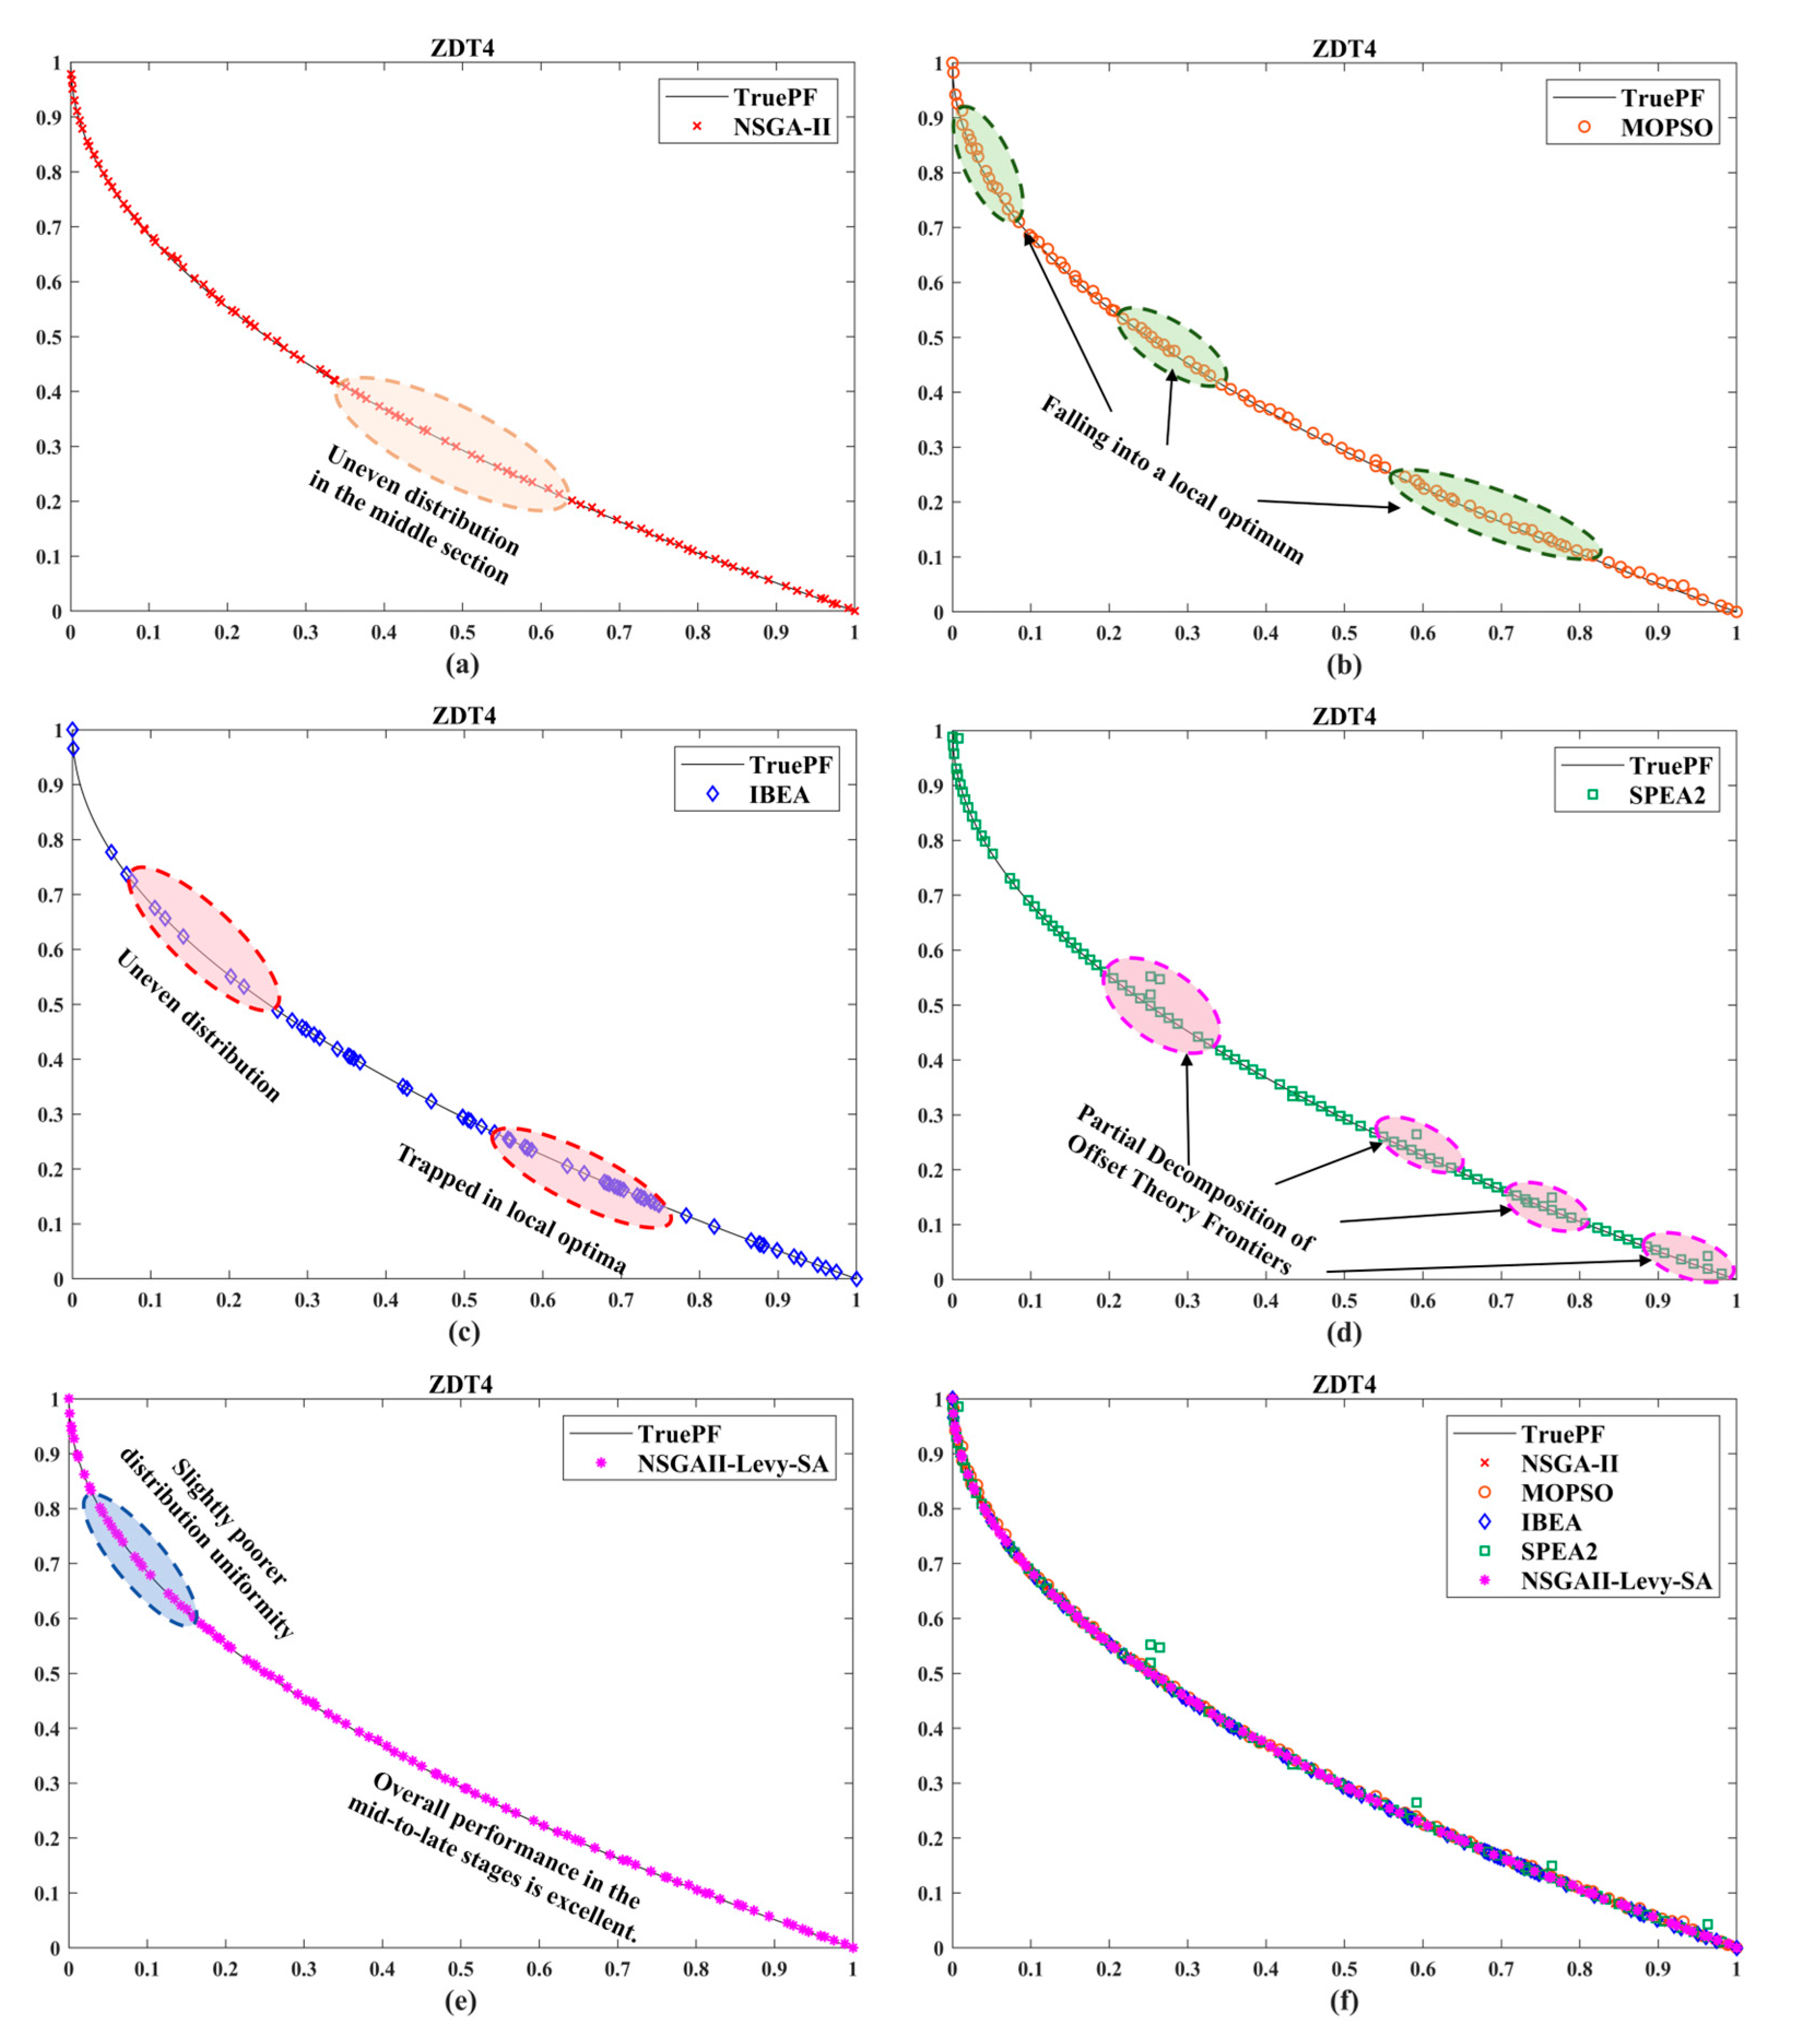
3.3.4. Pareto Frontier Analysis of NSGAII-Levy-SA on the ZDT Test Set

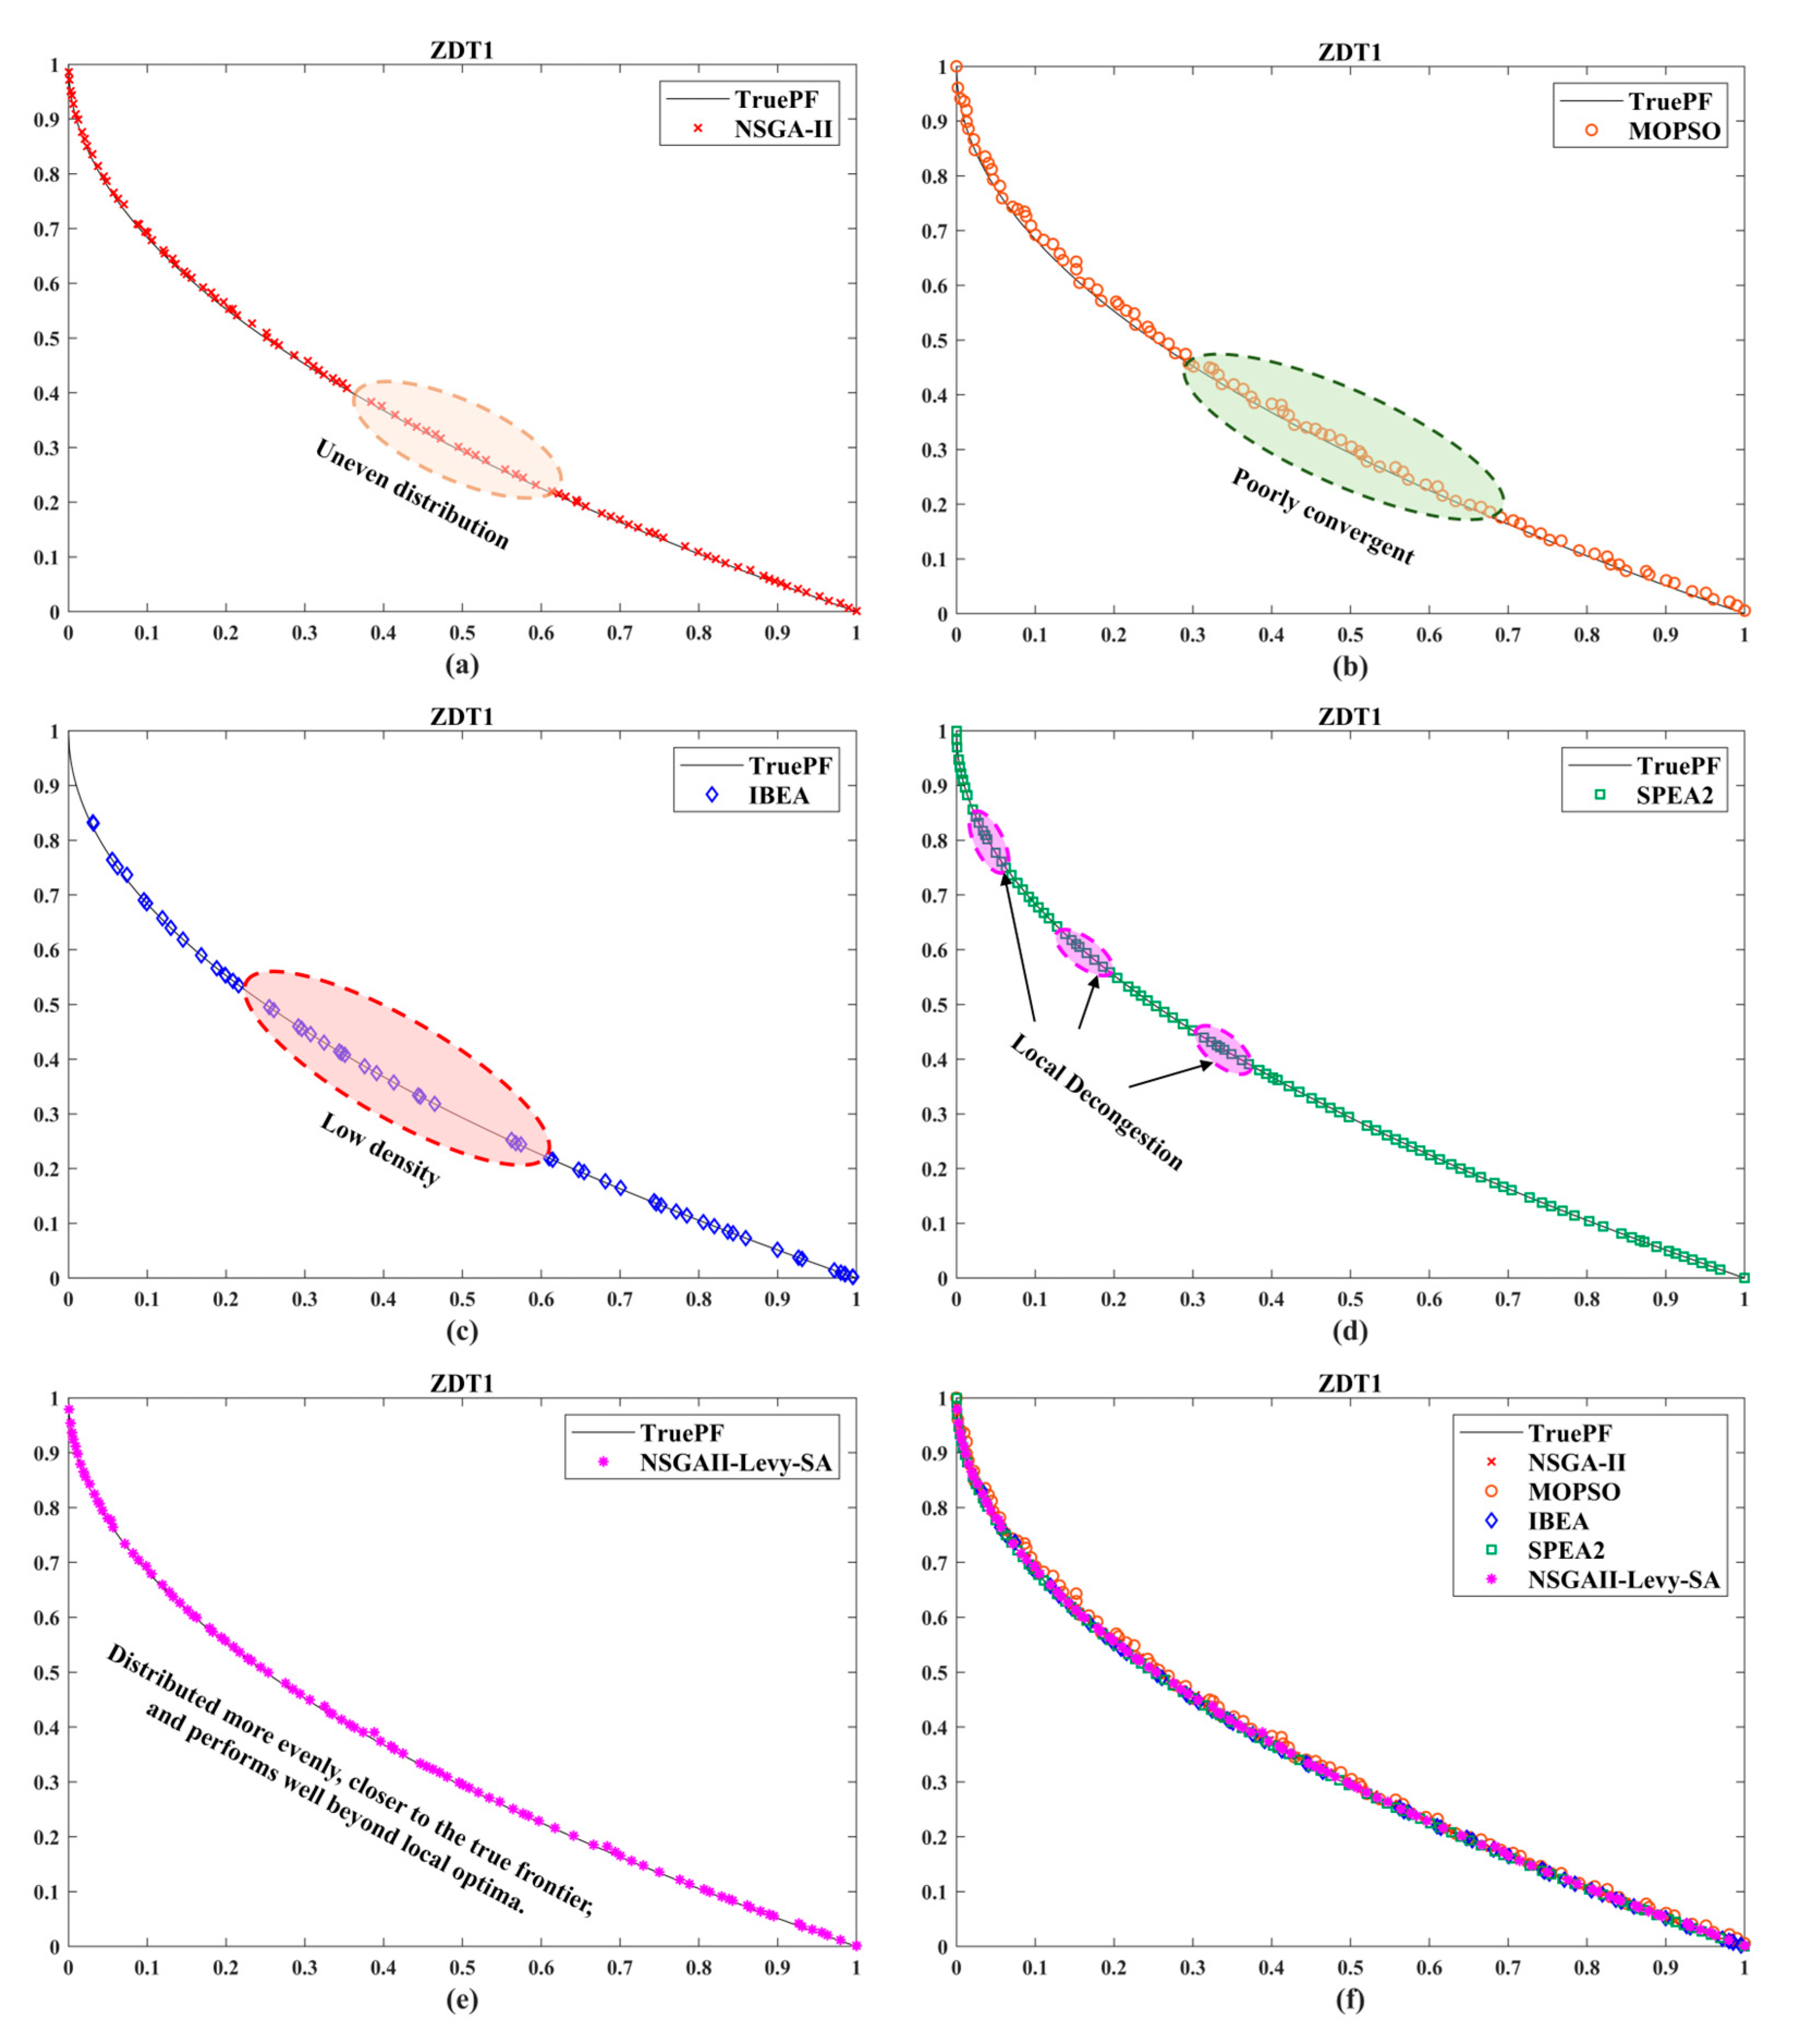
The Pareto frontier visualization results for the ZDT1–ZDT4 test functions are shown in Figure 2, Figure 3, Figure 4 and Figure 5. The NSGAII-Levy-SA algorithm demonstrates excellent frontier approximation performance across multi-objective optimization scenarios with varying topological characteristics. In the ZDT1 test, the Pareto frontier points generated by the NSGAII-Levy-SA algorithm closely align with the true frontier, exhibiting continuous distribution and uniform density. This outperforms the discrete distribution of NSGA-II and IBEA, as well as the locally dense bias of MOPSO. For the convex frontier of ZDT2, NSGAII-Levy-SA achieves more complete frontier coverage with superior convergence accuracy in boundary regions compared to competing algorithms. When confronting the multimodal frontier with discontinuous segments in ZDT3, NSGAII-Levy-SA precisely matches the shape of the true frontier across all segments, overcoming the segmented discretization issues of NSGA-II and the sparsity defects of IBEA. In the complex ZDT4 scenario with locally optimal perturbations, NSGAII-Levy-SA maintains tight tracking of frontier points relative to the true frontier, demonstrating outstanding convergence consistency and distribution uniformity among the comparison algorithms.
In the ZDT test series, the NSGAII-Levy-SA algorithm demonstrates consistent superiority in terms of convergence accuracy, population diversity, and distribution uniformity. When compared to algorithms such as NSGA-II, MOPSO, IBEA, and SPEA2, NSGAII-Levy-SA achieves a closer approximation to the true Pareto front. It also exhibits exceptional distribution consistency and comprehensive boundary coverage across diverse scenarios, including continuous, multimodal, and discontinuous fronts subject to local perturbations. These results collectively validate the algorithm’s enhanced robustness and overall performance in handling multi-objective optimization problems.

3.4. DTLZ Test Functions

To evaluate the scalability and convergence performance of the NSGAII-Levy-SA algorithm in high-dimensional objective spaces, the DTLZ series of test functions were selected for analysis. This series is widely used to assess the performance of multi-objective optimization algorithms when handling different Pareto frontier shapes, high-dimensional objectives, and complex characteristics. The DTLZ test function set offers an expandable number of objectives and exhibits diverse frontier characteristics—including linear, nonlinear, degenerate, multimodal, and discontinuous features—effectively validating the algorithm’s convergence, distribution uniformity, and search capabilities in high-dimensional spaces. Specific descriptions and characteristics of the functions are presented in Table 7.

3.4.1. Analysis of IGD Results for NSGAII-Levy-SA on the DTLZ Test Set

Table 8 presents the IGD metrics evaluating the solution set’s proximity to the true Pareto frontier and distribution uniformity. In scenarios DTLZ1-DTLZ6, NSGAII-Levy-SA outperforms NSGA-II, MOPSO, and IBEA. In DTLZ2 (convex spherical) and DTLZ3 (multi-peaked spherical) scenarios, its performance approaches that of SPEA2. Overall, it demonstrates robust adaptability to complex Pareto frontiers featuring multi-peak interference, spherical topologies, and degenerate structures. This effectively overcomes the convergence and distribution limitations of the comparison algorithms, highlighting the algorithm’s comprehensive advantages in multi-objective optimization.

3.4.2. Analysis of HV Results for NSGAII-Levy-SA on the DTLZ Test Set

As shown in Table 9, the NSGAII-Levy-SA exhibits a distinct competitive advantage in HV performance. Under the DTLZ1 multi-peak convex scenario, its HV performance surpasses that of NSGA-II, MOPSO, IBEA, and SPEA2. When addressing the DTLZ2 convex spherical and DTLZ3 multi-peak spherical problems, NSGAII-Levy-SA demonstrates superior coverage capability. In the DTLZ4 variable-scaled spherical and DTLZ5–DTLZ6 degenerate frontier scenarios, NSGAII-Levy-SA’s HV performance consistently outperformed most comparison algorithms. Its coverage completeness in the objective space was particularly outstanding when addressing search space distortion and low-dimensional collapse issues. Overall, NSGAII-Levy-SA demonstrates synergistic optimization effects in target space coverage and convergence completeness across complex scenarios—including multi-peak, spherical, and degenerate structures—revealing robust comprehensive performance.

3.4.3. Stability Analysis of the NSGA-II-Levy-SA Algorithm Based on the DTLZ Test Set

Combining Table 10 and Table 11, variance and standard deviation analyses were conducted on the IGD and HV metrics of the NSGAII-Levy-SA algorithm for the DTLZ1 to DTLZ6 test functions. The results indicate that the dispersion levels of both evaluation metrics are at an extremely low order of magnitude. Specifically, the variance of the IGD metric ranges from 10−8 to 10−6, with a standard deviation concentrated at the 10−4 order of magnitude. The variance of the HV metric spans from 10−8 to 10−5, while its standard deviation remains near the 10−4 range. This demonstrates that during multiple independent runs of the algorithm, the fluctuation range of both IGD and HV metrics remains minimal. Even when confronted with complex scenarios such as multi-peak, spherical, and degenerate Pareto front scenarios inherent in the DTLZ series test functions, the algorithm maintains high stability and result reproducibility.

3.4.4. Pareto Frontier Analysis of NSGAII-Levy-SA on the DTLZ Test Set

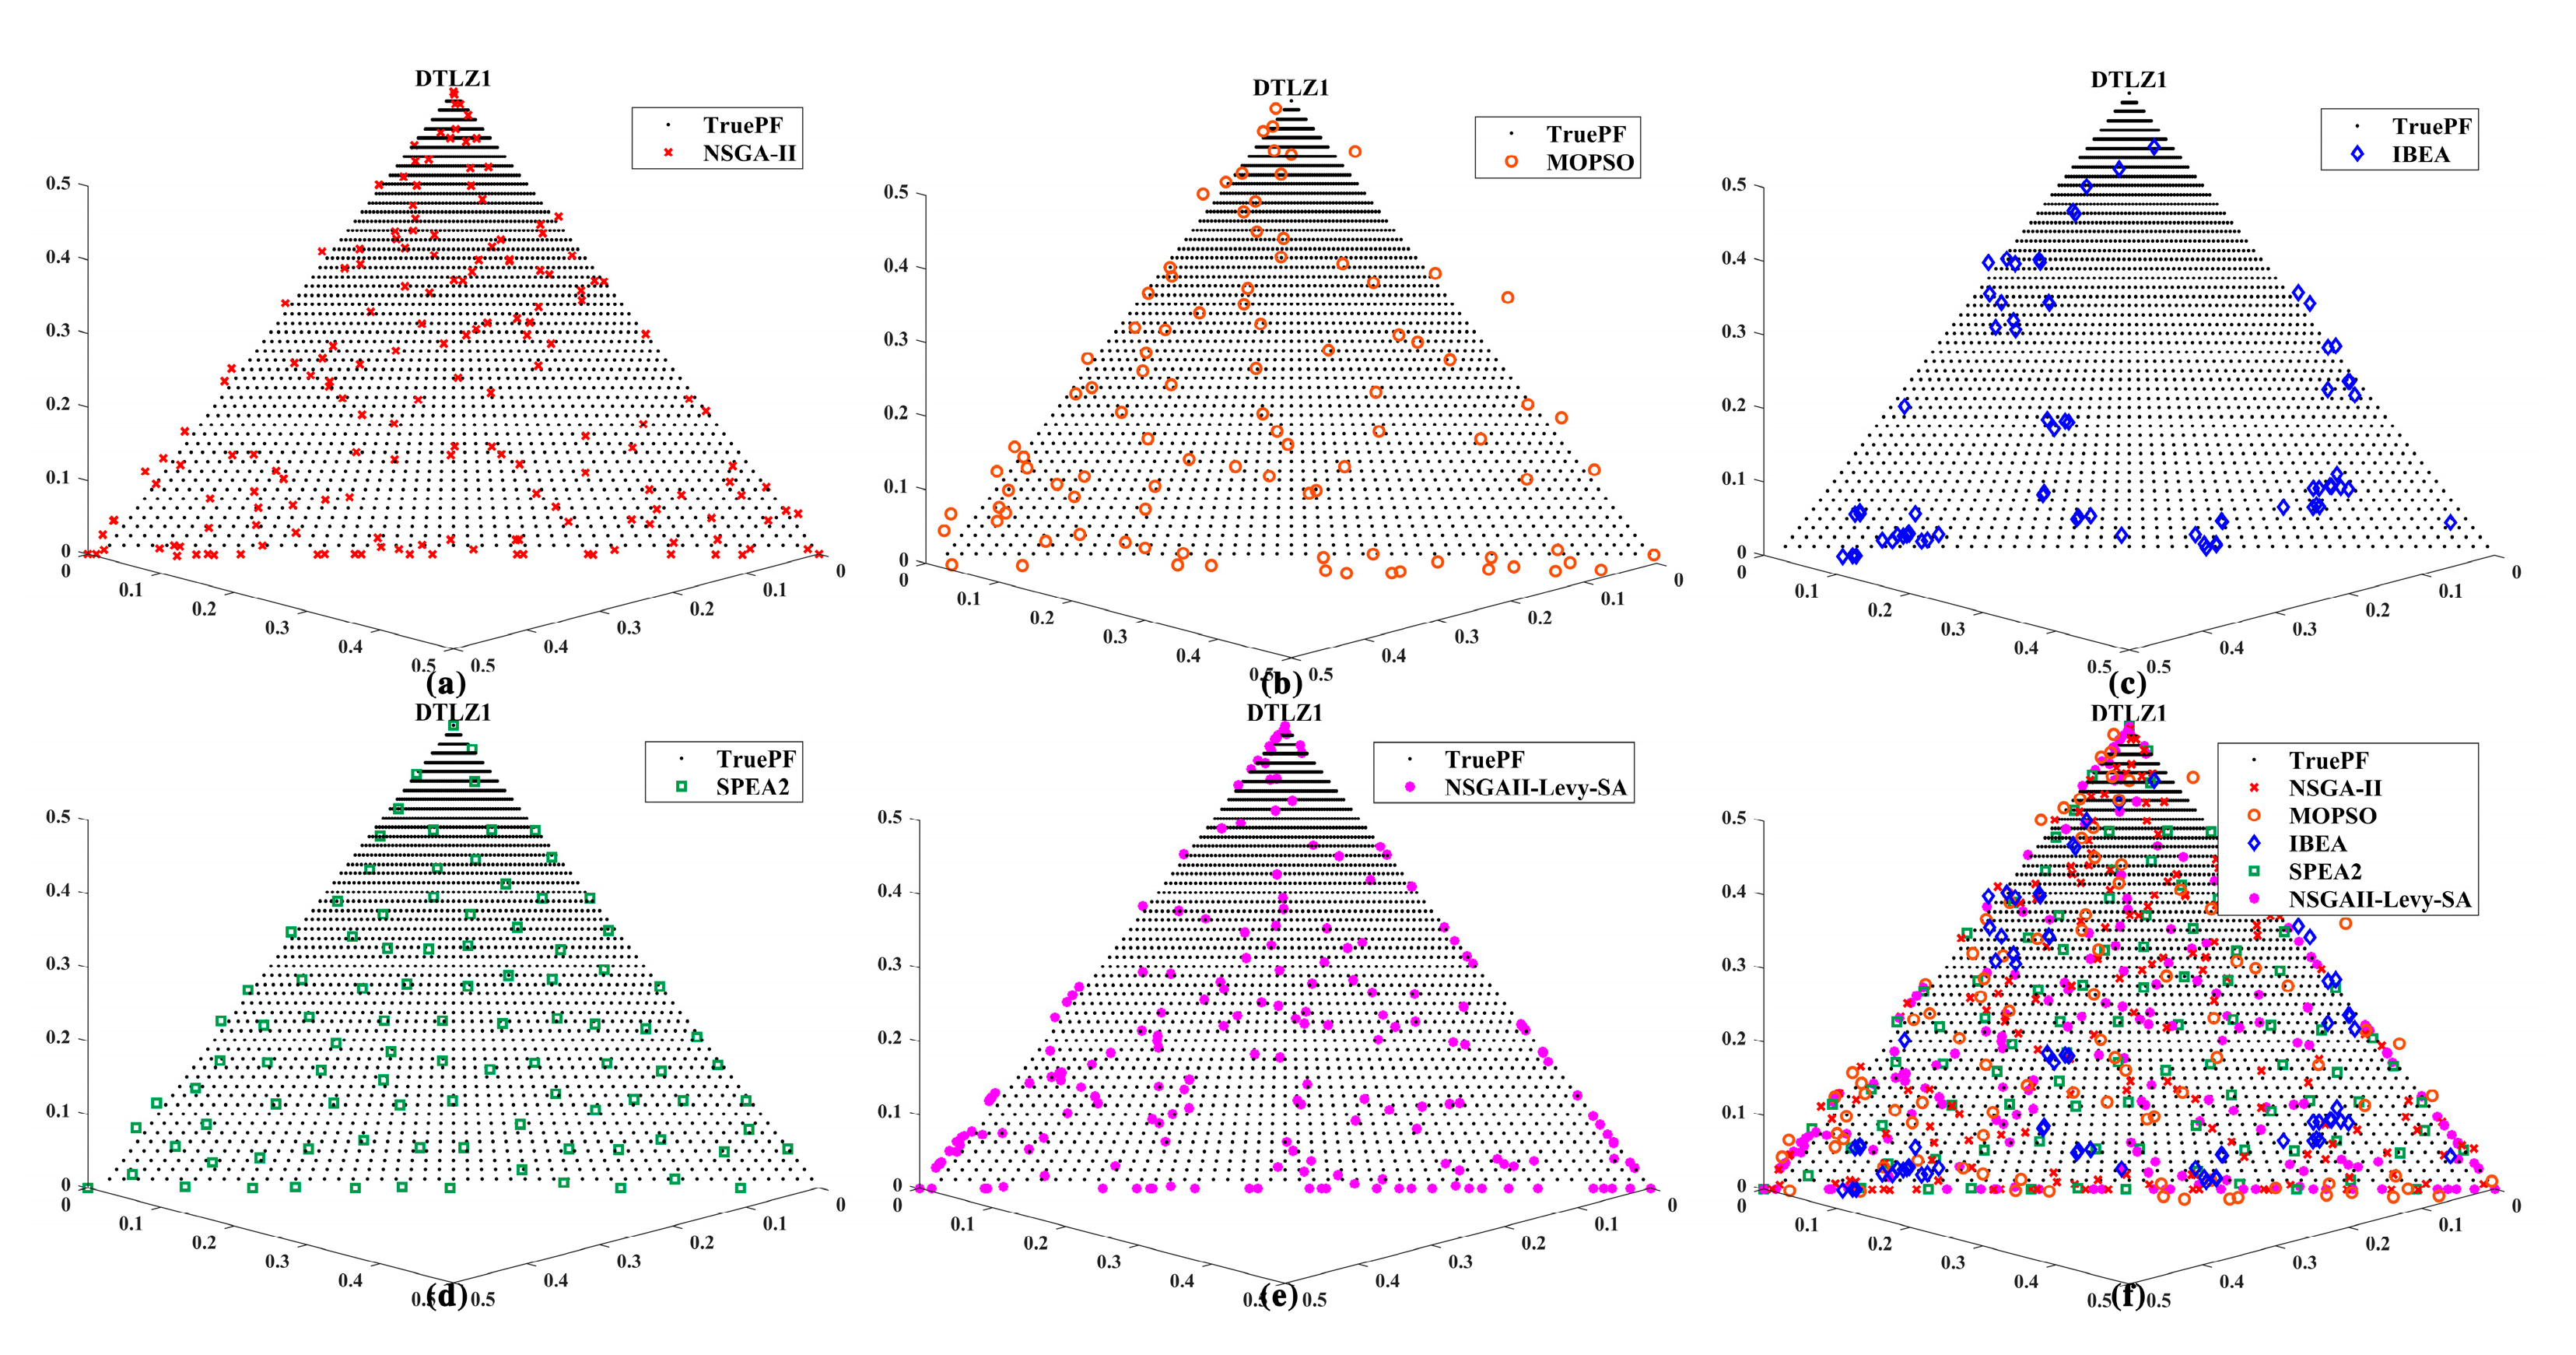
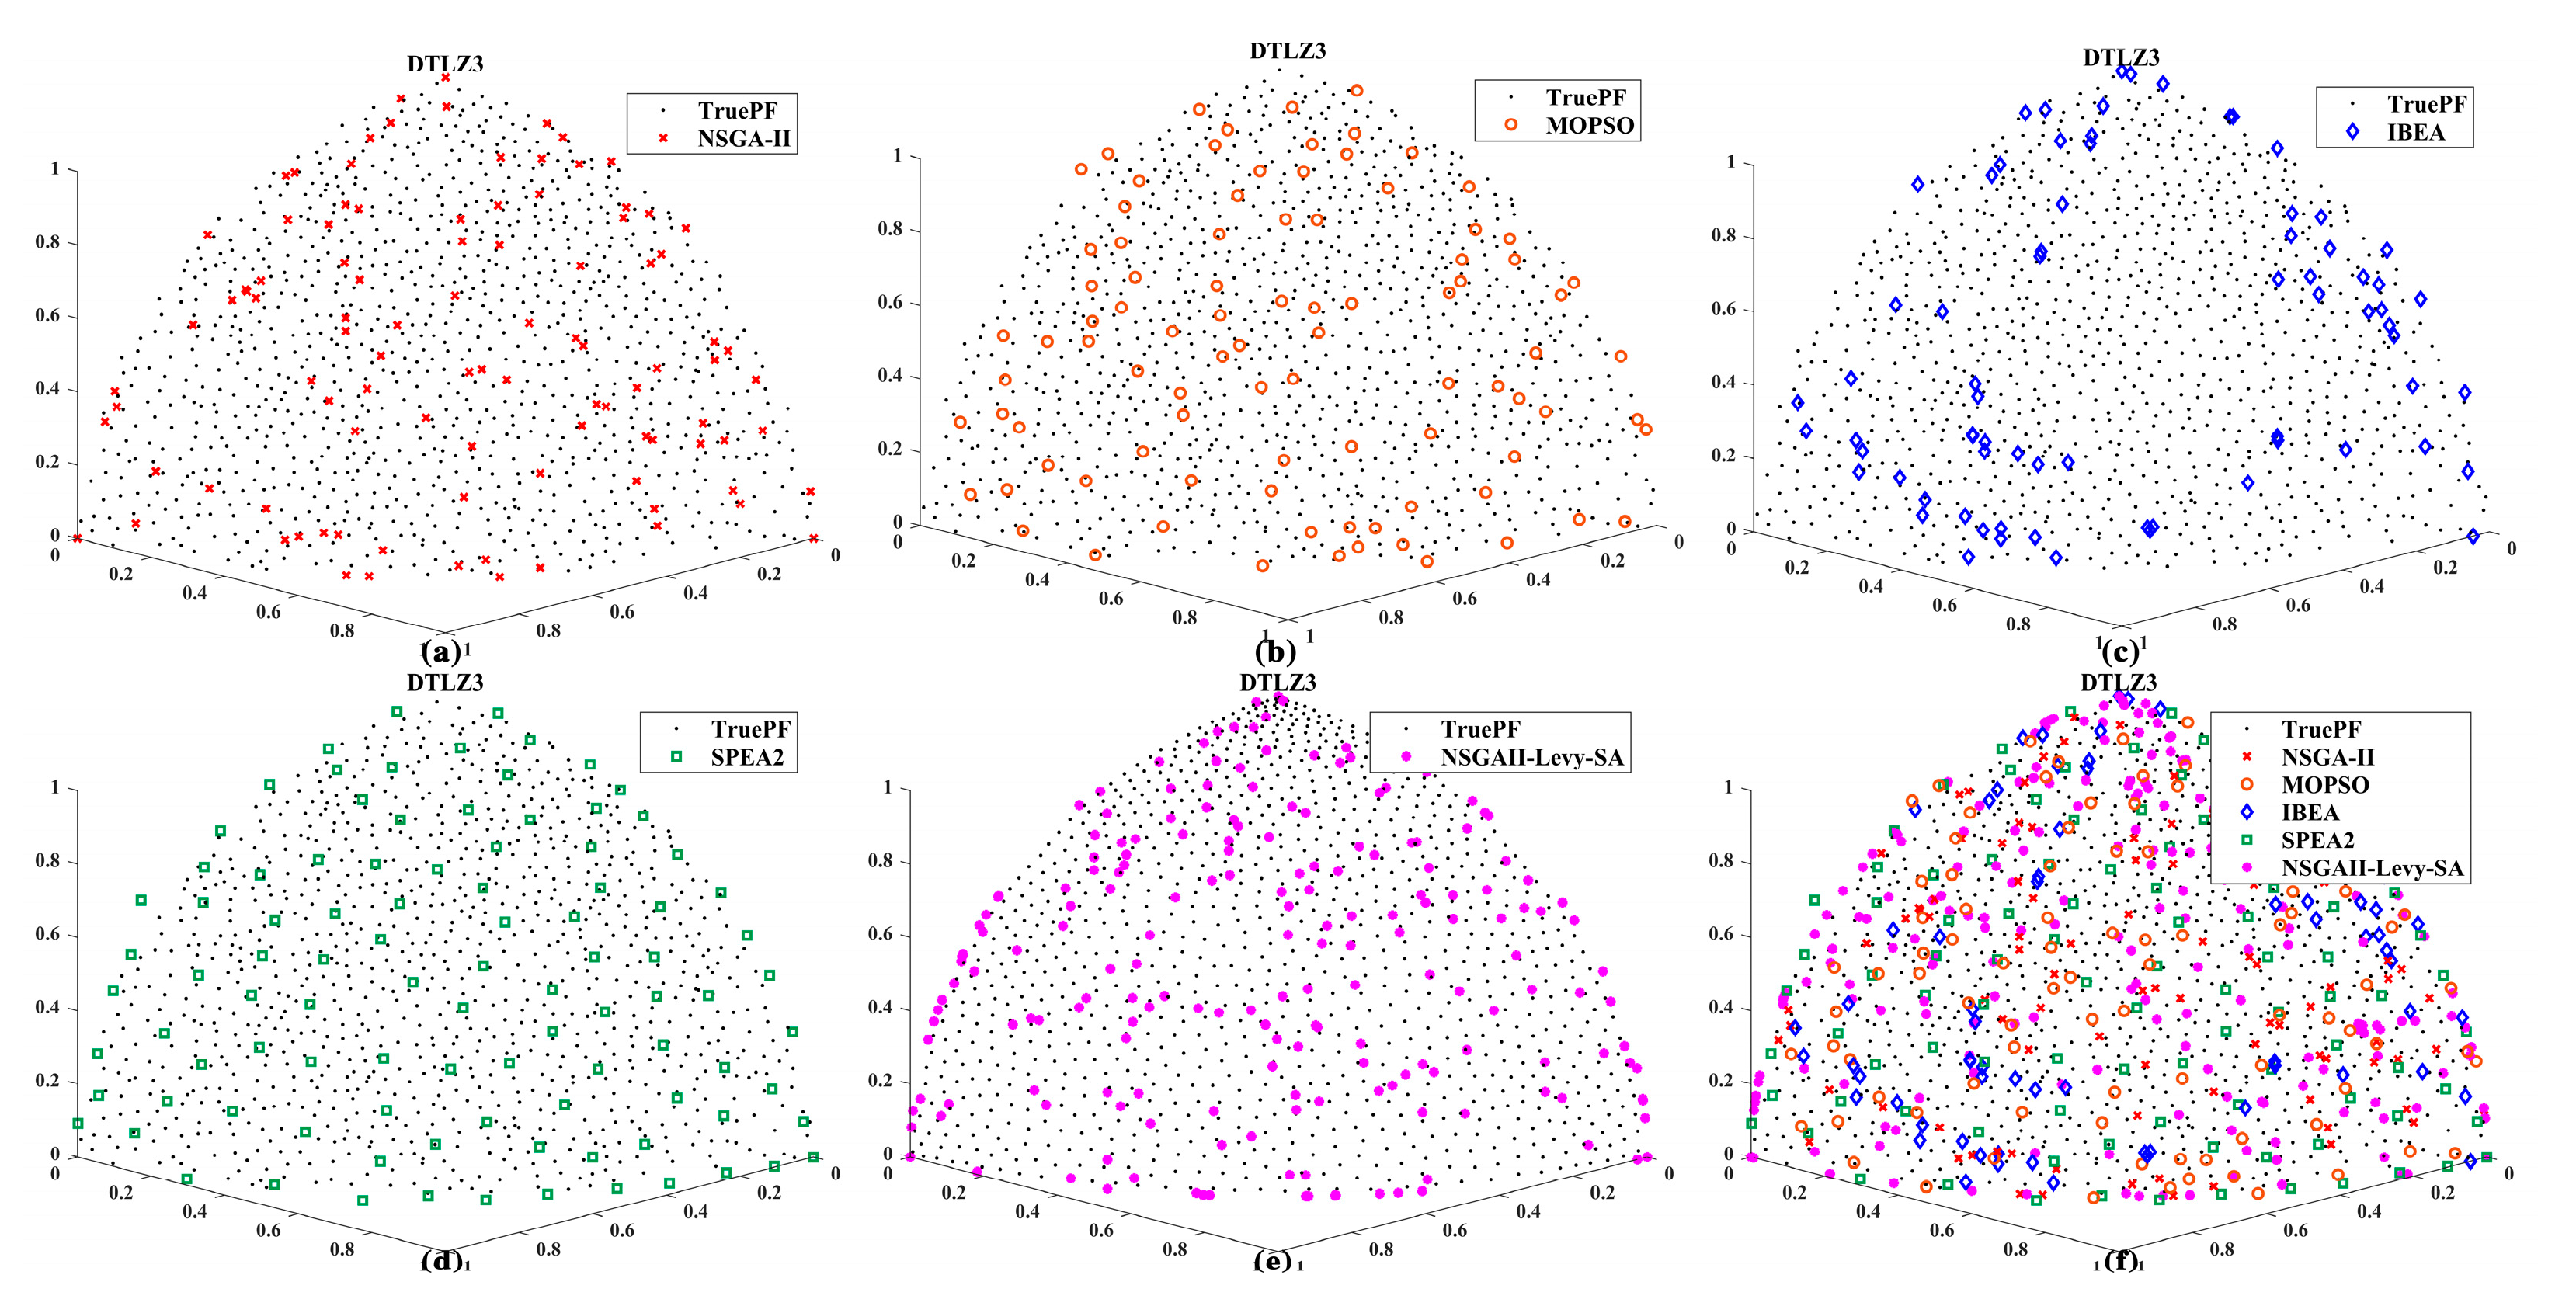
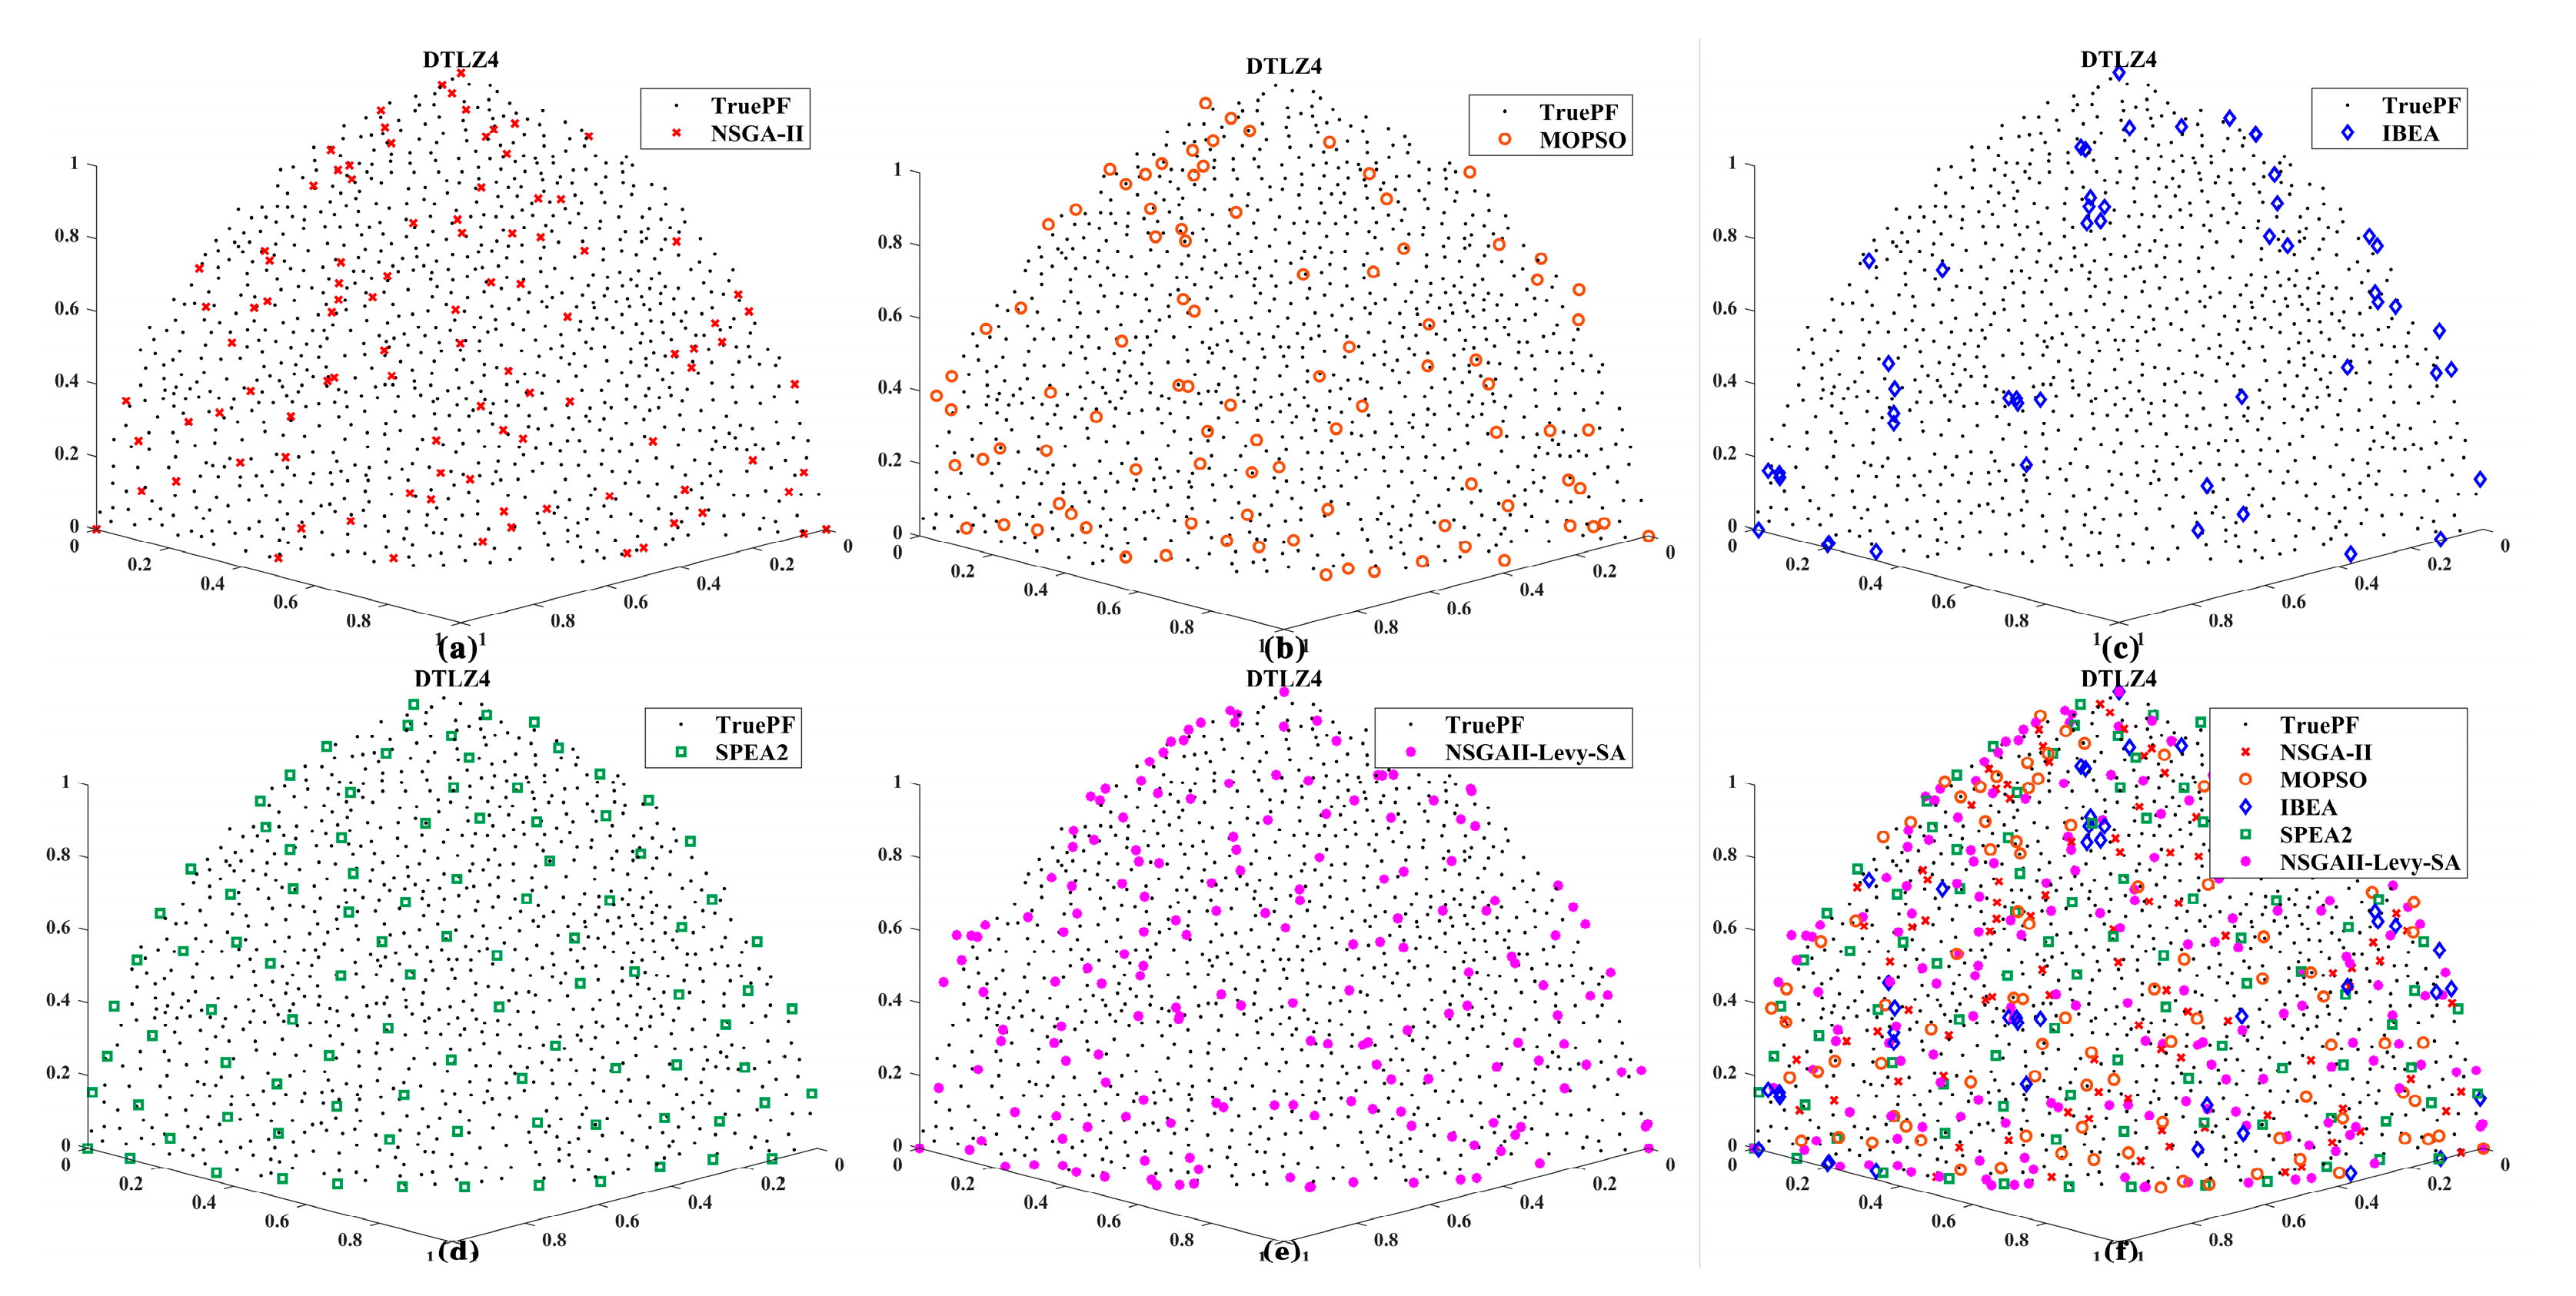
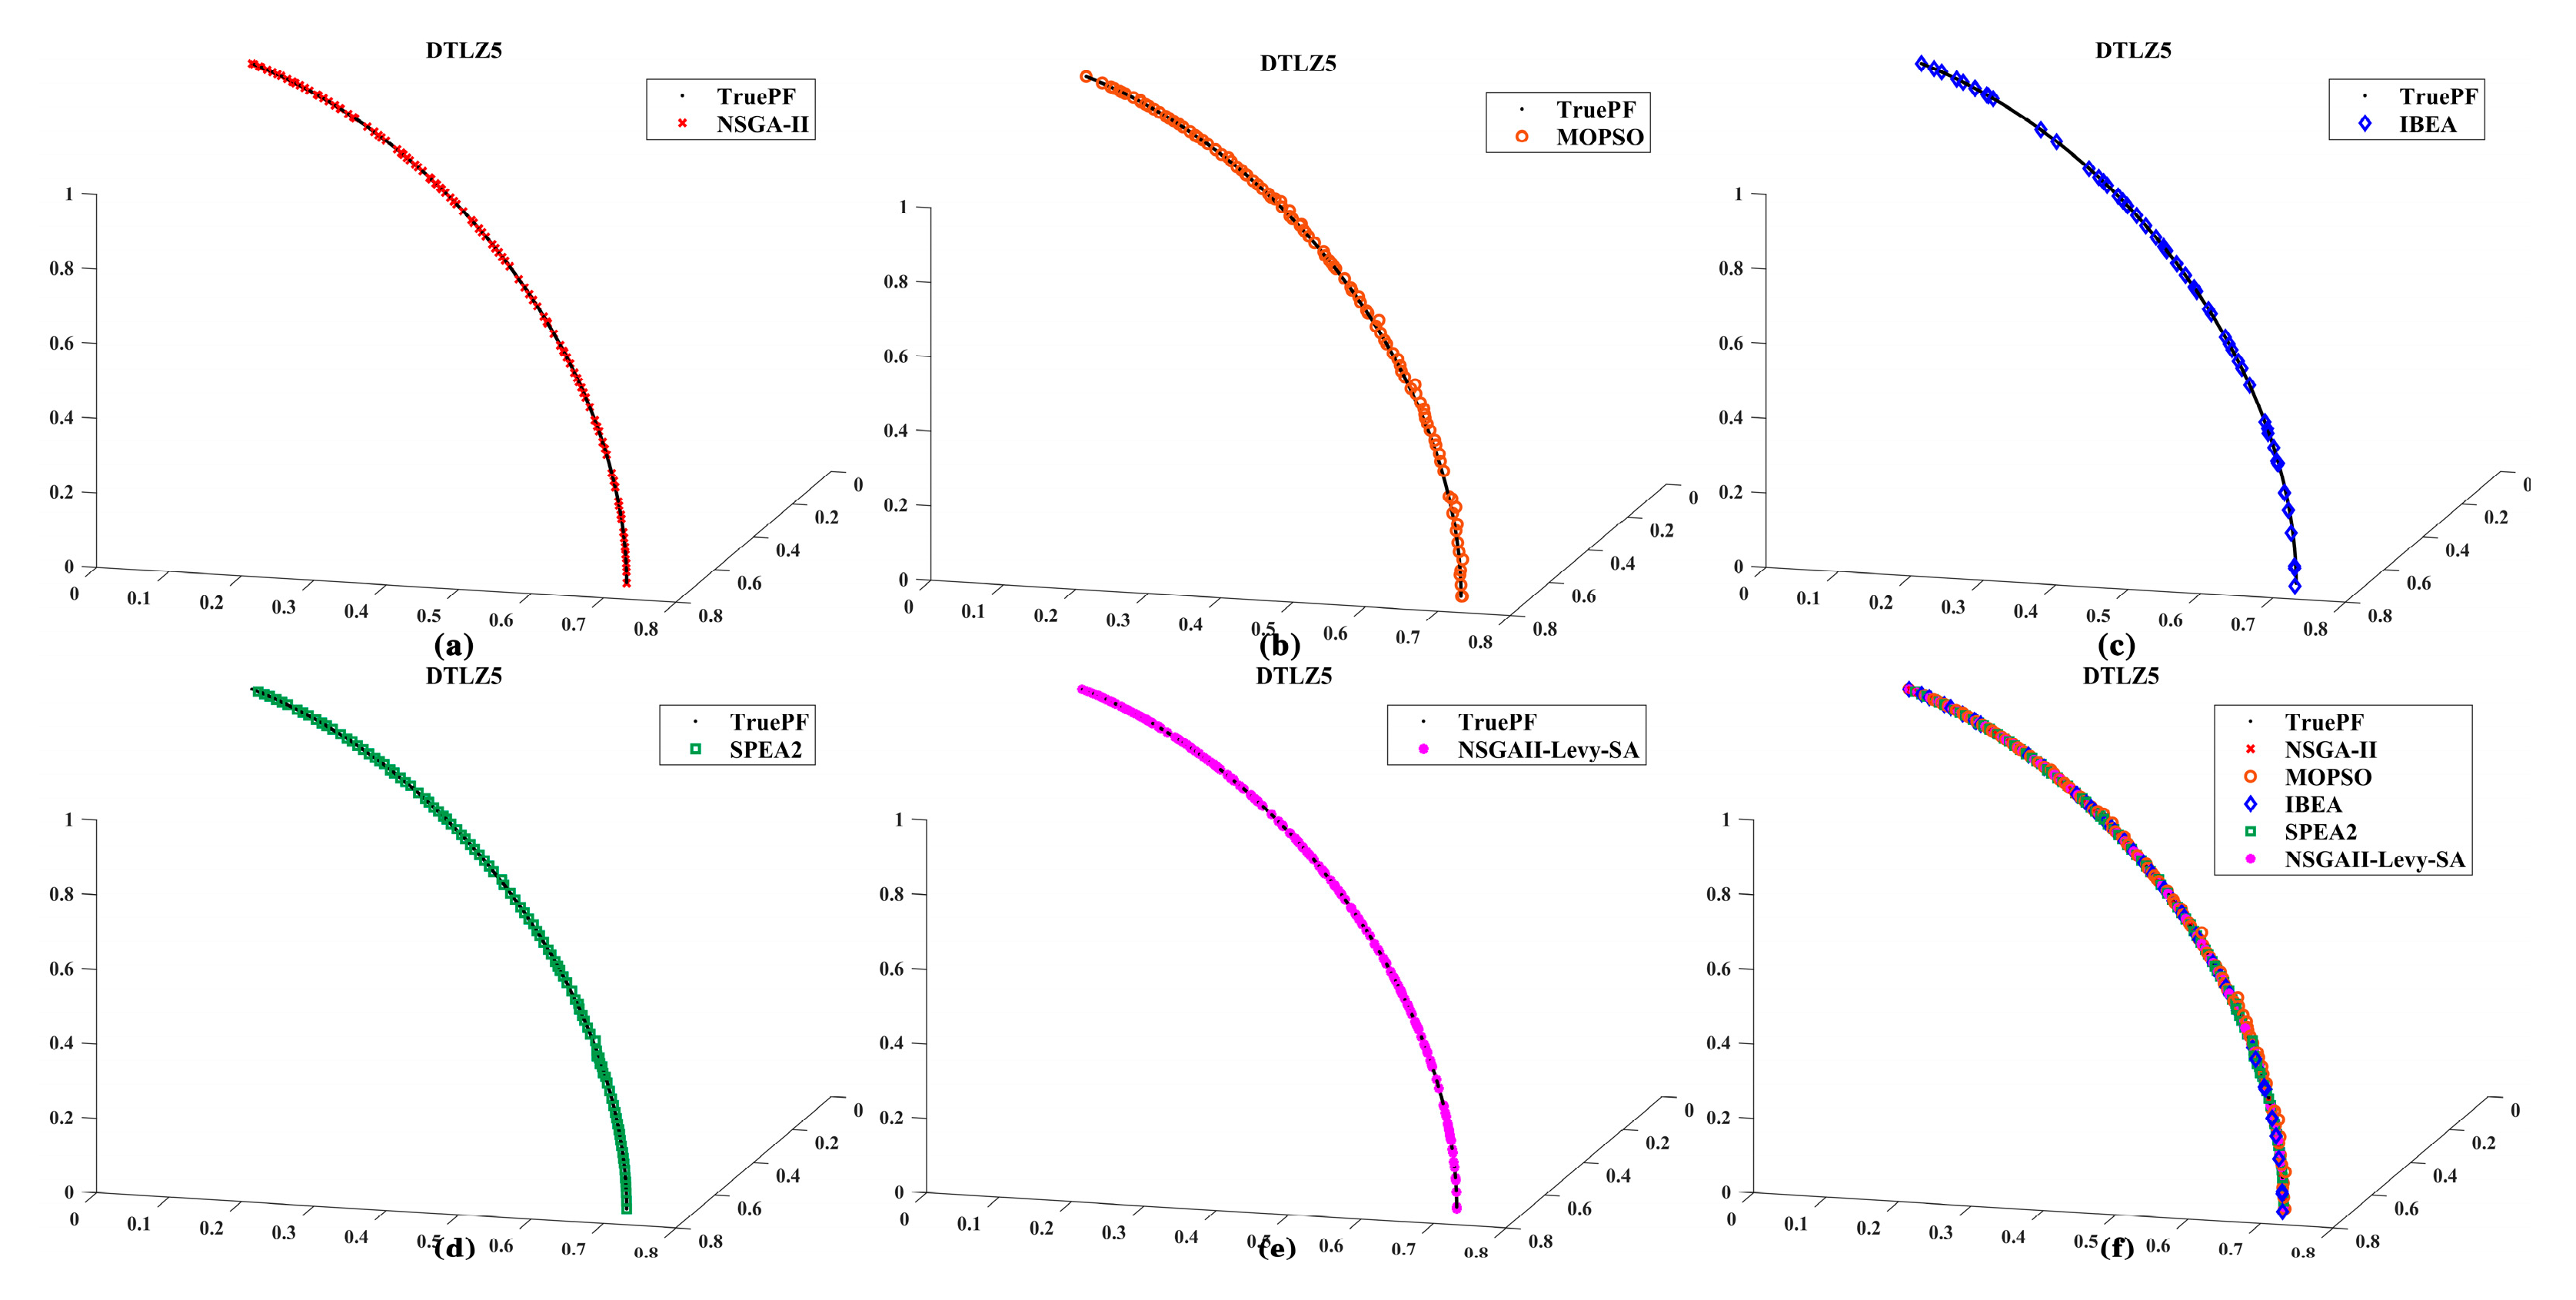
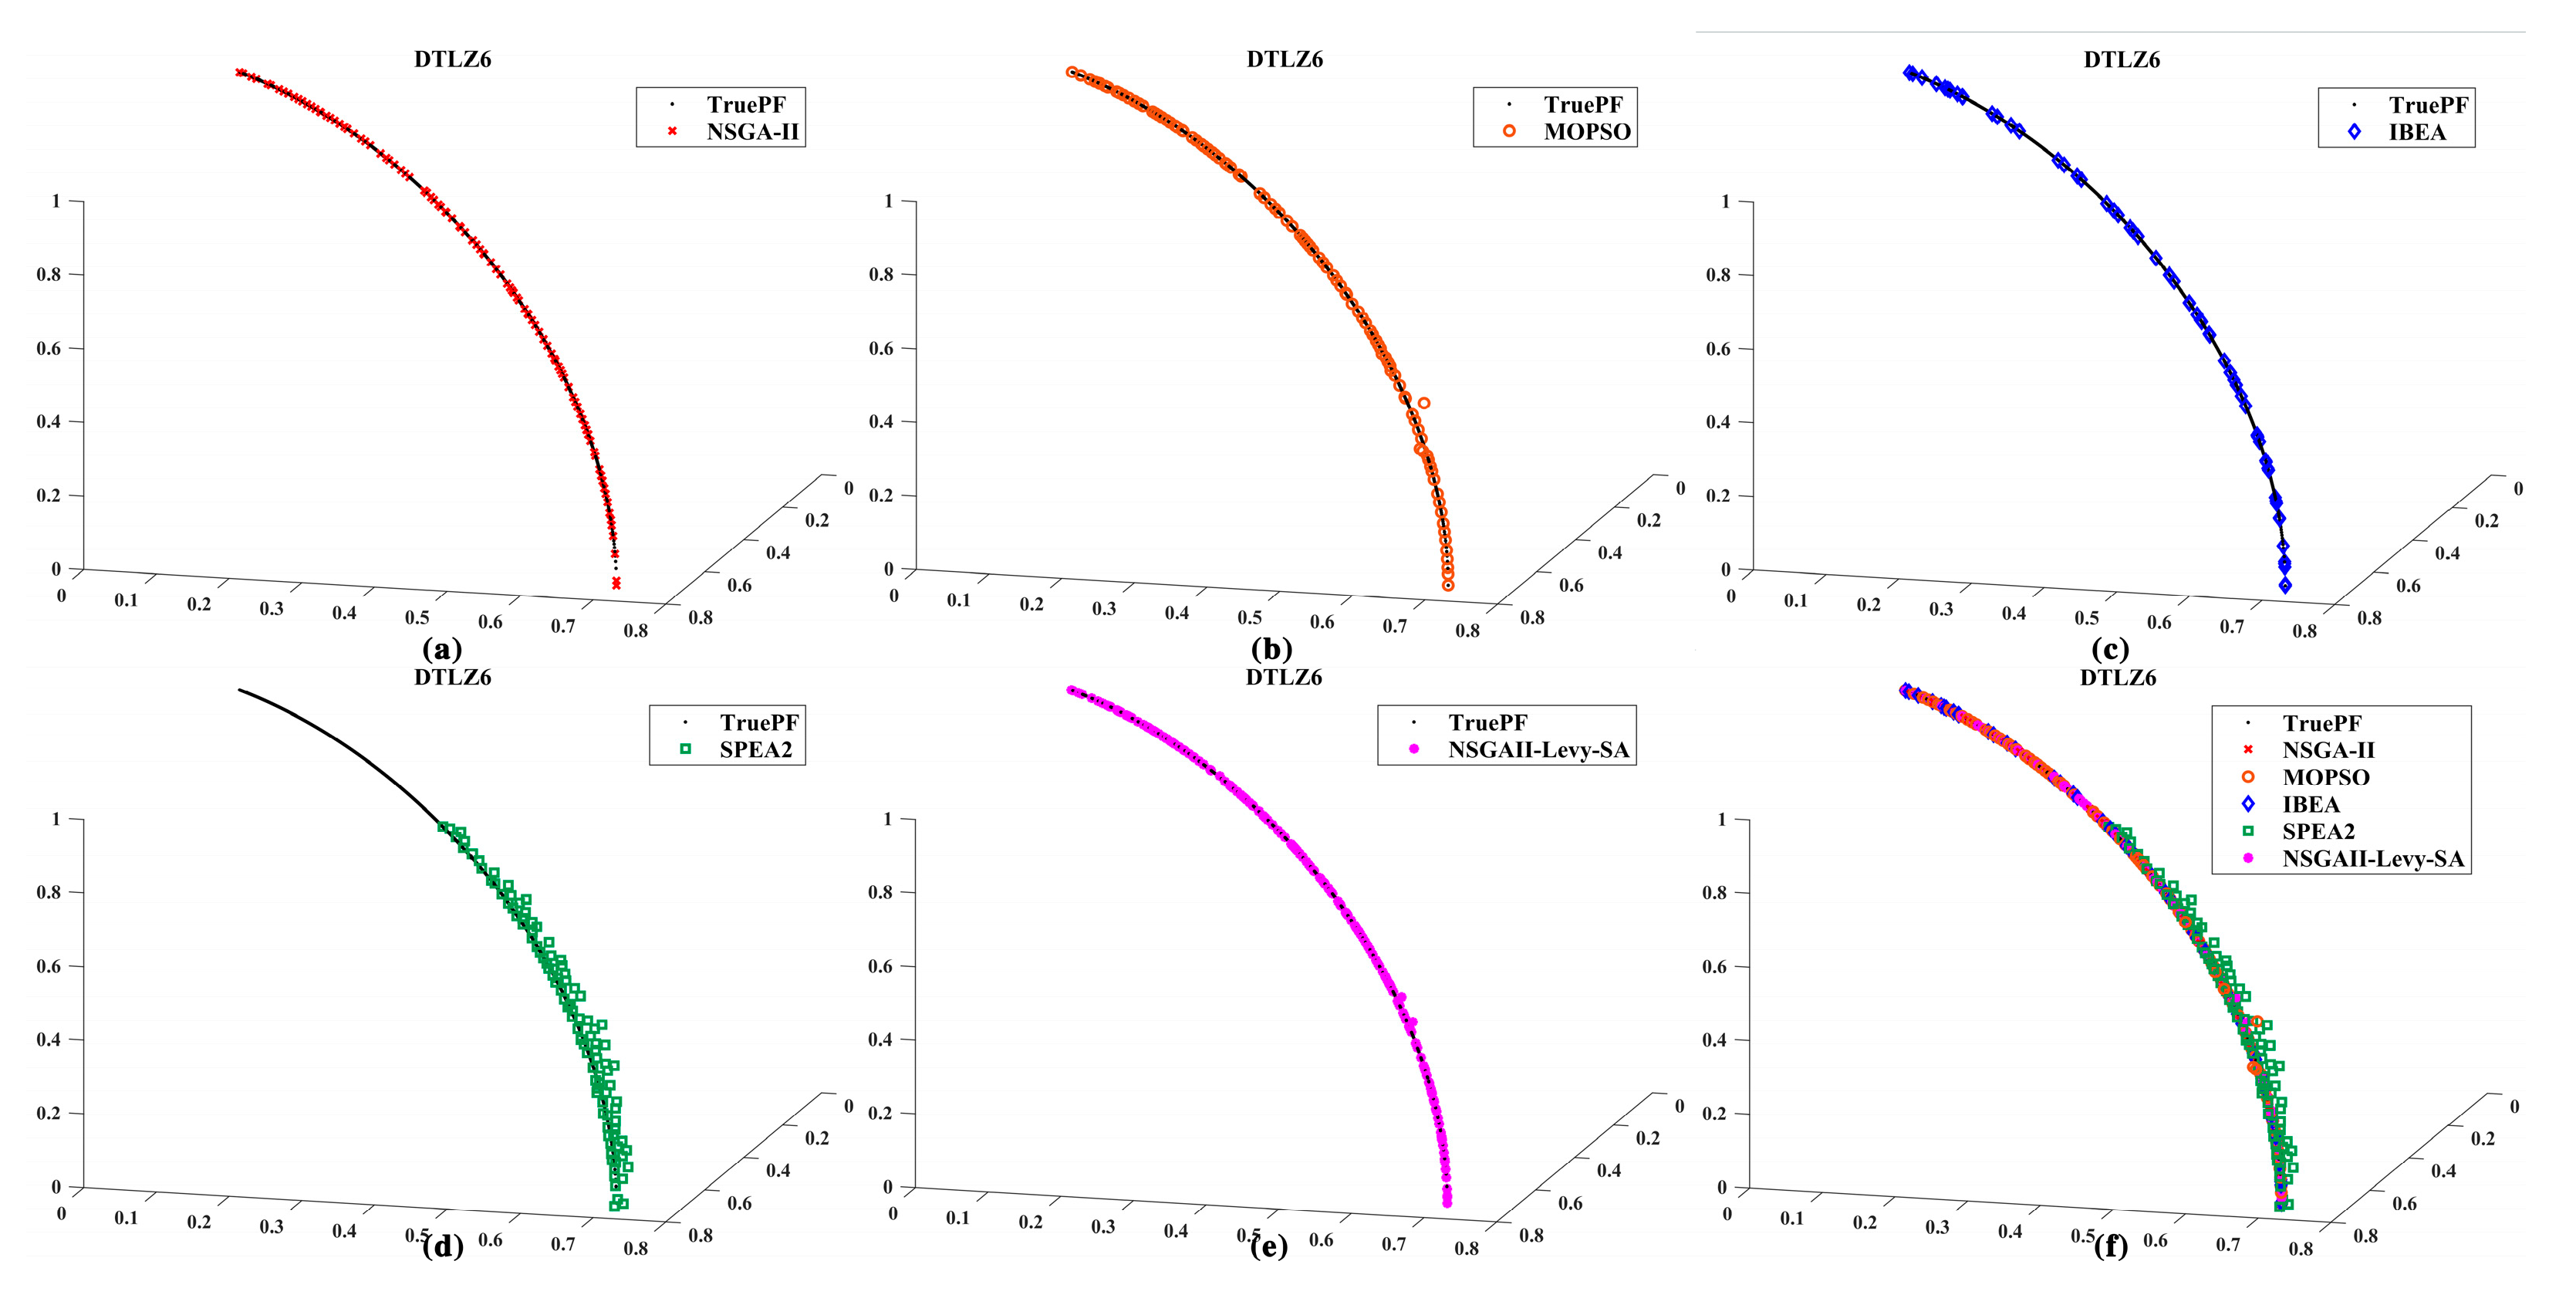
Figure 6, Figure 7, Figure 8, Figure 9, Figure 10 and Figure 11 present the Pareto frontier visualization results for test problems DTLZ1 to DTLZ6, revealing significant performance differences among various algorithms in these multi-objective optimization problems.
Figure 6 presents the results of different algorithms running the DTLZ1 test function. In comparing distribution uniformity and coverage, the IBEA algorithm exhibits sparse data distribution with poor uniformity. While the NSGA-II and MOPSO algorithms achieve broader coverage, they display local variations in density. The SPEA2 algorithm demonstrates balanced distribution across vertices, edges, and central regions, showing excellent uniformity. The NSGAII-Levy-SA algorithm demonstrates advantages in achieving full phase diagram coverage and continuous distribution: its data exhibits no significant gaps at the vertices, edges, or central regions of the ternary phase diagram, closely aligning with the phase diagram structure. Its coverage completeness and distribution continuity outperform the other algorithms.
Figure 7 displays the results of different algorithms running the DTLZ2 test function. The NSGA-II algorithm demonstrates convergence capability with some solution points closely matching the true frontier, but exhibits sparse edge regions and insufficient diversity, limiting exploration of the frontier boundaries. The MOPSO algorithm shows a narrow distribution range of solution points with overall low density, revealing inadequate convergence and global exploration capabilities. The IBEA algorithm exhibits sparse data distribution with poor convergence and diversity. The SPEA2 algorithm demonstrates relatively good convergence and diversity, though its local density uniformity is slightly inferior (with sparser central regions). The NSGAII-Levy-SA algorithm shows a balanced advantage in solution coverage, relative distribution uniformity, convergence, and diversity.
Figure 8 displays the results of different algorithms running the DTLZ3 test function. The solution set of the NSGA-II algorithm is distributed near the true Pareto frontier but exhibits local density variations. The solution set of the MOPSO algorithm closely aligns with the true Pareto frontier and shows overall uniform distribution. The solution set of the IBEA algorithm overlaps slightly less with the true Pareto frontier in certain regions and has poorer density distribution. The SPEA2 algorithm’s solution set closely aligns with the true Pareto frontier and exhibits good distribution uniformity. The NSGAII-Levy-SA algorithm’s solution set covers a broad range, demonstrates high alignment with the true Pareto frontier, and maintains relatively uniform distribution.
Figure 9 displays the results of different algorithms running the DTLZ4 test function. The NSGA-II algorithm’s solution set exhibits distribution in the boundary regions with lower density in the central area; the MOPSO algorithm’s solution set covers a broader range but shows poor local density; the IBEA algorithm’s solution set concentrates in specific regions with poor uniformity. The SPEA2 algorithm’s solution set exhibits relatively uniform distribution within the true Pareto frontier, demonstrating good convergence. The NSGAII-Levy-SA algorithm achieves a solution set with extensive coverage, high density, and good uniformity, showing excellent convergence performance.
Figure 10 displays the results of different algorithms running the DTLZ5 test function. The solution sets from the NSGA-II and NSGAII-Levy-SA algorithms exhibit a wide distribution range with good density and uniformity. The solution sets from the MOPSO and SPEA2 algorithms exhibit slight deviations from the true Pareto frontier. The IBEA algorithm’s solution set is concentrated in specific regions, with some solutions significantly deviating from the true Pareto frontier, indicating poor convergence and uniformity.
Figure 11 displays the results of different algorithms running the DTLZ5 test function. The solution set of the NSGA-II algorithm exhibits a distribution pattern characterized by sparse upper regions and dense lower regions. The solution set of the MOPSO algorithm is relatively dispersed, with some solutions significantly deviating from the true Pareto front, indicating poor uniformity. The solution set of the IBEA algorithm is concentrated in certain areas, also showing poor uniformity. The SPEA2 algorithm’s solution set is concentrated in the central region, with some solutions significantly deviating from the true Pareto frontier. The NSGAII-Levy-SA algorithm’s solution set exhibits dense and uniform distribution, closely aligning with the true Pareto frontier.
In the DTLZ test series, the NSGAII-Levy-SA algorithm consistently outperforms the comparison algorithms in convergence precision, distribution uniformity, and completeness of Pareto front coverage. Even in high-dimensional objective spaces and on complex fitness landscapes with local optima, NSGAII-Levy-SA is able to produce solution sets that are both widely spread and continuously distributed. This demonstrates the algorithm’s strong global exploration capability and stability. Thereby, it achieves significant improvements in both overall performance and robustness.

4. Application of NSGAII-Levy-SA Algorithm in Optimizing Electric Winch Trajectories for Oil Drilling Rigs

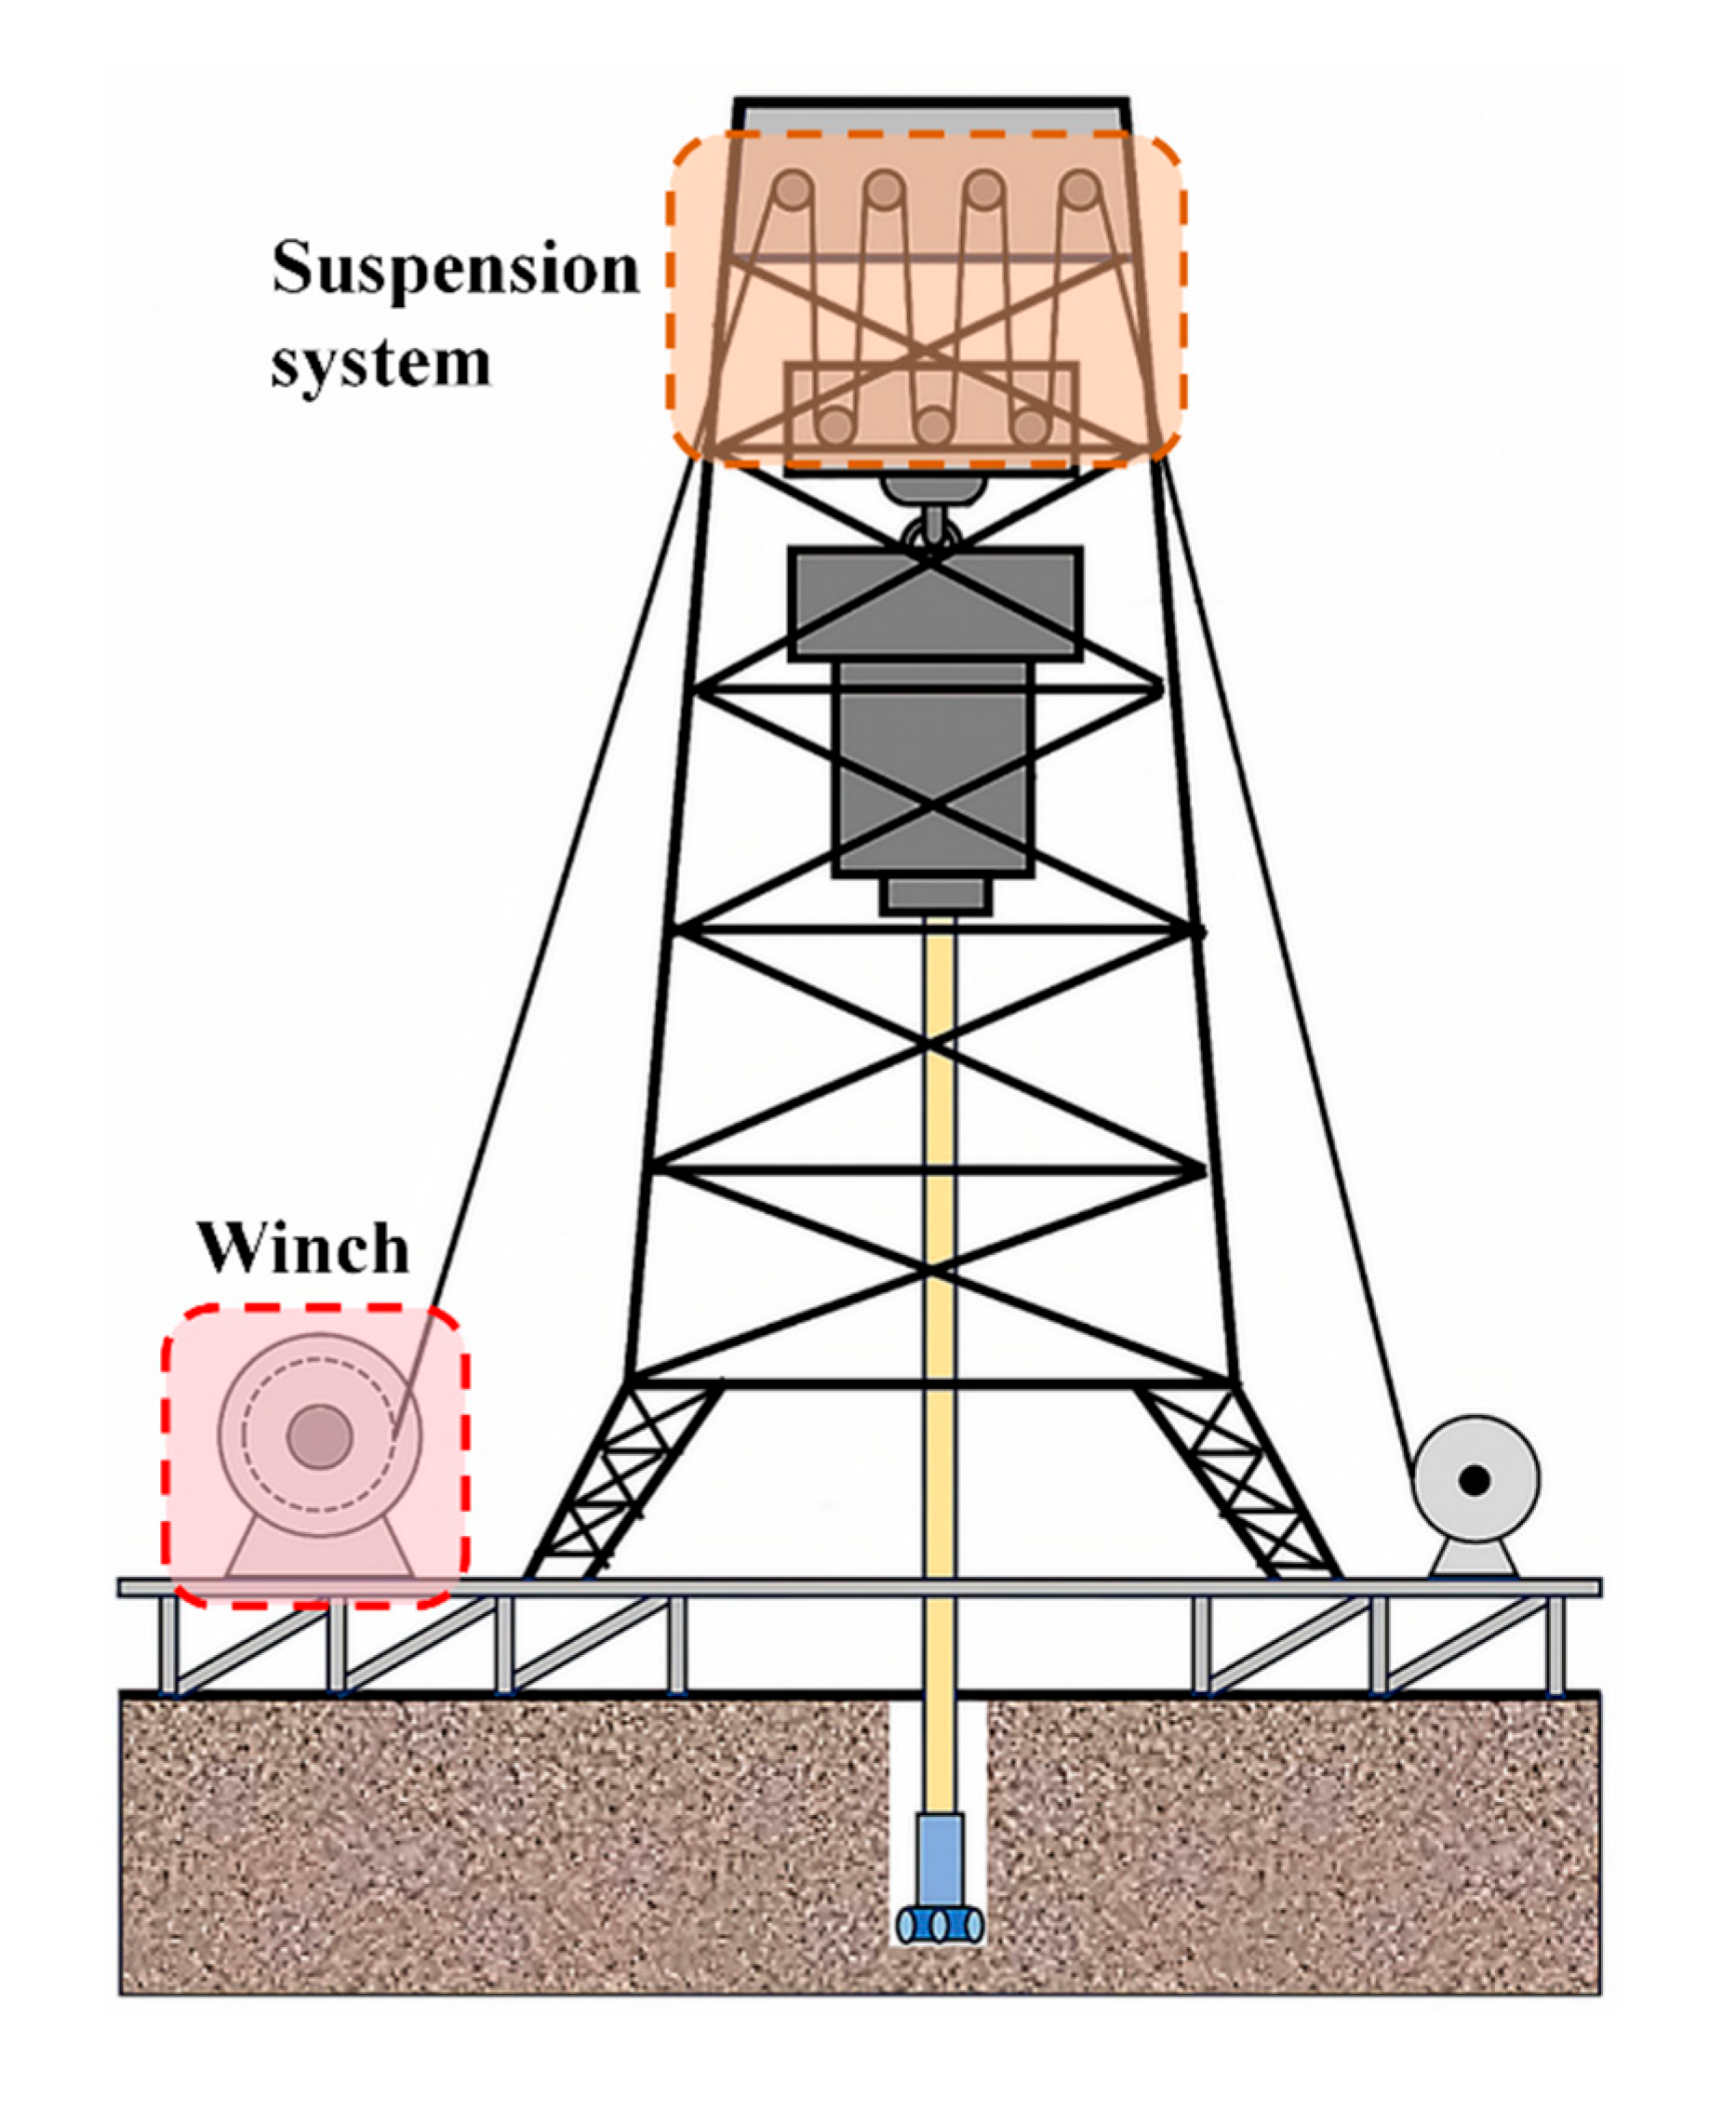
In oil drilling field operations, deviations in the rig operator’s control of electric winch hoisting/lowering speeds can easily trigger safety incidents such as “top-out” or “crashing into the drill floor” in the traveling block system. This not only directly threatens personnel safety and the structural integrity of core equipment but also causes chain reactions including drilling operation interruptions and drill string damage, highlighting the critical impact of winch speed control precision on drilling safety and continuity. Figure 12 shows a schematic diagram of the drilling system [33].
As the power core of the derrick hoist system, the electric winch of an oil drilling rig must balance operational efficiency with operational safety. It must meet the required lifting speed of drilling tools to shorten the operational cycle while ensuring a smooth lifting process to avoid system impacts caused by speed fluctuations. Therefore, scientific speed planning is a core element for safe and efficient drilling operations.
Based on field requirements, the speed and position response curves of electric winches must meet three core technical specifications:
(1)
Smoothness Requirements: Avoid residual vibrations caused by “hard impacts” and “soft impacts” during high-speed lifting. Ensure that acceleration is differentiable, and that displacement, velocity, and acceleration curves are continuously differentiable throughout the entire range. Displacement and velocity curves must be smooth without inflection points to suppress vibrations at their source.
(2)
Operational Efficiency Requirements: Optimize acceleration/deceleration time within smoothness constraints to shorten drill string hoisting cycles. Ensure rapid and precise positioning of drill string at target locations, meeting controllable operational cycle demands.
(3)
Energy Efficiency Requirements: Minimize total energy consumption of the winch drive motor while satisfying smoothness and efficiency requirements.
In constructing the motion control curve, a single-segment cubic polynomial acceleration function is applied to the acceleration/deceleration intervals during hoisting, paired with a quintic polynomial displacement curve. This design ensures that displacement, velocity, acceleration, and deceleration curves all satisfy continuous differentiability, meeting smoothness requirements. Detailed mathematical derivations are simplified here.
To enhance speed planning performance, this paper employs a quintic polynomial to refine the acceleration segment of the traditional S-shaped speed curve. Based on this refinement, a multi-objective trajectory optimization model for the winch is established, selecting time, energy consumption, and impact as the three optimization objectives. Specifically, the proposed quintic polynomial curve fits the displacement variation during motion. By adjusting polynomial coefficients, it achieves continuous and smooth transitions in displacement, velocity, acceleration, and deceleration, thereby effectively reducing system impact and improving motion smoothness.
Subsequently, a multi-objective trajectory optimization model for the winch was constructed based on this curve and solved using the NSGA-II-Levy-SA algorithm to obtain a Pareto-optimal solution set. Subsequent analysis was conducted under ideal conditions, assuming rigid connections and neglecting factors such as transmission vibration, external disturbances, and load mass variations to focus on evaluating the performance of the trajectory planning algorithm itself.

4.1. Establishing the Winch Speed Response Curve

The winch speed response curve consists of three segments: the acceleration interval [0, T1], the constant velocity interval [T1, T2], and the deceleration interval [T2, T3]. The acceleration curve a(t) for intervals [0, T1] and [T2, T3] is a cubic polynomial, while the velocity curve for interval [T1, T2] is a horizontal straight line representing the constant velocity segment.
The equations for the hoist’s displacement, velocity, acceleration, and deceleration response curves during the acceleration segment are defined by Formula (11):
J ( t ) = a 1 t 2 + a 2 a ( t ) = 1 3 a 1 t 3 + a 2 t v ( t ) = 1 12 a 1 t 4 + 1 3 a 2 t 2 + a 3 t + a 4 s ( t ) = 1 60 a 1 t 5 + 1 6 a 2 t 3 + 1 2 a 3 t 2 + a 4 t + a 5 t [ 0 , T 1 ]
Among these, a0, a1, a2, a3, a4, and a5 are the undetermined coefficients of the quintic polynomial, which can be determined from the boundary conditions.
The equations for the displacement, velocity, acceleration, and deceleration response curves of the winch during the uniform motion segment are given by Formula (12):
J ( t ) = 0 a ( t ) = 0 v ( t ) = v max s ( t ) = s ( T 1 ) + v max ( t T 1 ) t [ T 1 , T 2 ]
The displacement, velocity, acceleration, and deceleration response curve equations for the winch during the deceleration phase are given by Formula (13):
J ( t ) = b 1 ( t T 2 ) 2 + b 2 a ( t ) = 1 3 b 1 ( t T 2 ) 3 + b 2 ( t T 2 ) v ( t ) = 1 12 b 1 ( t T 2 ) 4 + 1 2 b 2 ( t T 2 ) 2 + b 3 s ( t ) = 1 60 b 1 ( t T 2 ) 5 + 1 6 b 2 ( t T 2 ) 3 + b 3 ( t T 2 ) + b 4 t [ T 2 , T 3 ]
To enhance operational efficiency, the durations of acceleration and deceleration phases must be minimized. Therefore, the maximum acceleration values during these phases should approach the hoist’s maximum achievable acceleration as closely as possible. Combining this requirement with initial velocity and acceleration conditions, the boundary conditions for Equations (11) and (13) are established as Equations (14) and (15).
J ( t 1 ) = 0 α ( 0 ) = 0 α ( T 1 ) = 0 α ( t 1 ) = a max ω ( 0 ) = 0 ω ( T 1 ) = v max θ ( 0 ) = 0
J ( t 2 ) = 0 α ( T 2 ) = 0 α ( T 3 ) = 0 α ( t 2 ) = α b max ω ( T 2 ) = ω max ω ( T 3 ) = 0
where α m a x denotes the maximum acceleration of the acceleration segment, α b m a x denotes the maximum deceleration of the acceleration segment, ω m a x denotes the maximum speed, t1 ∈ [0, T1], and t2 ∈ [T2, T3].
By simultaneously deriving Equations (11) and (14), Equation (16) can be obtained:
J ( t ) = 9 3 α max 2 T 1 3 t 2 + 3 3 α max 2 T 1 α ( t ) = 3 3 α max 2 T 1 3 t 3 + 3 3 α max 2 T 1 t ω ( t ) = 3 3 α max 8 T 1 3 t 4 + 3 3 α max 4 T 1 t 2 θ ( t ) = 3 3 α max 40 T 1 3 t 5 + 3 α max 4 T 1 t 3 t [ 0 , T 1 ]
Define local variables in the deceleration segment: when t = T2 and when t = T3, mapping the time interval [T2, T3] to [0, T], the calculation process and method for the deceleration segment are identical to those for the acceleration segment. Thus, Equation (13) can be rewritten as Equation (17):
J ( t ) = 9 3 α b max 2 ( T 3 T 2 ) 3 ( t T 2 ) 2 + 3 3 α b max 2 ( T 3 T 2 ) α ( t ) = 3 3 α b max 2 ( T 3 T 2 ) 3 ( t T 2 ) 3 + 3 3 α b max 2 ( T 3 T 2 ) ( t T 2 ) ω ( t ) = 3 3 α b max 8 ( T 3 T 2 ) 3 ( t T 2 ) 4 + 3 3 α b max 4 ( T 3 T 2 ) ( t T 2 ) 2 + ω max θ ( t ) = 3 3 α b max 40 ( T 3 T 2 ) 3 ( t T 2 ) 5 + 3 α b max 4 ( T 3 T 2 ) ( t T 2 ) 3 + ω max ( t T 2 ) + θ t [ T 2 , T 3 ]
Here, θ = ω m a x T 2 T 1 + θ ( T 1 ) .
When the control system specifies the maximum speed ω m a x and target displacement θ m , the time parameters T1, T2, and T3 can be calculated using Equations (16) and (17).
T 1 = 8 3 ω max 9 α max T 2 = θ m ω max 64 3 135 α b max ω max 7 3 α max 40 ω max T 1 2 + T 1 T 3 = 8 3 ω max 9 α b max + T 2

4.2. Optimal Trajectory Planning Based on NSGA-II-Levy-SA

The optimization problem can be formulated as in Equation (19):
min f ( x ) = f 1 ( x ) , f 2 ( x ) , f n ( x ) g i ( x ) 0 , ( i = 1 , 2 , m ) h i ( x ) = 0 , ( i = 1 , 2 , m )
In the equation, f n x represents the objective function; g i ( x ) , h i ( x ) are the constraint functions; X = ( x 1 , x 2 , x n ) τ is the n-dimensional decision variable.
The decision variables for multi-objective optimization of trajectories are the time lengths of each interpolation interval, denoted as Δ T = ( Δ T 1 , Δ T 2 , Δ T n ) τ , where Δ T = t i + 1 t i , i = 1, 2, ⋯ n, t i represents the time sequence of trajectory points. The time of the first point is t 1 , typically set to t 1 = 0 . The defined objective functions and constraints are shown in Equation (20).
f 1 = i = 1 N Δ T i f 2 = i = 1 N 1 Δ T i 0 Δ T i E i 2 d t f 3 = i = 1 N 1 Δ T i 0 Δ T i τ i 2 d t
Here, f1 represents the time-optimization objective function, where N denotes the number of interpolation intervals; f2 is the energy objective function, where E i signifies the power variable for each interval, E i = τ i · ω = I · α · ω and I represent the motor shaft rotational inertia, and α denotes acceleration; f3 is the impact objective function, where τ i indicates the torque variable for each interval, τ i = I · α and I denote the motor shaft rotational inertia, and α represents acceleration.
The constraint condition is given by Equation (21):
max ω ω max max α α max max α b α bmax
In the formula, ω and ω m a x represent the hoist’s operating speed and maximum allowable speed, respectively. α and α m a x represent the acceleration during the hoist’s acceleration phase and the maximum allowable acceleration, respectively. α b and α b m a x represent the acceleration during the hoist’s deceleration phase and the maximum allowable acceleration, respectively.
Assuming the parameters for the total displacement, velocity, acceleration during the acceleration phase, deceleration during the deceleration phase, and rotational inertia of the winch during a single drill string hoist are as shown in Table 12:
Calculations were performed based on the parameters listed in Table 12, and MATLAB (R2023b) was utilized to simulate the variations in motion parameters within the electric winch of an oil drilling rig, as shown in Figure 13.
The decision variable takes values within the range Δ T 0.05,50 , with the velocity and acceleration at the winch’s starting and ending points set to zero. The constraint condition is given by Equation (22):
max ω ω max = 85 rad / s max α α max = 50   rad / s 2 max α b α bmax = 40   rad / s 2
The NSGA-II-Levy-SA algorithm was employed for multi-objective optimization of the winch, with a maximum iteration count of 300 and a population size of 100. This process generated the Pareto front as shown in Figure 14.
The distribution pattern of the Pareto frontier reveals a clear trade-off between duration, energy consumption, and impact intensity: extending the duration simultaneously reduces both energy consumption and impact severity. Conversely, pursuing shorter durations inevitably entails higher energy consumption and more pronounced impacts. Therefore, engineering applications must make selections based on practical operational constraints. This study prioritizes energy consumption and impact mitigation. The selected parameters are shown in Table 13, and the optimized curve is depicted in Figure 15.
Simulation results demonstrate that the optimized trajectory is smooth, continuous, and free of abrupt changes. A comparative analysis of the motion curves before (Figure 13) and after (Figure 15) optimization reveals a significant enhancement in smoothness: the optimized acceleration and jerk profiles exhibit markedly reduced oscillations and more gradual transitions, effectively eliminating the sharp peaks present in the pre-optimization curves. Throughout the entire operation, both velocity and acceleration remain within the specified constraint limits. The quantitative metrics in Table 14 were computed through numerical simulation based on the objective functions defined in Equation (20), where the total operating time corresponds to the sum of all time intervals, while the total energy consumption and total impact were obtained by integrating the squared power and squared torque over the complete motion trajectory using the optimized parameters. A quantitative comparison of the total operating time, total energy consumption, and total impact force before and after optimization is presented in Table 14.
The table data indicates that compared to the baseline before optimization, the total operating time of the winch decreased by 6%, energy consumption dropped by 17.99%, and overall impact was reduced by 27.4%. Consequently, the multi-objective optimized trajectory enhances efficiency while ensuring stable operation, significantly lowering both energy consumption and impact.
The optimized performance in time, energy consumption, and impact holds clear value for industrial applications. The reduction in cycle time directly enhances tripping operation efficiency and equipment throughput. The decrease in energy consumption translates to significant operational cost savings and a reduced environmental footprint. The effective suppression of mechanical impact is crucial for extending the service life of key components such as wire ropes and gear transmission systems, thereby reducing maintenance frequency and the risk of downtime. Collectively, these improvements demonstrate that the proposed optimized trajectory not only enhances the economy and safety of a single operation but also contributes to the efficient, reliable, and long-term stable operation of the drilling rig at a systemic level.

4.3. Discussion on Practical Robustness

It is important to acknowledge that the present study and its promising results were obtained under idealized simulation conditions, which assumed rigid connections and neglected practical disturbances such as load mass variations, transmission vibrations, and external perturbations. This focus allowed for a clear evaluation of the trajectory planning algorithm’s core performance. In real-world industrial applications, these factors could influence the system’s dynamic response. However, the smooth and continuously differentiable nature of the quintic polynomial-based trajectories generated by the proposed method provides inherent robustness to a degree. By minimizing high-frequency components and avoiding abrupt changes in acceleration, the planned motion is less likely to excite detrimental vibrations even under parameter variations. Furthermore, this optimized trajectory serves as a high-quality reference input for downstream closed-loop controllers (e.g., PID or MPC), which are responsible for disturbance rejection. The superior smoothness of the reference facilitates more stable and precise tracking control, thereby enhancing the overall system’s resilience to disturbances. Investigating the algorithm’s performance under a wider range of operational uncertainties and conducting hardware-in-the-loop tests constitute key directions for our future work.

5. Comprehensive Discussion

5.1. Analysis of Principal Findings and Identified Challenges

The experimental results from both benchmark functions and engineering applications reveal and clarify two core issues in existing multi-objective optimization algorithms. First, there is the inherent limitation of traditional algorithms like NSGA-II in balancing global exploration and local exploitation. For instance, on the multimodal test function ZDT4, which contains numerous local Pareto fronts, algorithms such as NSGA-II and MOPSO easily become trapped, resulting in higher IGD values (0.0051 and 0.0054, respectively). In contrast, our algorithm achieves a lower IGD (0.0048), demonstrating its capability to effectively escape local optima. Second, there is the challenge of achieving synergistic optimization among strongly conflicting objectives in practical engineering problems. In the winch optimization case, pursuing minimal time naturally leads to increased energy consumption and impact, as shown by the clear trade-offs on the Pareto front (Figure 14). Prior to optimization, the baseline trajectory failed to balance these three objectives effectively.

5.2. Theoretical Implications and Practical Contributions

The superior performance of NSGAII-Levy-SA carries profound implications for both algorithmic design and engineering practice. In terms of algorithmic design, it validates the immense potential of strategically hybridizing metaheuristics with complementary properties. The 17.99% reduction in energy consumption and 27.4% reduction in impact in the winch application are not accidental. They are directly attributable to the intrinsic mechanisms of the introduced operators: the Lévy flight mechanism, with its heavy-tailed jumps, is particularly effective at exploring diverse, low-impact trajectories, while the simulated annealing mechanism, with its conditional acceptance, excels at refining solutions toward energy-efficient smoothness. For engineering practice, this study demonstrates that complex operational objectives—efficiency, economy, and safety—are not irreconcilable contradictions. By providing a well-distributed Pareto front, the algorithm transforms subjective empirical decisions into a scientific, data-driven multi-criteria decision-making process, enabling the selection of the optimal trajectory based on specific operational priorities.

5.3. Underlying Optimization Mechanism and Generalizable Pattern

This research uncovers a fundamental pattern for enhancing complex optimization algorithms: the “Dynamically Balanced Synergy” between exploration and exploitation. The adaptive parameter control strategy is the key to realizing this pattern. It is not a simple linear combination of operators, but a law-governed, dynamic coordination process. Experimental observations confirm this pattern: in the early stages of evolution (e.g., on ZDT1), a larger step scaling factor α(t) allows Lévy flight to play a dominant role in broad exploration, rapidly locating promising regions. In the later stages (e.g., critical for final convergence precision in DTLZ5/6), the strategy reduces α(t) while activating simulated annealing and adjusting the Lévy exponent, shifting focus to intensive local exploitation. This pattern of “early exploration, late exploitation, dynamically transitioned” ensures that the algorithm’s search capabilities are allocated optimally throughout the evolutionary process. This explains its consistent robustness and high performance across problems with vastly different landscape characteristics, from multimodal ZDT4 to degenerate DTLZ5/6.

6. Conclusions

The proposed hybrid NSGA-II algorithm, integrating Lévy flight and simulated annealing, enhances the performance of traditional multi-objective evolutionary algorithms by organically combining three complementary strategies. Lévy flight provides robust global exploration capabilities, and simulated annealing ensures efficient local convergence accuracy, while adaptive parameter control skillfully coordinates these two behaviors. This hybrid framework enables the algorithm to generate more uniformly distributed and better converged sets of Pareto-optimal solutions when tackling multi-objective optimization problems with complex characteristics. Comparative evaluations against NSGA-II, MOPSO, IBEA, and SPEA2 on two- and three-objective benchmark functions demonstrate that NSGAII-Levy-SA exhibits superior performance in convergence speed, solution diversity, and distribution uniformity. In engineering applications, this algorithm reduced the motion trajectory optimization results for oil drilling electric winches by 6% (time), 17.99% (energy), and 27.4% (impact), validating its practical effectiveness.
The current limitations of this paper and future research directions include:
  • The algorithm’s effectiveness has only been validated for optimizing electric winch trajectories in oil drilling rigs and has not yet been tested in other engineering domains.
  • Benchmark evaluations are limited to ≤3 objectives, leaving the scalability for high-dimensional problems unvalidated. These constraints highlight key research directions for developing multi-objective optimization algorithms.
  • Algorithmic performance remains somewhat sensitive to parameter tuning. Despite the introduction of adaptive strategies, hyperparameters such as the step size scaling factor in Lévy walk and the initial temperature in simulated annealing still require adjustment for specific problems, thereby compromising their “out-of-the-box” convenience.
  • The algorithm exhibits relatively high computational complexity, and the computational overhead introduced by mixed strategies may render it unsuitable for online optimization scenarios with stringent real-time requirements.
  • Integration with Surrogate Models: For computationally expensive simulations, a promising direction is to hybridize NSGAII-Levy-SA with surrogate models (e.g., Gaussian processes, neural networks). The key research problem is how to intelligently manage the interaction between the global search of Lévy flight and the uncertainty prediction of the surrogate to maximize convergence speed without sacrificing solution quality.
Author Contributions

E.Q.: Conceptualization, Writing—original draft. Y.L.: Writing—review and editing, Funding acquisition, Project administration. H.G.: Data curation, Visualization. H.Y.: Visualization, Data curation. G.X.: Writing—review and editing, Project administration. All authors have read and agreed to the published version of the manuscript.

Funding

This work is supported by the National Natural Science Foundation of China Basic Science Centre (42188102), the National Key Research and Development Program of China (2023YFC2810100), the National Natural Science Foundation of China (52471331).

Data Availability Statement

Data available on request due to restrictions. The data presented in this study are available on request from the corresponding author due to laboratory management requirements.

Conflicts of Interest

The authors declare no conflicts of interest.

References

  1. Kelley, C.T. Detection and Remediation of Stagnation in the Nelder--Mead Algorithm Using a Sufficient Decrease Condition. SIAM J. Optim. 1999, 10, 43–55. [Google Scholar] [CrossRef]
  2. Vogl, T.P.; Mangis, J.K.; Rigler, A.K.; Zink, W.T.; Alkon, D.L. Accelerating the Convergence of the Back-Propagation Method. Biol. Cybern. 1988, 59, 257–263. [Google Scholar] [CrossRef]
  3. Hare, W.; Nutini, J.; Tesfamariam, S. A Survey of Non-Gradient Optimization Methods in Structural Engineering. Adv. Eng. Softw. 2013, 59, 19–28. [Google Scholar] [CrossRef]
  4. Coello, C.A.C.; Brambila, S.G.; Gamboa, J.F.; Tapia, M.G.C. Multi-Objective Evolutionary Algorithms: Past, Present, and Future; Springer: Cham, Switzerland, 2021. [Google Scholar] [CrossRef]
  5. Zhong, K.; Zhou, G.; Deng, W.; Zhou, Y.; Luo, Q. MOMPA: Multi-Objective Marine Predator Algorithm. Comput. Methods Appl. Mech. Eng. 2021, 385, 114029. [Google Scholar] [CrossRef]
  6. Wu, G.; Pedrycz, W.; Suganthan, P.N.; Mallipeddi, R. A Variable Reduction Strategy for Evolutionary Algorithms Handling Equality Constraints. Appl. Soft Comput. 2015, 37, 774–786. [Google Scholar] [CrossRef]
  7. Wu, G. Across Neighborhood Search for Numerical Optimization. Inf. Sci. 2016, 329, 597–618. [Google Scholar] [CrossRef]
  8. Tang, A.-D.; Han, T.; Zhou, H.; Xie, L. An Improved Equilibrium Optimizer with Application in Unmanned Aerial Vehicle Path Planning. Sensors 2021, 21, 1814. [Google Scholar] [CrossRef]
  9. Holland, J.H. Genetic Algorithms. Sci. Am. 1992, 267, 66–72. [Google Scholar] [CrossRef]
  10. Kirkpatrick, S.; Gelatt, C.D.; Vecchi, M.P. Optimization by Simulated Annealing. Science 1983, 220, 671–680. [Google Scholar] [CrossRef]
  11. Kennedy, J.; Eberhart, R. Particle Swarm Optimization. In Proceedings of the ICNN’95—International Conference on Neural Networks, Perth, Australia, 27 November–1 December 1995; Volume 4, pp. 1942–1948. [Google Scholar] [CrossRef]
  12. Mirjalili, S.; Mirjalili, S.M.; Lewis, A. Grey Wolf Optimizer. Adv. Eng. Softw. 2014, 69, 46–61. [Google Scholar] [CrossRef]
  13. Mirjalili, S.; Lewis, A. The Whale Optimization Algorithm. Adv. Eng. Softw. 2016, 95, 51–67. [Google Scholar] [CrossRef]
  14. Bidar, M.; Kanan, H.R.; Mouhoub, M.; Sadaoui, S. Mushroom Reproduction Optimization (MRO): A Novel Nature-Inspired Evolutionary Algorithm. In Proceedings of the 2018 IEEE Congress on Evolutionary Computation (CEC), Rio de Janeiro, Brazil, 8–13 July 2018; pp. 1–10. [Google Scholar] [CrossRef]
  15. Venkatarao, K. The Use of Teaching-Learning Based Optimization Technique for Optimizing Weld Bead Geometry as Well as Power Consumption in Additive Manufacturing. J. Clean. Prod. 2021, 279, 123891. [Google Scholar] [CrossRef]
  16. Chen, W.; Chen, X.; Peng, J.; Panahi, M.; Lee, S. Landslide Susceptibility Modeling Based on ANFIS with Teaching-Learning-Based Optimization and Satin Bowerbird Optimizer. Geosci. Front. 2021, 12, 93–107. [Google Scholar] [CrossRef]
  17. Pham, V.H.S.; Nguyen Dang, N.T. Portia Spider Algorithm: An Evolutionary Computation Approach for Engineering Application. Artif. Intell. Rev. 2024, 57, 24. [Google Scholar] [CrossRef]
  18. Vikhar, P.A. Evolutionary Algorithms: A Critical Review and Its Future Prospects. In Proceedings of the 2016 International Conference on Global Trends in Signal Processing, Information Computing and Communication (ICGTSPICC), Jalgaon, India, 22–24 December 2016; pp. 261–265. [Google Scholar] [CrossRef]
  19. Nedjah, N.; Mourelle, L.d.M. Evolutionary Multi–Objective Optimisation: A Survey. Int. J. Bio-Inspired Comput. 2015, 7, 1–25. [Google Scholar] [CrossRef]
  20. Deb, K.; Pratap, A.; Agarwal, S.; Meyarivan, T. A Fast and Elitist Multiobjective Genetic Algorithm: NSGA-II. IEEE Trans. Evol. Comput. 2002, 6, 182–197. [Google Scholar] [CrossRef]
  21. Tian, Y.; Cheng, R.; Zhang, X.; Su, Y.; Jin, Y. A Strengthened Dominance Relation Considering Convergence and Diversity for Evolutionary Many-Objective Optimization. IEEE Trans. Evol. Comput. 2019, 23, 331–345. [Google Scholar] [CrossRef]
  22. Coello, C.A.C. Multi-Objective Evolutionary Algorithms in Real-World Applications: Some Recent Results and Current Challenges; Springer: Cham, Switzerland, 2014. [Google Scholar] [CrossRef]
  23. Ma, H.; Zhang, Y.; Sun, S.; Liu, T.; Shan, Y. A Comprehensive Survey on NSGA-II for Multi-Objective Optimization and Applications. Artif. Intell. Rev. 2023, 56, 15217–15270. [Google Scholar] [CrossRef]
  24. Lu, H.; Niu, R.; Liu, J.; Zhu, Z. A Chaotic Non-Dominated Sorting Genetic Algorithm for the Multi-Objective Automatic Test Task Scheduling Problem. Appl. Soft Comput. 2013, 13, 2790–2802. [Google Scholar] [CrossRef]
  25. Pires, D.F.; Antunes, C.H.; Martins, A.G. NSGA-II with Local Search for a Multi-Objective Reactive Power Compensation Problem. Int. J. Electr. Power Energy Syst. 2012, 43, 313–324. [Google Scholar] [CrossRef]
  26. Mirjalili, S.; Saremi, S.; Mirjalili, S.M.; Coelho, L.d.S. Multi-Objective Grey Wolf Optimizer: A Novel Algorithm for Multi-Criterion Optimization. Expert Syst. Appl. 2016, 47, 106–119. [Google Scholar] [CrossRef]
  27. Gao, X.; Chen, B.; He, X.; Qiu, T.; Li, J.; Wang, C.; Zhang, L. Multi-Objective Optimization for the Periodic Operation of the Naphtha Pyrolysis Process Using a New Parallel Hybrid Algorithm Combining NSGA-II with SQP. Comput. Chem. Eng. 2008, 32, 2801–2811. [Google Scholar] [CrossRef]
  28. Coello Coello, C.A.; Lechuga, M.S. MOPSO: A Proposal for Multiple Objective Particle Swarm Optimization. In Proceedings of the 2002 Congress on Evolutionary Computation. CEC’02 (Cat. No.02TH8600), Honolulu, HI, USA, 12 –17 May 2002; Volume 2, pp. 1051–1056. [Google Scholar] [CrossRef]
  29. Zitzler, E.; Künzli, S. Indicator-Based Selection in Multiobjective Search; Springer: Berlin/Heidelberg, Germany, 2004. [Google Scholar] [CrossRef]
  30. Zitzler, E.; Laumanns, M.; Thiele, L. SPEA2: Improving the Strength Pareto Evolutionary Algorithm; ETH Zurich: Zürich, Switzerland, 2001; 21p. [Google Scholar] [CrossRef]
  31. Sierra, M.R.; Coello Coello, C.A. Improving PSO-Based Multi-Objective Optimization Using Crowding, Mutation and ∈-Dominance; Springer: Berlin/Heidelberg, Germany, 2005. [Google Scholar] [CrossRef]
  32. Cai, X.; Xiao, Y.; Li, M.; Hu, H.; Ishibuchi, H.; Li, X. A Grid-Based Inverted Generational Distance for Multi/Many-Objective Optimization. IEEE Trans. Evol. Comput. 2021, 25, 21–34. [Google Scholar] [CrossRef]
  33. Peng, X.; Yue, B.; Li, G.; Qiu, Z.; Yang, H. Modeling and Multi-Objective Optimization of a Drill-String System in the Tripping Operation. Nonlinear Dyn. 2024, 112, 21849–21866. [Google Scholar] [CrossRef]
Figure 1. Workflow Diagram of the NSGAII-Levy-SA Algorithm.
Machines 13 01017 g001
Figure 2. ZDT1 Pareto Front: (a) NSGA-II Pareto Front; (b) MOPSO Pareto Front; (c) IBEA Pareto Front; (d) SPEA2 Pareto Front; (e) NSGAII-Levy-SA Pareto Front; (f) Pareto Front of All Algorithms.
Machines 13 01017 g002
Figure 3. ZDT2 Pareto Fronts: (a) NSGA-II Pareto Front; (b) MOPSO Pareto Front; (c) IBEA Pareto Front; (d) SPEA2 Pareto Front; (e) NSGAII-Levy-SA Pareto Front; (f) Pareto Fronts of All Algorithms.
Machines 13 01017 g003
Figure 4. ZDT3 Pareto Fronts: (a) NSGA--II Pareto Front; (b) MOPSO Pareto Front; (c) IBEA Pareto Front; (d) SPEA2 Pareto Front; (e) NSGAII--Levy--SA Pareto Front; (f) Pareto Fronts of All Algorithms.
Machines 13 01017 g004
Figure 5. ZDT4 Pareto Front: (a) NSGA-II Pareto Front; (b) MOPSO Pareto Front; (c) IBEA Pareto Front; (d) SPEA2 Pareto Front; (e) NSGAII-Levy-SA Pareto Front; (f) Pareto Front of All Algorithms.
Machines 13 01017 g005
Figure 6. DTLZ1 Pareto Front: (a) NSGA-II Pareto Front; (b) MOPSO Pareto Front; (c) IBEA Pareto Front; (d) SPEA2 Pareto Front; (e) NSGAII-Levy-SA Pareto Front; (f) Pareto Front of All Algorithms.
Machines 13 01017 g006
Figure 7. DTLZ2 Pareto Front: (a) NSGA-II Pareto Front; (b) MOPSO Pareto Front; (c) IBEA Pareto Front; (d) SPEA2 Pareto Front; (e) NSGAII-Levy-SA Pareto Front; (f) Pareto Front of All Algorithms.
Machines 13 01017 g007
Figure 8. DTLZ3 Pareto Front: (a) NSGA-II Pareto Front; (b) MOPSO Pareto Front; (c) IBEA Pareto Front; (d) SPEA2 Pareto Front; (e) NSGAII-Levy-SA Pareto Front; (f) Pareto Front of All Algorithms.
Machines 13 01017 g008
Figure 9. DTLZ4 Pareto Front: (a) NSGA-II Pareto Front; (b) MOPSO Pareto Front; (c) IBEA Pareto Front; (d) SPEA2 Pareto Front; (e) NSGAII-Levy-SA Pareto Front; (f) Pareto Front of All Algorithms.
Machines 13 01017 g009
Figure 10. DLZ5 Pareto Fronts: (a) NSGA-II Pareto Front; (b) MOPSO Pareto Front; (c) IBEA Pareto Front; (d) SPEA2 Pareto Front; (e) NSGAII-Levy-SA Pareto Front; (f) Pareto Fronts of All Algorithms.
Machines 13 01017 g010
Figure 11. DTLZ6 Pareto Front: (a) NSGA-II Pareto Front; (b) MOPSO Pareto Front; (c) IBEA Pareto Front; (d) SPEA2 Pareto Front; (e) NSGAII-Levy-SA Pareto Front; (f) Pareto Front of All Algorithms.
Machines 13 01017 g011
Figure 12. Schematic Diagram of the Drilling System.
Machines 13 01017 g012
Figure 13. Images of angular displacement, angular velocity, angular acceleration, and angular jerk before optimization.
Machines 13 01017 g013
Figure 14. True Pareto Frontier of Time-Energy Consumption-Impact.
Machines 13 01017 g014
Figure 15. Images of angular displacement, angular velocity, angular acceleration, and angular jerk after optimization.
Machines 13 01017 g015
Table 1. Algorithm Parameter Settings.
AlgorithmNSGA-IIMOPSOIBEASPEA2NSGAII-Levy-SA
ParametersMaxiter = 300
Npop = 100
Nr = 100
Pc = 1
Pm = 0.33
Maxiter = 300
Npop = 100
Nr = 100
Ngrid = 30
maxvel’ = 5
w = 0.4
c1 = 2
c2 = 2
Pc = 0.5
Maxiter = 300
Npop = 100
Nr = 100
Pc = 0.9
Pm = 0.1
m = 5
Maxiter = 300
Npop = 100
Nr = 100
Pc = 0.7
Pm = 0.3
Maxiter = 300
Npop = 100
Nr = 100
Pc = 1
Pm = 0.3
beta_levy = 1.5
step_scale = 0.1
sa_T0 = 1.0
sa_cooling = 0.95
sa_iter = 10
Table 2. ZDT Series Test Function Features and Characteristics.
Test FunctionMathematical FormulaFunctional Features
ZDT1 f 1 ( x ) = x 1 f 2 ( x ) = g ( x ) [ 1 f 1 ( x ) / g ( x ) ] w h e r e g ( x ) = 1 + 9 ( i = 2 n x i ) / ( n 1 ) 0 x i 1 , i = 1 , 2 , L n Convex, Continuous
ZDT2 f 1 ( x ) = x 1 f 2 ( x ) = g ( x ) [ 1 ( f 1 ( x ) / g ( x ) ) 2 ] w h e r e g ( x ) = 1 + 9 ( i = 2 n x i ) / ( n 1 ) 0 x i 1 , i = 1 , 2 , L n Concave, continuous
ZDT3 f 1 ( x ) = x 1 f 2 ( x ) = g ( x ) [ 1 ( f 1 ( x ) / g ( x ) ) ( f 1 ( x ) / g ( x ) ) sin ( 10 π x 1 ) ] w h e r e g ( x ) = 1 + 9 ( i = 2 n x i ) / ( n 1 ) 0 x i 1 , i = 1 , 2 , L n Concave, discontinuous
ZDT4 f 1 ( x ) = x 1 f 2 ( x ) = g ( x ) [ 1 f 1 ( x ) / g ( x ) ] w h e r e g ( x ) = 1 + 10 ( n 1 ) + i = 2 n x i 2 10 cos ( 4 π x i ) 0 x 1 1 , 5 x i 5 , i = 2 , L n Convex, continuous
Table 3. IGD Results for NSGAII-Levy-SA on the ZDT Test Set.
Test FunctionComparison Algorithm
NSGA-IIMOPSOIBEASPEA2NSGAII-Levy-SA
ZDT10.00580.00960.01300.00440.0051
ZDT20.00590.01150.01450.00470.0052
ZDT30.00620.01060.01830.00590.0059
ZDT40.00510.00540.01920.00570.0048
Table 4. Analysis of HV Results for NSGAII-Levy-SA on the ZDT Test Set.
Test FunctionComparison Algorithm
NSGA-IIMOPSOIBEASPEA2NSGAII-Levy-SA
ZDT10.65700.71120.85660.87120.9018
ZDT20.54420.43480.74590.54390.6893
ZDT30.76800.59690.88610.89610.7704
ZDT40.65930.71590.81200.86730.8704
Table 5. Variance of Evaluation Metrics for NSGA-II-Levy-SA on the ZDT Test Set.
ZDT1ZDT2ZDT3ZDT4
IGD 1.58 × 10 8 1.94 × 10 8 7.41 × 10 8 1.70 × 10 8
HV 1.66 × 10 7 2.86 × 10 5 6.40 × 10 5 7.53 × 10 5
Table 6. Standard Deviation of Evaluation Metrics for NSGAII-Levy-SA on the ZDT Test Set.
ZDT1ZDT2ZDT3ZDT4
IGD 1.19 × 10 4 1.32 × 10 4 2.58 × 10 4 1.24 × 10 4
HV 3.87 × 10 4 5.07 × 10 3 7.59 × 10 3 8.23 × 10 3
Table 7. Features and Capabilities of the DTLZ Test.
Test FunctionMathematical Formula
DTLZ1 min f 1 ( x ) = 1 2 x 1 x 2 x M 1 ( 1 + g ( x M ) ) min f 2 ( x ) = 1 2 x 1 x 2 ( 1 x M 1 ) ( 1 + g ( x M ) ) min f M 1 ( x ) = 1 2 x 1 ( 1 x 2 ) ( 1 + g ( x M ) ) min f M ( x ) = 1 2 x 1 ( 1 x 1 ) ( 1 + g ( x M ) ) g ( x M ) = 100 ( x M + x i x M ( x i 0.5 ) 2 cos ( 20 π ( x i 0.5 ) ) )
DTLZ2 min f 1 ( x ) = ( 1 + g ( x M ) ) cos ( x 1 π / 2 ) cos ( x M 2 π / 2 ) cos ( x M 1 π / 2 ) min f 2 ( x ) = ( 1 + g ( x M ) ) cos ( x 1 π / 2 ) cos ( x M 2 π / 2 ) sin ( x M 1 π / 2 ) min f M 1 ( x ) = ( 1 + g ( x M ) ) cos ( x 1 π / 2 ) sin ( x 2 π / 2 ) min f M ( x ) = ( 1 + g ( x M ) ) sin ( x 1 π / 2 ) g ( x M ) = x i x M ( x i 0.5 ) 2
DTLZ3 min f 1 ( x ) = ( 1 + g ( x M ) ) cos ( x 1 π / 2 ) cos ( x M 2 π / 2 ) cos ( x M 1 π / 2 ) min f 2 ( x ) = ( 1 + g ( x M ) ) cos ( x 1 π / 2 ) cos ( x M 2 π / 2 ) sin ( x M 1 π / 2 ) min f M 1 ( x ) = ( 1 + g ( x M ) ) cos ( x 1 π / 2 ) sin ( x 2 π / 2 ) min f M ( x ) = ( 1 + g ( x M ) ) sin ( x 1 π / 2 ) g ( x M ) = 100 ( x M + x i x M ( x i 0.5 ) 2 cos ( 20 π ( x i 0.5 ) ) )
DTLZ4 min f 1 ( x ) = ( 1 + g ( x M ) ) cos ( x 1 α π / 2 ) cos ( x M 2 α π / 2 ) cos ( x M 1 α π / 2 ) min f 2 ( x ) = ( 1 + g ( x M ) ) cos ( x 1 α π / 2 ) cos ( x M 2 α π / 2 ) sin ( x M 1 α π / 2 ) min f M 1 ( x ) = ( 1 + g ( x M ) ) cos ( x 1 α π / 2 ) sin ( x 2 α π / 2 ) min f M ( x ) = ( 1 + g ( x M ) ) sin ( x 1 α π / 2 ) g ( x M ) = x i x M ( x i 0.5 ) 2
DTLZ5 min f 1 ( x ) = ( 1 + g ( x M ) ) cos ( θ 1 π / 2 ) cos ( θ M 2 π / 2 ) cos ( θ M 1 π / 2 ) min f 2 ( x ) = ( 1 + g ( x M ) ) cos ( θ 1 π / 2 ) cos ( θ M 2 π / 2 ) sin ( θ M 1 π / 2 ) min f M 1 ( x ) = ( 1 + g ( x M ) ) cos ( θ 1 π / 2 ) sin ( θ 2 π / 2 ) min f M ( x ) = ( 1 + g ( x M ) ) sin ( θ 1 π / 2 ) g ( x M ) = 100 ( x M + x i x M x i 0.1 θ i = π 4 ( 1 + g ( x M ) ) ( 1 + 2 g ( x M ) x i )
DTLZ6 min f 1 ( x ) = x 1 min f M 1 ( x M 1 ) = x M 1 min f M ( x ) = ( 1 + g ( x M ) ) h ( f 1 , f 2 , f M 1 , g ) g ( x M ) = 1 + 9 x M x i x M x i
Table 8. IGD Results for NSGAII-Levy-SA on the DTLZ Test Set.
Test FunctionComparison Algorithm
NSGA-IIMOPSOIBEASPEA2NSGAII-Levy-SA
DTLZ10.0307 0.0284 0.0634 0.02970.0205
DTLZ20.3536 0.0691 0.1264 0.0529 0.0605
DTLZ30.3540 0.0696 0.1197 0.0531 0.0533
DTLZ40.3529 0.0701 0.1122 0.0540 0.0494
DTLZ50.4367 0.0068 0.0133 0.0043 0.0039
DTLZ60.4379 0.0067 0.0229 0.0993 0.0045
Table 9. Analysis of HV Results for NSGAII-Levy-SA on the DTLZ Test Set.
Test FunctionComparison Algorithm
NSGA-IIMOPSOIBEASPEA2NSGAII-Levy-SA
DTLZ10.87030.80230.75580.84490.9739
DTLZ20.44970.51910.69420.73730.8657
DTLZ30.50170.52090.79980.73810.9260
DTLZ40.62660.52810.65750.73630.9072
DTLZ50.80940.49800.78960.60260.9196
DTLZ60.75770.49570.80490.41880.9250
Table 10. Variance of Evaluation Metrics for NSGA-II-Levy-SA on the DTLZ Test Set.
DTLZ1DTLZ2DTLZ3DTLZ4DTLZ5DTLZ6
IGD 1.04 × 10 5 6.32 × 10 6 1.13 × 10 5 1.21 × 10 5 1.00 × 10 7 1.04 × 10 6
HV 5.56 × 10 7 3.49 × 10 5 9.43 × 10 5 1.82 × 10 5 4.92 × 10 5 2.28 × 10 7
Table 11. Standard Deviation of Evaluation Metrics for NSGAII-Levy-SA on the DTLZ Test Set.
DTLZ1DTLZ2DTLZ3DTLZ4DTLZ5DTLZ6
IGD 3.05 × 10 3 2.38 × 10 3 3.20 × 10 3 3.30 × 10 3 3.01 × 10 4 9.69 × 10 4
HV 7.07 × 10 4 5.60 × 10 3 9.21 × 10 3 4.04 × 10 3 6.65 × 10 3 4.53 × 10 4
Table 12. Relevant Motion Parameters Before Optimization.
Parameter InformationNumerical Value
Total angular displacement3381.35 rad
Angular velocity75 rad/s
Angular acceleration during acceleration phase30 rad/s2
Angular acceleration during deceleration phase20 rad/s2
Table 13. Optimized Kinematic Parameters.
Parameter InformationNumerical Value
Total angular displacement3381.35 rad
Angular velocity84.97 rad/s
Angular acceleration during acceleration phase17.71 rad/s2
Angular acceleration during deceleration phase19.66 rad/s2
Table 14. Quantitative Comparison of Time, Total Energy Consumption, and Total Impact Before and After Optimization.
Total Time (s)Total Energy (W)Total Impact (kN · m)
Before optimization49.83 4.8754 × 10 5 11,537
NSGA-II46.89 4.1043 × 10 5 8577
MOPSO48.82 4.3216 × 10 5 9835.1
IBEA47.11 4.0601 × 10 5 8471.5
SPEA246.89 4.0523 × 10 5 8495.9
NSGAII-Levy-SA46.98 3.9981 × 10 5 8375.8
Disclaimer/Publisher’s Note: The statements, opinions and data contained in all publications are solely those of the individual author(s) and contributor(s) and not of MDPI and/or the editor(s). MDPI and/or the editor(s) disclaim responsibility for any injury to people or property resulting from any ideas, methods, instructions or products referred to in the content.