Article

Phase-Aware Complex-Spectrogram Autoencoder for Vibration Preprocessing: Fault-Component Separation via Input-Phasor Orthogonality Regularization

1
Department of Ocean System Engineering, College of Marine Science, Gyeongsang National University, 11-dong, 2, Tongyeonghaean-ro, Tongyeong-si 53064, Gyeongsangnam-do, Republic of Korea
2
Department of Naval Architecture and Ocean Engineering, College of Marine Science, Gyeongsang National University, 11-dong, 2, Tongyeonghaean-ro, Tongyeong-si 53064, Gyeongsangnam-do, Republic of Korea
*
Author to whom correspondence should be addressed.
Machines 2025, 13(10), 945; https://doi.org/10.3390/machines13100945
Submission received: 8 September 2025 / Revised: 6 October 2025 / Accepted: 9 October 2025 / Published: 13 October 2025
(This article belongs to the Section Machines Testing and Maintenance)

Abstract

We propose a phase-aware complex-spectrogram autoencoder (AE) for preprocessing raw vibration signals of rotating electrical machines. The AE reconstructs normal components and separates fault components as residuals, guided by an input-phasor phase-orthogonality regularization that defines parallel/orthogonal residuals with respect to the local signal phase. We use a U-Net-based AE with a mask-bias head to refine local magnitude and phase. Decisions are based on residual features—magnitude/shape, frequency distribution, and projections onto the normal manifold. Using the AI Hub open dataset from field ventilation motors, we evaluate eight representative motor cases (2.2–5.5 kW: misalignment, unbalance, bearing fault, belt looseness). The preprocessing yielded clear residual patterns (low-frequency floor rise, resonance-band peaks, harmonic-neighbor spikes), and achieved an area under the receiver operating characteristic curve (ROC-AUC) = 0.998–1.000 across eight cases, with strong leave-one-file-out generalization and good calibration (expected calibration error (ECE) ≤ 0.023). The results indicate that learning to remove normal structure while enforcing phase consistency provides an unsupervised front-end that enhances fault evidence while preserving interpretability on field data.

1. Introduction

1.1. Research Background

Vibration monitoring of rotating electrical machines such as industrial motors and generators is crucial for early fault detection and predictive maintenance [1,2]. Even minute incipient faults—e.g., bearing defects or rotor unbalance-can escalate into severe failures if they are not identified in time. Accordingly, by analyzing vibration signals, maintenance engineers seek to detect such faults at an early stage and prevent unplanned downtime or catastrophic accidents [1]. To this end, a variety of signal-processing techniques have been investigated to effectively extract and enhance fault-related signatures from raw vibration signals.

1.2. Related Work

Early studies concentrated on preprocessing to attenuate background noise and stationary components while emphasizing fault features. A representative approach is envelope analysis, in which the bearing-resonance band is isolated using a band-pass filter and faults are identified by peaks at characteristic defect frequencies in the envelope spectrum [3]. Spectral kurtosis (SK) quantifies impulsiveness as a function of frequency to automate band selection, whereas Antoni’s kurtogram provides a visual means of locating the optimal band (where kurtosis is maximized) and separating transient fault components [4,5]. Cepstrum pre-whitening (CPW) removes prominent cepstral peaks to whiten the spectrum and thereby reveal weak modulation components [6]. Kiakojouri et al. combined CPW with a high-pass filter to suppress low-frequency content, emphasize weak impulses, and surpass the kurtogram under low signal-to-noise ratio (SNR) conditions [7]. Wavelet transforms have been widely used to separate and denoise transients via multiresolution analysis and to classify faults using wavelet-packet or discrete wavelet transform (DWT) features [8]. For nonlinear and nonstationary signals, empirical mode decomposition (EMD) and ensemble EMD (EEMD) decompose signals into intrinsic mode functions (IMFs); information-entropy criteria have been proposed to select effective IMFs, and grey system theory has been used to preserve salient features [9,10].
However, these classical preprocessing schemes share common limitations. Strong stationary components often mask weak fault signatures. Consequently, CPW, notch filters, and related methods may remove fault information together with the interference, or conversely, insufficient suppression may leave residuals that obscure discriminative characteristics [7,11]. Moreover, performance is sensitive to numerous hyperparameters-filter bands, thresholds, mother wavelets, decomposition levels, etc.-which increases dependence on expert tuning. Early kurtogram formulations have also been reported to be sensitive to outliers [4,8,10]. EMD suffers from mode mixing and result instability, while EEMD improves stability at the cost of computational overhead and additional decisions for IMF selection [9,10]. Procedures tailored to specific fault scenarios or operating conditions often generalize poorly to other fault modes or variable regimes, and they can be fragile when confronting incipient defects [2,11,12].
To address these limitations, data-driven approaches have gained traction [2]. Early attempts used simple artificial neural networks (ANNs) to classify fault severity [13]. More recently, deep learning has achieved high accuracy by transforming vibration into time-frequency images for convolutional neural networks (CNNs), or by modeling temporal dependencies with 1D-CNNs and long short-term memory (LSTM) networks [14]. Nevertheless, in industrial settings, the scarcity and imbalance of fault labels, the infeasibility of intentionally collecting fault data, and domain shift between training and field conditions often cause severe performance degradation [11,12]. This has motivated unsupervised/semi-supervised anomaly detection, particularly autoencoder (AE) methods. Trained solely on normal data, an AE reconstructs normal patterns well. Reconstruction error, therefore, serves as an anomaly indicator, and frequency analysis of the residual can localize defect components [15]. Variants such as the variational autoencoder (VAE) and LSTM-VAE have shown promise in detecting early bearing faults with subtle spectral changes and in enabling dynamic, input-adaptive decisions instead of fixed thresholds [16].
Within the AI Hub open dataset (Predictive Maintenance Sensors for Mechanical Facilities) used in this study, Sung et al. reported that advanced preprocessing combined with logistic regression (LR), k-nearest neighbors (KNN), support vector machine (SVM), random forest (RF), or light gradient boosting machine (LGBM) drove F1-scores to ≈0.999–1.000, whereas models on raw signals achieved only 52.8–96.7% accuracy [17]. Seo et al. built an LSTM-VAE anomaly detector over vibration/current and obtained > 97% accuracy across two scenarios [18]. An et al. encoded current time series as Gramian angular summation/difference fields (GASF/GADF), Markov transition fields (MTF), and recurrence plots (RP) for a compact CNN, reporting near-ceiling results (bearing F1 = 0.999/Acc = 0.998; rotor F1 = 0.996; belt F1 = 0.990; shaft-misalignment F1 = 0.948) [19]. Lee et al. benchmarked 13 deep time-series classifiers on vibration data and found CNN variants approaching 100% across standard metrics in their setting [20]. Complementing these supervised pipelines, Sim et al. used current-spectrum features with a multivariate kernel density estimation (MKDE) outlier detector to reach 98.93% accuracy on 5974 test samples, illustrating the practicality of nonparametric unsupervised detection [21].
To date, however, most vibration-based deep-learning studies for rotating electrical machines rely on spectral magnitude (amplitude) or time-domain amplitude alone, discarding phase information [4]. Yet phase can carry critical diagnostic cues: misalignment or eccentricity may yield amplitude spectra resembling healthy operation but induce characteristic phase differences between signals measured at different locations. Practitioners routinely exploit two-channel phase relations—e.g., ≈0° between bearing housings for rotor unbalance versus ≈ 180° across a coupling for misalignment—signals that vanish when only envelope or amplitude is used [1,8]. Consistent with this, An et al.’s magnitude-only image encoding achieved strong scores overall but a comparatively lower F1 for the phase-sensitive defect of shaft misalignment (0.948) [19]. Reflecting a broader shift, recent studies have begun to incorporate phase explicitly—for example, by emulating complex convolution via separate real/imaginary kernels [22] or by encoding time–frequency representations as quaternion color images so that different channels capture amplitude, phase, and related attributes [23]. In audio signal processing, feeding complex spectrograms to deep models is already known to markedly improve restoration and separation [16,24].
Motivated by these observations, we adopt a phase-aware complex-spectrogram formulation to learn normal operating behavior and to separate fault-related components into physically interpretable residuals. We validate the approach by benchmarking it against classic feature-based preprocessing pipelines and by situating the results relative to recent learning-based studies; key findings are consolidated in the Results and Discussion.

1.3. Research Objectives

This study proposes a method that feeds a phase-aware complex spectrogram to a deep learning model and reconstructs the learned normal behavior to effectively separate fault-related components. While applying an AE to vibration is not new, we introduce a preprocessing scheme that employs a complex-spectrogram AE to learn and remove normal components from rotating-machinery vibration and to extract only the fault components. First, we explicitly incorporate phase information by representing vibration signals as complex spectrograms. Second, we augment AE training with a constraint that enforces physically meaningful phase relationships.
Rather than relying on the default Cartesian decomposition into the real and imaginary axes, we promote physical consistency via a decomposition parallel and orthogonal to the input phasor’s phase reference. This guides the AE to produce outputs that are not only amplitude-consistent but also physically coherent in terms of phase relationships. The proposed method can enhance weak fault features more effectively than conventional techniques under low SNR and at incipient stages, and it can be applied without fault-data training or expert parameter tuning. Considering the pervasive use of electric motors across industries and the importance of their condition monitoring, we select motors as a representative application. Through case studies on motor vibration data, we aim to demonstrate that the proposed approach effectively distinguishes healthy and faulty states and delivers strong diagnostic performance.

2. Materials and Methods

2.1. Data Sources and Experimental Setup

This study used the AI Hub open dataset (Predictive Maintenance Sensors for Mechanical Facilities). The dataset comprises raw time-series accelerometer and current signals sampled at 4 kHz, together with metadata (root-mean-square (RMS), revolutions per minute (RPM), and rated power), collected from 41 heating, ventilation, and air conditioning (HVAC) motors installed at three Daejeon Metro stations (Daejeon, City Hall, and Gapcheon). Continuous signals are stored as comma-separated values (CSV) in ~3 s chunks, and condition labels are standardized as normal, shaft misalignment, rotor unbalance, bearing fault, and belt looseness. The procedures for data acquisition, cleaning, and quality control are documented. Importantly, training and validation sets are provided as separate partitions drawn from the same equipment and environment, enabling a reproducible training-evaluation configuration.
To reflect the diversity of motor ratings (2.2–5.5 kW) and fault types, eight representative cases were selected, as summarized in Table 1.
Each case includes the same motor in a healthy state and in one induced-fault state. Faults were introduced by removing lubricant (bearing fault), adding imbalance weights (rotor unbalance), loosening the belt and shifting the motor, or applying a shaft-alignment offset. Considering that lower-rated equipment tends to have a lower signal-to-noise ratio (SNR), we began the analysis with the lower ratings, and the case combination was arranged so that each fault type appears at least twice.
Each validation subset consists of multiple files, and the total number of samples reaches several hundred thousand. The number of files, samples, generated patches, and the validation throughput are summarized in Table 2. Each case comprises raw time-series data for a different motor under a normal condition and a single induced fault condition.

2.2. Signal Aggregation and Segmentation

CSV fragments were chronologically ordered by file and timestamp to reconstruct a single continuous raw time series. We then performed zero-mean normalization by subtracting the mean (removing the direct-current (DC) offset) and segmented the signal using a 2048-sample window with 50% overlap, given the 4000 Hz sampling frequency (Nyquist 2000 Hz). To mitigate boundary discontinuities and to support invertible reconstruction via the inverse short-time Fourier transform (iSTFT), a square-root Hann ( H a n n ) window was used.
Each segment was transformed using the short-time Fourier transform (STFT) under the same parameters to form complex spectrogram patches of 16 consecutive frames with 50% patch overlap. All subsequent methods operate on this same input. The overall aggregation and re-partitioning pipeline is illustrated in Figure 1.

2.3. Phase-Aware Complex Spectrogram Autoencoder

We design an AE that operates directly on the complex STFT of the vibration signal. The AE is trained to reconstruct normal components and to separate fault-components as residuals, while a phase-orthogonality regularizer encourages physical consistency with the input phasor at each time-frequency bin.

2.3.1. Problem Statement and Notation

The raw vibration signal x t is modeled as the sum of a normal deterministic part s t , background noise n t , and a fault-component f t :
x t = s t + n t + f t .
Letting the normal term be u t = s t + n t , we obtain
x t = u t + f t ,
for time-frequency analysis we use the STFT,
X τ , ω = x t w t τ e j ω t d t , X = S + N + F ,
where w t is the analysis window, τ the frame center time, j = 1 is the imaginary unit, and ω the angular frequency. The discrete STFT with frame length N and hop size H is
X m , k = n = 0 N 1 x n + m H w n e j 2 π k n / N ,
where n 0 ,   1 ,   2 ,   N 1 is the sample index within a frame, m is the frame index, and k 0 ,   1 ,   2 ,   N 1 is the frequency bin index.
The AE takes the two-channel input [ R X ,   I ( X ) ] and outputs the reconstruction X ^ . The residual
R = X X ^
is used to isolate fault-related content. When needed, the time-domain residual is obtained via the inverse STFT (iSTFT):
r t = i S T F T R .
These definitions establish the reconstruction-residual framework on which subsequent regularization and loss terms are built.

2.3.2. Phase-Orthogonality Regularization

Orthogonality is defined not with respect to the fixed real/imaginary axes of the STFT, but with respect to the local input phasor at each bin. Let ϕ = X . Define R ~ m , k = R [ m , k ]   e j ϕ . Then
R = R R ~ , R = I R ~ .
To encourage reconstructions that are physically consistent with the input phase on normal segments, we penalize the orthogonal component via
L = E m , k N I R ~ m , k ,
where N is the set of normal training regions, and the expectation is the mean over a spectrogram patch. This definition avoids assuming universal orthogonality of the STFT real/imag axes (which in practice depends on window, hop, and local phasor geometry) and instead enforces orthogonality directly relative to the input phase. We set λ = 0.5 for this term.

2.3.3. Training Objective

The total loss is
L = W f X X ^ 1 L r e c + λ L + λ s L s p + λ c L c w t ,
where denotes the Hadamard (element-wise) product. The frequency weight W f is derived from the standard deviation σ f of the STFT magnitude over the normal training set:
W f = 1 σ f + ε ,   1 F f W f = 1 ,
with F the number of frequency bins used for normalization and ε = 1 × 10 8 for numerical stability. The sparsity term on the residual is
L s p = R 1 , λ s = 1 × 10 3 .
To preserve broadband shape, we add a continuous-wavelet-transform (CWT) auxiliary loss,
L c w t = S c a l o g r a m x ^ S c a l o g r a m x 1 ,   x ^ = i S T F T { X ^ } .
The CWT uses a complex Morlet kernel (central parameter w 0 = 6 ) with 24 logarithmically spaced center frequencies over f [5, 0.45 × 4000] Hz, kernel length 1024, and reflect padding. The kernel is
ψ t , f = e t 2 2 σ 2 · c o s 2 π f t + j s i n 2 π f t , σ = w 0 2 π f .
We set λ c = 0 for the first three epochs and then linearly ramped it to 0.05 by convergence. Because the parallel and orthogonal components are defined with respect to the input phase at each time–frequency bin rather than the STFT’s fixed Cartesian axes, this regularization is more robust to the choice of window and hop parameters and to local phasor variations.

2.4. Model Architecture and Implementation

As described in Section 2.2, the two input channels are R X , I X . All signals were transformed to the spectral domain via the STFT and then partitioned into STFT patches before being fed to the model. For example, in one file from Case 1, we obtained about 224,541 time-domain frames and, from these, extracted roughly 28,066 STFT patches of length 16 frames using an overlap (stride 8). The detailed hyperparameters are listed in Table 3.

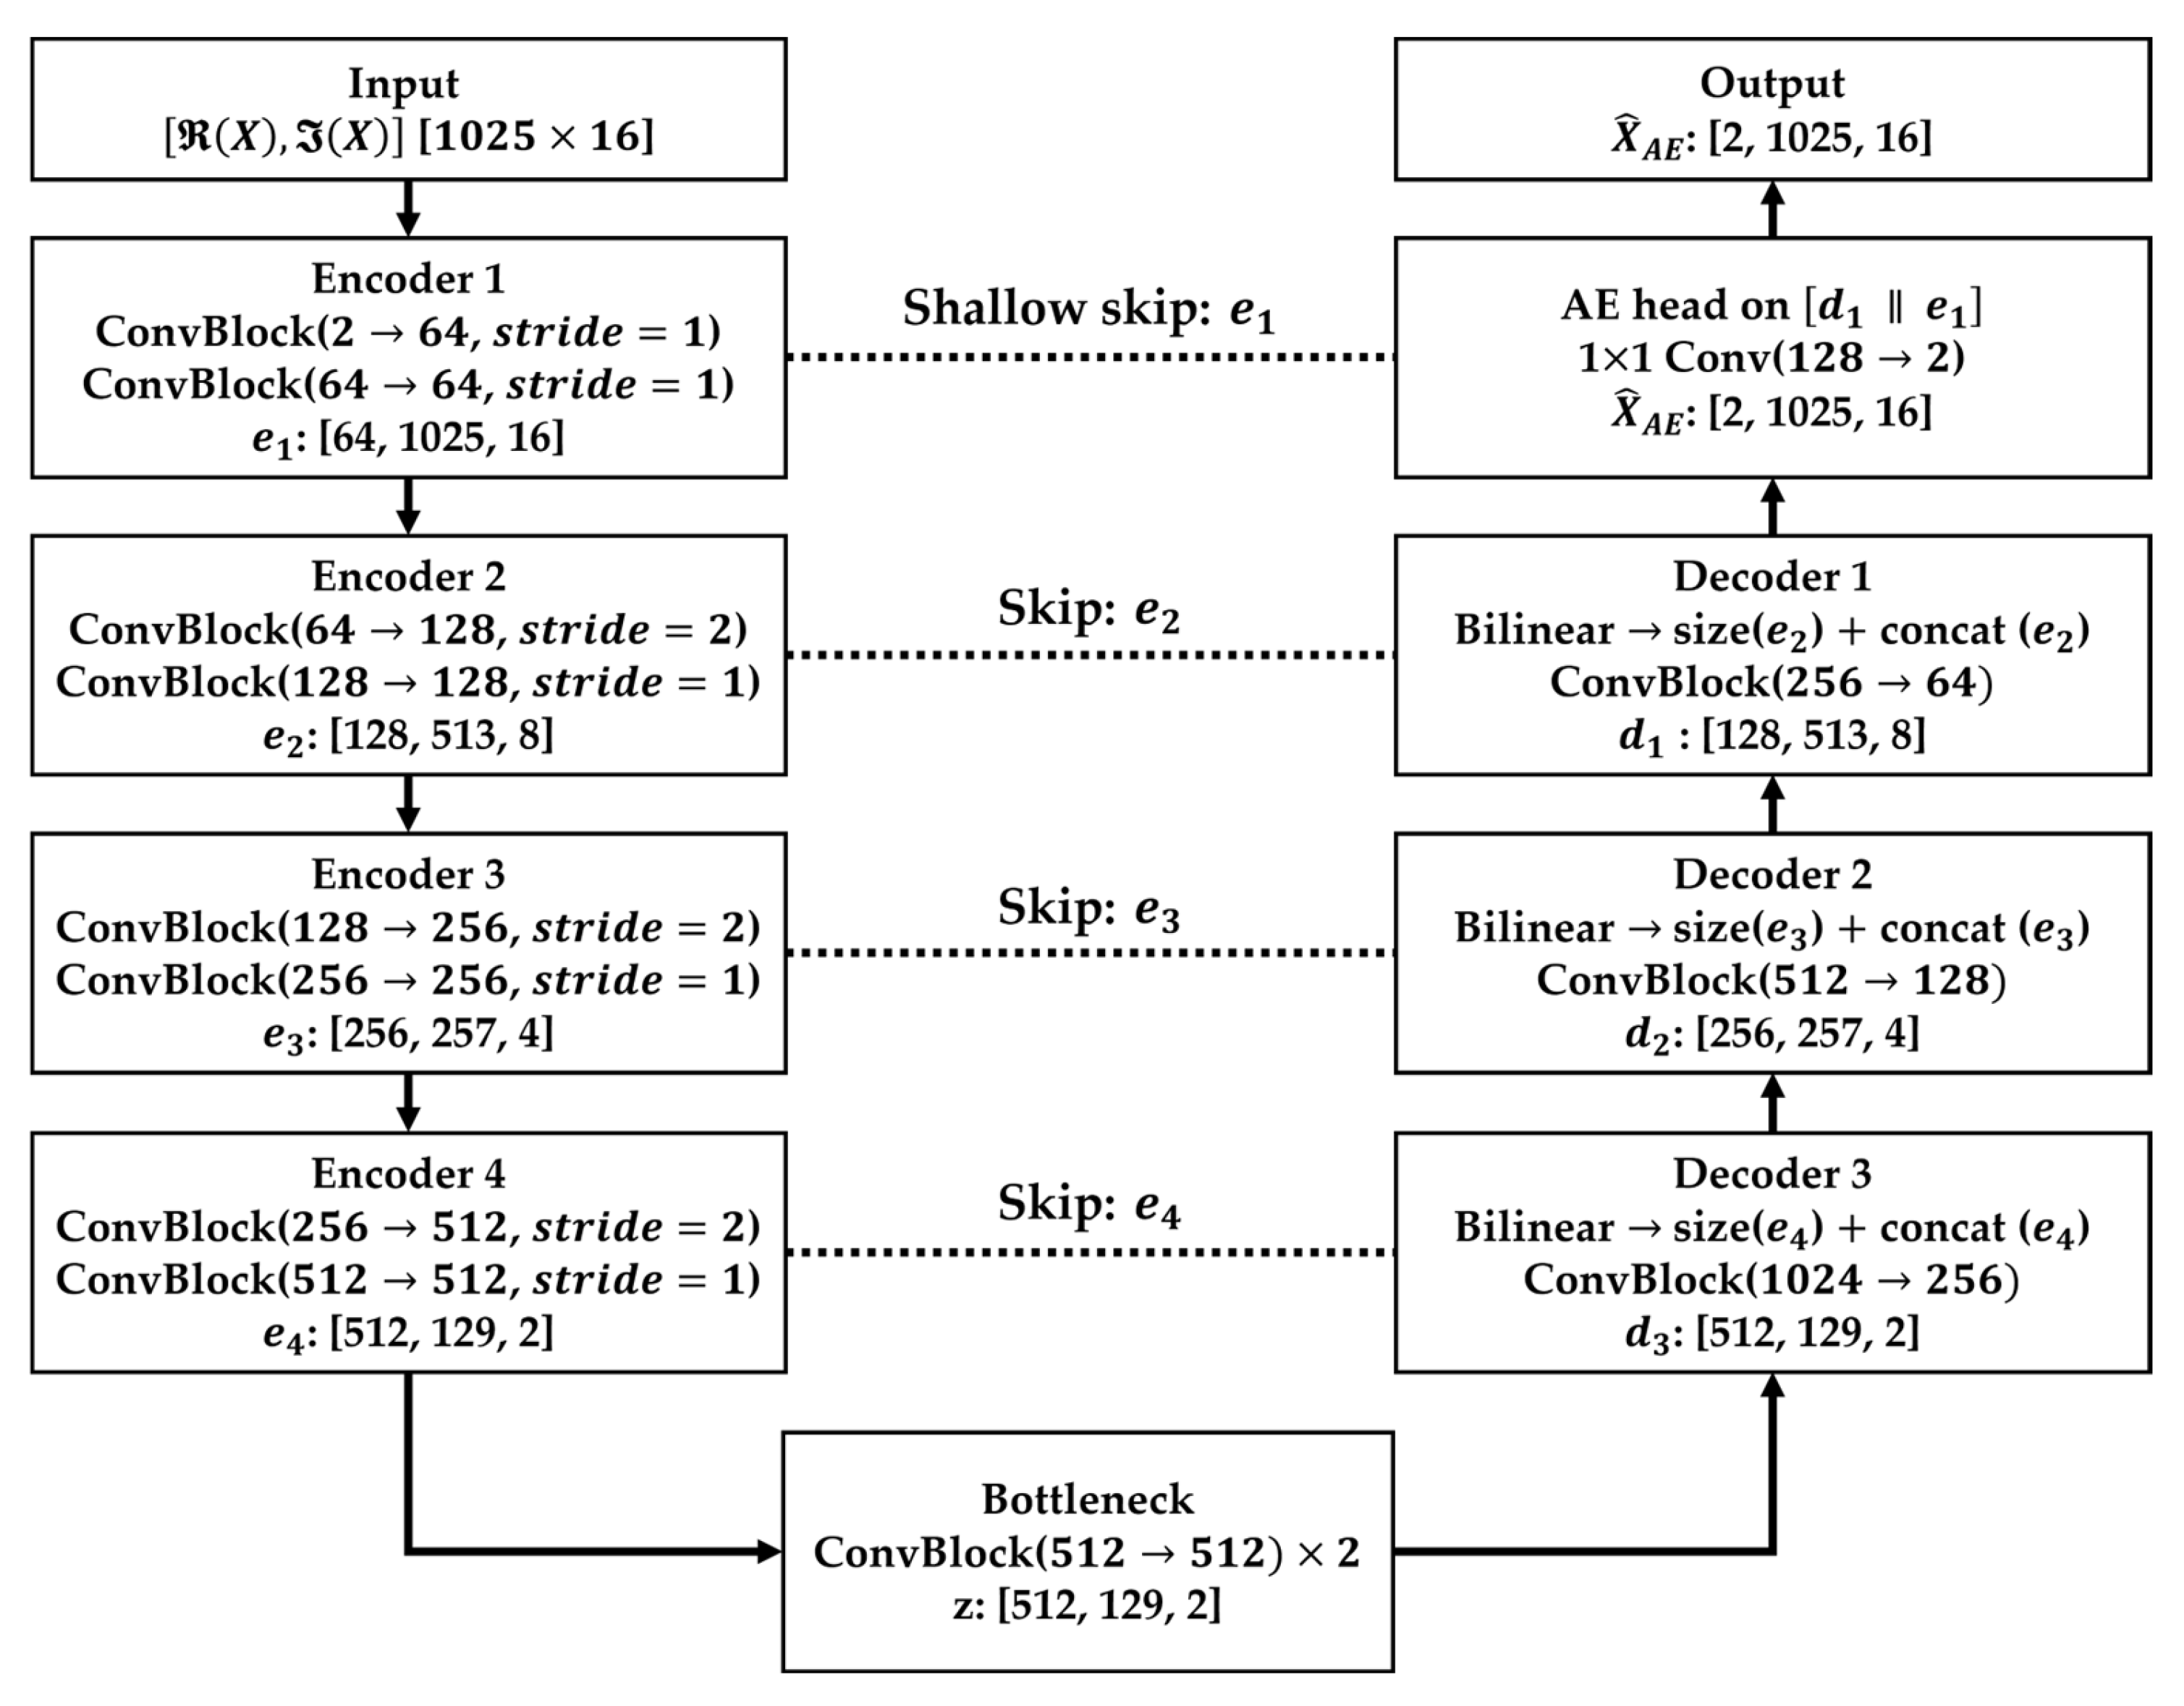
2.4.1. U-Net-Based Autoencoder (Normal Extractor)

We employ a real-valued U-Net autoencoder that takes the complex-spectrogram patch R X , I X and reconstructs normal patterns.
Downsampling is performed with 2D convolutions of stride 2, and upsampling uses bilinear upsampling followed by convolution. Skip connections are introduced between the encoder and decoder. The output has the same spatial resolution as the input, R X ^ , I X ^ . The architecture consists of a four-stage encoder–decoder. At each stage two convolutional blocks are applied, and downsampling uses stride-(2,2) convolution. The bottleneck comprises two convolutional blocks. The decoder proceeds in the order decoder-3 → decoder-2 → decoder-1 with bilinear upsampling and convolutional blocks. Finally, the shallow skip feature from encoder-stage 1 ( e 1 ) is concatenated with the corresponding decoder feature map ( d 1 ) and passed to the head.
See the diagram in Figure 2.

2.4.2. Mask-Bias Head

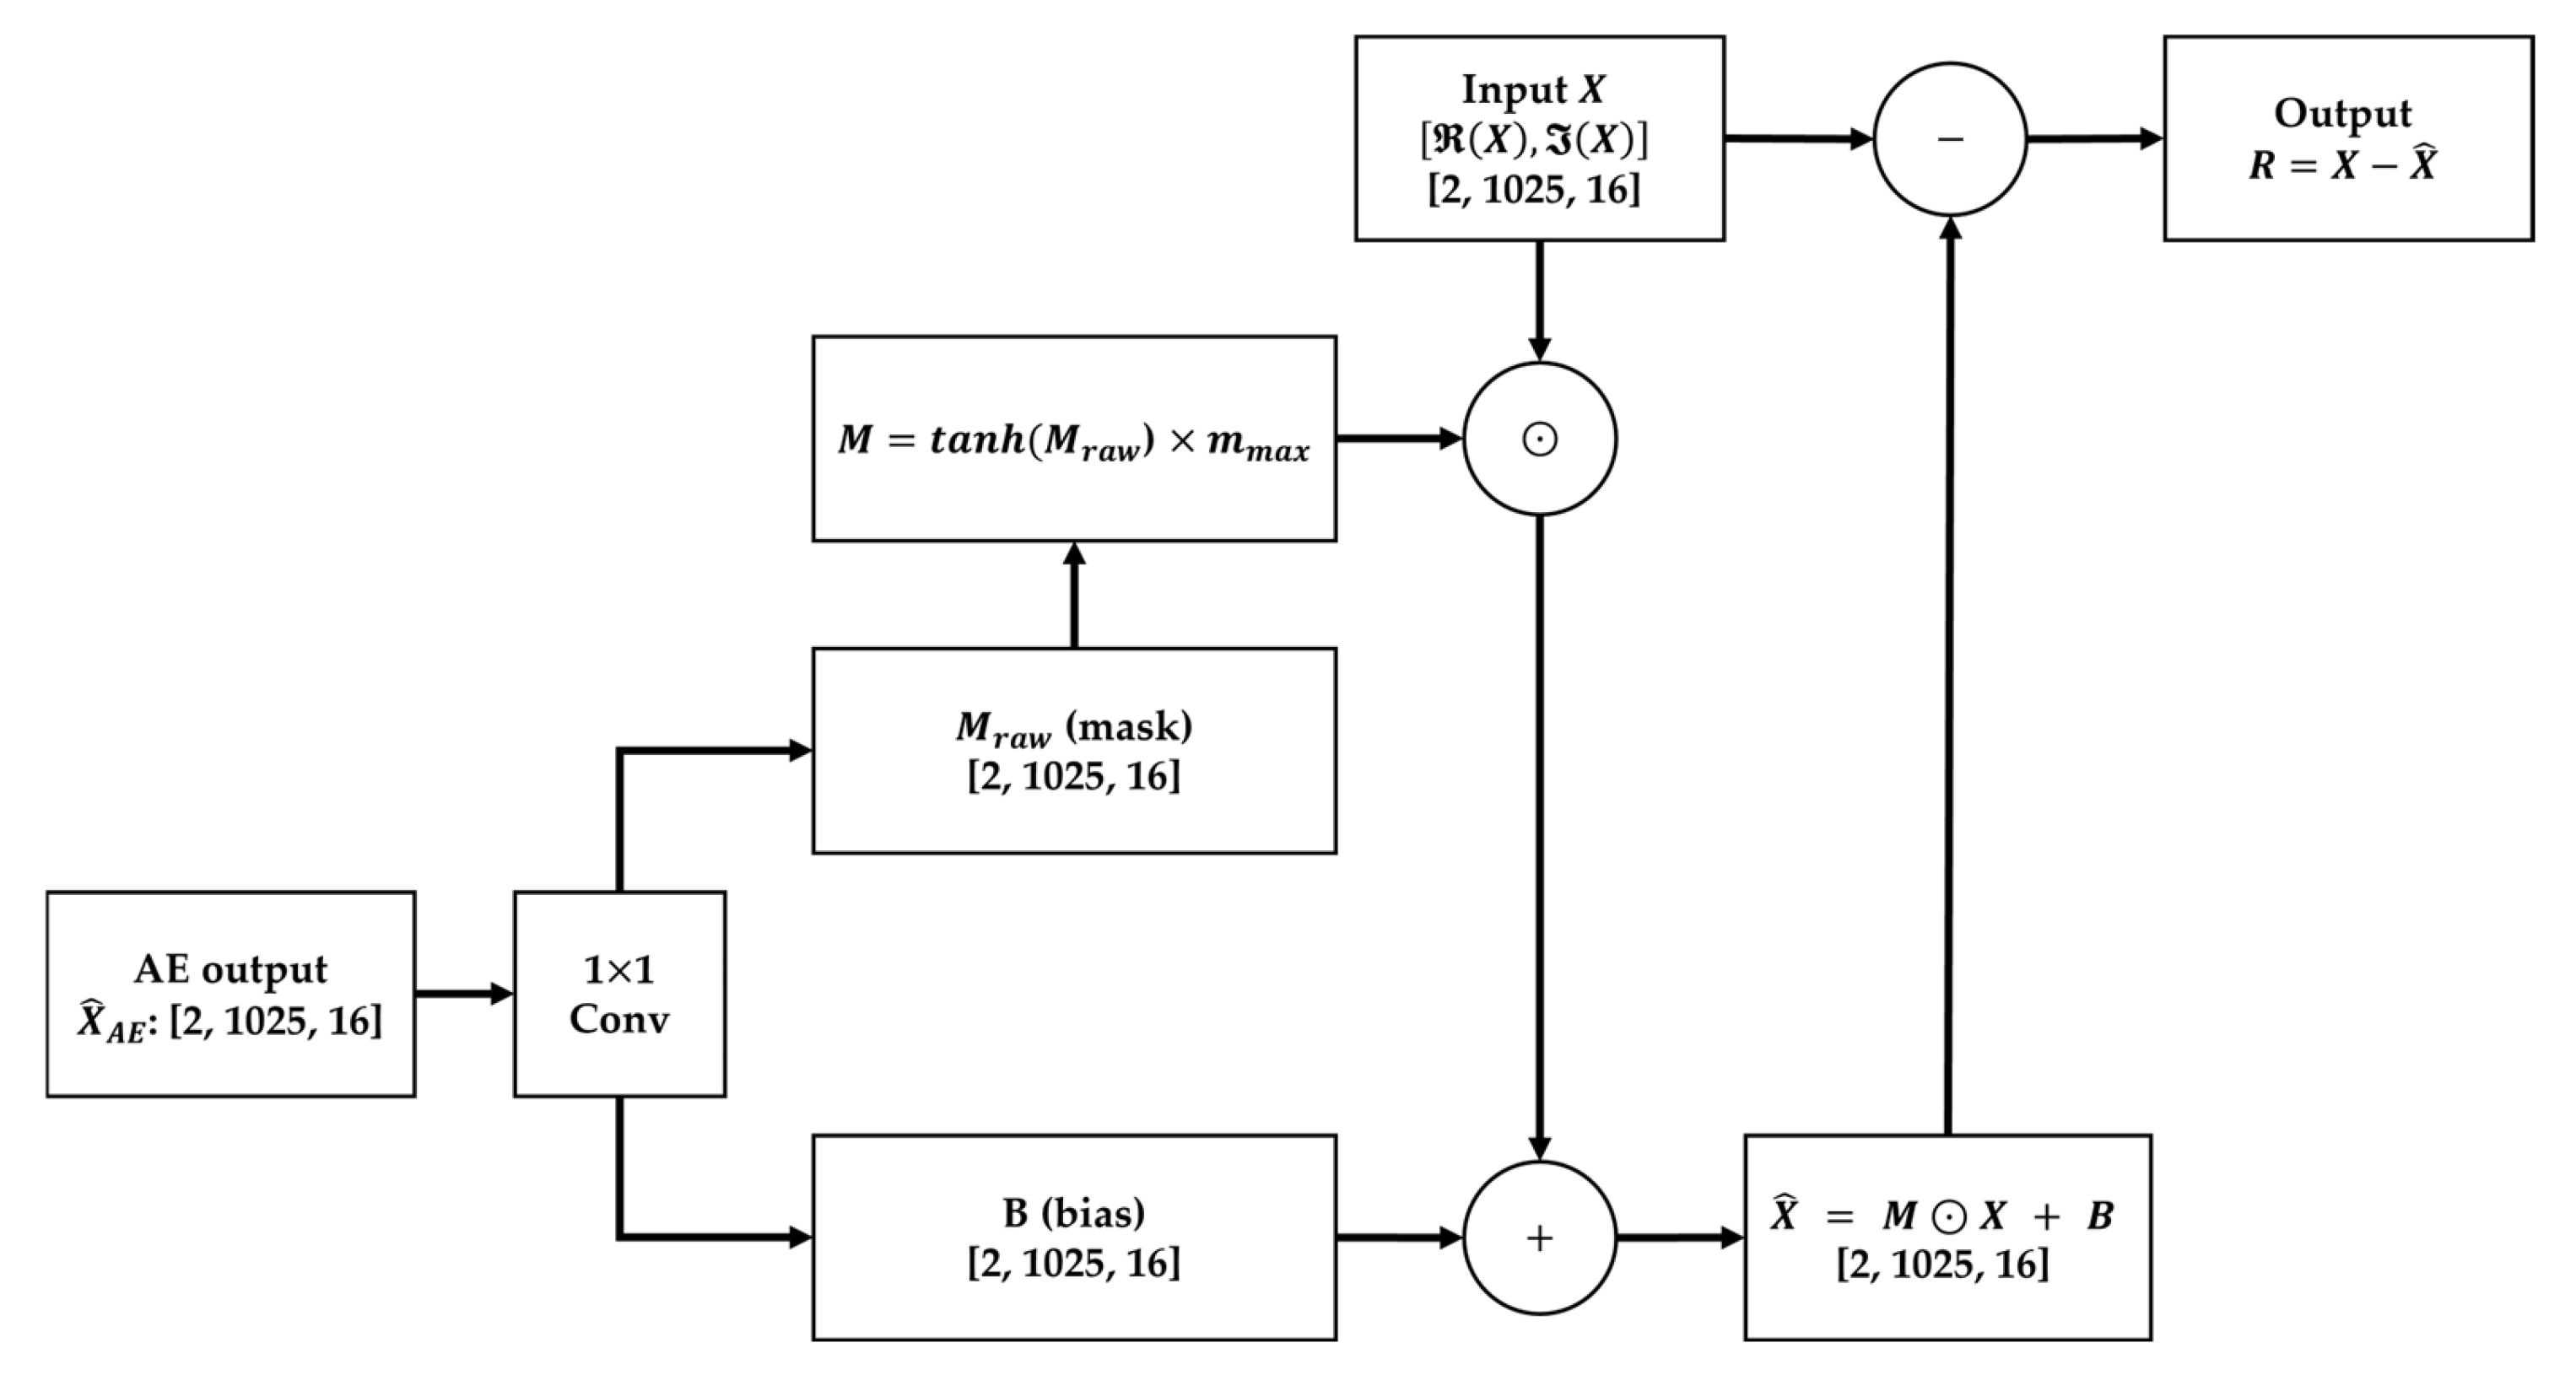
Given the final decoder features d 1 e 1 , a 1 × 1 2D convolution produces four output channels (Figure 3):
The first two constitute a complex mask M (real/imaginary), and the last two constitute a complex bias B (real/imaginary). The mask is gated by t a n h and scaled by a scalar m M a x , i.e., M = t a n h M Raw m M a x . The final reconstruction is computed by complex, element-wise multiplication plus bias:
X ^ = M X + B ,
where denotes element-wise multiplication applied to the complex components. Operating on high-resolution features that fuse the decoder and the shallow skip, this mask-bias head finely adjusts local amplitude and phase while reproducing the normal pattern.

2.4.3. Training and Inference

All experiments were conducted on an NVIDIA A100 40 GB graphics processing unit (GPU) using the PyTorch 2.8.0 framework. AMP was enabled, and the bf16 data type was used to improve computational efficiency.
Training follows normal-centric reconstruction. Stage 1 (teacher): train the U-Net AE to recover normal patterns. Stage 2 (student): train the affine mask-bias head. In both stages, the total loss is given by (9). In Stage 2, letting X ~ denote the Stage-1 teacher output, a weak guidance term is added to stabilize convergence and strengthen local phase alignment:
L Teach = X ^ X ~ 1 , L L + λ Teach L Teach λ Teach = 0.10 .
We set the random seed to 2025 and the batch size to 16. Each stage is trained for up to 1000 epochs with AdamW (fixed learning rate = 2 × 10 4 and weight decay = 1 × 10 4 ), AMP (bf16), channels_last, and torch.compile. Early stopping uses patience = 30 and Δ = 1 × 10 4 . During the first five epochs, a warm-up schedule increases the proportion of normal batches. The weight of L c w t is linearly ramped during the first three epochs. L is evaluated only on normal regions N . Frequency weights W are fixed from statistics of the normal training set.
At inference, given X we produce X ^ , compute the residual R = X X ^ , and derive magnitude (energy/L1), shape (CWT-based), frequency-distribution (band/centroid/peak), and orthogonal components ( R ). These residual-based features are then combined according to Section 2.5 for decision making.

2.5. Residual Features for Decision

To derive discriminative evidence from the residuals, we employ three feature families: (i) Magnitude/Shape, (ii) Frequency Distribution, and (iii) Normal-Manifold Projection (Parallel/Orthogonal).
Magnitude/Shape. The Residual-to-signal ratio (RSR) is defined as
R S R = m , k R m , k m , k X m , k ,
here, R m , k = X m , k X ^ m , k denotes the residual.
The weighted residual score is
W s c o r e = k w k m R m , k m , k R m , k ,
where w k is the weight assigned to the k-th frequency bin. We also compute shape-similarity indicators such as the input-reconstruction correlation coefficient.
Frequency Distribution. The centroid of the residual spectrum is
C e n t r o i d = k f k m R m , k m , k R m , k ,
where f k is the center frequency of bin k . The maximum-peak ratio and its frequency are
R p e a k = m a x k m R m , k m , k R m , k , f p e a k = a r g m a x k m R m , k .
We also use band energy ratios over [0, 50], [50, 100], [100, 200], [200, 400], [400, 800], [800, 1600], and [1600, 2000] Hz:
B [ f 1 , f 2 ] = k [ f 1 , f 2 ] m R m , k m , k R m , k , [ 0 , 2000 ] B = 1 .
Normal-Manifold Projection (Parallel/Orthogonal). Using the input spectrogram phase ϕ = X , we rotate the residual by − ϕ to obtain R ~ = R e j ϕ and decompose it into parallel and orthogonal components with respect to the local input phasor: R = R R ~ , R = I R ~ .
The band-energy ratios of the orthogonal component are then
d , B f 1 , f 2 = k [ f 1 , f 2 ] m I R ~ m , k k m I R ~ m , k .
Unless otherwise stated, all orthogonality-based features are computed on I R ~ .
We further use the orthogonal fraction and the parallel/orthogonal ratio:
p = I R ~ 1 R ~ 1 , ρ P / O = R R ~ 1 I R ~ 1 .
These quantities directly measure the energy that the normal model fails to explain. The final classifier is a Gaussian Naive Bayes. Inputs are z-score normalized using TRAIN statistics, class priors are fixed to (0.5, 0.5), and the tile-level decision threshold is chosen on TRAIN by maximizing Youden’s index. No post hoc calibration is applied.

2.6. Evaluation Protocol and Metrics

We split the data into Train, Validation, and Test. Feature selection (Top-K), standardization (z-score), and the Youden threshold ( θ *) are determined only on TRAIN, and we report final performance only on TEST.
Tile-level posteriors p i are aggregated into a file-level score by a top-k mean (top 10% of tiles):
s File = 1 k i top - k p i , k = 0.10 × N Tiles .
All significance tests in the manuscript use this s File . Where case-specific feature optimization is needed, selection and tuning are performed in inner cross-validation, then fixed in the outer fold to avoid information leakage. Generalization is additionally checked with Leave-One-File-Out (LOFO).
Classification performance. We evaluate ROC-AUC (with bootstrap 95% confidence interval (CI), using group-preserving bootstraps at the file level, B = 1000), F1-score, and the confusion matrix. From the confusion matrix we also compute accuracy and balanced accuracy:
A c c = N r N N + F r F F N + F , B a l a n c e d   A c c = 1 / 2 r N N + r F F ,
where N and F are the numbers of normal/fault tiles and r N N , r F F are the corresponding recalls.
Calibration. We report the Expected Calibration Error (ECE) and Brier score.
Generalization/statistical tests. We report LOFO file-level accuracy, a permutation test (label shuffle at the file level, R = 2000), and a null test (R = 500), both to rule out split bias or chance performance. The p-value is computed as
p = ( # { n u l l   s t a t i s t i c s   o b s e r v e d   } ) / ( R + 1 ) .
Overfitting prevention and monitoring. We use AdamW, early stopping, and a normal-region regularizer. We monitor the Train-Test area under the curve (AUC) gap, ECE drift, residual-growth flags, Kolmogorov–Smirnov (KS)-shift, and results of the null test. The evaluation protocol is summarized in Table 4.

3. Results

Using the settings specified in Section 2, we report both quantitative and qualitative results. Unless otherwise stated, the STFT parameters, data partitioning, and training hyperparameters follow Section 2.1, Section 2.2, Section 2.3 and Section 2.4. First, Section 3.1 visualizes the effect of the proposed preprocessing; subsequently, Section 3.2 presents the feature-selection and classification results.

3.1. Misalignment

Case 1 considers the normal and misalignment of a 2.2 kW blower, whereas Case 6 considers the normal and misalignment of a 5.5 kW blower. For both cases, we report the pre-processing (residual) spectra and the corresponding fault-classification outcomes.

3.1.1. Data Preprocessing Results

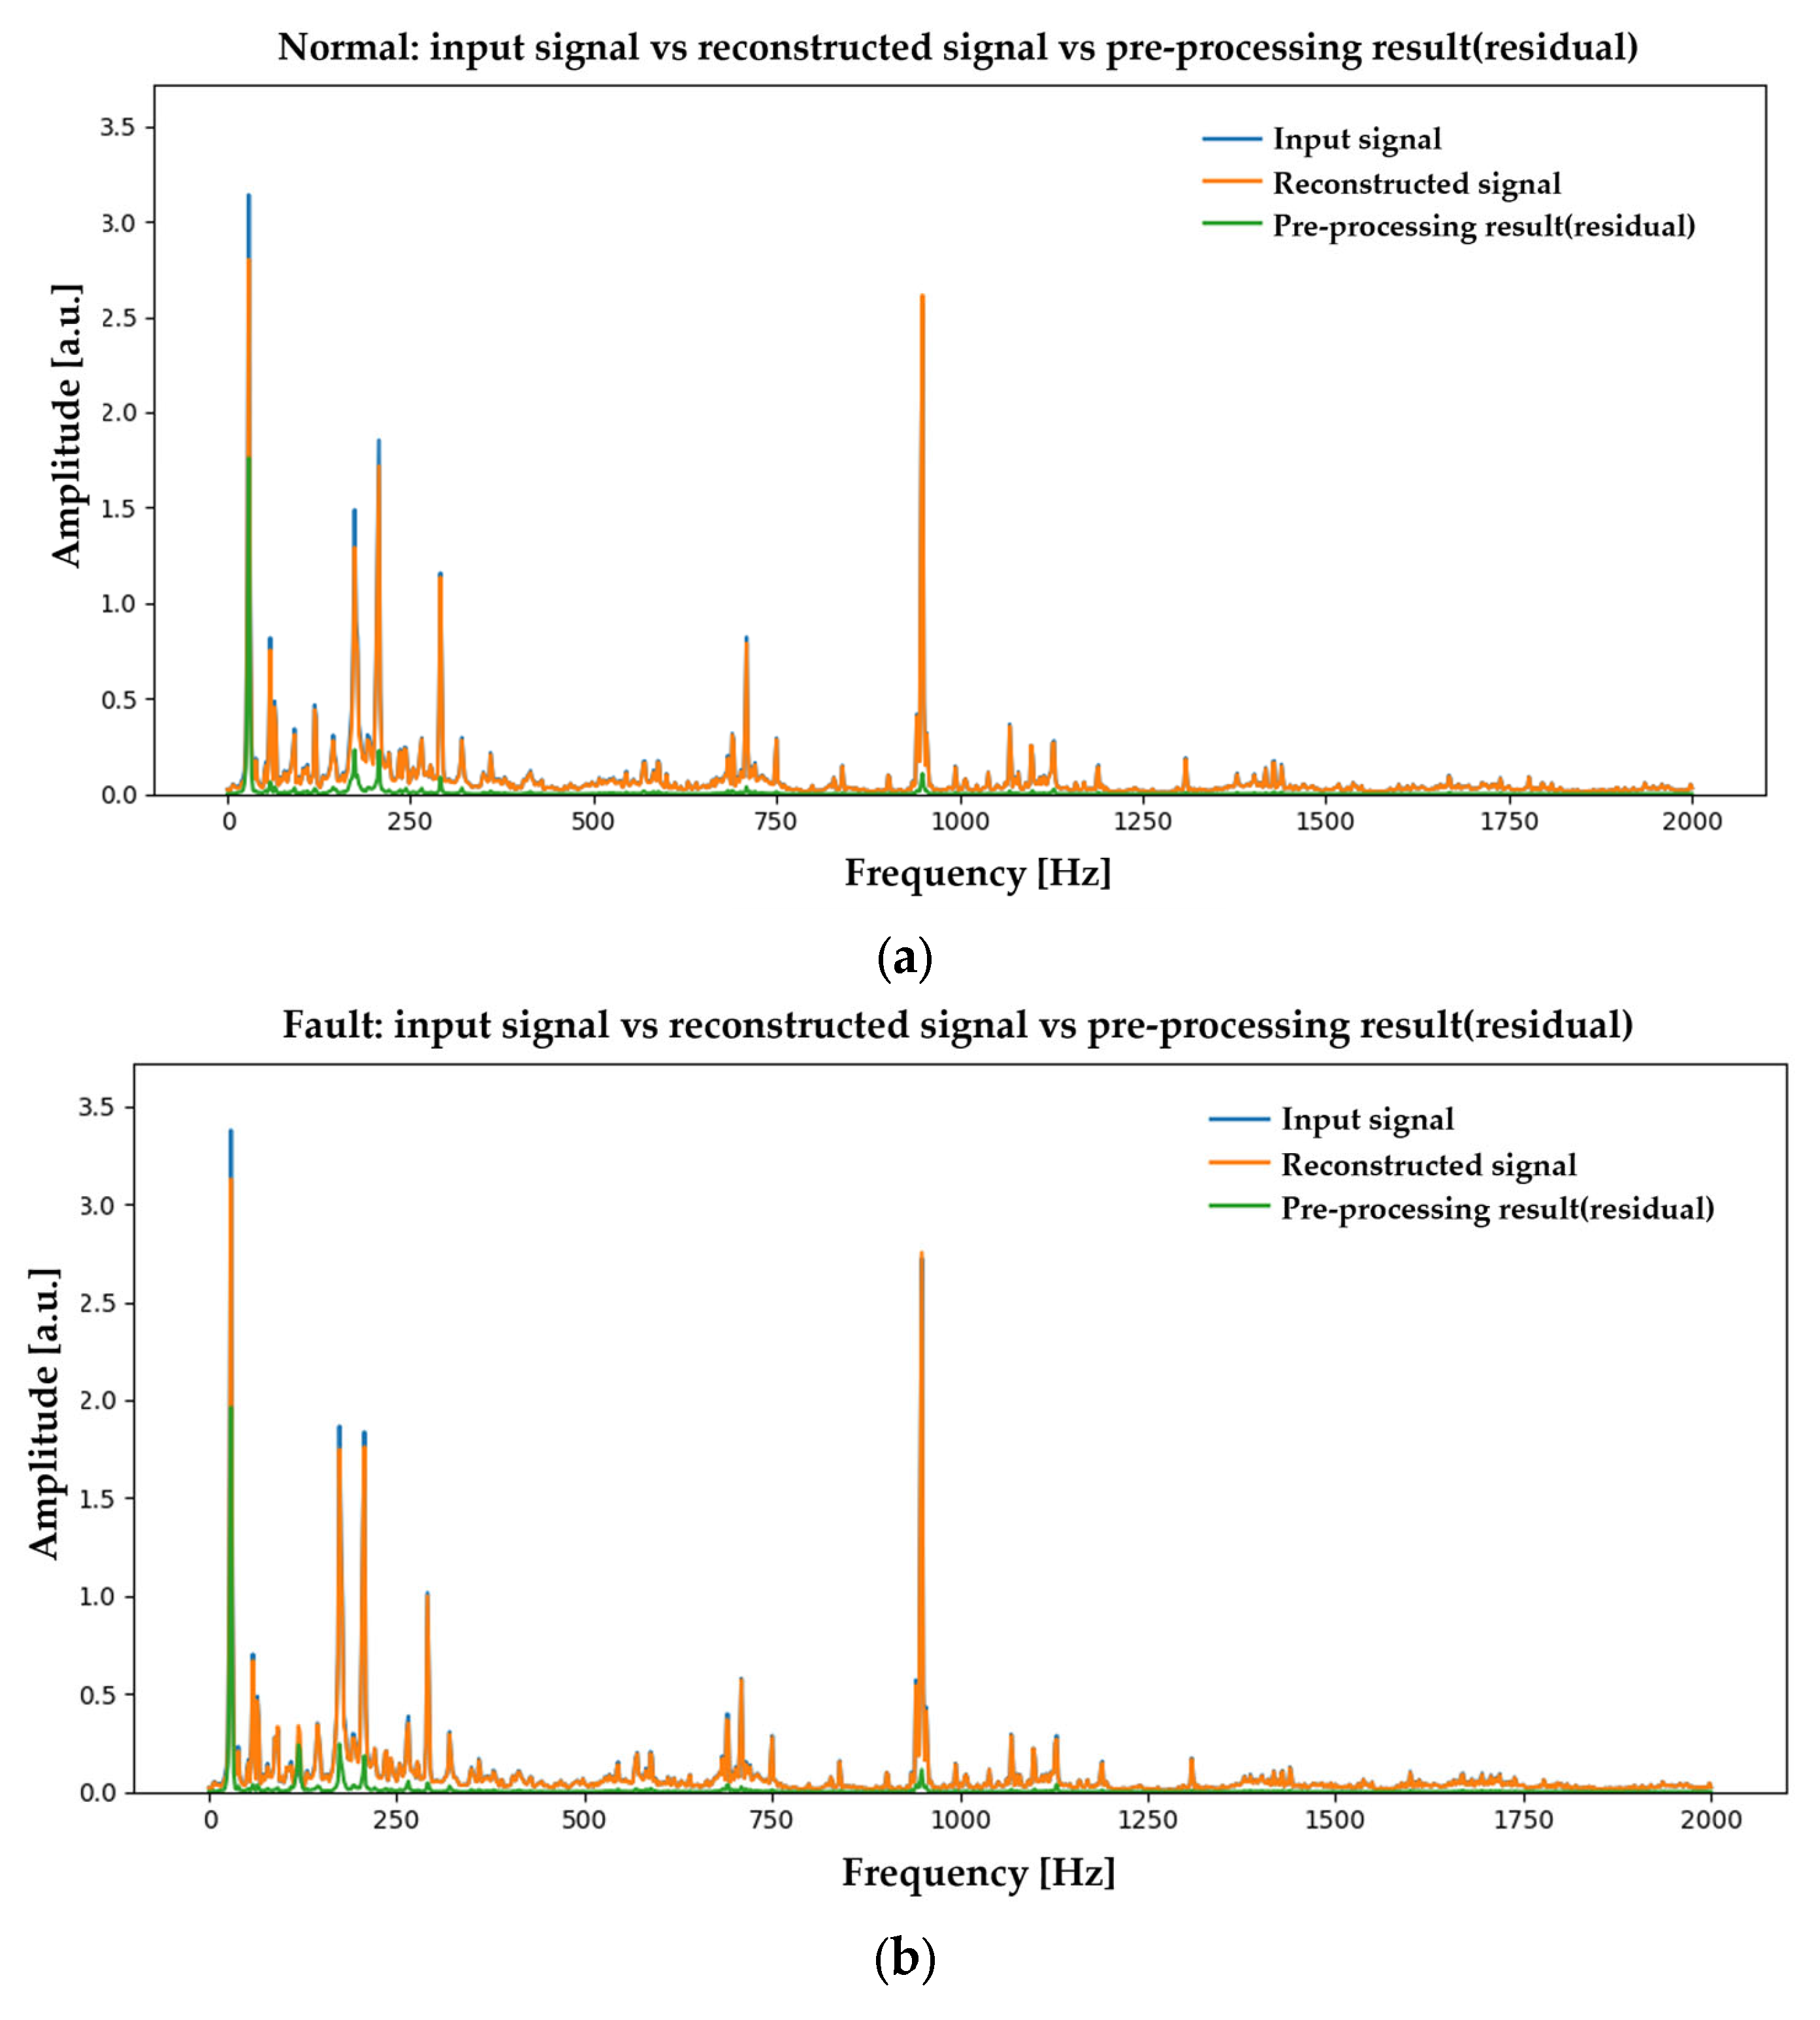
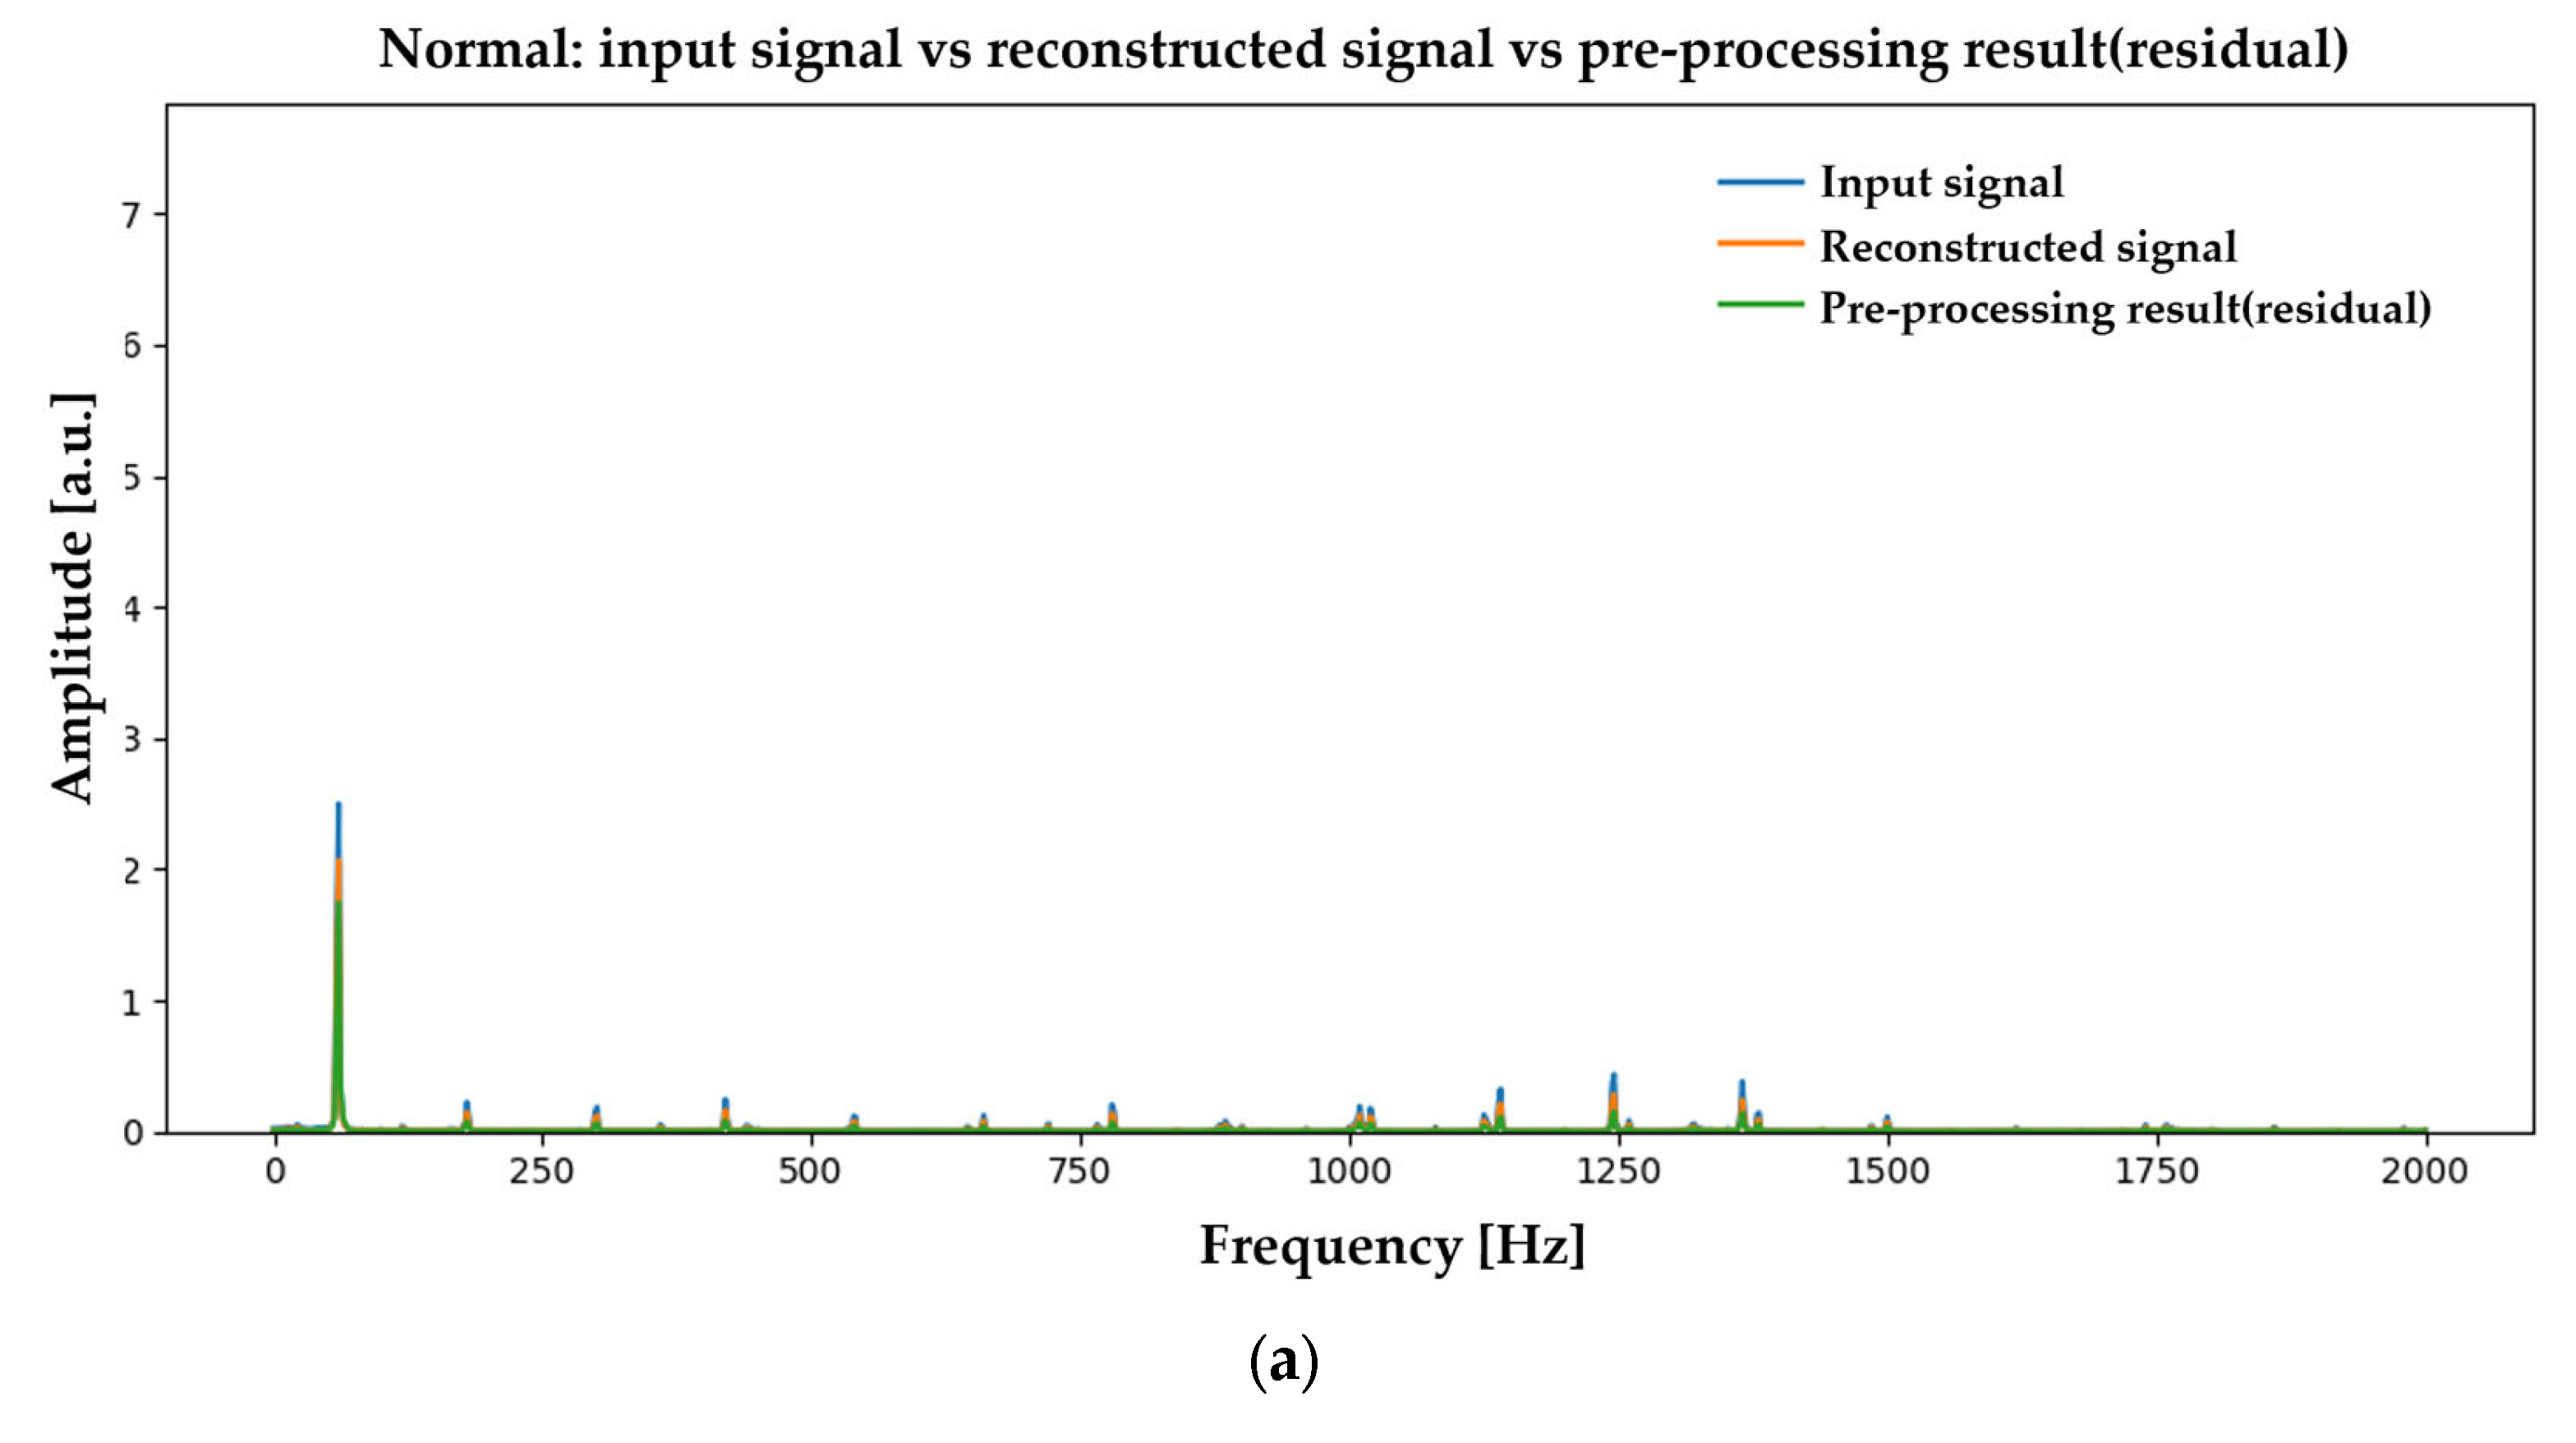
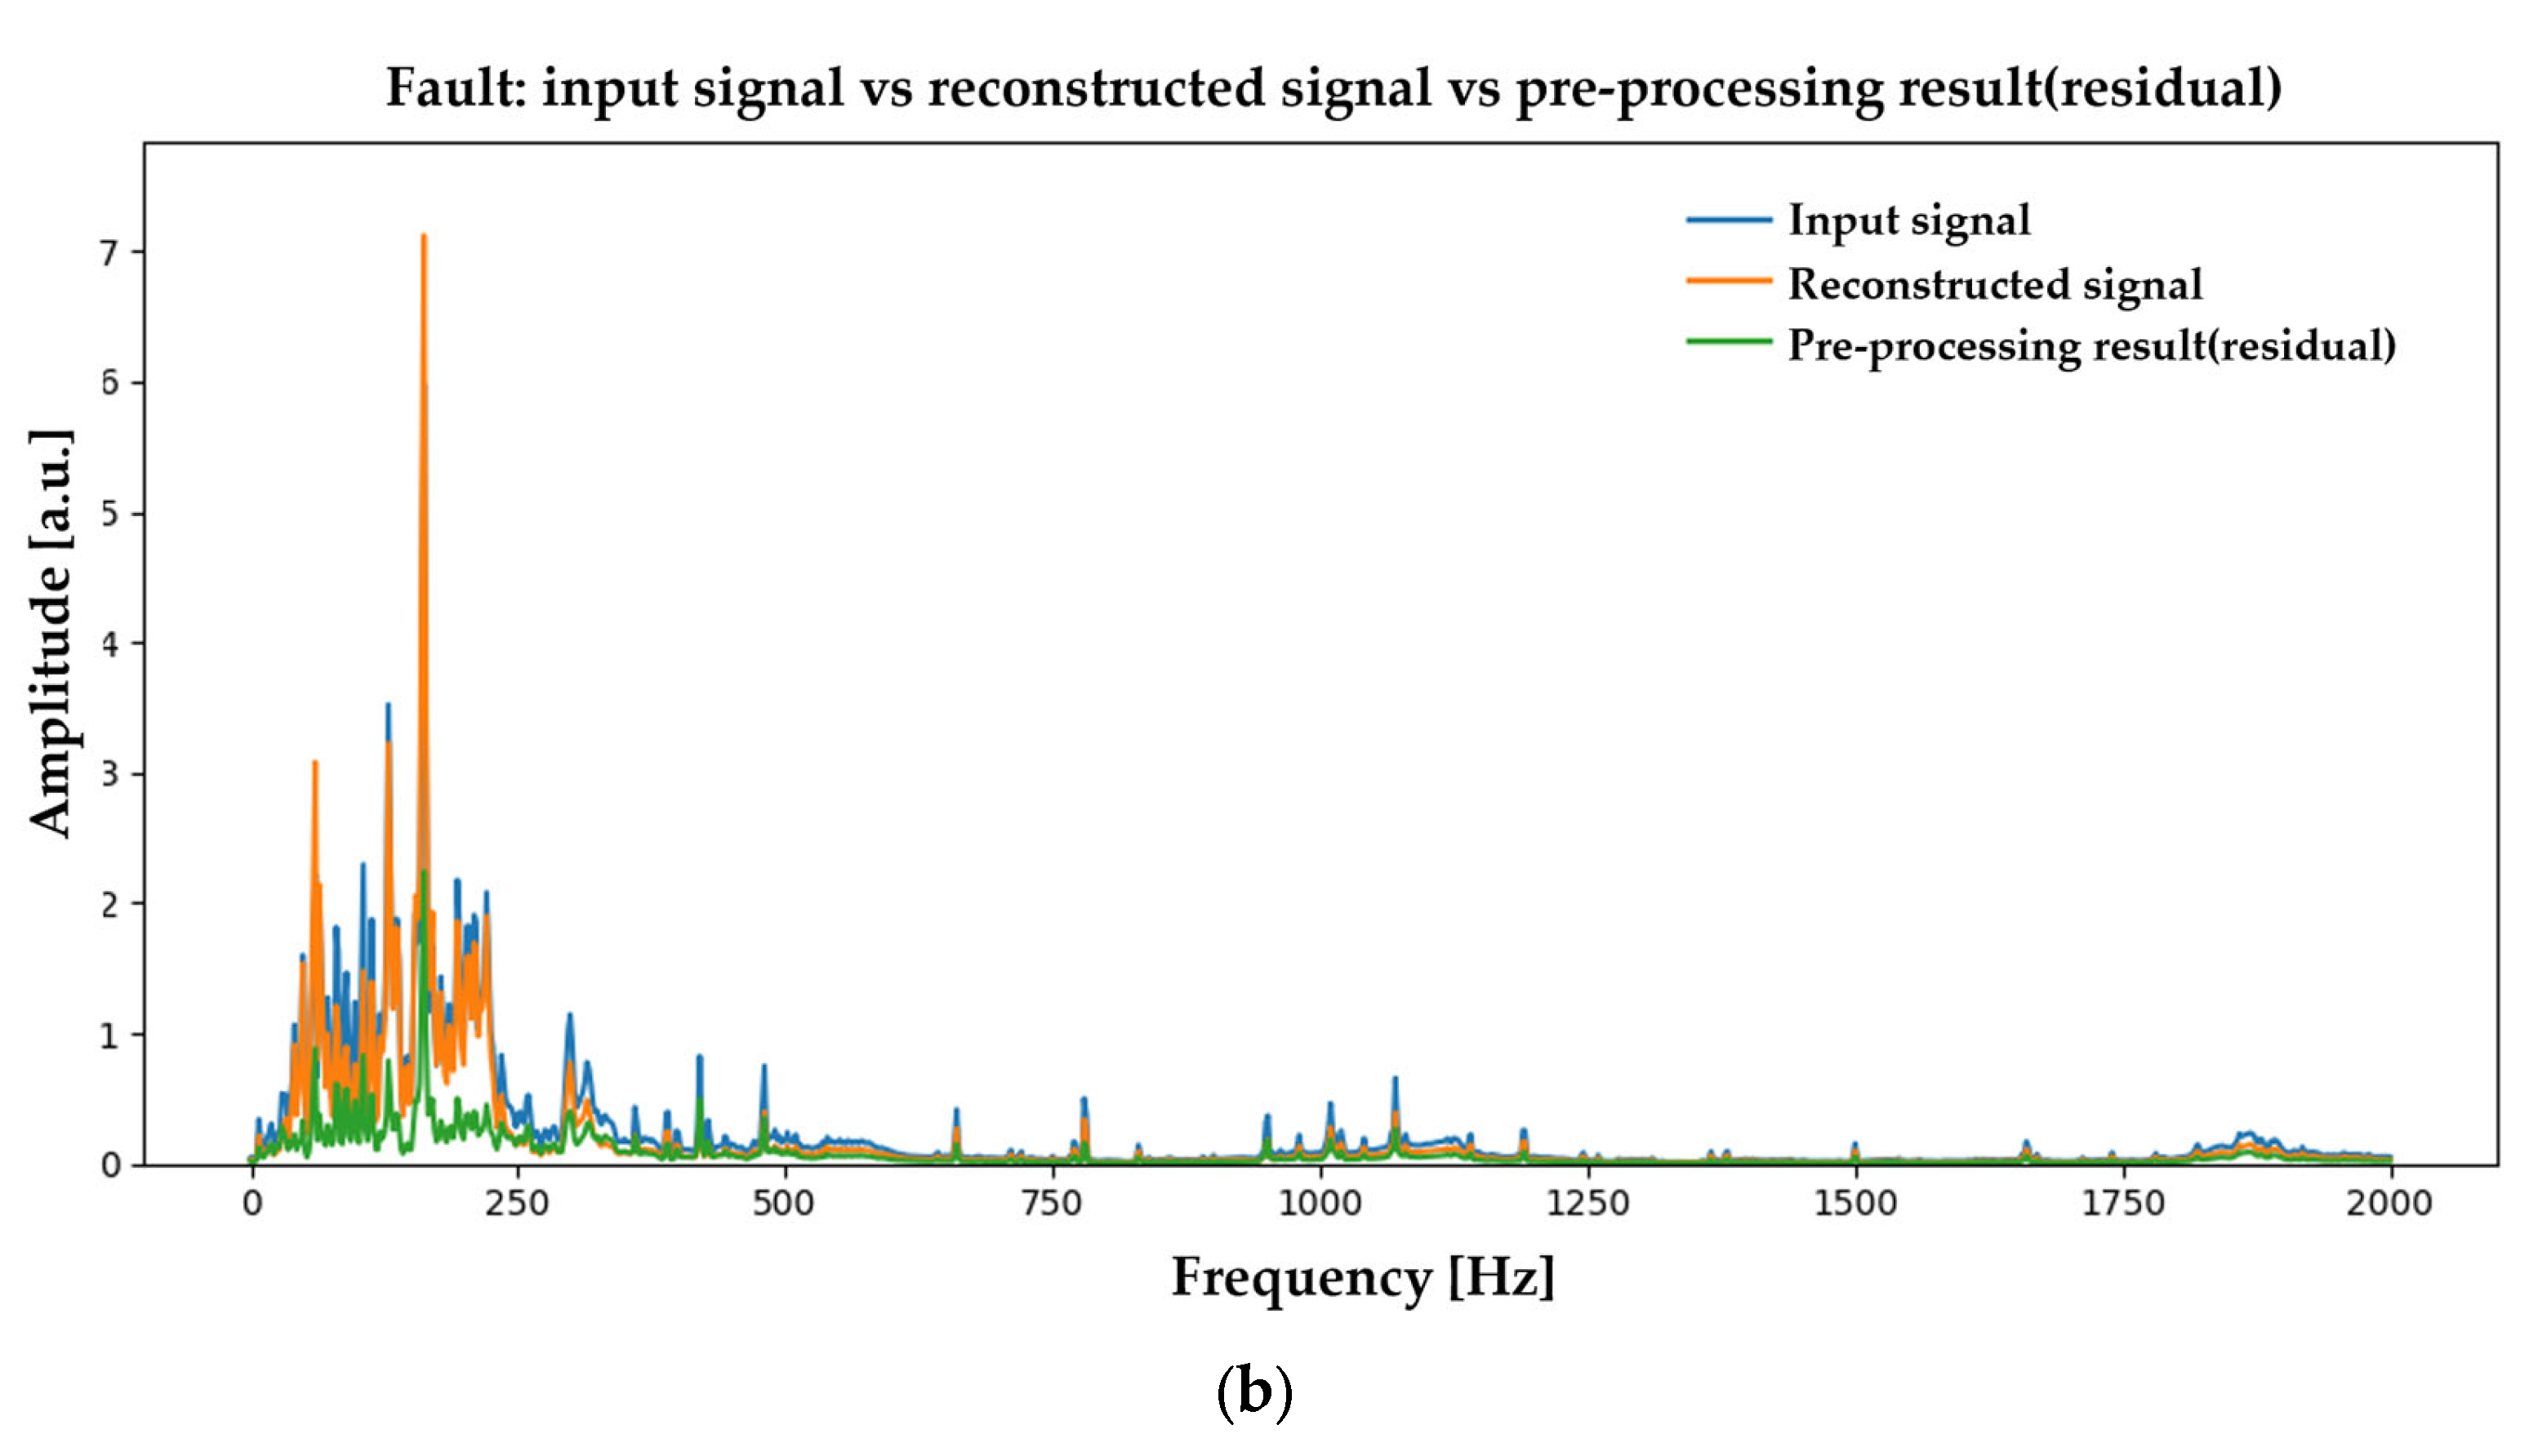
As shown in Figure A1 for Case 1, the healthy data yield a residual that is broadly low in energy across the entire band, with only small, isolated narrowband peaks. By contrast, under misalignment, a distinctly harmonic series of equally spaced narrowband peaks emerges—most prominently in the low-frequency region—indicating that, after subtraction of the reconstructed normal component, a set of order-related components persists and is spectrally separable from the raw spectrum. In particular, the prominent 1× and 2× orders are consistent with well-known spectral symptoms of shaft misalignment and, therefore, support the misalignment diagnosis for Case 1.
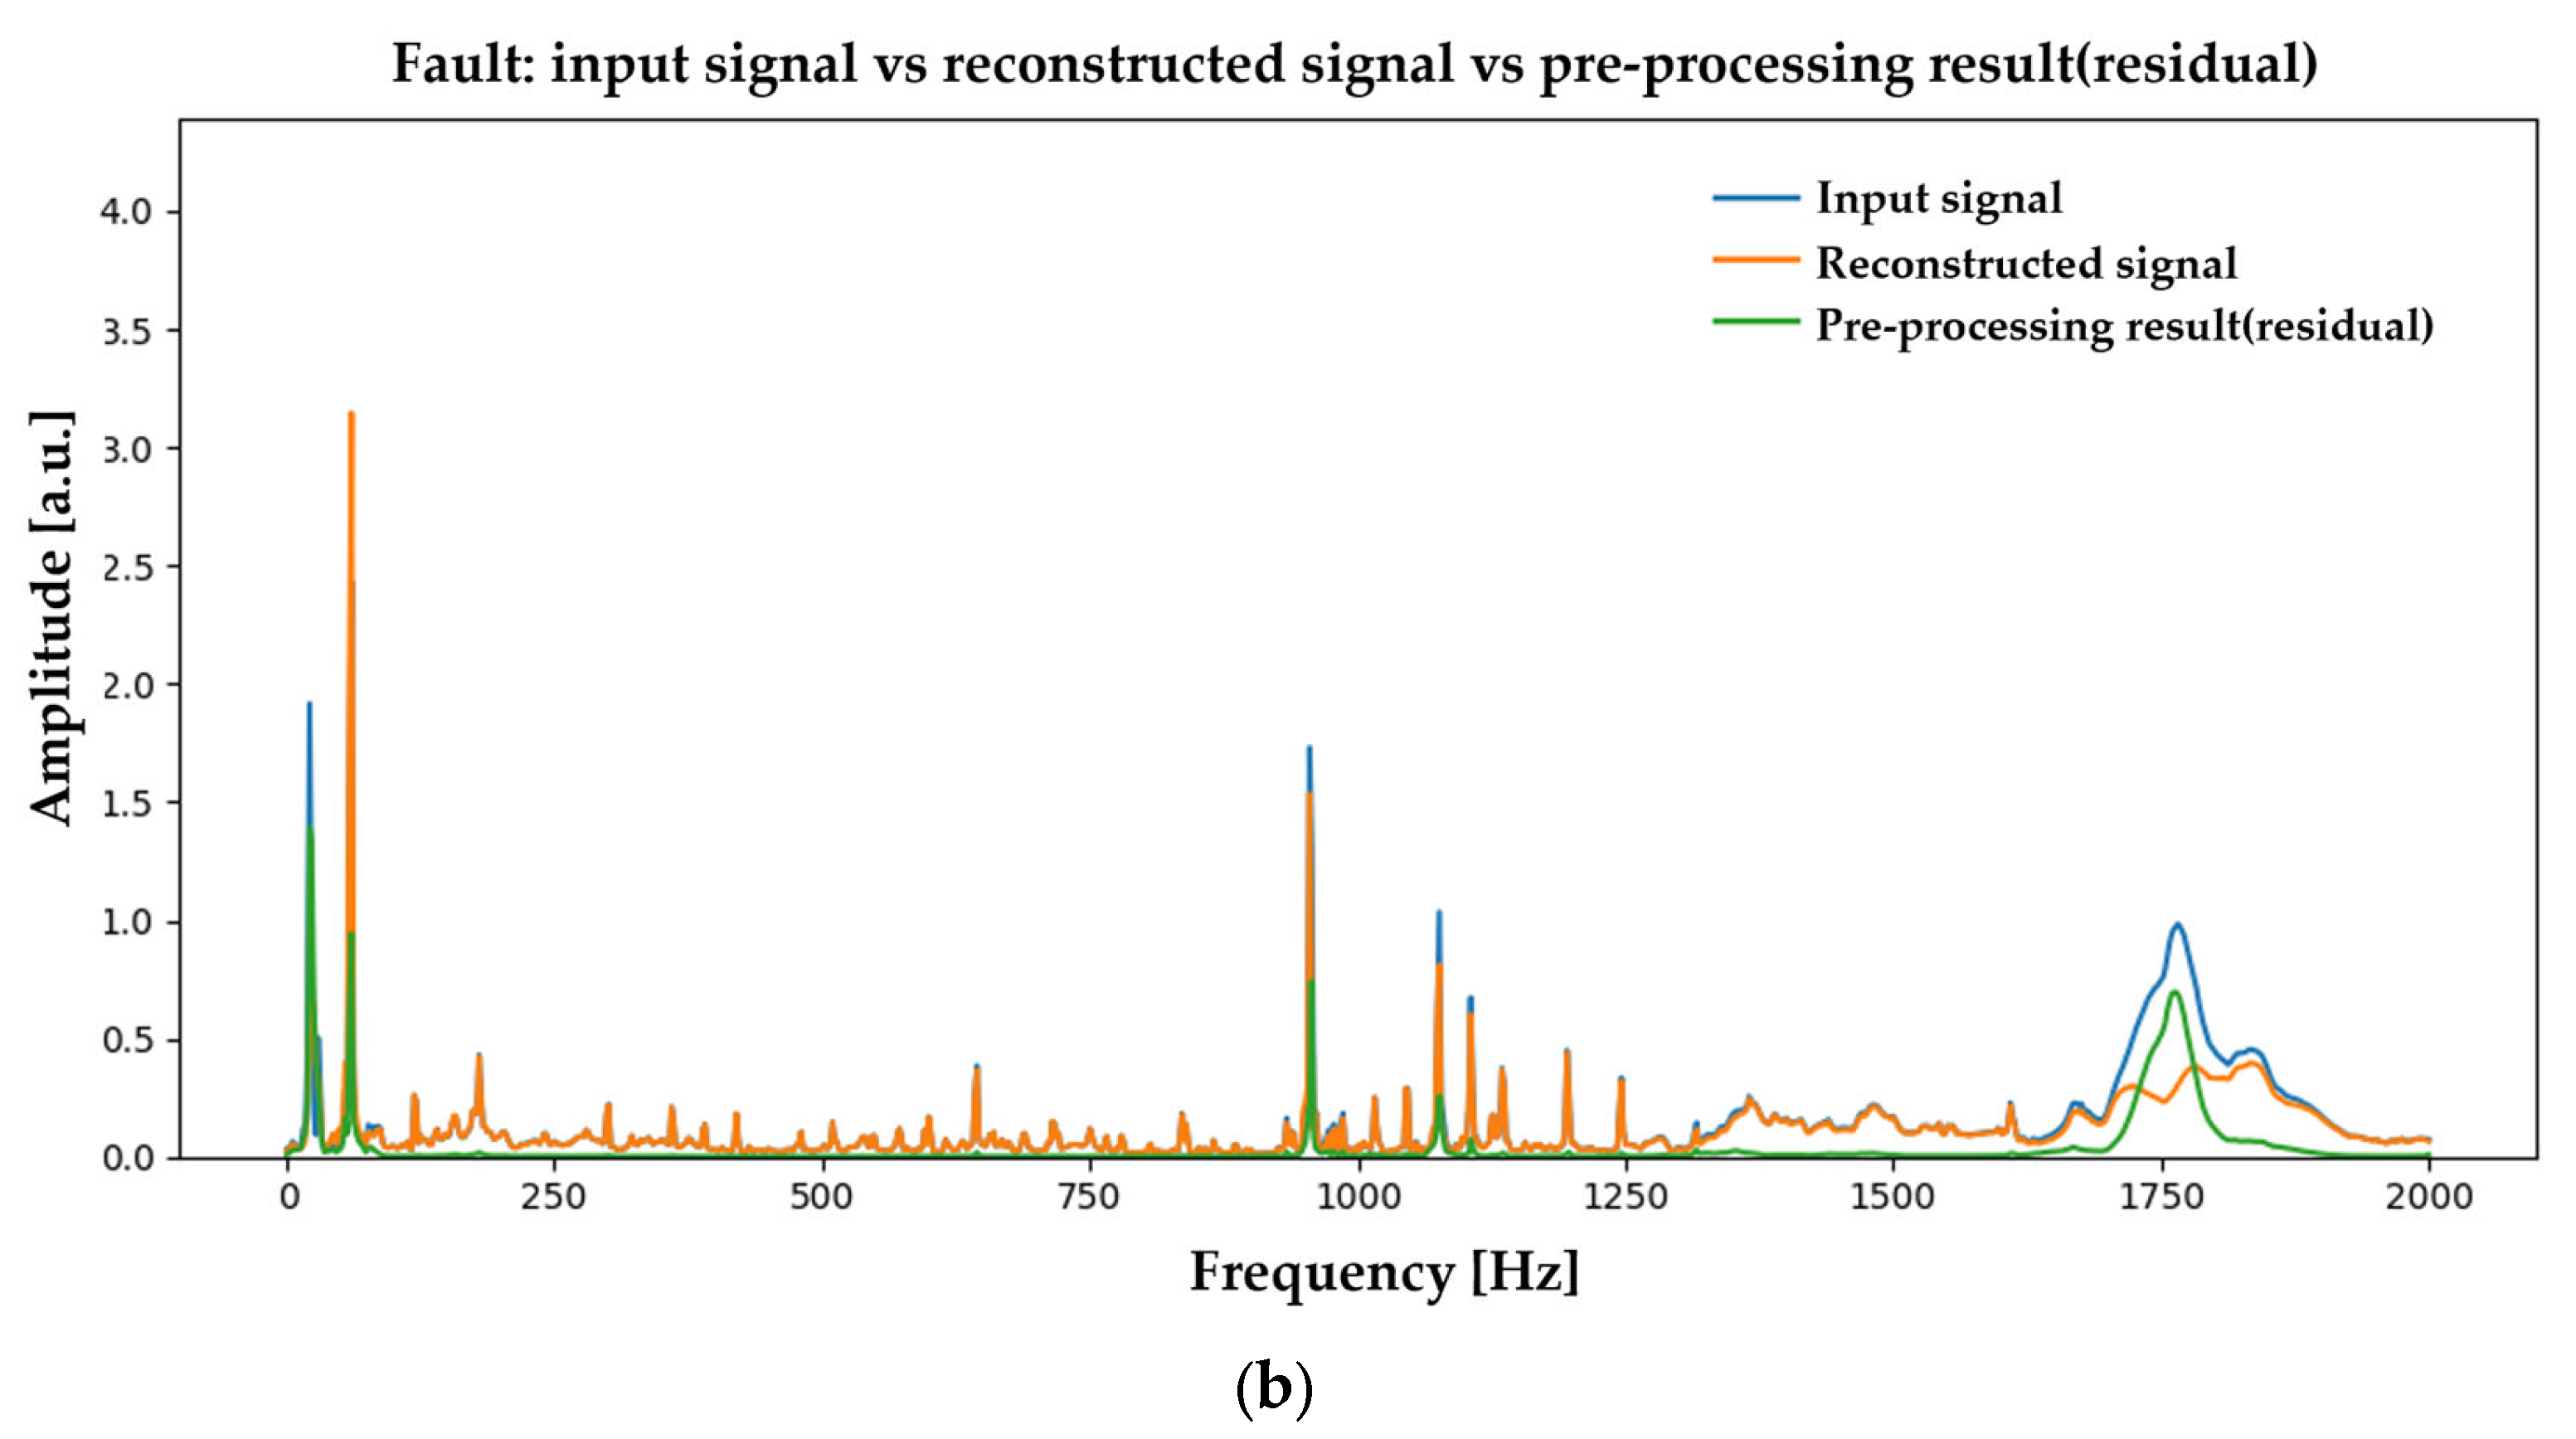
The results for Case 6 (see Figure A6) show the same qualitative trend. In the healthy state, the residual is of low amplitude and largely free of pronounced narrowband peaks. Under misalignment, however, we again observe low-frequency harmonics together with clusters of narrowband peaks in selected mid- to high-frequency bands. This indicates that, in Case 6 as well, the residual effectively cancels normal components while recovering fault-specific content as the remaining signal.
In summary, for both cases, the healthy residuals are comparatively flat, whereas misalignment yields harmonic narrowband peak trains—notably the 1× and 2× series in the low-frequency region—consistent with standard spectrum-based diagnostic rules for shaft misalignment. These observations suggest that the proposed pre-processing enhances fault-related harmonic structure by attenuating normal components.

3.1.2. Feature Selection & Classification Results

As shown in Figure A9 for Case 1, the top two features were the relative sum of residual energy orthogonal to the normal subspace ( R S T × p ) , and the energy ratio of the component parallel to the normal subspace to the orthogonal component ( ρ P / O ). Thus, in Case 1, the magnitude and proportion of energy located in the orthogonal subspace provided the strongest discriminative power. In line with Section 3.1.1, this implies that, even after normal-component removal, a phase-coherent harmonic train ( 1×, 2×) survives in the residual and that its energy is concentrated along directions geometrically orthogonal to the learned normal subspace.
As shown in Figure A14 for Case 6, the two most discriminative features were d , B 800 , 1600 and d , B 1600 , 2000 , the fraction of orthogonal-residual energy concentrated in the 0.8–1.6 kHz and 1.6–2.0 kHz bands, respectively. This indicates an ambidomain signature: along with the low-frequency harmonic train, Case 6 exhibits abnormal concentration of residual energy in specific mid/high-frequency windows.

3.2. Bearing Fault—Lubricant-Removed

Case 2 contrasts a 2.2 kW blower A in a healthy condition with bearing fault—lubricant-removed; Case 5 does the same for a 3.7 kW blower A. For both cases, we report the pre-processing result (residual) and the ensuing fault-classification outcomes.

3.2.1. Data Preprocessing Results

In Figure A2 (Case 2), the principal deterministic shaft-order components in the healthy runs (1×, 2× and other low-frequency rotating components) are effectively cancelled in the residual, whereas the lubricant-removed condition exhibits clear new components and an energy increase in the low-frequency band (0–200 Hz), together with additional content in the high-frequency band (1.6–2.0 kHz). The newly appearing low-frequency lines with their harmonics/sidebands are consistent with amplitude-modulated patterns at the bearing characteristic frequencies (BCFs) spaced by the running speed.
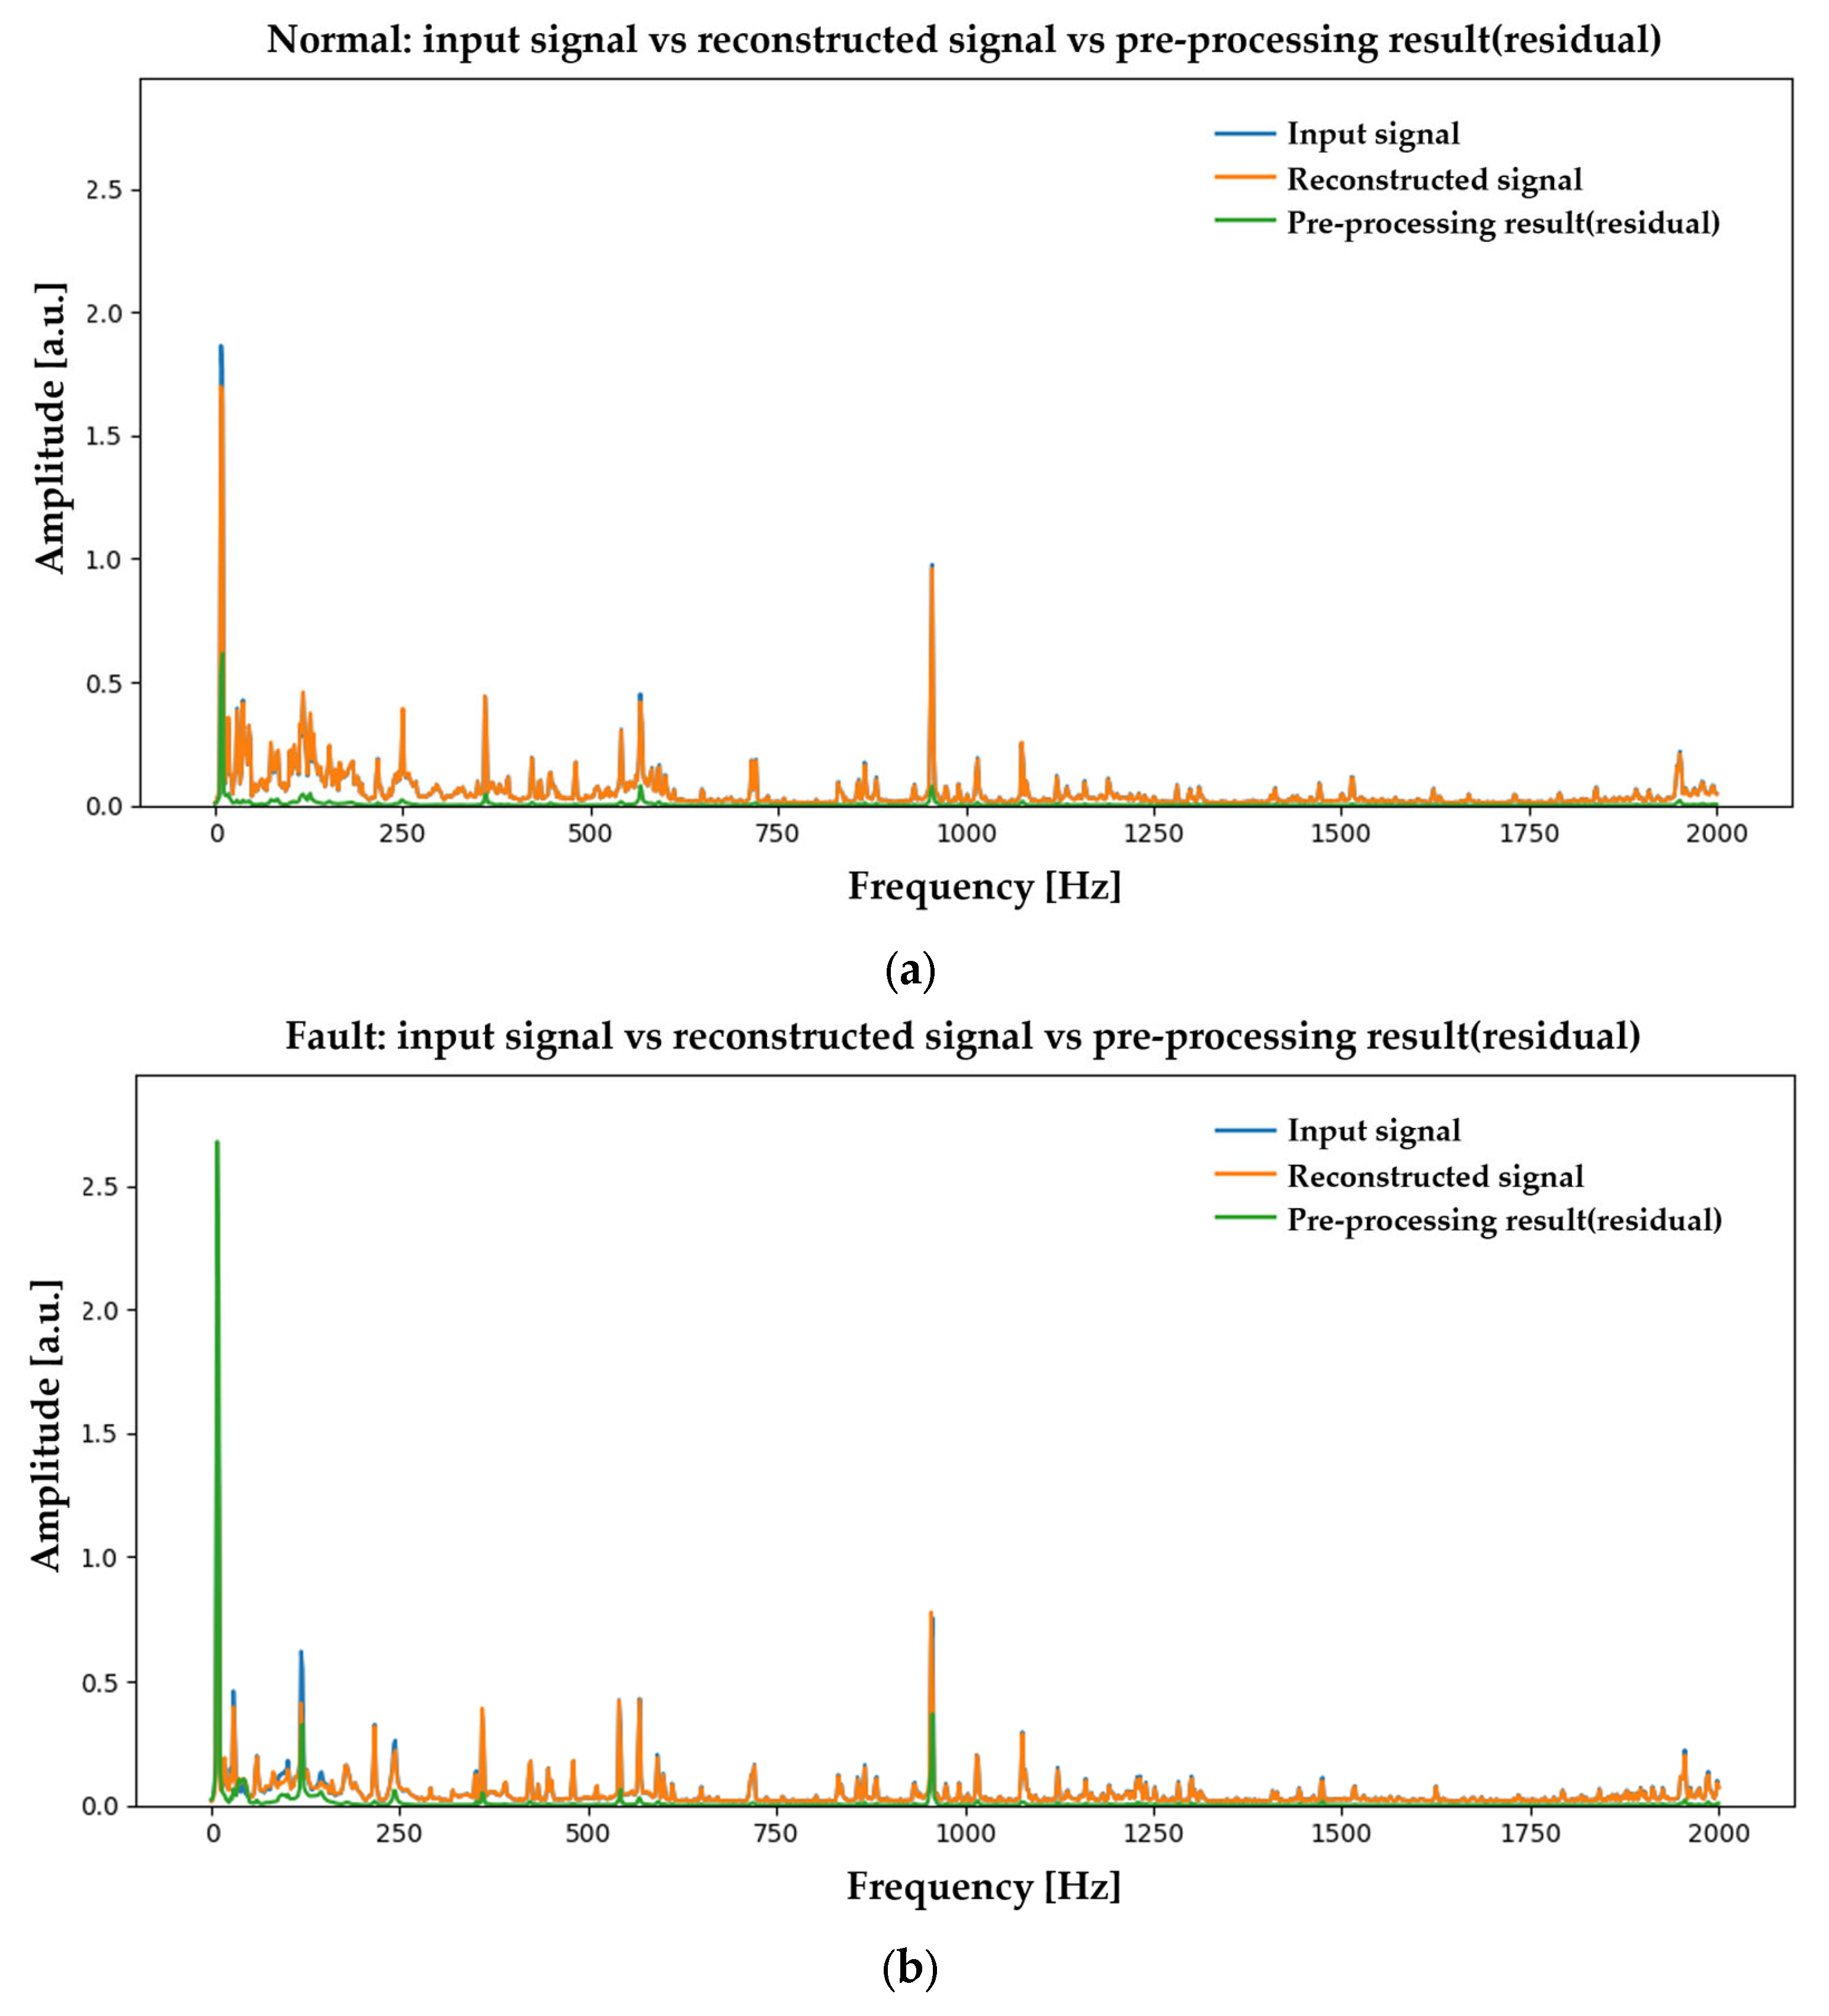
As shown in Figure A5 (Case 5), the residual remains overall low for the healthy segments, but under the lubricant-removed condition, the energy rises markedly in mid-/high-frequency ranges—most prominently 200–400 Hz and 400–800 Hz—along with a substantial increase in the relative amplitude of a few dominant spectral lines. In other words, both the residual-to-signal ratio and the prominence of the most dominant peak(s) increase under fault, and the energy concentration around the 400–800 Hz resonance band indicates impact-induced structural resonance, a characteristic symptom of bearing damage.

3.2.2. Feature Selection & Classification Results

As shown in Figure A10 for Case 2, the two top-ranked features quantify the residual energy fraction, relative to the healthy baseline, in two low-frequency bands (100–200 Hz and 0–50 Hz), thereby corroborating the low-frequency concentration of the residual energy. In particular, the 0–50 Hz band overlaps the fundamental (1 × ) and its harmonics/sidebands; its persistence after removal of the normal phase-aligned components indicates a clear low-frequency defect component.
As shown in Figure A13 for Case 5, the R S R ranked first and R Peak ranked second. The former reflects the marked increase in the residual energy share under fault, whereas the latter indicates that one dominant peak in the pre-processed spectrum becomes relatively more pronounced in the faulty condition.

3.3. Belt Looseness

Cases 3 and 8 concern belt looseness. Case 3 compares a healthy state and a belt-looseness state of a 2.2 kW blower, whereas Case 8 does so for a 5.5 kW blower. For both cases, we report the pre-processing result (residual) and the ensuing fault-classification outcome.

3.3.1. Data Preprocessing Results

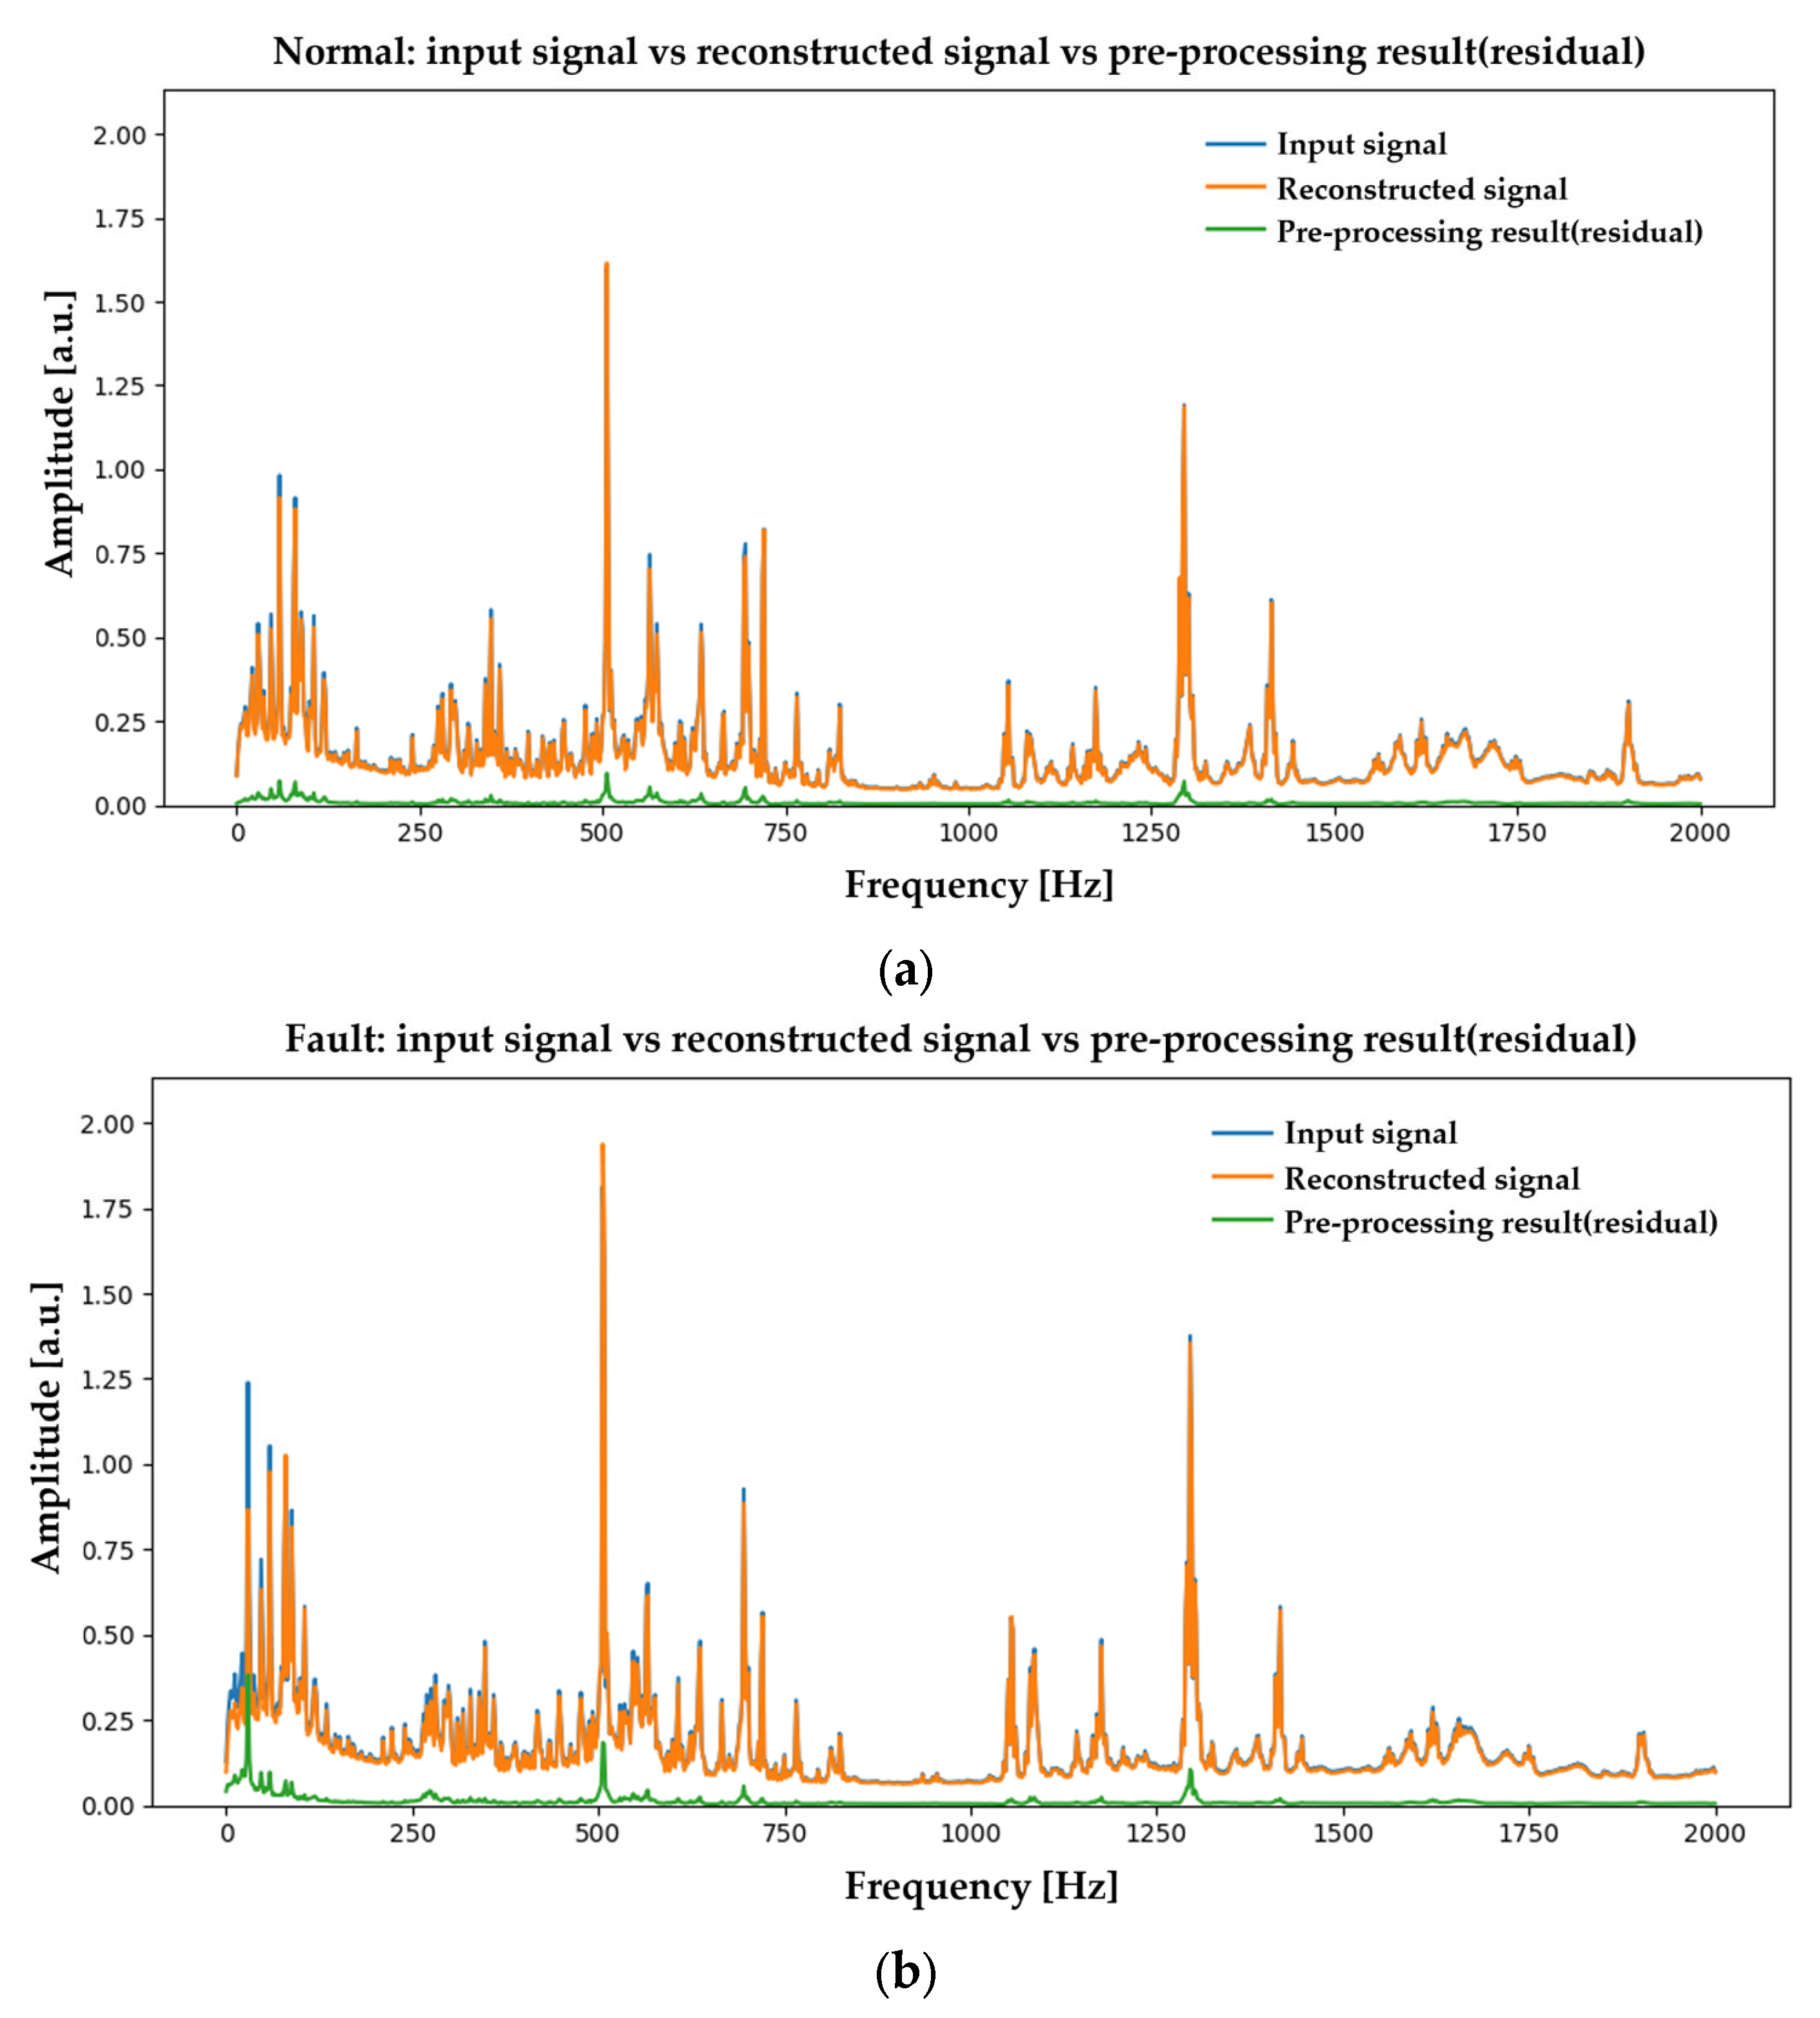
From Figure A3 (Case 3), the spectrum of the belt-looseness condition exhibits clear morphological departures from the healthy baseline in the 100–200 Hz and 400–800 Hz bands. In particular, the relative ordering of several low-/mid-frequency peaks is altered, and the fault average rises more prominently over a portion of the high-frequency range (≈1.6–1.8 kHz). For Case 8, as shown in Figure A8, belt looseness carries higher energy at low frequencies (notably 0–50 Hz) and in portions of the low-to-mid band; after pre-processing, the residual (green) remains appreciable over a broad range. In general, belt defects can introduce sub-synchronous and asynchronous components; because the belt traverses two pulleys, a 2× belt-frequency component may become dominant. Consequently, peaks at non-integral multiples of the shaft speed together with enhanced low-frequency content can be observed. In our data, the residual for Case 8 shows a relative increase within 0–50 Hz, which we interpret as a sub-synchronous pattern consistent with belt looseness.

3.3.2. Feature Selection & Classification Results

In Figure A11 (Case 3), the top two ranked features are d , B 100 , 200 and d , B 400 , 800 , indicating that—after phase alignment—the fraction of the total residual energy (orthogonal to the healthy subspace) attributable to the 100–200 Hz and 400–800 Hz bands increases under belt looseness. In Figure A16 (Case 8), R S R ranks first and R S T × p second, the overall residual-to-signal ratio rises most strongly, followed by the total orthogonal residual energy. Thus, band-specific changes dominate discrimination for Case 3, whereas broadband residual magnitude is more decisive for Case 8. This suggests that defect energy clusters in specific low-to-mid bands for Case 3, while broad low-frequency-centered changes occur for Case 8.

3.4. Unbalance

Case 4 pairs the normal condition of a 3.7 kW air handling unit (AHU) A with its unbalanced state, and Case 7 pairs the normal condition of a 5.5 kW AHU B with its unbalanced state. For both cases, we report the pre-processing residuals and the corresponding fault-classification outcomes.

3.4.1. Data Preprocessing Results

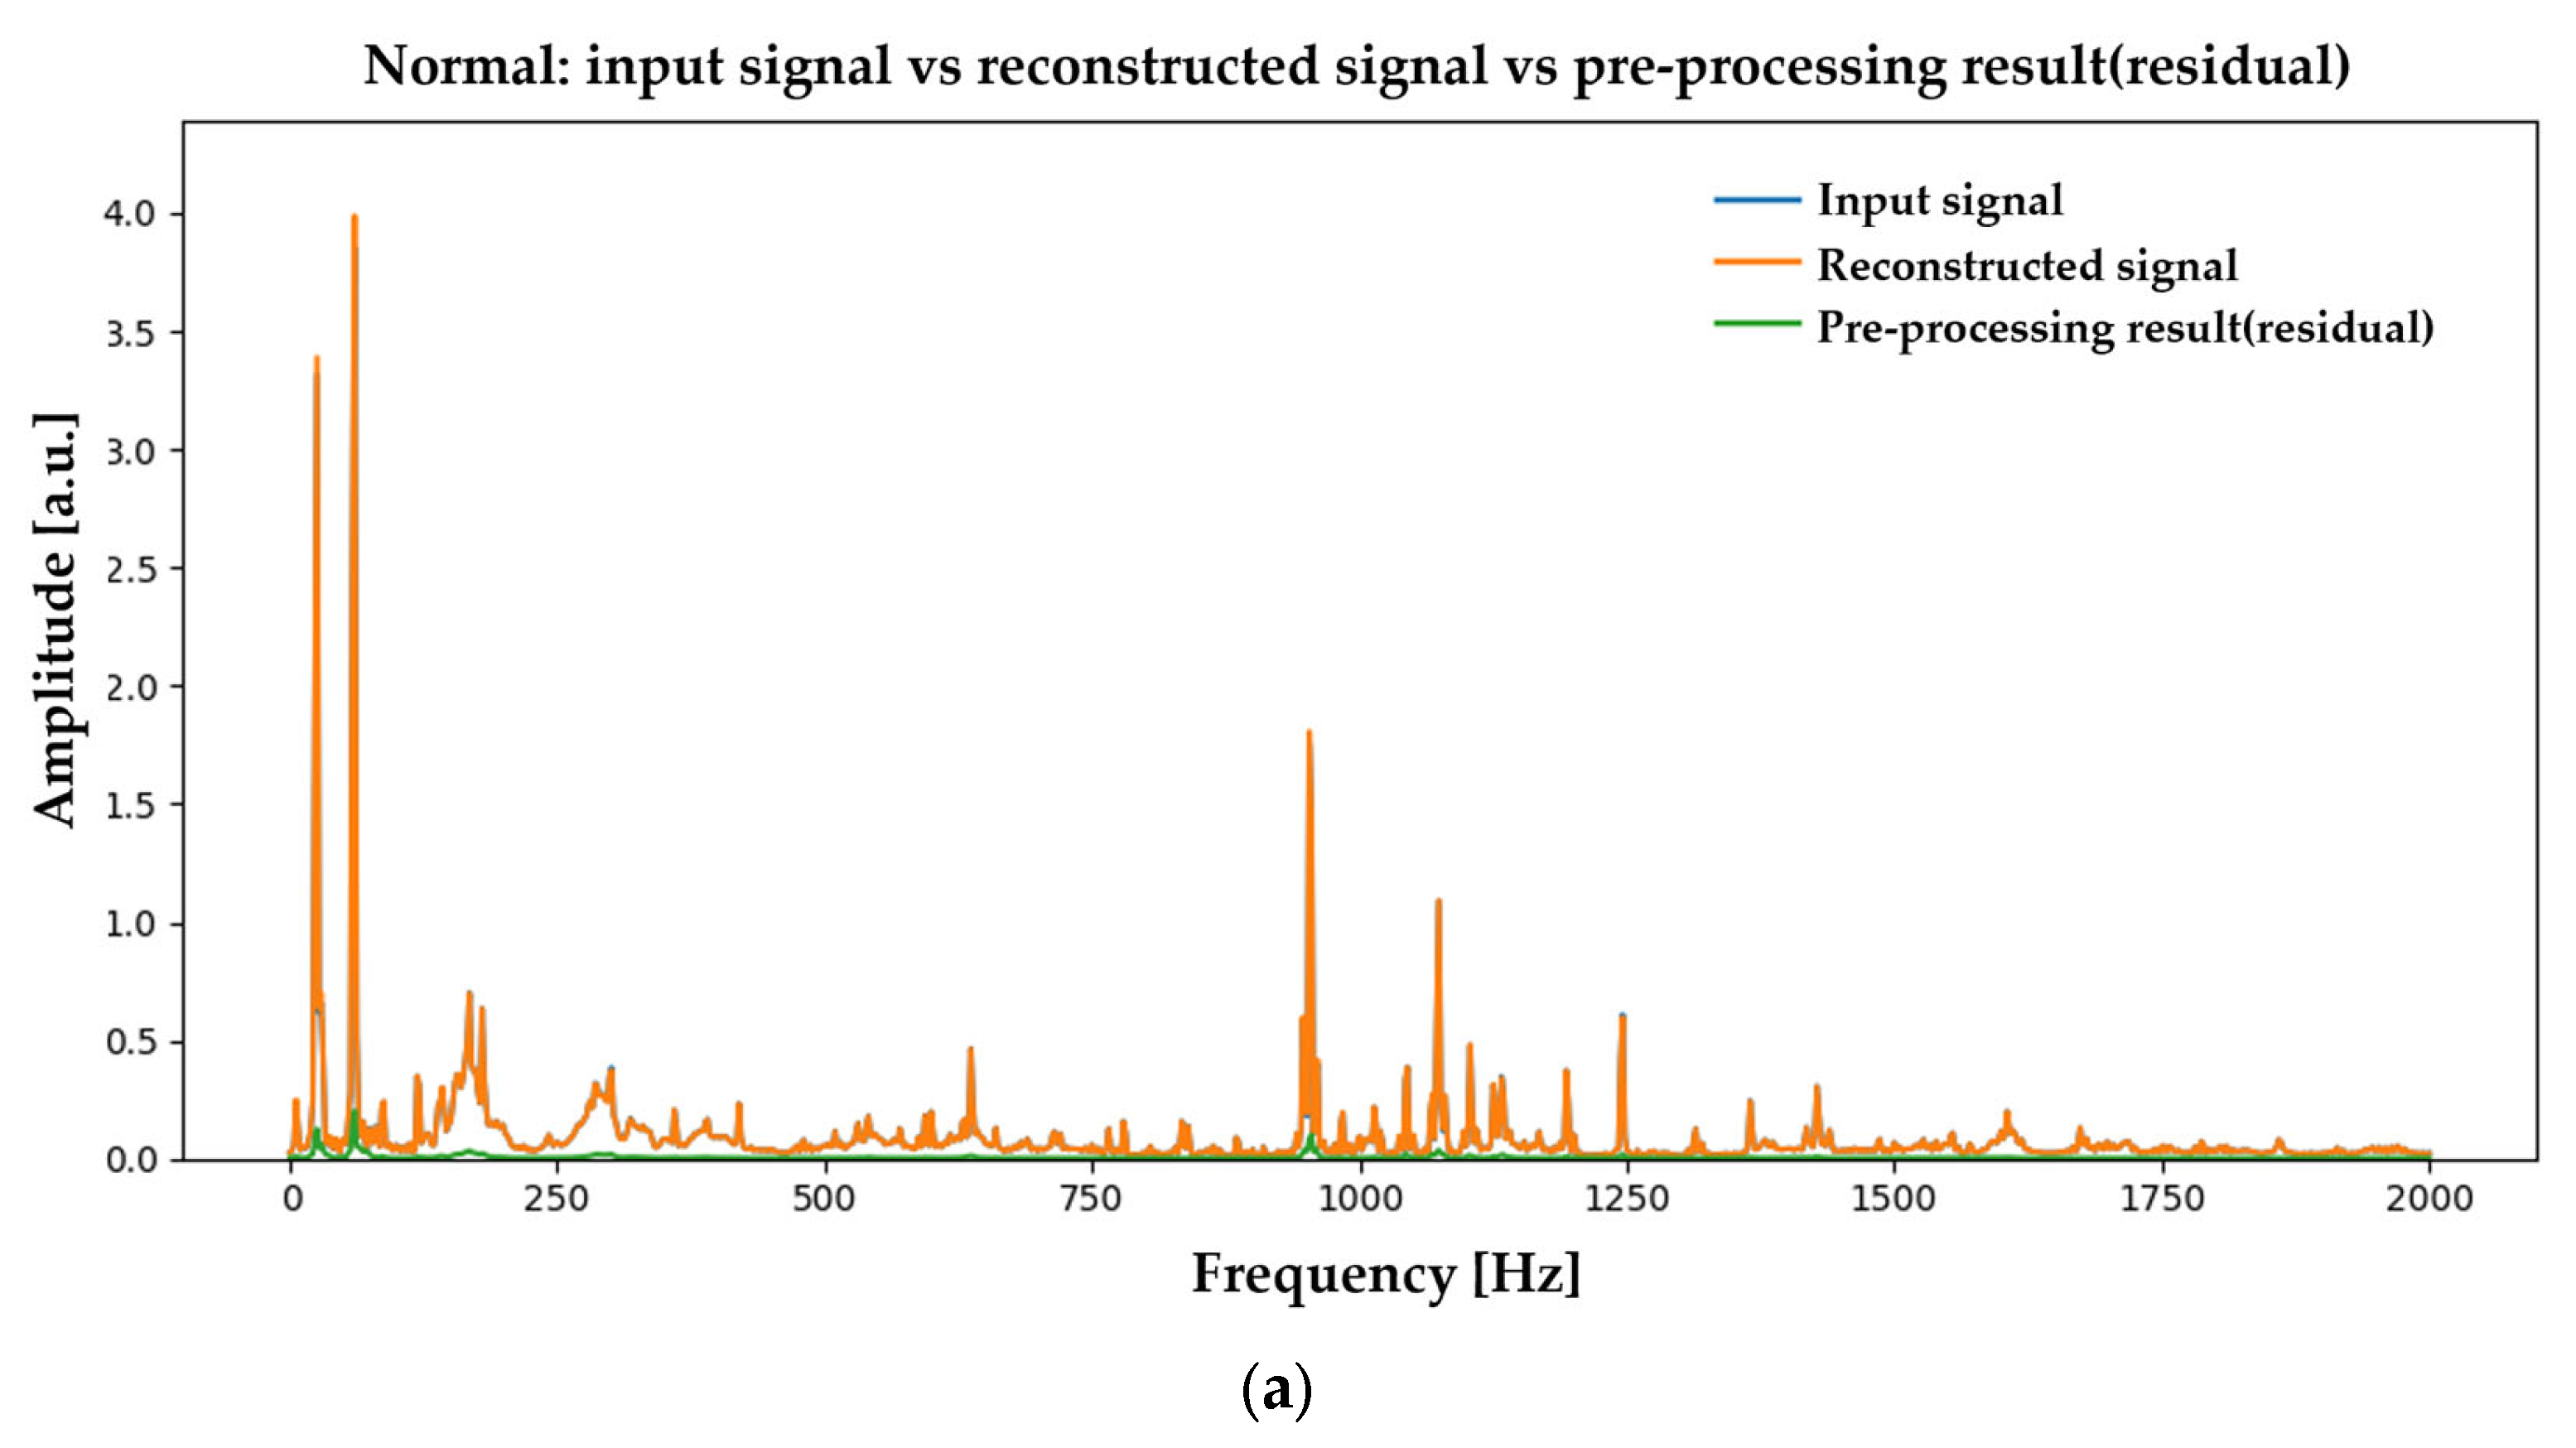
From Figure A4 (Case 4), the residual obtained after pre-processing the normal data remains low across the band, with a particularly shallow floor over ≈ 0–50 Hz. Under unbalance, by contrast, the residual (green) forms a distinct single peak in the low-frequency region at the 1× rotational component, and the residual level is markedly higher than that of the normal data at low frequency.
In Figure A7 (Case 7), the residual for the normal data is similarly low over the entire band and shows a very small low-frequency peak. Under unbalance, the residual exhibits a prominent single peak in the low-frequency range (again coincident with 1 × ), which is much larger than that of the normal condition.
Taken together, Cases 4 and 7 show that, even after removing normal components, out-of-phase (anti-phase) content remains concentrated at low frequency under unbalance. The dominance of the 1× RPM tone with comparatively small harmonics is consistent with the canonical spectral signature of rotor unbalance.

3.4.2. Feature Selection & Classification Results

As shown in Figure A12 (Case 4), the two highest-ranking features are centroid and B 0 , 50 . The downward shift in the spectral centroid indicates that the fault-energy distribution is significantly biased toward lower frequencies in the unbalanced state, consistent with a dominant 1× component; B 0 , 50 likewise emphasizes the increased energy share in the 0–50 Hz band where the unbalanced tone appears.
For Case 7 (Figure A15), the top two features are f Peak and B 0 , 50 . The former denotes the frequency of the largest spectral peak and, together with B 0 , 50 , again indicates that the unbalance-related 1 × component dominates the spectrum, as in Case 4.

4. Discussion

4.1. Overall Discriminative Performance (ROC-AUC)

As summarized in Table 5, the test ROC-AUC across all eight cases was 0.998–1.000, indicating threshold-free separability (AUC 0.998–1.000). The bootstrap 95% confidence intervals also concentrated near 1.0. ECE(test) 0.023 and Brier(test) 0.0228 except modest increases for Cases 4−5.

4.2. Threshold-Dependent Metrics (F1-Score, Confusion Matrix) and Error Characteristics

While the AUC was 0.998–1.000 for all cases (validation criterion), the F1-score was 1.000 in most cases, with only slight reductions for Case 4 (0.997) and Case 5 (0.996). Inspection of the confusion matrices shows that the decrease in F1-score for these two cases arose almost entirely from F → N errors. In other words, the operating threshold was tuned to keep false positives (specificity loss) nearly at zero, at the cost of increased false negatives (sensitivity loss). Calibration metrics (ECE and Brier score) were generally negligible but relatively larger in Case 4 and Case 5.

4.3. Calibration Quality and Drift

Overall probability calibration was good. In Table 5, ECE(test) ranged from 0.000 to 0.005 and Brier(test) from 0.0000 to 0.0039, both close to zero in most cases, with noticeable deviations only in Case 4 and Case 5. Calibration drift measured by Δ E C E > 0 was evident only for Case 4 (+0.003) and Case 5 (−0.011), suggesting a mild tendency toward under-confidence in these cases.

4.4. Accuracy, Balanced Accuracy, and Overall Weighted Summary

From the confusion-matrix counts (Table 6), accuracy (Acc) and balanced accuracy (bacc) per case were 99.4–100.00% and 99.5–100.00%, respectively. When weighted by the number of test patches per case, the overall summary was Acc ≈ 99.88% and bacc ≈ 99.90% (FP/FN = 6/40), with most errors concentrated in Cases 4–5. Errors were concentrated in Case 4 and Case 5, highlighting the importance of threshold-cost configuration.

4.5. Spectrum-Level Preprocessing Effects (Normal vs. Fault Frequency Bands)

From Figure A1, Figure A2, Figure A3, Figure A4, Figure A5, Figure A6, Figure A7 and Figure A8, normal segments exhibited high input-reconstruction overlap and a low residual floor, whereas fault segments consistently showed (i) an elevated low-frequency floor, (ii) resonance-pocket peaks, and (iii) spikes around harmonics. This indicates that the autoencoder reconstructs the linear/deterministic skeleton of normal patterns while pushing abnormal components into the residual.

4.6. Generalization Performance and Statistical Significance (LOFO, Permutation, Null)

Table 7 shows LOFO file-level accuracies mostly in the 0.994–1.000 range, with Case 5 slightly lower at 0.994. Thus, generalization remained strong even when an entire group was held out, although distribution dependence was somewhat stronger for Case 5. The permutation test on file-level aggregate scores (R = 2000) yielded p ≈ 0.00050, and the null test with label shuffling (R = 500) gave p ≈ 0.002 at A U C r e a l ≈ 0.999–1.000, rejecting the null that predictions carry no label information.

4.7. Overfitting Monitoring Results

Given the high classification performance, we verified that the results were not due to overfitting. As summarized in Table 8, the performance gap Δ A U C   =   v a l     t r a i n was 0.000 in most cases (Case 5: +0.002. Case 3: −0.001), indicating virtually no overfitting in discriminative power. Calibration drift Δ E C E   =   v a l     t r a i n was meaningfully positive only in Case 4 (+0.003) and Case 5 (−0.011)-that is, only the reliability of the probability calibration deteriorated for some domains/groups, precisely matching the ECE/Brier observations in Table 5.

4.8. Performance Comparison with Baselines

We quantitatively compared the proposed approach with a family of classic feature-based baselines. Performance was evaluated at the tile level using ROC-AUC and F1-score. The classic pipelines comprised (i) spectral kurtosis (SK) followed by envelope power spectral density (EnvPSD), harmonic/sideband features (H/SB), and cepstral features (Cep), coupled with Naïve Bayes (NB), logistic regression (Logit), or an SVM; and (ii) a fixed narrow-band variant, band-pass (BP, 0.8–1.6 kHz) + EnvPSD + H/SB + Cep with a Logit classifier (Classic-BP-Logit). For fairness, all baselines used exactly the same features introduced in Section 2.5, and we reported training-guided decision thresholds and tile-level confusion matrices in a common format.
Across all eight cases, the proposed method achieved ROC-AUCs of 0.998–1.000 and F1-scores of 0.996–1.000, indicating near-perfect, threshold-insensitive separability and good probability calibration (Table 5). The modest dip in F1-score was driven primarily by FN in Cases 4–5, a consequence of thresholds chosen to suppress FP. By contrast, the classic baselines exhibited strong case-dependent variability. Averaged over the eight cases, the proposed method (ROC-AUC 0.9999, F1-score 0.9993) outperformed Classic-NB (ROC-AUC 0.8666, F1-score 0.8212), Classic-Logit (ROC-AUC 0.9272, F1-score 0.9254), Classic-SVM (ROC-AUC 0.9736, F1-score 0.9305), and Classic-BP-Logit (ROC-AUC 0.5949, F1-score 0.4784). The BP–Logit variant frequently collapsed, yielding TN = 0 or a large number of FN in several cases. For example, in Case 5, NB effectively failed (ROC-AUC ≈ 0, F1-score = 0), whereas SVM remained acceptable (>0.96), underscoring the sensitivity of these pipelines to classifier choice and case particulars. Table 9 summarizes ROC-AUC and F1-scores for the proposed method and all classic baselines.

4.9. Consistency with Prior Work and Distinctive Contributions

To check consistency, we compared our findings with prior studies that used the AI Hub open dataset. The AI Hub predictive maintenance sensors for mechanical facilities literature commonly emphasizes preprocessing combined with traditional machine-learning classifiers (LR/KNN/SVM/RF/LGBM) [17], leverages representation learning in unsupervised/semi-supervised settings to mitigate label scarcity and class imbalance [18,21], and encodes 1D signals as images (GASF/GADF/MTF/RP) to feed CNNs for high accuracy [19,20]. Our design-learning to extract fault-components with an AE and making decisions with a compact classifier on residual features aligns with this trend of learned preprocessing that amplifies fault signatures before classification. In particular, Sung et al. [17] reported dramatic performance differences between models with and without preprocessing (F1-score ≈ 0.999–1.000 vs. Raw-signal Acc 52.8–96.7%), supporting our choice to place AE-based learned preprocessing at the core. (See Table 10 for the comparative summary.)
In line with prior work that fused image encoding with a lightweight CNN [19], many studies on bearing faults, rotor unbalance, and belt looseness have reported F1-scores around 0.99. However, for phase-sensitive defects such as shaft misalignment-where phase alignment and coherence are critical, the reported F1-score is relatively lower (≈0.948). In this study, under a vibration-only modality and a binary (normal vs. fault) setting, we achieved an area under the ROC curve (AUC) of 0.998–1.000 and F1-scores of 0.983–1.000. Notably, the misalignment cases (2.2/5.5 kW) were classified with F1-score = 1.000, confirming the advantage of exploiting explicit phase information. Nevertheless, because the prior studies summarized in Table 9 differ in sensor type (current vs. Vibration), task formulation (binary/multi-class/anomaly detection), and data-splitting protocols, a direct, absolute comparison of performance figures should be interpreted with caution.

4.10. Ablation Study

To quantify the contributions of the two key components—phase-orthogonality based on the input phase-ordering criterion and the mask–bias head (M, B)—we evaluated five variants: no-ortho-feats (phase-orthogonality-based features removed at inference), M = I (mask disabled by forcing the identity mask), B = 0 (bias disabled), phase-random (randomized input phase), and no- L (phase-orthogonal regularizer turned off during training). In the last variant, the phase-orthogonality regularizer was disabled only during training; the corresponding features were still used at inference. All other pipeline, training, and aggregation settings were held fixed (Train/Test split; classifier = Naive Bayes; features frozen; Top-K aggregation at 10%). Performance was assessed by ROC-AUC, F1-score, and ECE.
As summarized in Table 11, the proposed method achieved ROC-AUC 0.999 and F1-score 0.996 across all eight cases, with ECE predominantly in the 10 4 10 3 range, indicating near-perfect separability together with stable probability calibration. In contrast, M = I caused the largest degradation. For example, in Case 4, the F1-score fell from 0.9968 to 0.7685; in Case 5, the AUC dropped from 0.99997 to 0.8872, and ECE deteriorated to approximately 2.63 ×   10 1 , confirming that frequency- and spatio-temporal-selective gating is critical in noisy or overlapping spectra. For no-ortho-feats, ROC-AUC and F1-score were generally similar to the baseline, but ECE consistently increased (e.g., Case 2: 6.22 ×   10 3 ; Case 7: 3.02 ×   10 4 ), indicating a negative impact on calibration. Disabling the bias (B = 0) produced only minor accuracy changes yet raised ECE in some settings (e.g., Case 5, from ≈ 0.0037 to ≈ 0.0085), suggesting that retaining B benefits calibration stability. With phase-random, AUC tended to remain high, but F1/ECE worsened consistently (e.g., Case 8, ECE ≈ 9.39 ×   10 4 ), showing that indiscriminate phase perturbation harms classifier reliability. The effect of no- was case-dependent: several cases changed only marginally (e.g., Case 1 F1 = 0.9992, ECE = 4.16 ×   10 4 ; Case 3 AUC = 0.9985, ECE = 6.75 ×   10 4 ; Cases 6–8 with minor shifts), Case 2 was effectively unchanged (1.000/1.000/1.00 × 10 8 ), and Case 4 even improved to 1.000/1.000 (ECE ≈ 1.02 ×   10 4 ). However, Case 5 exhibited a clear drop (AUC 0.9830/F1 0.9541/ECE 5.24 ×   10 2 ), corroborated by a grouped-bootstrap ΔAUC ≈ −0.0169; p  < 0.001, indicating that L stabilizes learning, particularly in bearing-resonance-dominated or complex spectral conditions (Case 5).
As shown in Table 11, across all eight evaluation cases, the proposed method achieved ROC-AUC 0.999, F1-score 0.996, and ECE predominantly on the order of 10 4 10 3 , indicating near-perfect separability and stable probability calibration. In contrast, M = I (mask off) produced the most pronounced degradation. For example, in Case 4 (unbalance), the F1-score fell from 0.997 to 0.768, and in Case 5 (bearing fault), ROC-AUC dropped from 0.99997 to 0.88700, and ECE worsened from ≈0.003 to ≈0.205. These results underscore that the mask-gating mechanism, which applies frequency-selective and spatiotemporal-selective suppression/emphasis, provides decisive protection in spectra with noise/overlap.
In summary, mask gating is essential under complex spectra and low SNR; disabling it can precipitate severe performance collapse. Phase-orthogonality has little effect on average accuracy but improves calibration stability and interpretability. Retaining B yields small yet consistent ECE gains, while random phase manipulation degrades calibration and should be avoided. Disabling L can be harmless, neutral, or even mildly beneficial (Case 4), but may be risky in resonance-dominated environments (Case 5). These findings, together with Top-K aggregation, AUC confidence intervals, LOFO, and permutation/null testing, jointly support both the magnitude and the statistical reliability of the reported scores.

4.11. Limitations and Threats to Validity

Because faults were induced and the power-rating range was limited, additional validation is needed for naturally occurring faults and extreme operating conditions. We also observed slightly degraded calibration and divergent decision thresholds in Case 4 and Case 5, compared with the other cases. Specifically, the proposed method’s validation ECE was 0.00313 in Case 4 and 0.00469 in Case 5 (whereas many other cases were around ~10−8), suggesting minor calibration drift; the NB tile thresholds learned on TRAIN were also quite different (0.951 in Case 4 vs. 0.322 in Case 5), indicating domain shift possibly due to sensor/device calibration or operating conditions.
Ablation studies further showed that removing the spectral mask/orthogonalization steps leads to pronounced drops in these cases (e.g., in Case 4, No-Mask ECE 0.205/F1 0.768; in Case 5, No-Mask AUC 0.893/ECE 0.252/F1 0.863), underscoring their role in robustness against global spectral tilt/gain shifts.

5. Conclusions

This study proposed a preprocessing framework that combines a complex-spectrogram autoencoder (incorporating phase information) with phase-orthogonality regularization defined with respect to the input phasor. The framework reconstructs the normal component in a data-driven manner and separates the fault component as a residual. Using a U-Net-based AE with a mask-bias head, local amplitude/phase modulations in the time-frequency plane are finely corrected while restoring the normal pattern, and residual features-Magnitude/Shape, Frequency Distribution, and Normal-Manifold Projection (Parallel/Orthogonal)-are then exploited for normal-fault classification. A distinctive aspect of the design is its physical consistency: the decomposition is aligned to the input phase (parallel/orthogonal) rather than the fixed real-imaginary axes in the STFT. In the case studies, normal segments showed high overlap between input and reconstruction with a low residual floor, whereas fault segments exhibited consistent residual patterns that varied with fault type and rating, such as a rise in the low-frequency floor, local peaks in resonance pockets, and spikes around principal harmonics (see the frequency-domain comparison figures).
Even with only the top-2 residual features, the method achieved strong separability. Leave-one-file-out (LOFO) validation, together with calibration metrics (ECE and Brier), confirmed both generalization performance and probabilistic reliability. For certain equipment-fault combinations, predictive probabilities tended to be slightly conservative (under-confident), indicating a need for calibration against domain shift. Overall, the proposed preprocessing complements rule-based and filter-based approaches and offers interpretability that is readily applicable to field data through the physical meaning of residual features.
As future work, we will extend the approach beyond binary normal-fault decisions to multi-type fault diagnosis (e.g., bearing defects, unbalance, misalignment, and belt looseness). Concretely, we plan to develop a prototype and metric-learning-based multiclass decision rules using frequency-band features of the residual and the distribution of components orthogonal to the normal manifold. We will incorporate domain adaptation to absorb inter-case differences in motor operating conditions and calibrate small-sample regimes (per line or per facility). In addition, we will optimize thresholds by fault type using an adaptive Youden index and progressively introduce hybrid rule-and-learning pipelines that encode physical knowledge (e.g., bearing defect frequencies and 1×/2× harmonics where 1× denotes the rotational frequency), with the goal of a fully automated fault-type diagnostic system.

Author Contributions

Conceptualization, S.-y.Y. and S.-s.L.; methodology, S.-y.Y.; software, S.-y.Y. and Y.-n.L.; validation, S.-y.Y., J.-c.L. and S.-y.H.; formal analysis, S.-y.Y., Y.-n.L. and J.-y.L.; investigation, S.-y.Y., Y.-n.L. and J.-y.L.; resources, S.-y.Y.; data curation, S.-y.Y., Y.-n.L. and J.-y.L.; writing—original draft preparation, S.-y.Y.; writing—review and editing, S.-y.Y., J.-c.L. and S.-y.H.; visualization, S.-y.Y.; supervision, S.-s.L., J.-c.L. and S.-y.H.; project administration, S.-s.L. All authors have read and agreed to the published version of the manuscript.

Funding

This research received no external funding.

Data Availability Statement

The AI Hub open dataset “Predictive Maintenance Sensors for Mechanical Facilities” is available after registration at the AI Hub portal. Detailed specifications and access instructions are provided in the official documentation. Available online: https://www.aihub.or.kr/aihubdata/data/view.do?pageIndex=1&currMenu=115&topMenu=100&srchOptnCnd=OPTNCND001&searchKeyword=&srchDetailCnd=DETAILCND001&srchOrder=ORDER003&srchPagePer=20&srchDataRealmCode=REALM005&aihubDataSe=data&dataSetSn=238 (accessed on 9 August 2025).

Conflicts of Interest

The authors declare no conflicts of interest.

Appendix A

After training and validation, the test-set results for Cases 1–8 are presented as frequency-domain plots of the short-time Fourier transform (STFT). For each case and for both normal and faulty data, we show the STFT of the input signal (blue), the STFT of the reconstructed signal (orange), and the pre-processing residual (green), defined as the difference between the input and reconstructed STFTs.
Figure A1. Frequency domain comparison of case 1: (a) 2.2 kW misalignment-normal. (b) 2.2 kW misalignment-fault.
Machines 13 00945 g0a1
Figure A2. Frequency domain comparison of case 2: (a) 2.2 kW bearing fault-normal. (b) 2.2 kW bearing fault-fault.
Machines 13 00945 g0a2
Figure A3. Frequency domain comparison of case 3: (a) 2.2 kW belt looseness-normal. (b) 2.2 kW belt looseness-fault.
Machines 13 00945 g0a3aMachines 13 00945 g0a3b
Figure A4. Frequency domain comparison of case 4: (a) 3.7 kW unbalance-normal. (b) 3.7 kW unbalance-fault.
Machines 13 00945 g0a4
Figure A5. Frequency domain comparison of case 5: (a) 3.7 kW bearing fault-normal. (b) 3.7 kW bearing fault-fault.
Machines 13 00945 g0a5
Figure A6. Frequency domain comparison of case 6: (a) 5.5 kW misalignment-normal. (b) 5.5 kW misalignment-fault.
Machines 13 00945 g0a6aMachines 13 00945 g0a6b
Figure A7. Frequency domain comparison of case 7: (a) 5.5 kW unbalance-normal. (b) 5.5 kW unbalance-fault.
Machines 13 00945 g0a7
Figure A8. Frequency domain comparison of case 8: (a) 5.5 kW belt looseness-normal. (b) 5.5 kW belt looseness-fault.
Machines 13 00945 g0a8

Appendix B

For Cases 1–8, scatter plots of the top two features extracted from the pre-processing residuals, together with the corresponding classification outcomes, are provided; normal samples are plotted in blue and faulty samples in orange.
Figure A9. Top-2 features and P(fault) histogram for Case 1: (a) Feature distribution R S T × p . (b) Feature distribution ρ P / O . (c) P(fault) histogram.
Machines 13 00945 g0a9
Figure A10. Top-2 features and P(fault) histogram for Case 2: (a) Feature distribution d , B 100 , 200 . (b) Feature distribution d , B 0,50 . (c) P(fault) histogram.
Machines 13 00945 g0a10
Figure A11. Top-2 features and P(fault) histogram for Case 3: (a) Feature distribution d , B 100 , 200 . (b) Feature distribution d , B 400 , 800 . (c) P(fault) histogram.
Machines 13 00945 g0a11
Figure A12. Top-2 features and P(fault) histogram for Case 4: (a) Feature distribution centroid. (b) Feature distribution d , B 0 , 50 . (c) P(fault) histogram.
Machines 13 00945 g0a12
Figure A13. Top-2 features and P(fault) histogram for Case 5: (a) Feature distribution R S R . (b) Feature distribution R Peak . (c) P(fault) histogram.
Machines 13 00945 g0a13
Figure A14. Top-2 features and P(fault) histogram for Case 6: (a) Feature distribution d , B 800 , 1600 . (b) Feature distribution d , B 1600 , 2000 . (c) P(fault) histogram.
Machines 13 00945 g0a14
Figure A15. Top-2 features and P(fault) histogram for Case 7: (a) Feature distribution f Peak . (b) Feature distribution B 0 , 50 . (c) P(fault) histogram.
Machines 13 00945 g0a15
Figure A16. Top-2 features and P(fault) histogram for Case 8: (a) Feature distribution R S R . (b) Feature distribution R S T × p . (c) P(fault) histogram.
Machines 13 00945 g0a16

References

  1. Tavner, P.J. Review of condition monitoring of rotating electrical machines. IET Electr. Power Appl. 2008, 2, 215–247. [Google Scholar] [CrossRef]
  2. Gangsar, P.; Tiwari, R. Signal based condition monitoring techniques for fault detection and diagnosis of induction motors: A state-of-the-art review. Mech. Syst. Signal Process. 2020, 144, 106908. [Google Scholar] [CrossRef]
  3. Kim, S.; An, D.; Choi, J.-H. Diagnostics 101: A Tutorial for Fault Diagnostics of Rolling Element Bearing Using Envelope Analysis in MATLAB. Appl. Sci. 2020, 10, 7302. [Google Scholar] [CrossRef]
  4. Wang, Y.; Xiang, J.; Markert, R.; Liang, M. Spectral kurtosis for fault detection, diagnosis and prognostics of rotating machines: A review with applications. Mech. Syst. Signal Process. 2016, 66–67, 679–698. [Google Scholar] [CrossRef]
  5. Antoni, J. Fast computation of the kurtogram for the detection of transient faults. Mech. Syst. Signal Process. 2007, 21, 108–124. [Google Scholar] [CrossRef]
  6. Peeters, C.; Guillaume, P.; Helsen, J. A Comparison of Cepstral Editing Methods as Signal Pre-Processing Techniques for Vibration-Based Bearing Fault Detection. Mech. Syst. Signal Process. 2017, 91, 354–381. [Google Scholar] [CrossRef]
  7. Kiakojouri, A.; Lu, Z.; Mirring, P.; Powrie, H.; Wang, L. A Novel Hybrid Technique Combining Improved Cepstrum Pre-Whitening and High-Pass Filtering for Effective Bearing Fault Diagnosis Using Vibration Data. Sensors 2023, 23, 9048. [Google Scholar] [CrossRef]
  8. Chen, J.; Li, Z.; Pan, J.; Chen, G.; Zi, Y.; Yuan, J.; Chen, B.; He, Z. Wavelet transform based on inner product in fault diagnosis of rotating machinery: A review. Mech. Syst. Signal Process. 2016, 70–71, 1–35. [Google Scholar] [CrossRef]
  9. Li, H.; Liu, T.; Wu, X.; Chen, Q. Application of EEMD and Improved Frequency Band Entropy in Bearing Fault Feature Extraction. ISA Trans. 2019, 88, 170–185. [Google Scholar] [CrossRef]
  10. Jia, Y.; Li, G.; Dong, X.; He, K. A novel denoising method for vibration signal of hob spindle based on EEMD and grey theory. Measurement 2021, 169, 108490. [Google Scholar] [CrossRef]
  11. Kumar, A.; Kumar, R. Role of signal processing, modeling and decision making in the diagnosis of rolling element bearing defect: A review. J. Nondestruct. Eval. 2019, 38, 5. [Google Scholar] [CrossRef]
  12. Wei, Y.; Li, Y.; Xu, M.; Huang, W. A review of early fault diagnosis approaches and their applications in rotating machinery. Entropy 2019, 21, 409. [Google Scholar] [CrossRef] [PubMed]
  13. Park, H.J.; Sim, J.; Jang, J.; Jang, K.-H.; Seol, J.-W.; Kwon, J.-Y.; Choi, J.-H. Study on Fault Severity Diagnosis of Planetary Gearbox in Unmanned Aerial Vehicle using Artificial Neural Network. J. Appl. Reliab. 2021, 21, 329–340. [Google Scholar] [CrossRef]
  14. Verstraete, D.; Ferrada, A.; Droguett, E.L.; Meruane, V.; Modarres, M. Deep Learning Enabled Fault Diagnosis Using Time-Frequency Image Analysis of Rolling Element Bearings. Shock Vib. 2017, 2017, 5067651. [Google Scholar] [CrossRef]
  15. Jiang, G.; He, H.; Xie, P.; Tang, Y. Stacked multilevel-denoising autoencoders: A new representation learning approach for wind turbine gearbox fault diagnosis. IEEE Trans. Instrum. Meas. 2017, 66, 2391–2402. [Google Scholar] [CrossRef]
  16. Pandey, A.; Wang, D.L. Exploring deep complex networks for complex spectrogram enhancement. In Proceedings of the ICASSP 2019—2019 IEEE International Conference on Acoustics, Speech, and Signal Processing (ICASSP), Brighton, UK, 12–17 May 2019. [Google Scholar] [CrossRef]
  17. Sung, S.-H.; Hong, S.; Choi, H.-R.; Park, D.-M.; Kim, S. Enhancing Fault Diagnosis in iot Sensor Data through Advanced Preprocessing Techniques. Electronics 2024, 13, 3289. [Google Scholar] [CrossRef]
  18. Seo, J.; Park, J.; Yoo, J.; Park, H. Anomaly Detection System in Mechanical Facility Equipment: Using Long Short-Term Memory Variational Autoencoder. J. Korean Soc. Qual. Manag. 2021, 49, 581–594. [Google Scholar] [CrossRef]
  19. An, D.; Shin, J.; Lee, S. A Lightweight Deep Learning Model based on Image Encoding for Failure Classification of Motor Mechanical Facilities. J. Inst. Electron. Inf. Eng. 2022, 59, 57–63. [Google Scholar] [CrossRef]
  20. Lee, S.; Ko, S.; Lee, S. Fault Classification Model Based on Deep Learning Using Vibration Data of Mechanical Equipment. J. Korean Inst. Next Gener. Comput. 2022, 18, 36–46. [Google Scholar] [CrossRef]
  21. Sim, Y.; Choi, J.; Kim, B.; Im, S. Outlier Detection Based on Multivariate Kernel Density Estimation in Induction Motors. In Proceedings of the 2nd Korea Artificial Intelligence Conference (Korea AI Conf.), Jeju, Republic of Korea, 29 September–1 October 2021; pp. 337–338. [Google Scholar]
  22. Li, X.; Xiao, S.; Zhang, F.; Huang, J.; Xie, Z.; Kong, X. A fault diagnosis method with AT-ICNN based on a hybrid attention mechanism and improved convolutional layers. Appl. Acoust. 2024, 225, 110191. [Google Scholar] [CrossRef]
  23. Hua, L.; Qiang, Y.; Gu, J.; Chen, L.; Zhang, X.; Zhu, H. Mechanical Fault Diagnosis Using Color Image Recognition of Vibration Spectrogram Based on Quaternion Invariant Moments. Math. Probl. Eng. 2015, 2015, 1–11. [Google Scholar] [CrossRef]
  24. Hu, Y.; Liu, Y.; Lv, S.; Xing, M.; Zhang, S.; Fu, Y.; Wu, J.; Zhang, B.; Xie, L. DCCRN: Deep Complex Convolution Recurrent Network for Phase-Aware Speech Enhancement. In Proceedings of the Interspeech 2020, Shanghai, China, 25–29 October 2020. [Google Scholar] [CrossRef]
Figure 1. The data aggregation and re-partitioning process.
Machines 13 00945 g001
Figure 2. Phase-aware complex spectrogram AE with phasor-rotation regularization.
Machines 13 00945 g002
Figure 3. Fault-aware normal extractor.
Machines 13 00945 g003
Table 1. Selected motor cases from the AI Hub condition monitoring dataset used in this study.
CasePower (kW)Failure ModeTarget EquipmentNameRPM
12.2Misalignment
(shaft misaligned by +5 mm/+4 mm)
BlowerL-DSF-011730
22.2Bearing fault
(lubricant-removed from bearing)
Blower AL-SF-041760
32.2Belt looseness
(belt removed, motor shifted 5 mm)
BlowerR-SF-031760
43.7Unbalance
(added rotor imbalance weight)
Air Handling Unit AL-PAC-011750
53.7Bearing fault
(lubricant-removed from bearing)
Blower AL-EF-021755
65.5Misalignment
(shaft misaligned by +5 mm/+4 mm)
BlowerR-SF-011765
75.5Unbalance
(added rotor imbalance weight)
Air Handling Unit BR-CAHU-01R1760
85.5Belt looseness
(belt removed, motor shifted 5 mm)
BlowerL-SF-011765
Table 2. Dataset & validation summary.
CaseFailure ModePower
/RPM
Files
(N/F)
Samples
(N/F)
STFT Frames T
(N/F)
Patches
(N/F)
Validation Speed
(it/s, N/F)
1Misalignment2.2 kW
/1730
998
/2066
11,976,000/24,792,00011,694
/24,209
1460
/3025
2.89
/2.87
2Bearing fault2.2 kW
/1760
838
/2397
10,056,000/28,764,0009819
/28,088
1226
/3510
3.37
/2.91
3Belt looseness2.2 kW
/1760
1329
/1707
15,948,000/20,484,00015,573
/20,002
1945
/2499
9.28
/9.63
4Unbalance3.7 kW
/1750
2095
/2027
25,140,000/24,324,00024,549
/23,752
3067
/2968
10.21
/10.61
5Bearing fault3.7 kW
/1755
1011
/2171
12,132,000/26,052,00011,846
/25,440
1479
/3179
9.14
/9.44
6Misalignment5.5 kW
/1765
12,089
/16,000
145,068,000/192,000,000141,666/187,49917,707
/23,436
9.61
/10.71
7Unbalance5.5 kW
/1760
13,369
/16,000
160,428,000/192,000,000156,666/187,49919,582
/23,436
8.85
/9.24
8Belt looseness5.5 kW
/1765
13,025
/14,877
156,300,000/178,524,000152,635/174,33819,078
/21,791
3.03
/3.05
Abbreviations—N: normal; F: fault; it/s: iterations per second.
Table 3. Hyperparameters.
CategoryItemValue/Description
Input N F F T , hop, window 2048 ,   1024 ,   H a n n
PatchT (frames), channels 16 ,   [ R X ,   I ( X ) ]
Common blockConv-BN-GELU 3   × 3, padding = 1
Down/UpDown/upStride-2 Conv/bilinear + Conv
U-Net (teacher)Base_ch, depth64, 4-stage encoder–decoder
Output (teacher)Out-ch 2 ch   ( R X ,   I ( X ) )
Affine head (student)Head-ch4ch
( R M ,   I M ,   R B ,   I B )
Affine constraints m m a x 1.5
OptimizationAdamw, early-stopValidation-MAE, patience = 30,
Δ   =   1 × 10 4
AMP/Hardwaredtype, HWbf16, A100 40 GB
Abbreviations— N F F T : number of points in the fast Fourier transform; BN: batch normalization; GELU: Gaussian error linear unit; MAE: mean absolute error; AMP: automatic mixed precision; dtype: data type; HW: hardware; bf16: bfloat16.
Table 4. Evaluation protocol summary used in this study.
CategoryItemSetting/MethodNotes
DatasplitTraining
/Internal validation
Public training set,
70/30 stratified split
Maintain class/case balance
Independent testPublic validation set,
Entirely used
Prevent information leakage
Cross-validationLOFOFile-level generalization check
Classification
Performance
ROC-AUCReport with bootstrap
95% CI
Threshold-invariant
Performance
F1-scoreComputed at the optimal thresholdBalances precision and recall
Confusion matrixReport
TP/FP/FN/TN
Identifies error patterns
CalibrationECEExpected Calibration ErrorCloser to 0 is better
Brier scoreMean squared error of
Probabilistic predictions
Closer to 0 is better
Generalization
/statisticaltests
LOFO file-level accuracyAccuracy with file-level holdoutChecks split bias
Permutation testLabel-shuffle p-valueRules out chance performance
Null testPerformance against
No-information inputs
Detects overfitting/bias
Overfitting
Prevention
RegularizationAdamW weight decay (L2)Weight-level regularization
Early stoppingValidation MAE criterionPrevents overfitting
Normal-region regularizerIdentity preservation on normal segmentsPreserves normal patterns
Overfittingdetection (monitoring)Performance gapTrain-test AUC gapGeneralization drop
Indicator
Calibration driftECE change over trainingOver/under-confidence
Indicator
Abbreviations—TP: true positives; FP: false positives; FN: false negatives; TN: true negatives.
Table 5. Classification performance & calibration.
CaseROC-AUC
(Train/Test)
AUC 95% CI
(Bootstrap)
F1-ScoreConfusionECE
(Train/Test)
Brier Score (Train/Test)
11.000
/1.000
1.000–1.0001.000 N N = 1.000
N F = 0.000
F N = 0.000
F F = 1.000
0.000
/0.000
0.0000/0.0000
21.000
/1.000
1.000–1.0001.000 N N = 1.000
N F = 0.000
F N = 0.000
F F = 1.000
0.000
/0.000
0.0001/0.0000
31.000
/0.999
0.999–1.0001.000 N N = 0.999
N F = 0.001
F N = 0.000
F F = 1.000
0.000
/0.000
0.0001/0.0004
41.000
/1.000
1.000–1.0000.997 N N = 1.000
N F = 0.000
F N = 0.006
F F = 0.994
0.000
/0.003
0.0001/0.0031
50.998
/1.000
1.000–1.0000.996 N N = 0.997
N F = 0.003
F N = 0.007
F F = 0.963
0.016
/0.005
0.0172/0.0039
61.000
/1.000
1.000–1.0001.000 N N = 1.000
N F = 0.000
F N = 0.000
F F = 1.000
0.000
/0.000
0.0001/0.0001
71.000
/1.000
0.999–1.0001.000 N N = 1.000
N F = 0.000
F N = 0.000
F F = 1.000
0.000
/0.000
0.0002/0.0002
81.000
/1.000
1.000–1.0001.000 N N = 1.000
N F = 0.000
F N = 0.000
F F = 1.000
0.000
/0.000
0.0000/0.0000
Table 6. Acc & balanced Acc results.
CaseAcc
(%)
Balanced Acc
(%)
FP
(N→F)
FN
(F→N)
Number of
Test Patches
1100.0100.0004485
2100.0100.0004736
3100.0100.0204444
499.799.70186035
599.499.54224658
6100.0100.0000041,143
7100.0100.0000043,018
8100.0100.0000040,869
Table 7. Generalization and statistical tests.
CaseLOFOPermutation Test
(p, R = 2000)
Null Test
(p, R = 500)
11.000<0.0005<0.002
21.000<0.0005<0.002
31.000<0.0005<0.002
41.000<0.0005<0.002
50.994<0.0005<0.002
61.000<0.0005<0.002
71.000<0.0005<0.002
81.000<0.0005<0.002
Table 8. Overfitting detection (monitoring).
CasePerformance Gap
( Δ A U C = v a l t r a i n )
Calibration Drift
( Δ E C E = v a l t r a i n )
10.0000.000
20.0000.000
3−0.0010.000
40.000+0.003
5+0.002−0.011
60.0000.000
70.0000.000
80.0000.000
Table 9. ROC-AUC and F1-scores for the proposed method and all classic baselines.
CaseProposed Full
(ROC-AUC/F1-Score)
NB
(ROC-AUC/F1-Score)
Logit
(ROC-AUC/F1-Score)
SVM
(ROC-AUC/F1-Score)
BP-Logit
(ROC-AUC/F1-Score)
11.000000/1.0000001.000000/1.000001.000000/1.000001.000000/0.992780.049978/0.00000
21.000000/1.0000000.963850/0.850900.964972/0.851320.964972/0.851320.626469/0.85132
30.999486/0.9996000.970200/0.719860.452837/0.719680.824507/0.719860.080720/0.00000
41.000000/0.996789 0.998864/0.998991.000000/0.999831.000000/0.997480.997184/0.65934
50.999971/0.9981110.000237/0.000001.000000/0.832321.000000/0.962300.004541/0.12746
60.999887/0.999893 0.999944/0.999981.000000/1.000001.000000/0.999791.000000/0.72581
70.999744/0.999829 1.000000/1.000001.000000/1.000000.999515/0.923810.999924/0.70533
81.000000/1.0000001.000000/1.000001.000000/1.000001.000000/0.996621.000000/0.75814
Table 10. Comparative results on the AI Hub open dataset (Predictive maintenance sensors for mechanical facilities).
No.StudySensorTaskMethod (Traditional/DL)Reported Test Metric(s)
1This
Paper
VibrationBinary
(normal vs. fault)
Complex-spectrogram AE + phase-orthogonality regularization. 2 residual features + simple classifierROC-AUC 0.998–1.000
F1-score 0.983–1.000
LOFO 0.980–1.000
ECE 0.000–0.023
Brier 0.0000–0.0228
2[17]Vibration/CurrentBinary (per-fault)Preprocessing (noise reduction & spectrum augmentation) + LR/KNN/SVM/RF/LGBMAfter preprocessing
F1-score ≈ 0.999–1.000 (tree models)
Without preprocessing
Acc 52.8–96.7%
3[18]Vibration/CurrentAnomaly detectionLSTM-VAE (unsupervised) vs. IF/OC-SVM/AEAccuracy > 97% (two scenarios)
4[19]CurrentMulti/BinaryTime-series → image (GASF/GADF/MTF/RP) + CNNBearing F1-score 0.999/Acc 0.998
Rotor F1-score 0.996
Belt F1-score 0.990
Misalignment F1-score 0.948
5[20]VibrationMulti13 DL time-series classifiers comparedCNN variants reported near-100%
Acc/Prec/Rec/F1-score
(abstract level)
6[21]CurrentAnomaly detectionFFT/THD features + MKDE (non-parametric density) Accuracy   98.93 %   ( test   n = 5974)
Abbreviations—IF: isolation forest; OC-SVM: one-class SVM; FFT: fast Fourier transform; THD: total harmonic distortion.
Table 11. Ablation of phase-orthogonality and the mask–bias head: case-wise ROC-AUC, F1-score, and ECE.
CaseProposed Full
(ROC-AUC/F1-Score/ECE)
No-Ortho-Feats
(ROC-AUC/F1-Score/ECE)
M = I (No-Mask)
(ROC-AUC/F1-Score/ECE)
B = 0 (No-Bias)
(ROC-AUC/F1-Score/ECE)
Phase-Random
(ROC-AUC/F1-Score/ECE)
No - L
(ROC-AUC/F1-Score/ECE)
11.000000/1.000000/
1.00   × 10 8
1.000000/1.000000/
1.01   × 10 8
1.000000/0.999835/
4.41   × 10 5
1.000000/1.000000/
1.00   × 10 8
1.000000/1.000000/
1.00   × 10 8
1.000000/0.999174/
4.16   × 10 4
21.000000/1.000000/
1.00   × 10 8
0.999928/0.998006/
6.22   × 10 3
1.000000/1.000000/
1.00 × 10 8
1.000000/1.000000/
1.00 × 10 8
1.000000/1.000000/
1.00   × 10 8
1.000000/1.000000/
1.00   × 10 8
30.999486/0.999600/
4.43   × 10 4
0.998972/0.999600/
6.75   × 10 4
1.000000/0.999800/
2.25   × 10 4
0.998972/0.999400/
6.75   × 10 4
0.999486/0.999600/
4.50   × 10 4
0.998458/0.999400/
6.75   × 10 4
41.000000/0.996789/
3.13   × 10 3
1.000000/0.998650/
2.04   × 10 3
0.997934/0.768465/
2.05   × 10 1
0.999921/0.997128/
3.55   × 10 3
1.000000/0.996958/
3.61   × 10 3
1.000000/1.000000/
1.02   × 10 8
50.999971/0.998111/
3.66   × 10 3
0.999995/0.999528/
3.21   × 10 3
0.887223/0.864343/
2.63   × 10 1
0.999995/0.998109/
8.48   × 10 3
0.999984/0.996845/
5.94   × 10 3
0.983043/0.954070/
5.24   × 10 2
60.999887/0.999893/
1.22   × 10 4
0.999944/0.999957/
7.30   × 10 5
0.999887/0.999893/
1.22   × 10 4
0.999944/0.999957/
4.90   × 10 5
0.999887/0.999893/
1.22   × 10 4
0.999887/0.999851/
1.70   × 10 4
70.999744/0.999829/
1.86   × 10 4
0.999584/0.999723/
3.02   × 10 4
0.999995/0.999872/
2.60   × 10 4
0.999744/0.999829/
1.86   × 10 4
0.999460/0.999274/
7.90   × 10 4
0.999900/0.999637/
3.95   × 10 4
81.000000/1.000000/
1.35   × 10 7
1.000000/1.000000/
1.00   × 10 8
1.000000/0.999977/
2.69   × 10 5
1.000000/0.999908/
1.28   × 10 4
0.999991/0.999242/
9.39   × 10 4
0.999947/0.999862/
2.31   × 10 4
Disclaimer/Publisher’s Note: The statements, opinions and data contained in all publications are solely those of the individual author(s) and contributor(s) and not of MDPI and/or the editor(s). MDPI and/or the editor(s) disclaim responsibility for any injury to people or property resulting from any ideas, methods, instructions or products referred to in the content.