Article

Encoding Multivariate Time Series of Gas Turbine Data as Images to Improve Fault Detection Reliability

1
Dipartimento di Ingegneria, Università degli Studi di Ferrara, 44122 Ferrara, Italy
2
Siemens Energy, 20128 Milano, Italy
*
Author to whom correspondence should be addressed.
Machines 2025, 13(10), 943; https://doi.org/10.3390/machines13100943 (registering DOI)
Submission received: 27 August 2025 / Revised: 25 September 2025 / Accepted: 10 October 2025 / Published: 13 October 2025

Abstract

The monitoring and diagnostics of energy equipment aim to detect anomalies in time series data in order to support predictive maintenance and avoid unplanned shutdowns. Thus, the paper proposes a novel methodology that utilizes sequence-to-image transformation methods to feed Convolutional Neural Networks (CNNs) for diagnostic purposes. Multivariate time series taken from real gas turbines are transformed by using two methods. We study two CNN architectures, i.e., VGG-19 and SqueezeNet. The investigated anomaly is the spike fault. Spikes are implanted in field multivariate time series taken during normal operation of ten gas turbines and composed of twenty gas path measurements. Six fault scenarios are simulated. For each scenario, different combinations of fault parameters are considered. The main novel contribution of this study is the development of a comprehensive framework, which starts from time series transformation and ends up with a diagnostic response. The potential of CNNs for image recognition is applied to the gas path field measurements of a gas turbine. A hard-to-detect type of fault (i.e., random spikes of different magnitudes and frequencies of occurrence) was implanted in a seemingly real-world fashion. Since spike detection is highly challenging, the proposed framework has both scientific and industrial relevance. The extended and thorough analyses unequivocally prove that CNNs fed with images are remarkably more accurate than TCN models fed with raw time series data, with values higher than 93% if the number of implanted spikes is 10% of the total data and a gain in accuracy of up to 40% in the most realistic scenario.

1. Introduction

Gas turbine performance degradation is inevitable due to several types of gas path faults, e.g., fouling, erosion, abrasion, and damage, which lead to increased fuel consumption. To protect gas turbines against performance loss, gas turbine diagnostics is aimed at identifying anomalies in time series, i.e., single data points or patterns that deviate from the expected behavior and, thus, differ from “normal” instances [1]. In some cases, such anomalies can also lead to major failures, catastrophic events, or extremely costly repair. Thus, timely and reliable diagnostics can translate into meaningful and actionable pieces of information to be used for both improving energy efficiency and saving costs. Generally, continuous monitoring can not only support preventive maintenance to avoid further damage and expensive maintenance operations, but also favor predictive maintenance to optimally plan both future operation and subsequent maintenance actions.
Prognostics and health management is a computation-based paradigm that elaborates on physical knowledge, information, and data to enable detecting equipment and process anomalies, diagnosing degradation states and faults and predicting the evolution of the degradation to failure, with the final goal of estimating the remaining useful life [2]. Two approaches, namely life consumption monitoring and system health monitoring, can be adopted [3]. Some of the main challenges are related to the knowledge of the physics of the problem and data availability [2]. Prognostics and health management includes three steps [4]: (i) data acquisition, (ii) data processing (e.g., data filtering and cleaning [5]), and (iii) condition diagnosis and prognosis, for which state-of-the-art methodologies based on machine learning (ML) models are reviewed in Section 2.1.1.
It is clear that the three steps outlined above rely on the reliability of the available data. However, anomalies in time series are often not directly observable and, thus, they must be indirectly diagnosed by considering the available data. In fact, field data are stochastic by nature and operation varies over time because of both environmental conditions and mainly off-design operation. The advances in sensor technology and condition monitoring techniques have dramatically increased the amount and quality of data that can provide valuable information about the current health of a piece of equipment. This is expected to provide a step shift in maintenance procedures.
Thus, time series data, which reproduce the time-dependent behavior of system variables, have been increasingly collected and analyzed in all fields, from industry to finance. In addition to such perceptual signals, additional data are also artificially generated, as for instance sensor data taken from an energy asset. Because of the huge amount (in some cases, data are sampled at kHz frequency) and, more importantly, the underlying randomness of real-world data, understanding their temporal pattern is really challenging by using both physics-based approaches (such approaches can be applied only in a few cases because of system complexity) and also ML approaches. In fact, so-called Big Data are potentially a gold mine to gain knowledge and insight.
Indeed, data-driven models are the best fit for this type of task, given their inherent capability to infer rules from data by mapping input/output data, thus establishing relationships between system’s multivariate measurements and response variables. This feature makes data-driven models theoretically independent of process knowledge. According to [6], the main positive features of data-driven models are that they require low knowledge of the process under consideration and have a low computational burden. Conversely, their extrapolation capability is limited. A complete and up-to-date review of the ideas that underlie deep learning (DL) is documented in the textbook by Prince [7], which thoroughly discusses DL models, their training and performance metrics, and the strategies to improve their performance. The textbook addresses both supervised and unsupervised learning, as well as generative adversarial networks.
So far, ML approaches for data mining have been applied to time series data, e.g., classical ML classifiers (e.g., decision trees, random forests, and support vector machines) and neural network models. These approaches have been applied both alone and in combination (e.g., in ref. [8]). In addition to GT diagnostics, which is the topic of this paper, ML approaches have also been applied to assess the health state of turbomachines and energy-related systems. For instance, Marugána et al. [9] published a literature survey about the capabilities of artificial neural networks for the fault detection and diagnosis of wind turbines. Moghaddass and Sheng [1] developed a Bayesian hierarchical framework to model the relationship between sensor measurements and system variables of wind turbines. Other applications of ML-based tools include drilling pumps, for which Guo et al. [8] developed a hybrid DL model for processing time series data. For steam turbines, Ko et al. [10] developed an ensemble denoising auto-encoder to minimize false alarms. For a chiller plant, Hu et al. [11] proposed a methodology to exploit existing sensor data and encoded expert knowledge to create “virtual sensors”.
Regardless of model architecture, some strong and weak points can be highlighted about classical ML approaches, as, for instance, complex and time-consuming feature engineering, which require not only the manual design of extracted features, but also feature selection or dimensionality reduction to identify the most representative features. Moreover, almost all approaches presented in the literature rely on the analysis of raw data, i.e., time series, without performing any dimensionality change.
Inspired by the recent successes of both supervised and unsupervised learning techniques in computer vision, and with the ambition to make a step change in technical literature regarding GT diagnostics, this paper proposes the feeding of Convolutional Neural Networks (CNNs) [12,13,14] to extract profound features with deep layers of neuron structures.
In this paper, CNNs are fed with images obtained from multivariate time series data, transformed by means of two different approaches, namely, Gramian Angular Summation Field (GASF) and Markov Transition Field (MTF). Time series data are encoded as images to allow for the visual recognition, classification, and identification of structures and patterns. Moreover, encoding time series as images also improves the training phase of CNN models [15]. In the last few years, reformulating features of time series as visual clues has in fact raised attention in computer science and physics [13,14] as well as in other technical fields, such as civil engineering [15].
To unequivocally prove the actual advantage of time series encoded as images, two different CNNs are employed in this paper, of which the architecture was taken from the literature. The first one is known as “VGG-19”, characterized by nineteen learnable layers (sixteen convolution layers and three fully connected layers) and 11.5 million learnable parameters. Thanks to its topology, such a network is expected to achieve high values of accuracy. The second CNN architecture is known as “SqueezeNet”, has twenty-six convolutional layers, but has a significantly lower number of learnable parameters (approximately 0.7 million). The performance of these two CNNs, fed with images and trained from scratch on the data used in this paper, is compared to that of a Temporal Convolution Network (TCN), fed with time series data, which also have approximately 0.7 million learnable parameters. Thus, a direct comparison between a CNN fed with images and a CNN fed with time series data can be made, at the same number of learnable parameters, which is a metric of model capability and flexibility, for both training and testing.
Finally, the CNN’s ability to classify image data is deciphered by means of four techniques aimed at translating the CNN learning process into an interpretable output. In this work, we analyze CNN predictions by means of four visualization techniques: activation map, occlusion sensitivity, gradient-weighted class activation mapping, and gradient-based saliency maps [16].
In summary, this paper develops a methodology aimed at significantly improving the reliability of GT fault diagnostics by encoding time series data as images. To the best of the authors’ knowledge, such an approach is absolutely novel in the field of GT diagnostics and allows for a step-change in this area by significantly improving fault detection accuracy and, thus, dramatically reducing the number of false alarms, which usually hinder the benefits of the whole diagnostic process.
This paper is organized as follows. First, an updated and extended literature survey is provided by highlighting recent trends and unexplored areas, as well as the novelty of this paper. Then, the novel methodology is described and discussed; model tuning is also disclosed for the sake of replicability. Subsequently, Section 4 reports the description of the data used to validate the methodology, a discussion about the training and testing procedure, and a description of the analyses conducted. An extensive and thorough analysis of the results documents, from both a quantitative and a qualitative perspective, the capabilities of the methodology. Finally, conclusions are drawn and some rules of thumb are provided.

2. Literature Survey

2.1. Related Work

2.1.1. GT Diagnostics by Means of ML Models

As mentioned in the Introduction, GTs are affected by several types of faults. Among the various studies in this research area, the paper [17] provides an updated review of the signatures of gas turbine faults affecting the aerothermodynamic performance of compressors and turbines (namely, fouling, tip clearance increase, erosion, variable geometry system malfunction, and object impact damage). One of the most relevant results of the study [17] for the analyses conducted in this study is that the signature of a fault is not univocal. Thus, as conducted in this paper, a sensitivity analysis is required. Another very recent study that is worth mentioning is [18], which documents an overview of the research carried out in the last few years in the field of GT monitoring and fault detection.
Several recent papers address the challenge of system diagnostics by means of ML-based approaches. The up-to-date review paper of Zio [2] provides a high-level outlook on fault detection, fault diagnostics, and failure prognostics, and also analyzes the capabilities of data-driven models with a focus on interpretable models. Similarly, the analysis carried out in [3] highlighted the strengths, weaknesses, and potential advancements of both knowledge-based and data-driven approaches aimed at the prognostics and health management of industrial assets. Arena et al. [19] provided a set of guidelines and recommendations for selecting the most suitable ML tool to be used for data-driven approaches to predict and diagnose system’s health conditions. Rivas et al. [20] presented a predictive maintenance framework based on ML models (i.e., Convolutional Neural Network Autoencoder and Bayesian Neural Network), which employ sensor measurements (taken from bearings) to predict a pump’s remaining useful life. Synthetic data were also generated to increase the framework’s coverage. Zendehboudi et al. [6] reviewed the use of hybrid models, which combine the physical significance and generalization capabilities of white-box models with the complexity reduction capability of black-box models in several applications, among which are applied energy systems. Surucu et al. [4] widened the survey presented in [6] to consider the recent literature on condition monitoring systems carried out by means of ML models. In particular, the study [4] quantitively and comparatively discussed the tradeoff between the task constraints and the performance of each diagnostic technique.
With regard to GT diagnostics by means of ML-based approaches, Abed and Ping [21] provided a comprehensive review of GT’s faults and predicting models based on ML. With regard to the utilization of data mining and ML techniques for fault prediction in GT units, Abed and Ping highlight that (i) few studies have utilized GT industrial Big Data for diagnostic analysis and (ii) the capability of data mining to forecast GT faults to extend their lifespan is still an open field of research. Brahimi et al. [18] developed a real-time anomaly detection system by using Adaptive Neuro-Fuzzy Inference Systems and Long Short-Term Memory (LSTM) algorithms and analyzed thirty-six years of GT operation. Bai et al. [22] proposed the idea of GT group fault diagnosis to overcome the issue of data shortage (e.g., when a new GT has been operated for a short time). Deep transfer learning was introduced to analyze faults affecting the GT combustion chamber by means of Convolutional Neural Networks. Leveraging the potential of transfer learning was also the topic of the study [23], in which a deep-neural-network-based transfer learning framework was used for predicting the system’s behavior and structured fault residuals. The model was fine-tuned for the target domains associated with the degraded system, thus mitigating data scarcity. The method was capable of detecting and isolating both sensor and actuator faults, even in the presence of system gradual deterioration. The paper [24] proposed a data-driven digital twin approach for GT performance monitoring and degradation prognostics from an airline operator perspective. The framework adopted a semi-supervised DL method (namely, a deep Convolutional Neural Network) to construct a data-driven performance digital twin with multi-dimensional health features. The framework was tested on a real turbofan engine dataset from an airline company. The authors of this paper also contributed to the technical literature in the field of GT diagnostics by means of ML models, starting with a pioneer study published in 2007. In fact, a neural network model aimed at GT diagnostics was developed and tuned in [25] by also accounting for its robustness with respect to measurement uncertainty. The latest advancements are documented in [26,27], in which GT trip was predicted by employing a data-driven methodology that was based on the most up-to-date and effective ML approaches.
As discussed in [28], the probability of fault occurrence in GTs is usually low and, thus, one of the main challenges for reliable diagnostics is related to data insufficiency and imbalanced classes. To address this issue, Li et al. [29] provided a state-of-the-art review of generative adversarial networks suitable for prognostics and health management in industrial applications and were able to make practitioners overcome the problems of lack of faulty data or insufficient degradation data. In 2024, Losi et al. [30] also developed a generative adversarial network model that aimed to generate synthetic data to be used for training a more accurate diagnostic tool thanks to the enlarged training dataset. The data were gathered from three GTs by considering corrected power output and compressor efficiency for several years. The results proved the high reliability of the synthetic data, which can be, thus, exploited to train a digital twin model suitable for prognostic purposes. In the same year, Sok et al. [31] set up virtual sensors to predict combustion, performance, and emissions of internal combustion engines by using neural networks and image processing translation. A generative adversarial network was also used to track pressure profile.
The main limitation of existing fault detection methods is the ever-increasing amount of multivariate time series data. Moreover, if complex systems are considered, dependencies across both variables and time steps are hard to disclose. Finally, noise embedded in field data further challenges the fault detection process.

2.1.2. Encoding Time Series as Images

The idea of investigating the potential of image-based approaches for machine fault diagnosis was first evaluated by Thiel et al. [32]. In a study published in 1997 [33], such recurrence plots were proved to preserve the original dynamical properties, thus allowing for the compression of high-dimensional vector sets into a two-dimensional format without losing relevant information. In the study [34], published in 1998, vibration signals collected from an inertial measurement unit sensor were exploited by considering a dataset containing different operational states (idle, normal, fault).
In 2015, Wang and Oates [35] encoded time series data by means of both GAF and MTF methods and used a CNN for classification purposes. The results were successful compared to five state-of-the-art approaches. Wang and Oates also performed an analysis of the features and weights to explain CNN-improved capability. The same authors Wang and Oates confirmed their results in a parallel study [36]. It must be acknowledged that both studies [35] and [36] leaned on the pioneer work by Thiel et al. [32].
In 2020, in the study [13], an ensemble of CNNs, trained over Gramian Angular Field (GAF) images, generated from a time series related to financial market data, was used to predict the future trends of the U.S. market. The model, used for a classification task, proved to outperform competing approaches. An additional investigation into the potential of the CNN-based analysis of time series data transformed into images via the GAF method was documented in [37]. In this case, the authors analyzed human activity recognition data (e.g., walking, jogging, sitting, and standing) collected from the smartphones of some volunteers. The results, compared to ones obtained by means of seven different models, were superior in both accuracy and convergence speed, with accuracy values higher than 90%. The two studies [13,37] also demonstrated the versatility of such an approach.
More recently, Jiang et al. [38] proposed an automatic feature selection method, based on an image feature fusion strategy and a DL algorithm, for the sake of time series classification. They demonstrated that the proposed algorithm had a higher classification accuracy and smaller prediction error compared to benchmark models. In ref. [39], Sayed et al. considered environmental sensor data related to building occupancy, such as temperature, humidity, carbon dioxide and light sensors, and could achieve accuracy values above 99%. It is worth noting that the study [39] also includes a synoptic comparison of the related works describing encoded univariate and multivariate time series data.
In 2024, Hyun et al. [14] developed a CNN-based model for detecting anomalies in manufacturing process data (force, vibration, and sound) by encoding time series as images by means of the MTF method, thus obtaining very high accuracy. Yang et al. [15] proposed a channel- and spatial-wise attention model that exploited time series encoded as images to diagnose the structural health status of dams. With the goal of diagnosing rotor faults of hydroelectric units, Li et al. [40] exploited the GASF method to feed an improved coati optimization algorithm parallel Convolutional Neural Network, followed by a multi-head self-attention mechanism and support vector machine. The results showed that the accuracy of the whole approach was close to 100%, significantly surpassing other non-optimized models.

2.1.3. CNN Visualization Techniques

CNNs have a nested non-linear structure and, thus, no information is provided about what makes them arrive at their predictions. This lack of transparency can be a major drawback and, thus, the development of methods for visualizing, explaining, and interpreting DL models has recently attracted increasing attention in the technical literature. Moreover, the learned features are hard to identify and interpret from a human vision perspective, causing a lack of understanding of CNNs’ working mechanism. Thus, to fully exploit CNN potential, it is necessary to improve CNN interpretability and visualization by means of a qualitative analysis method [12], which translates the internal features into visual patterns.
Therefore, the papers dealing with CNN visualization techniques are ranked in chronological order hereafter to illustrate how these techniques have developed in recent years and, mainly, which procedures have become more popular thanks to their effectiveness for practitioners. As can be seen, this is a relatively recent field of research.
In 2014, Simonyan et al. [16] analyzed the visualization of image classification models by using deep convolutional networks. Two visualization techniques, based on computing the gradient of the class score with respect to the input image, were analyzed. In the same year, Zeiler and Fergus [41] introduced a visualization technique for the intermediate feature layers. Moreover, they performed an ablation study to discover the performance contribution from different model layers. In particular, the authors presented a novel approach (called “activation map”—AM) to identify the input patterns that caused an activation in the feature maps. Moreover, they also performed occlusion sensitivity (OS) by systematically occluding different portions of the input image to monitor classifier’s predictions.
In 2015, Bach et al. [42] proposed a solution to the problem of understanding classification decisions by the pixel-wise decomposition of non-linear classifiers. The methodology allowed them to visualize the contributions of single pixels to predictions for kernel-based classifiers by means of layer-wise relevance propagation. Yosinski et al. [43] analyzed two open-source tools for visualizing and interpreting neural nets. The first one visualized the activations produced on each layer of a trained CNN. The second one enabled visualizing features at each layer via regularized optimization in image space. Yu et al. [44] analyzed the internal representations of CNNs by visualizing (i) patches in the representation spaces constructed by different layers and (ii) visual information kept in each layer. Moreover, they demonstrated the superiority of CNNs with deeper architecture.
In 2016, Zhou et al. [45] revisited the global average pooling layer technique and analyzed CNN localization ability. They demonstrated that it was possible to localize the discriminative image regions even though their CNN model was trained just for solving a classification task.
The following year, Samek et al. [46] presented two approaches for explaining predictions of DL models: one computed the sensitivity of the prediction with respect to changes in the input and another one decomposed the decision in terms of the input variables. These methods were evaluated on three classification tasks.
In 2018, Liu and Wang [47] developed an approach to translate time series into a network graph for visualization and pattern mining. In the same year, Qin et al. [12] presented an extended survey of several CNN visualization methods. The methods were presented in terms of motivations, algorithms, and experiment results. A discussion about their possible applications was also provided to demonstrate the significance of CNN interpretability. Among the different visualization methods, they also reviewed and discussed Activation Maximization.
In 2019, Montavon et al. [48] presented a detailed overview of layer-wise relevance propagation, which is a technique that helps to highlight which input features are used to support model prediction, by also extending it to a variety of ML scenarios beyond deep neural networks. In particular, the authors mapped the neurons corresponding to pixels that activate from one layer to the next one. Instead, Iwana et al. [49] tackled the interpretability and explainability of the predictions of CNNs for multi-class classification problems by proposing a visualization method of pixel-wise input attribution using the gradient of softmax to back propagate the relevance of the output probability to the input image.
In 2020, Selvaraju et al. [50] proposed a technique called gradient-weighted class activation mapping (Grad-CAM) for producing visual explanations for the decisions from CNN models. They also conducted human studies to measure whether Grad-CAM explanations actually help users to establish appropriate trust in predictions. Occlusion sensitivity (OS) was also performed for comparison purposes.
Finally, in 2024, Hyun et al. [14] exploited Grad-CAM in order to visually explain CNN outputs (i.e., an activation heat map), with the final goal of identifying the location and size of the detected anomaly patterns.
Based on the literature survey reported above, the four visualization and interpretation techniques used in this paper are activation map (AM), occlusion sensitivity (OS), gradient-weighted class activation mapping (Grad-CAM), and gradient-based saliency maps (Grad-SM).

2.2. Knowledge Gap and Novelty of This Study

The literature survey presented in Section 2.1 demonstrates that, so far, the huge potential of CNNs for image recognition has never been applied to GT gas path measurements. This is the knowledge gap tackled for the first time in this paper. In fact, as of today, only two studies have dealt with the exploitation of time series data converted into images for energy system diagnostics. However, both the goal and the approach of these two studies are significantly different from the ones of this paper. In fact, the study [51] converted time series signals into an image by means of the GASF method, first employing an autoencoder-generative adversarial network to generate fault samples for balancing the training dataset and then a CNN was used for diagnosing the health state of a centrifugal chiller. Instead, the study [52] employed normalized grayscale images, obtained by rearranging the original pressure readings at various positions of the throttling valve and locations (thus, no transformation method was used), in order to classify the stability of a centrifugal compressor. Moreover, the literature survey also outlines that a comprehensive framework, which combines time series transformation and CNN exploitation and visualization, has never been documented in the literature.
Therefore, the authors of this study carried out a pilot analysis in [53] to preliminarily investigate the potential of using CNNs fed with images in order to perform GT diagnostics. The advancement of this study with respect to [53] is three-fold. First, faults are implanted in all the twenty available gas path measurements to challenge the detection capability of the proposed methodology. Second, different scenarios with different combinations of faults, also occurring at different time points, are thoroughly investigated and compared. Finally, the main advancement of this study with respect to [53] is that the diagnostic response is discussed and interpreted by means of the visualization techniques reviewed in Section 2.1.3.
The novel contributions of this paper to the technical literature can be summarized as follows:
  • The development of a comprehensive methodology, which includes (i) transformation of time series into images, (ii) Convolutional Neural Network models, and (iii) classification criterion, in order to provide significant quantitative advantages to improve the accuracy and robustness of the fault diagnosis process. Such an architectural innovation (GASF/MTF and CNN) coupled with a pioneering application to GT diagnostics and a subtle type of fault (random spikes) represents the key novel contribution that this study provides.
  • The exploitation and comparison of two different approaches for image encoding, namely, GASF and MTF.
  • The analysis of a hard-to-detect type of fault, represented by a random series of spikes of different magnitudes and frequencies of occurrence. Because of its random nature, such a fault cannot be detected by applying standard data-driven approaches, as demonstrated in this paper. Both magnitude and frequency are varied in agreement with spikes encountered in industry practice to highlight the respective minimum value that makes such fault detectable. Moreover, the faults are artificially implanted in different combinations of the available measurable parameters to infer rules of thumb that account for both methodology capability and fault detectability. In fact, such random and isolated anomalies may be masked by measurement noise, especially in the case of low magnitude (in fact, in our paper, we also consider 1% maximum magnitude).
  • The comparison of a state-of-the-art baseline approach for analyzing time series data, namely a Temporal Convolution Network (TCN), and the employment of two different CNNs with a remarkably different number of learnable parameters in order to prove that the methodology presented in this paper is clearly preferable in terms of accuracy.
  • The application of the most up-to-date techniques aimed at the interpretability of CNN predictions, providing insights into the detected fault patterns and contributing to the overall trustworthiness of the whole diagnostic system.
In addition to the scientific value highlighted above, the methodology is also a good fit for industrial assets. In fact, though the computational time required for ML model training can be high, as it depends on data quantity and network type and architecture, simulation time is extremely low and, thus, the methodology can also be applied online. This allows for leveraging vast amounts of information embedded in historical data that OEMs as well as users continuously store but have not yet been fully exploited because of the difficulty of both navigating data lakes and identifying highly challenging anomalies, such as random and isolated spikes. In fact, spikes are often used in industrial practice for the simulation and backtesting of anomaly detection algorithms. Moreover, CNN outputs are quantitative and, thus, they can be automatically processed. As demonstrated in Section 5, prediction accuracy also outperforms the values obtainable by exploiting time series data, thus establishing a new benchmark for high-value accuracy and, at the same time, the low value of the rate of false alarms. Finally, thanks to the techniques that allow output visualization, practitioners can also investigate the root causes of the detected anomalies in more detail.
All these strong points perfectly support the present industrial trend of maximizing the exploitation of Artificial Intelligence (AI) techniques in order to share knowledge about anomaly detection and isolation across GT fleets and even across different installations. Such AI tools can be run both locally and remotely, thanks to edge-cloud computing, by continuously learning new data, with the aim of increasing operational efficiency and minimizing costs.
Finally, it must be highlighted that the proposed framework, though applied in this paper to GT field data with implanted spikes, is absolutely general and can be potentially extended to any energy equipment as well as, in principle, to time series data taken on any system.

3. Methodology

3.1. Rationale and Overview

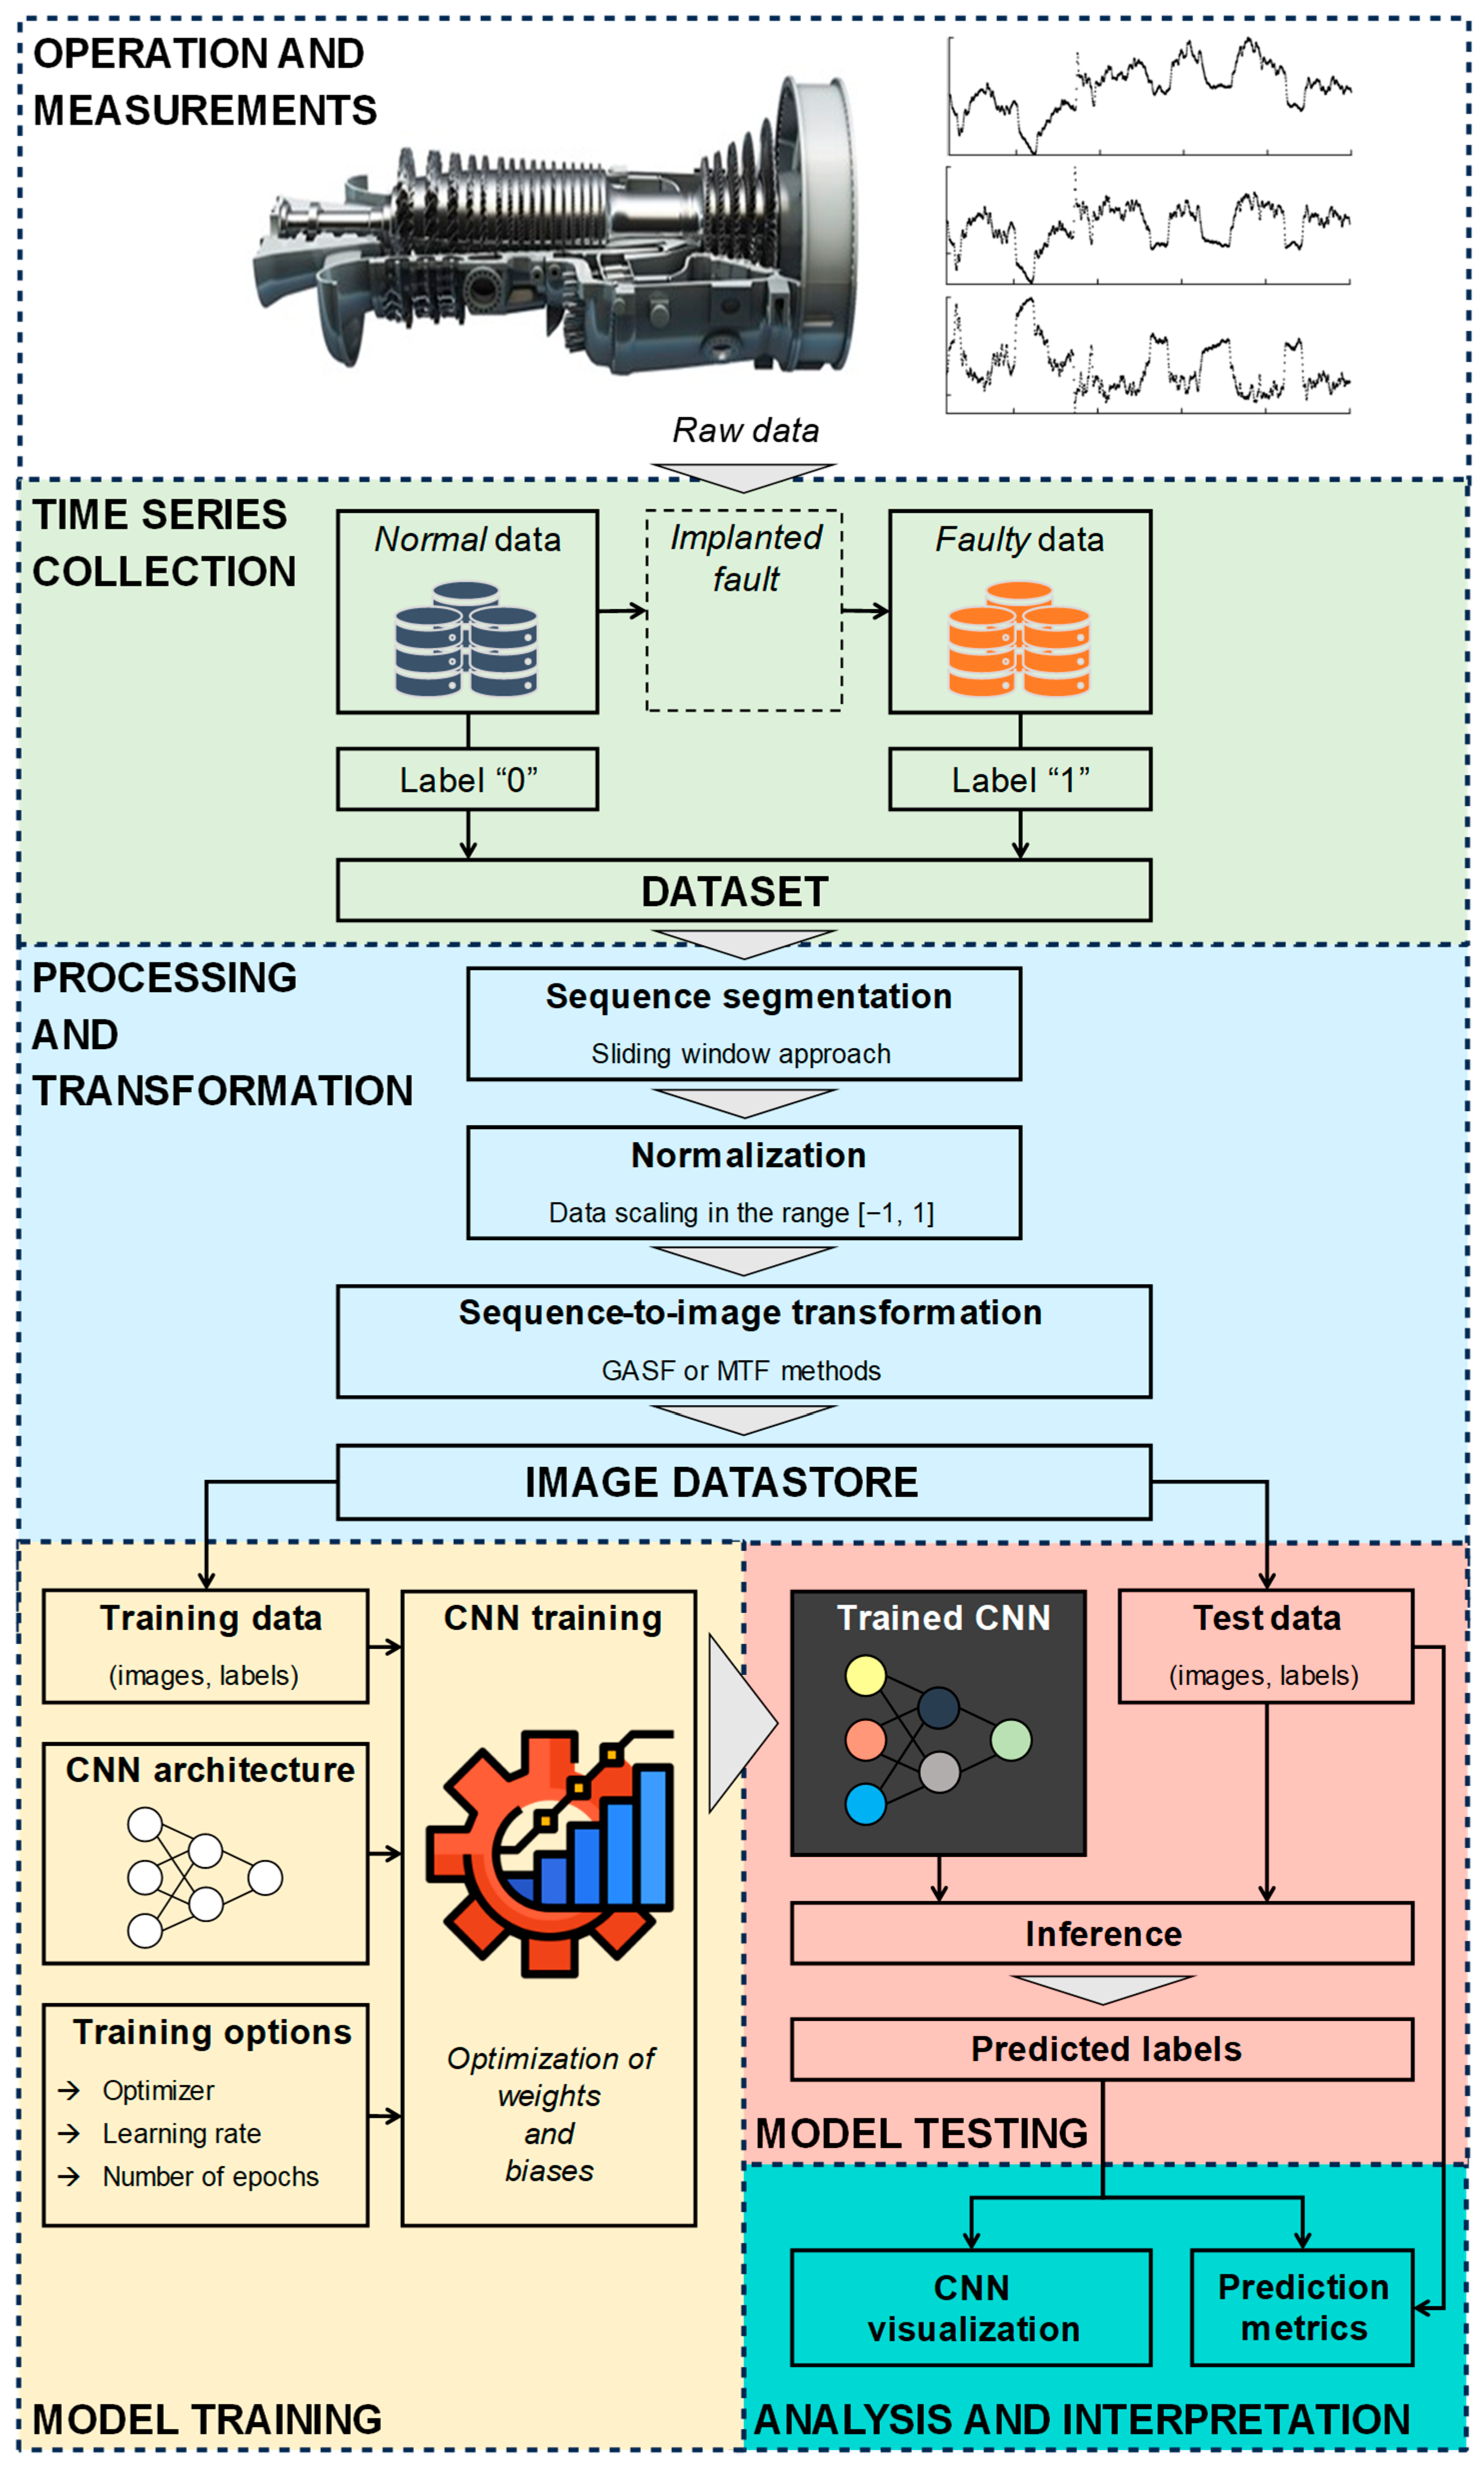
The data-driven methodology proposed in this paper adopts a binary classification approach based on an innovative treatment of temporal data that consists of encoding a 1D sequence time series into a 2D image. Thus, the proposed methodology tackles the challenge of multivariate time series classification. To this aim, the methodology makes use of CNNs as data-driven models thanks to their ability to learn features from 2D representations [12,13,14]. An overview of the proposed approach is shown in Figure 1.
Time series is the most common type of data used to track machine operation. Several gas path measurements (e.g., temperatures, pressures, fuel mass flow rate, and power output) are continuously monitored during GT operation with the purpose of real-time diagnostics. Thus, such variables can be used to discriminate between normal and faulty operation. However, the unpredictability of ambient and working conditions interferes with fault symptoms, especially in the case of faults with low magnitude, and this, in turn, may hinder the adoption of conventional data-driven methodologies that exploit raw time series data. The aim of the proposed methodology is to demonstrate that 2D images can reveal characteristics and patterns in faulty data that are not detectable by means of conventional approaches, thus providing enhanced classification reliability.
The approach adopted in this study is illustrated in Figure 2.
The methodology starts with the collection of both normal (i.e., label “0”) and faulty (i.e., label “1”) measurements. In this study, normal measurements reflect the normal operation of 10 GTs over several years, while faulty measurements include implanted faults. Thus, the faulty data employed in this work are simulated. In this manner, methodology reliability can be evaluated in different fault scenarios, as both fault magnitude and frequency are known, as well as the identification of the minimum fault severity that can be reliably detected.
In the second step, time series data are preprocessed and encoded as images by using two transformation methods, namely GASF or MTF, taken from the literature. First, sequence segmentation is applied by sliding a fixed-size window over the longer time series in order to generate multiple sub-time series from a single time series. This allows us to obtain a set of observations that covers a more extended range of GT operation. Then, normalization is applied through a min-max scaler. Finally, GASF or MTF methods, which are described in Section 3.2, are employed to derive the corresponding images.
Subsequently, in “model training”, a CNN model is trained on a subset of observations of the image datastore (i.e., the training dataset). The training dataset includes images from both classes (normal and faulty data) and is balanced (i.e., it has the same number of images for each class). Subsequently, in the “inference” step, the trained CNN model is tested on brand new images.
In the last step, the classification reliability of the trained CNN model is assessed by comparing the true labels of the tested images to the labels predicted by the CNN model. Moreover, in this paper, an analysis on the interpretation of CNN predictions is also conducted.

3.2. Processing and Sequence-to-Image Transformation

In this paper, a multivariate time series (MTS) is composed of C channels (in this study, it is equal to the number of measured variables) and L time stamps as X = {x1, x2, …, xC} ∈ R C × L , where xc = { x 1 c , x 2 c , …, x L c } ∈ R 1 × L is a single time series composing the MTS.
Each channel is transformed separately to obtain a gray scale image. Then, a multispectral image I of size h × w × C is obtained by stacking multiple channels; h, w, C are the height, width, and number of channels of the image, respectively. Thus, the image I is stored as a multidimensional array. The images considered in this paper have h = w, i.e., the same number of pixels in both x- and y- axes. The channel axis allows the evaluation of the image representation of the different measured variables.
In this work, we perform two preprocessing steps, namely sequence segmentation and normalization.
Sequence segmentation consists of dividing the original time series x of length L into various overlapped segments by means of a moving window of fixed w. Thus, each segment is a time series of length w, i.e., x = { x 1 , x 2 , …, x w }, where w << L. As mentioned in Section 3.1, this makes the prediction model exploit an augmented and more assorted dataset and also reduces the size of the corresponding image (equal to w × w).
Normalization consists of rescaling a 1D time series x to have values in the range [−1, +1], according to Equation (1):
x ~ n   =   2 x n   x min x max   x min 1
where xmin and xmax are the minimum and maximum values calculated over the entire dataset of normal data, respectively.
Finally, starting from the rescaled time series x ~ , it is possible to calculate the corresponding image Y, according to Equation (2):
Y   =   y 11 y 1 w y w 1 y ww
where ymn is a pixel of Y, of which the value depends on the transformation method.
Once each single time series of the MTS is transformed, the final image I can be constructed, as I = [Y1, Y2, …, YC] ∈ R h   ×   w   ×   C .
In this work, the size w of the moving window is assumed equal to 224 data points, since the CNN model with VGG-19 architecture, which will be described in Section 3.3.1, is fed with images of size 224 × 224.

3.2.1. Gramian Angular Summation Field

As described in detail by Wang and Oates [35], polar coordinates are used by the GASF transformation by encoding the value as the angular cosine and the time stamp as the radius. Such a representation maintains the absolute temporal relationships of the original 1D time series in the 2D image. In fact, in the image Y obtained by means of GASF, time increases as the position moves from top-left to bottom-right.
Based on the rescaled time series x ~ = { x ~ 1, x ~ 2, …, x ~ w}, the GASF method computes the pixels of the image Y as shown in Equation (3).
y mn =   x ~ m     x ~ n 1 x ~ m 2     1 x ~ n 2
It is evident from Equation (3) that the image obtained by means of GASF transformation is symmetric, and its main diagonal contains the encoded time series. This means that it is possible to reconstruct the raw time series, starting from the features learnt by the CNN from the input image. However, to achieve this aim, it is necessary to rescale the original time series in the range [0, 1], and only grey-scale (i.e., single channel) images must be considered. Consequently, in this work, we do not perform the inverse transformation from image to time series, as we employ multi-channel images.

3.2.2. Markov Transition Field

The MTF method was also proposed by Wang and Oates in [35]. Wang and Oates adopted Markov transition probabilities to encode temporal information embedded in the time series and represented such transition probabilities sequentially to maintain the temporal dependency on consecutive time steps.
The procedure can be summarized as follows:
(i)
Split the rescaled time series x ~ into Q quantile bins. Each bin must include the same number of data points of x ~ .
(ii)
Each data point, x ~ n, is assigned to the corresponding bin qj (j ∈ [1, Q]).
(iii)
Markov transition probability, pij, with which a data point in quantile qi is followed by a data point in quantile qj, is calculated. The sum of all probabilities makes one.
(iv)
Calculate ymn = pij | x ~ mqi, x ~ nqj.
The variable ymn is a pixel of the image Y defined in Equation (2).
It should be noted that MTF transformation is surjective, i.e., the inverse transformation is not univocal. Moreover, unlike GASF, the transformation implemented by the MTF method is also not symmetrical.
In this paper, we set Q = 8. Such an optimal value was identified by carrying out a sensitivity analysis that considers Q equal to 4, 8, and 16 (the investigated values were selected in agreement with [35]). The sensitivity analysis revealed that Q = 4 decreases the accuracy by 1.0% with respect to the case with Q = 8, but the computational time is 10% lower. If Q = 16, the accuracy also decreases by 0.8% with respect to the case with Q = 8, but, in this case, the computational time increases by 54%.

3.3. Convolutional Neural Networks

A CNN is a stack of convolutional layers, ReLU activation layers, and max-pooling layers. Optionally, normalization layers may be added between convolutional and ReLU layers and fully connected (FC) layers used at the end of the network. By passing from the input layer to the output layer, an image is transformed, and more numerous and general features are extracted to predict the label of the input image.
A convolutional layer performs 2D discrete convolutions on the input image or, more generally, on the input feature map. According to the AI glossary, a feature map is a two-dimensional array resulting from the application of convolutional filters to an input image. An example of a discrete convolution is illustrated in Figure 3a. The kernel, which contains the weights learnt during the training process, slides across the input feature map in both directions and with a fixed stride. At each location, the product between the weights of the kernel and the input elements is computed; the sum is calculated to produce the output in the current location. Each channel of the input image or input feature map has its own kernels. This operation can be repeated using several kernels to obtain any number of output feature maps.
The output feature map is passed through a ReLU layer that performs a non-linear activation, f (x), of the feature map, where f (x) = max(0, x).
Finally, max-pooling layers are employed to perform a downsampling of the output feature map, as illustrated in Figure 3b, and extract the most significant pieces of information from the input feature map.
In this work, we test two different CNN architectures (VGG-19 and SqueezeNet), both taken from the literature and developed for image recognition. They are publicly available after having been trained on the ImageNet dataset, a free and benchmark dataset comprising more than one million RGB images from 1000 different classes. The VGG-19 architecture proved more accurate than the SqueezeNet architecture over the ImageNet dataset thanks to its higher complexity (in fact, VGG-19 architecture has a significantly higher number of learnable parameters).
However, it has to be highlighted that, in this work, both VGG-19 and SqueezeNet models were trained from scratch on the data used in this paper and also for a brand-new classification task. In fact, images are obtained from time series data, have more than three channels, and belong to two different classes representing normal and faulty operation. Thus, a comparison of the two CNNs has to be carried out in this work by considering their prediction accuracy. Training and inference time, as well as the required memory, are also accounted for.

3.3.1. VGG-19 Architecture

The aim of VGG (Visual Geometry Group) architectures is to achieve enhanced classification accuracy by using a conventional CNN (i.e., composed of convolutional, pooling, and fully connected layers) with significantly increased depth.
The VGG-19 neural network is the state-of-the-art architecture proposed by Simonyan and Zisserman in [54]. It comprises nineteen learnable layers, i.e., a stack of sixteen convolutional layers followed by three FC layers. The network must be fed with images of size 224 × 224. All learnable layers (namely convolutional and FC layers) are followed by ReLU activation, with the exception of the last FC layer, of which the outputs are passed through a softmax layer that precedes the output classification layer. Each convolutional layer performs 3 × 3 convolutions with stride equal to 1 pixel in both directions. Downsampling is obtained by means of max pooling layers. The pooling operation is performed over a 2 × 2 region with stride equal to 2 in both directions. Finally, a dropout layer is inserted after the first and second FC layer with probability equal to 0.5. The number of filters for each convolutional layer as well as the number of neurons of the FC layers are reported in [54].
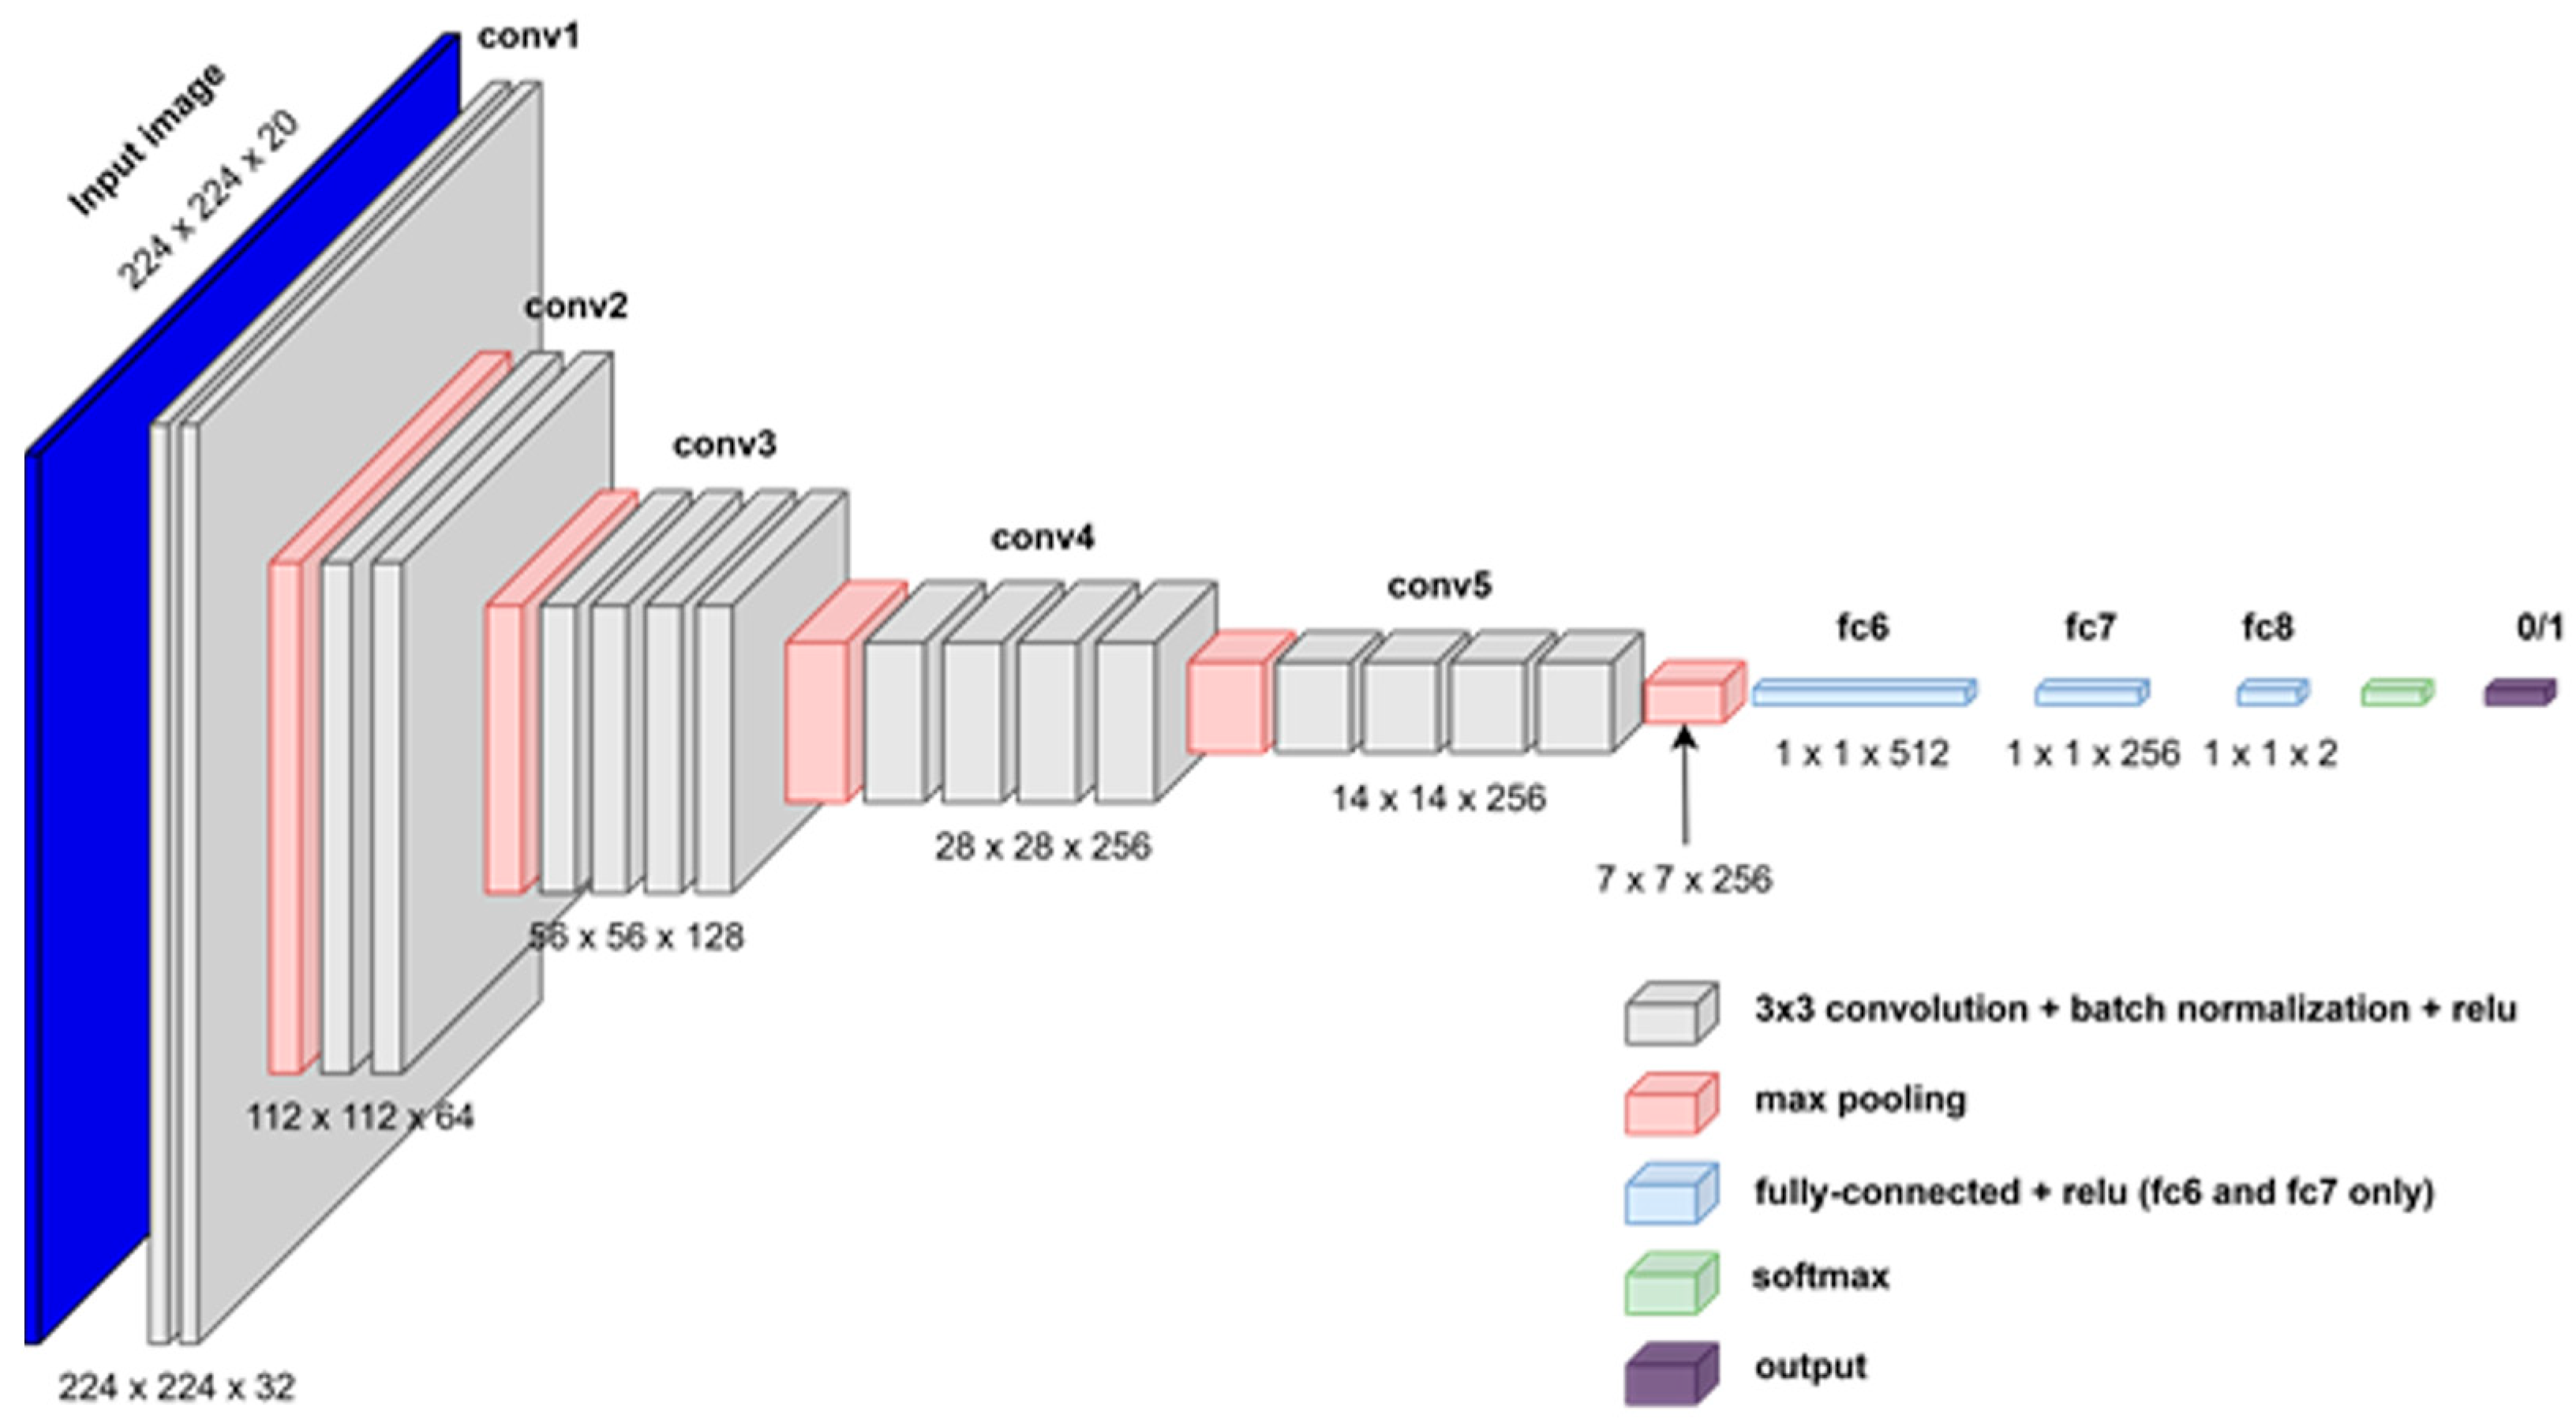
The VGG-19 model developed in this work is illustrated in Figure 4, where it should be noted that, in this paper, the number of channels is twenty, since this is the number of considered measured variables, as discussed in Section 4. It can be observed that, by passing from the input layer to the output layer, the input image is shrunk by means of pooling layers and more numerous and complex features are extracted by increasing the number of filters of the convolutional layers. With respect to the original architecture, we introduced some modifications.
First, batch normalization layers are added after each convolutional layer to improve training convergence for our dataset. Second, the number of filters for the convolutional layers and the number of neurons of the FC layers are decreased with respect to the values reported in [54] and adapted to a binary classification task. In particular, the number of convolutional filters is set equal to {32, 64, 128, 256, 256} for the five convolutional blocks, respectively, as shown in Figure 4. The three FC layers have {512, 256, 2} hidden neurons, respectively, where the number of neurons of the last FC layers reflects the number of classes considered in this study (i.e., two). The VGG-19 model developed in this work has approximately 11.5 million learnable parameters in total.
Thanks to its increased depth, the VGG-19 is able to create a hierarchy of features, i.e., shallower layers include more simple features, while deeper layers allow more complex and general features.

3.3.2. SqueezeNet Architecture

The SqueezeNet architecture was presented by Iandola et al. [55] to obtain a CNN model with far fewer parameters, while preserving good prediction accuracy with respect to AlexNet, which is another popular CNN architecture used for image recognition. In this work, we consider SqueezeNet v1.1 [56].
Iandola et al. [55] adopted three design strategies to decrease the number of parameters of the CNN while maintaining high accuracy. The first strategy was replacing the 3 × 3 convolutional filters with 1 × 1 convolutional filters that have 9× fewer parameters than 3 × 3 filters. The second strategy was decreasing the number of input channels of the 3 × 3 filters thanks to the squeeze layers. The third strategy was maximizing performing downsampling (i.e., stride higher than 1) in deeper layers.
These three strategies were implemented by introducing the Fire module as the main block to construct the SqueezeNet architecture. The Fire module includes a squeeze layer, namely a convolutional layer with a reduced number, Cs1, of 1 × 1 filters. The feature map of the squeeze layer feeds two expand layers, i.e., 1 × 1 and 3 × 3 convolutional layers with Ce1 and Ce3 filters. Finally, the Fire module concatenates the output of the two expand layers. In order to effectively reduce the number of parameters of the CNN, Cs1 must be lower than the sum of Ce1 and Ce3.
The SqueezeNet begins with a convolutional layer with 3 × 3 filters and stride equal to 2 (conv 1), followed by 8 Fire modules (fire 2 through fire 8) and a convolutional layer having two (i.e., the number of classes) 1 × 1 filters with stride equal to 1 (conv 10). Max pooling layers are inserted after “conv 1”, “fire 3”, and “fire 5” for downsampling. Dropout is used after “fire 9” and global average pooling is applied before the softmax layer that, in turn, precedes the output classification layer.
The SqueezeNet architecture employed in this work is shown in Figure 5. As already observed for the VGG-19 model, the number of channels is 20, since this is the number of considered measured variables. Moreover, also in this case, the size of the input image is progressively reduced (feature downsampling) through the SqueezeNet network by means of the first convolutional layer and the three max-pooling layers. For all these layers, the stride of their kernels is equal to 2. Simultaneously, the number of channels is increased by increasing the number of filters in the expand layers to allow the CNN model to learn more features. It has to be noted that the SqueezeNet model of this paper is fed with images of size 224 × 224 instead of size 227 × 227, which was the image size employed in [55]. As made for the VGG-19 model, we inserted batch normalization between each convolutional layer and ReLU activation. The SqueezeNet model has approximately 0.7 million learnable parameters.

3.4. Visualization Techniques

The great ability of CNNs to classify image data pushed researchers to design techniques aimed to visualize what CNNs actually learn about image data. These post-training techniques employ test images to translate CNN behavior into an interpretable output that can explain network predictions by means of a visual representation. Such techniques can also be used to verify the correctness of the trained CNN or to improve model performance.
In this work, we analyze CNN predictions by means of four visualization techniques: activation map (AM) [41], occlusion sensitivity (OS) [41], gradient-weighted class activation mapping (Grad-CAM) [50], and gradient-based saliency maps (Grad-SM) [34].
A description of the rationale behind these techniques is reported below.
  • Activation map (AM) shows (for example, by means of a gray-scale image) the output feature map of a CNN layer during the forward pass. It can be applied to any layers of the network. The returned activation map (i.e., a square matrix for convolutional layers or a feature vector for fully connected layers) has a reduced size with respect to the input image, i.e., the activation map has lower resolution than the input image. In particular, the deeper the considered layer, the lower the resolution of the activation map. Thus, an upscaling method is required to obtain an activation map of the same size as the input image.
  • Occlusion sensitivity (OS) measures CNN sensitivity to perturbations in the input image. The method perturbs areas of the input images by replacing it with an occluding mask. As the mask moves across the image, the technique measures the change in the probability score for a given class. The change in activation score is estimated by comparing it to the score without occlusion. Thus, occlusion sensitivity highlights the parts of the image that are most important for a given classification task. This technique requires the fine-tuning of three hyperparameters, i.e., size mask, stride, and mask value. In particular, the size of the returned score map depends on mask size and stride and a resize of the score map is required to obtain the same size as the input image. The map returned by occlusion sensitivity can be visualized by means of a heat map.
  • Gradient-weighted class activation mapping (Grad-CAM) computes the gradient of the classification score with respect to a feature map learnt by CNN. Once again, the goal is the identification of the parts of an image that are most important for the classification task. The portions of an observation with a large value of the Grad-CAM map are those that most impact the CNN score for that class. The gradients of the classification score can be computed with respect to any convolutional layer in the CNN. In this work, we apply the Grad-CAM to the feature map of the ReLU layer after the last convolutional layer in the CNN (namely “relu5_4”). As observed for the AM technique, the size of the returned map depends on the selected layer and an upsampling method is usually required to obtain a score map of the same size as the input image.
  • A gradient-based saliency map (Grad-SM) provides a pixel-resolution map showing the pixels that are most important. This method computes the gradient of the class score with respect to the input pixels. Intuitively, the map highlights the pixels that mostly affect the class score if it was changed. This technique produces a map of the same size as the input image. Therefore, Grad-SM images have a high resolution, but they tend to be much more affected by noise than score maps obtained by means of OS or Grad-CAM techniques.

4. Case Study

This section describes the framework designed to validate the proposed methodology. GT normal data and the implanted faults employed in this work are presented in Section 4.1 and Section 4.2, respectively. The procedure adopted to split the available data into training and test sets is described in Section 4.3. Section 4.4 outlines the analyses developed to compare the reliability of the proposed innovative approach to that of a conventional approach that makes use of raw time series. Finally, the metrics used for such a comparison are defined in Section 4.5.

4.1. Normal Data

The data employed in this work to reproduce GT normal operation are experimental data gathered from 10 SGT-800 GTs, operated in combined cycle, running at base load, and located in two different regions. Thus, the normal data are characterized by significant variability over time and are highly heterogeneous across GTs since they were acquired under different ambient and working conditions.
The normal data refer to 150 different days of operation (according to the glossary of computer science, each day is considered an instance) and are spread over multiple years. Each instance consists of an MTS composed of 1440 time stamps (i.e., data granularity is equal to one data point per minute) and includes 20 measured variables.
The 20 variables considered in this work are gas path measurements, namely compressor discharge temperature (CDT), compressor discharge pressure (CDP), fuel mass flow rate (F), power output (P), and 16 exhaust gas temperatures (EGTs). In particular, the 16 EGT measurements are acquired from a ring of equally spaced thermocouples placed circumferentially at the outlet section of the turbine.
All these variables are usually employed for monitoring and diagnostics purposes. Indeed, they reflect the overall GT health state, since CDT and CDP contribute to compressor efficiency, F and P define specific fuel consumption, and EGTs provide an indication of temperature spread. In addition, it must be observed that such measured variables are usually available across different GTs and installations.

4.2. Implanted Fault

The fault investigated in this work is the spike fault, i.e., an abnormal and isolated increase in a given measured variable.
Spikes are often used in industrial practice for backtesting anomaly detection algorithms. With regard to sensors, spikes can be symptoms of sensor hardware anomalies. With regard to equipment, spikes can be precursors of a random disturbance affecting an asset.
The procedure used to implant spikes is reported below.
For a time series x= {x1, x2, …, xL} ∈ R L, where L = 1440 (this is the value used in this paper), N = Φ · L spikes of variable magnitude in the range [0, Δ] are implanted at random time stamps, as defined in Equation (4):
x i *   =   x i ( 1   +   α i   δ i )
where x* is the faulty value, x is the normal value, δ is the fault magnitude (expressed as a relative value), and α is a random coefficient (α ∈ [0, 1]), sampled from a continuous uniform distribution in order to introduce a uniform scatter on δ, which is defined as in Equation (5):
δ i = Δ           i f           i     𝒯   0             i f           i     𝒯
where Δ is the maximum fault magnitude and 𝒯 is the set containing the N locations of the implanted spikes, which are randomly sampled in the range [1, L].
Since the normal data used in this paper are field data and spikes are simulated in agreement with the literature [5,57,58,59], the spikes investigated in this study are fully representative of real-world spikes.

4.3. Training and Testing

The procedure adopted in this paper to prepare both training and testing data is illustrated in Figure 6. The field data (150 MTS instances in total) are randomly divided into K distinct folds; K − 1 folds are merged to obtain the subset S 1, while the remaining subset S 2 is used for testing. In this manner, training and testing data are disjointed.
Two subsets of equal size ( S 1a and S 1b) are created by randomly splitting the subset S 1. The subset S 1a, which is used for training, represents the Normal class (label “0”). Faults are implanted in the data included in subset S 1b, thus obtaining F 1b, which represents the Faulty class (label “1”) during the training phase. The entire training dataset is D train = S 1a    F 1b. The goal of this procedure is to improve the generalization capability of the methodology, since faults are implanted on normal data ( S 1b) that are different from S 1a.
The test dataset is composed of data from S 2 (label “0”) and data from F 2 (label “1”), i.e., D test = S 2   F 2. In this case, faults are implanted on in S 2 data to obtain F 2.
This procedure is applied K times for different testing subsets in such a manner that each instance is tested at least once. In this study, based on common practice and literature sources [26,27], we use K = 5 (i.e., five folds). At each run, 80% of the available MTS data are used for training: 40% of the data represents the Normal class, while the remaining 40% is the Faulty class. The remaining MTS instances (20%) are used for testing, by considering both normal data ( S 2) and faulty data ( F 2).

4.4. Analyses

This section outlines and discusses the analyses performed to test the novel methodology based on sequence-to-image transformation and assess its capability with respect to a conventional approach that makes use of raw time series.

4.4.1. Prediction Models

In this study, we compare five models, of which one is fed with raw time series and four are fed with images, as listed below:
  • TCN: Temporal Convolutional Network fed with raw time series;
  • SqueezeNet-GASF: SqueezeNet neural network fed with images obtained by means of GASF transformation;
  • VGG19-GASF: VGG-19 neural network fed with images obtained by means of GASF transformation;
  • SqueezeNet-MTF: SqueezeNet neural network fed with images obtained by means of MTF transformation;
  • VGG19-MTF: VGG-19 neural network fed with images obtained by means of MTF transformation.
The data-driven model fed with raw time series is a Temporal Convolutional Network (TCN). Such a model is a benchmark since it (i) exploits convolution operations like SqueezeNet and VGG-19 architectures and (ii) has a number of learnable parameters comparable to that of the SqueezeNet. The TCN model is trained for 50 epochs by means of the mini-batch (size equal to 128) stochastic gradient descend method and Adam optimizer with tuned hyperparameters [60]. According to the same study [60], the initial learning rate is set equal to 0.002 and is subsequently halved every 10 epochs, β1 and β2 are equal to 0.9 and 0.999, respectively, and L2 regularization is set to 10−4.
The training setting for the SqueezeNet and VGG-19 models is the following. The number of training epochs is set equal to 25 and the models are trained by means of mini batches (size equal to 128) of stochastic gradient descend method with Adam optimizer. The hyperparameters of the Adam optimizer are the following: the initial learning rate is set equal to 0.0002 and is subsequently halved every 10 epochs, β1 = 0.9, β2 = 0.9, and the L2 regularization factor is set to 10−5. With respect to the training setting of the TCN, the value of β2 and L2 of the CNNs are decreased due to the higher number of network parameters.
All the prediction models were implemented in the Matlab® environment (version 23.2). All the simulations ran on a server with CPU i7-11700F @ 2.50 GHz, 32 GB RAM, and two GPUs Nvidia RTX 3060.

4.4.2. Fault Scenarios

The five models are challenged to predict six fault scenarios that differ from each other in the number and combination of the measured variables affected by the implanted faults. It has to be highlighted that all models are fed with all the 20 available variables (see Section 4.1), but only a subset is affected by the spike fault.
The six scenarios are constructed as follows:
(i)
Scenario 1: spikes are implanted in CDT and CDP variables at the same time stamps.
(ii)
Scenario 2: spikes are implanted in CDT, CDP, F, and P variables at the same time stamps.
(iii)
Scenario 3: spikes are implanted in all EGTs at the same time stamps.
(iv)
Scenario 4: spikes are implanted at the same time stamps in the following variables:
-
CDT and CDP;
-
CDT, CDP, F, and P;
-
all EGTs.
Thus, scenario 4 equally shares observations from scenarios 1 through 3.
(v)
Scenario 5: spikes are implanted in the same combinations of variables as scenario 4, but at different time stamps across variables.
(vi)
Scenario 6: spikes are implanted in six different subsets of variables (s1 through s6), as follows:
-
s1: CDT and CDP;
-
s2: CDT, CDP, F, and P;
-
s3: CDT, CDP, and 2 EGTs;
-
s4: CDT, CDP, F, P, and 4 EGTs;
-
s5: 8 (out of 16) EGTs;
-
s6: 16 (all) EGTs.
It has to be highlighted that the EGTs in s3, s4, and s5 are randomly selected. Moreover, spikes are implanted at different time stamps across variables, as in scenario 5.
In summary, in scenarios 1 through 3, all instances have spikes implanted in the same subset of variables, but in an increasing number of variables (2, 4, or 16). In scenarios 4 and 5, three different subsets of faulty variables are considered to increase the heterogeneity of the dataset as well as challenge both training and test phases. Moreover, in scenarios 1 through 4, for a given instance, the spikes are implanted at the same time stamps across variables. Instead, in scenario 5, spikes occur at different time stamps. Finally, to further increase the heterogeneity of the considered dataset and mimic a real-world situation, scenario 6 includes spikes implanted in six different subsets of variables (instead of three) and at different time stamps.

4.4.3. Fault Parameters

For each scenario, we investigate nine permutations of Δ and Φ, which derive from three values of the maximum fault magnitude, i.e., Δ = {1%, 2%, 4%}, and three values of Φ = {1%, 5%, 10%}, which defines the relative number of implanted spikes in each time series. The goal of this sensitivity analysis is the analysis of the influence of fault magnitude and frequency on prediction reliability. Moreover, a trade-off value of fault severity can be identified. It must be highlighted that, though the number of implanted spikes in each time series of length L is univocally determined by the parameter Φ, the number of implanted spikes in each segment (shorter time series of length w) may be different, since spikes occur at random locations. Also, fault magnitude is randomly calculated by means of Equation (4), where the parameter Δ represents the maximum possible magnitude. Thus, the number of spike occurrences is random across different segments (and, in turn, across different images) for a given value of the parameter Φ, and fault magnitude is probabilistically distributed up to the considered value of Δ. In other words, the number of implanted spikes can be different in each segment (and, thus, across images) and fault magnitude also varies from zero to the maximum value Δ.
It can be argued that the spikes characterized by the maximum magnitude of 1% are extremely hard to detect, since these spikes blend with normal data, which vary over time according to a change in ambient conditions and GT operation. The test cases characterized by Φ = 1% are also very challenging, since spikes are extremely sparse.
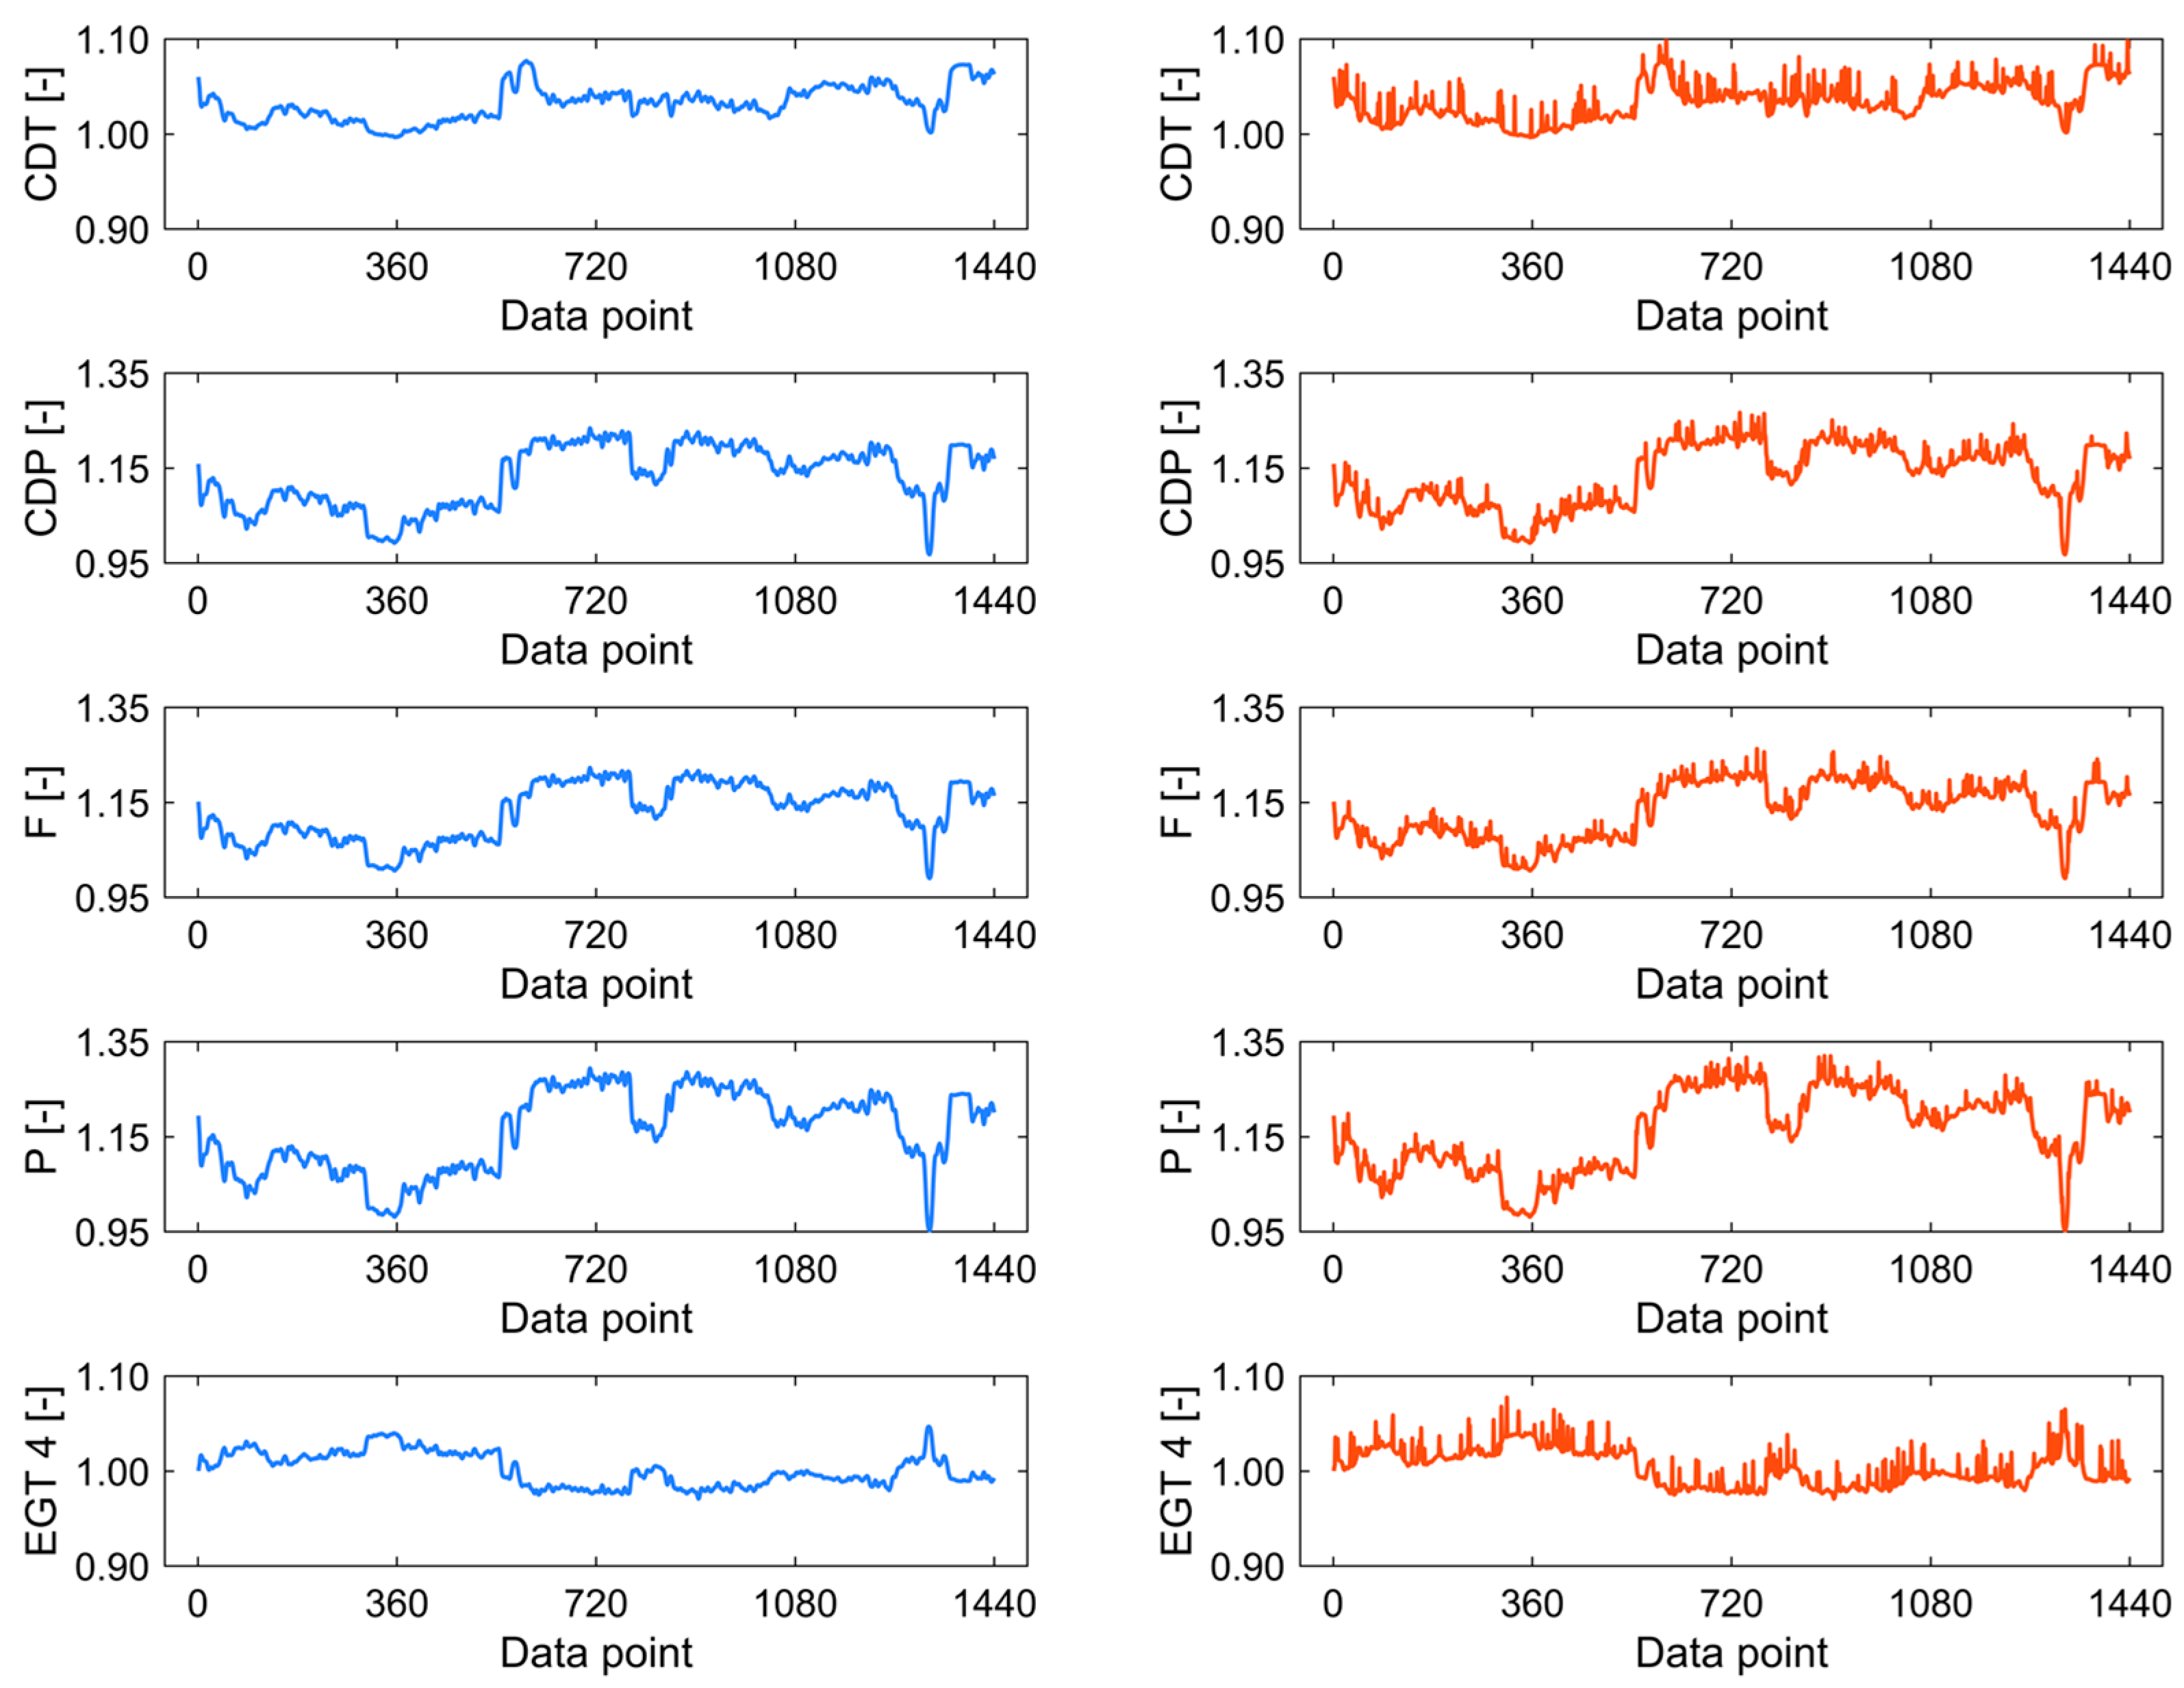
As an example of the trend over time of the field data employed in this paper and the corresponding implanted spikes, Figure 7 reports the trend over one day out of the 150 considered instances. Since the sampling frequency is one minute, the data points are 1440. For the sake of brevity, only one out of the sixteen EGTs (namely, EGT 4) is shown in Figure 7.
For confidentiality reasons, the values are rendered nondimensional by considering the mean value of a given variable across all instances. It can be observed that normal data (figures on the left) vary over time because the considered GTs are operated at different ambient and working conditions. For the variables CDP, P and F, variations are relatively large. For example, the variation of P over one day can be up to approximately 40%. As expected, the variables CDT, CDP, F, and P are related to each other, while EGT follows a different pattern.
The faulty data shown in Figure 7 on the right refer to scenario 6, with Δ = 4% and Φ = 10%, which is the most severe case. Spikes seem to be easy to identify, but it should be noted that their magnitude is very low compared to the scatter of normal data, mainly if both Δ and Φ are equal to 1%.
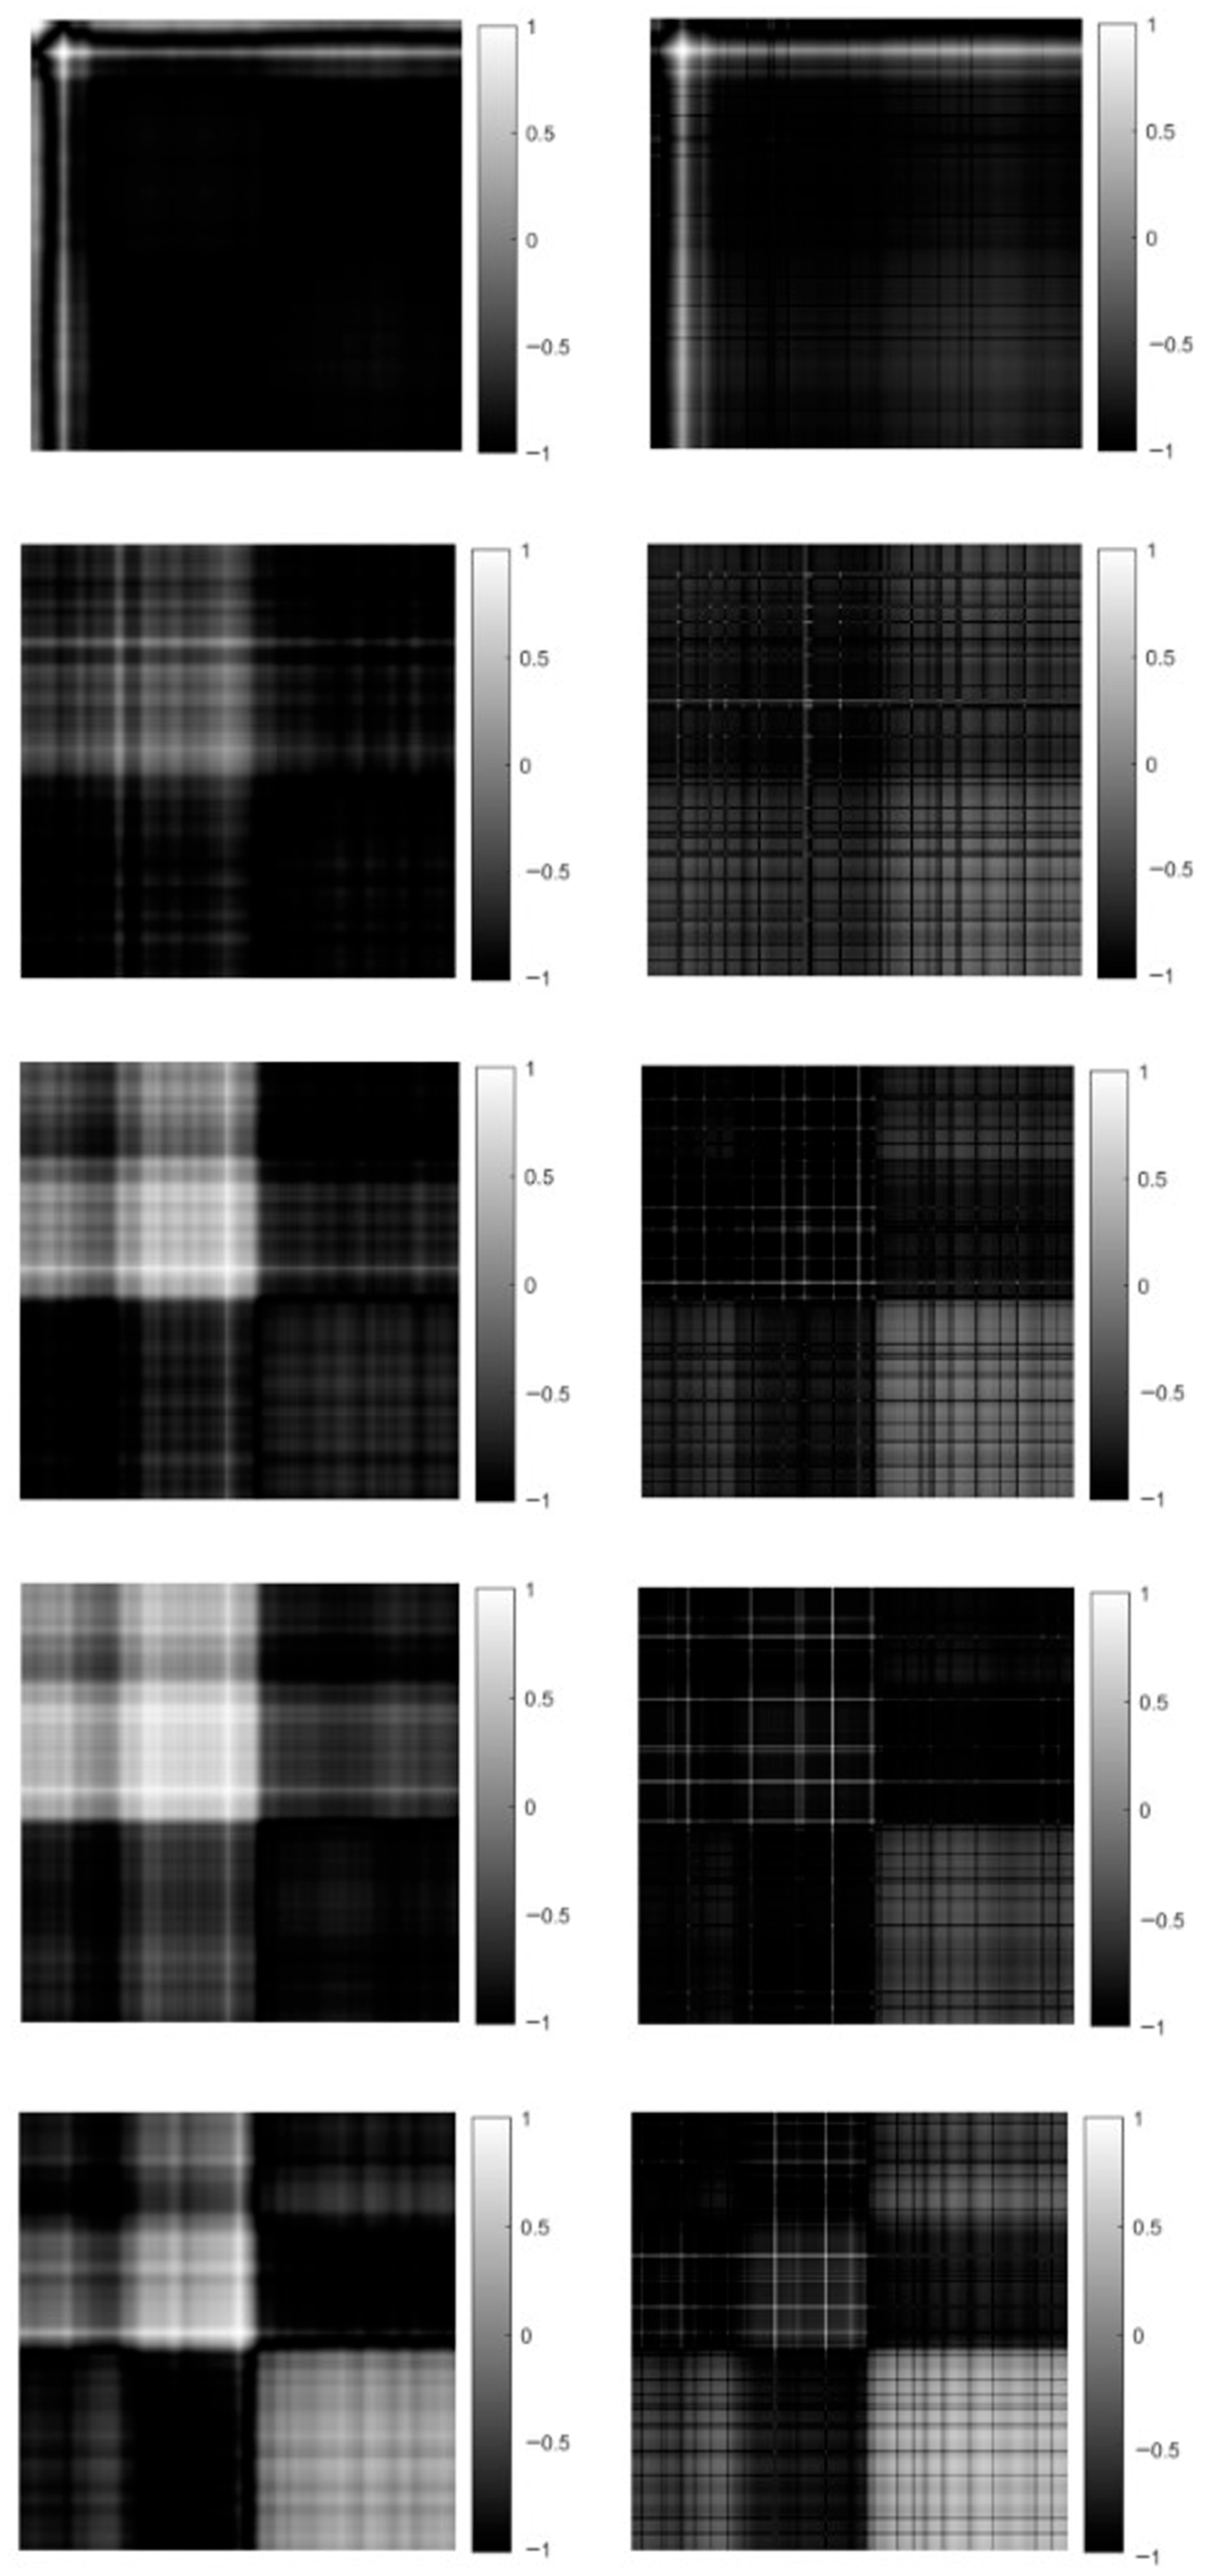
As an example, both GASF and MTF transformation methods are applied to the trends reported in Figure 7 and the resulting images are reported in Figure A1 and Figure A2 in the Appendix A. It should be noted that the scale of GASF images is [−1; 1], while the scale of MTF images is [0; 1].
Figure A1 and Figure A2 show that, in general, the difference between the image obtained from normal data and the one obtained from faulty data for a given variable is visually negligible. A macrolevel difference is that images of faulty data (on the right of Figure A1 and Figure A2) are more detailed (see the lines in GASF image and the smaller squares in MTF image), while images of normal data (on the left of Figure A1 and Figure A2) are blurred. In fact, the images obtained from normal data are more homogeneous, since they reflect data without the “perturbations” represented by the spikes. However, the two transformation methods highlight the implanted faults in a different manner. This comment explains the preference for the MTF method, as demonstrated in the Results section.

4.5. Prediction Reliability Assessment

We consider the Faulty class as the positive class and the Normal class as the negative class. The metrics defined in Equations (6) through (9) require the calculation of the number of true positive (tp), false positive (fp), true negative (tn), and false negative (fn) observations. If model prediction corresponds to the true label (“1” or “0”), a tp or tn is obtained. Conversely, fp and fn denote the wrong classification of an observation belonging to the Normal and Faulty class, respectively.
The precision metric (Prec) expresses the number of the positive observations that are correctly classified divided by the total number of positive predictions, as shown in Equation (6).
Prec = tp tp + fp
The recall metric (Rec) assesses whether a model can correctly classify true positives. As shown in Equation (7), Rec is estimated by dividing the number of true positives by the number of positive instances, which is the sum of true positives and false negatives.
Rec = tp tp + f n
For a binary classification task, the F1-score metric is also commonly employed. Such a metric is derived from Prec and Rec and focuses on the positive class, which is also the case of interest in this paper (in fact, the positive class is the Faulty class). The F1-score is in fact the harmonic mean between Prec and Rec, as shown in Equation (8).
F 1 - score = 2   ·   Prec   ·   Rec Prec + Rec
Finally, the accuracy metric (Acc) allows the quantification of the model’s overall reliability as it is calculated as the total number of properly classified observations (both for the positive and negative class) divided by the total number of tested observations, as shown in Equation (9).
Acc = tp + tn tp + fp + tn + fn
It should be noted that the metrics above vary from 0 (poorest reliability) to 1 (optimal reliability). Thus, the optimal model should have all these metrics close to 1.

5. Results and Discussion

In this section, we present and thoroughly discuss the results of the analyses carried out in this paper. First, the accuracy of the five prediction models in all fault scenarios is reported to compare the reliability of the proposed innovative methodology to that of a conventional approach for MTS classification. Then, the visualization techniques described in Section 3.4 are applied to investigate the pieces of information that CNN learns from image data.

5.1. Prediction Model Performance

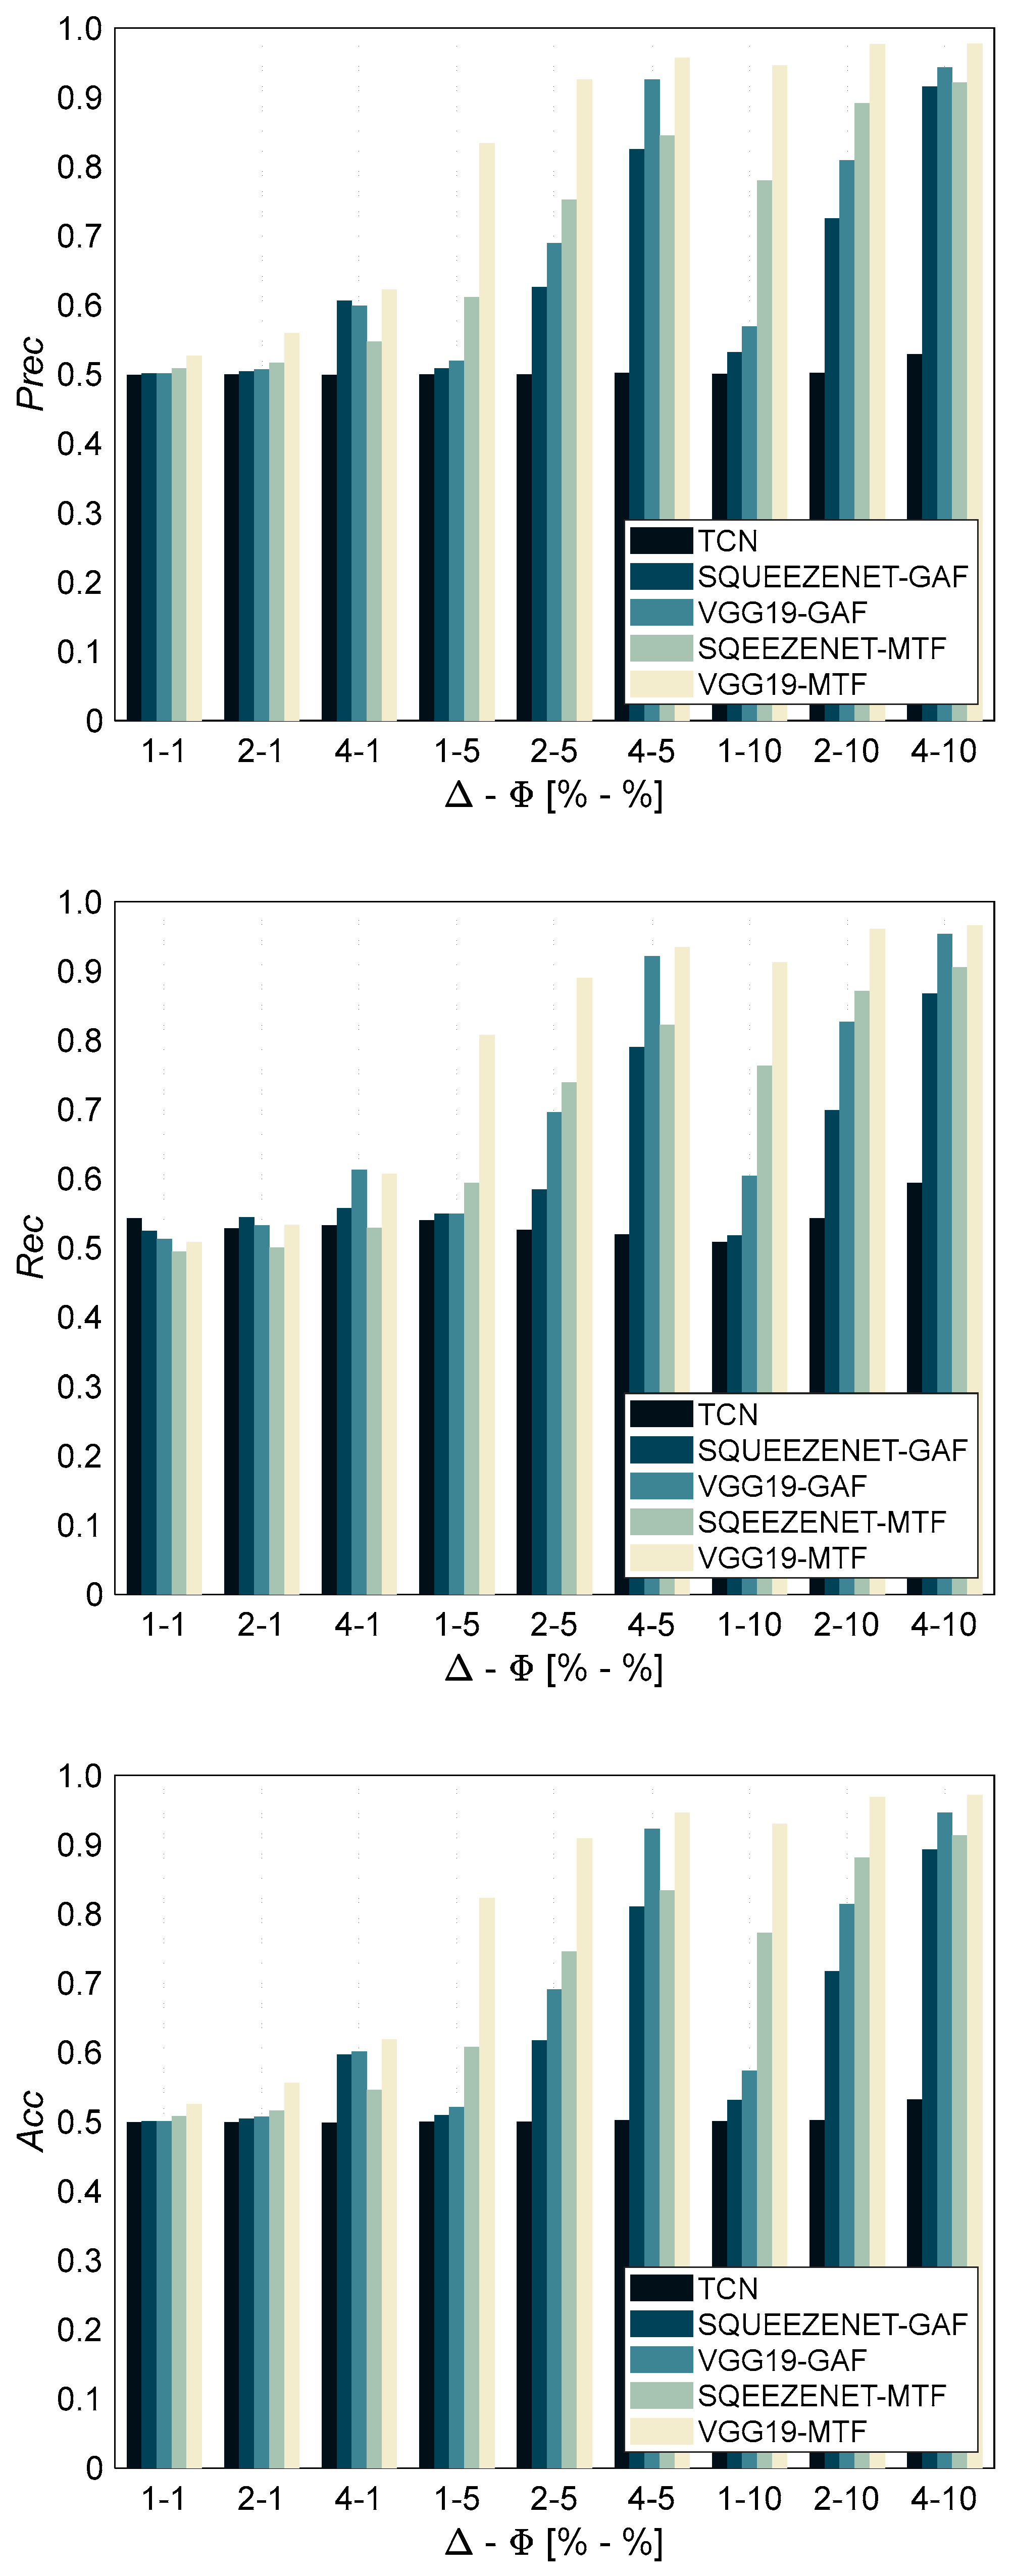
For the sake of completeness, the values of the Acc metric obtained by using the five prediction models for scenarios 1 through 6 are reported in Table 1, Table 2, Table 3, Table 4, Table 5 and Table 6, respectively. Instead, Figure 8 provides a synoptic view of the values of Prec, Rec, and Acc metrics for scenario 6 only, which is the most challenging and real-world scenario considered in this work.
For a given prediction model, the values of Acc for scenario 1 (see Table 1) and 2 (see Table 2) are very similar. Therefore, the following comments refer to both scenarios. Both VGG-19 and SqueezeNet models always outperform the TCN model, which provides accuracy values approximately equal to 0.5, regardless of the magnitude (Δ) and numerousness (Φ) of the implanted spikes. Moreover, as expected, the VGG-19 model almost always provides better classification reliability than the SqueezeNet model thanks to its higher complexity, even though the two CNNs tend to perform comparably if both Δ and Φ increase.
With regard to the transformation method, the results prove that the accuracy of VGG-19 and SqueezeNet models fed with GASF images is up to 0.8 and 0.9, respectively, while that of SqueezeNet-MTF and VGG19-MTF is very close to 1. Thus, CNN models fed with MTF images are more accurate than those trained with GASF images, especially in the case of low fault severity. It can also be observed that the GASF transformation method is more sensitive to the magnitude (Δ) of the implanted spikes. In fact, by passing from Δ = 1% to Δ = 4%, the increase in accuracy obtained by means of the VGG-19 model is approximately equal to 30% or 40% if Φ = 5% or Φ = 10%, respectively. Instead, the increase obtained by means of the SqueezeNet model is close to 20% (Φ = 5%) and 30% (Φ = 10%). Conversely, the MTF transformation method is more sensitive to the number of implanted spikes (Φ); while Acc values provided by both SqueezeNet and VGG-19 models are approximately equal to 0.5 at Φ = 1%, they are close to or even higher than 0.9 when Φ is equal to 5% and 10%; thus, the reliability of SqueezeNet-MTF and VGG19-MTF is very high regardless of spike magnitude.
The accuracy of all prediction models increases in scenario 3 (see Table 3) with respect to scenarios 1 and 2 (on average, TCN: +19%, SqueezeNet-GASF: +18%, VGG19-GASF: +21%, SqueezeNet-MTF: +8%, VGG19-MTF: +9%) thanks to the higher number of input variables affected by the spike fault, with the exception of the case Δ = 1% and Φ = 1%. The increase in accuracy clearly depends on fault magnitude and numerousness. TCN accuracy increases most when Δ = 4% and Φ ≥ 5%. Instead, for CNNs fed with images, Acc gain reduces by increasing fault severity since it tends to be very close to 1.
The results of scenario 3 further confirm that CNN models trained on MTF images are less sensitive to the numerosity of implanted spikes than those fed with GASF images. In fact, although the number of variables affected by the fault increases from 2 (scenario 1) or 4 (scenario 2) to 16 (scenario 3), the increase in Acc for SqueezeNet-MTF and VGG19-MTF is usually lower than 10%, while the increase varies from 15% up to 35% when using GASF images.
Also, in scenario 3, regardless of the adopted sequence-to-image transformation method, VGG-19 and SqueezeNet models significantly outperform TCN, when the smallest faults are considered (Δ < 4% and Φ < 10%).
However, spike faults characterized by Δ = 1% and Φ = 1% cannot be reliably predicted by any of the considered models, thus undoubtedly proving to be the lower detectable bounds for magnitude and numerousness. Instead, both approaches provide Acc close to 1 in case of the most severe faults (Δ = 4% and Φ ≥ 5%). This result also demonstrates that, unlike CNNs models fed with MTF images, the reliability of the TCN model is significantly affected by the number of faulty input variables as well as fault magnitude.
As discussed in Section 4.4.2, scenarios 4 through 6 include observations with spikes implanted in different subsets of variables. Moreover, in scenarios 5 and 6, spikes are implanted at different time stamps across variables. Such datasets, which mimic real-world data, are more heterogeneous than those of scenarios 1, 2, and 3, and, thus, further challenge the considered prediction models. Finally, it is also worth recalling that the datasets of scenario 4 include observations from scenarios 1 through 3.
It can be grasped from Table 4 that the classification accuracy of TCN models trained in scenario 4 on observations with spikes implanted in all EGTs is significantly lower (more than 20% lower when Δ ≥ 2% and Φ ≥ 5%) than that obtained by TCN models in scenario 3. Such performance deterioration is due to the increased heterogeneity of the dataset. Instead, the accuracy of TCN models trained in scenario 4 and tested on observations with spikes implanted in CDT and CDP variables or CDT, CDP, F, and P variables is almost the same as that of TCN models trained in scenario 1 or 2, respectively, and approximately equal to 0.5. In general, the results reported in Table 4 demonstrate that classification reliability of TCN models is very poor compared to that of CNNs fed with images. On the contrary, although the values of Rec are not reported in this paper for the sake of brevity, the results of scenario 4 demonstrate that the loss of accuracy of VGG19-MTF models trained in scenario 4 with respect to the models trained in scenarios 1 through 3 is lower than 4% on the Faulty class and 6% on the Normal class.
In scenario 5, in which, unlike in scenario 4, spikes can occur at different time stamps across variables, the prediction models perform as in scenario 4 (see Table 4 and Table 5). Consequently, the time randomness of spike occurrence does not affect the prediction accuracy of VGG-19 and SqueezeNet models. Finally, scenario 6 includes faulty observations with spikes implanted in six different subsets of variables, thus further increasing the heterogeneity of the dataset.
To further highlight the superiority of the proposed approach, in addition to benchmarking against TCNs, we also document the accuracy of both Long Short-Term Memory (LSTM) and Gated Recurrent Unit (GRU) networks. LSTM networks are recurrent neural networks capable of learning long-term dependencies embedded in a data sequence [26,27]. A GRU network is also a recurrent neural network, but has a simpler structure than an LSTM network and utilizes two gating mechanisms (namely, update gate and reset gate) to efficiently model temporal dependencies and, thus, reduce computational complexity. All the six scenarios were investigated, with spike faults characterized by Δ = 4% and Φ = 10%. The obtained accuracy values were comparable (LSTM: mean accuracy equal to 45% and standard deviation equal to 2%; GRU: mean accuracy equal to 46% and standard deviation equal to 3%) and in line with the accuracy obtained by using the TCN model (see Table 1, Table 2, Table 3, Table 4, Table 5 and Table 6). Such accuracy values are clearly poor, thus confirming the superiority of the proposed approach.
Figure 8 reports the values of Prec, Rec, and Acc for each prediction model, while Table A1, Table A2, Table A3, Table A4 and Table A5 in Appendix A report the values of Rec for each subset of faulty data, namely s1 through s6 (see Section 4.4.2).
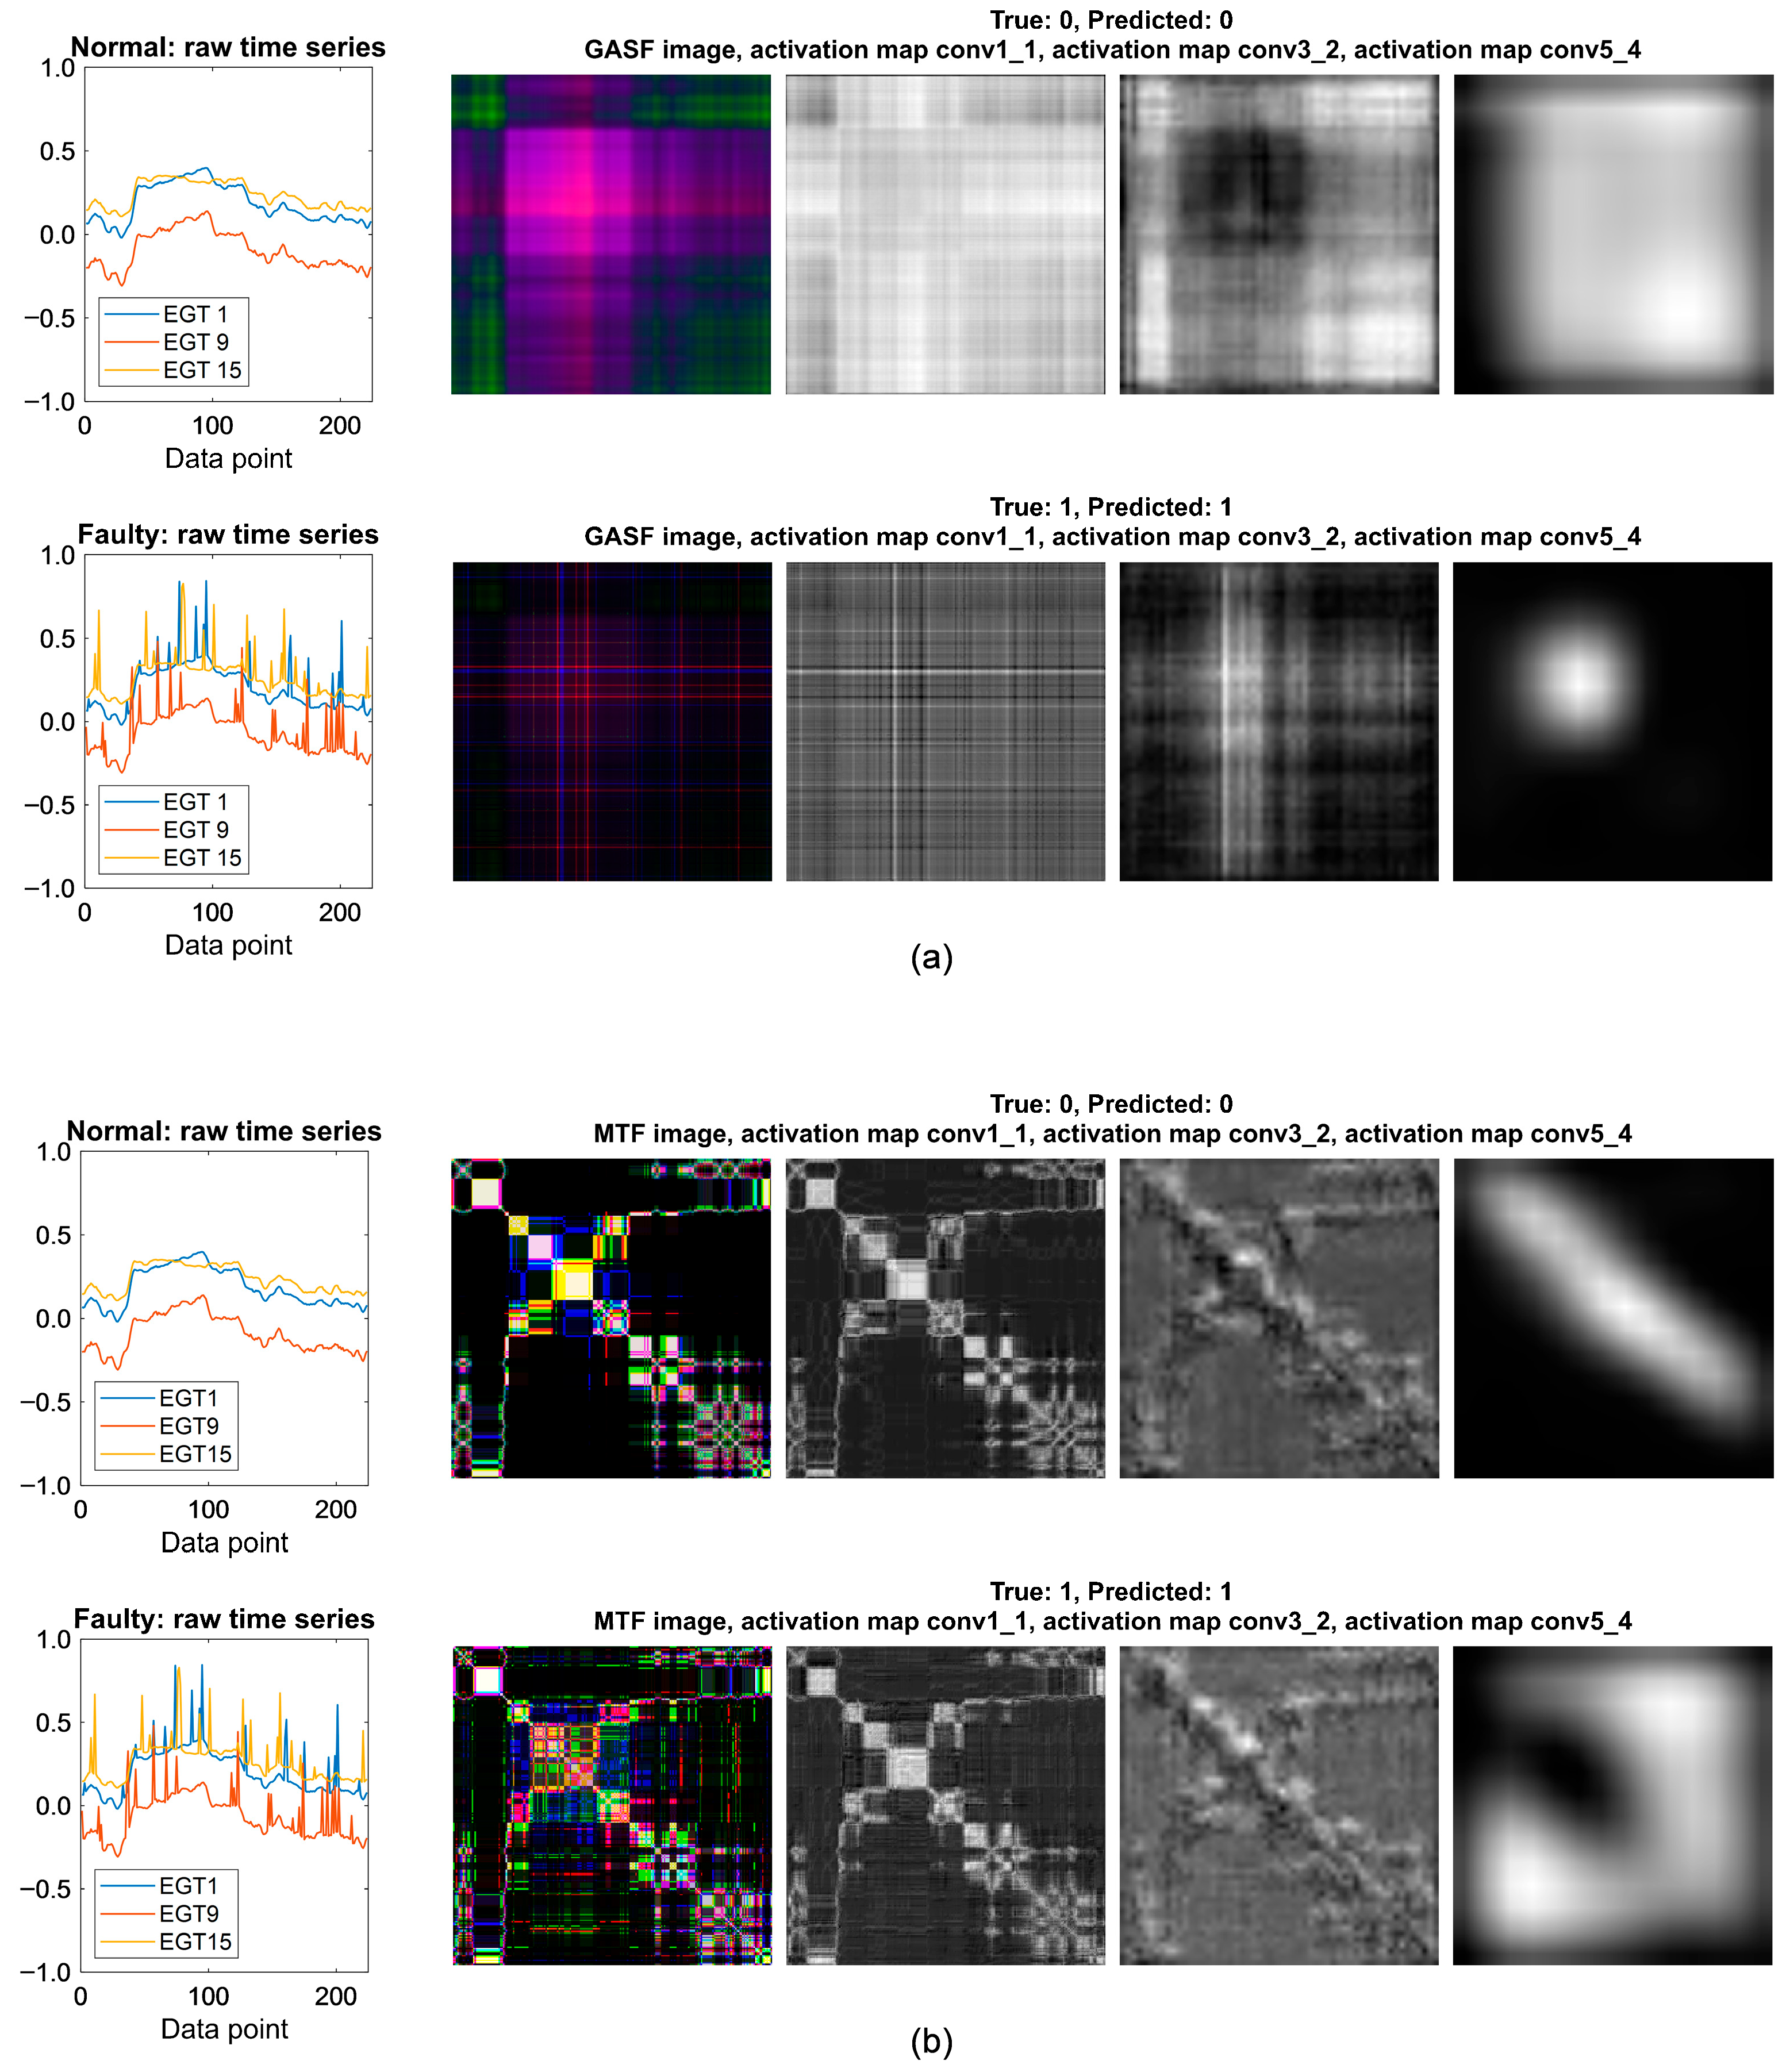
Also, in scenario 6, the five prediction models rank as in the previous scenarios in terms of classification reliability. As can be grasped from Figure 8, TCN models prove unsuitable for capturing the fault pattern over time. In fact, spikes represent isolated and random deviations that may be masked by the variability of the time series. Instead, if a sequence-to-image transformation (GASF or MTF) is performed, spikes reveal as stripes in the image (as discussed in Section 5.3) and CNNs can successfully learn such a pattern. As a consequence, VGG-19 and SqueezeNet models fed with images are remarkably more accurate and robust than TCN models. Furthermore, Figure 8 further corroborates the outcomes discussed above. VGG-19 architecture is more accurate than SqueezeNet architecture (+7% on average over the nine test cases) and MTF transformation allows enhanced classification accuracy with respect to GASF. The gain in accuracy is, on average, in the order of +10%.
The key achievements of this analysis can be summarized as follows:
  • VGG-19 and SqueezeNet architectures, fed with either GASF or MTF image data, almost always achieve significantly higher classification accuracy than TCN models fed with raw time series data, thus proving that the considered type of fault, i.e., a series of random and unrelated spikes of varying magnitude and frequency, can be more effectively detected by employing a 2D representation thanks to 2D convolutions. In fact, TCN models, as well as LSTM and GRU networks, are not able to grasp the temporal pattern embedded in the faulty data, which are affected by isolated and random spikes.
  • VGG-19-MTF outperforms SqueezeNet-MTF by at least 10% on average in scenario 6, but requires higher computational time (1.8× for training and 1.25× for inference).
  • The MTF method is more robust and allows for higher accuracy than the GASF method. In particular, CNN models trained by means of MTF images are less affected by spike magnitude and number of faulty input variables (i.e., channels of the image). However, it has to be highlighted that the MTF method itself requires Φ ≥ 1%, i.e., a sufficient numerosity of spikes over time.
  • Models trained on more heterogeneous datasets (scenarios 4 through 6) achieve slightly lower accuracy values, but are more general than models trained on a specific pattern of fault occurrence (scenarios 1 through 3).
To fully demonstrate the superiority of the MTF method, we also perform a further assessment of VGG19-MTF and VGG19-GASF models. For this analysis, each model, trained on a given combination of fault parameters Δ and Φ, is tested on datasets with a fault magnitude (Δ) and/or numerousness (Φ) different from the values used for training. Only scenario 6 is considered for this analysis. Since nine different combinations of fault parameters have been considered, 81 tests in total are conducted.
Figure 9 reports the outcomes of these tests by considering the F1-score metric. In fact, since this analysis only relies on the Faulty class, the metrics of interest are Prec and Rec and F1-score, which, as shown in Equation (8), quantifies model reliability on the Faulty class. Figure 9 proves that neither VGG19-MTF nor VGG19-GASF are reliable for predicting fault observations in test cases with Φ = 1%. Such an outcome sets Φ = 1% as the lower bound on the numerousness of spikes that can be predicted by the proposed methodology. However, it must be highlighted that this is a really challenging task. Nevertheless, VGG19-MTF models trained with Φ = 1% are generally more accurate than VGG19-GASF models (also trained with Φ = 1%) for predicting implanted spikes with Φ > 1%.
The results reported in Figure 9 convey the following key findings:
  • The F1-score of VGG19-MTF is higher than 0.9 in 21 out of 81 tests, while VGG19-GASF achieves F1-score values higher than 0.9 only in 3 out of 81 tests.
  • If Δ and/or Φ values considered for model testing are increased with respect to the values implanted in the data used for training, the F1-score of the VGG-19-MTF almost always increases (from 3% to 20%) with respect to the value achieved in the test with Δ and Φ values equal to those employed for training; instead, for VGG19-GASF, this outcome is verified only if both Δ and Φ increase with respect to the values used for training.
  • If Δ and/or Φ values considered for testing are lower than the ones used for training, the F1-score of VGG19-MTF always decreases, as expected. In particular, the higher the fault severity in the training data, the higher the drop of the F1-score by decreasing fault severity during testing. However, VGG19-MTF models trained with high Δ and/or Φ have the lowest drop of F1-score (less than 4%) if fault severity is only slightly decreased during testing.
  • If Δ and/or Φ values in the test data are lower than the corresponding values in the training data, the drop in the F1-score of VGG19-MTF is usually lower than that of VGG19-GASF. For example, if Δ is halved with respect to the training value, the decrease in the F1-score of VGG19-GASF is at least 25%, while that of the VGG19-MTF is negligible. On the other hand, if Φ is halved with respect to training, the F1-score of VGG19- MTF drops more (about 15–20%) than that of VGG19- GASF.
The outcomes above fully demonstrate the superior robustness and flexibility of the CNN models fed with data encoded by using the MTF method, since encoding time series data as images allows for the mining of temporal information in a 2D representation, which can be optimally exploited by CNNs.

5.2. Computational Complexity, Storage Requirements, and Computational Time

Understanding the computational complexity and storage requirements of sequence-to-image transformation methods is essential for assessing their applicability to large-scale time series analysis and, in turn, selecting the appropriate method for ML applications.
The computational complexity of the GASF and MTF methods depends on the steps involved in the transformation. For example, GASF relies on pairwise computations to construct a Gramian matrix, while MTF uses Markov transition probabilities, leading to different computational costs and storage implications. More details are given below.
The GASF transformation defined in Equation (3) has quadratic complexity, O(w2), due to the computation of a full w × w matrix from a time series x of length w. In fact, although element-wise squaring and subtraction and square root operation are characterized by O(w) complexity, the computation of outer products (i.e., pairwise multiplications between vectors) and subtractions between elements of w × w matrices are O(w2), thus inherently leading to overall quadratic complexity. This means that the number of computations for GASF transformation increases quadratically with the length of the time series and the computational cost may become very expensive for long time series. To mitigate this effect, time series segmentation can be applied, as made in this work, or piece-wise aggregation approximation can be adopted, as suggested in [35]. Finally, it should be noted that scaling the time series to [−1, 1] also has a linear computational cost and, thus, does not affect the overall computational time of the transformation.
The memory required to store an image is w2 · C · b, and clearly depends on image size (w × w × C) and data type used to store each pixel (b). In general, time series data are stored with single (float32) precision, i.e., 4 bytes are used to store each individual value. This means that, since, in this paper, w = 224 and C = 20, an image (GASF or MTF) requires approximately 4 MB, which leads to high storage capacity for large datasets and limits its feasibility.
To reduce the storage volume without losing accuracy, we stored each pixel of a GASF image with int16 precision, i.e., 2 bytes. In addition, since GASF images are symmetric, we only stored the upper/lower triangular part of the image, so that the number of stored pixels for each channel is almost halved (w · (w + 1)/2 instead of w2). In summary, the space required to store each GASF image is approximately 1 MB. This strategy allows for both reducing redundant storage and speeding up the process of feeding images to CNNs during training and inference. The stored images are retrieved from a local database and then the full image is efficiently reconstructed each time it needs to feed the CNN.
From the point of view of both computation time and memory allocation, transforming a time series into an MTF image is more efficient than using the GASF method, since an MTF image can be quickly obtained from a pre-computed Markov Transition Matrix (MTM) containing transition probabilities between quantiles. In fact, as described in Section 3.2.2, computing the MTM has a linear computational cost, O(w), since both (i) partitioning the time series into Q quantiles and (ii) calculating the transition probabilities pij for i, j = 1, …, Q require a single pass through the time series. Once computed, the MTM is spread out into the MTF matrix by considering temporal positions, and this calculation is performed by indexing the MTM matrix (very fast and efficient in both MATLAB® or Python environments) with the binned time series.
This approach also leads to storage advantages. Indeed, rather than storing an MTF image of size w × w × C (unlike GASF images, the MTF image is not symmetric), we stored the MTM of each channel, i.e., a matrix of dimension Q × Q × C. Although we stored probabilities with single precision (4 bytes for each value), we obtained a significant reduction in storage as Q << w. In particular, each MTM only requires 0.005 MB. The conversion from MTM to MTF is performed each time the image needs to feed the CNN, with minimal impact on computational time during both training and inference. Once the MTF image is obtained, as made for GASF images, its pixels are converted to int16 precision.
Table 7 summarizes the computational complexity and storage requirements of GASF and MTF methods. The MTF method proves to be by far superior to GASF method thanks to both its linear computational complexity and minimal storage requirements. These advantages make MTF particularly well suited for real-time, large-scale, or resource-constrained applications, thus enabling efficient preprocessing and integration into deep learning pipelines without compromising performance or scalability.
Table 8 reports the computational time of the CNN models developed in this paper. For both training and inference, Table 2 reports the average and standard deviation values (expressed in hours) of the computational time, calculated over all six scenarios and cross-validation runs.
Training a VGG-19 model takes approximately 0.6 h, while training a SqueezeNet takes roughly half the time. For comparison purposes, training a TCN model is up to 10 times faster than training a VGG-19 model.
The values reported in Table 8 refer to the CNN setting described in Section 4.4.1. The training dataset contains 9240 images, while the test dataset is 4620 images. In addition, one must account for the time required to transform the time series. In this paper, the time required to transform the entire time series dataset (23,100 time series) was equal to 0.45 min and 0.36 min for GASF and MTF methods, respectively. Thus, in this paper, the computational time required for sequence-to-image transformation, which, in general, depends on the length of the time series and dataset size, is very low and suitable for industrial applications.

5.3. CNN Visualization

In this section, we exploit the visualization techniques presented in Section 3.4 to investigate the features learnt by a CNN fed with image data with the aim of explaining CNN prediction. This process also allows for a qualitative validation of CNN training.
First, a comparison between a VGG-19 model trained on images obtained by means of the GASF method and a VGG-19 model trained on images obtained by means of the MTF method is conducted by visualizing network activations in three convolutional layers in order to highlight both the different features learnt by the two models as well as image modification through the CNN. The analysis is conducted by considering a normal and a faulty observation from scenario 6, with Δ = 4% and Φ = 10%. The comparison is presented in Figure 10a,b, which refer to VGG19-GASF and VGG19-MTF, respectively.
In Figure 10, the images from left to right refer to (i) the trend of 3 out of 20 raw time series, (ii) the corresponding RGB image, and (iii) the activation map at layers “conv1_1”, “conv3_2”, and “conv5_4”. For each convolutional layer, the map with the highest activations is considered. It has to be noted that we plot three time series (out of twenty) for the sake of readability. However, all CNN models have 20 inputs (equal to the number of available measurable variables), i.e., the input image has 20 channels. Both Figure 10a and Figure 10b report the normal observation on the top and the faulty observation on the bottom.
Figure 10 shows that GASF and MTF images are significantly different. In fact, in general, a GASF image of a normal observation has blurred edges since temporal correlations between data points of the raw time series are progressively encoded moving from the top-left to the bottom-right of the image. In the images including the implanted spikes (lower images of Figure 10a), spikes look like stripes of different intensity, resulting in a grid pattern in a 2D representation. Instead, the MTF method transforms the raw time series by means of discrete transition probabilities, thus generating an image with well-defined edges, where the color of the image sharply varies from one pixel to its neighbors if an abrupt change in the time series occurs. In fact, in Figure 10b, the image of a normal observation, composed of data that are expected to progressively vary over time, includes pixels on the main diagonal or in its proximity that tend to be more homogeneous. In fact, such data represent a self-transition probability (i.e., the two data points of the raw time series that contribute to a given pixel belong to the same quantile and the transition probability is the highest) or at least a transition probability between two adjacent quantiles. On the contrary, in a faulty observation, spikes are usually isolated and thus the transition probability that a spike is adjacent to a normal value is low compared to the transition probability between two normal data (i.e., highest transition probability). Consequently, the values of pixels are more scattered and vary more frequently.
It should be noted that the convolutional activation maps have a reduced size with respect to the input image, which implies lower resolution. In particular, the deeper the layer in the network, the lower the resolution of the activation map. For example, while the input image has size 224 × 224, the activation map of layers “conv1_1”, “conv3_2”, and “conv5_4” have sizes 224 × 224, 56 × 56, and 14 × 14, respectively. Thus, an upscaling method is required to obtain an activation map of the same size as the input image. The results shown in Figure 10 prove that, in general, convolutional filters in shallower layers (e.g., “conv1_1”) learn specific features about the texture of the image, while convolutional filters in deeper layers (e.g., “conv5_4”) learn more complex and general features about the characteristic pattern that distinguishes the observations of different classes.
In fact, as can be clearly seen in Figure 10b, the activation maps of layers “conv1_1” and “conv3_2” of VGG19-MTF look very similar for both normal and faulty observation, while, in the activation map of layer “conv5_4”, the pattern of the normal observation is significantly different from the pattern of the corresponding faulty observation. Similarly, VGG19-GASF (see Figure 10a) also learns different features in the case of normal or faulty observation. In fact, the model focuses on the regular decreasing pattern for the normal observation, while it maximally activates (see the almost square white region) in correspondence of the occurrence of the spikes in the raw time series for the faulty observation.
In summary, the analysis of Figure 10 demonstrates that VGG19-GASF and VGG19-MTF do learn different features, and this outcome explains the different performance for the considered classification task.
To further investigate CNN learning process, Figure 11 shows the activation maps of the layer “conv5_4” for 64 normal observations (see Figure 11a) and their corresponding observations with implanted spikes (see Figure 11b). These observations were randomly sampled from scenario 6, with Δ = 4% and Φ = 10%. Figure 11a clearly demonstrates that the VGG19-MTF model learns a similar pattern from normal observations by capturing the behavior of MTF images on the main diagonal and its proximity. Such a piece of information reflects the regular trend of raw data over time and the relationship among the considered measured variables. Instead, the pattern of faulty observations is more complex. In fact, it mostly reflects on pixels far from the main diagonal and changes across observations, since spikes occur randomly and affect different combinations of input variables.
Finally, Figure 12 allows the analysis of three additional visualization techniques, namely score maps of OS (Figure 12a), Grad-CAM (Figure 12b), and Grad-SM (Figure 12c), obtained by testing the VGG19-MTF model on the same faulty observation shown in Figure 10 (scenario 6; Δ = 4%; Φ = 10%). As can be noted, the three score maps have different resolutions. The size of the score map of OS depends on the dimension of the occlusion mask (equal to [56 56] pixels in this paper) and its stride (equal to 14 pixels in this paper). The size of the score map of Grad-CAM is equal to the dimension of the feature map used for the computation of gradients (i.e., layer “relu5_4” with size 14 × 14). Instead, the score map of Grad-SM has the same size as the input image, since it computes the gradients of the prediction score with respect to the input pixels.
Thus, upscaling was first applied to the score maps of OS and Grad-CAM and, subsequently, the scores of each map were normalized in the range [0, 1] for the sake of comparison, where “0” and “1” correspond to the lowest/highest importance.
Although the three score maps are different, they all agree that pixels of the upper-right part of the image are the most important for VGG19-MTF model prediction. At the same time, pixels on the main diagonal have the lowest importance in Grad-CAM and Grad-SM score maps since, as previously highlighted, the VGG19-MTF model exploits the pixels on the main diagonal to predict normal observations.

6. Conclusions

In this paper, with the final goal of identifying anomalies in time series, Convolutional Neural Networks (CNNs) were fed with images obtained from multivariate time series data, which were transformed by means of two different approaches, namely, Gramian Angular Summation Field (GASF) and Markov Transition Field (MTF). Two CNN architectures were investigated, namely VGG-19 and SqueezeNet, and compared to a Temporal Convolution Network (TCN) fed with time series data.
The case study consisted of 150 days of operation, taken from the 10 GTs and spread over multiple years. Twenty measured variables and six fault scenarios with implanted spikes of different magnitudes and frequency were analyzed.
The main outcome was that both VGG-19 and SqueezeNet models always outperformed the TCN model, with the VGG-19 model almost always preferable with respect to the SqueezeNet model. The best sequence-to-image transformation method was proven to be MTF. In the most realistic scenario, the VGG-19 model was more accurate than the SqueezeNet model (7% on average) and the MTF transformation method was always preferable, as it allowed for a gain in accuracy in the order of 10%. Rules of thumb about spike detectability were inferred.
CNN ability was also interpreted by means of four techniques suitable for visualizing the CNN learning process. It was visually demonstrated that the features learnt in the case of normal or faulty observations are different. Moreover, the transformation method (GASF or MTF) also made CNNs learn different features, thus clarifying the different classification accuracy.
Future works will further investigate the capabilities of CNNs fed with images. In addition to VGG-19 and SqueezeNet architectures, other CNN architectures (e.g., ResNet, MobileNet, DenseNet) will be investigated. Moreover, their capability will be also tested for different types of faults, such as drift and bias. Field data affected by faults will also be analyzed to validate the methodology in an operational environment. Moreover, model output will be further interpreted by means of visualization techniques to provide rules of thumb for field application.

Author Contributions

Conceptualization, E.L., M.V. and G.B.; methodology, E.L. and M.V.; software, E.L.; validation, E.L., M.V., L.M. and G.B.; formal analysis, E.L. and M.V.; investigation, E.L. and M.V.; resources, E.L., M.V., L.M. and G.B.; data curation, E.L.; writing—original draft preparation, E.L. and M.V.; writing—review and editing, E.L., M.V., L.M. and G.B.; visualization, E.L., M.V. and L.M.; supervision, M.V. and G.B.; project administration, M.V. and G.B.; funding acquisition, M.V. and G.B. All authors have read and agreed to the published version of the manuscript.

Funding

This research was funded by Siemens Energy.

Data Availability Statement

The datasets presented in this article are not available because of confidentiality reasons.

Acknowledgments

The authors gratefully acknowledge Siemens Energy for the permission to publish the results. The authors also wish to thank Carlo Antonio Caputo, who helped to review the final manuscript.

Conflicts of Interest

Author Giovanni Bechini was employed by the company Siemens Energy. The remaining authors declare that the research was conducted in the absence of any commercial or financial relationships that could be construed as potential conflicts of interest.

Abbreviations

Symbols
Accaccuracy
Cnumber of channels
CDPcompressor discharge pressure
CDTcompressor discharge temperature
D dataset
EGTexhaust gas temperature
Ffuel mass flow rate
F set of faulty instances
fnnumber of false negatives
fpnumber of false positives
himage height
F1-scoreF1-score
Imultichannel 2D image
Knumber of folds
𝒯 set of spike locations
Ltime series length
Nnumber of implanted spikes
pMarkov transition probability
Ppower output variable
Precprecision
qquantile
Recrecall
ssubset of faulty input variables
S set of normal instances
tnnumber of true negatives
tpnumber of true positives
wimage size
xdata point
x1D time series
x ~ rescaled 1D time series
x*faulty data point
Xmultivariate time series
yimage pixel
Y2D image
Greek letters
αrandom coefficient
δfault magnitude
Δrelative spike magnitude
Φrelative numerosity of implanted spikes
Subscripts and superscripts
i, jquantile counter
maxmaximum value
minminimum value
m, npixel counter
testtest
traintraining
Acronyms
AIArtificial Intelligence
AMActivation Map
CNNConvolutional Neural Network
DLDeep Learning
FCFully connected
GASFGramian Angular Summation Field
Grad-CAMGradient-based Class Activation Mapping
Grad-SMGradient-based Saliency Map
GRU Gated Recurrent Unit network
GTGas Turbine
LSTMLong Short-Term Memory network
MLMachine Learning
MTFMarkov Transition Field
MTSMultivariate Time Series
OSOcclusion Sensitivity
TCNTemporal Convolutional Network

Appendix A

Figure A1. Normal data (left) and faulty data (right) of the sample instance reported in Figure 7 (from top to bottom: CDT, CDP, F, P, EGT 4) for scenario 6 with Δ = 4% and Φ = 10%. Images obtained by means of the GASF transformation method.
Machines 13 00943 g0a1
Figure A2. Normal data (left) and faulty data (right) of the sample instance reported in Figure 7 (from top to bottom: CDT, CDP, F, P, EGT 4) for scenario 6 with Δ = 4% and Φ = 10%. Images obtained by means of the MTF transformation method.
Machines 13 00943 g0a2
Table A1. Recall values of TCN models on different subsets of data from scenario 6.
Fault
Parameters
Subset, s#
Δ-Φ [%-%]123456
1-10.6190.6140.4290.5860.5770.432
2-10.5690.6060.4380.5430.6210.392
4-10.5780.5810.4310.5490.5940.461
1-50.6570.5830.4640.5620.5520.423
2-50.6190.5440.4570.5860.5550.396
4-50.5760.6280.4210.5450.5720.376
1-100.5810.5510.4560.5340.5560.374
2-100.6030.5930.5050.5290.5790.446
4-100.6050.5880.4850.5980.7280.558
Table A2. Recall values of SqueezeNet-GASF models on different subsets of data from scenario 6.
Fault
Parameters
Subset, s#
Δ-Φ [%-%]123456
1-10.5440.5960.4730.5250.5820.428
2-10.6450.5770.4700.5950.5890.391
4-10.4460.3990.5140.6420.7060.638
1-50.5640.5940.5400.5900.6240.387
2-50.4420.4280.5000.6420.7900.706
4-50.5550.5330.7840.9570.9480.962
1-100.4710.4850.4750.5560.6380.482
2-100.4170.4380.6530.8620.9040.919
4-100.6720.6870.9230.9770.9830.964
Table A3. Recall values of VGG19-GASF models on different subsets of data from scenario 6.
Fault
Parameters
Subset, s#
Δ-Φ [%-%]123456
1-10.5860.5250.5030.5330.5940.334
2-10.5710.5560.5140.5610.6030.389
4-10.5300.5340.5040.6990.6750.736
1-50.5560.5550.5620.5830.6160.425
2-50.4780.5100.6310.8230.8500.885
4-50.7980.8430.9360.9860.9700.997
1-100.5040.5590.5340.6220.7410.666
2-100.5370.7030.8450.9640.9240.988
4-100.8550.9080.9571.0001.0001.000
Table A4. Recall values of SqueezeNet-MTF models on different subsets of data from scenario 6.
Fault
Parameters
Subset, s#
Δ-Φ [%-%]123456
1-10.5000.5330.4880.4850.4530.509
2-10.5300.5020.4730.4920.4700.535
4-10.4430.5140.5000.5720.5180.627
1-50.5440.5520.5810.6580.5330.694
2-50.6710.6640.7480.8490.6430.861
4-50.7660.7680.8390.9270.7110.920
1-100.7410.7130.8050.8740.5620.884
2-100.9010.8270.9300.9480.6530.967
4-100.9450.8840.9510.9680.6940.989
Table A5. Recall values of VGG19-MTF models on different subsets of data from scenario 6.
Fault
Parameters
Subset, s#
Δ-Φ [%-%]123456
1-10.4830.5240.4620.5160.4700.599
2-10.5090.4700.4740.5620.5000.684
4-10.5220.5380.5530.6590.5940.777
1-50.7400.7360.8030.8910.6950.979
2-50.8200.8360.9220.9740.7900.997
4-50.8950.9250.9580.9900.8420.998
1-100.9150.9000.9610.9810.7300.989
2-100.9600.9710.9880.9980.8510.997
4-100.9650.9810.9880.9970.8700.997

References

  1. Moghaddass, R.; Sheng, S. An anomaly detection framework for dynamic systems using a Bayesian hierarchical framework. Appl. Energy 2019, 240, 561–582. [Google Scholar] [CrossRef]
  2. Zio, E. Prognostics and Health Management (PHM): Where are we and where do we (need to) go in theory and practice. Reliab. Eng. Syst. Saf. 2022, 218, 108119. [Google Scholar] [CrossRef]
  3. Huang, C.; Bu, S.; Lee, H.H.; Chan, C.H.; Kong, S.W.; Yung, W.K.C. Prognostics and health management for predictive maintenance: A review. J. Manuf. Syst. 2024, 75, 78–101. [Google Scholar] [CrossRef]
  4. Surucu, O.; Gadsden, S.A.; Yawney, J. Condition Monitoring using Machine Learning: A Review of Theory, Applications, and Recent Advances. Expert Syst. Appl. 2023, 221, 119738. [Google Scholar] [CrossRef]
  5. Manservigi, L.; Venturini, M.; Ceschini, G.F.; Bechini, G.; Losi, E. Development and Validation of a General and Robust Methodology for the Detection and Classification of Gas Turbine Sensor Faults. J. Eng. Gas Turbines Power 2020, 142, 021009. [Google Scholar] [CrossRef]
  6. Zendehboudi, S.; Rezaei, N.; Lohi, A. Applications of hybrid models in chemical, petroleum, and energy systems: A systematic review. Appl. Energy 2018, 228, 2539–2566. [Google Scholar] [CrossRef]
  7. Prince, S.J.D. Understanding Deep Learning; The MIT Press: Cambridge, MA, USA, 2024; Available online: http://udlbook.com (accessed on 13 December 2024).
  8. Guo, J.; Yang, Y.; Li, H.; Wang, J.; Tang, A.; Shan, D.; Huang, B. A hybrid deep learning model towards fault diagnosis of drilling pump. Appl. Energy 2024, 372, 123773. [Google Scholar] [CrossRef]
  9. Marugána, A.P.; García Márquez, F.P.; Pinar Perez, J.M.; Ruiz-Hernández, D. A survey of artificial neural network in wind energy systems. Appl. Energy 2018, 228, 1822–1836. [Google Scholar] [CrossRef]
  10. Ko, J.U.; Na, K.; Oh, J.; Kim, J.; Youn, B.D. A new auto-encoder-based dynamic threshold to reduce false alarm rate for anomaly detection of steam turbines. Expert Syst. Appl. 2022, 189, 116094. [Google Scholar] [CrossRef]
  11. Hu, R.L.; Granderson, J.; Auslander, D.M.; Agogino, A. Design of machine learning models with domain experts for automated sensor selection for energy fault detection. Appl. Energy 2019, 235, 117–128. [Google Scholar] [CrossRef]
  12. Qin, Z.; Yu, F.; Liu, C.; Chen, X. How Convolutional Neural Networks See the World|A Survey of Convolutional Neural Network Visualization Methods. Math. Found. Comput. 2018, 1, 149–180. [Google Scholar] [CrossRef]
  13. Barra, S.; Carta, S.; Corriga, A.; Podda, A.S.; Reforgiato, D. Deep Learning and Time Series-to-Image Encoding for Financial Forecasting. IEEE/CAA J. Autom. Sin. 2020, 7, 683–692. [Google Scholar]
  14. Hyun, Y.; Yoo, Y.; Kim, Y.; Lee, T.; Kim, W. Encoding Time Series as Images for Anomaly Detection in Manufacturing Processes Using Convolutional Neural Networks and Grad-CAM. Int. J. Precis. Eng. Manuf. 2024, 25, 2583–2598. [Google Scholar] [CrossRef]
  15. Yang, J.; Sun, Y.; Chen, Y.; Mao, M.; Bai, L.; Zhang, S. Time series-to-image encoding for saturation line prediction using channel and spatial-wise attention network. Expert Syst. Appl. 2024, 237, 121440. [Google Scholar] [CrossRef]
  16. Simonyan, K.; Vedaldi, A.; Zisserman, A. Deep Inside Convolutional Networks: Visualising Image Classification Models and Saliency Maps. In Proceedings of the 2nd International Conference on Learning Representations, ICLR 2014, Banff, AB, Canada, 14–16 April 2014; 1312. [Google Scholar] [CrossRef]
  17. Mathioudakis, K.; Alexiou, A.; Aretakis, N.; Romesis, C. Signatures of Compressor and Turbine Faults in Gas Turbine Performance Diagnostics: A Review. Energies 2024, 17, 3409. [Google Scholar] [CrossRef]
  18. Brahimi, L.; Hadroug, N.; Iratni, A.; Hafaif, A.; Colak, I. Advancing predictive maintenance for gas turbines: An intelligent monitoring approach with ANFIS, LSTM, and reliability analysis. Comput. Ind. Eng. 2024, 191, 110094. [Google Scholar] [CrossRef]
  19. Arena s Florian, E.; Sgarbossa, F.; Sølvsberg, E.; Zennaro, I. A conceptual framework for machine learning algorithm selection for predictive maintenance. Eng. Appl. Artif. Intell. 2024, 133, 108340. [Google Scholar] [CrossRef]
  20. Rivas, A.; Delipei, G.K.; Davis, I.; Bhongale, S.; Yang, J.; Hou, J. A component diagnostic and prognostic framework for pump bearings based on deep learning with data augmentation. Reliab. Eng. Syst. Saf. 2024, 247, 110121. [Google Scholar] [CrossRef]
  21. Abed, A.I.; Ping, L.W. Implementing data mining techniques for gas-turbine (GT) health tracking and life management: The bibliographic perspective. Expert Syst. Appl. 2024, 252, 124077. [Google Scholar] [CrossRef]
  22. Bai, M.; Yang, X.; Liu, J.; Liu, J.; Yu, D. Convolutional neural network-based deep transfer learning for fault detection of gas turbine combustion chambers. Appl. Energy 2021, 302, 117509. [Google Scholar] [CrossRef]
  23. Irani, F.N.; Soleimani, M.; Yadegar, M.; Meskin, N. Deep transfer learning strategy in intelligent fault diagnosis of gas turbines based on the Koopman operator. Appl. Energy 2024, 365, 123256. [Google Scholar] [CrossRef]
  24. Sun, J.; Yan, Z.; Han, Y.; Zhu, X.; Yang, C. Deep learning framework for gas turbine performance digital twin and degradation prognostics from airline operator perspective. Reliab. Eng. Syst. Saf. 2023, 238, 109404. [Google Scholar] [CrossRef]
  25. Bettocchi, R.; Pinelli, M.; Spina, P.R.; Venturini, M. Artificial Intelligence for the Diagnostics of Gas Turbines. Part I: Neural Network Approach. ASME J. Eng. Gas Turbines Power 2007, 129, 711–719. [Google Scholar] [CrossRef]
  26. Losi, E.; Venturini, M.; Manservigi, L.; Bechini, G. Ensemble Learning Approach to the Prediction of Gas Turbine Trip. J. Eng. Gas Turbines Power 2023, 145, 021009. [Google Scholar] [CrossRef]
  27. Losi, E.; Venturini, M.; Manservigi, L.; Bechini, G. Methodology to Monitor Early Warnings Before Gas Turbine Trip. J. Eng. Gas Turbines Power 2024, 146, 051005. [Google Scholar] [CrossRef]
  28. Wen, Y.; Rahman Md, F.; Xu, H.; Tseng, T.-L.B. Recent advances and trends of predictive maintenance from data-driven machine prognostics perspective. Measurement 2022, 187, 110276. [Google Scholar] [CrossRef]
  29. Li, Q.; Tang, Y.; Chu, L. Generative adversarial networks for prognostic and health management of industrial systems: A review. Expert Syst. Appl. 2024, 253, 124341. [Google Scholar] [CrossRef]
  30. Losi, E.; Manservigi, L.; Spina, P.R.; Venturini, M. Data-driven Generative Model Aimed to Create Synthetic Data for the Long-Term Forecast of Gas Turbine Operation. In Proceedings of the ASME Turbo Expo 2024: Turbomachinery Technical Conference and Exposition, London, UK, 24–28 June 2024. ASME Paper GT2024-122162. [Google Scholar]
  31. Sok, R.; Jeyamoorthy, A.; Kusaka, J. Novel virtual sensors development based on machine learning combined with convolutional neural-network image processing-translation for feedback control systems of internal combustion engines. Appl. Energy 2024, 365, 123224. [Google Scholar] [CrossRef]
  32. Thiel, M.; Romano, M.C.; Kurths, J. How much information is contained in a recurrence plot? Phys. Lett. A 2004, 330, 343–349. [Google Scholar] [CrossRef]
  33. McGuire, G.; Azar, N.B.; Shelhamer, M. Recurrence matrices and the preservation of dynamical properties. Phys. Lett. A 1997, 237, 41–43. [Google Scholar] [CrossRef]
  34. Łuczak, D. Machine Fault Diagnosis through Vibration Analysis: Time Series Conversion to Grayscale and RGB Images for Recognition via Convolutional Neural Networks. Energies 2024, 17, 1998. [Google Scholar] [CrossRef]
  35. Wang, Z.; Oates, T. Encoding Time Series as Images for Visual Inspection and Classification Using Tiled Convolutional Neural Networks. In Proceedings of the AAAI-15 (Twenty-Ninth Conference on Artificial Intelligence), Austin, TX, USA, 25–30 January 2015. [Google Scholar]
  36. Wang, Z.; Oates, T. Imaging Time-Series to Improve Classification and Imputation. In Proceedings of the IJCAI’15: 24th International Conference on Artificial Intelligence, Buenos Aires, Argentina, 25–31 July 2015. [Google Scholar] [CrossRef]
  37. Xu, H.; Li, J.; Yuan, H.; Liu, Q.; Fan, S.; Li, T.; Sun, X. Human Activity Recognition Based on Gramian Angular Field and Deep Convolutional Neural Network. IEEE Access 2020, 8, 199393–199405. [Google Scholar] [CrossRef]
  38. Jiang, W.; Zhang, D.; Ling, L.; Lin, R. Time Series Classification Based on Image Transformation Using Feature Fusion Strategy. Neural Process. Lett. 2022, 54, 3727–3748. [Google Scholar] [CrossRef]
  39. Sayed, A.N.; Himeur, Y.; Bensaali, F. From time-series to 2D images for building occupancy prediction using deep transfer learning. Eng. Appl. Artif. Intell. 2023, 119, 105786. [Google Scholar] [CrossRef]
  40. Li, X.; Zhang, J.; Xiao, B.; Zeng, Y.; Lv, S.; Qian, J.; Du, Z. Fault Diagnosis of Hydropower Units Based on Gramian Angular Summation Field and Parallel CNN. Energies 2024, 17, 3084. [Google Scholar] [CrossRef]
  41. Zeiler, M.D.; Fergus, R. Visualizing and Understanding Convolutional Networks. In Computer Vision—ECCV 2014. ECCV 2014. Lecture Notes in Computer Science; Fleet, D., Pajdla, T., Schiele, B., Tuytelaars, T., Eds.; Springer: Cham, Switzerland, 2014; Volume 8689. [Google Scholar] [CrossRef]
  42. Bach, S.; Binder, A.; Montavon, G.; Klauschen, F.; Müller, K.-R.; Samek, W. On Pixel-Wise Explanations for Non-Linear Classifier Decisions by Layer-Wise Relevance Propagation. PLoS ONE 2015, 10, e0130140. [Google Scholar] [CrossRef]
  43. Yosinski, J.; Clune, J.; Nguyen, A.; Fuchs, T.; Lipson, H. Understanding Neural Networks Through Deep Visualization. In Proceedings of the 31st International Conference on Machine Learning, Lille, France, 6–11 July 2015; 1506. [Google Scholar] [CrossRef]
  44. Yu, W.; Yang, K.; Bai, Y.; Rui, Y.; Yao, H. Visualizing and Comparing Convolutional Neural Networks. In Proceedings of the ICLR 2015 Conference, San Diego, CA, USA, 7–9 May 2015; 1412. [Google Scholar] [CrossRef]
  45. Zhou, B.; Khosla, A.; Lapedriza, A.; Oliva, A.; Torralba, A. Learning Deep Features for Discriminative Localization. In Proceedings of the 2016 IEEE Conference on Computer Vision and Pattern Recognition (CVPR), Las Vegas, NV, USA, 26 June–1 July 2016. [Google Scholar]
  46. Samek, W.; Wiegand, T.; Muller, K.-R. Explainable Artificial Intelligence: Understanding, Visualizing and Interpreting Deep Learning Models. arXiv 2017, arXiv:1708.08296v1. [Google Scholar] [CrossRef]
  47. Liu, L.; Wang, Z. Encoding Temporal Markov Dynamics in Graph for Visualizing and Mining Time Series, AAAI 2018 workshop. arXiv 2018, arXiv:1610.07273. [Google Scholar] [CrossRef]
  48. Montavon, G.; Binder, A.; Lapuschkin, S.; Samek, W.; Müller, K.R. Layer-Wise Relevance Propagation: An Overview. In Explainable AI: Interpreting, Explaining and Visualizing Deep Learning; Lecture Notes in Computer Science; Samek, W., Montavon, G., Vedaldi, A., Hansen, L., Müller, K.R., Eds.; Springer: Cham, Switzerland, 2019; Volume 11700. [Google Scholar] [CrossRef]
  49. Iwana, B.K.; Kuroki, R.; Uchida, S. Explaining Convolutional Neural Networks using Softmax Gradient Layer-wise Relevance Propagation. arXiv 2019, arXiv:1908.04351v3. [Google Scholar] [CrossRef]
  50. Selvaraju, R.R.; Cogswell, M.; Das, A.; Vedantam, R.; Parikh, D.; Batra, D. Grad-CAM: Visual Explanations from Deep Networks via Gradient-Based Localization. Int. J. Comput. Vis. 2020, 128, 336–359. [Google Scholar] [CrossRef]
  51. Ruan, Y.; Zheng, M.; Qian, F.; Meng, H.; Yao, J.; Xu, T.; Pei, D. Fault detection and diagnosis of energy system based on deep learning image recognition model under the condition of imbalanced samples. Appl. Therm. Eng. 2024, 238, 122051. [Google Scholar] [CrossRef]
  52. Płuciennik, P.; Jaśkiewicz, M.; Liśkiewicz, G. Classification of Compressors Stability Using an Image Recognition Machine Learning Model. In Proceedings of the ASME Turbo Expo 2025: Turbomachinery Technical Conference and Exposition, Memphis, TN, USA, 16–20 June 2025. ASME Paper GT2025-154137. [Google Scholar]
  53. Losi, E.; Venturini, M.; Manservigi, L.; Bechini, G. Gas Turbine Diagnostics by Means of Convolutional Neural Networks Fed With Time Series Data Encoded as Images. ASME J. Eng. Gas Turbines Power 2025, 1–25. [Google Scholar] [CrossRef]
  54. Simonyan, K.; Zisserman, A. Very Deep Convolutional Networks for Large-Scale Image Recognition. In Proceedings of the 3rd International Conference on Learning Representations, ICLR 2015, San Diego, CA, USA, 7–9 May 2015. [Google Scholar]
  55. Iandola, F.N.; Han, S.; Moskewicz, M.W.; Ashraf, K.; Dally, W.J.; Keutzer, K. SqueezeNet: AlexNet-level accuracy with 50x fewer parameters and <0.5 MB model size. In Proceedings of the 5th International Conference on Learning Representations, ICLR 2017, Toulon, France, 24–26 April 2017. [Google Scholar]
  56. Iandola, F.N. SqueezeNet. Available online: https://github.com/forresti/SqueezeNet/tree/master/SqueezeNet_v1.1 (accessed on 13 December 2024).
  57. Lo, C.; Lynch, J.P.; Liu, M. Distributed Model-Based Nonlinear Sensor Fault Diagnosis in Wireless Sensor Networks. Mech. Syst. Signal Process. 2016, 66–67, 470–484. [Google Scholar] [CrossRef]
  58. Muhammed, T.; Shaikh, R.A. An Analysis of Fault Detection Strategies in Wireless Sensor Networks. J. Netw. Comput. Appl. 2017, 78, 267–287. [Google Scholar] [CrossRef]
  59. Jombo, G.; Zhang, Y.; Griffiths, J.D. Automated Gas Turbine Sensor Fault Diagnostics. In Proceedings of the ASME Turbo Expo 2018: Turbomachinery Technical Conference and Exposition, Oslo, Norway, 11–15 June 2018. ASME Paper No. GT2018-75229. [Google Scholar]
  60. Kingma, D.; Ba, J. Adam: A Method for Stochastic Optimization. In Proceedings of the 3rd International Conference on Learning Representations (ICLR), 2015, San Diego, CA, USA, 7–9 May 2015. [Google Scholar]
Figure 1. Overview of the proposed approach.
Machines 13 00943 g001
Figure 2. Workflow of the proposed methodology.
Machines 13 00943 g002
Figure 3. Convolution operation (a) and max pooling operation (b).
Machines 13 00943 g003
Figure 4. Architecture of the VGG-19 model.
Machines 13 00943 g004
Figure 5. Architecture of the SqueezeNet model.
Machines 13 00943 g005
Figure 6. Procedure for preparing training and test datasets.
Machines 13 00943 g006
Figure 7. Example of normal data and faulty data (scenario 6; Δ = 4% and Φ = 10%) for a sample instance.
Machines 13 00943 g007
Figure 8. Precision, recall, and accuracy values for scenario 6.
Machines 13 00943 g008
Figure 9. F1-score values for scenario 6 (fault parameters used for training on the rows; fault parameters used for test on the columns)—(a) VGG19-GASF model; (b) VGG19-MTF.
Machines 13 00943 g009
Figure 10. RGB image and activation maps in three layers for normal and faulty data: (a) GASF image; (b) MTF image.
Machines 13 00943 g010
Figure 11. Activations of the layer “conv5_4” of the VGG19-MTF model trained on scenario 6 (Δ = 4%; Φ = 10%) for 64 normal (a) and faulty (b) observations.
Machines 13 00943 g011
Figure 12. Score maps obtained on one sample faulty observation taken from scenario 6 (Δ = 4%; Φ = 10%) by using VGG19-MTF model: OS (a), Grad-CAM (b), and Grad-SM (c).
Machines 13 00943 g012
Table 1. Accuracy values for scenario 1.
Fault ParametersPrediction Model
Δ-Φ [%-%]TCNSqueezeNet-GASFVGG19-GASFSqueezeNet-MTFVGG19-MTF
1-10.5000.5000.5000.5010.513
2-10.5000.5000.5010.5070.516
4-10.5000.5020.5020.5150.541
1-50.5000.5010.5020.6790.848
2-50.5000.5100.5110.8090.897
4-50.5020.6090.6660.8970.951
1-100.5000.5020.5060.9210.973
2-100.5010.5730.6420.9710.988
4-100.5050.7460.8560.9830.990
Table 2. Accuracy values for scenario 2.
Fault ParametersPrediction Model
Δ-Φ [%-%]TCNSqueezeNet-GASFVGG19-GASFSqueezeNet-MTFVGG19-MTF
1-10.5000.5000.5000.5050.514
2-10.5000.5000.5000.5080.526
4-10.5000.5040.5030.5240.565
1-50.5000.5010.5020.6950.845
2-50.5000.5140.5300.8220.931
4-50.5000.6620.7700.8890.963
1-100.5000.5050.5070.9190.973
2-100.5010.5730.6710.9700.989
4-100.5020.7780.8790.9750.992
Table 3. Accuracy values for scenario 3.
Fault ParametersPrediction Model
Δ-Φ [%-%]TCNSqueezeNet-GASFVGG19-GASFSqueezeNet-MTFVGG19-MTF
1-10.5000.5050.5030.5250.620
2-10.5000.6040.5670.5890.770
4-10.5040.9280.9850.6570.850
1-50.5010.6850.7670.8820.960
2-50.7180.9560.9860.9580.990
4-50.9970.9920.9990.9800.990
1-100.5060.8850.9580.9710.980
2-100.9760.9870.9920.9900.990
4-101.0000.9980.9960.9901.000
Table 4. Accuracy values for scenario 4.
Fault ParametersPrediction Model
Δ-Φ [%-%]TCNSqueezeNet-GASFVGG19-GASFSqueezeNet-MTFVGG19-MTF
1-10.5000.5010.5010.5040.517
2-10.5000.5080.5040.5090.522
4-10.5010.5620.5750.5120.540
1-50.5000.5120.5160.5770.784
2-50.5010.5810.6530.6640.894
4-50.5600.7980.9030.7690.937
1-100.5010.5290.5560.7660.931
2-100.5120.7030.8130.8890.971
4-100.6070.8710.9490.9240.979
Table 5. Accuracy values for scenario 5.
Fault ParametersPrediction Model
Δ-Φ [%-%]TCNSqueezeNet-GASFVGG19-GASFSqueezeNet-MTFVGG19-MTF
1-10.5000.5010.5010.5070.525
2-10.5000.5030.5110.5130.559
4-10.5000.5510.5570.5330.603
1-50.5000.5070.5160.6210.837
2-50.5020.5550.6260.7590.920
4-50.5070.7720.9210.8500.961
1-100.5000.5180.5480.8200.957
2-100.5060.6520.7830.9150.980
4-100.5500.8670.9570.9500.985
Table 6. Accuracy values for scenario 6.
Fault ParametersPrediction Model
Δ-Φ [%-%]TCNSqueezeNet-GASFVGG19-GASFSqueezeNet-MTFVGG19-MTF
1-10.5000.5010.5010.5090.525
2-10.5000.5050.5080.5170.556
4-10.4990.5970.6010.5460.619
1-50.5000.5100.5210.6080.823
2-50.5000.6170.6910.7450.909
4-50.5030.8110.9230.8340.946
1-100.5010.5310.5740.7730.930
2-100.5030.7170.8140.8820.969
4-100.5320.8930.9460.9140.972
Table 7. Summary of computational complexity and storage requirements of GASF and MTF methods.
MethodComputational ComplexityOptimization StrategyStorage RequirementStore PrecisionSize
(MB)
GASFO(w2)Store only the upper triangular partO(w2/2)int16
(2 bytes)
4
MTFO(w)Store the entire
MTM matrix
O(Q2)float32
(4 bytes)
0.005
Table 8. Summary of computational time required for CNN models.
ModelTraining Time [Hours]Inference Time [Hours]
VGG19-MTF0.625 ± 0.0170.013 ± 0.002
VGG19-GASF0.631 ± 0.0380.023 ± 0.002
SqueezeNet-MTF0.328 ± 0.0020.010 ± 0.002
SqueezeNet-GASF0.410 ± 0.0030.023 ± 0.003
Disclaimer/Publisher’s Note: The statements, opinions and data contained in all publications are solely those of the individual author(s) and contributor(s) and not of MDPI and/or the editor(s). MDPI and/or the editor(s) disclaim responsibility for any injury to people or property resulting from any ideas, methods, instructions or products referred to in the content.