Abstract
Promoting the green transformation of traditional diesel-powered ships is crucial for achieving carbon peaking and carbon neutrality goals. This study focuses on diesel-engine ships operating in the inland river areas of Anhui Province, China. It proposes two electrification retrofit schemes based mainly on lithium iron phosphate (LIP) batteries: full electrification and diesel-engine redundancy. The economic and environmental impacts of these schemes are analyzed and compared with those of conventional diesel-powered ships. A cost prediction algorithm based on model prediction is proposed, supported by a mathematical model for cost analysis. Results indicate that for electric tankers to become economically viable, battery costs must decrease through yearly improvements in energy density and reduced degradation rates. Additionally, government support is essential, such as raising carbon prices and providing subsidies—either an annual operational subsidy of CNY 80,000 or an initial construction subsidy of CNY 500,000. The study concludes that continued advances in battery technology, together with policy and financial support, will accelerate the large-scale electrification of ships.
1. Introduction
The extensive 6503.93-km inland waterway network and the Yangtze River Delta location of Anhui make it ideal for shipping development, as recognized in the regional integration plan covering Shanghai, Jiangsu, Zhejiang, and Anhui.
According to the National Bureau of Statistics, Anhui has dominated China’s waterborne freight transport since 2013, with the 2022 volumes exceeding 1.4 billion metric tons. Anhui shipyards specialize in inland ships and also produce ocean-going ships, which meet rigorous quality standards and boast world-class shipbuilding capabilities. Wuhu Shipyard’s CCS-classified 6600-ton chemical tanker for Ding Heng Shipping demonstrates this excellence. This project established new global benchmarks in construction techniques and performance specifications while achieving 99% domestic equipment localization—a milestone in China’s shipbuilding technological autonomy [1].
However, the shipping sector faces pressure to decarbonize, as traditional diesel-powered vessels—still constituting 90% of inland fleets (2022)—emit substantial pollutants (CO2, particulates, NOx) with severe ecological consequences [2].
Recent advancements in battery energy density have made pure battery-powered ships a viable solution for decarbonizing inland waterway transport [3]. The inland waterways in Anhui Province are mostly located close to the interior, so they have strict requirements for pollution and noise. Pure electric vessels have the advantages of zero emissions and low noise. However, inland shore power facilities are lacking. Using the onboard OBC to directly convert AC power to charge the lithium iron phosphate battery can significantly reduce the cost of shore power facility renovations. The cost of a lithium iron phosphate battery is relatively low, although the battery capacity is small. However, the requirements for battery capacity are relatively low because the inland waterways in Anhui Province are mostly short-distance routes. Among the three types of batteries, solid-state batteries have high safety but are costly and have slow charging speeds. Hydrogen mixture systems have a larger capacity and are faster charging. However, they lack infrastructure support and have significant additional costs. Therefore, lithium iron phosphate batteries are more suitable for the application scenarios within the inland waterways of Anhui Province. They have also been applied in areas such as inland waterway vessels, tugboats, small and medium-sized marine engineering auxiliary ships, and passenger ships. For example, the first 3000-ton new energy pure battery-powered inland container transport ship in Anhui Province. The “Port and Shipping Bus” customized container route from Hefei to Wuhu was launched to create a “zero-carbon demonstration route” [4] in October 2022. In addition, in 2022, the “Dong Xing 100”, a battery-powered ship equipped with 3.4 MWh batteries, was operated for coal transportation in China [5].
However, the limited range of pure electric vessels remains a challenge for long-distance Yangtze River operations. Compared with hydrogen hybrid systems, there are relatively few specific subsidy measures for the owners of pure electric vessels at both the national and provincial levels.
Nationally, the “Implementation Opinions on Accelerating the Green and Intelligent Development of Inland Waterway Vessels” was jointly issued by five Chinese national ministries on September 27. It explicitly needs to promote the development of battery-powered vessels, apply pure battery electric propulsion technologies to medium-distance and short-distance inland cargo ships, and designate Anhui Province as one of the first pilot zones. Provincially, the “14th Five-Year Plan for Responding to Climate Change in Anhui Province” was issued by the Anhui Provincial Department of Ecology and Environment on 31 December 2022. It mentioned that it is necessary to launch a core battery system with “Hydrogen-Powered Yangtze River” as the core, and increase tax incentives for the development and transformation of low-carbon emissions and related technologies. The “Electrochemical Yangtze River” initiative was issued by the Yangtze River Department in June 2023, involving 9 of the 13 provinces and cities. It proposes promoting power batteries and other new energy technologies in Yangtze River shipping applications, thereby accelerating the transition to a clean, low-carbon energy structure. The retrofitting of pure electric vessels was mentioned. Specific subsidy measures for shipowners were provided; however, specific subsidies for shore power were not mentioned. Moreover, there is also a lack of corresponding policy guidance for the comprehensive handling of the entire life cycle of batteries including production, use, scrapping, decomposition, and reuse [4].
In addition, there are technical and shore power infrastructure-related obstacles. The technical obstacles mainly refer to the insufficient battery density and high price. This problem leads to contradictions between the battery capacity and cost, battery weight and ship space [5], and high replacement costs during periods of low battery degradation. For example, manufacturers promise a battery life of 8 years, while the lifespan of a ship is calculated at 20 to 30 years. Therefore, during the ship’s life cycle, batteries need to be replaced three to four times, which makes the cost of batteries high [6]. Thus, the higher the battery degradation rate, the faster battery replacements are needed, and the higher the battery replacement cost. Of course, methods such as BMS optimization and temperature control can be adopted to solve this problem.
In inland rivers, the shore power resources are relatively abundant. However, the large size of ships, the lack of supporting facilities, and the inability of the shore power alternating current to charge the lithium iron phosphate battery directly still pose challenges to shore power infrastructure. For inland bulk carriers, sightseeing ships, and large ocean-going cargo ships, the cost of the batteries (initial construction cost) and the electricity costs (operating costs) vary due to different cruising times and battery capacities. For inland river bulk carriers and sightseeing vessels, the cargo and passengers need to occupy most of the space and weight of the ships. Therefore, higher requirements are imposed on battery capacity.
In addition to the advantages of zero emissions, lower operating costs, and the low noise of electric vessels [7], the electrification transformation of typical short-distance inland river shipping vessels in Anhui Province also benefits shore power facilities. Unlike the long-distance routes in the Yangtze River region, short-distance routes within Anhui Province do not need battery stations charged by shore power. Customizing the onboard OBC to directly convert shore power alternating current for charging onboard batteries significantly reduces the cost of shore power facility renovation. Moreover, the inland waterway navigation environment is relatively simple, and custom-made permanent magnet synchronous motors can be set to the optimal working range to match different water environment conditions, which can increase operational efficiency.
The existing research on electric vessels is already quite extensive. For instance, there are studies on the retrofitting plans and cost analyses for hybrid-powered vessels for specific port routes [6], and the methods for retrofitting passenger boats in Bai Hua Lake [8]. These specific retrofitting plans play a significant role in promoting the green transformation of vessels. However, the description in [6] was not regarding pure electric vessels, and [8] did not conduct a detailed cost analysis.
Furthermore, Fan et al. [9,10] (related to Yangtze River operations) pointed out that improper infrastructure planning for charging stations and ships would increase the costs and reduce operational efficiency. However, for short-haul routes in Anhui Province, this study proposes a customized retrofit solution. The solution takes advantage of the low operating costs of lithium iron phosphate batteries and uses a customized onboard charger (OBC) to charge from shore power during berthing. This can significantly reduce the need for large-scale renovations of shore power facilities or the construction of dedicated charging stations, effectively lowering the cost of shore power renovations. In addition, Sun et al. [11] proposed an energy and speed optimization method for inland battery-powered ships considering dynamic electricity prices and complex navigation environments. Wen et al. [12] proposed a two-stage optimization model based on a deep learning method considering onshore electricity prices. For the cost analysis of inland ships, it is crucial to break away from the static analysis framework and take into account dynamic electricity prices. Since the direct electric transformation of traditional oil tankers on specific routes was not considered, the impact of dynamic battery prices on the cost of electric transformation was also not taken into account. However, for traditional oil tankers on specific routes, undergoing direct electric transformation can save costs and facilitate a better cost comparison and analysis. For example, Ref. [13] established a carbon emission accounting and benefit analysis model for the “oil-to-electricity” transformation of gantry cranes. The electrification transformation was carried out for specific ships. Still, the benefit analysis was relatively simple and did not take into account the impact of electricity price fluctuations and policy subsidies on the cost analysis.
Therefore, developing route-specific electrification plans and conducting a comparative economic analysis are essential. Additionally, proposing a cost prediction model and algorithm based on model prediction to predict the financial impact of the battery density growth rate, battery degradation rate, and policy subsidies on the transformation plan is necessary. This method clearly assesses the feasibility of the electrification transformation plan proposed in this paper, and further reduces the cost and accelerates the specific implementation of relevant policies.
2. Electrification Retrofit Scheme
Ship electrification brings changes to vessel systems in two main aspects:
Firstly, traditional diesel propulsion systems are replaced by battery systems, propulsion systems, and electric control systems. Secondly, shore-based charging/battery-swapping infrastructure needs to be added [6].
The technological upgrade mainly focuses on the “three-electricity system” including continuous optimization of the battery system, battery management system, networking and control technology of the thrusters, etc.
This section will carry out the electrification transformation of oil tankers from the battery system, propulsion system, electronic control system, shore power charging, and battery swapping system. Data of the prototype oil tankers are shown in Table 1, close to “Maritime and Port Vessels 01”.

Table 1.
Data of prototype oil tankers.
2.1. Design and Analysis of Pure Electric Vessel Power Systems
- 1.
- Battery system
The core components of battery-powered ships include the propulsion batteries and their corresponding battery management systems. The core of the battery system is the calculation of battery capacity. In terms of operating time, it is required that the battery operation time be as long as possible, which will lead to an increase in battery capacity. In terms of cost savings, the construction cost of the ship can be minimized, which in turn limits the battery capacity. In addition, due to the space and weight restrictions of the boat, the battery capacity cannot be increased indefinitely. Consequently, the design of battery capacity is mainly based on the following factors:
(1) Meet the operational requirements for battery capacity design;
(2) The weight and size of the ship should be reduced as much as possible to meet the space and weight limitations of the boat;
(3) The shipowner must accept the economic cost, and if the price is too high, alternative solutions need to be considered.
Lithium iron phosphate batteries were used as the propulsion batteries, and the battery capacity of the ship was calculated based on the prototype data in Table 1. There are two methods: the first method takes into account the changes in propulsion power and operating conditions [6,8,14,15,16]; the second method considers fuel demand and conversion efficiency [14]. By comparing the two methods, the first method takes into account the operating conditions and auxiliary loads (such as daily power sources), which is more in line with reality.
The detailed formula derivation is as follows:
1st Method:
According to Table 1, when the power of the main drive motor is 196 × 2 kW, at the economic speed, the maximum power of the ship propulsion load is 80% of the propulsion power, but it will not remain at the economic speed all the time. Consequently, the average working efficiency of the ship is taken as 80% [5,6]:
where is the rated propulsion power of the vessel and is the maximum propulsion power at the economic speed.
The power consumption of one one-way voyage is:
where denotes the power consumption per hour. denotes the navigation time. denotes the environmental factor. If is 1, it indicates that the vessel is sailing in calm waters or normal weather conditions, and if it is 1.2, it indicates that the vessel is sailing in severe weather or extreme water conditions. denotes the load factors, when it is 0.7, it indicates that the vessel is in an empty load condition, and when it is 1, it denotes the vessel is in standard load, and when it is 1.1, it denotes the vessel is in heavy load.
The battery capacity must meet the extreme working conditions, thus the power consumption of a one one-way voyage is 2406 kWh.
Consequently, the battery capacity is:
where is the daily-use electricity, is the conversion efficiency of the DC distribution system at 95%, and margin is the considered safety margin is 15%; consequently, the battery capacity is 2923 kWh.
is the battery density, which is 180 kWh/t. Thus, the weight of the required battery is 16t.
2nd Method:
Based on the diesel combustion heat, the of diesel is 42,652 kJ/kg and the total fuel demand is converted to kWh units [8], thus the actual propulsion energy demand of the vessel is:
Based on the motor efficiency of 90%, the conversion efficiency of the DC distribution system is 95%, and the battery safety margin is 15%, thus the battery capacity is:
Based on the battery density, is 180 kWh/t, and the estimated weight of the required battery is:
The weight of a 1960 × 2 kWh battery pack is approximately 24.3 tons. This means that the two methods do not exceed the weight of the prototype ship diesel engine, which is 25 tons.
- 2.
- Propulsion system
The design of the propulsion system mainly includes the configuration analysis of DC networking frequency converters, inverters, and propulsion motors [17,18,19,20]. The DC networking frequency converter is mainly divided into two types based on the bus voltage range: 500~800 VDC and 640~1100 VDC, corresponding to AC voltages of 380 VAC and 690 VAC, respectively. Given that the DC bus voltage must exceed the maximum lithium battery voltage, and considering the propulsion motor’s power in this scheme is 800 KW, we proposed adopting an 800 VDC low-voltage DC networked variable frequency control distribution system as the core component. The specific configuration needs to be confirmed based on the propulsion motor, generator, and daily power supply.
The inverter adopted a 2-SiC hybrid three-level active neutral point clamped inverter.
The propulsion motor adopted a custom-made dual-three-phase permanent magnet synchronous motor. Based on the known speed and resistance of the ship during stable navigation, the high-efficiency range of the motor can be determined, and the permanent magnet synchronous motor was custom-made.
- 3.
- Shore power system
The existing shore power system mainly includes the shore-based power supply system, the shore power connection system, and the ship power receiving system. The shore-based power supply system consists of the central functional units such as the incoming line switch cabinet, metering cabinet, steering transformer, frequency converter, filter cabinet, and outgoing line switch cabinet [21,22].
Although the inland river has abundant shore power resources, the ample space occupied by ships, the lack of supporting facilities, and the alternating current from shore power cannot directly charge a lithium iron phosphate battery. Supposing battery swapping stations are constructed for battery swapping, with the basic construction costs. In that case, the lifting costs for each time are as high as CNY 1800 per time (taking “Gang Hang Ship Route 01” as an example), which is extremely expensive. Considering that most inland waterway routes are short-distances, the battery charging time is relatively short. Consequently, we decided to adopt a custom ship-mounted OBC to convert the alternating current during the berthing period to charge, which reduces the time and cost of retrofitting the existing shore power system. However, it also leads to the problem of insufficient berthing spaces. For this issue, the policy can provide support by creating charging berths for electric vessels. The berthing and charging times for electric vessels of different routes should be strictly arranged to reduce costs.
2.2. Configuration Results of Pure Electric Ship Systems
Basic information of the ship after its electrification transformation is shown in Table 2, and the information of the custom dual-three-phase permanent magnet synchronous motor is presented in Table 3. Based on the information after the transformation, the single-line diagram of the pure electric ship’s power system is shown in Figure 1.
Table 2.
Basic information table of ships after “oil-to-electricity” conversion.
Table 3.
Information table of customized dual three-phase permanent magnet synchronous motors.
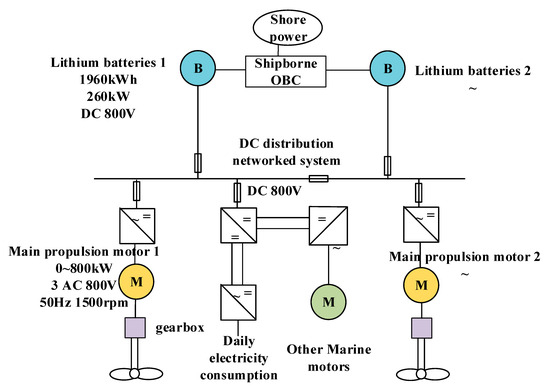
Figure 1.
Single-line diagram of the power system of pure battery-powered ships.
In Table 2, the lithium battery pack was selected from CATL or an equivalent brand, the onboard charger from Huawei or an equivalent brand, and the DC bus variable frequency power distribution control system from CATL or an equivalent brand.
Figure 1 clearly shows the specific power system architecture of the new electric ship design scheme. The data above are from Table 2 and Table 3 as well as the official website information of brands such as Infineon. The next section will present a cost analysis of the new scheme based on the electrification configuration results and compare it with the other two schemes: hybrid scheme and conventional scheme.
3. Economic Comparison
3.1. Determination of Key Economic Performance Indicators
To conduct an economic comparison before and after the transformation of the prototype oil tanker into an electric vessel, it was first assumed that the operating income of the ship was equal, and then it was believed that the cost of other systems was the same, except for the power system. The shipping cost indicators and key cost indicators for this design are shown in Table 4.
Table 4.
Ship cost indicators.
3.2. Comparison of Net Present Value of Assets
The reference data for the ship operation costs are shown in Table 5, where other expenses, such as ship income, insurance premiums, and port charges, were the same and not considered.
Table 5.
Reference data of ship operating expenses.
Equations (8)–(10) are used to calculate the net present value of the entire life cycle of the ship. Based on the net present value (NPV) model, they are derived by considering the initial construction cost, fuel cost, and battery replacement cost throughout the entire life cycle [6,23].
where i denotes (6%) the discount rate, and n (30 years) is the depreciation period of ships. When A denotes the mechanical maintenance cost, P is the equivalent calculation of the mechanical maintenance cost during the ship’s life cycle. Similarly, Pb is the life cycle battery replacement cost, PRL is the life cycle residual value cost, and Pfuel is the life cycle fuel cost. According to the annual average method, the annual depreciation amount is the difference between the original price and the expected net residual value of the equipment over its service life on average each year.
Formula (9) calculates the battery cost F as the final cost of replacement every 8 years, which is CNY 4.12 million. The replacement times are 8 years, 16 years, and 24 years.
The equivalent total cost is the sum of five items: construction cost, fuel cost equivalent calculation, mechanical maintenance cost equivalent calculation, battery replacement cost, and residual value equivalent calculation.
3.3. Comparison of Internal Rate of Return
The main differences in the costs of the power system before and after the transformation are presented in Table 6, where “Electric Retrofit” is the purely electrical transformation, “Conventional” is the pre-renovation project for the oil tanker, “Hybrid Retrofit” is the hybrid electric retrofitting plan. The prototype ship was equipped with two Wei Chai generators, worth CNY 350,000. Two three-phase permanent magnet synchronous motors were the main drive motors, worth CNY 450,000. The electrification transformation plan adopted a battery pack priced at CNY 550 per kilowatt-hour and two custom dual-three-phase permanent magnet synchronous motors worth CNY 500,000 as the main drive motors. The battery swap station was not taken into account, thus the use of the onboard OBC avoided the costs of battery replacement hoisting and the large-scale renovation of shore power facilities. Thus, in terms of shore power supporting facilities, the cost of the on-board OBC (CNY 80,000) was included in the battery system and not separately listed.
Table 6.
Main differences in power system costs before and after renovation.
The internal rate of return formula is as follows [8,24,25,26,27].
Overall objective function of operating costs:
In the formula, is the total operating cost, is the crew wages and additional expenses, is the annual depreciation cost, is the maintenance and repair cost, is the insurance cost, is the fuel cost, is the port operator’s cost, and is other expenses.
Formula for calculating the net present value:
In the formula, the specified symbols RL represent the residual value of the ship, i is the discount rate, n is the age of the ship, P is the cost of the ship, and the annual income per ship is .
The internal rate of return (IRR) is an indicator for examining the efficiency of project fund utilization and is a major dynamic indicator of project profitability. First, calculate the annual cash income (CI) and the annual cash outflow expense (CO) using Formula (13). Then, based on the present value coefficient table of annuities, use the interpolation method to obtain the IRR. When the IRR ≥ i0 (benchmark rate of return), it is considered that the plan is economically feasible.
In Formula (14), NPVR denotes the net present value rate, NPV denotes the net present value, and is the present value of all investments. If so , the scheme with a higher investment (present value) should be selected; conversely, the scheme with a lower investment (present value) should be selected.
The annual operating cost calculation of ships is shown in Table 7.
Table 7.
Annual operating cost calculation.
3.4. Results of Economic Analysis and Comparison
The comparison results of the net present value of assets are shown in Table 8 and Figure 2, while the comparison results of the internal rate of return are presented in Table 9 and Figure 3 and Figure 4.
Table 8.
Comparison results of the net present value of assets.
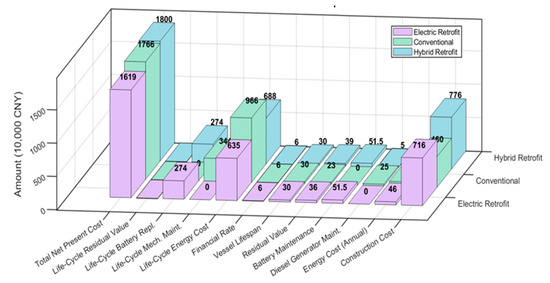
Figure 2.
Comparison results of the net present value of assets.
Table 9.
Comparison results of the internal rate of return.
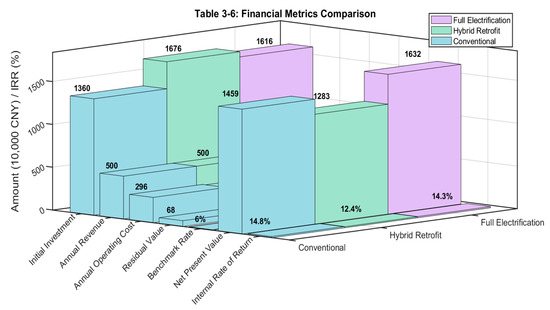
Figure 3.
Comparison results of the net present value of assets for the three schemes.
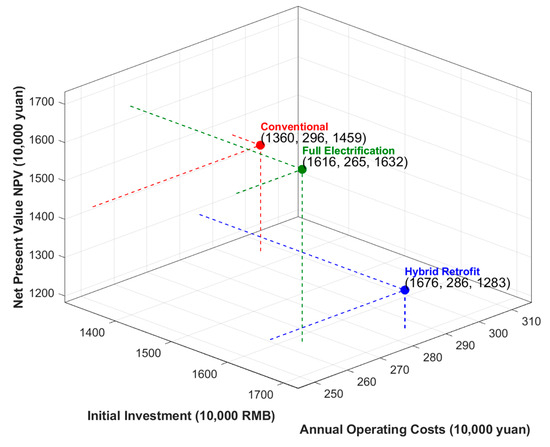
Figure 4.
Comparison results of the IRR of assets for the three schemes.
Figure 2 illustrates that the net present value (NPV) of assets for the pure electric retrofit exceeded that of conventional ships, although its internal rate of return (IRR) was lower (Table 9). It is necessary to reduce the capital cost by CNY 500,000 or increase the annual income by CNY 80,000 to reach the conventional return rate. However, after the “oil-to-electricity” transformation, the ship emissions were reduced nearly 95%, and the noise was reduced by about 20 dB. Hybrid electric ships incorporate diesel engines as backup power sources and require an additional cost of CNY 1.2 million or an increase of CNY 150,000 per year in revenue to achieve the same return rate as pure electric ships, but their safety and cruising range have been improved, and can also reduce noise by 10 to 15 dB.
The financial analysis results of the three schemes provide specific data sources for the cost analysis algorithm based on the model prediction proposed in the next section. The established model can also re-analyze the results of the economic analysis, thereby drawing conclusions on how to achieve economic overtaking. Moreover, the operating costs and fuel prices of the pure electric and hybrid electric schemes in this article were taken as the benchmark, and the prices in other regions were processed in a per-unit manner based on this. In this case, an electricity price fluctuation factor and fuel price factor will be formed, which were multiplied by the electricity price and fuel price in this article, respectively, to obtain the economic analysis results of other regions in a simple way.
4. Cost Prediction and Analysis Based on the Purely Electric Scheme
4.1. Establish a Mathematical Model for Cost Analysis Based on Model Prediction
Based on the scheme and economic analysis model of electrically-powered ships, considering the yearly growth rate of battery density, the battery degradation rate, and the further impact of policy subsidies on costs, a cost prediction model was established [8,14,20,21,28,29,30,31].
We set the battery cost (CNY/kWh) as , and initial cost as , which was 550 CNY/kWh:
where is the initial density and is the annual growth rate of battery density. The higher is, the lower the battery cost will be.
The initial construction cost includes fixed components (such as motors and DC systems) and battery system components:
1. Total initial cost (when = 0%): CNY 16.19 million;
2. Battery system cost proportion: CNY 2.16 million;
3. Fixed part cost: remains unchanged, which is CNY 5 million.
Consequently, the initial construction cost based on the change in battery cost is:
where capacity refers to the capacity of the 1960 × 2 battery pack, and battery replacement occurs at t = 8, 16, and 24 years. The cost of each replacement is the battery cost at that time multiplied by the capacity.
The battery replacement cost based on the change in battery cost is:
where k = 1, 2, and 3 correspond to , , and years, is the battery replacement cycle, is the battery attenuation rate, (6%) is the discount rate, where the higher the , the greater the maintenance expenses will be.
Assuming that other costs (CNY 846,000 from Table 9) remain unchanged, the total net present value cost of the battery cost change is:
Formulas (15)–(20) constitute a new cost analysis model based on model prediction.
Considering the impact of policy subsidies on model establishment, the mathematical model of policy subsidies can be established as follows:
where is the subsidy policy, j (%) is the carbon pricing factor, is the increasing carbon price. The higher the carbon pricing, the higher the carbon pricing factor becomes. The carbon emissions of traditional oil tankers decrease accordingly. Capital subsidies increase, which drives traditional oil tankers to reduce their emissions further, and leads to a decrease in carbon emissions. (CNY 10,000) is the capital subsidy, and (CNY 10,000) is the annual operation subsidy.
4.2. Simulation Results of the Cost Analysis Algorithm Based on Model Prediction
The correctness of the mathematical model proposed above was verified by MATLAB R2023b simulation. Taking the pure electric ship transformation plan as an example, a cost analysis algorithm based on model prediction was proposed to predict the cost based on the electric retrofit.
When the value of was 8, the simulation result of the cost prediction algorithm based on the yearly growth rate of battery density was generated, and is shown in Figure 5. When the yearly growth rate of battery density reached 15%, the initial construction cost of the battery could be reduced by CNY 2.5 million, reaching the initial cost of a traditional oil tanker. When the yearly growth rate of the battery was 0, the simulation result of the cost prediction algorithm based on the battery degradation rate was generated and is shown in Figure 6. When the battery degradation rate was reduced to 5%, the battery replacement cost could be decreased by CNY 2.5 million. Figure 7 shows a 3D model considering the yearly growth rate of batteries and the battery decay rate. The key points are the initial investment of CNY 16.19 million for the new pure electric transformation and CNY 14.30 million for the conventional oil tanker.
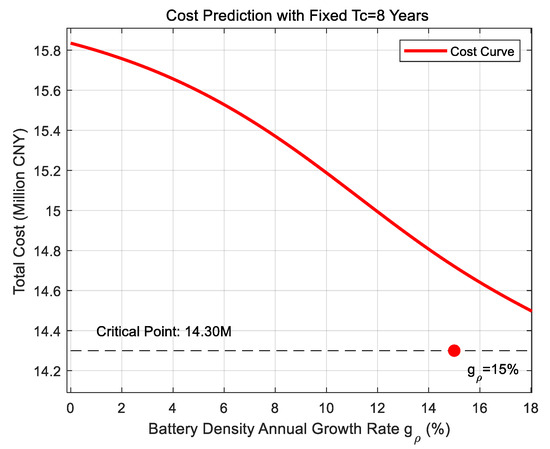
Figure 5.
Cost prediction algorithm simulation results based on the yearly growth rate of battery density ().
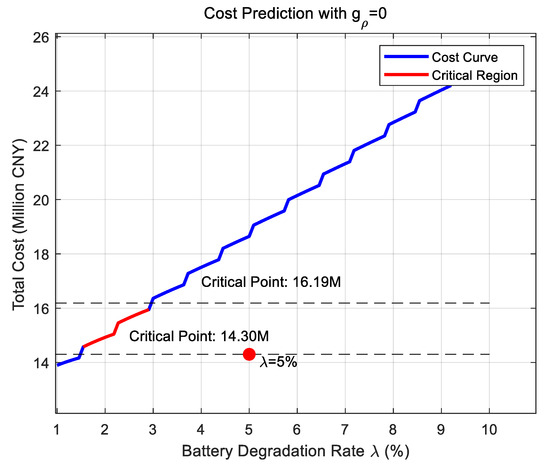
Figure 6.
Cost prediction algorithm simulation results based on the battery degradation rate ().
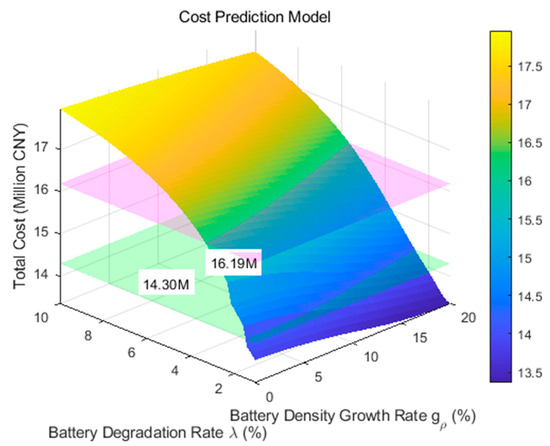
Figure 7.
A 3D model diagram based on the yearly growth rate of batteries and the battery decay rate.
Figure 8 shows the simulation results of the cost prediction model algorithm considering the carbon pricing factor and the impact of policy subsidies. The higher the carbon pricing , the greater the fluctuation of the carbon pricing factor j (%), and the less carbon emissions of traditional oil tankers. Consequently, the more capital subsidies there are, the more likely it is to promote the modification of traditional oil tankers and reduce carbon emissions. Assuming that t is an 8-year lifespan, is 80,000 CNY/year or is CNY 500,000, the initial investment of traditional oil tankers can reach CNY 14.30 million. If is 20,000 CNY/year and is CNY 3.5 million, the carbon pricing should increase by 35.35 CNY/ton, thus the policy subsidy can exceed 32%.
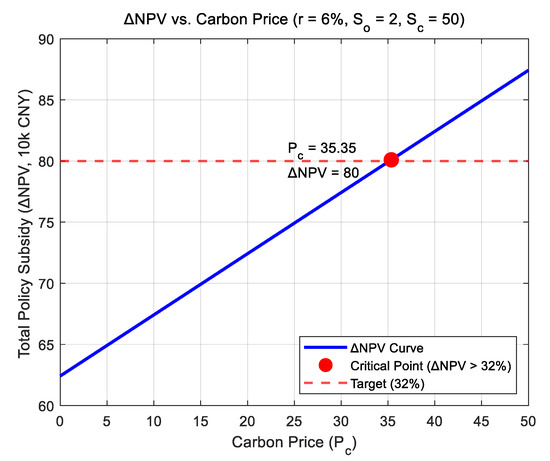
Figure 8.
Government subsidy results based on model prediction.
5. Conclusions
Pilot operations of electric ships have been launched in many regions, but traditional diesel-powered vessels remain dominant. Although the return on investment after electrification retrofits may not yet match that of conventional oil tankers, the retrofitted vessels can reduce emissions by nearly 95% and lower noise levels by approximately 20 dB. These improvements lead to significant benefits in pollution control, noise reduction, and enhanced comfort for both the crew and passengers.
Furthermore, the model-based cost prediction algorithm proposed in this study showed that the funding gap of CNY 2.5 million can be effectively covered. These include a decline in battery prices—driven by annual increases in energy density and reduced degradation rates—a rise in carbon pricing, and government subsidies such as a yearly operational subsidy of CNY 80,000 or an initial construction subsidy of CNY 500,000. Under these conditions, electric ships can achieve a better economic performance than conventional diesel vessels. This result indicates that continued advances in battery technology, coupled with policy and financial support, will accelerate the large-scale electrification of ships.
There are still some drawbacks in the design process: the established model is relatively simple and requires continuous improvement and refinement in the future.
Author Contributions
X.Z. and R.N. jointly conceived the original idea and contributed to the conceptual development of the research through in-depth discussions. Technical support and input was received from J.T., and the paper layout as handled by X.Z. All authors contributed to the design of the simulation, execution of the experiments, and interpretation of the combined experimental and computational results. The manuscript was drafted by X.Z., with writing and editorial support from R.N. All authors have read and agreed to the published version of the manuscript.
Funding
This research received no external funding.
Data Availability Statement
All data supporting the results of this study are included within the article. Consequently, no additional data are available.
Acknowledgments
The authors also express their gratitude to the School of Electrical Engineering and Automation, Anhui University for providing laboratory facilities and technical assistance throughout the study.
Conflicts of Interest
The authors declare no conflicts of interest.
Nomenclature
| Rated propulsion power of the vessel (kW) | |
| Maximum propulsion power under the economic speed (kW) | |
| Power consumption of per hour (kW) | |
| Navigation time (h) | |
| Power consumption of one one-way voyage (kWh) | |
| Environmental factor (per-unit value) | |
| Load factor (per-unit value) | |
| Battery capacity (kWh) | |
| Conversion efficiency of the DC distribution system (%) | |
| Daily use electricity (kWh) | |
| margin | Considered safety margin (%) |
| Weight of the required battery(t) | |
| Battery density (kWh/t) | |
| Combustion heat of diesel (kJ/kg) | |
| Ship actual propulsion energy demand (kWh) | |
| Life cycle fuel cost (CNY 10,000) | |
| Life cycle battery replacement cost (CNY 10,000) | |
| Life cycle residual value cost (CNY 10,000) | |
| Depreciation period of ships (year) | |
| Discount rate (%) | |
| Annual income per ship (CNY 10,000) | |
| Total operating cost (CNY 10,000) | |
| Crew wages and additional expenses (CNY 10,000) | |
| Annual depreciation cost (CNY 10,000) | |
| Maintenance and repair cost (CNY 10,000) | |
| Insurance cost (CNY 10,000) | |
| Fuel cost (CNY 10,000) | |
| Port operator’s cost (CNY 10,000) | |
| Other expenses (CNY 10,000) | |
| IRR | Internal rate of return (%) |
| CI | Annual cash income (%) |
| CO | Annual cash outflow expense (%) |
| Benchmark rate of return (%) | |
| NPVR | Net present value rate (%) |
| NPV | Net present value (%) |
| Present value of all investments (CNY 10,000) | |
| Battery cost (CNY/kWh) | |
| Initial cost as (CNY/kWh) | |
| Initial density (kWh/Ton) | |
| Yearly growth rate of battery density (%) | |
| Initial fixed part cost (million) | |
| Capacity of the 1960 × 2 battery pack (kWh) | |
| Battery replacement cycle (year) | |
| Battery attenuation rate (%) | |
| Other costs (CNY 10,000) | |
| Subsidy policy (CNY 10,000) | |
| Carbon pricing factor (%) | |
| Increasing carbon price (CNY/kg) | |
| Capital subsidy (CNY 10,000) | |
| Annual operation subsidy (CNY 10,000) |
References
- Chen, M. Inland river ships, more green and intelligent. Fujian J. 2023. [Google Scholar] [CrossRef]
- Zhou, S. Weekly wash. Electric ship in “spring”. J. Pearl River Water Transp. 2018, 4, 28–29. [Google Scholar] [CrossRef]
- Kersey, J.; Popovich, N.D.; Phadke, A.A. Rapid battery cost declines accelerate the prospects of all-electric interregional container shipping. Nat. Energy 2022, 7, 664–674. [Google Scholar] [CrossRef]
- Jiang, S.; Shen, Q.; Ran, J. The latest application progress of lithium battery power technology for ships. Traffic Inf. Saf. 2024, 42, 168–174. [Google Scholar]
- China First 2000 DWT New Energy Container Bulk Ship Was Delivered. Xinde Marine News. 2021. Available online: https://xindemarinenews.com/m/view.php?aid=39510 (accessed on 21 July 2025).
- Zhu, G. A Study on the “Oil to Electricity” Transition and Its Economy of Penglai-Changshu Line Ferry; Dalian Maritime University: Dalian, China, 2020. [Google Scholar]
- Wang, S.; Zhang, W. Investigation and Research on the Ship Types of Freight Vessels in the Huaihe Waterway Network of Anhui Province. Eng. Constr. 2014, 28, 600–601+629. [Google Scholar]
- Tao, H. Research on the Application Technology of “Oil-to-Electricity” Conversion of Passenger Ships in Baihua Lake Waters. China Water Transp. 2019, 19, 101–102. [Google Scholar]
- Zhang, Y.; Sun, L.; Sun, W.; Fan, M.; Xiao, R.; Wu, Y.; Huang, H. Bilevel Optimal Infrastructure Planning Method for the Inland Battery Swapping Stations and Battery-Powered Ships. Tsinghua Sci. Technol. 2024, 29, 1323–1340. [Google Scholar] [CrossRef]
- Zhang, Y.; Sun, L.; Fan, T.; Fan, M.; Xiong, Y. Speed and energy optimization method for the inland all-electric ship in battery-swapping mode. Ocean Eng. 2023, 284, 115234. [Google Scholar] [CrossRef]
- Sun, L.; Zhang, Y.; Ma, F.; Ji, F.; Xiong, Y. Energy and speed optimization of inland battery-powered ship with considering the dynamic electricity price and complex navigational environment. Energy Rep. 2023, 9, 293–304. [Google Scholar] [CrossRef]
- Wen, S.; Zhao, T.; Tang, Y.; Xu, Y.; Zhu, M.; Fang, S.; Ding, Z. Coordinated Optimal Energy Management and Voyage Scheduling for All-Electric Ships Based on Predicted Shore-Side Electricity Price. IEEE Trans. Ind. Appl. 2021, 57, 139–148. [Google Scholar] [CrossRef]
- Li, N. Carbon Emission Calculation and Benefit Analysis Model for “Diesel-to-Electricity” Conversion of Portal Cranes; Dalian Maritime University: Dalian, China, 2013. [Google Scholar]
- IEEE. Electric container ships are a hard sail [Opinion]. IEEE Spectr. 2019, 56, 22. [Google Scholar] [CrossRef]
- Jovanović, I.; Perčić, M.; Vladimir, N. Identifying Differences Between Power System of Conventional and Autonomous Ship with Respect to Their Safety Assessment. In Proceedings of the 2023 18th Conference on Electrical Machines, Drives and Power Systems (ELMA), Varna, Bulgaria, 29 June–1 July 2023; pp. 1–5. [Google Scholar] [CrossRef]
- Lee, J.-S.; Lee, H.-T.; Cho, I.-S. Maritime Traffic Route Detection Framework Based on Statistical Density Analysis from AIS Data Using a Clustering Algorithm. IEEE Access 2022, 10, 23355–23366. [Google Scholar] [CrossRef]
- Wang, W.; Xiao, A.; Zhang, L.; Sheng, Y.; Zhao, Z.; Zhang, Y. Dc Networking Power System for Electric Propulsion Vessels. CN107147103A. 2017. [Google Scholar]
- Ding, S. Electric propulsion ship dc power distribution system design. J. Ship’s Mater. Mark. 2019, 11, 43–44. [Google Scholar]
- Segovia, P.; Pesselse, M.; Van Den Boom, T.; Reppa, V. Scheduling Inland Waterway Transport Vessels and Locks Using a Switching Max-Plus-Linear Systems Approach. IEEE Open J. Intell. Transp. Syst. 2022, 3, 748–762. [Google Scholar] [CrossRef]
- Qian, H.; Ren, G. Introduction to Anhui Provincial Local Standard “Series of Inland River Vessel Dimensions”. Water Transp. Sci. Technol. Inf. 1999, 12–13. [Google Scholar]
- Xia, Z. Discussion on the Green Development of New Energy Ships in Anhui Province. China Water Transp. 2023, 9, 58–60. [Google Scholar] [CrossRef]
- Xing, H.; Li, X. Instead of ship power: Progress and perspective. J. World Shipp. 2023, 46–48, 4–11. [Google Scholar]
- Qin, L.; Wang, Y.; Wei, L.; Liu, Y.; Xie, W. A New Generation Cost Analysis Method of High Renewable Penetration Power Grid. In Proceedings of the 2023 IEEE/IAS Industrial and Commercial Power System Asia (I&CPS Asia), Chongqing, China, 7–9 July 2023; pp. 1660–1665. [Google Scholar] [CrossRef]
- Li, W.; Luo, X. Current Situation and Development Suggestions of Lithium Battery Application in Ships. China Ship Insp. 2021, 3, 68–71. [Google Scholar]
- Wang, Y.; Luo, W. Exploring the Innovative Development Path of the Shipbuilding Industry. China Water Transport News, 2023. [Google Scholar]
- The delivery of the world’s largest battery-capacity pure battery-powered vessel “Three Gorges 1 on the Yangtze River”. China Ship Insp. 2022, 4, 3.
- Papatheofanis, F.J. Healthcare Economics: Estimating cost in health economic analyses. IEEE Eng. Med. Biol. Mag. 2003, 22, 14–15. [Google Scholar] [CrossRef]
- Yin, X.; Shen, B. Accelerating Water Transport Development to Create a New Support for Hefei’s Economic Growth. China Water Transp. 2017, 17, 86–87. [Google Scholar]
- Papatheofanis, F.J. Economic evaluation approaches for new technology. IEEE Eng. Med. Biol. Mag. 2003, 22, 16–17. [Google Scholar] [CrossRef]
- Di Piazza, M.C.; Pucci, M.; Iafrati, A. Status and Future Trends of Electrification-Based Solutions for Efficiency-Oriented Ship Retrofitting. In Proceedings of the 2024 IEEE International Conference on Electrical Systems for Aircraft, Railway, Ship Propulsion and Road Vehicles & International Transportation Electrification Conference (ESARS-ITEC), Naples, Italy, 26–29 November 2024; pp. 1–6. [Google Scholar] [CrossRef]
- Degan, G. Changes in weight and stability on ships after conversion from diesel to hybrid-electric. In Proceedings of the 2023 IEEE International Conference on Electrical Systems for Aircraft, Railway, Ship Propulsion and Road Vehicles & International Transportation Electrification Conference (ESARS-ITEC), Venice, Italy, 29–31 March 2023; pp. 1–5. [Google Scholar] [CrossRef]


Disclaimer/Publisher’s Note: The statements, opinions and data contained in all publications are solely those of the individual author(s) and contributor(s) and not of MDPI and/or the editor(s). MDPI and/or the editor(s) disclaim responsibility for any injury to people or property resulting from any ideas, methods, instructions or products referred to in the content. |
© 2025 by the authors. Licensee MDPI, Basel, Switzerland. This article is an open access article distributed under the terms and conditions of the Creative Commons Attribution (CC BY) license (https://creativecommons.org/licenses/by/4.0/).