3.1. Analysis of Upper Limb Stretching Testing Results
The results of the upper limb elevation test and upper limb abduction test are listed in
Table 6 and
Table 7, respectively. During testing, the tensile force was recorded as F.
Based on the data in the table, we could calculate the 95% confidence intervals for the total average force under all experimental conditions of upper limb elevation and upper limb abduction. According to the average values of the experimental runs, the total average force for upper limb elevation was 25.58 Newtons (95% confidence interval: 21.50 to 29.66 Newtons), and the total average force for upper limb abduction was 22.04 Newtons (95% confidence interval: 18.50 to 26.04 Newtons). This clearly demonstrated the precision of our overall measurements. Given the repeated—measures nature of the experimental design, we used the Intraclass Correlation Coefficient (ICC) to assess the consistency and stability of the measurement method. The specific results are as follows: the ICC for upper limb elevation was approximately 0.9996, and that for upper limb abduction was approximately 0.9999. This indicates that the differences among different samples were far greater than the measurement errors, and the measurement results showed extremely high consistency.
Significance testing was conducted on the linear, second-order, and third-order models. The model significance tests, fit statistics, and correlation analyses were subsequently benchmarked against each other. This comparative analysis identified the second-order model as the optimal choice for this experimental study. Using body height A, body weight B, upper limb elevation angle E and abduction angle H as independent variables, the regression model equations obtained via Design-Expert 13.0 software [
23] are presented in Equations (11) and (12). The Analysis of Variance (ANOVA) results for the regression models are listed in
Table 8 and
Table 9.
As shown in
Table 8, the model yields
p = 0.0315 (<0.05), demonstrating statistically significant regression model fitting, which indicates good agreement between the regression model and experimental testing. Comparison of the
p-values and F-values in the table reveals the relative influence of each factor on the model. Height exhibits a highly significant effect on upper limb elevation force (
p < 0.01), while body weight and elevation angle show significant effects (
p < 0.05). The ANOVA revealed that height had a statistically significant and very large effect on the output force (F-value = 21.01,
p = 0.0059, η
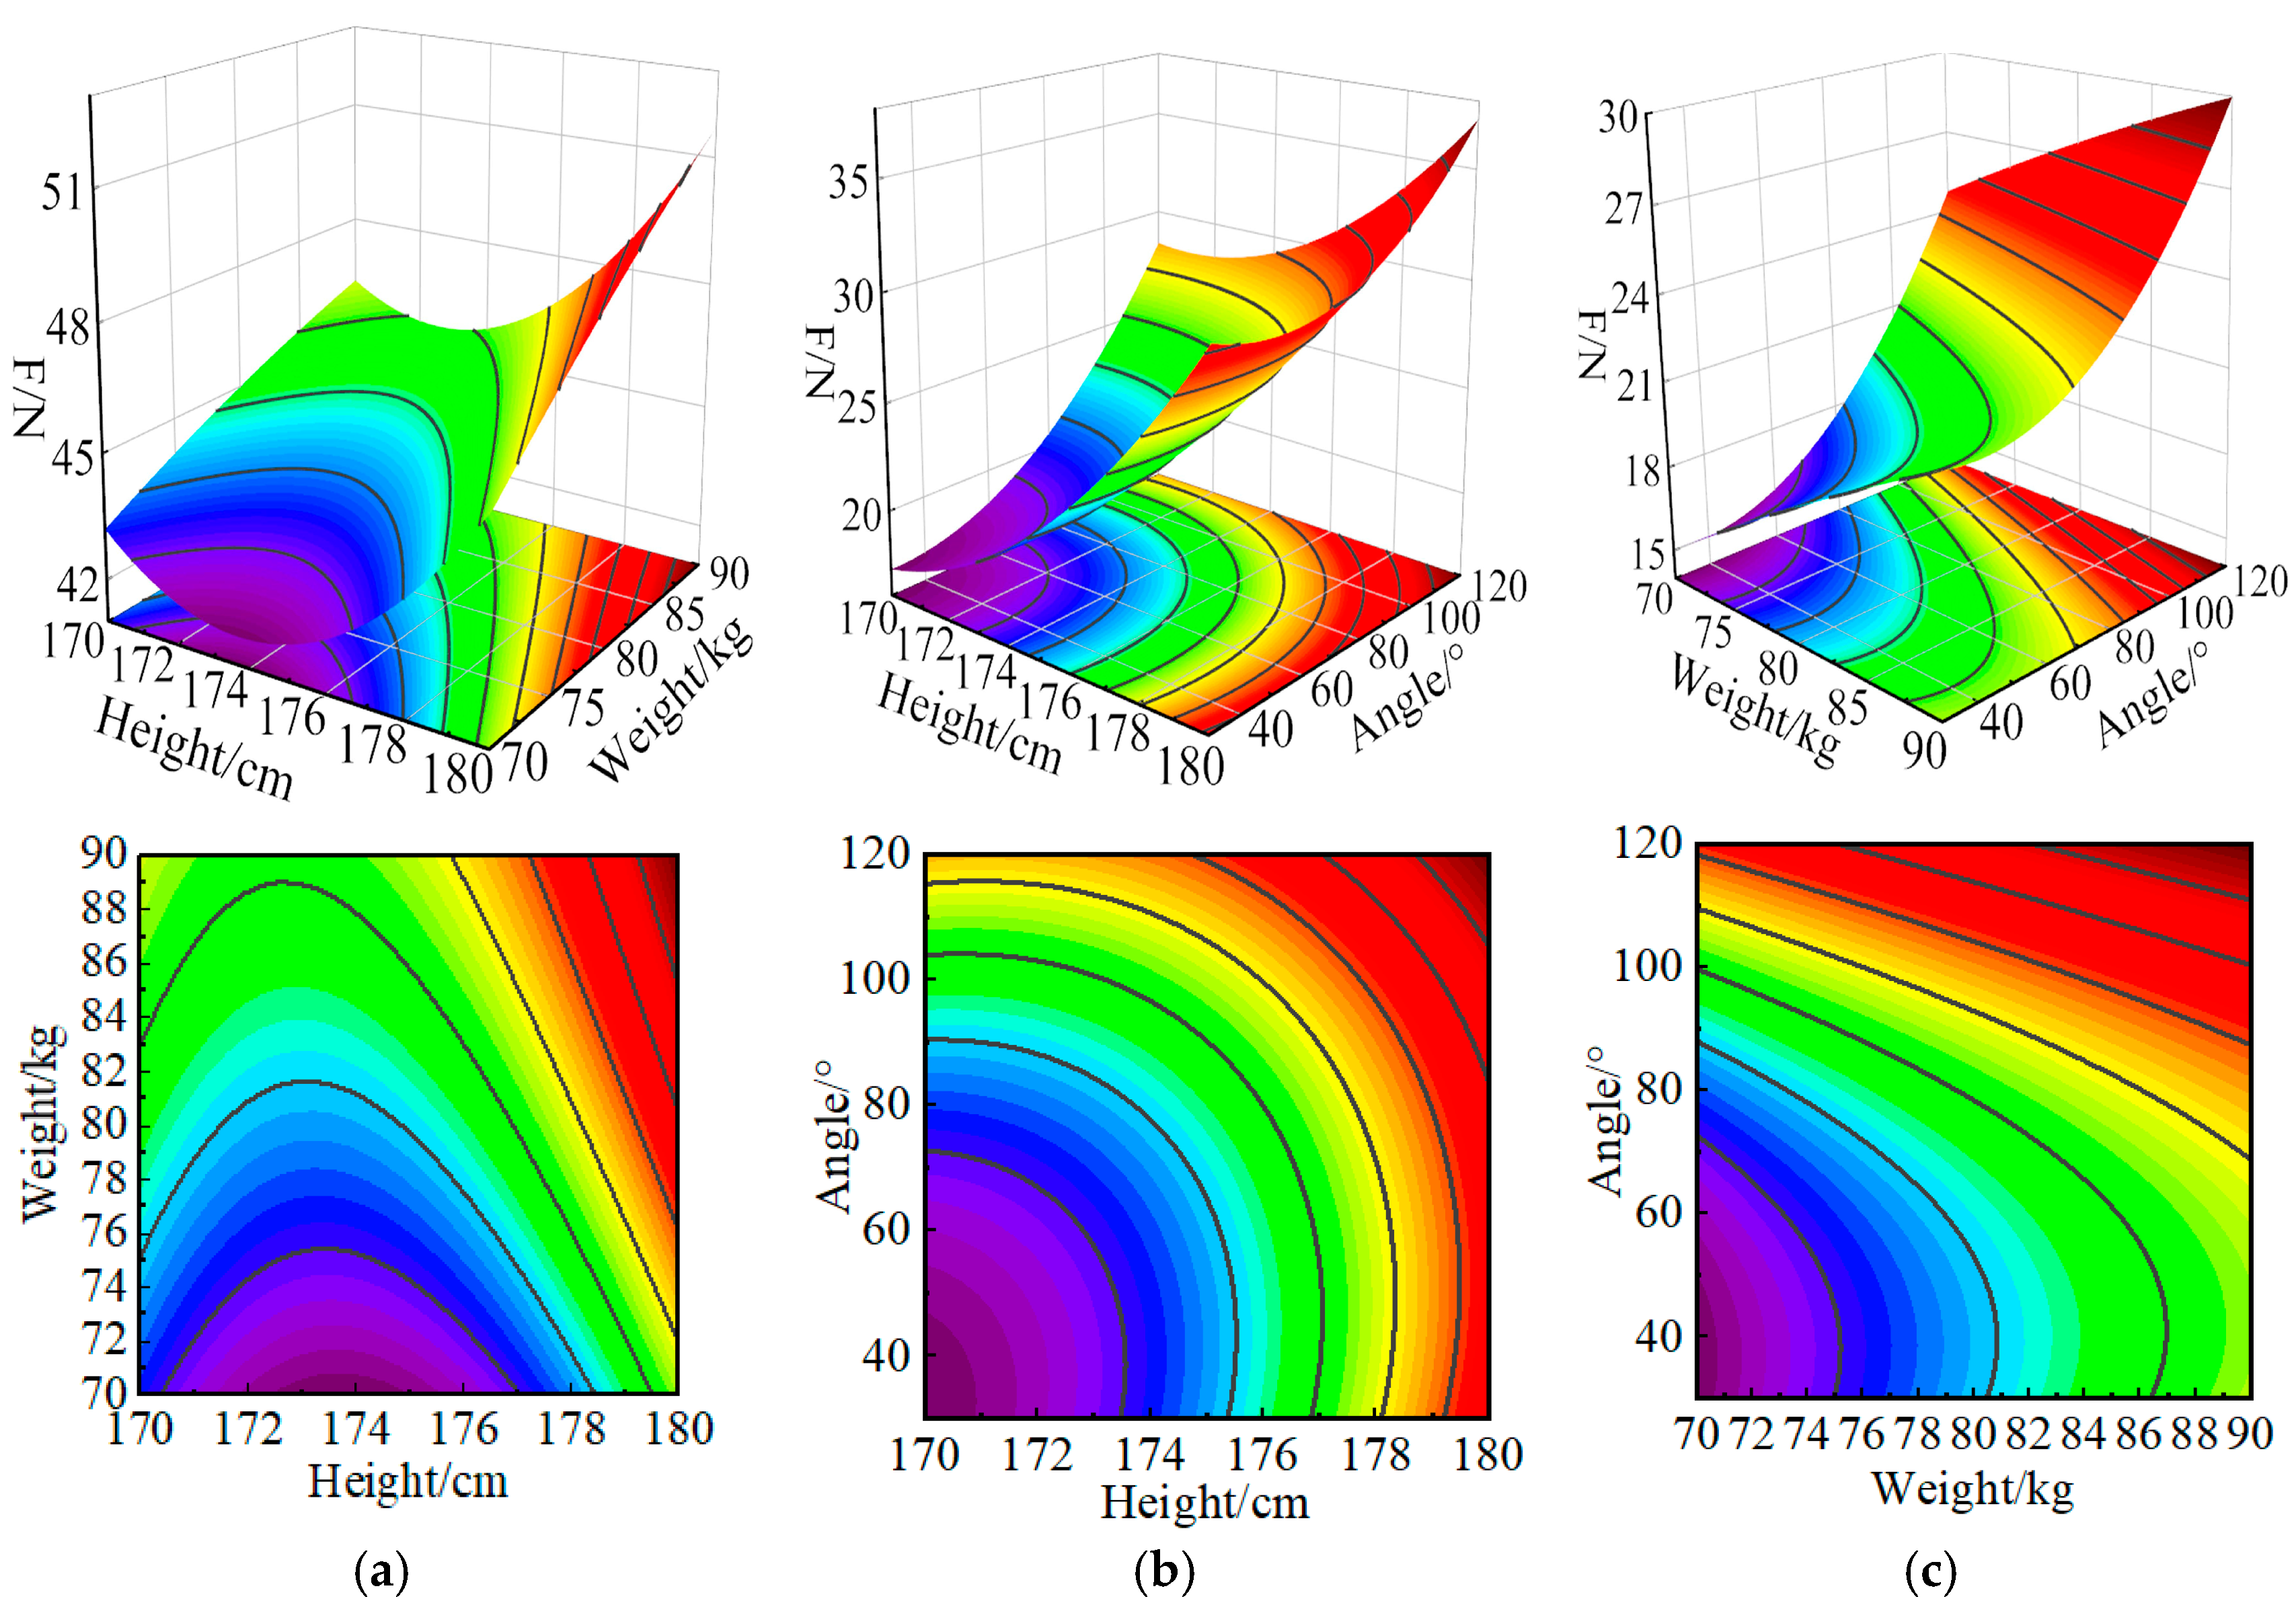
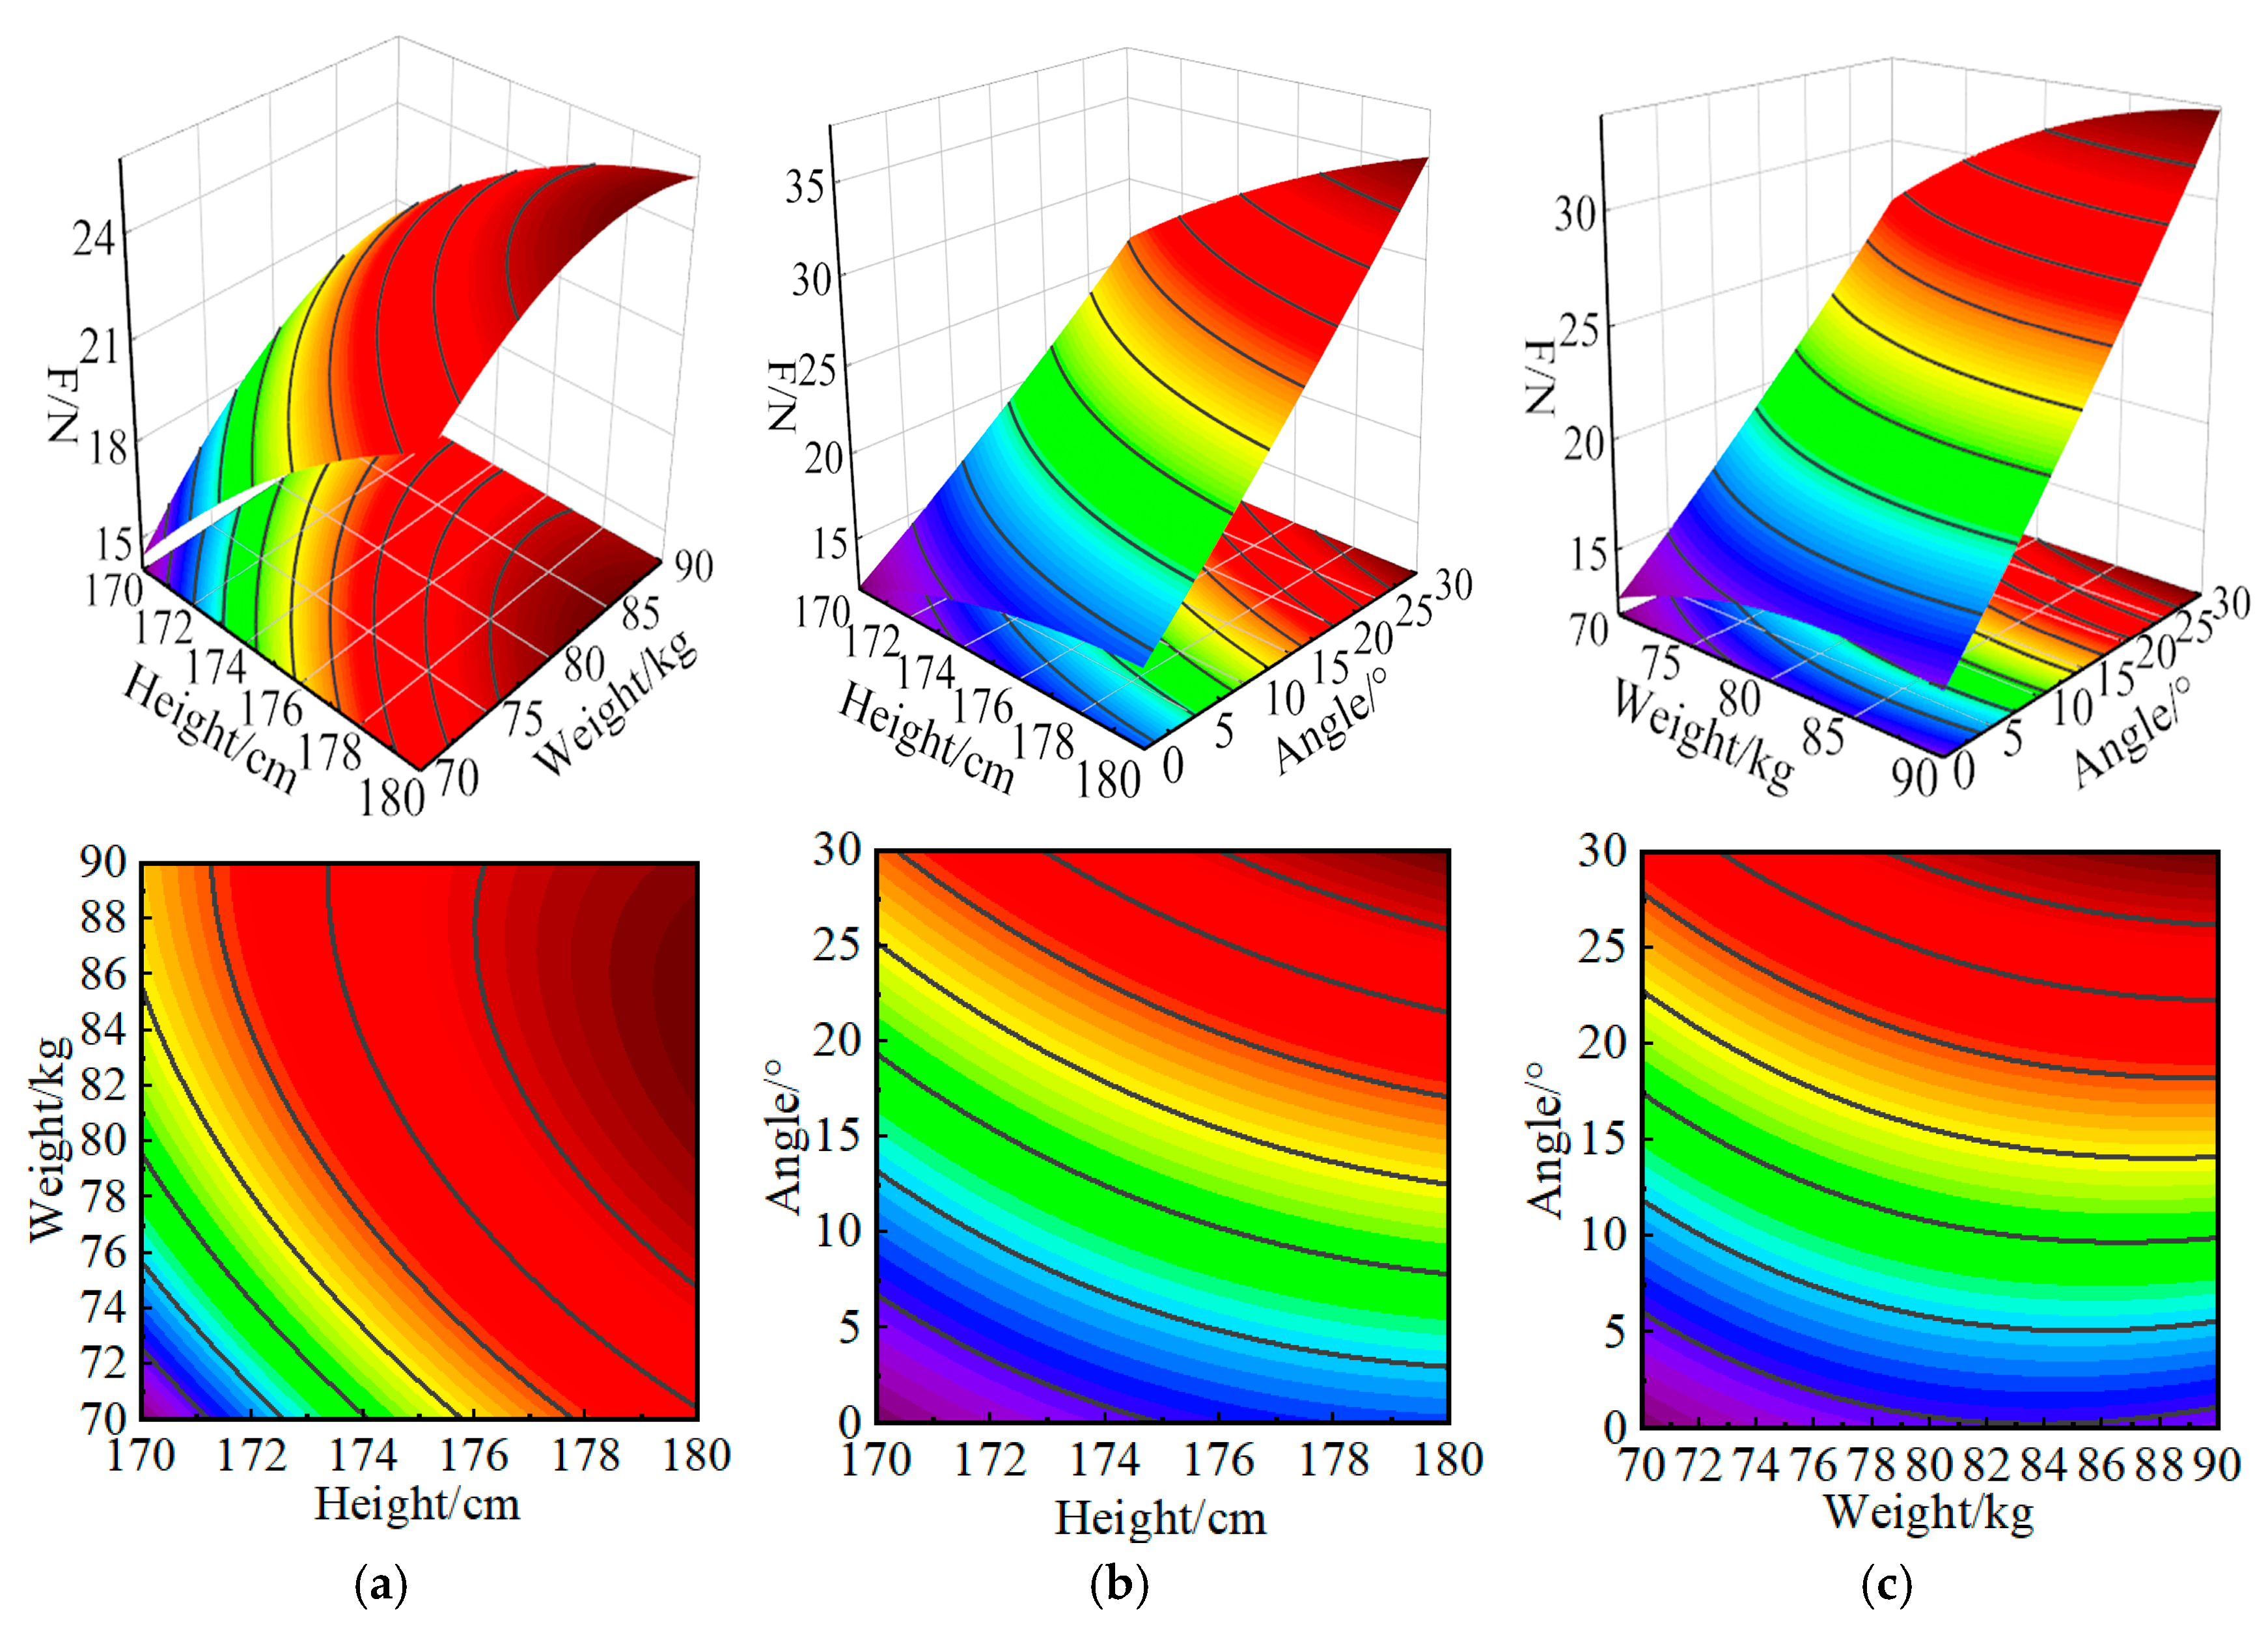
2p = 0.823). The significance ranking of factors affecting force magnitude is A > B > E > AE > AB > BE. Response surface and contour plots depicting the force during upper limb elevation were generated from the regression model equation. The interaction effects of factors on force magnitude were analyzed, as shown in
Figure 11.
As shown in
Table 9, the model yields
p = 0.0006 (<0.01), demonstrating a highly significant regression model fit, which confirms excellent agreement between the regression model and experimental testing. Based on the
p-values and F-values, the influence magnitude of each factor on the model was determined. The abduction angle exhibited a highly significant effect (
p < 0.01) on upper limb abduction force, while height and body weight showed significant effects (
p < 0.05). The ANOVA revealed that angle had a statistically significant and very large effect on the output force (F-value = 244.35,
p < 0.0001, η
2p = 0.989). The significance ranking of factors affecting force magnitude is H > A > B > AH > BH > AB. Response surface and contour plots of the arm expansion force were constructed from the regression model equation. These graphical representations were then employed to analyze the factor interaction effects, shown in
Figure 12.
As shown in
Figure 11a, the force during upper limb elevation increases with greater height and body weight. The steeper slope of the height curve signifies its greater influence on the force, while the steep gradient and dense contour lines of the response surface reveal a pronounced interaction between height and weight on the elevation force. As shown in
Figure 11b, the force during upper limb elevation increases with greater height and larger elevation angles. The height curve exhibits a steeper slope than the angle curve, suggesting that height exerts a more significant influence on the force. The steep gradient and dense contour lines of the response surface demonstrate a pronounced interaction effect between height and elevation angle on the force. As shown in
Figure 11c, the force during upper limb elevation increases with greater body weight and larger elevation angles. In contrast to the angle curve, the steeper slope of the body weight curve identifies it as the more dominant factor. Furthermore, the steep gradient and dense contour lines of the response surface collectively point to a strong interactive effect between body weight and elevation angle on the force.
As shown in
Figure 12a, the force during upper limb abduction rises with increasing height and body weight. The steeper slope of the height curve demonstrates that height has a stronger effect on the force than weight. The steep gradient and dense contour lines of the response surface demonstrate a pronounced interaction effect between height and body weight on the abduction force. As shown in
Figure 12b, the force during upper limb abduction increases with greater height and larger abduction angles. The steeper slope of the abduction angle curve compared to the height curve signifies its greater influence on the force; the response surface’s steep gradient and dense contour lines further demonstrate a pronounced interaction between these two factors on the abduction force. As shown in
Figure 12c, the force during upper limb abduction increases with greater body weight and larger abduction angles. A comparative analysis of the slopes reveals that the abduction angle has a greater influence on the force than body weight, as evidenced by its steeper curve. The steep gradient and dense contour lines of the response surface demonstrate a pronounced interaction effect between body weight and abduction angle on the abduction force.
3.2. ADAMS-Based Motion Simulation Results for the Upper Limb Stretching Device
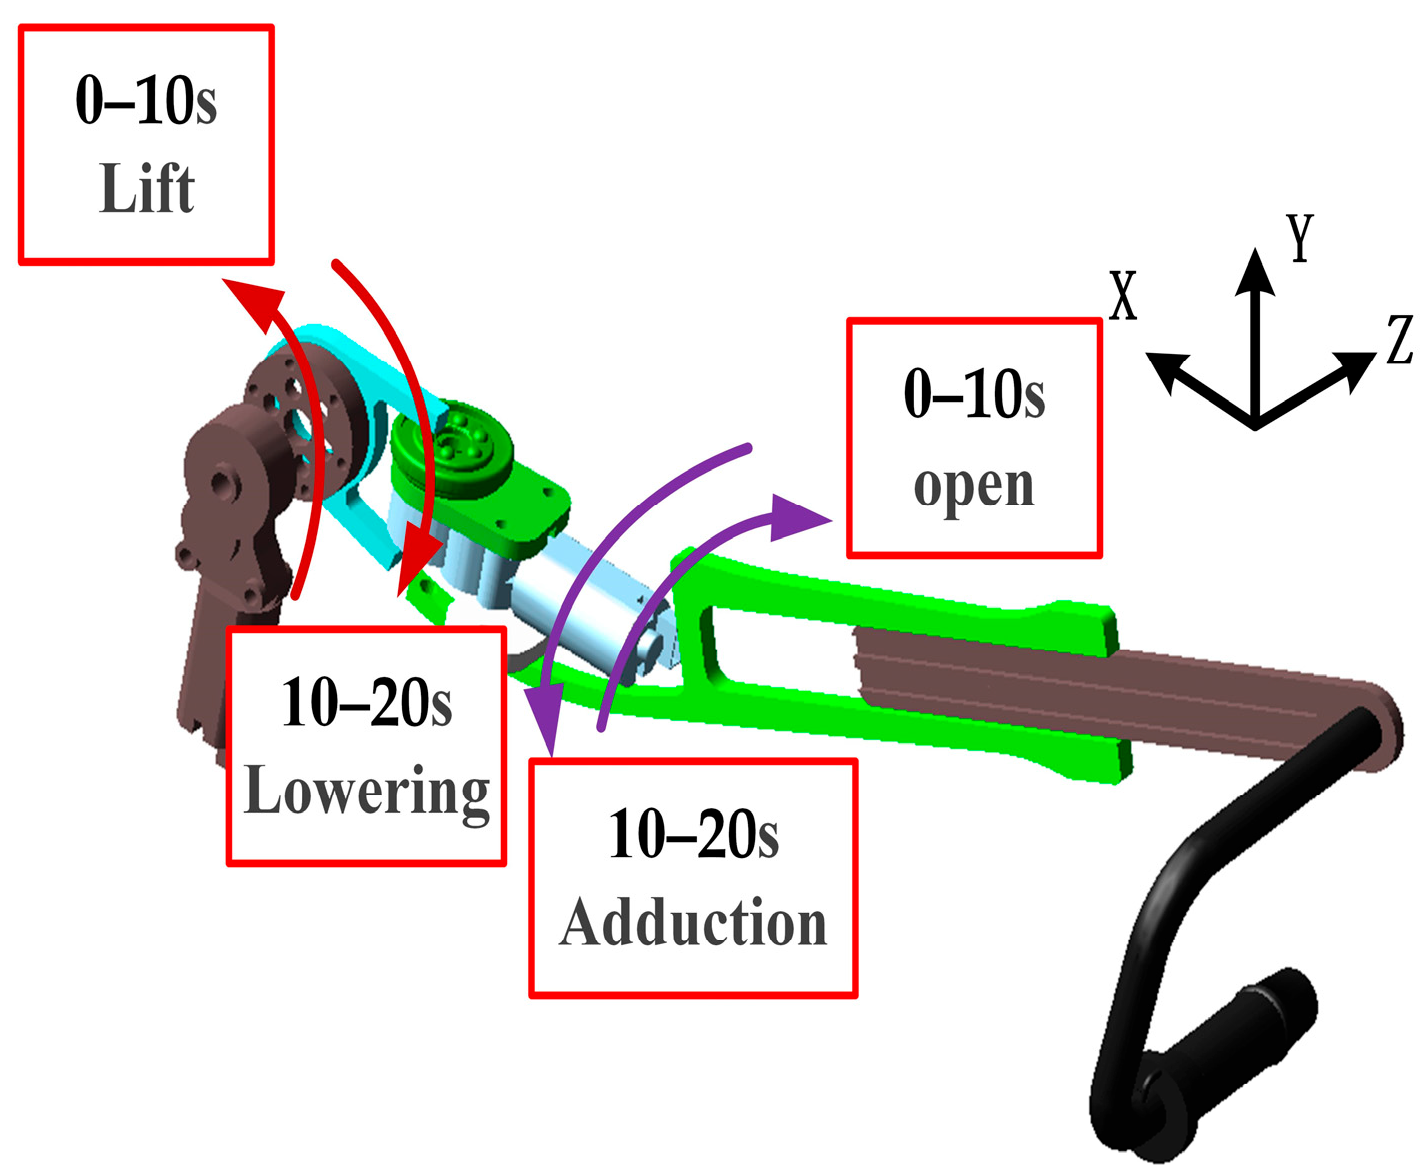
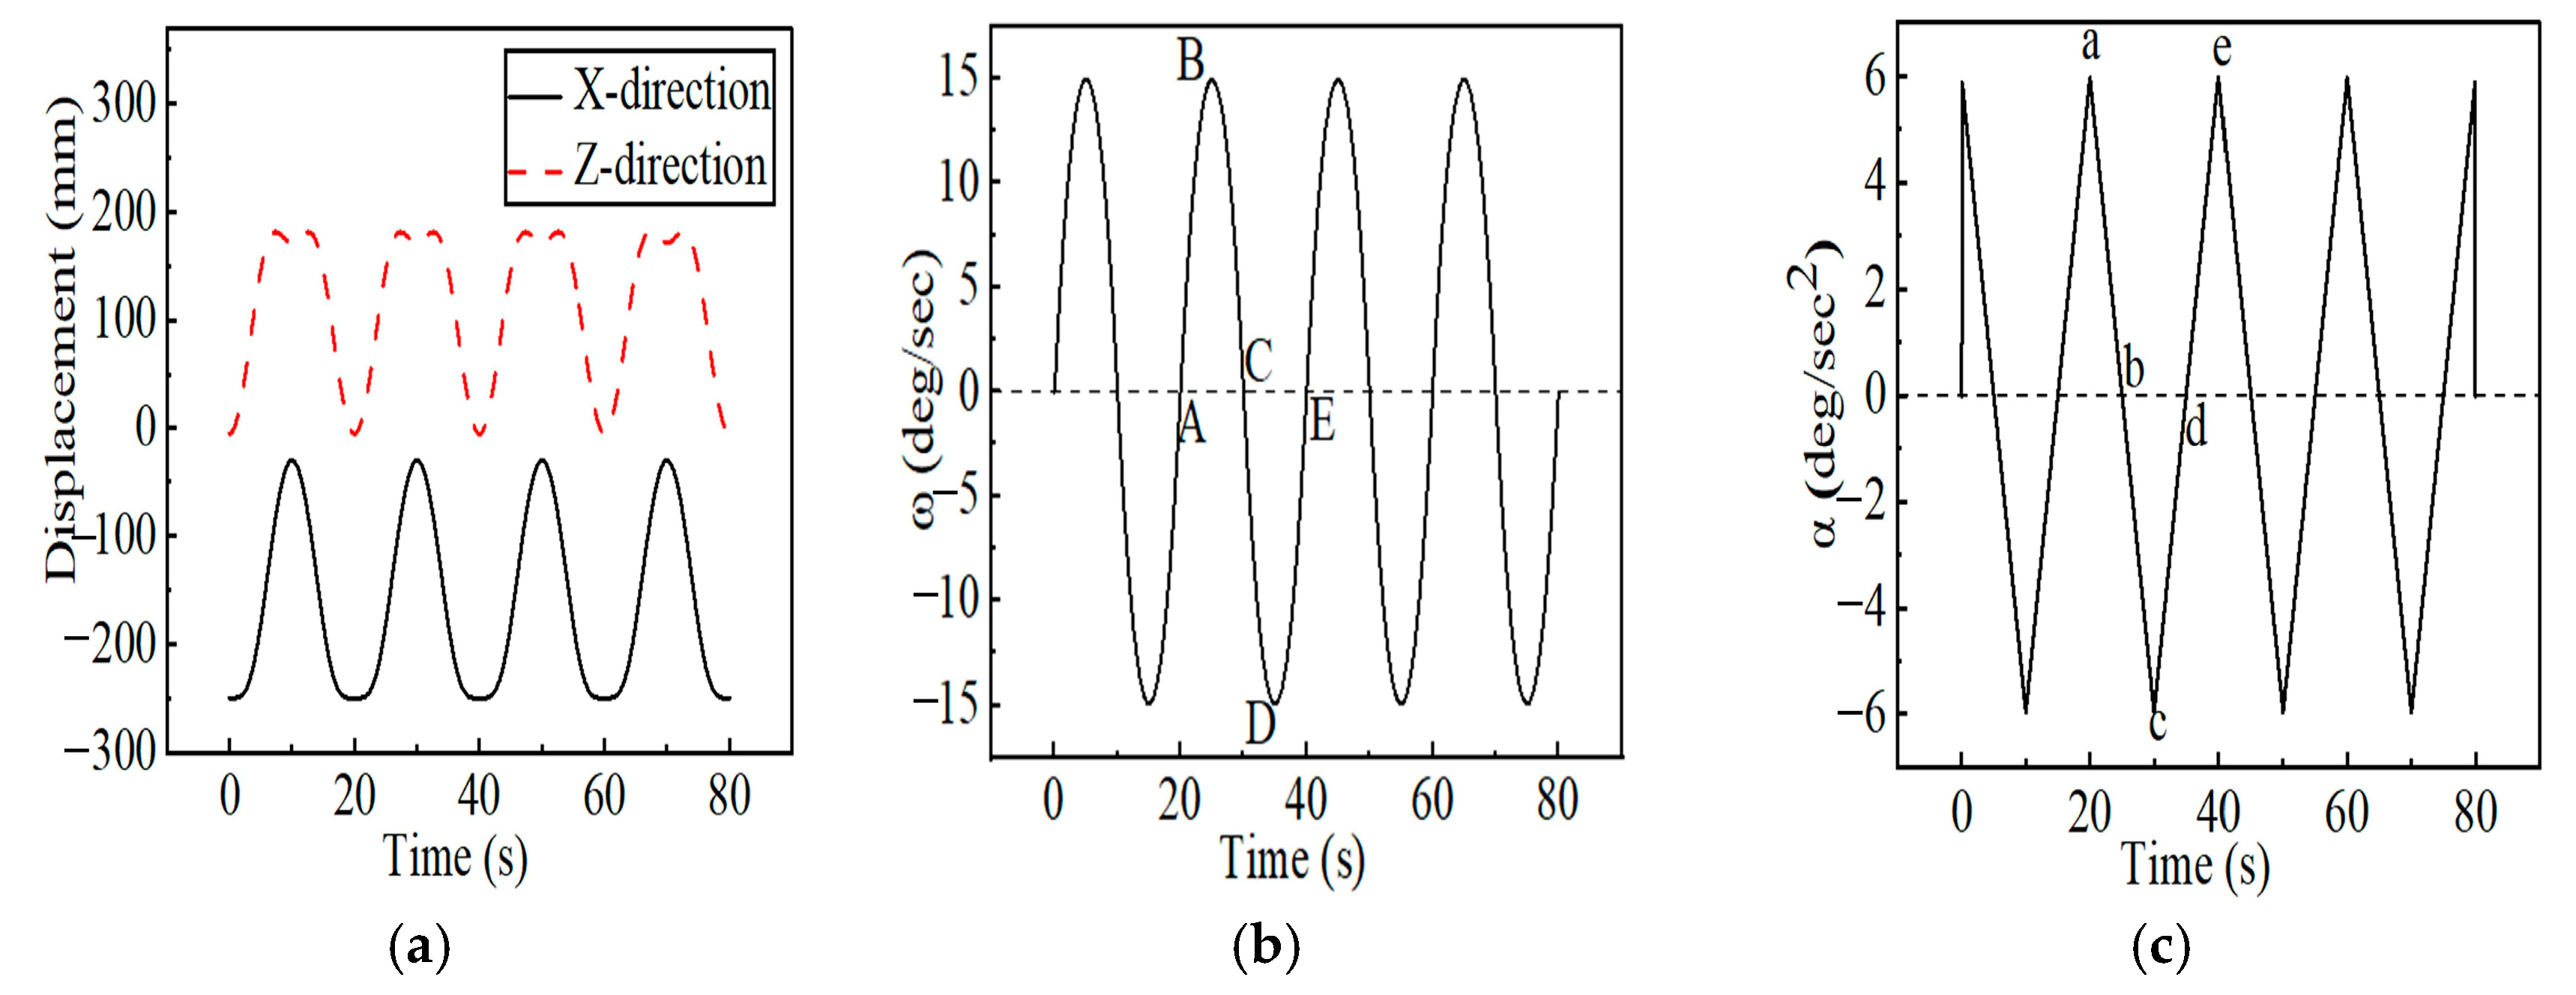
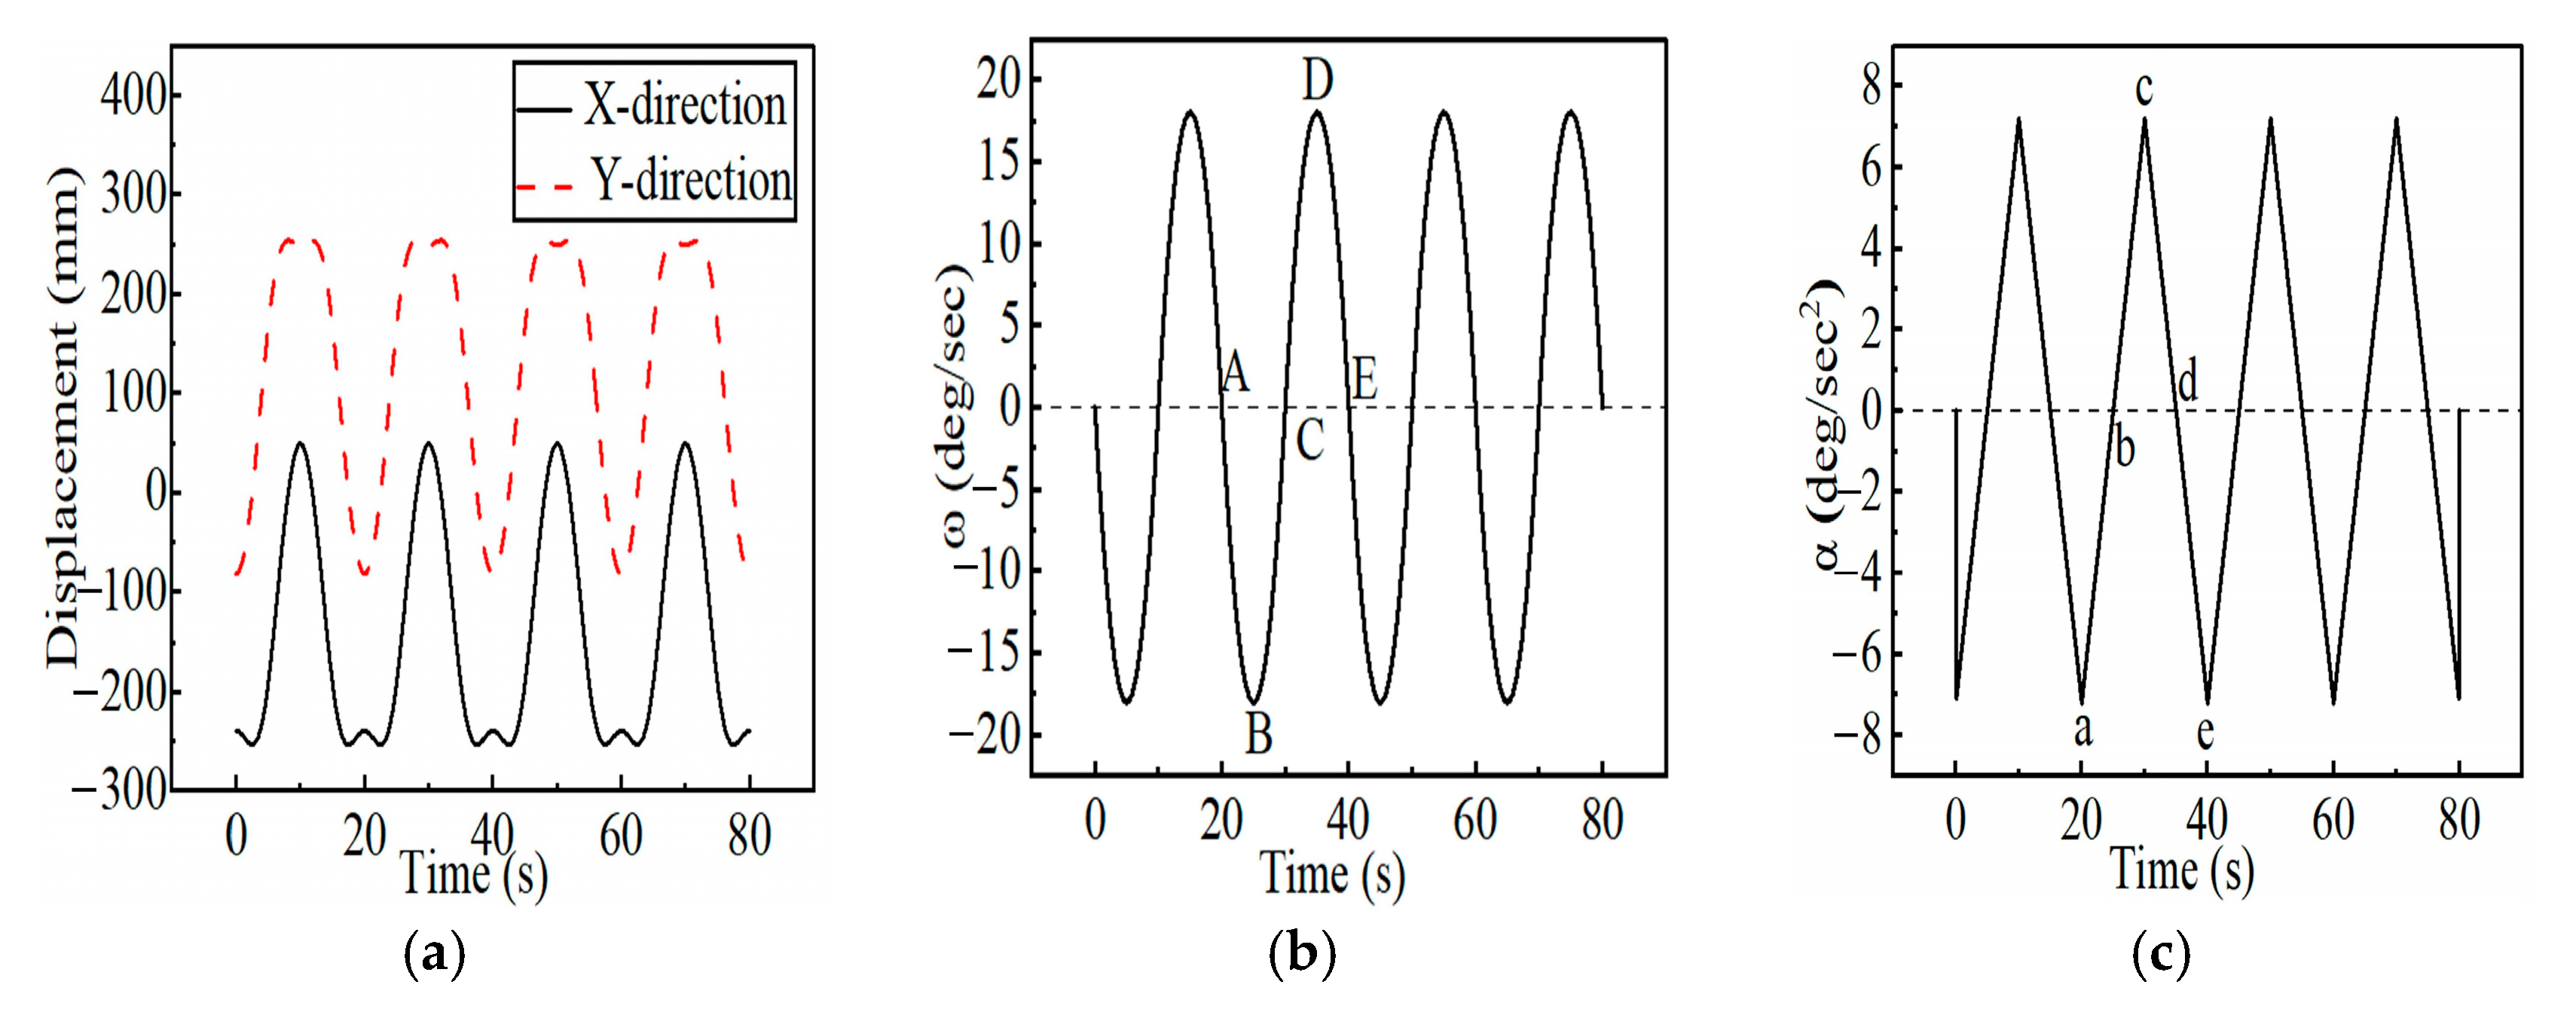
Simulation results for the upper limb abduction and elevation stretching mechanisms are shown in
Figure 13 and
Figure 14.
As shown in
Figure 13a, the discrepancies between displacement peaks and initial values at the mechanism’s centroid are approximately 219.99 mm in the X-direction and 186.44 mm in the Z-direction. These results demonstrate that the positioning performance of the upper limb abduction stretching mechanism satisfies the design requirements.
Figure 13b displays the angular velocity variation at points A-E during a full abduction-adduction cycle in the frontal plane of the mechanism, with a peak angular velocity of approximately 14.92 deg/s.
Figure 13c illustrates the angular acceleration variation at points A-E during a complete abduction-adduction cycle of the mechanism, with a peak angular acceleration of approximately 5.97 deg/s
2. The motion curves of the upper limb abduction mechanism exhibit smooth variations without abrupt changes, demonstrating good kinematic performance and compliance with design requirements.
As shown in
Figure 14a, the discrepancies between displacement peaks and initial values at the mechanism’s centroid are approximately 288.91 mm in the X-direction and 334.82 mm in the Y-direction. These results demonstrate that the positioning performance of the upper limb elevation stretching mechanism satisfies its design requirements. As shown in
Figure 14b, angular velocity variation at points A-E during a complete elevation-lowering cycle in the sagittal plane of the mechanism is presented, with a peak angular velocity of approximately 17.99 deg/s.
Figure 14c illustrates angular acceleration variation at points A-E during a complete elevation-lowering cycle in the mechanism’s sagittal plane, with a peak angular acceleration of approximately 7.08 deg/s
2. The motion curves of the upper limb elevation mechanism exhibit smooth variations without abrupt changes, demonstrating satisfactory kinematic performance and compliance with design requirements.
3.4. Prototype Testing Results
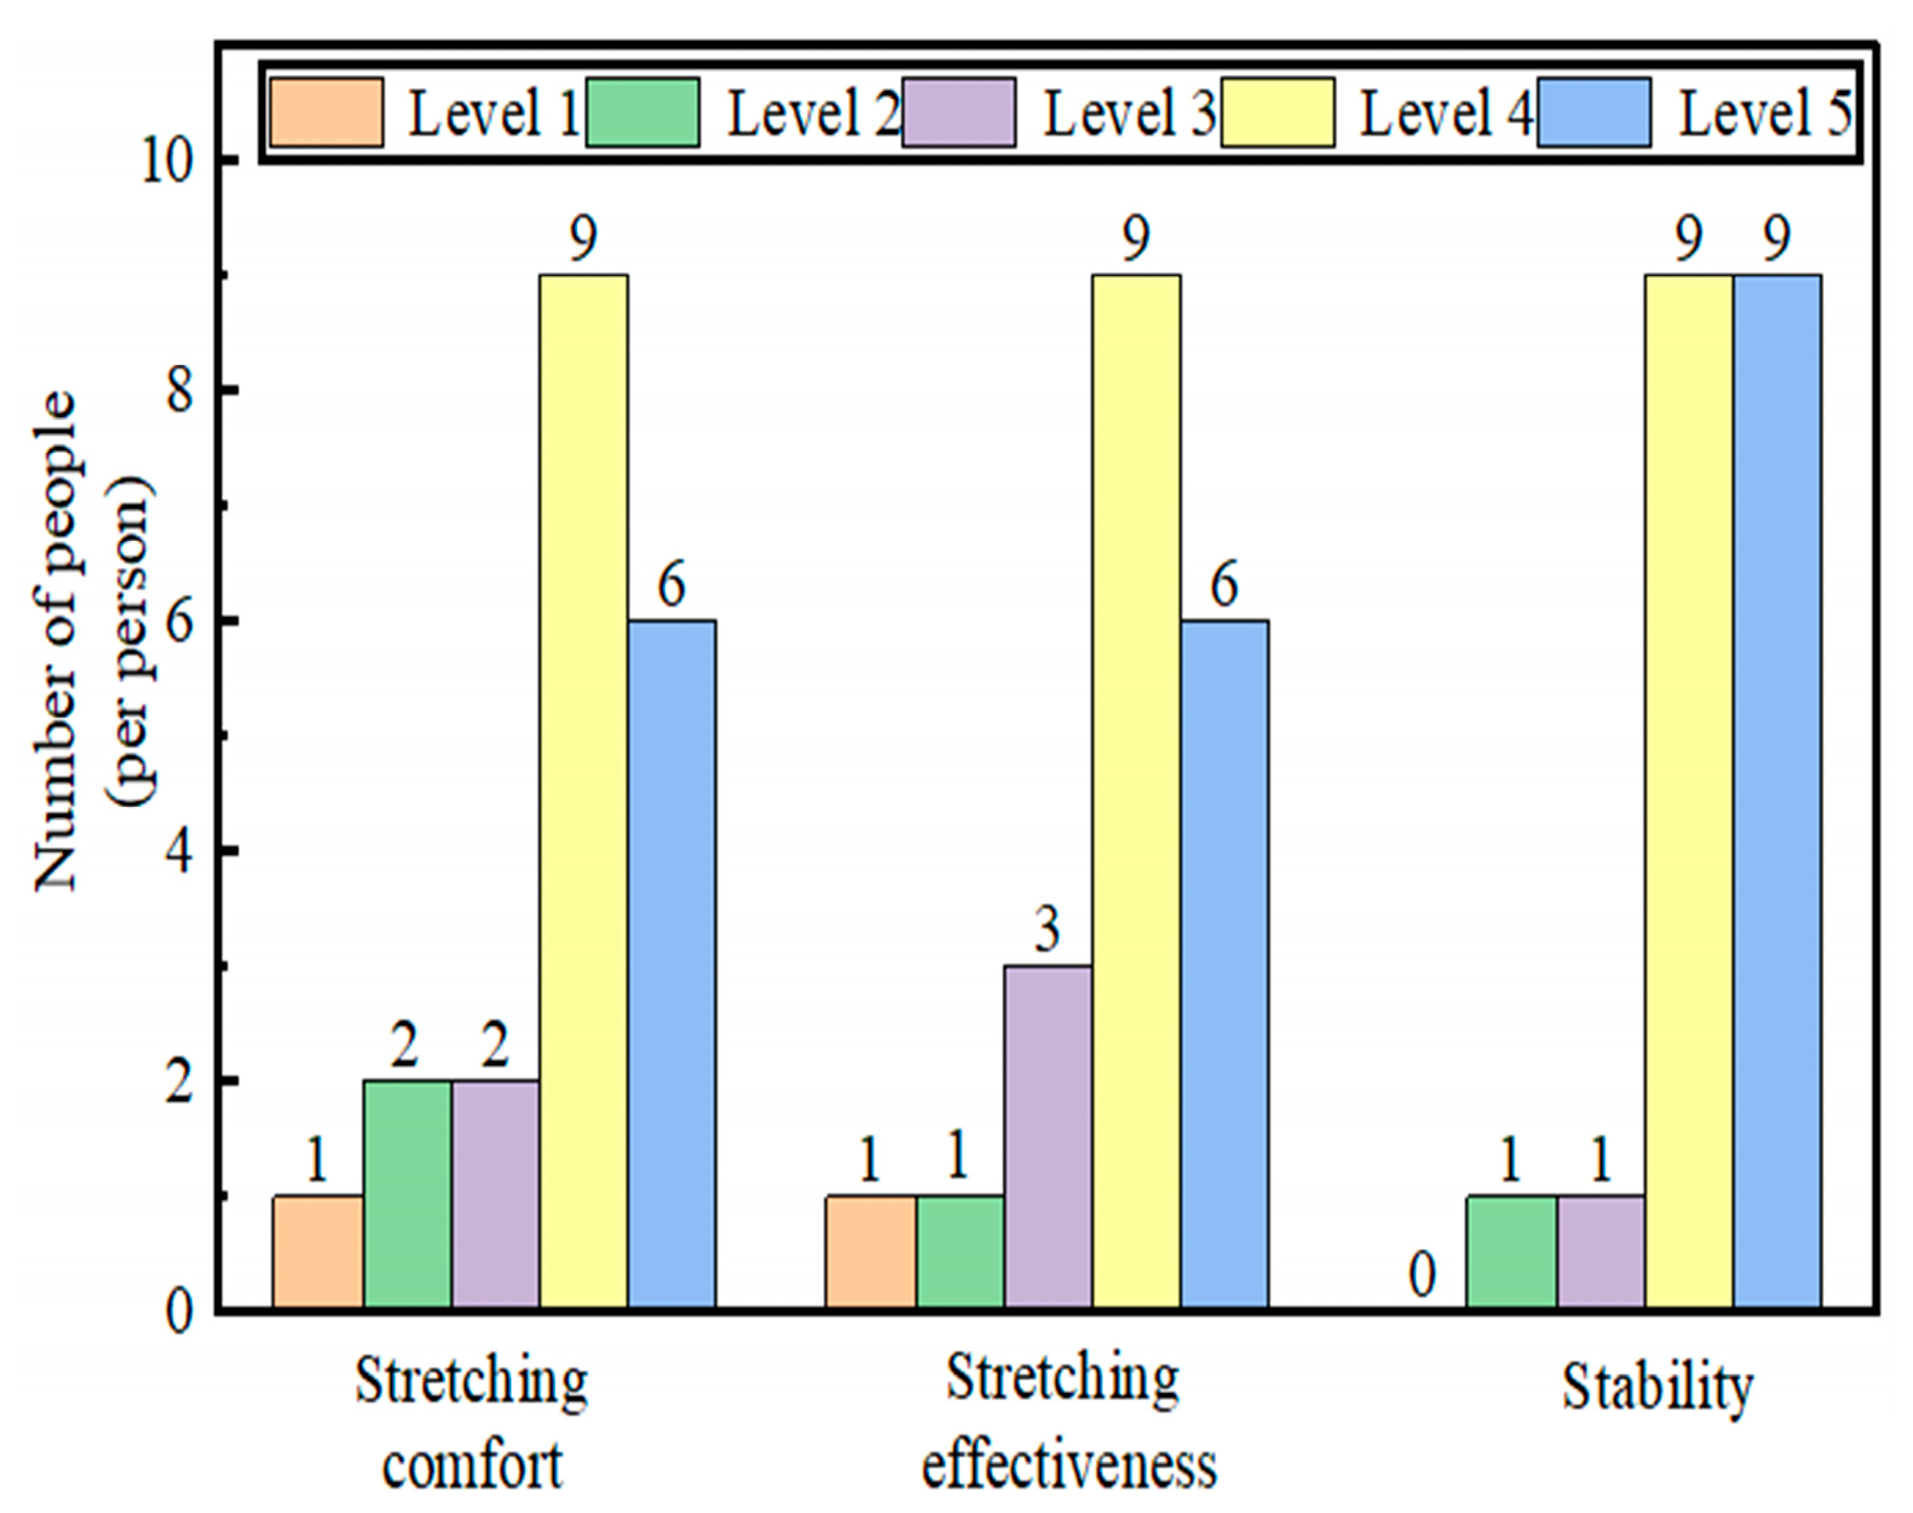
Following prototype testing, the evaluation data were processed. The experimental findings demonstrate that the upper limb stretching device successfully meets the design specifications. The subjective ratings from participants regarding the stretching comfort, muscle stretching effectiveness, and stability of the upper limbs stretching device are shown in
Figure 16.
The comfort ratings were concentrated at the highest levels, with 15 participants choosing either level 4 “Comfortable” or level 5 “Very Comfortable”. This result indicated a high level of comfort provided by the upper limbs stretching device during the stretching process. Five participants assigned lower ratings, which they attributed to a more pronounced sensation of muscle stretching during the process, resulting in discomfort. With regard to muscle stretching effectiveness, only one participant reported feeling “Minimal effect”. Combined with the comfort assessment, the stretching device for the upper limbs demonstrated effective stretching performance. In terms of stability, level 1 “severe vibrations” was not selected by any participant, whereas levels 4 and 5 were chosen by a total of 18 individuals. Therefore, the stretching device for the upper limbs exhibited good stability and posed no safety concerns during stretching exercises. In summary, the usability evaluation of the stretching device yielded positive results, which confirmed the feasibility of its design.
