1. Introduction
The research on hydraulic servo system is an industrial discipline covering many fields such as hydraulics, transmission, electricity, automatic control, signal processing, etc., and is the backbone of modern hydraulic technology. Electro-hydraulic servo valve, as core technology, is the main control part of the servo system and plays a very important role in the operation stability of the entire controller [
1]. After receiving the electrical signal sent by the controller, it is processed through relevant processes and transmitted to the hydraulic system voltage power as a polarity signal proportional to the pressure current and load pressure, so as to drive the machine to perform the specified action [
2]. In this way, the requirements of precise control and rapid feedback can be achieved, and at the same time, it has the advantage of great load resistance stiffness, making it have extremely high industrial application value [
3].
In the wake of the advancement of modern industrial production science and technology, the advantages of small inertia range and high driving performance in system control components are often seen in industrial production processes with large inertia and high power [
4]. Servo control systems have also been widely used in many mechanical fields. Their high accuracy, high output power, and short response time give them a wide range of applications. Therefore, they are used in industrial fields such as aerospace, ore smelting, and navigation technology [
5].
As a key component of servo control, the performance of the servo valve affects the normal operation of mechanical equipment. Therefore, regular inspection and testing are necessary to ensure the stable and safe operation of the servo valve [
6]. Under premise of ensuring the function of the electro-hydraulic servo valve, it is necessary to test it before production and use, and in the corresponding tests, its dynamic and static functions must be strictly tested in accordance with relevant regulations [
7].
As a core component commonly used in hydraulic systems that is both precise and complex, the electro-hydraulic servo valve has very strict parameter requirements for the corresponding use occasions, as shown in
Table 1. Its main characteristics are divided into two types: dynamic characteristics and static characteristics. Static characteristics are mainly divided into no-load voltage characteristics, load current characteristics, internal leakage characteristics, resolution characteristics, pressure characteristics, and zero-position characteristics [
8]. Commonly used dynamic characteristics are also divided into step response characteristics and frequency response characteristics [
9]. The detection experiment of the electro-hydraulic servo valve is to evaluate the properties by experimentally debugging the performance parameters under the condition of obtaining the corresponding characteristic curve.
As industrial equipment is gradually applied to working conditions in different environments, the feasibility of simulating the operating characteristics of mechanical equipment under certain working conditions has attracted widespread attention from technicians. The method of placing mechanical equipment under certain vibration conditions and judging the impact of working conditions on the equipment is called vibration environment simulation test. It is a necessary measure to determine whether the equipment can withstand the expected vibration intensity and whether the performance and accuracy of the equipment design are reduced under the working conditions [
10,
11]. It is to test the design stability and operating safety of mechanical equipment under vibration environment and obtain relevant information on the sensitivity of the equipment to vibration conditions and the accuracy of its expected life. Therefore, the shaking table required for the vibration environment simulation test is an important instrument and equipment. The hydraulic shaker, with the advantages of a large load function range and easy adjustment of frequency characteristics, is widely used in vibration environment simulation experiments on large-structure, large-area heavy-duty mechanical devices [
12].
The vibration test and loading test are usually included in the research content related to mechanical testing. It uses the acceleration and power controller module to apply set measures on the compressive strength of the test block to verify the compressive strength and motion characteristics of the test component [
13]. The advantages of the shaking table include a high power-to-weight ratio, good rapidity, and high load resistance, making it a commonly used experimental equipment in vibration and loading test technology as a method to verify and improve the stability of engineering equipment [
14,
15].
The main idea of the vibration and loading capacity hybrid test is to use the electro-hydraulic servo method to test the test piece to achieve the expected acceleration or loading capacity. However, due to the difficulty of its control, despite many corresponding studies, it is still very difficult and challenging to achieve real-time and precision characteristics of the control strategy. The core of the vibration and loading capacity hybrid test is to use electro-hydraulic servo technology to test the piece to achieve the expected acceleration and loading capacity. For electro-hydraulic controllers, the simple loading test has been relatively perfected after research in recent years, but in the oscillation and load tests, the vibration test causes interference to the servo valve, which leads to a decrease in the stability of the controller; therefore, there is currently a lack of research on corresponding control strategies.
The inherent nonlinear factors present in the dynamic characteristics of the electro-hydraulic servo valves are key factors that affect the control accuracy and constrain effectiveness of vibration suppression strategies. They also pose challenges for precise modeling, which can be mainly summarized into the following categories [
16]:
- (1)
The flow-pressure characteristic is nonlinear. The core parameters of the servo valve, namely, the flow gain coefficient and the flow-pressure coefficient, vary with the spool displacement and load pressure difference, exhibiting non-constant characteristics. This leads to a drift in the system’s open-loop gain with changes in the operating point, affecting the consistency of parameter tuning for the vibration suppression controller.
- (2)
There is the nonlinearity of friction. The combined effects of Coulomb friction, viscous friction, and static friction between the valve core and valve sleeve exhibit nonlinear hysteresis characteristics and dead zone effects. This not only diminishes the system’s ability to distinguish micro-amplitude vibration signals but also potentially induces limit cycle oscillations, thereby limiting the practical performance of linear vibration suppression strategies.
- (3)
Saturation nonlinearity. Due to the limitations of the electromagnetic output force, displacement limit of the mechanical structure, and supply pressure of the pilot stage, the input-output characteristics of the servo valve exhibit significant amplitude saturation. Under large amplitude vibration commands or strong disturbances, the saturation effect can alter dynamic characteristics, limit output capability, and even lead to integration issues, resulting in reduced vibration suppression effectiveness.
- (4)
There is the nonlinearity of hydraulic forces. The steady-state and transient hydraulic forces acting on the valve spool dynamically change with valve port opening, flow rate, and direction. Their direction of action tends to hinder the movement of the valve spool, equivalent to a nonlinear negative damping or negative stiffness effect. This not only increases the uncertainty of the valve spool’s dynamic response but also complicates precise system modeling, thereby affecting the robustness of model-based vibration suppression algorithms.
This study addresses the issue of servo valve performance degradation faced by electro-hydraulic servo vibration platforms in a vibrating environment. It establishes mathematical models for a force-feedback two-stage servo valve and a single-degree-of-freedom electro-hydraulic servo vibration platform under such conditions. The core contribution of the research lies in proposing a vibration suppression method based on an adaptive lattice notch filter. It is verified that this method effectively suppresses resonance peaks, reduces overshoot, and enhances the fidelity of the output signal, significantly improving the stability and control accuracy of the vibration platform in a vibrating environment.
Based on the physical platform of the horizontal single-degree-of-freedom electro-hydraulic servo shaking table, this paper systematically studies the main functions of the servo valve under vibration and impact conditions, according to the vibration test characteristics. Combining the method of applying hydraulic transmission theory and control principles, by studying the influence of the acceleration caused by the valve core, armature baffle components, and various components of the servo valve under vibration and impact conditions, after establishing the servo valve numerical model, the mathematical model of the electro-hydraulic servo valve under ideal vibration conditions is obtained, and the force conditions of various components under vibration conditions are judged. Through mathematical calculation and simulation, the structural relationships of the electro-hydraulic servo valve and the changing laws and characteristic frequencies of the characteristic point displacement of the servo valve under normal operating conditions are clarified, and vibration suppression measures for the electro-hydraulic servo valve are implemented accordingly. Research results not only provide a certain technical foundation and method for the precise control research of the hydraulic vibration table but also provide a technical basis for the control strategy of the hydraulic servo control system.
3. Modeling of Servo Valve Shaking Table Based on Vibration Environment
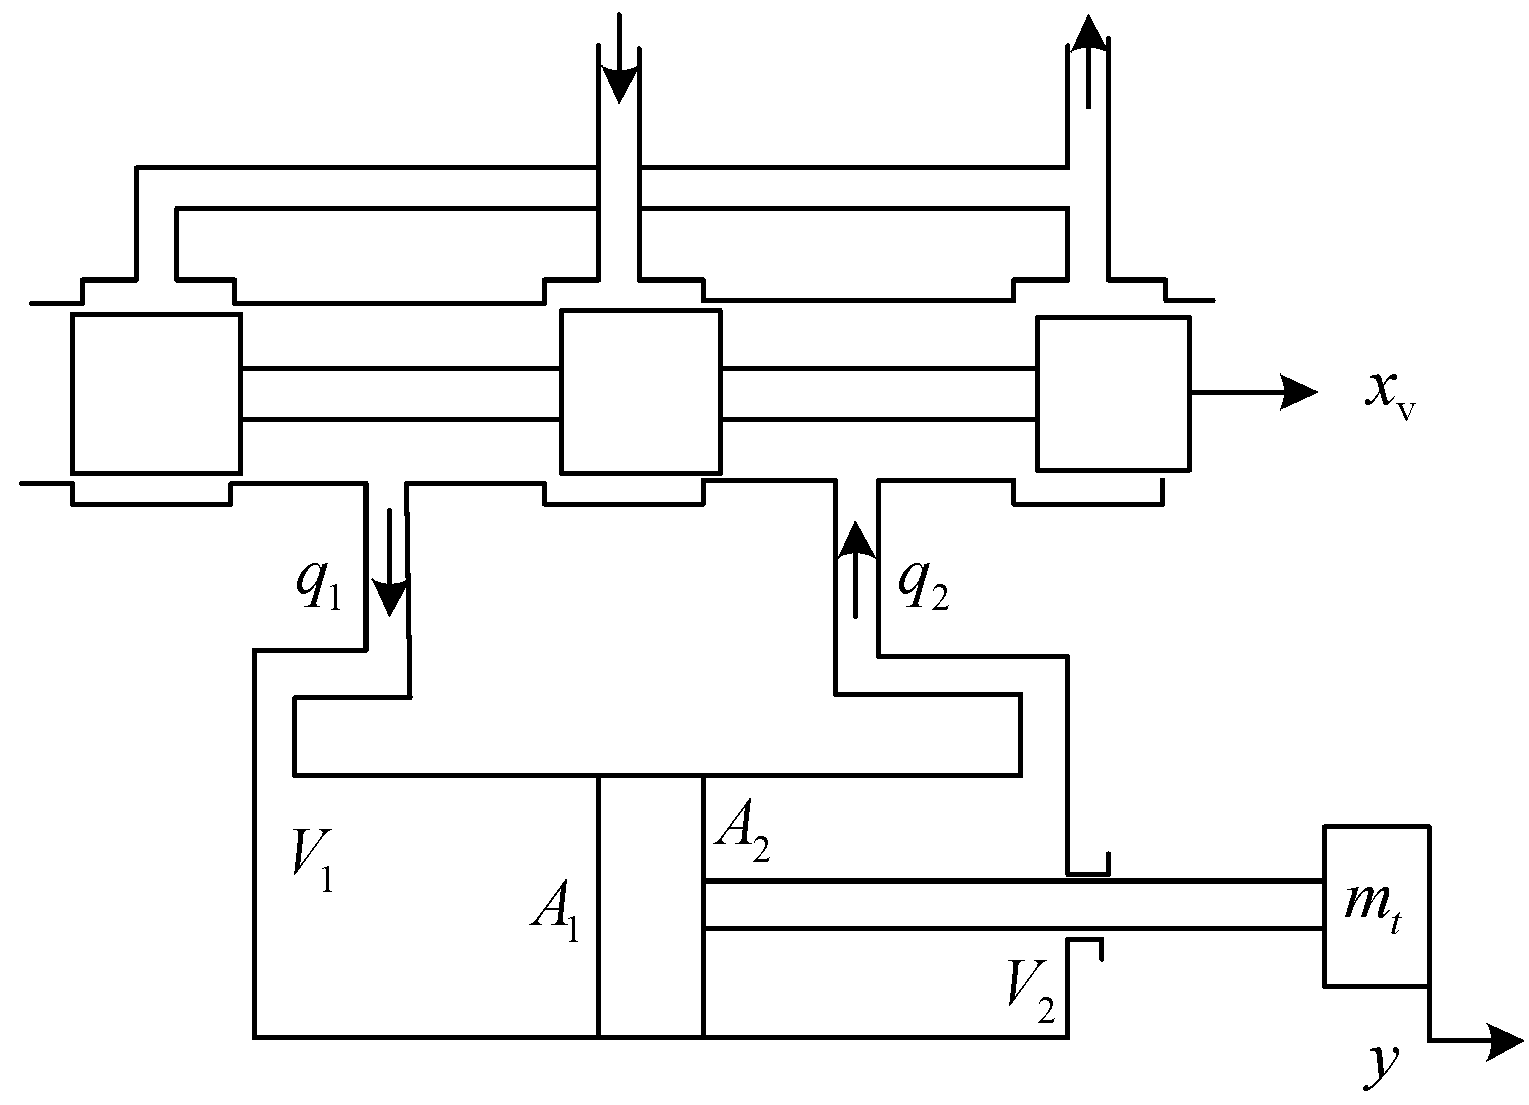
The schematic diagram is shown in
Figure 5. According to the actual model of the asymmetric hydraulic cylinder, the ratio is as follows:
According to the flow continuity equation of the hydraulic cylinder, the flow relationship between the left and right chambers can be derived from Equation (12) as follows:
The right movement of the valve core is set to be in a positive direction. When the valve core moves to the right, that is, when the displacement
xv of the valve core is greater than 0, the linearized flow continuity equation, load flow equation, and force balance equation can be obtained [
29,
30]
The Laplace transform of the three equations is as follows:
Therefore, the transfer function model of the valve controlled hydraulic cylinder that obtains the output displacement of the piston rod and the displacement of the valve core input by the command signal is shown below [
31]
Without considering viscous friction and load elasticity, it can be simplified as
When the slide valve moves to the left, that is, when the displacement
xv < 0, the piston is in a state of retracting to the left. The transfer function model of the valve controlled hydraulic cylinder is shown below
Without considering viscous friction, it can be simplified as
Thus, a mathematical model of the actuator during the expansion and contraction process of an asymmetric hydraulic cylinder was established. This model was introduced into the mathematical modeling of the hydraulic system based on the flow ratio of the asymmetric hydraulic cylinder and the different pressures at both ends of the slide valve orifice, and its transfer function was obtained to make it more reliable and practical. Based on the above mathematical modeling, combined with the mathematical formula in the vibration environment in the previous chapter, the mathematical transfer function of the electro-hydraulic servo valve in the vibration impact environment of the electro-hydraulic servo vibration table can be obtained.
The flow pressure coefficient
Kc changes according to the displacement, which is used to measure the change in flow caused by changes in load pressure, so the value is a variable. But for the convenience of application, the numerical value is in the most unfavorable situation and is treated as a constant. When the hydraulic valve of the hydraulic system is working at zero position, the value of its flow pressure coefficient is relatively low, but the flow gain is also at its maximum, resulting in the maximum gain of the hydraulic system and the lowest stability. If the hydraulic system can still work normally in this situation, then it can also work normally in other situations. As can be seen from the above, when the spool is in the zero position, the evaluation of its flow pressure coefficient is as follows:
The internal leakage coefficient is
Cip = 5 × 10
−13 m
5/N·s, and the external leakage coefficient is
Cep = 0. When the hydraulic cylinder is in extended motion, that is, when
xv > 0, the equivalent leakage coefficient can be calculated as:
The total pressure and flow rate obtained are:
Due to the neglect of interference caused by external leakage and interference with the friction cylinder, the hydraulic cylinder can operate at a fixed frequency in a state that can be considered as “no external leakage”. However, due to the high-pressure fluid, which is equivalent to the stiffness of the hydraulic spring and the equivalent volume
Ve = 5.5 × 10
−4 m
3. The total stiffness value is
When the hydraulic cylinder is in retraction motion, that is, when
xv < 0, the equivalent leakage coefficient can be calculated as:
Similarly, the following formula can be obtained:
At this time, the piston is in the middle position, and the equivalent volume of the hydraulic cylinder when it is in the middle position is
Ve = 4.1 × 10
−4 m
3. The total stiffness value is
4. Adaptive Grid Filter Method for Suppressing Vibration Interference in Servo System
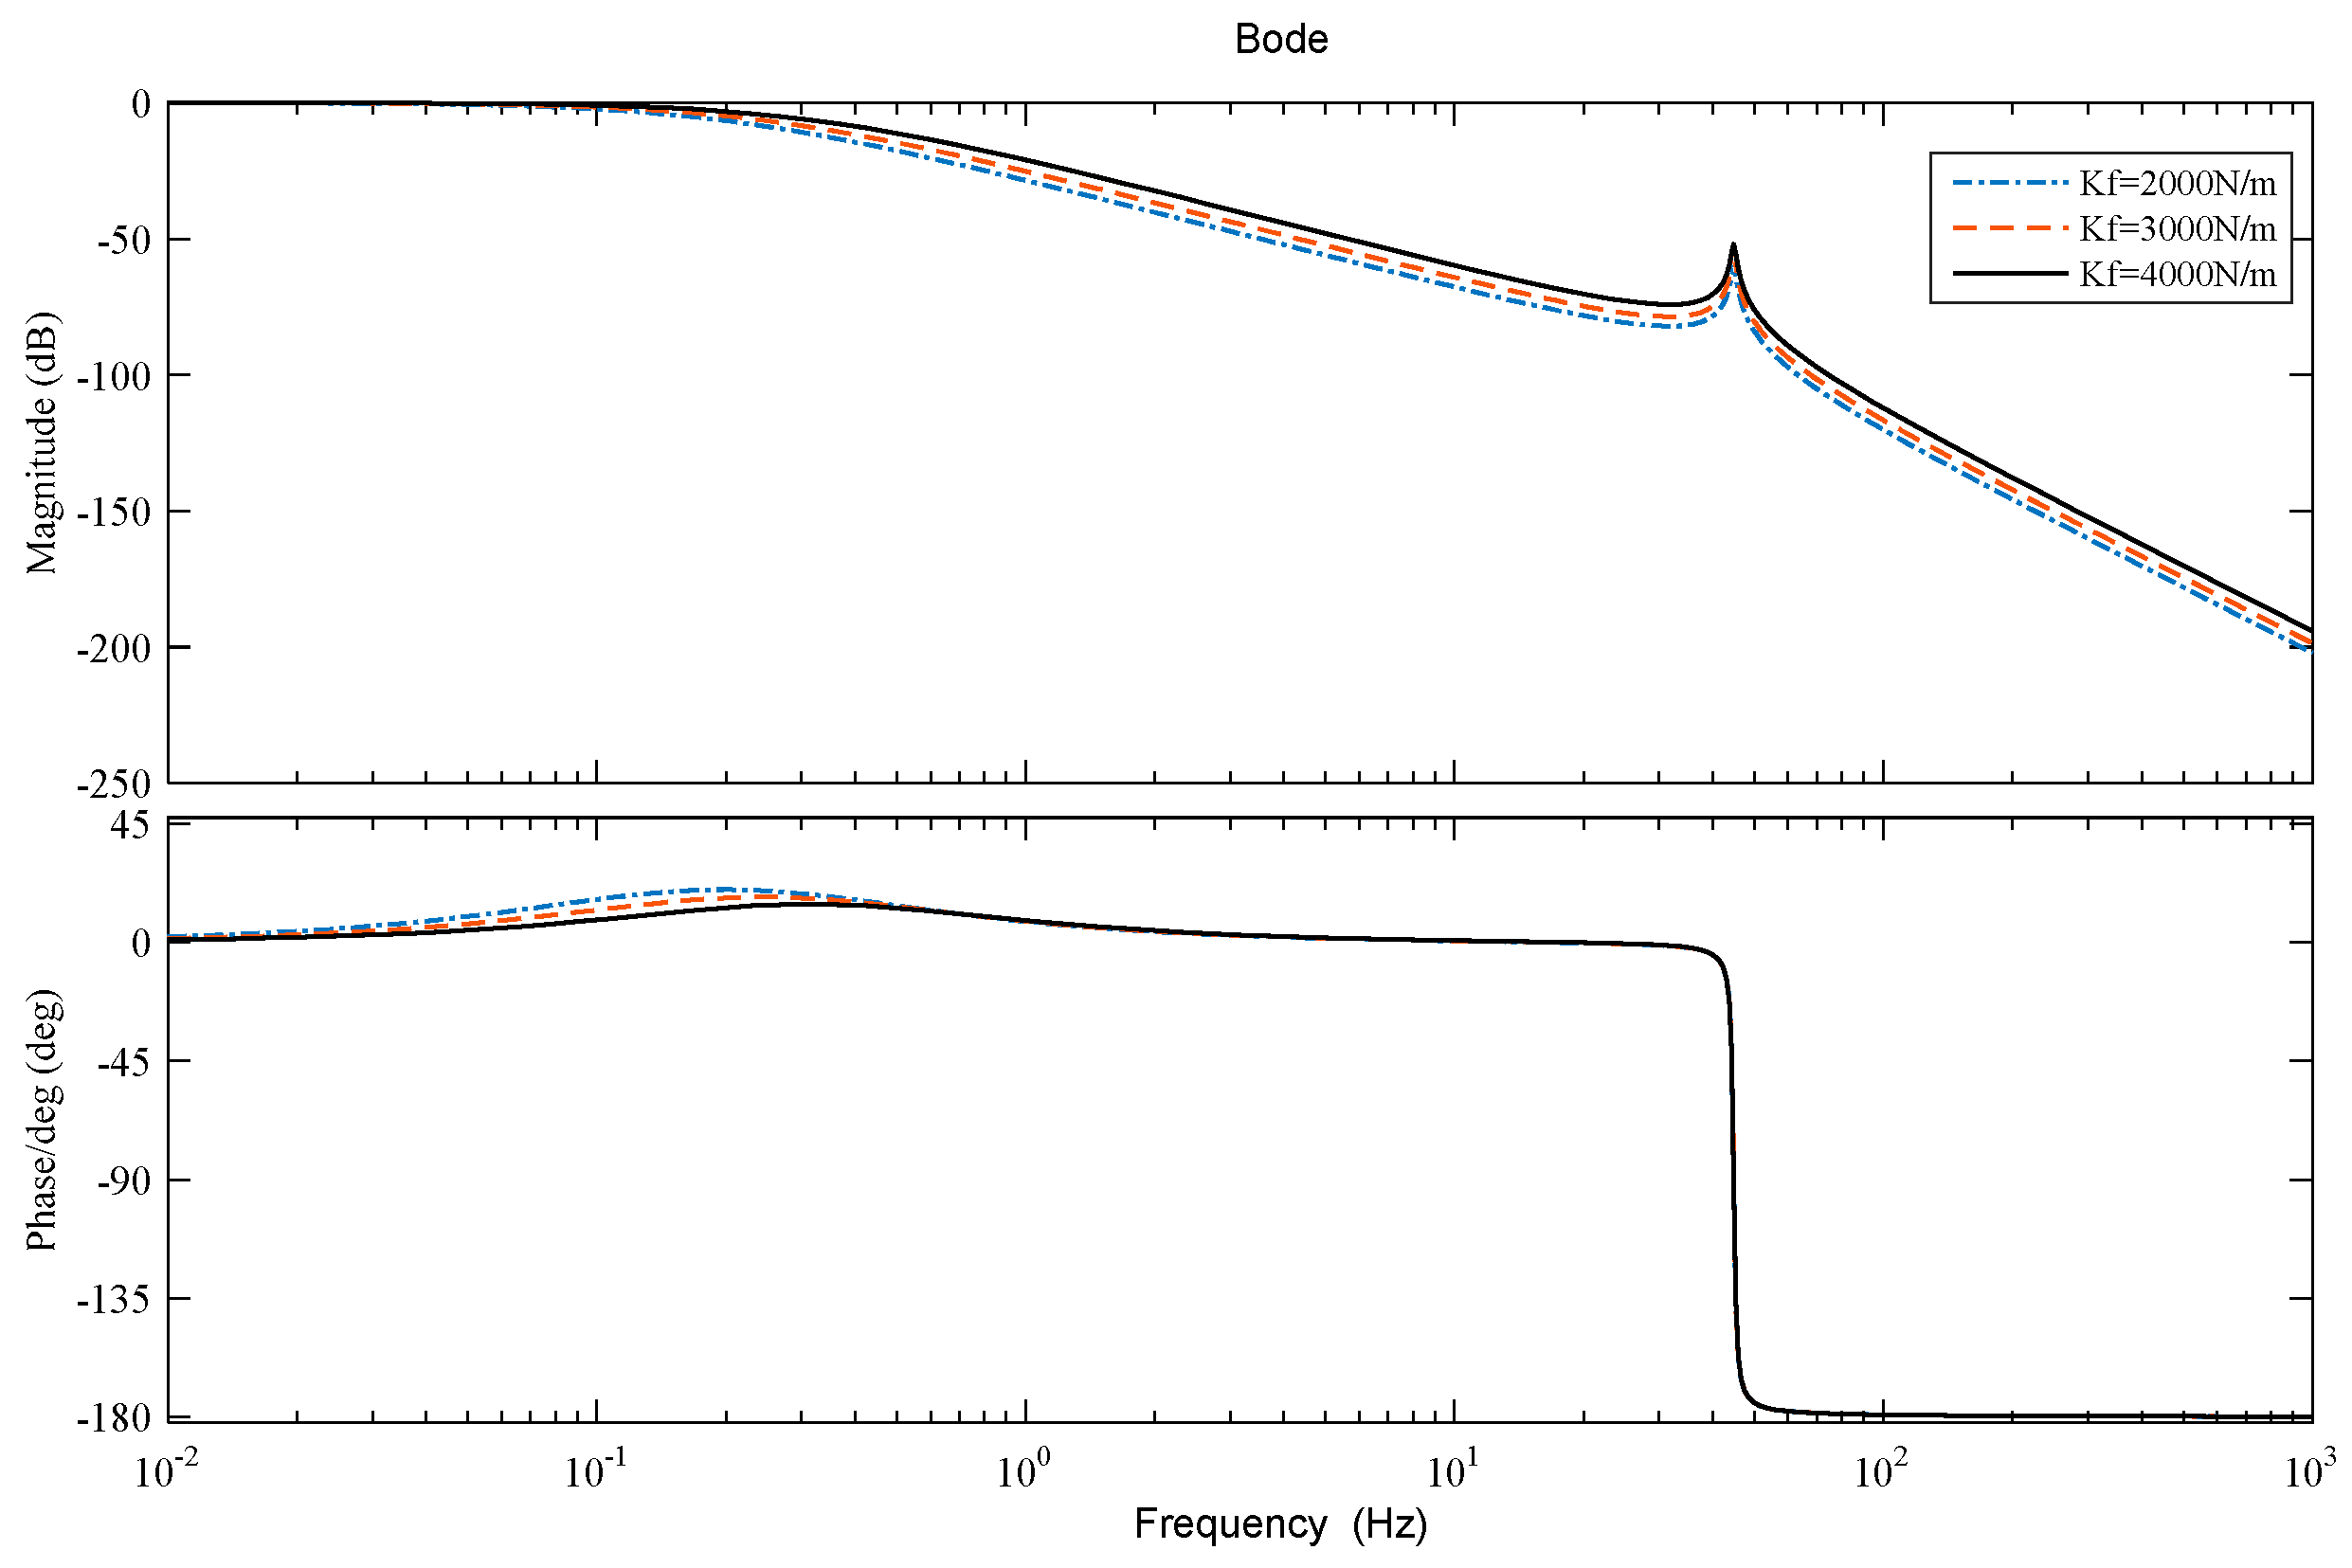
This section focuses on servo valves and explores their working characteristics under vibration and impact conditions due to the sensitivity of the linear displacement of the slide valve armature to frequency changes in the low frequency range (<100 Hz). As shown in
Figure 6, the frequency spectrum is based on different values of spring tube stiffness. When the vibration frequency is higher than 45 Hz, gain of amplitude frequency is large, which is prone to resonance problems. The influence of mass on load displacement is minimal, while an increase in load pressure and spring tube stiffness will enhance frequency characteristics and resonance. The applicable frequency range is within the resonant frequency range, which seriously interferes with the stability of the servo valve. Therefore, it must be taken seriously, and efforts must be made to prevent the operation of electro-hydraulic servo valves under such oscillation conditions.
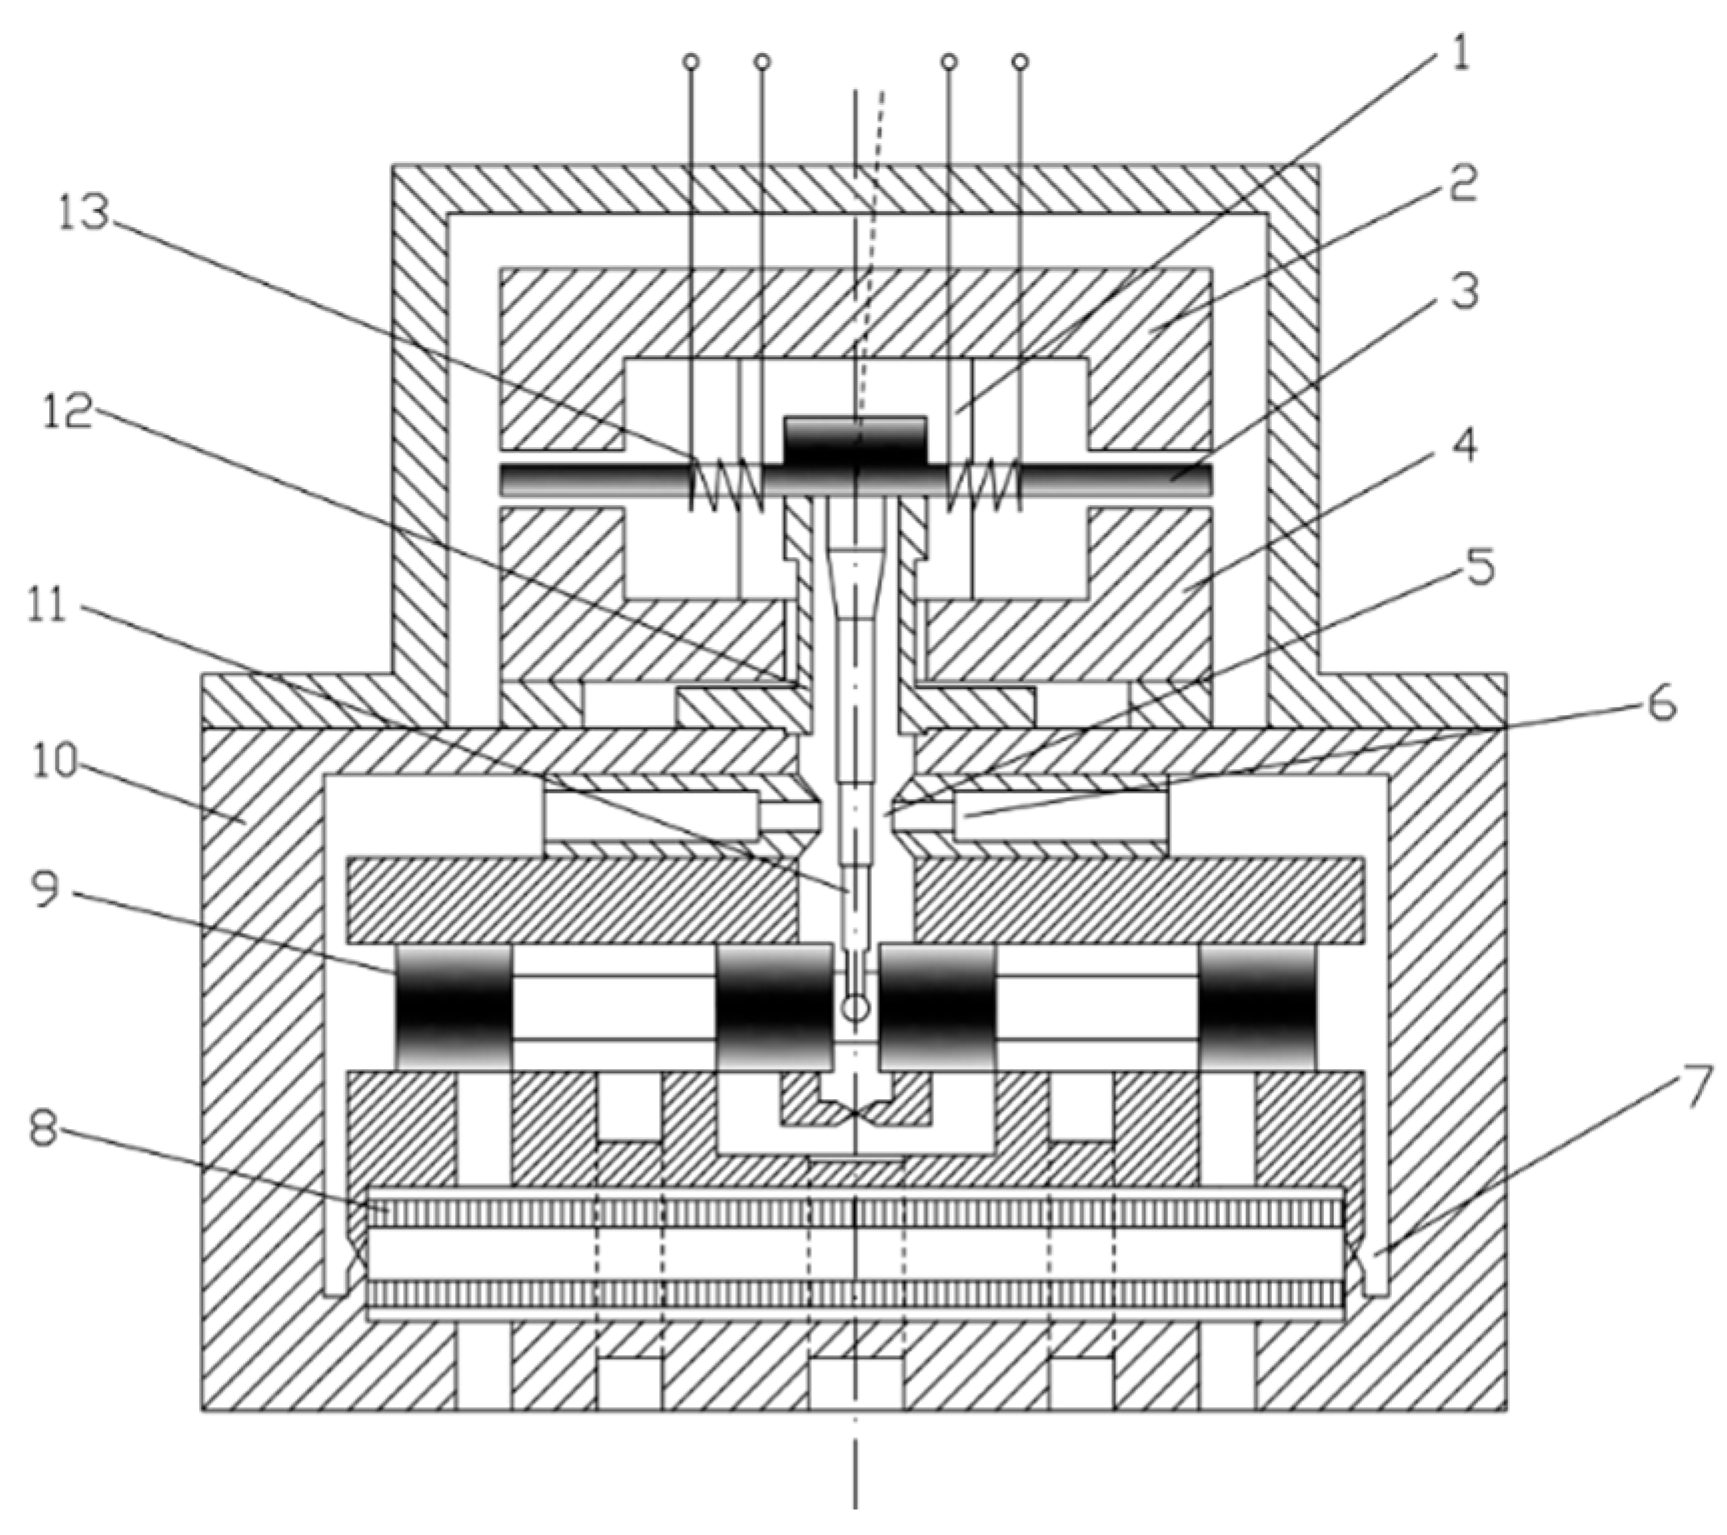
The core components of the servo valve of the armature baffle assembly mainly composed of the armature, the partition, the damping reed tube, and the reed tube, which together form a rigid connection at the top of the tube. At the same time, the center of mass of the assembly mainly falls between the reed tube and tube; however, because the tube is a component with hollow cantilever beam characteristics, improvements have been made by increasing the stiffness of the spring tube, such as expanding the outer diameter of the spring tube or reducing the inner diameter of the spring tube, to enhance its rigidity that further improves the vibration resistance and impact resistance.
This article proposes a technique for suppressing vibration interference in an electro-hydraulic servo control system using an adaptive grid notch filter combined in the time domain frequency range. The technique utilizes a parallel processing structure, optimal prediction windowing, and spectrum adjustment techniques to accurately predict the frequency spectrum of the interference signal in a small frequency range. Then, the frequency estimation error and signal-to-noise ratio are used to determine the optimal predicted notch bandwidth, and the main technical parameters of the grid notch filter are adaptively modified [
32,
33]. Through scientific research and experimental verification, this technology not only has greater security and real-time performance than conventional anti-interference methods but also minimizes damage to useful signals while effectively suppressing interference [
34,
35].
The transfer function
H(
z) of a second-order lattice notch filter is
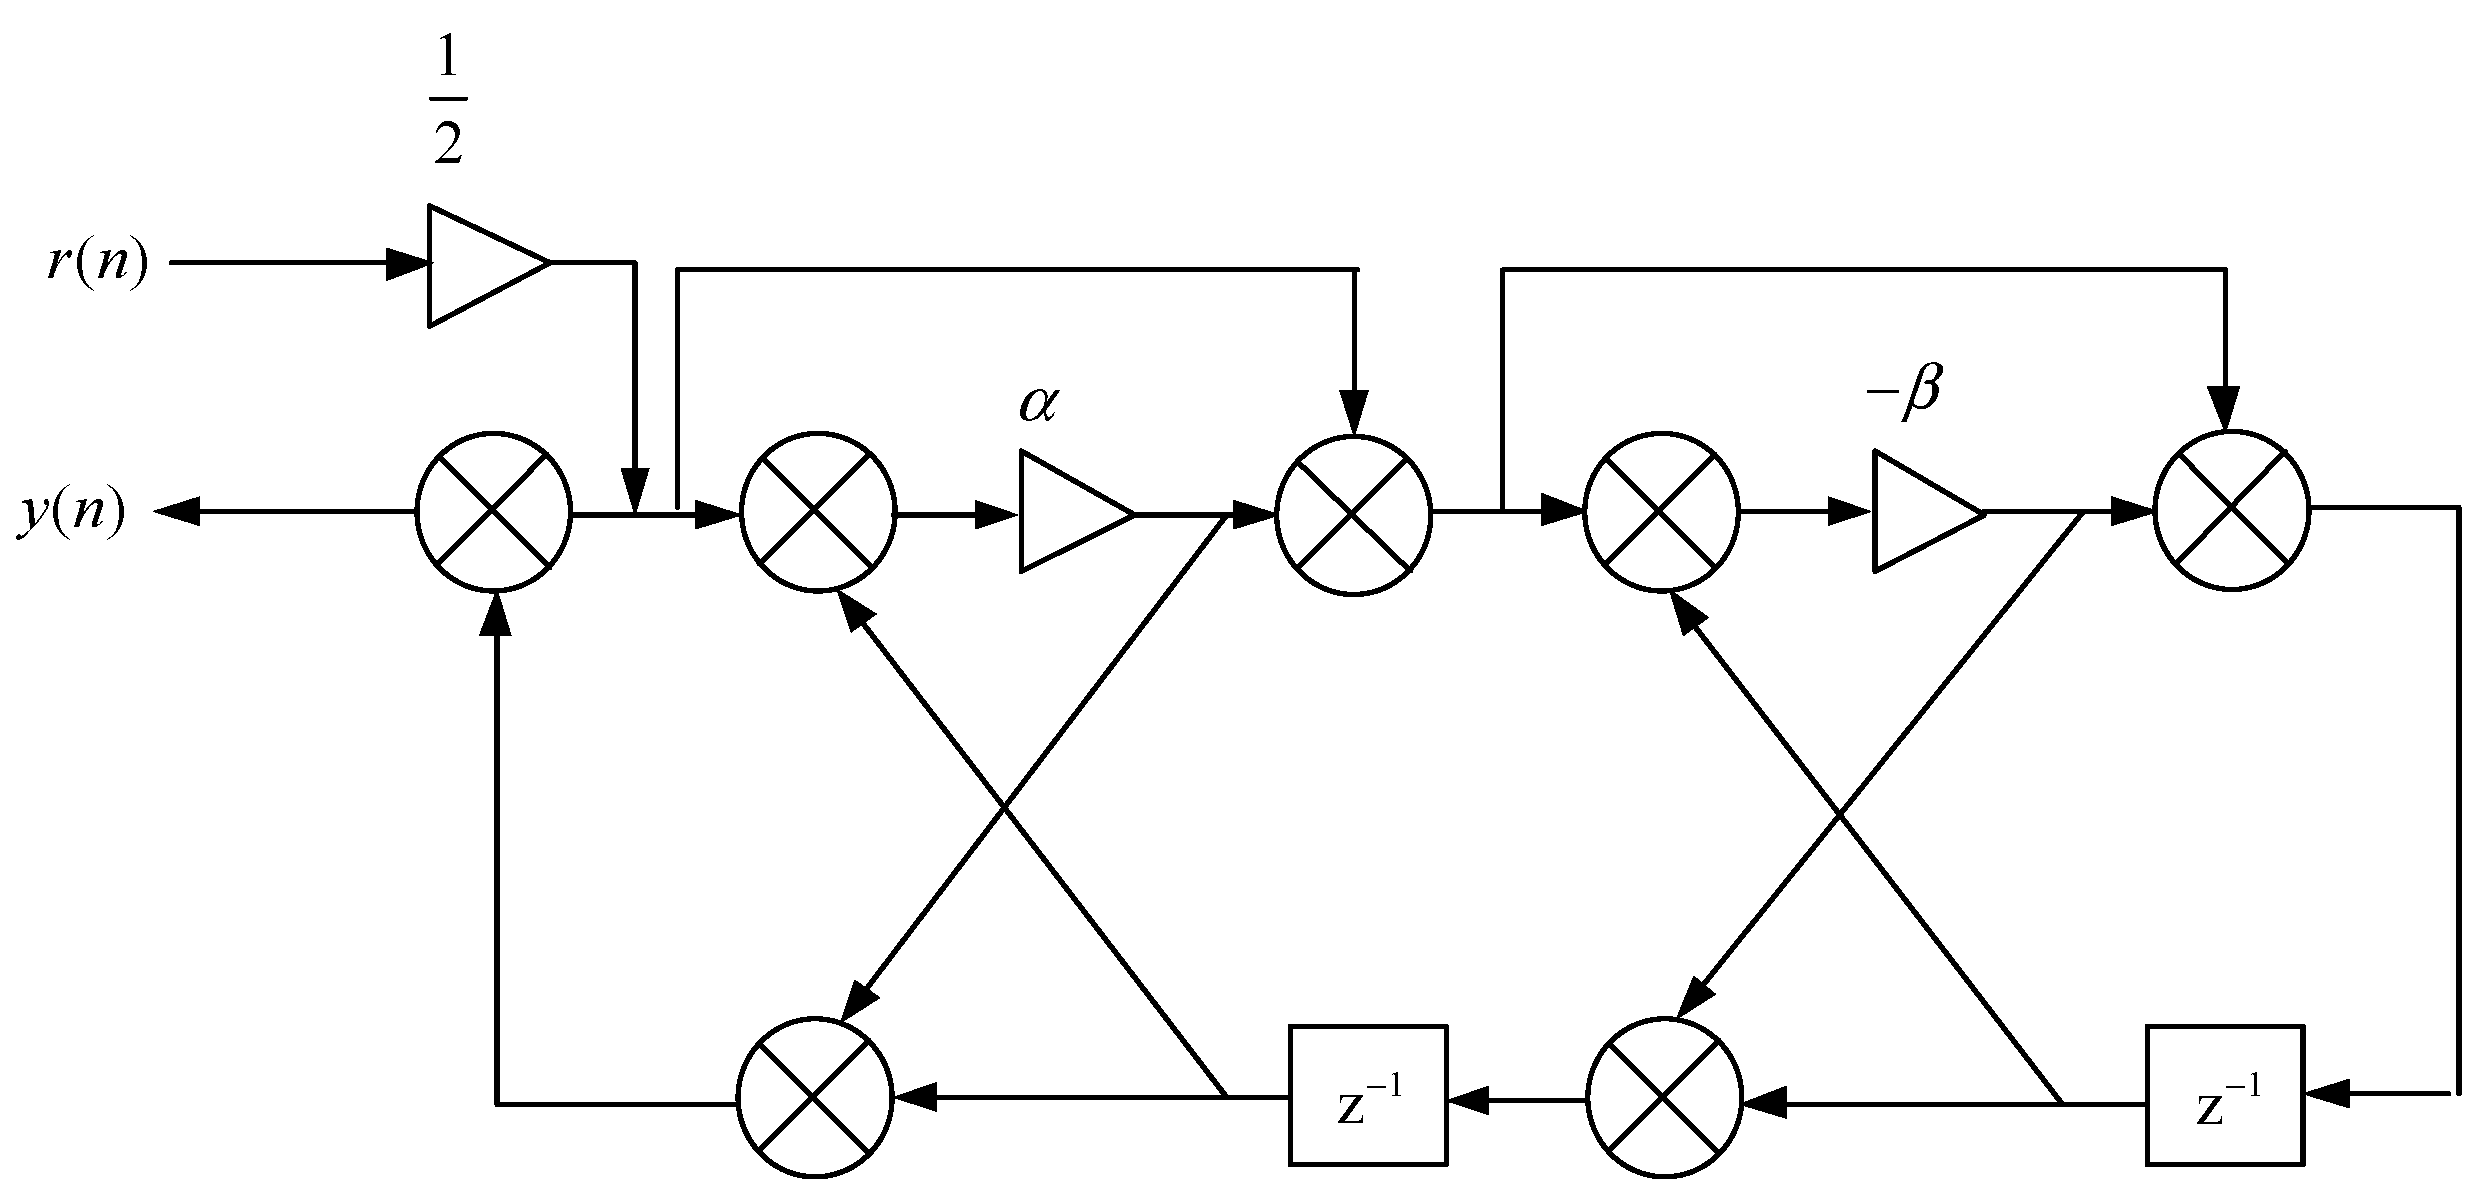
The corresponding structure is shown in
Figure 7.
After sampling, the spread spectrum signal consists of the following components:
In the formula,
r(
n) is a signal with interference, noise
s(
n) is the base signal,
n(
n) is the noise signal, and
i(
n) is the interference signal, which can be expressed as:
After using a notch filter, the power of the output signal is
is the square of the modulus of the response function,
is the power spectrum of the interference and noise signals, and the mathematical formula is
In the equation,
is the variance of the signal-to-noise ratio, and
refers to the power spectral density of the signal. Since the output power of the signal is much smaller than the total output power of the noise, assuming
and
, the output power of the output signal is described as [
35]
Under the premise of constant power, changing different notch values, that is, by varying the value of
β, there is a possibility of minimizing the power of the output signal [
36]. In practical applications, it is difficult to accurately estimate the spectral range of interference signals, so the bandwidth parameters of the notch should consider the error range of frequency estimation [
37]. Assuming the error range of spectrum estimation is
ω1 <
ω <
ω2, the obtained signal-to-noise ratio is JSR. For complete control of interference, assuming
ω1 <
ω <
ω2, the following formula is given:
Under the premise of suppressing all interference and minimizing the loss of useful information, the bandwidth value can be set as Δ
ω =
ω2 −
ω1, which means that the equal sign holds for both
ω =
ω1 and
ω =
ω1The notch bandwidth coefficient α is a monotonic function of the notch bandwidth Δω value. Given the signal-to-noise ratio JSR, as the α value gradually approaches 1, the bandwidth of the notch filter gradually decreases; when there is no interference, setting the α value to 1, it becomes a pass-through filter.
When α is too small (the notch is too wide), the advantage is that it is insensitive to the estimation error of β and has good robustness. The disadvantage is that it excessively attenuates the useful signals near the target frequency, leading to signal distortion and reducing the system’s fidelity.
When α is too large (the notch is too narrow), the advantage is that it causes minimal damage to the useful signal and has high fidelity. The disadvantage is that the accuracy requirements for β become extremely stringent, making the system fragile, and even a slight frequency offset may lead to suppression failure.
Formula (41) in this paper is precisely designed to resolve this contradiction. It automatically calculates the currently optimal α value based on the actual frequency uncertainty (Δω) and performance requirements (JSR), thereby achieving an optimal balance between robustness and fidelity under given constraints.
The use of adaptive LMS lattice filtering method is based on minimizing the mean square error or the sum of forward and backward prediction errors. Once the stationary random process signal is transformed into information for adaptive lattice filtering, all backward prediction errors exhibit an orthogonal relationship. This enables decoupling of data between adjacent nodes in the adaptive lattice filtering process, allowing for targeted optimization of filter components for each node to achieve overall optimization goals [
38]. If the number of nodes in the grid filter is reduced, there is no need to reset the parameters lower than the original adaptive grid filter system caused by the reduction in the number of nodes, while also ensuring the overall system optimization effect [
39].
Based on the decoupling characteristics of backward prediction error, using it as a tap input signal from an adaptive filter has many benefits, such as the ability to easily control the number of filter sections, and global optimization is not limited by adding or reducing one section. If the entire system is optimized, it is equivalent to optimizing each part of the rod. And when a certain section is added or removed, the filter does not need to be readjusted [
40,
41].
The adaptive grid joint processing filter is shown in
Figure 8. Depending on the input method, there are two ways for
d(
n). Firstly, the filter will adjust the coefficient values of the entire system within the error margin; the second is to use each error to adjust the tap coefficient. The error signal is described as
Among them, is the instantaneous value of the tap filter coefficient at time n. The cost equation is based on the square of the error signal, and an adaptive method is used to obtain the instantaneous estimation of the coefficient by the function.
5. Case Analysis
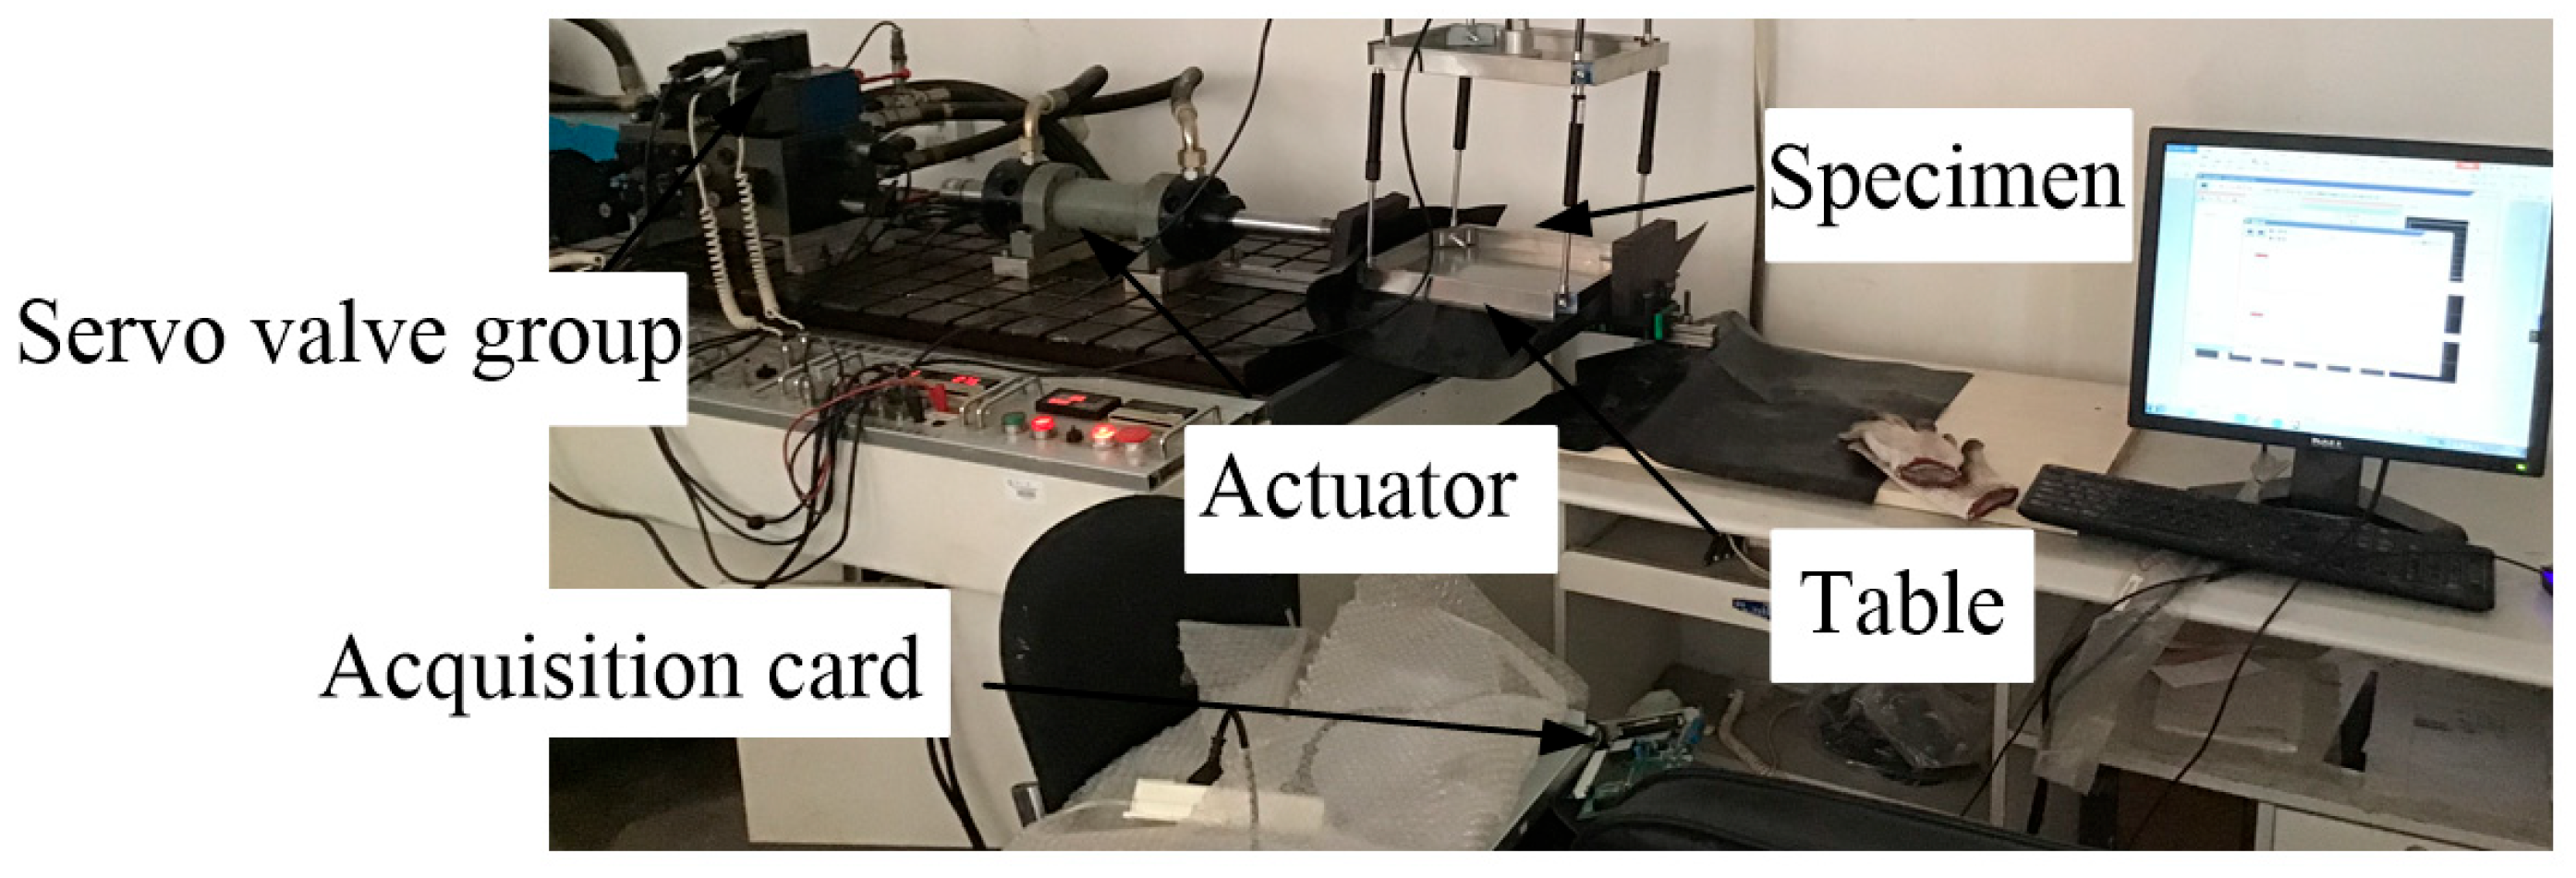
Figure 9 is a schematic diagram of the mechanical structure of a horizontal single-degree-of-freedom electro-hydraulic servo vibration table. The specific physical parameters are shown in
Table 2. The core load-bearing component is a rigid tabletop, and two sets of symmetrical support frames are set below the tabletop to fix it and ensure overall stability during vibration; set up guide rails on the tabletop to limit its horizontal movement and avoid lateral displacement; the geometric center of the table is rigidly connected to the hydraulic cylinder piston rod through a flange, ensuring that the hydraulic driving force can be efficiently transmitted to the table in the horizontal direction; the oil outlet A/B of the servo valve is connected to the rodless chamber and the rodless chamber of the hydraulic cylinder through hydraulic pipelines, forming a complete mechanical hydraulic transmission link.
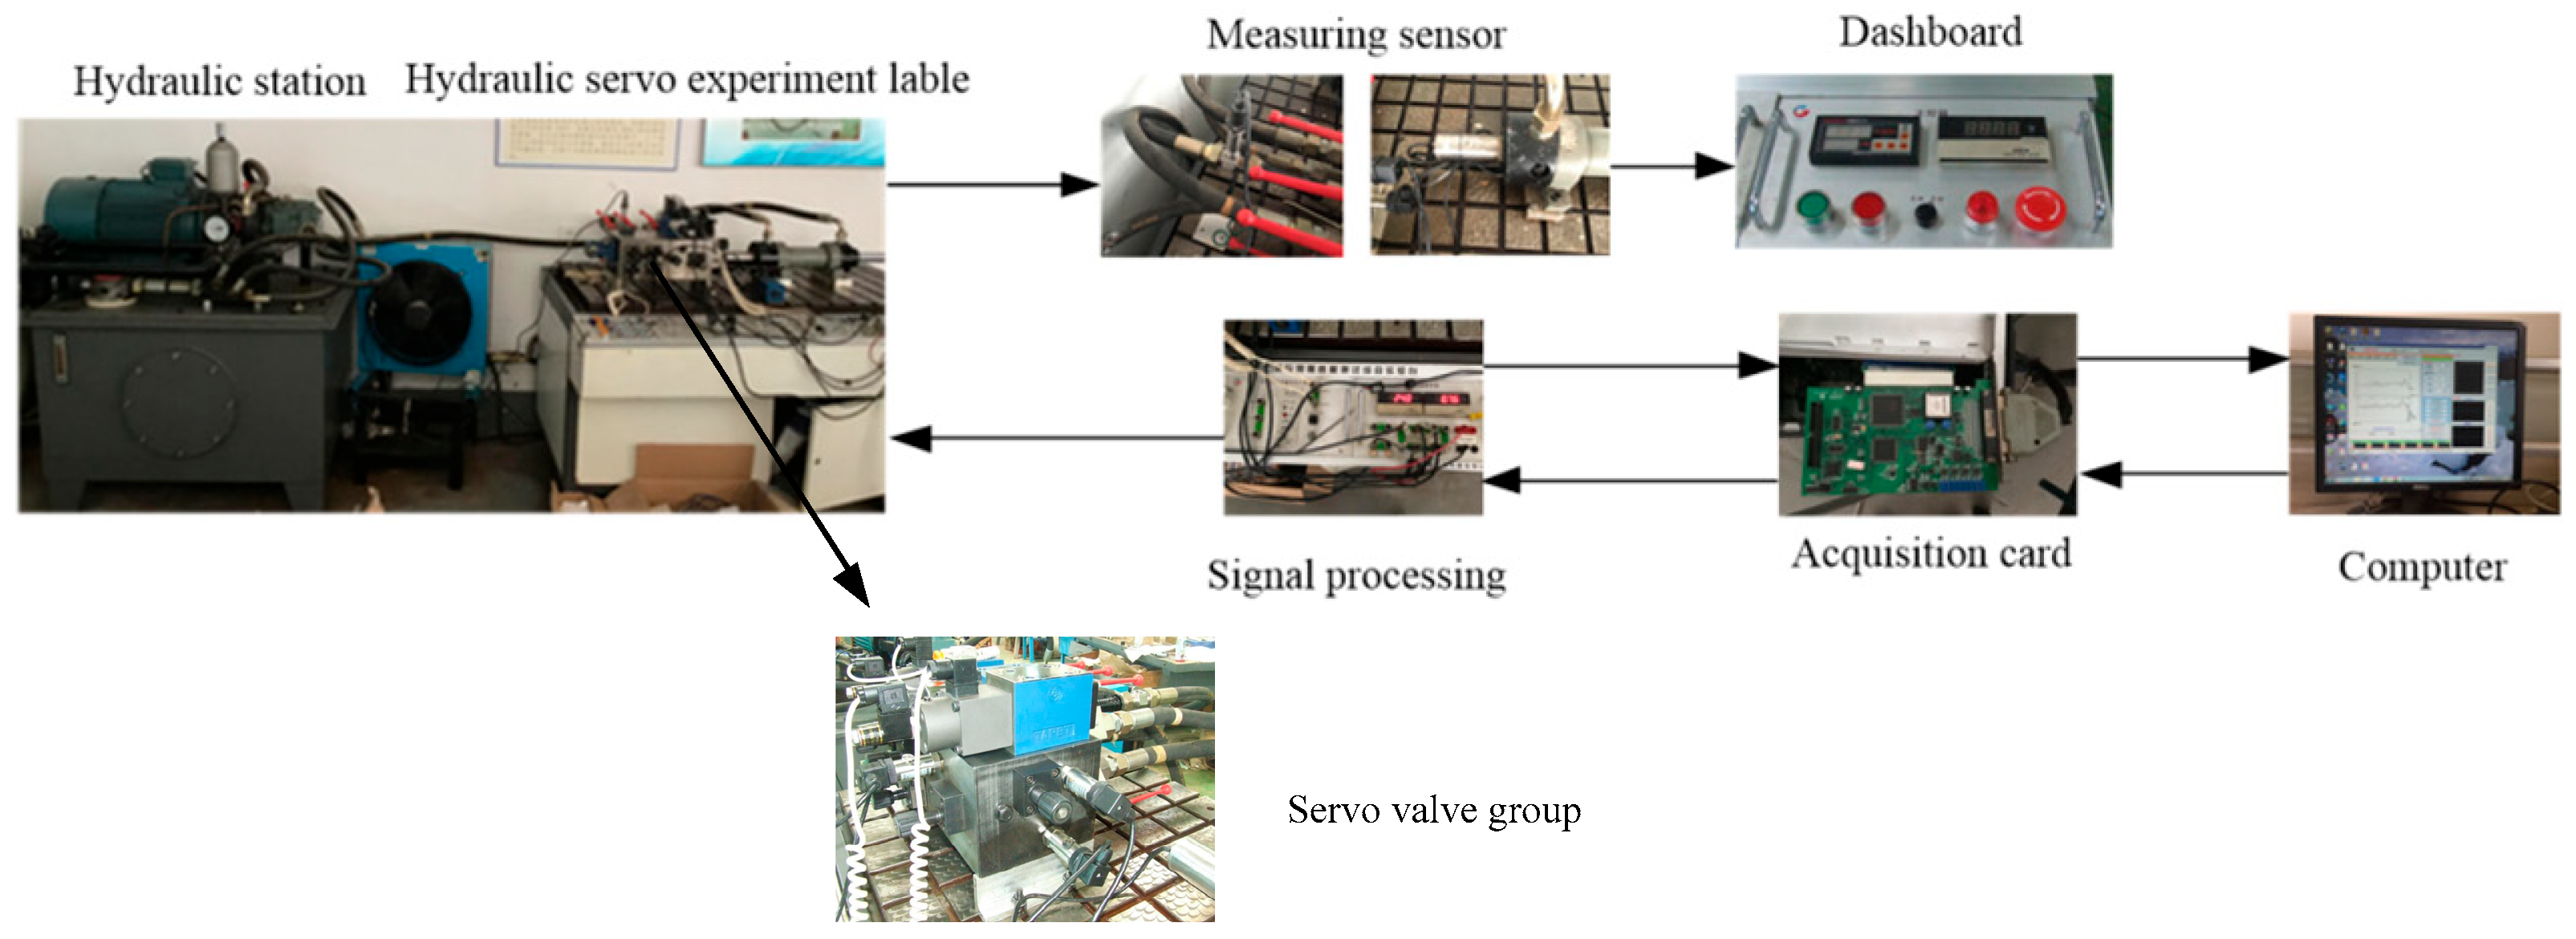
Figure 10 shows the control system structure of the electro-hydraulic servo shaking table. The key components of the system include electro-hydraulic servo valves, data acquisition cards, signal adjustment equipment, and various sensors, among others. The control module directly sends instructions to the servo valve amplifier, which can then convert the input voltage signal into a high-power signal. The vibration waveform generated from this is used to excite the target object. At the same time, the hydraulic cylinder equipped with displacement sensors and the acceleration sensor of the target object also provide feedback to the control module, thus constructing a complete and effective closed-loop servo dynamic control system. Based on the deviation between the feedback signals, iterative correction is continuously performed through the control module. The servo valve’s oil outlet A is directly connected to the rodless chamber of the vibration table’s hydraulic cylinder via a hydraulic pipeline, while oil outlet B is connected to the rod chamber of the hydraulic cylinder through a hydraulic pipeline, forming a hydraulic power circuit that drives the tabletop to vibrate. The hydraulic cylinder’s piston rod is rigidly connected to the vibration tabletop via a high-strength flange, ensuring that the hydraulic driving force can be transmitted to the tabletop without loss, thereby driving the tabletop to complete preset vibration motions. At the signal feedback level, a displacement sensor is mounted on the hydraulic cylinder’s piston rod to collect real-time displacement data of the piston movement, while an acceleration sensor is fixed to the vibration tabletop to monitor the tabletop’s vibration acceleration information. Both detection signals are connected to the system control module through a data transmission line, providing real-time feedback for the dynamic optimization and adjustment of the servo valve’s control parameters.
Figure 11 shows the process of using the servo valves to suppress the vibration of an electro-hydraulic servo shaking table. According to the above content, when the vibration reaches the resonance point, its interference to the system will be more significant. To solve this problem, an adaptive format filter can be added to the control loop of the vibration table to reduce the vibration effects generated by the servo valves in the hydraulic system. To make the selection of the filter more effective, it is necessary to make its frequency as close as possible to the maximum frequency point of vibration, thereby reducing the error of the servo valve at the vibration frequency point.
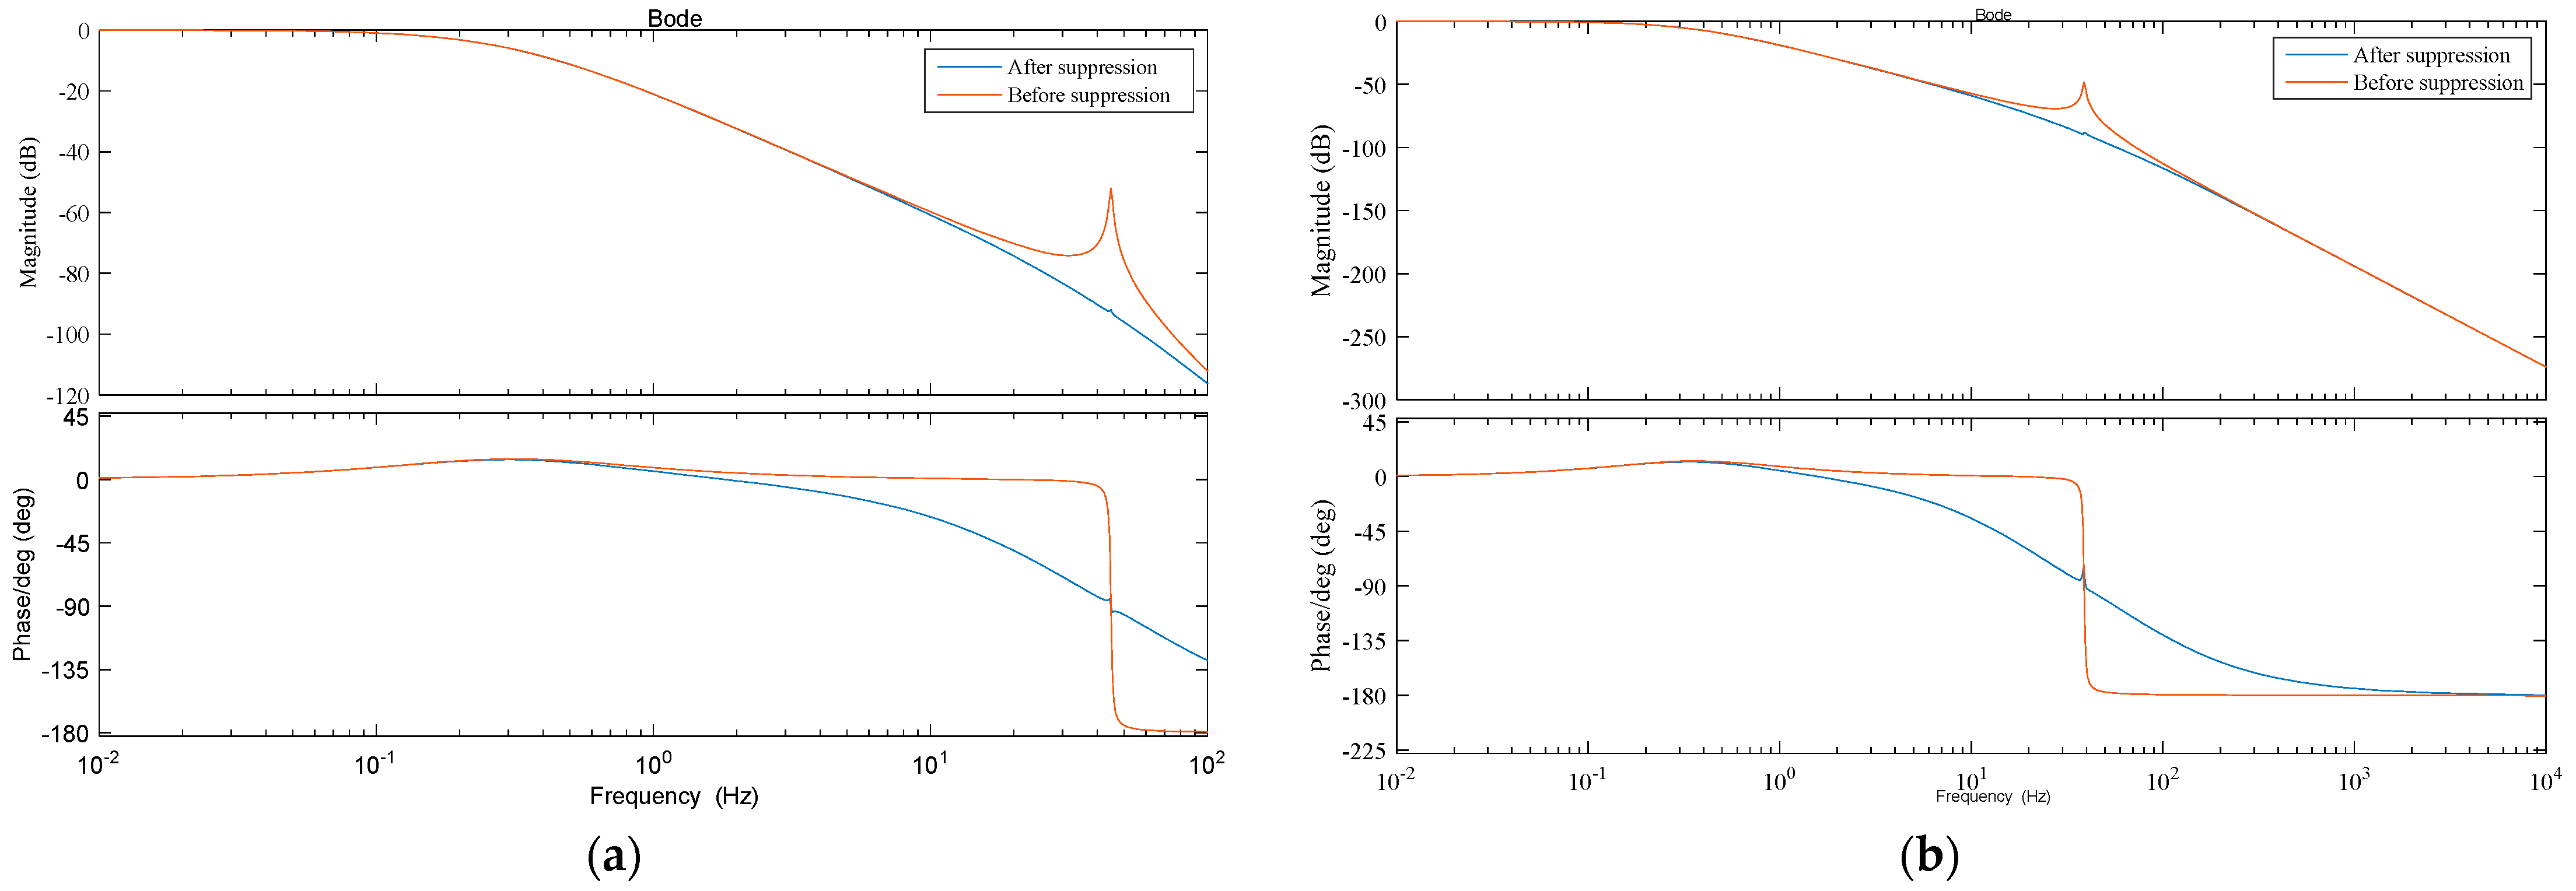
As can be seen from the Bode plot earlier, regardless of the working state, the resonance point remains consistent, except for exceeding the specified maximum allowable range. Therefore, this study chose a heavy load pressure of 14 MPa as the testing condition, and the oil supply pressure is rated oil supply pressure of 21 MPa. Then, an adaptive format filter is used to suppress the oscillation in the vibration environment. This section verifies the effectiveness of the proposed adaptive lattice filter through numerical simulations. As shown in
Figure 12,
Figure 13 and
Figure 14, due to resonance greatly reducing the effective damping of the system, energy attenuation is slow, and the response oscillates continuously at the equilibrium position. In this way, near the resonance point, the system has a very large gain on the input signal, resulting in significant overshoot. So the system response time is longer, and the accuracy deteriorates. Under the conditions of asymmetric hydraulic cylinders, the adaptive format filter can effectively suppress oscillations and enhance the stability of the servo valve and vibration table itself at different resonance frequencies of the execution structure. The frequency characteristics of the system after suppression by the adaptive format filter are shown in the figure. The filter can better suppress oscillation effects, reduce coupling effects, and enhance system stability.
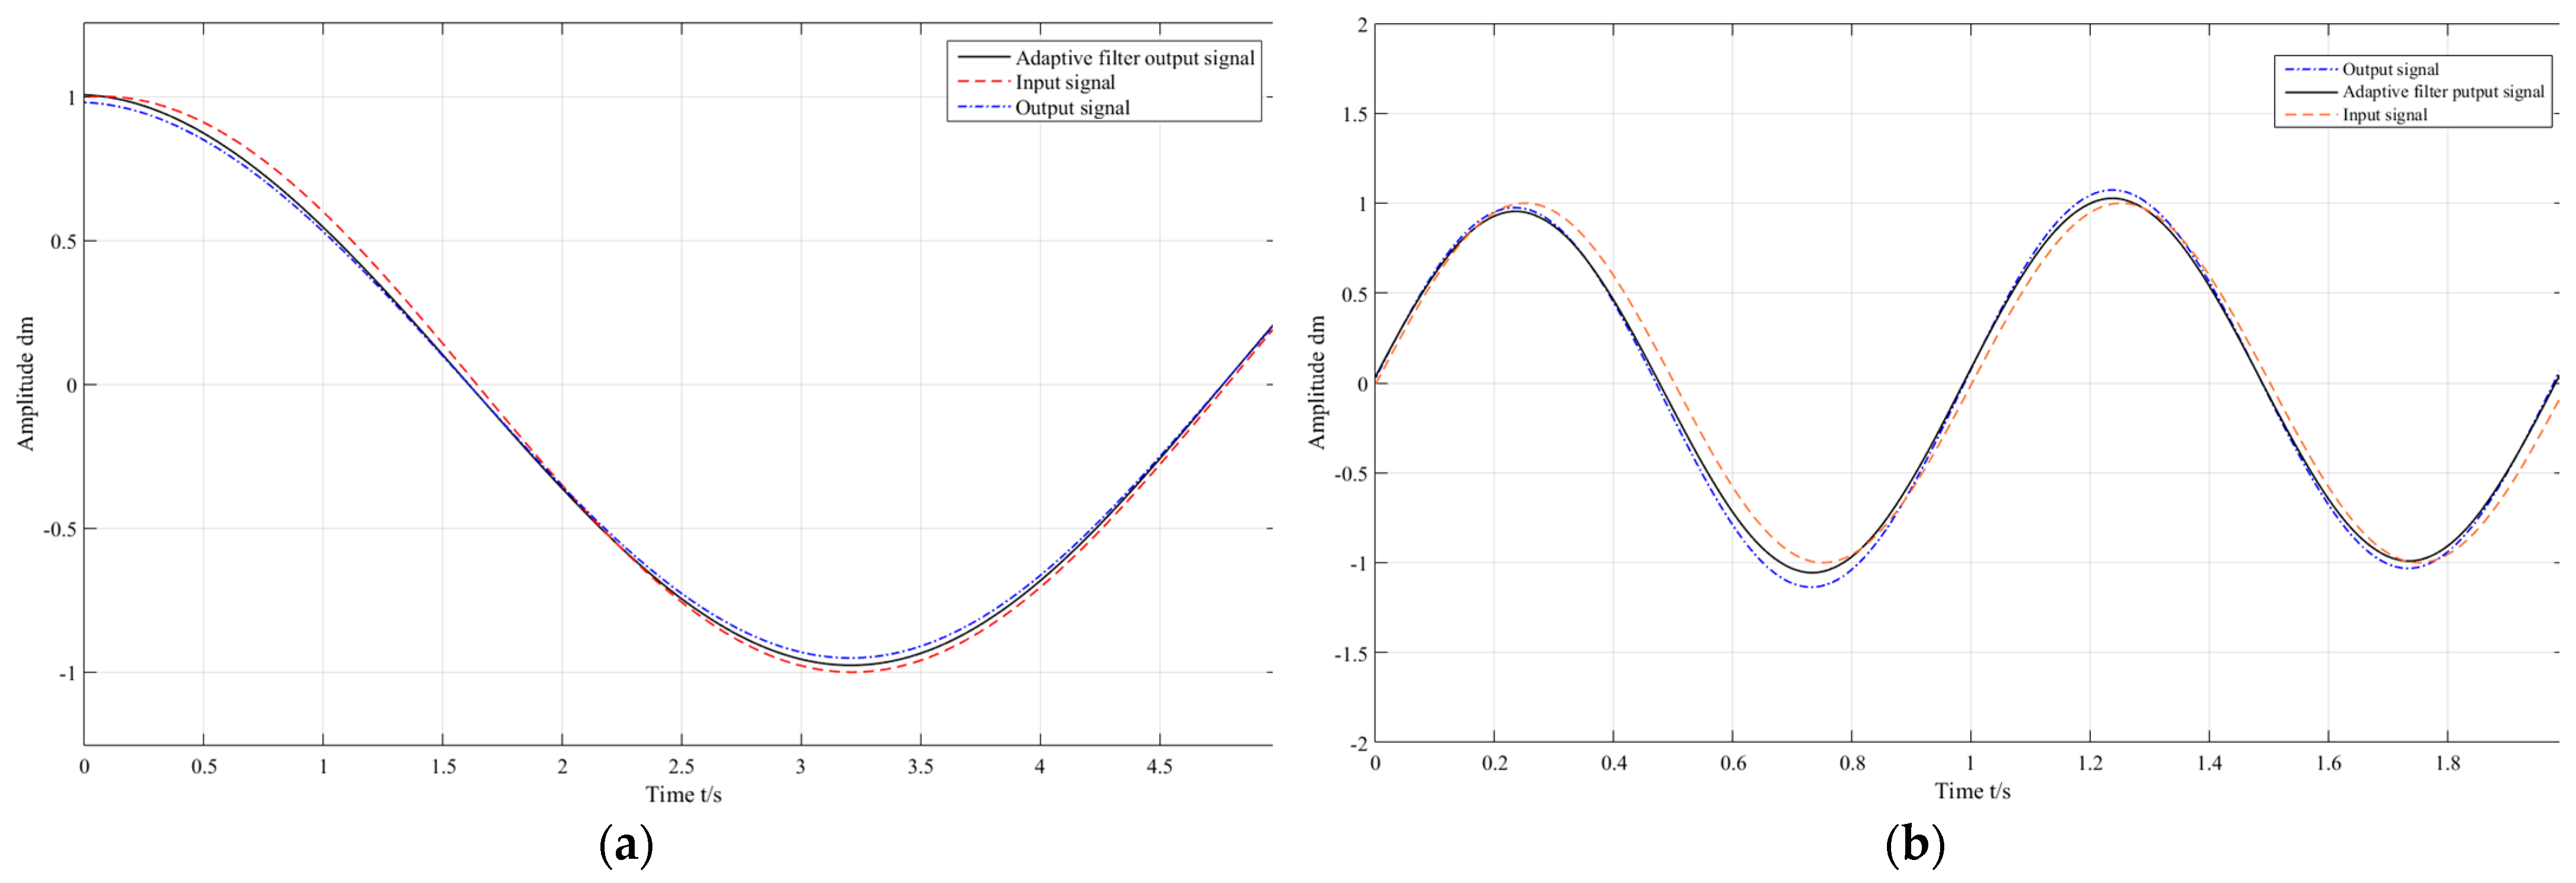
Figure 14 is a simulation comparison chart of the output sine signal, from which it can be seen that after resonance suppression, the output signal can accurately reproduce the waveform.
Figure 12,
Figure 13 and
Figure 14 show the effects of adaptive format filters on the frequency response, step response, and output sine signal of an electro-hydraulic servo vibration table under a certain load pressure. The Bode plot in
Figure 12 shows that the filter can significantly reduce the peak gain of the system at the resonance frequency point and minimize the impact of vibration. During the extension motion, the peak gain reduction in the vibration frequency is 39.5 dB; during the retraction motion, the peak gain reduction is 40.4 dB, which is consistent with the conclusion that the filter can significantly reduce the peak gain of the system at the vibration frequency point and minimize vibration impact. The step response simulation diagram in
Figure 13 indicates that the blue curve in the figure represents the input step response curve. This filter can reduce system overshoot, improve response stability, and enhance dynamic performance. The sine curve in
Figure 14 shows that the filter can reduce output signal distortion and improve signal reproduction quality. The Total Harmonic Distortion (THD) of the Sin(t) signal decreases from 12~13% to 2~2.5%; the THD of the Sin(2π × t) signal decreases from 14~15% to 2.5~3%. After suppression, the THD is less than 3%, meeting the reproduction accuracy requirements for vibration environment simulation test signals. Overall, adaptive format filters can effectively suppress vibration under load pressure, significantly improve system stability and accuracy, reduce the impact of vibration on system performance, and provide theoretical support and practical guidance for precise control and stability optimization of electro-hydraulic servo systems.
6. Conclusions
In order to solve various problems that the servo valve in the electro-hydraulic servo shaking table may face during vibration testing, such as vibration and impact, this study constructs an electro-hydraulic shaking table with a horizontal single-degree-of-freedom and combines it with its load test system. Using principles such as hydraulic dynamics and control algorithms, theoretical simulation, digital simulation, and verification methods are used to establish mathematical models for the electro-hydraulic servo valve and its vibration table under different working conditions. This provides an important theoretical basis and practical tool for the research of precise control strategies for systems.
A mathematical model for a servo valve and vibration platform is established using a horizontal single-degree-of-freedom electro-hydraulic shaking table for testing and the principle of hydraulic drive. Next, the study of the frequency characteristics of the device reveals that its performance is significantly affected by vibration environmental interference. According to calculations and analysis, it is known that this device has a low resonant frequency, mainly concentrated in the range of 40 Hz to 50 Hz, and should be avoided from operating in such vibration environments. Although the negative impact of vibration can be alleviated by reducing the weight of component and increasing hardness, this method is more convenient and effective from the perspective of introducing control algorithms.
This study proposes a regulation method based on format filters and integrates adaptive control algorithm technology on this basis to construct an adaptive based comprehensive regulation system for format filters. The simulation results show that during the reciprocating operation of hydraulic actuator structures, compared with the absence of control strategies, the vibration platform is more susceptible to disturbances caused by resonance. However, adding an adaptive format filter to the system can significantly suppress the influence of vibration environment on the servo valve, thereby improving the accuracy and stability of the testing system, optimizing the frequency domain characteristics, and significantly improving the quality of the system’s simulated signal reproduction.
This article constructs a single-degree-of-freedom horizontal electro-hydraulic vibration and loading comprehensive testing platform and conducts in-depth exploration of the control scheme, achieving certain progress. However, due to time constraints and research tool limitations, the author believes that deeper work needs to be done in the following areas: (1) When designing the controller for the electro-hydraulic vibration and loading comprehensive testing system, the dynamic characteristics of the tested object and its impact on the control effect are not fully considered, which may require more attention to how the dynamic characteristics of the tested object affect the control strategy of the testing system in the future. (2) This article mainly explores the testing system of a single-degree-of-freedom electro-hydraulic shaking table, but in reality, the tested object may face multiple coupled vibrations. Therefore, the future research direction should be the control strategy of a comprehensive testing system for spatial multi-degree-of-freedom electro-hydraulic vibration and loading.
For the spatial multi-degree-of-freedom electro-hydraulic vibration loading system, the adaptive notch filtering method proposed in this paper can achieve vibration suppression through multi-channel parallel extension, that is, a separate filtering module is designed for each degree-of-freedom vibration signal, and an inter channel coupling compensation algorithm is introduced to solve the cross interference problem caused by multi-degree-of-freedom coupled vibration. But it will also bring corresponding core challenges, including the collaborative optimization of multi-channel filtering parameters, which need to avoid the instability of the overall system caused by the optimal parameters of a single channel; the real-time processing delay of high-dimensional vibration signals requires hardware acceleration to improve computational efficiency; dynamic matching between servo valves and hydraulic cylinders under multiple degrees of freedom requires modifying the mathematical model to incorporate coupling stiffness coefficients.


